Review

How Has the Concept of Air Traffic Complexity Evolved? Review and Analysis of the State of the Art of Air Traffic Complexity

by
Francisco Pérez Moreno
1,*,
Víctor Fernando Gómez Comendador
1,
Raquel Delgado-Aguilera Jurado
1,
María Zamarreño Suárez
1,
Bruno Antulov-Fantulin
2 and
Rosa María Arnaldo Valdés
1
1
Department of Aerospace Systems, Air Transport and Airports, Universidad Politécnica de Madrid (UPM), 28040 Madrid, Spain
2
Department of Aeronautics, Faculty of Transport and Traffic Sciences, University of Zagreb, 10000 Zagreb, Croatia
*
Author to whom correspondence should be addressed.
Appl. Sci. 2024, 14(9), 3604; https://doi.org/10.3390/app14093604
Submission received: 15 March 2024 / Revised: 13 April 2024 / Accepted: 19 April 2024 / Published: 24 April 2024
(This article belongs to the Special Issue Application of Information Systems)

Abstract

:

Featured Application

Application of main conclusions when developing a complexity indicator for giving information about air traffic.

Abstract

Air traffic complexity is an indicator that allows air traffic controllers to understand the airspace situation. Controllers need support tools to reduce their workload. For this reason, complexity is a parameter that is being studied more and more, as it makes it possible to know a large amount of information about air traffic. In this article, we perform a bibliometric analysis in the field of air traffic complexity. Through Web of Science (WoS), a collection of complexity-related articles from 2001 to 2022 is compiled. Subsequently, the bibliometric analysis itself is performed. Then, a summary of five main contributions is presented, identifying the strengths and weaknesses of the contributions, and thus the topic. The results of the bibliometric analysis show that future air traffic complexity indicators should consider aircraft trajectories but also take into account other aspects, such as regulations. In addition, future complexity indicators should introduce artificial intelligence predictions to foresee areas of conflict in airspace but taking into account the main limitations, such as uncertainty of the air traffic trajectories. This study helps in the study of complexity due to being able to know previous studies in a summarised form and being able to draw conclusions on future lines.

1. Introduction

The Air Traffic Management (ATM) system organises a large network of airports and a large volume of airspace to help thousands of flights operate safely and efficiently day to day [1]. But the ATM system is currently facing certain difficulties. The ever-increasing traffic demand is saturating the ATM system [2]. EUROCONTROL predicts that the demand for flights in 2035 will be 14.4 million movements, which is 1.5 times the number of operations documented in 2012 [3]. This increase causes the existing balance between ATM service capacity and demand for operations to break down, as there is not sufficient capacity to handle all operations. This traffic growth will have negative consequences, such as airspace congestion, delays, or increased fuel consumption [4], and this situation will worsen in the coming years. This increase in complexity will also lead to an increase in the workload of Air Traffic Controllers (ATCOs) [5] because of their direct relationship. For these reasons, complexity is critical for operational safety and will limit Air Traffic Control (ATC) system capacity [6].
Because of these negative consequences, the assessment of and reduction in air traffic complexity is a topic that is attracting a great deal of interest from researchers around the world [7,8]. It follows that early identification of traffic complexity can help to increase ATC system capacity [9]. For this reason, studies on this topic are based on the definition of a complexity indicator [10] or to assess the complexity in the airspace [11]. Therefore, knowledge of the complexity of air traffic will be associated with better management of both human and technological resources by the ATC system [12].
Despite much work on the study of complexity, no consensus has been reached on the definition of complexity [13]. Measuring complexity is very challenging due to, among other reasons, the selection of factors that affect complexity. Since these factors are very varied but highly correlated with each other, their selection is very difficult [14]. Therefore, arriving at a single indicator of complexity is very challenging. At present, air navigation service providers remain reliant on the subjective assessment of ATCOs as the most prominent technique for measuring air traffic complexity, despite the fact that many studies have focused on the research of new complexity indicators based on objective parameters [15]. However, there is also a tendency to create indicators that objectively measure the workload of air traffic controllers, taking into account air traffic parameters [15].
Complexity describes air traffic situations. For this reason, the knowledge of complexity can give much information to the air traffic controllers. By knowing complexity, they will have information about the structure of air traffic, which could help in providing separation to aircraft, helping efficiency and safety in air traffic management.
Complexity is a variable that depends on many parameters. These parameters can be airspace structure, weather conditions, space weather conditions, wars, and technological factors, among others. From the operational point of view, an analysis of the operational variables that influence complexity is shown in [16]. These variables include the number of aircraft in the airspace, the number of aircraft per flight level, and daily occupancy. Regarding the structure of airspace, the number of flows is also a parameter taken into account in this analysis. In addition, war conflicts also affect complexity by affecting air traffic. In [17], it is analysed how the airspace bans resulting from the Russo-Ukrainian war affect traffic. Specifically, by modifying trajectories, areas of complexity are generated for ATCOs as they have a traffic structure with which they are not familiar. One factor that is widely related to complexity is weather. Uncertainty in weather, and the effects on air traffic structuring (regulations, delays, economic costs [18], …), make adverse weather conditions related to complexity. In [19], a model is developed to predict trajectories under adverse weather conditions. Advances like this would allow ATC to predict air traffic structure, and therefore to better understand air traffic complexity. Another area related to complexity is the systems used for Communication, Navigation, and Surveillance (CNS). As these systems advance technologically (i.e., the introduction of Automatic Dependent Surveillance–Broadcast (ADS-B) systems), a higher degree of security is achieved by facilitating the labour of ATCOs [20]. As the performance of CNS systems increases, the complexity of the airspace will be reduced.
In addition to air traffic complexity being a topic of interest, the fundamental objective of Air Traffic Management (ATM) is to reduce complexity. To this end, some of the measures that the ATM are considering are as follows:
-
Advances in CNS systems. This allows for the optimization of air traffic structure. Several studies, such as [21], develop systems that try to optimise traffic through CNS systems. This would result in reduced complexity as air traffic is more structured and easier to control.
-
Development of technical and/or procedural enablers for ATCOs to control airspace more easily and with technological support tools.
-
Development of complexity indicators. Being able to measure and/or predict complexity will allow ATCOs to better understand and act on conflict areas, thereby reducing complexity.
-
Other factors discussed above, such as weather or war, are unpredictable. Even so, research is being carried out to reduce this uncertainty and mitigate the adverse effects on complexity.
After this analysis, the conclusion is that air traffic complexity is a variable highly considered in ATM. Seeing that this topic is of great interest and that the advances made may be of great interest to air traffic management, it has been decided to carry out a bibliometric analysis to summarise the contributions in this field. Bibliometric analysis refers to the quantitative analysis of bibliometric material related to a research area, a specific topic, or a journal [22,23]. Bibliometric analysis is a technique that has been applied to different disciplines, such as medicine [24], finance [25], and even social media [26]. In aviation, bibliometric analysis is also a widely used technique. Bibliometric analyses have been carried out on topics such as airport service quality [27], the evolution of the different technological areas in aviation [28], or the aviation situation in the aftermath of the COVID-19 pandemic [29].
Being such a widespread and flexible tool, it is considered the best way to make a comprehensive study of the concept of complexity in aviation and the main contributions made in this regard. Therefore, this paper aims to analyse the main publications in the Web of Science and to find relationships between them. Another objective of this paper is to summarise and group the main contributions to deepen the definition of air traffic complexity.
To this end, Section 2 describes the methodology used to carry out the study. Section 3 carries out the bibliometric analysis of the selected publications, and Section 4 analyses the contributions of the main publications on this topic. Finally, Section 5 presents the conclusions of the study.

2. Materials and Methods

The analysis of the references related to the complexity of air traffic has been carried out employing a bibliometric analysis. Following the structure of the relevant bibliometric analysis within the ATM [30], this study has been carried out with three fundamental objectives in mind.
  • Identify the main contributions to the field of air traffic complexity.
  • Map the ‘intellectual structure’ of the topic using co-citation and co-author analysis.
  • Analyse the relationships between the different articles to identify areas of interest and to better understand how research on this topic is evolving.
    Specifically, during this process, the following research questions will be addressed:
    • Is the study of air traffic complexity really relevant?
    • Which authors have published the most papers regarding the topic of air traffic complexity?
    • What have been the key issues studied related to air traffic complexity?
    • What are the main solutions proposed by academia to the complexity problem?
    • What are the weaknesses and strengths of the main complexity indicators?
These questions, together with the objectives set, will guide the development of the bibliometric analysis. To answer these questions, a study was carried out based on the methodology of [31]. For this purpose, the steps followed in this paper are as follows, and are represented schematically in Figure 1.
  • The first step is data collection and filtering of non-targeted articles. In this case, a search for the topics ‘Air Traffic complexity’ and ‘Airspace complexity’ was made. In this case, only the Web of Science (WoS) repository was used (Clarivate, London, UK), with a further manual filtering of the articles found to only study relevant articles.
  • Once the data have been filtered, a preliminary analysis is carried out. This analysis aims to answer the question “Is the study of the complexity of air traffic really relevant?”. To achieve this, we studied how relevance in the topic has evolved over time in terms of the number of publications and citations.
  • A co-authorship and co-citation analysis is carried out. With these analyses, it is also expected to be able to identify which are the most prominent papers dealing with the complexity of aerospace. The question “Which authors have studied air traffic complexity?” will be answered. A co-authorship analysis by organisations will also be carried out to find out in a structured way where the knowledge on this topic is located.
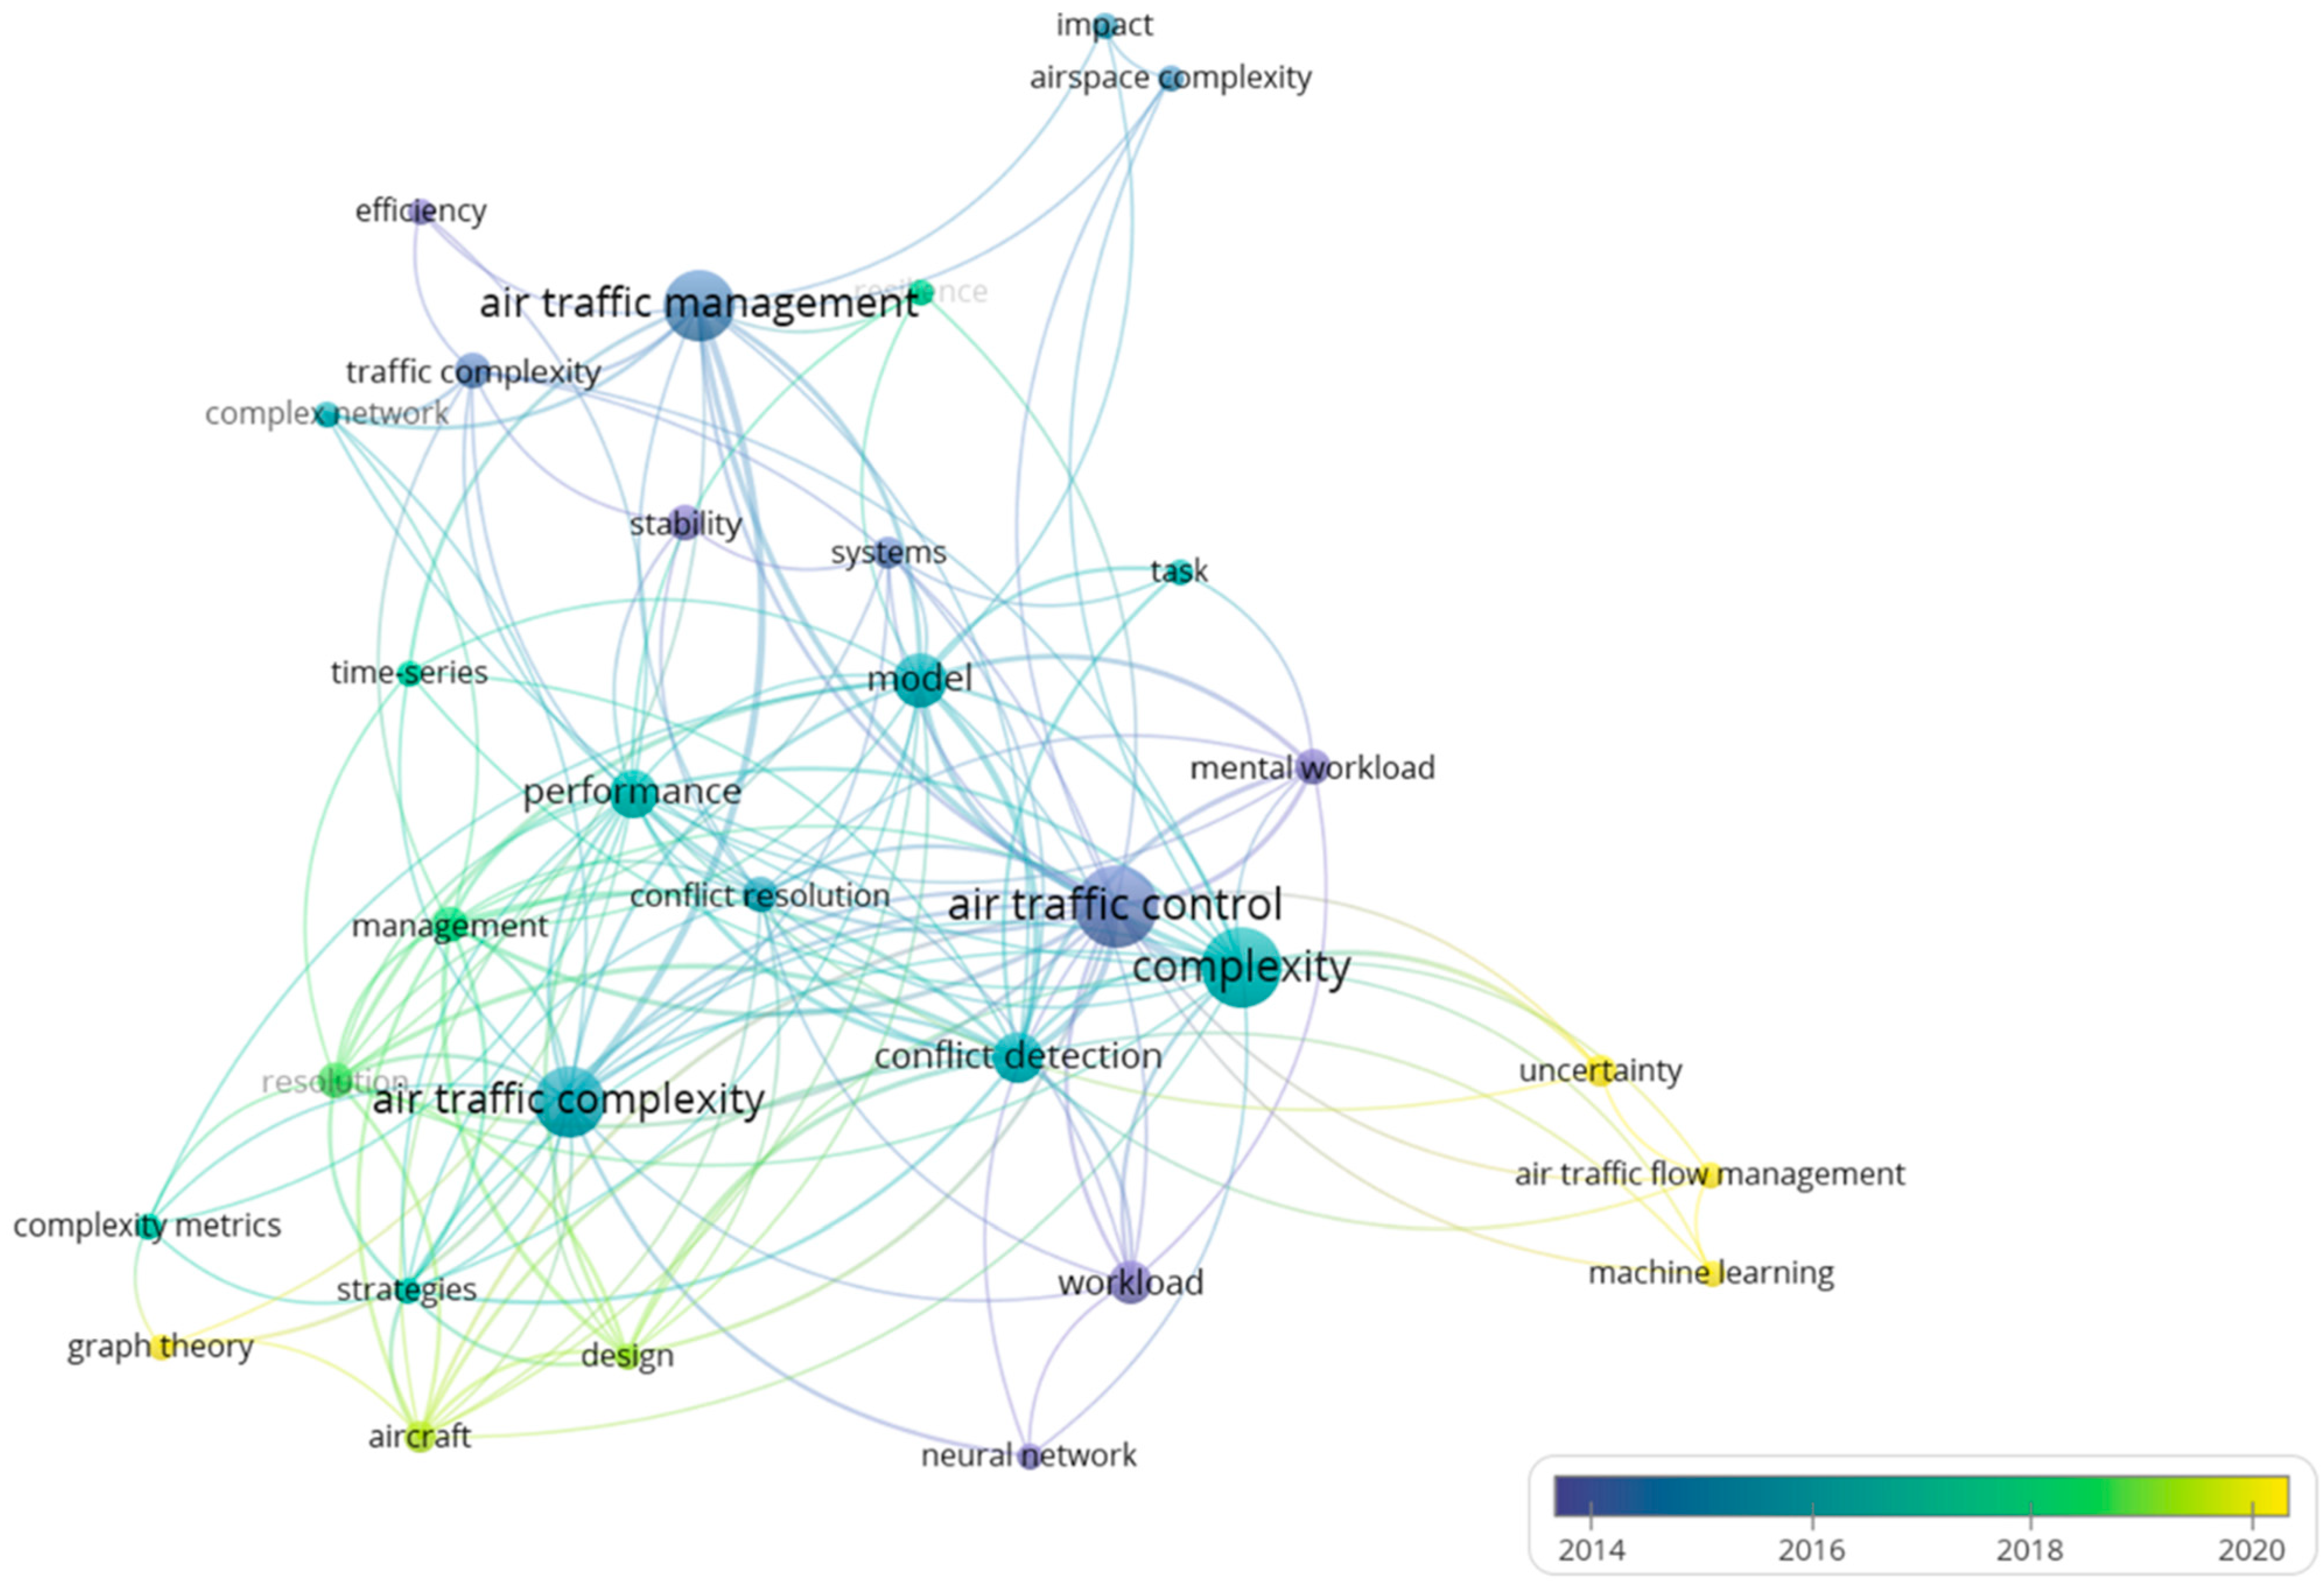
  • In addition, an analysis of the keywords will be carried out. This analysis aims to detect the main areas of interest within the topic of complexity in aerospace in the hope of finding common lines of research among the papers analysed. Therefore, this analysis is carried out to answer the question “What are the key topics studied related to the complexity of aerospace?”.
  • Once the previous analyses have been carried out, the main contributions on the topic can be identified and compared with each other in a more detailed way, being able to answer, “What are the main solutions proposed by academia to the problem of complexity?”. This last study will be interesting as it will allow readers to have a detailed idea of what the main interests of the industry are on this topic, and what the solutions proposed by authors are to the problems of the industry related to this topic. It will also try to collect possible strengths and weaknesses of the complexity indicators. This will allow us to answer the question “What are the strengths and weaknesses of the main complexity indicators?” and to give guidance for the realisation of future complexity indicators.
This process of bibliometric analysis is presented schematically in Figure 1, relating the steps of the methodology to the fulfilment of the objectives set out in this paper. Figure 1 also relates the steps of the methodology to the research questions posed.
Once a clear structure of the analysis is in place, each of the steps in this methodology will be detailed.

2.1. Data Collection

The first step in this bibliometric analysis is data collection. In this case, a search was undertaken in WoS with the topics “Air Traffic Complexity” and “Airspace Complexity”. Following the references [29,32], in which aviation-related bibliometric analyses are carried out, it was decided to carry out a filter from 2001 onwards. Of these, a total of 1200 documents were found. A manual filter was then carried out by reading the abstracts and keywords of the articles to select those that were really related to the topic intended. Of the total, 142 articles were selected for bibliometric analysis.

2.2. Preliminary Analysis of Publications

The first part of the analysis corresponds to a preliminary study. This serves to answer the first research question and to justify the interest of the research community in the complexity of aerospace, and therefore to justify the interest in carrying out a bibliometric analysis of it. To this end, we studied the publications per year, the citations per year, and the distribution of references according to the WoS category and according to the journal/conference to which they belong.

2.3. Co-Citation and Co-Author Analysis

Once the data collection and preliminary analysis have been conducted, it is time to perform the bibliometric analysis itself. Within the bibliometric analysis, there are two main techniques: performance analysis, which is based on the study of components’ contributions to an investigation of a given field; and science mapping, which is based on relationships between the research constituents of a field of interest [33].
Coupling and co-citation analysis are the two main techniques of performance analysis, and historiographic mapping of the literature is also possible [34]. The relevance of the citation study lies in the fact that the most cited texts are usually those that make the greatest contribution to a field of research [35]. For this reason, it was decided to perform a study of co-citations with the aim of being able to see which contributions are interesting within the topic of study. In addition, a co-authors analysis was made, presenting the names of the authors and the different organisations and countries to which they belong, to form the ‘intellectual structure’ of the topic [36]. This intellectual structure is interesting because it provides insight into the different clusters of organisations engaged in research on this topic. This analysis can be very representative, and the intellectual structure can be mapped visually and quickly and can answer the second research question posed.

2.4. Keywords Analysis

A co-word analysis was also conducted as part of the science mapping. This keyword analysis will make it possible to condense the most important themes within the analysed publications [37], and to identify the most relevant lines of research in general and at present. Specifically, the third research question can be resolved with this analysis.
Together, these three analyses will make it possible to meet the objectives set out at the beginning of the methodology. Specifically, following different bibliometric analyses [38,39], it was determined that the best tool for the three analyses is VOSviewer from Leiden University (Leiden, The Netherlands, v1.6.18.0), which was selected for this paper.

2.5. Analysis of Key Contributions

Part of the aim of the above analyses is to highlight the papers that have made the greatest contribution to the area of study of air traffic complexity, thus answering the fourth research question. These papers will be the references for present and future researchers who wish to explore deeper into this topic. Therefore, in this bibliometric analysis, these references are also treated specifically and in detail. Concretely, based on the number of citations and the relationships of their authors with others, the five most relevant references are chosen.
Once it has been determined which references are the most relevant, a study was carried out on them, taking into account three fundamental aspects of each of the articles analysed:
  • Contribution of the document: In this section, the contribution that each of the references will make to the topic will be presented in summary form. This will be a summary of the main theme of each of the documents. With this, readers will be able to identify the topics addressed by the authors and which are the lines of research that are the reference of the topic of study.
  • Advantages of the methodology: Along with the contribution of each of the papers, it is interesting to know what advantages each author’s approach presents. This section will help the reader to understand why the particular papers have been so relevant and are considered references for other researchers on this topic.
  • Limitations of the methodology: Although they are the best-known papers on complexity in aerospace, the identified papers will also have limitations that need to be improved. This analysis is particularly interesting because the limitations can help to uncover possible lines of future research within the topic studied.
With the first part of the analysis, the analysed reference is presented, answering the fourth research question. But, the analysis of advantages and limitations allow one to give a further dimension to the study. Thanks to the answer to the last research question, it will be possible to make recommendations for the creation of future complexity indicators, giving an additional usefulness to this bibliometric analysis.
Once the analysis has been completed for each of the five most important references, a comparison will be made to study the main contributions in a summarised and schematic way. It is hoped that this comparison will allow us to see points in common between the different articles, and divergences between them. This comparison may also help to identify future lines of research in the definition of complexity in aerospace.

3. Bibliometric Analysis

After having developed the bibliometric analysis methodology, the use case is developed. A bibliometric analysis of 142 articles extracted from the Core Collection of the Web of Science is carried out. As mentioned above, the VOSviewer tool was used to carry out this bibliometric analysis. This tool was used because of the large number of possibilities it offers for bibliometric analysis. VOSviewer is capable of creating visualisation maps, author maps, or keyword maps [38], but density maps can also be represented with this tool [40]. This flexibility allows for a complete bibliometric analysis that is tailored to the needs of the problem being analysed.
Next, the analysis itself is performed. To carry this out, firstly, a preliminary analysis of the selected sample is conducted. Subsequently, co-citation and keyword analyses are performed, and, finally, the main contributions to the topic are studied in terms of everything analysed previously.

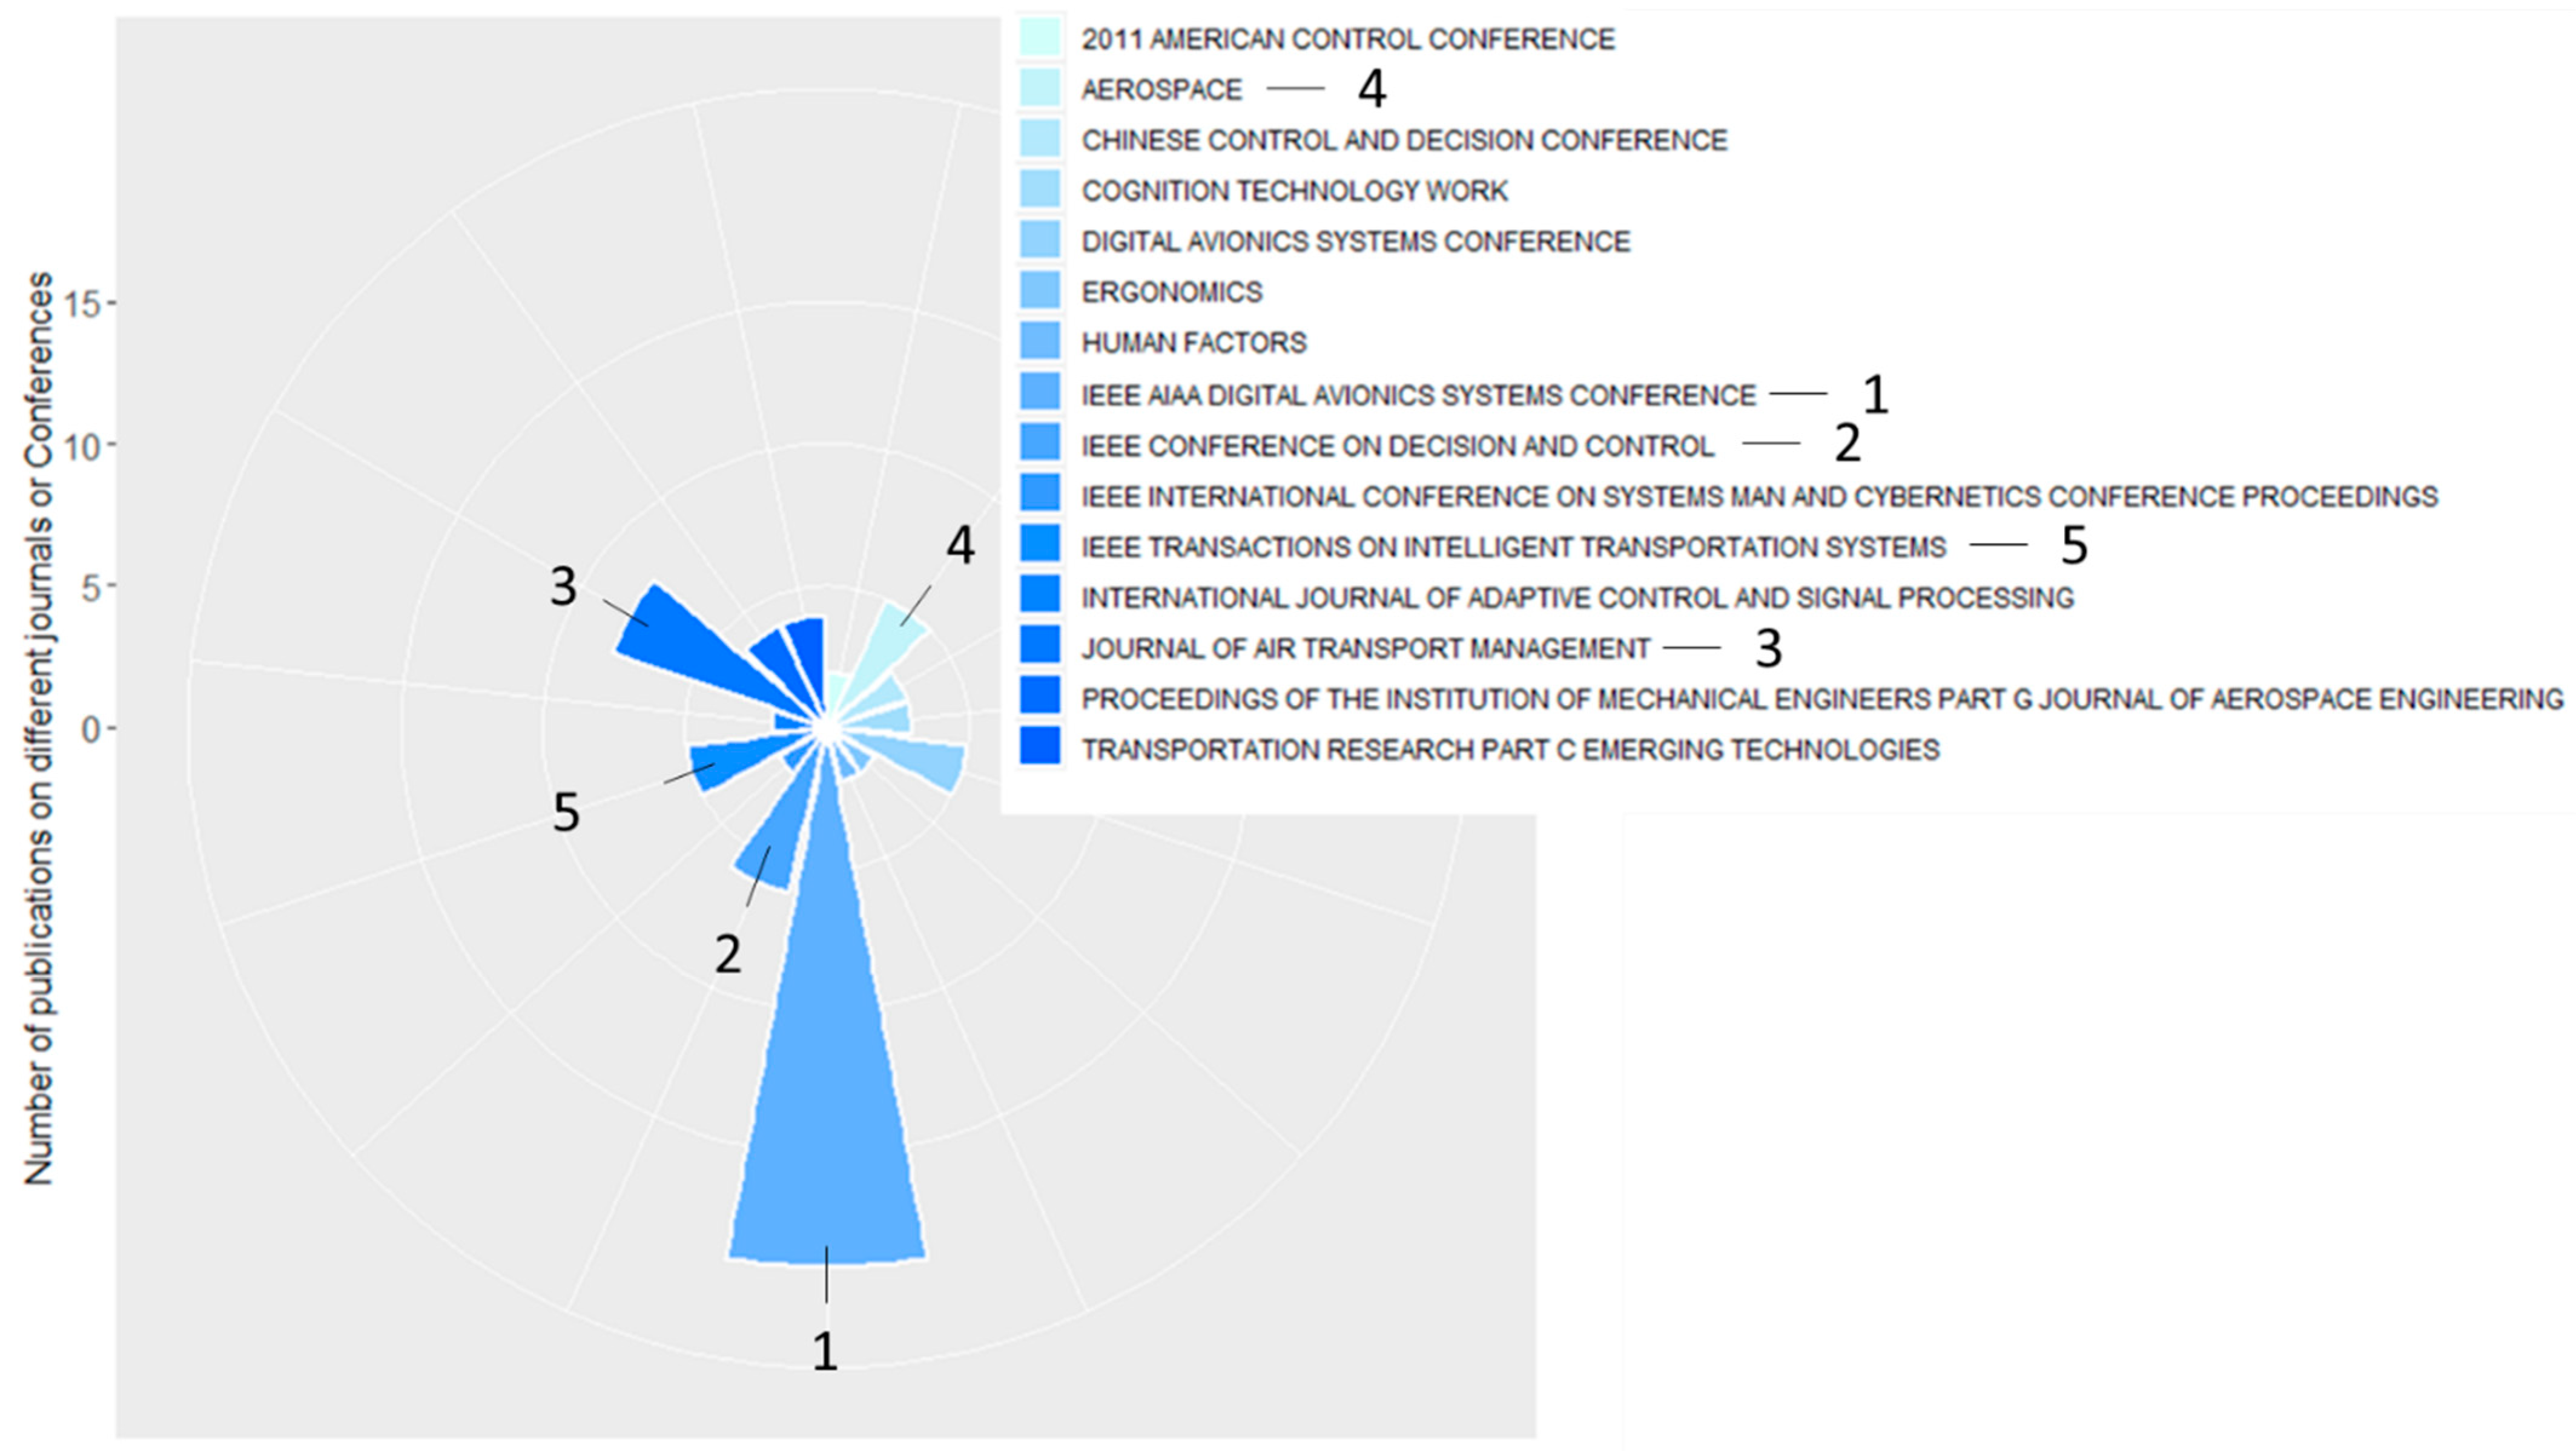
3.1. Preliminary Analysis of Publications

Before starting with the analysis of co-citations, it is necessary to know the main features of the articles to be analysed. To achieve this, a preliminary analysis of the set of articles to be studied is performed. This preliminary analysis is carried out to check whether this topic is really interesting; thus, the result of this analysis will be the answer to the question “Is the study of air traffic complexity really relevant?” To carry out the study of the interest of complexity, the first subjects to study are the number of articles published and the number of citations per year. Figure 2 shows this first analysis. The publications are shown in grey, together with their trend from 2001 to 2022. The number of citations is also shown in blue, subject to the secondary axis.
Figure 2 shows how the number of publications and citations has grown overall since 2001. It has gone from publishing fewer than 2 articles per year until 2004 to publishing more than 10 articles in 2021 and 2022 related to this topic based only on the WoS repository. Moreover, the trend is to increase this number in the following years. Specifically, this trend has been stable since 2001, except in the period 2009–2014, where there is a sudden increase in publications. From this moment, the slope of the trend of publications is lower, although increasing until 2022. As for the number of citations, this has also increased in general and much more in absolute value. Specifically, more than 150 citations are reached in 2021 and 2022.
It can be deduced from the citation curve that interest in the topic is high and has increased in recent years. This trend lags slightly behind that of the number of publications, which is logical as these papers cannot be cited until they are published and disseminated among the scientific community. Despite being a very specific topic within the aeronautics industry, and currently publishing around 10 papers per year, the number of citations to these is much higher. Specifically, the number of citations is more than 10 times per publication. This is a very large number and it is estimated that these papers are very well received in the general industry and that they are cited in articles dealing with other topics.
Figure 2 shows that the complexity of aerospace is indeed a topic that is attracting a great deal of interest, especially in recent years. In addition, the graph of the number of publications related to the WoS categories is presented. The publications studied are divided into 45 different categories. However, Figure 3 shows only the 10 categories with the most publications.
Below is a list of acronyms for all the categories used in Figure 3 for a better understanding of the figure.
  • Trans. (Transport);
  • Eng. (Engineering);
  • Aut. (Automation);
  • Sys. (Systems);
  • AI (Artificial Intelligence);
  • O.R.M. (Operation Research Management).
It can be seen from Figure 3 that the most common category is “Engineering Aerospace”. This is logical, as the problem of complexity in aerospace is an aerospace problem. A total of 42 publications (30% of the total) are included in this topic. The topic “Engineering Electrical Electronic” gathers 36 publications (25%); this is because a large part of the solutions proposed in the papers to solve this problem are related to this field. The third most common topic is “Transportation Science Technology”, with 28 publications (19%). This is also logical. On the other hand, it is interesting to note that “Computer Science Artificial Intelligence” only has eight publications in the whole period studied. Artificial Intelligence (AI)-based solutions are gaining importance in recent years, and the complexity of aerospace is benefiting from the advances that AI brings [16,41]. It is therefore curious that the number of articles is not higher, although the number of publications related to AI and aerospace complexity will certainly increase in the future.
In addition to the publications by the WoS category, the number of publications by journals or conferences is also presented in this preliminary analysis. This analysis (Figure 4) complements the previous analysis by category by allowing us to localise the interest in this topic. There are many conferences and journals interested in this topic, reaching up to 113 different fields. But, in Figure 4, the 15 journals or conferences with the most contributions have been represented.
In this case, most of the publications related to air traffic complexity belong to the “IEEE AIAA Digital Avionics System Conference” (1). In total, 19 publications belong to this conference. Another conference that also shows great interest in this topic is the “IEEE Conference on Decision and Control” (2), with six contributions. Among the journals with the most publications in this topic, the “Journal of Air Transport Management” (3), with eight publications; “Aerospace” (4), with five publications; and “IEEE Transactions on Intelligent Transportation Systems” (5), with five publications, stand out.
This preliminary analysis has attempted to demonstrate the growing interest in the engineering industry, and especially in the aerospace industry, in solving the problem of complexity in aerospace. Therefore, through this analysis, it has been possible to answer the following question:
  • Is the study of air traffic complexity really relevant?
The answer is as follows: more and more papers related to complexity are published in different journals and conferences, and citations to publications on this topic have grown in recent years, along with the number of publications. This makes the topic interesting, and interesting to study and perform a bibliometric analysis on it. In addition, air navigation system providers are interested in complexity indicators to measure the workload of air traffic controllers [15]. Therefore, it can be said that both academia and industry are interested in air traffic complexity.
Once this analysis is performed, the performance analysis within the bibliometric analysis begins. This will focus on the analysis of co-citations and co-authorship to help to identify the main contributions to the sector.

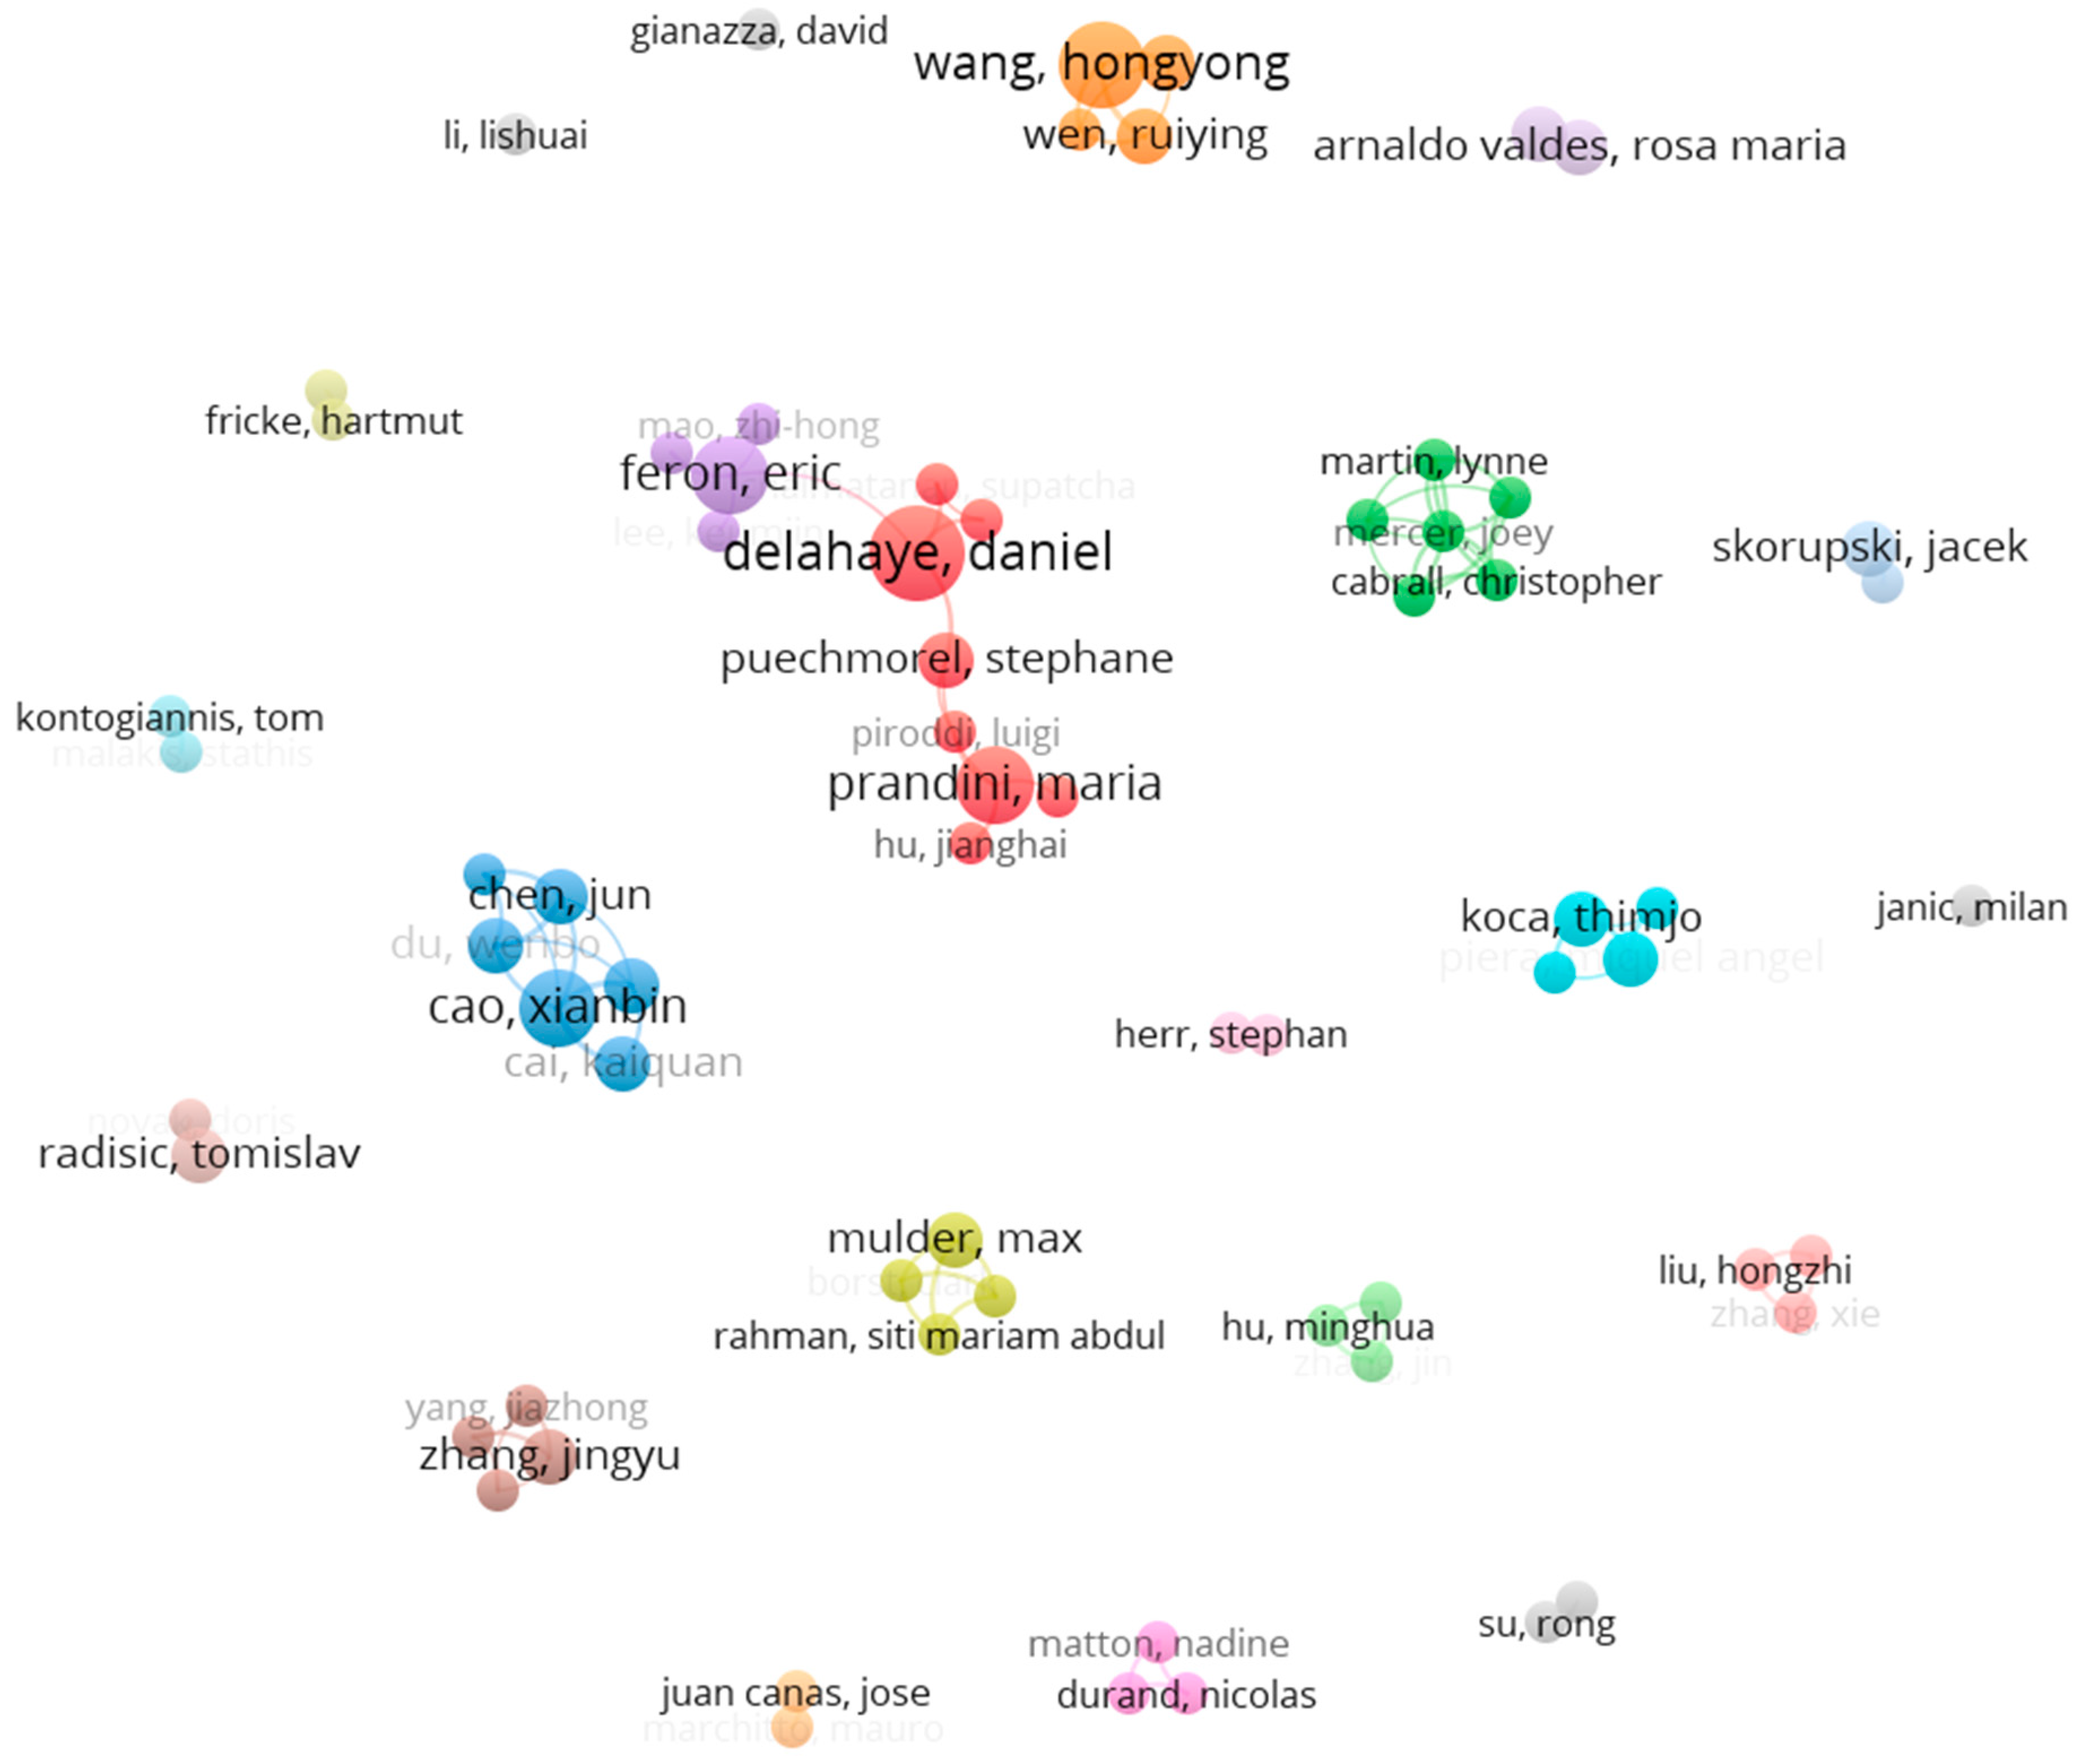
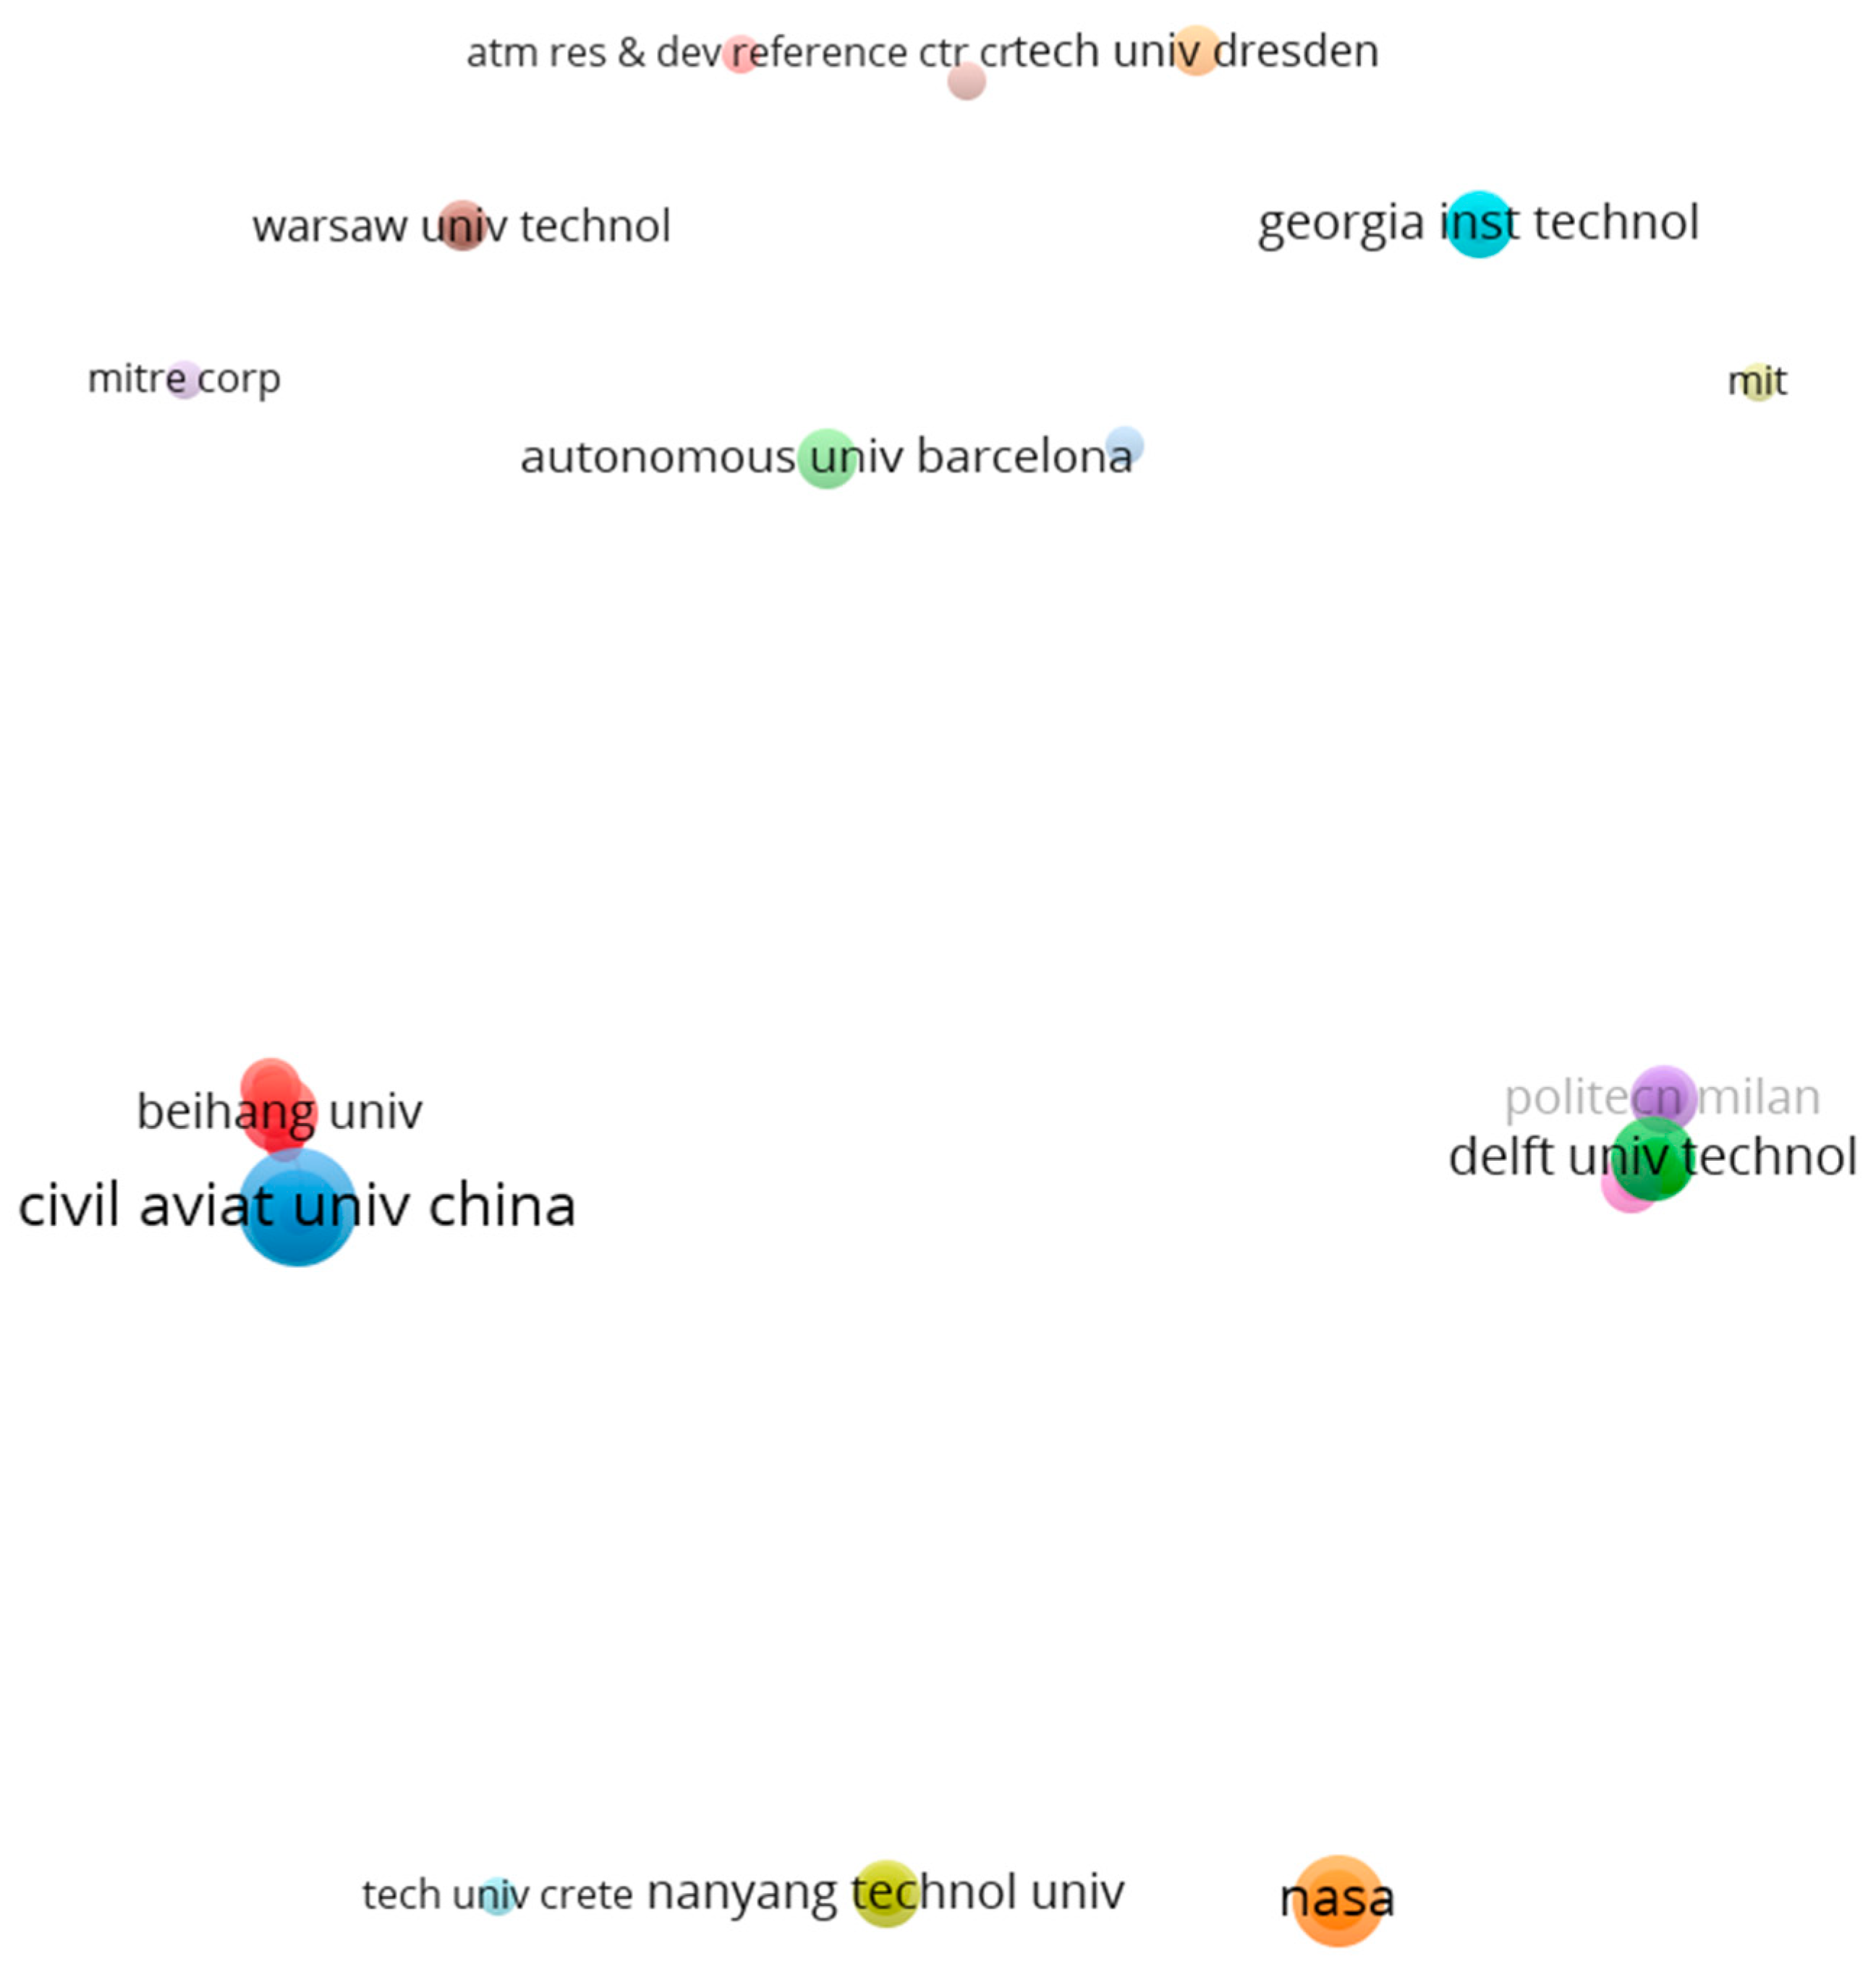
3.2. Performance Analysis

We previously observed that the topic of air traffic complexity is gaining popularity because of the rising number of publications and citations. Therefore, the need for this bibliometric analysis is justified.
First of all, a performance analysis of all the analysed documents will be carried out. To achieve this, it is important to detect the authorship of the articles, and then to carry out an analysis of their citations.
The objective of this performance analysis is to identify the main authors on the topic of air traffic complexity. In doing so, we hope to answer the question “Which authors have published the most papers regarding the topic of air traffic complexity?”.
The first step of the performance analysis is the identification of authors. The identification of the most influential authors will be carried out through the Total Link Strength (TLS) obtained from VOSviewer, the number of publications, and the number of citations [39]. According to these three criteria, the 10 most influential authors are shown in Table 1.
Authors with a total link strength of 9, but only 2 publications and no citations, have been omitted from this table. These authors are Cabrall, Christopher; Homola, Jeffrey; Martin, Lynne; Mercer, Joey; and Morey, Susan. These authors have not been considered as influential, despite their TLS, as they have no citations for their publications.
In this case, the main authors have been identified. The next step is to know the co-authorship network. This network will reveal how the authors relate to each other in order to develop the articles. Thanks to this analysis, it will be possible to know where the knowledge in this topic is focused. Figure 5 shows the main co-authorship cluster, and Figure 6 shows the complete network co-authorship. In both cases, the figures are formed by authors who have published more than one article.
It can be seen in Figure 5 that the main cluster is formed by two of the main authors identified, specifically, two nodes of this cluster are Daniel Delahaye and Maria Prandini. The cluster has a total of 12 authors, highlighting those 2 main authors. Figure 6 shows how other main authors, such as Xianbin Cao or Hongyong Wang, are in different clusters, although these clusters do not have as much total weight. A total of 68 authors have been identified, divided into 22 different clusters.
But, in addition to understanding the authors’ relationships, it is also necessary to identify the organisations and countries where the knowledge is located [42]. In this case, the main organisations in which the knowledge on complexity in aerospace is structured are identified. This information is presented in Figure 7. All organisations that have published more than one article are presented in this figure, as well as the relationships between them. A total of 37 different organisations have been identified, organised into 17 clusters. Also, 29 different links between the different organisations have been identified. In addition, for a more accurate localisation of knowledge, Table 2 shows the five main organisations identified according to the documents published, the number of citations, and the TLS.
Below is a list of acronyms for all the categories used in Figure 7 for a better understanding of the figure.
  • Univ. (University);
  • Aviat. (Aviation);
  • Politecn. (Polytechnic);
  • MIT. (Massachusetts Institute of Technology);
  • ATM (Air Traffic Management);
  • Res. (Research);
  • Dev. (Development);
  • Ctr. (Centre);
  • Inst. (Institute);
  • Technol. (Technology);
  • Tech. (Technical);
  • Corp (Corporation);
  • NASA (National Aeronautics and Space Administration).
It can be seen from Figure 7 that, except for Delft University, the rest of the main organisations are related through the blue and red clusters. This cluster is therefore the main cluster of organisations. Specifically, this cluster is made up of 14 links between 10 different organisations and with a TLS of 21.
Finally, as part of this performance analysis, the analysis of joint appointments is presented. This analysis is a fundamental part of the performance analysis. Co-citation analysis explores the underlying data architecture of publications. Co-citations indicate that a paper or a document appears in the list of references of different papers. Co-citation analyses are used to discover the most outstanding research groups in a given topic, as they will be the most important items in a co-citation network [43]. In Figure 8, the network of author co-citations is shown. We have added the filter that authors have to be cited at least 10 times in order to appear in the network, thus representing very influential authors.
This figure shows the network of co-citations of the authors. Within the different nodes, the five main authors are Delahaye, D.; Kopardekar, P.; Gianazza, D.; Prandini, M. and Sridhar, B. Of these authors, only Daniel Delahaye and Maria Prandini are present in Table 1 in the list of most influential authors.
Following this analysis, the objective of mapping the intellectual structure in the analysed topic is fulfilled, and the following question can be answered:
  • Which authors have published the most papers regarding the topic of air traffic complexity?
The answer is as follows: insightfully, the main contributors to the development of the concept of complexity in aerospace, after performance analysis, could be Xianbin Cao, Chen Jun, Hongyong Wang, Daniel Delahaye, and Maria Prandini. Therefore, in order to identify the main contributions to the topic, a first filter is made, refining the search to only these authors.
Once the authors who have contributed the most have been identified, the next step in identifying the main contributions is to find out which topics have been most studied. To achieve this, the following keyword analysis is carried out.

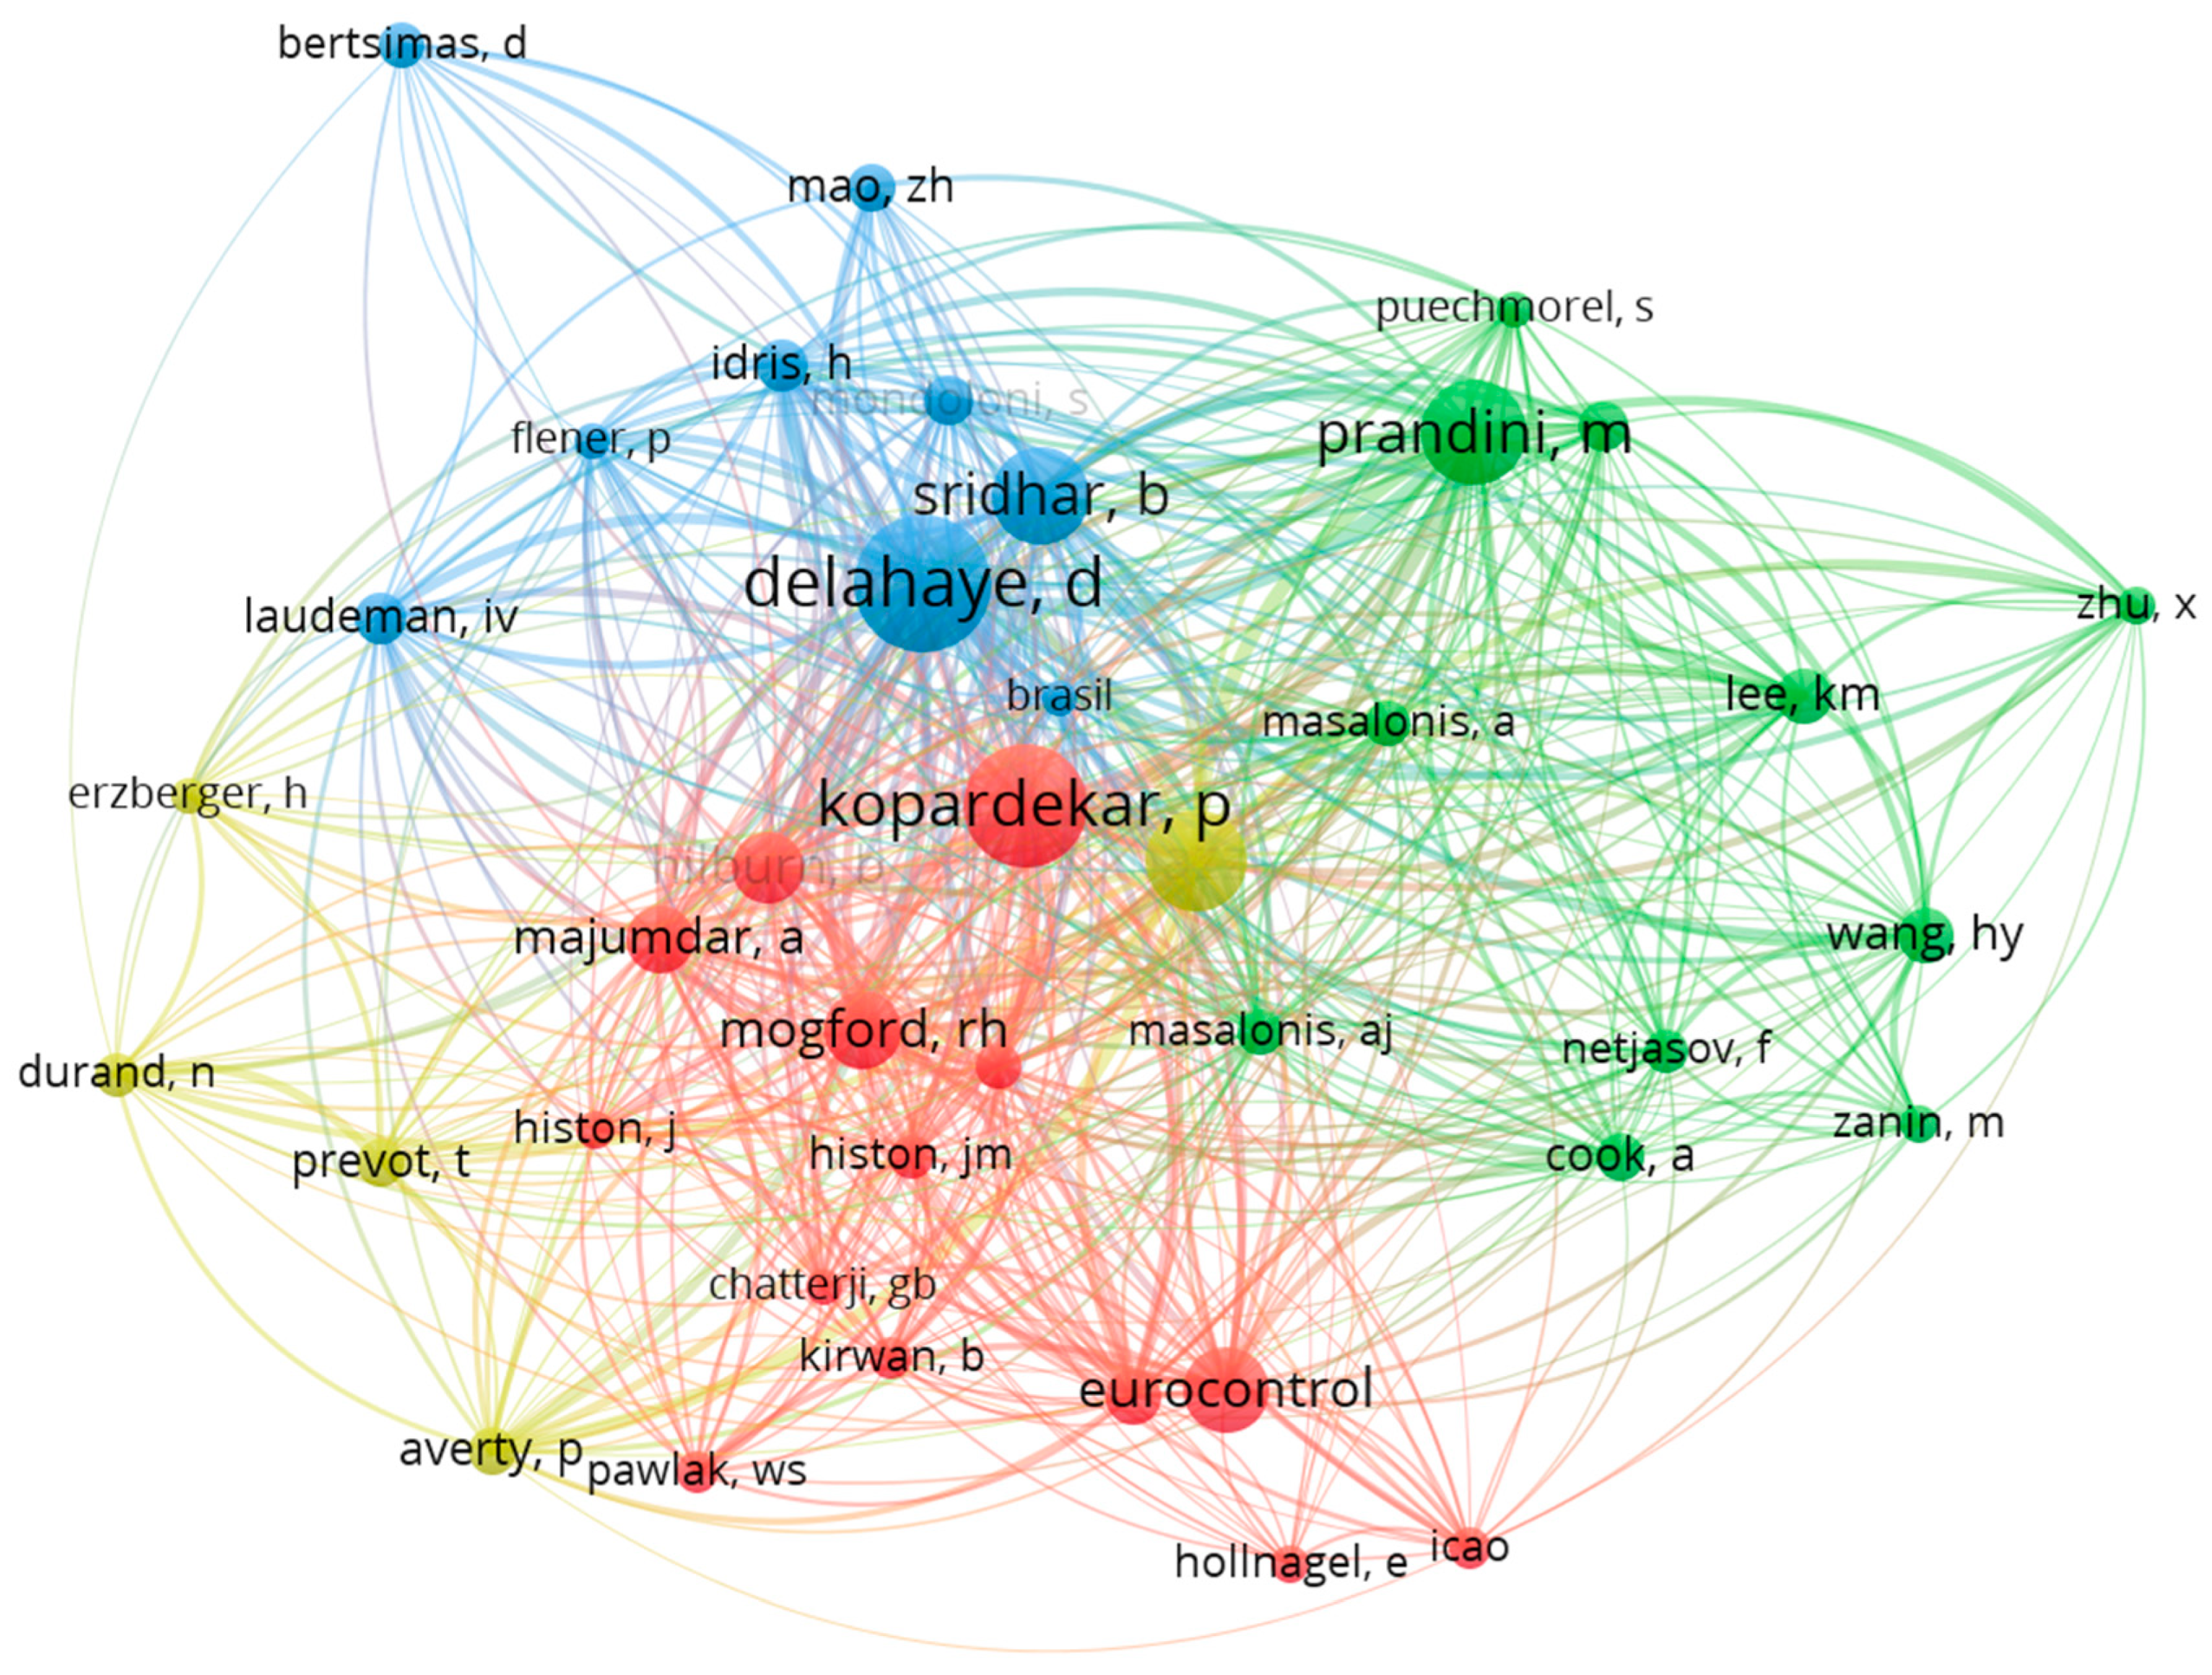
3.3. Science Mapping

The last analysis prior to the identification of relevant contributions is the science mapping analysis. This analysis is carried out with the aim of identifying recurrent topics in publications related to air traffic complexity. With this, the question “What have been the key issues studied related to air traffic complexity?” can be answered.
By combining the topics that are considered relevant, together with the information and conclusions obtained from the performance analysis, it is possible to determine which publications have been the most prominent on this topic. The science mapping in this case consists of a co-occurrence analysis of words carried out by the VOSviewer tool. All keywords appearing three or more times in the set of analysed publications were identified. They were then structured in the form of a network according to the relationships between these words. Figure 9 shows the result of this analysis.
A total of 31 words occurring three or more times were obtained. In Figure 9, the words are divided into clusters, which are represented in different colors. Words stand out, such as: “complexity” and “air traffic control” in yellow, “workload” in purple, “model” and “conflict detection” in green, “air traffic complexity” in red, “air traffic management” in blue, and “time-series” in orange. From these clusters, the main words of the whole network can be identified. For a more detailed overview of the network, information on the 10 most common keywords has been added. This information is in Table 3. Additionally, a summary of each of the clusters in the network has been added to Table 4. This was carried out to have a more detailed understanding of the entire network and not only to focus on the keywords that are globally more important. Specifically, the number of keywords in each cluster and the keyword of each cluster are specified.
In Table 3, two of the most relevant terms are “Air Traffic Control” and “Air Traffic Management”. This is because of the direct relationship of the concept of complexity with the ATC service and the workload of air traffic controllers [44]. The terms “Complexity” and “Air Traffic Complexity” are general terms related to the topic. “Conflict Detection” is also related to complexity, as there is an increase in complexity and an increase in the workload of the controllers, so the detection and potential resolution of conflicts also need to be addressed. The term “model” refers to the fact that, in different publications analysing complexity, the study is based on the definition of a complexity indicator, or a model used to measure complexity.
With this study, the topics of greatest interest in this area of knowledge can be determined. Additionally, Figure 10 shows the same co-occurrence network, but shows its evolution by years from 2014 to 2020.
In this network, the same keywords can be observed as in Figure 9. However, different trends can be seen in the evolution over time. In the first few years of this study, the keywords were, among others, “workload”, “mental workload”, or “air traffic control”. This indicates that, in the first few years analysed, the studies focused more on human factors and on studies of complexity related to the workload of controllers. In 2020, some of the keywords are “machine learning”, “air traffic flow management”, or “uncertainty”. This indicates that the trend has changed, and that the complexity problem is now approached from a point closer to air traffic flow management and artificial intelligence.
This variation in the trend, together with the previous co-occurrence analysis of words, allows us to complete the performance analysis and to be able to know the different topics of major interest within the air traffic complexity studies. With this, it is possible to answer the following question:
  • What have been the key issues studied related to air traffic complexity?
The answer is as follows: science mapping has provided insight into the issues of greatest interest within the topic of complexity. Issues related to ATC service to measure or reduce the workload of controllers are a recurring theme. The development of complexity models or indicators, from their “Air traffic Flow Management” point of view, is also an expanding area of knowledge. In recent years, the use of machine learning within the studies is becoming increasingly important.
Once performance analysis and science mapping have been completed, the findings can be combined to identify benchmark contributions in the field of air traffic complexity.

4. Identification and Summary of Main Contributions

After the previous analyses, a complete picture is obtained of which authors and organisations group knowledge around the complexity of aerospace. It is also known which specific topics are of interest within complexity studies. This information lets us determine which works are or have been influential. This is the last step of the bibliometric analysis, and it will help to know explicitly which studies have been carried out and extract the advantages and/or weaknesses of these models. This final study answers the questions “What are the main solutions proposed by academia to the complexity problem?” and “What are the weaknesses and strengths of the main complexity indicators?”. By answering these questions, the bibliometric analysis is completed.
The identification of the main contributions was carried out considering a combination of the following criteria:
  • Number of citations: The number of citations considers the number of times that this document has been used as a reference in other studies. Therefore, the number of citations is highly relevant when deciding whether a publication is relevant or not.
  • Authors: Whether the publication has been written by authors considered relevant is also a selection criterion. Thanks to the performance analysis, it is possible to identify the most relevant authors, so their works will also be relevant.
  • Topic: Works have been selected that fall within the topics considered important in the keyword study.
According to these criteria, the main contributions considered to the topic of air traffic complexity are [11,45,46,47,48]. The order of analysis of these publications is in chronological order from the earliest to the latest publication. Table 5 presents the citations, authors, and topics of each of the references.
Table 5 presents the citations in order to see that the articles are indeed important, and the topic of each paper is presented in order to see in a preliminary way what the air traffic complexity studies focus on. The main contributions focus on the definition of complexity indicators and their prediction. This is the main concern in the sector. Only one of the papers aims to review indicators.
In this section, an explanation of each of the papers will be given, identifying the subject of each publication and the advantages offered by each of the publications, but also the possible limitations that they may have.
The first publication under consideration is [45]. Here, an analysis is made of the complexity maps of a sector in response to disturbances. Lee defines a disturbance as an event that requires controller action to maintain aircraft management, and he defines the complexity map as a map detailing controller activity as a function of the parameters describing the disturbances. This publication analyses a two-dimensional sector, and details, in the form of complexity maps, the response of controllers to incoming aircraft. This analysis allows scalar indicators of complexity to be obtained, and the analysis can also be extrapolated to different disturbances, such as time. In conclusion, this paper addresses the complexity problem from the point of view of a system responding to disturbances. It is concluded that complexity can be defined in terms of how the system responds. This approach has the advantage of not having to consider the traffic characteristics to define complexity. But, it also has the limitation that only limited causes of disturbances have been studied, and that it has made a two-dimensional approximation when height is a fundamental parameter in air traffic management.
Subsequently, Ref. [46] maps are made to identify cases of low or high complexity by modelling a dynamic system. To measure complexity, a model based on the Lapunov exponent is used to characterise complexity by identifying different scenarios according to the trajectory of the different aircraft. The main advantage of this model is the non-linear dynamic approach followed by the model, which allows for both average and local complexity indicators. The limitation of the model is that it assesses air traffic complexity simply by modelling aircraft trajectories, without taking other aspects into account. Air traffic complexity, although largely dependent on aircraft density, is a parameter that has to take into account a larger number of parameters, such as the number of aircraft, the mix of aircraft models, meteorology, separation between aircraft, aircraft speed, and regulations affecting traffic [49].
Ref. [11] provides a review of the complexity indicators that have been used up to the time of publication. It summarises the indicators “Aircraft Density”, “Dynamic Density”, “Interval Complexity”, “Fractal Dimension”, “Input/Output Approach”, and “Lapunov Exponents”. The author discusses the differences between them and the main features of each. The author states that these models have served as a reference for progress in this field in previous years. But, these models do not consider aspects such as uncertainty in aircraft trajectory, or the increasing automation of ATM. She, therefore, speaks of the need to continue defining more modern complexity indicators, but considering the progress already made.
Additionally, Ref. [47] carries out a study of the complexity of air traffic based on the study of complex networks and graph theory, also treated in [50]. These complex networks are based on the definition of certain variables of interest and their relationship with each other to establish a complex system that is more than the sum of its parts. Using this approach, this article assesses complexity in two and three dimensions, dividing it into low, medium, and high tiers. The temporal assessment of complexity is also evaluated. Conclusions are drawn on how this complexity evolution can influence the controllers. The main advantage of this model is that the classification of the scenarios is performed by artificial intelligence and human subjectivity can be avoided, and that the complex network approach allows several different variables to be related. The limitation is that the number of variables is reduced to the number of aircraft and the changes in aircraft trajectories in a congested space. Aspects such as the regulations that may appear in the airspace [51], which are one of the main causes of delays, are not considered in this model.
Finally, the analysis of [48] is performed. This publication performs complexity prediction using machine learning models. In this paper, scenarios of low, medium, or high complexity are classified. This classification is carried out using ATM experts. Subsequently, a machine learning model is built that learns from this sample and can predict future scenarios of low, medium, or high complexity based on common characteristics. Training is also performed with unclassified samples to have a more robust model. For this model, the authors evaluated the complexity of the airspace through the Sector Operation Complexity (SOC) based on the complexity of a sector to be controlled. This indicator is used in several publications [14,52]. The authors conclude that this tool can be used as an auxiliary in the decision-making process of a real ATM tool. This paper has many advantages, such as being a reference in terms of predicting complexity in airspace using machine learning tools, but it has the main disadvantage of being based on the human component for the labeling of variables, which can influence the quality of the machine learning models. Many of the models that have been developed so far are based on human subjectivity [10], although artificial intelligence tools have changed this trend in recent years.
After analysing the five selected references, several commonalities can be drawn. Table 6 shows the advantages and limitations that have been obtained as common points after reading and analysing the main references. This provides recommendations for the creation of future indicators, as well as the conclusion of the bibliometric analysis.
Once the contributions have been analysed and conclusions such as the general advantages and limitations that can be extrapolated from them have been drawn, the main objective of the paper is fulfilled, and the questions can be answered:
  • What are the main solutions proposed by academia to the complexity problem? What are the weaknesses and strengths of the main complexity indicators?
The answer is as follows: through the above analyses, five main contributions have been identified, as shown in Table 5. After an analysis of these, the main strengths and weaknesses of the main contributions are summarised in Table 6.

5. Conclusions

Finally, this chapter presents the conclusions of the analysis.
The preliminary analysis has served to justify the interest in this topic. The complexity of air traffic is increasingly researched because of its relation to the workload of ATCOs. As a result, the number of papers and citations to these papers has been growing steadily. This is why a bibliometric analysis can help to structure all the knowledge on this topic.
Bibliometric analysis has served to structure knowledge. Emphasis has been placed on knowing which authors and organisations have researched complexity in more detail, and which topics are the most researched. Performance analysis and science mapping have proved to be very useful tools that have made it possible to structure and summarise a large amount of knowledge. Moreover, with the use of VOSviewer, one has a visual and intuitive picture of this and can make an analysis in a simple way.
In addition, this bibliometric analysis has been very useful when searching for the main contributions. In a bibliography analysis, in order to identify the most relevant papers, it would be necessary to read all of them and see which ones have most influenced the rest. Thanks to bibliometric analysis, this task has been made easier. The author analysis has made it possible to identify the main authors, and the keyword analysis has made it possible to investigate the main topics. This is a great filter for identifying the main contributions in the topic studied.
Finally, by analysing five main contributions, it has been possible to identify trends in the definition of complexity indicators so far. This topic will continue to evolve, and more indicators need to be defined. Having studied five relevant publications, it has been possible to obtain the weaknesses and strengths of the models developed. This is very useful for the next development of indicators, as they will have to try to maintain the advantages of the indicators developed so far but will have to overcome their weaknesses.
In addition to the conclusions drawn from this analysis, limitations are also established. Firstly, this bibliometric analysis has been carried out on a very specific topic, and only using the Web of Science repository. Therefore, the number of articles that have been collated is limited. Even so, valid conclusions could be drawn from this study, although there may be some relevant studies that have been left out of the analysis. Secondly, bibliometric analysis is a tool that allows for the bibliographic study of many articles. But, it also has the disadvantage that it is not able to see the real contributions of each of them. For this paper, it is a correct approximation, but it does not allow for an exhaustive analysis of the analysed documents.

Author Contributions

Conceptualisation, V.F.G.C.; methodology, F.P.M.; software, R.D.-A.J.; validation, R.D.-A.J.; formal analysis, M.Z.S.; investigation, R.M.A.V.; resources, B.A.-F.; data curation, B.A.-F.; writing—original draft preparation, F.P.M.; writing—review and editing, M.Z.S.; supervision, R.M.A.V.; project administration, V.F.G.C. All authors have read and agreed to the published version of the manuscript.

Funding

This research received no external funding.

Data Availability Statement

Not applicable.

Conflicts of Interest

The authors declare no conflicts of interest.

References

  1. Pandey, M.; Shukla, D. Evaluating the human performance factors of air traffic control in Thailand using Fuzzy Multi Criteria Decision Making method. J. Air Transp. Manag. 2018, 81, 101708. [Google Scholar] [CrossRef]
  2. Gorripaty, S.; Lui, Y.; Hansen, M.; Pozdnukhov, A. Identifying similar days for air traffic management. J. Air Transp. Manag. 2017, 65, 144–155. [Google Scholar] [CrossRef]
  3. EUROCONTROL. Challanges of Growth 2013: Summary Report; EUROCONTROL: Brussels, Belgium, 2013. [Google Scholar]
  4. Simic, T.K.; Babic, O. Airport traffic complexity and environment efficiency metrics for evaluation of ATM measures. J. Air Transp. Manag. 2015, 42, 260–271. [Google Scholar] [CrossRef]
  5. Xie, H.; Zhang, M.; Ge, J.; Dong, X.; Chen, H. Learning air traffic as images: A deep convolutional neural. Complexity 2021, 2021, 6457246. [Google Scholar] [CrossRef]
  6. Zhu, X.; Cao, X.; Cai, K. Measuring air traffic complexity based on small samples. Chin. J. Aeronaut. 2017, 30, 1493–1505. [Google Scholar] [CrossRef]
  7. Radisic, T.; Novak, D.; Juricic, B. Reduction of Air Traffic Complexity Using Trajectory-Based Operations and Validation of Novel Complexity Indicators. IEEE Trans. Intell. Transp. Syst. 2017, 18, 3038–3048. [Google Scholar] [CrossRef]
  8. Wang, F.; Zhao, L. Complexity Analysis of Air Traffic Flow Based on Sample Entropy. In Proceedings of the 2019 Chinese Control and Decision Conference (CCDC), Nanchang, China, 3–5 June 2019; pp. 5368–5371. [Google Scholar]
  9. Flener, P.; Pearson, J.; Agren, M.; Garcia-Avello, C.; Celiktin, M.; Dissing, S. Air-traffic complexity resolution in multi-sector planning. J. Air Transp. Manag. 2007, 13, 323–328. [Google Scholar] [CrossRef]
  10. Gianazza, D.; Guittet, K. Selection and evaluation of air traffic complexity metrics. In Proceedings of the 2006 IEEE/AIAA 25th Digital Avionics Systems Conference, Portland, OR, USA, 15–19 October 2006. [Google Scholar]
  11. Prandini, M.; Piroddi, L.; Puechmorel, S.; Brazdilova, S.L. Toward Air Traffic Complexity Assessment in New Generation Air Traffic Management Systems. IEEE Trans. Intell. Transp. Syst. 2011, 12, 809–818. [Google Scholar] [CrossRef]
  12. Moreno, F.P.; Comendador, V.G.; Jurado, R.D.-A.; Suárez, M.Z.; Janisch, D.; Valdés, R.A. Dynamic model to characterise sectors using machine learning techniques. Aircr. Eng. Aerosp. Technol. 2022, 94, 1537–1545. [Google Scholar] [CrossRef]
  13. Gianazza, D. Airspace configuration using air traffic complexity metrics. In Proceedings of the 7th FAA/Europe Air Traffic Management Research and Development Seminar, Barcelona, Spain, 2–5 July 2007. [Google Scholar]
  14. Xiao, M.; Zhang, J.; Cai, K.; Cao, X. ATCEM: A synthetic model for evaluating air traffic complexity. J. Adv. Transp. 2016, 50, 315–325. [Google Scholar] [CrossRef]
  15. Antulov-Fantulin, B.; Juricic, B.; Radisic, T.; Cetek, C. Determining Air Traffic Complexity challenges and future development. Promet-Traffic Transp. 2020, 32, 475–485. [Google Scholar] [CrossRef]
  16. Moreno, F.P.; Comendador, V.G.; Jurado, R.D.-A.; Suárez, M.Z.; Janisch, D.; Valdés, R.A. Determination of Air Traffic Complexity Most Influential Parameters Based on Machine Learning Models. Symmetry 2022, 14, 2629. [Google Scholar] [CrossRef]
  17. Wang, X.; Zhang, J.; Wandelt, S. On the ramifications of airspace bans in aero-political conflicts: Towards a country importance ranking. Transp. Policy 2023, 137, 1–13. [Google Scholar] [CrossRef] [PubMed]
  18. Xue, D.; Yang, J.; Liu, Z.; Yu, S. Examining the Economic Costs of the 2003 Halloween Storm Effects on the North Hemisphere Aviation Using Flight Data in 2019. Space Weather. 2023, 21, e2022SW003381. [Google Scholar] [CrossRef]
  19. Pang, Y.; Zhao, X.; Yan, H.; Liu, Y. Data-driven trajectory prediction with weather uncertainties: A Bayesian deep learning approach. Transp. Res. Part C Emerg. Technol. 2021, 130, 103326. [Google Scholar] [CrossRef]
  20. Ali, B. A Safety Assessment Framework for Automatic Dependent Surveillance Broadcast (ADS-B) and Its Potential Impact on Aviation Safety; Centre for Transport studies, Department of Civil and Environmental Engineering, Imperial College London: London, UK, 2013. [Google Scholar]
  21. Xue, D.; Hsu, L.-T.; Wu, C.-L.; Lee, C.-H.; Ng, K.K.H. Cooperative surveillance systems and digital-technology enabler for a real-time standard terminal arrival schedule displacement. Adv. Eng. Inform. 2021, 50, 101402. [Google Scholar] [CrossRef]
  22. Mulet-Fortaleza, C.; Genovart-Balaguer, J.; Mauleon-Mendez, E.; Merigó, J.; Genovart-Balaguer, J.; Mauleon-Mendez, E. Twenty five years of the journal of travel & tourism marketing: A bibliometric ranking. J. Travel Tour. Mark. 2018, 35, 1201–1221. [Google Scholar]
  23. Merigó, J.; Balnco-Mesa, F.; Gil-Lafuente, A.; Yager, R. Thirty Years of the International Journal of Intelligent Systems: A Bibliometric Review. Int. J. Intell. Syst. 2016, 32, 526–554. [Google Scholar] [CrossRef]
  24. Yang, W.; Zhang, J.; Ma, R. The Prediction of Infectious Diseases: A Bibliometric Analysis. Int. J. Environ. Res. Public Health 2020, 17, 6218. [Google Scholar] [CrossRef]
  25. Khan, A.; Goodell, J.; Hassan, M.; Paltrinieri, A. A bibliometric review of finance bibliometric papers. Financ. Res. Lett. 2022, 47, 102520. [Google Scholar] [CrossRef]
  26. Rejeb, A.; Rejeb, K.; Abdollahi, A.; Treiblmaier, H. The big picture on Instagram research: Insights from a bibliometric analysis. Telemat. Inform. 2022, 73, 101876. [Google Scholar] [CrossRef]
  27. Bakır, M.; Ozdemir, E.; Akan, S.; Atalik, O. A bibliometric analysis of airport service quality. J. Air Transp. Manag. 2022, 104, 102273. [Google Scholar] [CrossRef]
  28. Valdés, R.A.; Burmaoglu, S.; Tucci, V.; de Costa, L.B.; Mattera, L.; Comendador, V.G. Flight Path 2050 and ACARE Goals for Maintaining and Extending Industrial Leadership in Aviation: A Map of the Aviation Technology Space. Sustainability 2019, 11, 2065. [Google Scholar] [CrossRef]
  29. Tanriverdi, G.; Bakir, M.; Merkert, R. What can we learn from the JATM literature for the future of aviation post COVID-19?—A bibliometric and visualization analysis. J. Air Transp. Manag. 2020, 89, 101916. [Google Scholar] [CrossRef] [PubMed]
  30. Dixit, A.; Jakhar, S. Airport capacity management: A review and bibliometric analysis. J. Air Transp. Manag. 2021, 91, 102010. [Google Scholar] [CrossRef]
  31. White, H.; Griffith, B. Author cocitation: A literature measure of intellectual structure. J. Am. Soc. Inf. Sci. 1981, 32, 163–171. [Google Scholar] [CrossRef]
  32. Cifuentes-Faura, J.; Faura-Martínez, U. Twenty Years of Airport Efficiency—A Bibliometric Analysis. Promet-Traffic Transp. 2021, 33, 476–490. [Google Scholar] [CrossRef]
  33. Castañeda, K.; Sánchez, O.; Herrera, R.; Mejía, R. Highway Planning Trends: A Bibliometric Analysis. Sustainability 2022, 14, 5544. [Google Scholar] [CrossRef]
  34. Garfield, E. Historiographic mapping of knowledge domains literature. J. Inf. Sci. 2004, 30, 119–145. [Google Scholar] [CrossRef]
  35. Pierre, S.; Grawe, P.; Bergstrom, J.; Meuhaus, C. 20 years after To Err Is Human: A bibliometric analysis of ‘the IOM report’s’ impact on research on patient safety. Saf. Sci. 2022, 147, 105593. [Google Scholar] [CrossRef]
  36. Gutiérrez-Salcedo, M.; Martínez, M.; Moral-Munoz, J.; Herrera-Viedma, E.; Cobo, M. Some bibliometric procedures for analyzing and evaluating research fields. Appl. Intell. 2018, 48, 1275–1287. [Google Scholar] [CrossRef]
  37. Garfield, E.; Sher, I. KeyWords PlusTM Algorithmic Derivative Indexing. J. Am. Soc. Inf. Sci. 1993, 44, 298–299. [Google Scholar] [CrossRef]
  38. Chen, Y.; Lin, M.; Zhuang, D. Wastewater treatment and emerging contaminants: Bibliometric analysis. Chemosphere 2022, 297, 133932. [Google Scholar] [CrossRef] [PubMed]
  39. Shi, L.; Mai, Y.; Wu, Y. Digital Transformation: A Bibliometric Analysis. J. Organ. End User Comput. 2022, 34, 37. [Google Scholar] [CrossRef]
  40. Gua, Y.; Hunag, Z.; Guo, J.; Li, H.; Guo, X.; Nkeli, M. Bibliometric Analysis on Smart Cities Research. Sustainability 2019, 11, 3606. [Google Scholar] [CrossRef]
  41. Li, B.; Du, W.Z.Y.; Chen, J.; Tang, K.; Cao, X. A Deep Unsupervised Learning Approach for Airspace Complexity Evaluation. IEEE Trans. Intell. Transp. Syst. 2022, 23, 11739–11751. [Google Scholar] [CrossRef]
  42. Guo, Y.; Hunag, Z.; Gua, J.; Guo, X.; Li, H.; Liu, M.; Ezzeddine, S.; Nkeli, M. A bibliometric analysis and visualization of blockchain. Future Gener. Comput. Syst.-Int. J. Escience 2021, 116, 316–332. [Google Scholar]
  43. Hossian, N.; Dayarathna, V.; Nagahi, M.; Jaradat, R. Systems Thinking: A Review and Bibliometric Analysis. Systems 2020, 8, 23. [Google Scholar] [CrossRef]
  44. Debbache, N. Electronic stripping interface. Aircr. Eng. Aerosp. Technol. 2003, 75, 595–599. [Google Scholar] [CrossRef]
  45. Lee, K.; Feron, E.; Pritchett, A. Describing Airspace Complexity: Airspace Response to Disturbances. J. Guid. Control Dyn. 2009, 32, 210–222. [Google Scholar] [CrossRef]
  46. Delahaye, D.; Puechmorel, S. Air traffic complexity based on dynamical systems. In Proceedings of the 49th IEEE Conference on Decision and Control (CDC), Atlanta, GA, USA, 15–17 December 2010; pp. 2069–2074. [Google Scholar]
  47. Wang, H.; Song, Z.; Wen, R.; Zhao, Y. Study on evolution characteristics of air traffic situation complexity based on complex network theory. Aerosp. Sci. Technol. 2016, 58, 518–528. [Google Scholar] [CrossRef]
  48. Cao, X.; Zhu, X.; Tian, Z.; Chen, J.; Wu, D.; Du, W. A knowledge-transfer-based learning framework for airspace operation complexity evaluation. Transp. Res. Part C Emerg. Technol. 2018, 95, 61–81. [Google Scholar] [CrossRef]
  49. Oktal, H.; Yaman, K. A new approach to air traffic controller workload measurement and modelling. Aircr. Eng. Aerosp. Technol. 2011, 83, 35–42. [Google Scholar] [CrossRef]
  50. Dunn, S.; Wilkinson, S. Increasing the resilience of air traffic networks using a network graph theory approach. Transp. Res. Part E Logist. Transp. Rev. 2016, 90, 39–50. [Google Scholar] [CrossRef]
  51. Dalmau, R.; Gawinoski, G.; Arnoraud, C. Comparison of various temporal air traffic flow management models in critical scenarios. J. Air Transp. Manag. 2022, 105, 102284. [Google Scholar] [CrossRef]
  52. Gianazza, D. Forecasting workload and airspace configuration with neural networks and tree search methods. Artif. Intell. 2010, 174, 530–549. [Google Scholar] [CrossRef]
Figure 1. Description of the bibliometric analysis and relationship with the objectives.
Applsci 14 03604 g001
Figure 2. Publications and citations related to air traffic complexity from 2001 to 2022.
Applsci 14 03604 g002
Figure 3. Number of publications related to air traffic complexity organised by WoS category.
Applsci 14 03604 g003
Figure 4. Number of publications related to air traffic complexity organised by journal or conference.
Applsci 14 03604 g004
Figure 5. Main cluster of co-authorship of authors who have published more than one article.
Applsci 14 03604 g005
Figure 6. Network of co-authorship, representing the total number of authors who have published more than one article.
Applsci 14 03604 g006
Figure 7. Network of organisation co-authorship, representing the total number of organisations in which researchers have published more than one article.
Applsci 14 03604 g007
Figure 8. Network of co-citations, representing the total number of organisations in which researchers have published more than one article.
Applsci 14 03604 g008
Figure 9. Network of co-occurrence of keywords.
Applsci 14 03604 g009
Figure 10. Network of co-occurrence of keywords. Evolution over the last few years.
Applsci 14 03604 g010
Table 1. Most influential authors ordered by total link strength.
AuthorPublicationsCitationsTotal Link Strength
Cao, Xianbin54511
Jun, Chen3218
Du, Wenbo3218
Wang, Hongyong6398
Delahaye, Daniel7237
Zhu, Xi3337
Prandini, Maria5946
Wen, Ruiying3306
Mulder, Max346
Van Paassen, Rene246
Table 2. Most influential organisations ordered by total link strength.
AuthorPublicationsCitationsTotal Link Strength
Civil Aviation University China12567
Delft University Technology7797
Beihang University6456
Queen Mary University London4136
University of Chinese
Academy of Sciences
3216
Table 3. List of most common keywords ordered by total link strength.
KeywordOccurrencesTotal Link Strength
Air Traffic Control2451
Conflict Detection1044
Complexity2340
Model1136
Air Traffic Complexity1831
Air Traffic Management1828
Performance927
Management525
Resolution524
Design320
Table 4. Description of the clusters in the keyword co-occurrence network.
ClusterNumber of KeywordsKeywords
19Air Traffic complexity, Aircraft, Complexity Metrics, Design, Graph Theory, Management, Performance, Resolution, Strategies
27Conflict Detection, Conflict Resolution, Mental Workload, Model, Stability, Systems, Task
36Air Traffic Management, Airspace Complexity, Complex Network, Efficiency, Impact, Traffic Complexity
45Air Traffic Control, Air Traffic Flow Management, Complexity, Machine Learning, Uncertainty
52Neural Network, Workload
61Resilience
71Time-series
Table 5. Preliminary analysis of main contributions on air traffic complexity.
PaperCitationsMain Topic
[45]41Sector complexity maps, defined as the response to disturbances
[46]21Defining complexity through dynamic system modelling
[11]72Review of complexity indicators
[47]25Study of the complexity of air traffic based on the study of complex networks
[48]21Complexity prediction using machine learning models
Table 6. Benefits and limitations of the above models.
BenefitsLimitations
Complexity models are developed based on aircraft trajectoriesTrajectory-based models do not take into account other aspects, such as regulations
Models classifying complexity according to the scenario as low, medium, or highThis classification is usually based on expert opinion, although artificial intelligence is increasingly being taken into account
Newer indicators are beginning to try to make predictions of complexityThe most commonly used indicators do not take into account the uncertainty of aircraft trajectory, although new ones are starting to take it into account
Disclaimer/Publisher’s Note: The statements, opinions and data contained in all publications are solely those of the individual author(s) and contributor(s) and not of MDPI and/or the editor(s). MDPI and/or the editor(s) disclaim responsibility for any injury to people or property resulting from any ideas, methods, instructions or products referred to in the content.

