


Identification of Students with Similar Performances in Micro-Learning Programming Courses with Automatically Evaluated Student Assignments

Faculty of Natural Sciences and Informatics, Constantine the Philosopher University in Nitra, Tr. A. Hlinku 1, 9494 01 Nitra, Slovakia
*
Author to whom correspondence should be addressed.
Appl. Sci. 2024, 14(9), 3615; https://doi.org/10.3390/app14093615
Submission received: 29 January 2024
/
Revised: 14 April 2024
/
Accepted: 22 April 2024
/
Published: 24 April 2024
(This article belongs to the Special Issue Artificial Intelligence Technologies for Education: Advancements, Challenges, and Impacts)
Abstract
:Featured Application
The student performance data stored in the micro-learning platform Priscilla, specially developed to improve IT students’ knowledge, is analyzed using learning analytics methods to identify meaningful groups of students with similar performances and uncover possible changes in the number of identified groups and their compositions in consecutive term periods and based on different types of activities.
Abstract
The identification of heterogeneous and homogeneous groups of students using clustering analysis in learning analytics is still rare. The paper describes a study in which the students’ performance data stored in the micro-learning platform Priscilla are analyzed using learning analytics methods. This study aims to identify the groups of students with similar performances in micro-learning courses focused on learning programming and uncover possible changes in the number and composition of the identified groups of students. The CRISP-DM methodology was used to navigate through the complexity of the knowledge discovery process. Six different datasets representing different types of graded activities or term periods were prepared and analyzed for that purpose. The clustering analysis using the K-Means method found two clusters in all cases. Subsequently, performance metrics, the internal composition, and transfers of the students between clusters identified in different datasets were analyzed. As a result, this study confirms that analyzing student performance data from a micro-learning platform using learning analytics methods can reveal distinct groups of students with different academic performances, and these groups change over time. These findings align with teachers’ assumptions that the micro-learning platform with automated evaluation of programming assignments highlights how the students perceive the role of learning tools during learning programming in different term periods. Simultaneously, this study acknowledges that clustering, as an exploratory method, provides a solid basis for further research and can identify distinct groups of students with similar characteristics.
1. Introduction
Learning analytics (LA) represents a research discipline that gathers, measures, and analyses available educational data about stakeholders for understanding and optimizing the learning process and the whole environment where the learning process occurs [1]. Higher educational institutions (HEIs) worldwide have already understood the benefits of LA, which applies modern statistical and machine learning techniques on different levels of the learning process, targets the institutional level, and tries to support the decision-making processes of the HEIs. In this context, LA research is primarily driven by the data available in different virtual learning environments (VLE) to improve student success and predict early dropout, student retention, and the learning experience.
In this context, the Erasmus Plus project FITPED aimed to design and implement a sustainable educational model, which supports the development of highly specialized skills and competencies of future IT experts in programming and software development. The research outcomes of the project were summarized in [2]. Its successor project, FITPED-AI, continues in this effort and aims to prepare IT students for a career in artificial intelligence, especially in machine and deep learning.
Both projects continually develop a modern micro-learning platform named Priscilla. This platform implements a novel educational model, which utilizes the benefits of micro-learning units, interactive activities, automated evaluation of student assignments, and gamification elements. As a result, this educational model applies selected elements of work-based, collaborative, and problem-based learning to improve students’ readiness for lifelong learning. The proposed and implemented model has already shown its potential to decrease the number of students with learning problems and increase the level of knowledge obtained from computer science courses [2]. Therefore, the micro-learning courses provided on the platform can be considered a valuable prerequisite for increasing graduates’ highly specialized knowledge and skills.
The Priscilla platform has become an integral part of teaching and learning programming at the universities participating in the projects for three academic years. More than 1800 individual student accounts have been created on the platform. In addition, students have actively participated in most of the 26 micro-learning courses created. The platform provides more than 4330 micro-learning units, 2200 automatically evaluated programs, 180 course topics based on the work-based and problem-based learning strategy, and 560 solved student projects from practice within the educational model.
The positive impact of the educational model implemented in the micro-learning platform Priscilla has been confirmed by surveys and conventional statistical and educational technology research methods. Together with the conceptual architecture of the platform, these are described on the project webpage (www.fitped.eu).
Even though the Priscilla stakeholders positively evaluated the attractivity, interactivity, and usefulness of the platform, the student’s behavior in the micro-learning courses enhanced with automated programming assignment evaluation requires further research to confirm that the proposed educational settings have a positive impact on the number of students, who will learn better programming skills and achieve higher academic performances.
The learning analytics researchers previously confirmed the positive impact of the LA methods on the understating of learners, learning outcomes, and the learning process in general. Considering the number of students, micro-learning courses, and assignments mentioned above and the rising amount of stakeholders’ data stored in the platform, it is natural to expect that using suitable learning analytics methods can uncover hidden patterns in students’ learning behavior or identify students with similar learning patterns. Their understanding can further improve the platform and educational model behind it. It can also influence subsequent platform and educational content development. Although these methods can be applied at the course, topic, or platform level, the most promising results can be expected at the course level because of the direct relationship between the applied educational model, course structure, and students.
Concurrently, it is worth noting that the primary motivation to develop the platform was a belief that providing the learning content in the form of micro-learning units suitably combined with questions and automatically evaluated programming assignments can positively influence students’ self-confidence and engagement in learning programming. This expectation was amplified by the teachers’ previous negative experiences with teaching programming in two separate systems for providing educational online content and automated programming code evaluation.
Therefore, this paper’s main aim is to analyze students’ academic performance data using unsupervised machine learning methods to identify the groups of students with similar performances and behaviors in a Java programming micro-learning course and uncover possible changes in the number of identified groups in consecutive periods of the term and based on different types of micro-learning units. The following research questions can be formulated to addresses this issue:
- Q1.
- How do the students’ performances in micro-learning units with quizzes and programming assignments in introductory micro-learning courses affect the number of identified meaningful clusters?
- Q2.
- How do identified groups of students with different academic performances change in composition over three periods of term?
According to Shafiq et al. [3], who published a taxonomy of machine learning approaches used in learning analytics in different learning environments, the application of ensemble and unsupervised learning clustering techniques for the identification of the heterogeneous and homogeneous groups of students is still generally lacking. In addition, available studies deal predominantly with data obtained from the LMS environments or surveys. Clustering analysis of the students’ partial achievements in learning programming in a tailor-made environment is rare. Therefore, the application of clustering analysis with the evaluation of students’ data obtained from a micro-learning environment and comparing changes in cluster distribution found in different term periods can be considered partially novel. This paper contributes to the discussion of whether delivering educational content in the form of micro-learning units with automated programming assignments can identify meaningful groups of students with different academic performances and whether these groups change over time. Consequently, these findings could initialize the adjustment of the educational model and initialize changes in course structure and content sequencing. Simultaneously, the presented results can evoke new ideas, which can be considered in the future development of the platform Priscilla in the context of the planned implementation of the learning analytics module and dashboard. These findings could decrease the dropout rate and achieve better academic performance.
The paper is structured as follows. First, the Related Works section summarizes some interesting findings of similar studies. Consequently, all phases of the CRISP-DM methodology are described to explain the complexity of the problem of the practical adoption of machine learning methods in the case of data obtained from the micro-learning platform. The selected clustering methods and other evaluation and visualization techniques are then applied to different datasets to identify distinct groups of students with similar performances. This section also analyzes and visualizes the changes in the composition of individual groups of students to understand the differences and behavioral patterns of the found groups over time and based on types of activities. Afterwards, this paper summarizes the main findings, the limitations of this study, its implications for future changes in the micro-learning platform and educational model, and recommendations for further research directions.
2. Related Works
This section summarizes the results of other related scientific papers from the educational data mining (EDM) and learning analytics domains, which apply different clustering methods to students’ performance data from their interactions with a virtual learning environment. The researchers in both domains systematically analyze specific patterns of students’ interactions with VLE, their performances, and the risk of early dropout or achievements [4]. Aldowah et al. [5] also confirmed these trends, especially in higher education. They stated that specific EDM and LA methods could offer the best means of solving specific learning problems. Similarly, Gashevic et al. [1] provided a concise review of the current state of the learning analytics research field and its typical tasks, technologies, and challenges. As a result, they stated that many learning analytics and educational data mining methods, including clustering, have been successfully applied to the student’s activity and performance data stored in VLEs during the last decade.
As stated by Shafiq et al. [3], publications that dealt with unsupervised machine learning clustering techniques for the identification of the heterogeneous and homogeneous groups of students as a primary research topic are still rare. Clustering analysis was more frequently applied as a part of the data-understanding phase [6] or data-modeling phase, together with classification or prediction [7,8]. Several papers tried to find the best clustering methods and algorithms using artificial, open-source, or real datasets [9,10].
Regarding the selection of the best clustering method in LA research, K-Means was the most often selected [10]. The reason is that this unsupervised machine learning method is considered simple, flexible, and time-effective for the cluster analysis of educational data, which usually have linear or monotonic relationships. Other, more robust methods like DBSCAN or OPTICS, often applied in industry and engineering, were not frequently applied in the LA domain [11]. Table 1 summarizes the main characteristics of other studies focused on clustering analysis in the context of learning analytics and topics related to the study presented in this paper. As can be seen, a low number of identified clusters is typical for the education domain because of the issues related to the correct interpretation of higher values. Simultaneously, it is surprising that several studies did not apply any internal or external validation metrics, which can cause problems with the generalization of the findings.
Even fewer articles dealt with clustering data about the students’ performances in learning programming courses. Avella et al. [12] confirmed the potential of clustering methods to understand students’ performances better and identify behavioral patterns. However, they did not deal with programming courses or data from the micro-learning environment. Beena et al. [13] used K-Means clustering to group students with similar performances without collecting their previous academic records or demographic information. They identified 7.7% as slow learners, 31% as average learners and the rest as advanced learners. Simultaneously, they found a correlation between these groups and academic success. Nafuri et al. [14] classified low-income students based on the clustering analysis of their academic performance. They applied three unsupervised models, including K-Means. As a result, they identified five clusters of students and proposed actions that could increase their success. Gonzalez-Nucamendi et al. [15] studied relationships among the self-regulation learning and affective strategies and multiple intelligence dimensions of students using clustering analysis. As a result, they identified features that positively or negatively impacted academic performance. These publications confirm the suitability of clustering analysis and selection of the K-Means method for the identification of groups with similar academic achievements. On the other hand, they did not focus on data from programming learning courses or the micro-learning environment.
The following papers used clustering analysis in close connection with programming. Gupta et al. [16] proposed a rubric based on the learning outcomes like syntactical, logical, conceptual, and advanced JAVA skills. K-Means clustering was applied to the results to classify the students according to their learning preferences and abilities. Bey et al. [17] introduced a three-phase process and a case study in which unsupervised clustering techniques were used to automatically identify learners’ programming behavior. They continued their research [18] and analyzed students’ programming habits using K-Means clustering. They found six students’ profiles, which differed in behavioral trajectories and performance. However, they did not combine data from VLE with the automated programming code evaluation tool.
Similarly, López-Pernas et al. [19] combined learning analytics methods, including clustering and sequence analysis, to examine students’ strategies when learning programming. They combined data from VLE and automated assessment tools. They found that the students have special preferences for specific learning resources when learning programming and often use slides that support search and copy-and-paste actions. Kovari et al. [20] applied K-Means clustering to study self-confidence in programming, problem-solving, and engagement in software development courses. They identified two groups of students based on their self-confidence in programming.
This analysis of the related works confirms that there is a general agreement that clustering methods can contribute to a better understanding of the students’ behavior and achievements in VLE, but further research is needed. Moreover, despite the popularity of learning programming platforms, including micro-learning platforms, the number of research studies that apply clustering is limited.
3. Methodology
This study used clustering analysis to evaluate students’ data from a micro-learning environment and looked for changes in cluster distribution found in different term periods. The study followed individual steps of a well-known knowledge discovery process: the CRISP-DM methodology. This methodology guides the researchers through all phases of the knowledge discovery process. Previous research papers confirmed its suitability for learning analytics projects [21,22]. All phases of the CRISP-DM methodology, such as data understanding, preprocessing, modeling, and evaluation, are described in detail to eliminate the risk of the unintentional underestimation of a particular research phase. At the same time, this methodology can explain the complexity of the issues, as well as the practical use of machine learning methods in learning analytics.
Figure 1 visualizes the necessary actions realized in the individual steps of the CRISP-DM methodology. The output datasets on the right side will be introduced and analyzed in detail in the next sections.
3.1. Problem Understanding
As mentioned in the introduction section, this paper aims to determine whether delivering educational content in micro-learning units with automated programming assignments can identify groups of students with different academic performances and whether these groups change over time. The students’ performance data stored in the micro-learning platform Priscilla were analyzed using selected learning analytics methods. Among other things, the results of this study can help to explore the potential and suitability of the collected data for the future implementation of a learning analytics module or dashboard. This module should engage students in achieving their learning goals, support teachers in applying suitable and early forms of intervention, and fulfil the expectations of the micro-learning platform Priscilla community of stakeholders.
Nowadays, the platform stores data about the students’ activities in the form of xAPI logs. However, their potential for clustering without massive preprocessing is questionable. On the other hand, the platform provides several reports for teachers and managers through its user interface. These reports provide detailed information about each student’s progress, partial and final grades, number of attempts, and experience points as gamification module outputs. Nevertheless, these data resources have not yet been systematically analyzed with machine learning methods.
A programming course, Introduction to Java, was selected for this study. Almost 120 students had started to learn programming in this course. During the term, they gradually went through individual topics suitably ordered to develop the students’ skills in Java programming in line with the object-oriented paradigm. Each topic contained micro-learning units with quizzes, which tested students’ correct understanding of the topic and provided immediate feedback to them. Afterwards, each student had to solve a set of programming assignments with automated feedback and programming code evaluation to verify whether they correctly understood the given programming concept. Each student could repeat the quizzes and automatically evaluate the programming code without limit, use hints, and receive grades for successfully passing the activities.
This educational strategy can be considered one of the most essential features of the micro-learning platform. It aligns with the expectations of the current generation of students who prefer combining short textual or graphical content with interactive activities. The micro-learning platform replaced programming courses created in LMS Moodle, which used the Virtual Programming Lab (VPL) plugin for the automated evaluation of programming assignments. The main motivation to leave LMS Moodle resulted from the students’ dissatisfaction with the complexity of the programming courses enhanced with the VPL plugin. The reason was that many activities and resources made the course confusing. The micro-learning platform tried to eliminate this problem. The automated evaluation of programming assignments based on VPL was improved and successfully implemented in the micro-learning platform during the realization of the FITPED project.
The primary motivation for clustering analysis can be explained using heatmap visualization (Figure 2). This figure shows a normalized heatmap of each student’s performance in individual micro-learning units and programming code assignments in individual topics. Topics were ordered chronologically by how they happened in the term. The students with the lowest performance were ordered at the bottom. The enrolled students with zero activity were removed for better clarity. Each student’s performance was normalized because each topic contained a different number of graded quizzes and programming assignments.
Unsurprisingly, the students’ activity levels and performances declined during the term. However, this distribution simultaneously indicates that the students’ activity levels seem to decline after two control tests (Methods and Static class topics). There seem to be differences between grades achieved in micro-learning units with quizzes and programming assignments, which are parts of the thematic topics. These findings should be investigated in more detail to understand the students’ behavior better and improve the course structure and its content. Therefore, the clustering analysis was chosen as the first to uncover whether the students with similar performance create clusters and whether these clusters change over time.
3.2. Data Understanding
The dataset was downloaded in tabular form from the Priscilla platform. The data were anonymized in the first step because this knowledge discovery task did not expect any intervention in which student identification occurs. As a result, it was not possible to reversely identify individual student personal data from the analyzed dataset or identified clusters. The dataset contained detailed information about each student enrolled in the micro-learning course on programming in Java. The course contained more than 400 micro-learning units divided into thematic topics. Each topic provided several categories of units, like an explanation of the theory, quizzes, and programming assignments with automated programming code evaluation. The students could repeatedly use these units and train in practical programming skills. The students received the following two types of grades:
- Grades, which characterize the level of comprehension of the learning content belonging to the individual topics of the course. The platform collected data about the number of attempts in quizzes, received scores, and spent time, which were summarized in these grades.
- Grades from automatically evaluated programming assignments using a modified VPL. The platform collected data about the number of attempts, received scores, use of hints, and spent time, which were reflected in the calculation of these grades.
The dataset contained aggregated data about 119 unique students and 17 attributes, which characterized their performances in graded automated programming assignments and micro-learning units with quizzes. Table 2 shows an exploratory data analysis of the input dataset. Seventeen students enrolled on the course but did not participate in any activity. Therefore, they were removed from the dataset before this analysis to minimize the bias. Each table column represents a learning topic containing micro-learning units with quizzes or programming assignments, which correspond to a particular programming learning construct. These topics are shown in the same order in which they took place in the term. One topic took approximately two weeks.
After initial data exploration and discussion with the course developers and teachers about the exact meanings of individual attributes, the final dataset contained 17 attributes. Nine attributes represented the grades received from micro-learning units with quizzes, and eight attributes characterized the students’ performances in programming assignments (with VPL suffix). The first group of attributes was consequently visualized using boxplot to graphically depict the distribution of the numerical data through their quartiles (Figure 3). Moreover, correlation matrix was calculated to ensure that the initial requirements of the planned clustering methods were fulfilled (Figure 4). A similar approach was applied to the second group of attributes (Figure 5 and Figure 6).
Figure 3 confirms our expectations that the students repeatedly answered the questions in the quiz until they reached almost maximal grades. Even though they could ask for a hint, they used this option rarely. As a result, most boxplots had very high values of the mean. Values below average belong to the students who did not finish all quizzes or other graded activities in micro-learning units.
Spearman’s rank correlation coefficient is a nonparametric measure of rank correlation. It assesses how well the relationship between two variables can be described using a monotonic function. Spearman’s correlation assesses monotonic relationships, whether linear or not. Even though Figure 4 shows positive correlations between individual topics, these attributes were not removed from the dataset for several reasons. Firstly, this correlation was expected because students were motivated to complete all the quizzes as part of their learning process. Secondly, planned clustering methods are not sensitive to the correlation between input features. Finally, removing individual features can significantly impact the final distribution and number of clusters. However, these correlations should be considered if principal component analysis (PCA) is applied.
Figure 5 shows the box plots representing grades received from programming assignments. The students could receive different grades depending on the number of unique tasks, number of attempts, and used hints. The lower position of the means in boxplots is worth mentioning, as it differs in comparison to the previous groups of attributes. The higher difficulty of the programming tasks probably caused this difference.
The impact of a wider distribution of the students’ achievements in programming assignments is also evident in the correlation matrix (Figure 6). Spearman’s rank correlation coefficients were lower. Therefore, it was not necessary to remove any attributes for the same reasons as those previously considered.
3.3. Data Preprocessing
Each machine learning project requires thoughtful analysis of the original dataset and the application of inevitable data preprocessing techniques to prepare an input dataset, which respects the specificity of the planned machine learning methods. In this study, most preprocessing tasks were already realized during the initial data collection and ingestion phase from different database tables. As was mentioned, attributes represented aggregated grades from different topics. Each row in the dataset represented the academic performance of one student. Therefore, grades on individual activities were not scarce and did not contain null values.
Consequently, an open-source low-code machine learning library named PyCaret for Python was used in this case study to automate the machine learning workflow. The preprocessing phase is the right point at which such low-code machine learning libraries can be helpful. The library automates many repeating preprocessing steps and provides many options to correctly set up the parameters of the implemented preprocessing methods [23]. During its application on the input dataset, several features were retyped. Simultaneously, the dataset was normalized. As a result, a final dataset with 102 rows and 17 numeric features was created and prepared for applying selected clustering algorithms.
After cleaning and normalizing the dataset, the following datasets were created in line with the planned main aim of this study:
- Dataset with all features, which represent students’ performances in the programming course;
- Dataset MC, which contains only features representing students’ performances in micro-learning units and quizzes;
- Dataset VPL, which contains only features representing students’ performances in automatically evaluated programming code assignments;
- Dataset T1 has all the features from the first period of the term, including micro-learning units, quizzes, and assignments;
- Dataset T2 with all features from the second period of the term, including micro-learning units, quizzes, and assignments;
- Dataset T3 with all features from the third period of the term, including micro-learning units, quizzes, and assignments.
3.4. Modeling and Model Evaluation
Clustering analysis is an exploratory data mining activity that aims to group a set of objects so that the objects in the same group (a cluster) are more similar than those in other groups. The different clustering methods include density-based, distribution-based, grid-based, connectivity-based, and partitioning clustering. Each type of clustering method has its own strengths and limitations, and the choice of method depends on the study’s specific data analysis needs. The most frequently used unsupervised machine learning methods in learning analytics are K-Means, Agglomerative Clustering, DBCAN, and K-Modes.
Involving the low-code machine learning library Pycaret simplified the modeling phase of the CRISP-DM methodology. It automates the repeating application of clustering methods, including K-Means, Affinity Propagation, Mean Shift Clustering, Spectral Clustering, Agglomerative Clustering, Density-Based Spatial Clustering, OPTICS Clustering, Birch Clustering, and K-Modes. Calling individual APIs includes hyperparameter tuning of the selected clustering method and repeating initialization. As a result, the library visualized several characteristics of the found clusters, as well as summarized their performance metrics, considering the unique features of the selected method.
The models were evaluated using the most common performance metrics, such as the Silhouette Coefficient, Davies–Bouldin Index, and Calinski–Harabasz Index. All three provide intra-cluster characteristics of the clusters. In other words, the score is based on the cluster itself and not on external knowledge such as labels. The Calinski–Harabasz index compares the variance between clusters to the variance within each cluster. The Davies–Bouldin index is a validation metric often used to evaluate the optimal number of clusters. It is defined as a ratio between the cluster scatter and the cluster’s separation, and a lower value will mean that the clustering is better.
Whereas the Elbow method assumes that the distortion/inertia decreases linearly, the appropriate number of clusters can be found visually, locating the kink or elbow in the plot. However, the Elbow method, in selecting the number of clusters, may work correctly because the error function is monotonically decreasing for all initially selected centroids.
3.4.1. Clustering Analysis Using All Features
The first analyzed dataset contained features from both groups of grades. Table 3 summarizes the results of the application of several clustering methods. Even though the Elbow method suggested five initial clusters for the K-Means method (Figure 7), Table 3 shows that the K-Means model with k = 2 was the best after hyperparameter tuning. Other methods, which do not require an initial estimation of the number of clusters, suggested more clusters. However, the intra-clustering characteristics were significantly worse.
Similar results were obtained when principal component analysis (PCA) was applied before clustering. PCA tries to find the best possible subspace, which explains most of the variance in the data. In other words, PCA can avoid the curse of dimensionality. PCA suggested that five components explained more than 90% of the variance (Figure 7).
These findings also confirmed inter-cluster distance maps for different k values (Figure 8). Inter-cluster distance maps display the embedding of the cluster centers in a two-dimensional space with the distance to the other centers preserved. The clusters are sized according to the number of instances that belong to each center. Their size expresses the relative importance of clusters. It is worth noting that the clusters have comparable sizes in the case of six clusters, except one. The overlapping of the clusters means the case was wrongly assigned to the correct cluster. It also confirmed that not all students’ performance attributes could be included in the clustering to find groups of students with similar behaviors.
All metrics confirmed that the distribution of the cases in clusters was not optimal and could potentially be improved using subsets of original features. Therefore, the following sections will analyze other datasets created in the preprocessing phase.
3.4.2. Clustering Analysis of Micro-Learning Units and Quizzes
This dataset contained nine features, representing the grades from micro-learning units with quizzes. Each feature summarized the grades from one topic. Table 4 summarizes the results of K-Means clustering with performance metrics. Again, although the Elbow method suggested five clusters, the method performed the best in the case of two clusters. The value of intra-cluster characteristics continually declined for a higher number of clusters.
The higher value of the Silhouette coefficient indicates that the data points are well clustered, with clear separation between clusters and tight cohesion within each cluster. The comparison of the Silhouette plots of K-Means clustering for different k values showed uneven data distribution between clusters (Figure 9). Simultaneously, the negative value of the Silhouette coefficient confirmed the problems with correct data distribution and the possible misclassification of data to the correct clusters.
3.4.3. Clustering Analysis of Automatically Evaluated Programming Code Assignments
The dataset analyzed in this section represents grades from automatically evaluated programming code assignments in individual topics. The dataset contained eight features. The Elbow method curve suggested setting the number of clusters to five. The results of K-Means clustering with performance metrics for different values of k for these features confirmed again that the students’ performance results could create two clusters (Table 5). However, the highest Silhouette coefficient value was lower than in the dataset with micro-learning units.
The comparison of Silhouette plots of K-Means clustering for different values of k showed the dominancy of one cluster (Figure 10) and uneven distribution of data between other small clusters.
The suggestion to divide the students’ grades into two clusters aligns with the previous results. The reasoning for the existence of two clusters was also confirmed in teachers’ feedback. They repeatedly noticed that involving a micro-learning platform did not cause a normal distribution of the grades between students. However, it highlighted the differences between students with a positive attitude toward learning tools and students who do not prefer intensive use of tools in learning programming.
More subjectively, students could be divided into more than two clusters, as suggested in Figure 11. A visualization of inter-cluster distance maps for different k values indicates that the dataset contains more groups of students with similar performances. This statement aligns with the survey results among the teachers who implemented the course. They observed a similar number of student groups, as identified using clustering methods. For example, the students who made continual efforts during the semester represented the first group. The second group of students focused mainly on automated programming assignments. The third group is characterized by losing interest as the assignments become harder. Finally, the last group or cluster represents students with minimal effort or self-motivation. However, these observations and subjective conclusions should be further analyzed and confirmed using other learning analytics methods or process mining. The reason is that inter-cluster distance maps use PCA with two components to map multidimensional space to 2D space. This means the clusters with visible intra-cluster distance can look different in higher-dimensional space.
The comparison of how students moved between clusters identified using micro-learning units with quizzes and programming assignments could add an interesting contribution to this discourse about students’ behavior. The Rand Index computes a similarity measure between two clustering results by considering all pairs of samples and counting pairs assigned in the same or different clusters. The Adjusted Rand Index represents its normalized value. It has a value close to 0.0 for random labeling independently of the number of clusters and samples and exactly 1.0 when two clustering results are identical. The order of the samples must be the same in both clustering results. The adjusted Rand Index was 0.574, indicating that several students moved between clusters. A contingency matrix can visualize this movement, which shows the relationship between labels. As a result, eight students moved from the first cluster identified in micro-learning units to the second cluster identified in programming assignments. On the other hand, four students moved from the second cluster to the first one. Other students stayed in the same cluster (Figure 12).
3.4.4. Clustering Analysis of Students’ Academic Performance over Term
As was mentioned in the problem understanding phase, the students’ activity levels and performances declined during the term, mainly after two control tests (Methods and Static class topics) (Figure 12). Therefore, the clustering analysis was applied to the following three datasets, which represent the students’ grades obtained in different term periods:
- Dataset T1, with all features from the first term period, including micro-learning units, quizzes, and assignments;
- Dataset T2, with all features from the second term period, including micro-learning units, quizzes, and assignments;
- Dataset T3, with all features from the third term period, including micro-learning units, quizzes, and assignments.
Figure 12.
Contingency matrix describing the relationship between labels assigned to the data belonging to the clusters found for features that represent grades from micro-learning units with quizzes (0) and features that represent grades from programming assignments (1).
Figure 12.
Contingency matrix describing the relationship between labels assigned to the data belonging to the clusters found for features that represent grades from micro-learning units with quizzes (0) and features that represent grades from programming assignments (1).

Table 6, Table 7 and Table 8 summarize the results of applying the K-Means method for different values of k on datasets from different parts of the term. Similarly, with the models from previous sections, the best performance metrics belong to k = 2. These findings confirmed the teachers’ observation that students created two groups based on their attitudes toward using the micro-learning platform. They mainly considered the automated evaluation of programming assignments as a part of their learning process.
Moreover, considering the subjectively identified four groups of students with similar performances, the results shown in the tables could motivate us to examine not only the results of clustering with k = 2 but also those of clustering with k = 4 in more detail. Figure 13 shows the final distribution of data between identified clusters. The most significant changes are visible between the third period and the two previous ones in the case of two identified clusters. Similar movement between clusters is also visible in the case of four identified clusters, namely between cluster 2 and cluster 0 in the last observed period of the term.
Table 9 shows the values of the Adjusted Rand Index, which expresses the similarity between the clustering results with k = 2. The most significant movement between clusters happened between the first and the third period.
Figure 14 shows that the composition of clusters between the first and second periods did not change significantly. Only six students moved to another cluster based on their results. However, the composition changed significantly between the second and third periods and the first and third periods.
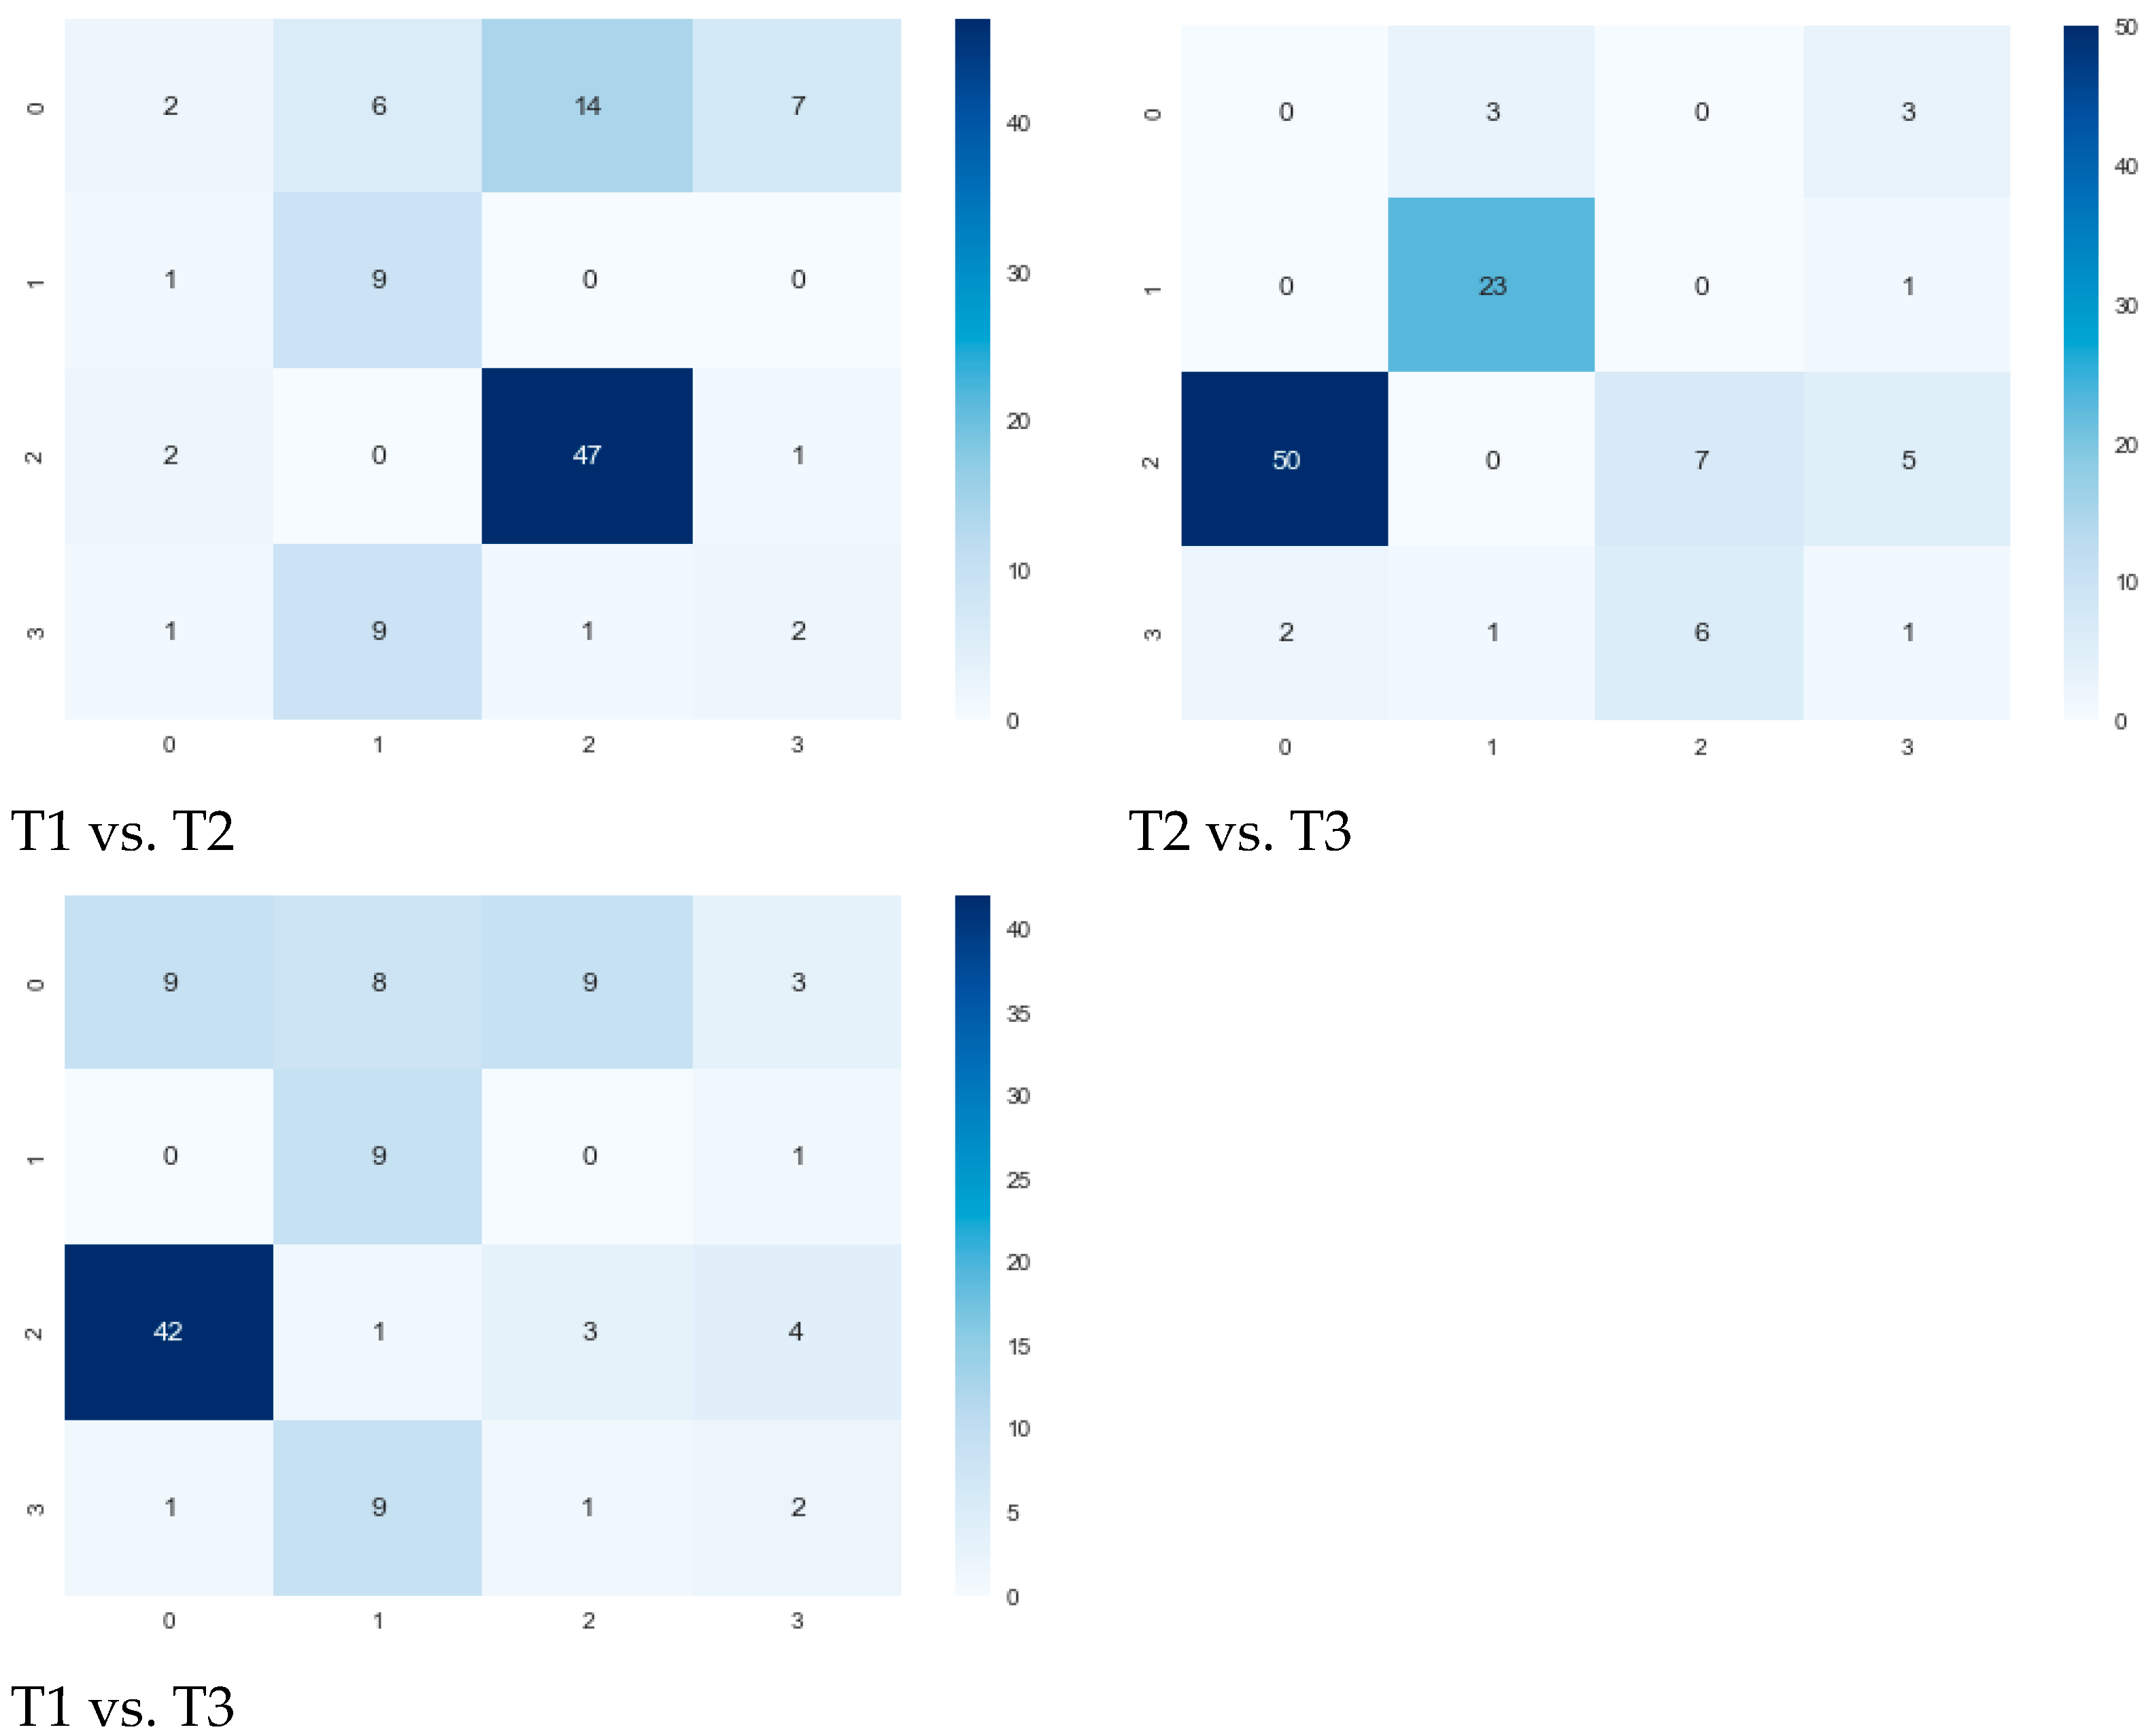
An analysis of similarities between the clustering results with k = 4 confirmed the transfer of the students between clusters after the second period (Table 10). The most significant changes in the composition of the clusters happened between the first and the third periods.
Figure 15 shows changes in the compositions of clusters in absolute numbers. Again, the most significant change happened towards the third period. The composition of the clusters changed between the second and third periods and between the first and third periods. While most students did not change clusters based on their performances between the first two periods (47 students), they transferred to other clusters during the third period. These findings and possible reasons are analyzed in the Discussion section in more detail.
4. Discussion
This paper’s main objective was to analyze students’ academic performance data using unsupervised machine learning methods and find potentially useful patterns regarding students’ performances in learning programming. The first research question (Q1) tried to find how the students’ performances in micro-learning units with quizzes and programming assignments affect the number of identified meaningful clusters. Therefore, several datasets were prepared and analyzed for that purpose. The clustering analysis found two clusters in all cases. This finding confirmed teachers’ assumptions and feedback that the micro-learning platform with automated evaluation of programming assignments highlighted the students’ attitudes towards using learning tools during learning programming. While the activity of the first group of students on the platform led to higher grades, the activity of the students who did not prefer the intensive support provided by the platform led to lower grades. This observation is comparable with each student’s performance before the platform was deployed at the university. It is not surprising and confirms the conclusions of other research publications, which dealt with the role of virtual learning platforms with automated programming code evaluation in the learning process, especially in learning programming. The positive effects of platforms like Priscilla on the learning process will manifest only when the students accept that these tools were developed to help them with the most challenging part of learning programming—associating theoretical knowledge with practical programming skills. While the developers and platforms seem to be better prepared, the teachers and, in particular, students should continually work on improving their learning and teaching methods in line with the main principles of self-regulation learning.
Furthermore, the cluster analysis indicates the existence of more than two clusters of students. Although the performance metrics did not strongly support this statement, further analysis of each student’s characteristics and behavior could uncover potentially useful knowledge. For example, using association or sequence rule analysis or process mining methods could confirm the correctness of the teachers’ observation that the students naturally group into four clusters based on their performances.
As mentioned earlier, the aim of this study was to identify the groups of students with similar performances in the Java programming micro-learning course and uncover possible changes in the number of identified groups in consecutive periods of the term and based on different types of micro-learning units. However, the methodology and findings can also be helpful outside this course. This course represents a whole family of similar courses developed on the micro-learning platform, which have the same structure and combine micro-learning units with quizzes and programming assignments for different programming languages. Moreover, they contain similar structures of thematic topics, which allow the students to practice and improve their programming skills. Therefore, the analysis of students’ performance data from other courses could be extrapolated from these findings.
The second research question (Q2) tried to examine how identified groups of students with different academic performances change in composition over three periods of term. This study confirmed the natural assumption that delivering educational content in micro-learning units with automated programming assignments leads to creating groups of students with different academic performances. The compositions of these groups change based on activity type and over time. The transfer of students between the clusters identified in cluster analyses of datasets with different types of features indicates (Figure 12) that eight students decreased their performances and fell into another cluster. On the other hand, four students increased their performances in programming assignments. The transfer of the students between the found clusters in different periods of the term confirmed these findings and provided more interesting opportunities for further analysis. In the case of two clusters found, the composition of the clusters significantly changed before the third period of the term (Figure 14). Unfortunately, the analysis of input data showed that this movement was not in favor of higher activity of students in activities, particularly programming assignments.
On the contrary, each student’s motivation to solve programming assignments declined during the term and after the midterm tests. This conclusion aligns with the teachers’ feedback, as they mentioned that they had a problem keeping students interested after they became familiar with the course’s difficulty and teaching style and achieved high enough grades to pass the course with minimal effort. These students’ behaviors can also be observed from contingency matrices, which represent changes in the cluster composition in the case of the four clusters identified in different term periods (Figure 15). However, these conclusions were based on the analysis of the input data. Further detailed analysis of input data supplemented by interviews with students or surveys is needed before these findings can be generalized.
This study confirmed that data about the students’ performance in the micro-learning platform have research potential in connection with learning analytics methods. Applying clustering analysis to student data obtained from a micro-learning environment and comparing changes in cluster distribution found in different periods of the term can be considered valuable. Clustering, as an exploratory method, provides a solid basis for further research, along with other supervised or semi-supervised methods.
On the other hand, the presented research has several limitations that should be considered. This study confirmed the conclusions of other research publications that the volume and veracity of data impact the research findings and their possible generalization. The micro-learning platform Priscilla can be considered a newly developed system that provides valuable reports for teachers and managers. Even though the implemented approach to storing data about students’ activity and performance is based on recommendations and standards for educational research, it does not fully support learning analytics research and does not simplify the machine learning process. As a result, any attempt to implement a learning analytics module still requires a precise evaluation of the structure and semantics of stored data and additional preprocessing or computing.
The datasets used in this study did not require massive cleaning because they were directly received from the structured reports available on the platform. They contained aggregated information about the students’ grades and other behavioral characteristics in the course. The number of rows corresponds to the number of unique students because of data aggregation. This limited input dataset size can have a negative impact on the results. However, the size of the dataset used in this study was comparable with the dataset often used in the learning analytics domain.
The collinearity or multicollinearity of the input attributes could potentially play an essential role in clustering analysis. Even though Figure 4 and Figure 5 showed positive correlations between individual attributes, these attributes were not removed for several reasons. Firstly, this correlation was expected because students were motivated to complete all the quizzes as part of their learning process. Secondly, the K-Means clustering method was not sensitive to the correlation between input features. Finally, removing individual features could significantly impact the final distribution and number of clusters. Nevertheless, these correlation matrices could initialize a discussion about which correlations are natural or valuable from the learning process point of view.
The CRISP-DM methodology reliably guided the knowledge discovery process in this study. However, using the machine learning library Pycaret in the data preprocessing, modeling, and evaluation phases had several specifics, including missing detailed information about the implemented machine learning algorithms and their hyperparameters. Nevertheless, it speeded up the overall machine learning process after precise familiarization with the hyperparameters of this automated learning machine library. It helped to evaluate the potential of the examined datasets. Simultaneously, the application of this library allowed us to quickly examine and visualize the performance metrics of the most frequently used clustering methods.
As was mentioned in Section 3.4.1, the K-Means clustering method was finally selected as the best unsupervised machine learning method. This method has several limitations, which must be thoroughly considered. K- Means gives more weight to the bigger clusters. It assumes spherical shapes of clusters, with a radius equal to the distance between the centroid and the furthest data point. It does not work well when clusters are in different shapes, such as elliptical clusters. Moreover, if clusters overlap, K-Means does not have an intrinsic measure of uncertainty for the cases belonging to the overlapping regions. Therefore, other popular clustering methods were analyzed. However, they did not provide more precise results or have better performance metrics values.
The evaluation phase of the methodology uncovered several limitations of the proposed approach used for identifying students with similar performances. The selected approach for clustering provided limited added value to the more conservative statistical or visualization methods. From the results point of view, the selected features only partially contributed to answering the question about their potential to identify the groups of students with similar performances, effort made, or behaviors. The quality of the found clusters was evaluated using intra-cluster performance metrics. Although these metrics could be better, the found clusters can be considered useful. Higher values of these metrics could be achieved using additional features that characterize the students’ performances in the course. This finding is in line with the results of similar research papers, which recommended combining different characteristics of the students, as well as their achievements and progress. Following the discussion about the relationship between the identified clusters and the heatmap in Figure 2, it can be concluded that the presented approach objectivated the subjective observations of the teachers about each student’s performance in the course.
5. Conclusions
This study showed how the selected clustering techniques could be applied to identify groups of students with similar behaviors in the micro-learning environment. Available similar studies deal predominantly with data obtained from LMS or surveys. The study showed no difference between the application of clustering techniques on data from micro-learning, e-learning, or MOOC learning platforms. However, clustering analyses of the students’ partial achievements in learning programming in a tailor-made environment are still rare. Therefore, the clustering analyses of students’ performance data obtained from a micro-learning environment and comparison of changes in cluster composition found in different periods of the term can be considered novel enough. This study contributes to the discussion about the benefits of using a micro-learning platform for learning programming based on delivering educational content in the form of micro-learning units with automated programming assignments.
Consequently, these findings could initialize future educational model adjustments and changes in course structure and content sequencing. Simultaneously, the presented results can evoke new ideas, which can be considered in the future development of the platform Priscilla in the context of the planned implementation of the learning analytics module. These findings could decrease the dropout rate and achieve better academic performance.
Author Contributions
Conceptualization, V.P. and M.D.; methodology, V.P. and M.D.; software, V.P.; validation, V.P. and M.D.; formal analysis, V.P. and M.D.; investigation, V.P. and M.D.; resources, V.P.; data curation, V.P. and M.D.; writing—original draft preparation, V.P.; writing—review and editing, V.P. and M.D.; visualization, V.P. and M.D.; supervision, M.D.; project administration, M.D.; funding acquisition, M.D. All authors have read and agreed to the published version of the manuscript.
Funding
This work was supported in part by the Science Grant Agency of the Ministry of Education of the Slovak Republic under Grant VEGA 1/0490/22 and in part by the European Commission through the ERASMUS+ Program 2021 under Grant 2021-1-SK01-KA220-HED-000032095.
Institutional Review Board Statement
This study was conducted in accordance with the Declaration of Helsinki and approved by the Ethics Committee of Constantine the Philosopher University in Nitra (protocol code UKF-2023/1136-2:191013 and date of approval 2 October 2023) for studies involving humans.
Informed Consent Statement
Informed consent was obtained from all subjects involved in this study.
Data Availability Statement
The data presented in this study will be openly available in anonymized form at the author’s GitHub repository: https://github.com/martin-ukf/mdpi-clustering-data.
Conflicts of Interest
The authors declare no conflicts of interest.
References
- Gašević, D.; Merceron, A. The Handbook of Learning Analytics; Society for Learning Analytics Research: Edinburgh, UK, 2022; ISBN 9780995240834. [Google Scholar]
- Smyrnova-Trybulska, E.; Kommers, P.; Drlik, M.; Skalka, J. (Eds.) Microlearning: New Approaches to A More Effective Higher Education; Springer: Cham, Switzerland, 2022. [Google Scholar] [CrossRef]
- Shafiq, D.A.; Marjani, M.; Habeeb, R.A.A.; Asirvatham, D. Student Retention Using Educational Data Mining and Predictive Analytics: A Systematic Literature Review. IEEE Access 2022, 10, 72480–72503. [Google Scholar] [CrossRef]
- Arizmendi, C.J.; Bernacki, M.L.; Raković, M.; Plumley, R.D.; Urban, C.J.; Panter, A.T.; Greene, J.A.; Gates, K.M. Predicting student outcomes using digital logs of learning behaviors: Review, current standards, and suggestions for future work. Behav. Res. Methods 2022, 55, 3026–3054. [Google Scholar] [CrossRef]
- Aldowah, H.; Al-Samarraie, H.; Fauzy, W.M. Educational Data Mining and Learning Analytics for 21st century higher education: A Review and Synthesis. Telemat. Inform. 2019, 37, 13–49. [Google Scholar] [CrossRef]
- Liu, S.; D'Aquin, M. Unsupervised learning for understanding student achievement in a distance learning setting. In Proceedings of the BT—2017 IEEE Global Engineering Education Conference, EDUCON 2017, Athens, Greece, 25–28 April 2017. [Google Scholar]
- López, S.L.S.; Redondo, R.P.D.; Vilas, A.F. Discovering knowledge from student interactions: Clustering vs. classification. In Proceedings of the 5th International Conference on Technological Ecosystems for Enhancing Multiculturality (TEEM 2017), Cádiz, Spain, 18–20 October 2017; Association for Computing Machinery: New York, NY, USA, 2017. Article 40. pp. 1–8. [Google Scholar] [CrossRef]
- Fida, S.; Fida, S.; Masood, N.; Masood, N.; Tariq, N.; Tariq, N.; Qayyum, F.; Qayyum, F. A Novel Hybrid Ensemble Clustering Technique for Student Performance Prediction. JUCS—J. Univers. Comput. Sci. 2022, 28, 777–798. [Google Scholar] [CrossRef]
- Palani, K.; Stynes, P.; Pathak, P. Clustering Techniques to Identify Low-Engagement Student Levels. In Proceedings of the 13th International Conference on Computer Supported Education (CSEDU 2021), Virtual Event, 23–25 April 2021. [Google Scholar]
- Hooshyar, D.; Yang, Y.; Pedaste, M.; Huang, Y.-M. Clustering Algorithms in an Educational Context: An Automatic Comparative Approach. IEEE Access 2020, 8, 146994–147014. [Google Scholar] [CrossRef]
- Navarro, M.; Moreno-Ger, P. Comparison of Clustering Algorithms for Learning Analytics with Educational Datasets. Int. J. Interact. Multimed. Artif. Intell. 2018, 5, 9–16. [Google Scholar] [CrossRef]
- Nunn, S.; Avella, J.T.; Kanai, T.; Kebritchi, M. Learning Analytics Methods, Benefits, and Challenges in Higher Education: A Systematic Literature Review. Online Learn. 2016, 20, 13–29. [Google Scholar] [CrossRef]
- Joseph, B.; Abraham, S. Identifying slow learners in an e-learning environment using k-means clustering approach. Knowl. Manag. E-Learn. Int. J. 2023, 15, 539–553. [Google Scholar] [CrossRef]
- Nafuri, A.F.M.; Sani, N.S.; Zainudin, N.F.A.; Rahman, A.H.A.; Aliff, M. Clustering Analysis for Classifying Student Academic Performance in Higher Education. Appl. Sci. 2022, 12, 9467. [Google Scholar] [CrossRef]
- Gonzalez-Nucamendi, A.; Noguez, J.; Neri, L.; Robledo-Rella, V.; García-Castelán, R.M.G.; Escobar-Castillejos, D. Learning Analytics to Determine Profile Dimensions of Students Associated with Their Academic Performance. Appl. Sci. 2022, 12, 10560. [Google Scholar] [CrossRef]
- Priyanka, P.G.; Mehrotra, D. Objective Assessment in Java Programming Language Using Rubrics. J. Inf. Technol. Educ. Innov. Pr. 2022, 21, 155–173. [Google Scholar] [CrossRef]
- Bey, A.; Champagnat, R. Analyzing Student Programming Paths using Clustering and Process Mining. In Proceedings of the 14th International Conference on Computer Supported Education (CSEDU 2022), Virtual Event, 22–24 April 2022; Volume 2, pp. 76–84. [Google Scholar] [CrossRef]
- Bey, A.; Perez-Sanagustin, M.; Broisin, J. Unsupervised Automatic Detection of Learners’ Programming Behavior. In Transforming Learning with Meaningful Technologies; EC-TEL 2019, Lecture Notes in Computer Science; Springer: Berlin/Heidelberg, Germany, 2019; Volume 11722, pp. 69–82. [Google Scholar] [CrossRef]
- López-Pernas, S.; Saqr, M.; Viberg, O. Putting It All Together: Combining Learning Analytics Methods and Data Sources to Understand Students’ Approaches to Learning Programming. Sustainability 2021, 13, 4825. [Google Scholar] [CrossRef]
- Kovari, A.; Katona, J. Effect of software development course on programming self-efficacy. Educ. Inf. Technol. 2023, 28, 10937–10963. [Google Scholar] [CrossRef]
- Calderon-Valenzuela, J.; Payihuanca-Mamani, K.; Bedregal-Alpaca, N. Educational Data Mining to Identify the Patterns of Use made by the University Professors of the Moodle Platform. Int. J. Adv. Comput. Sci. Appl. 2022, 13, 321–328. [Google Scholar] [CrossRef]
- Kabathova, J.; Drlik, M. Towards Predicting Student’s Dropout in University Courses Using Different Machine Learning Techniques. Appl. Sci. 2021, 11, 3130. [Google Scholar] [CrossRef]
- Ali, M. An Open Source, Low-Code Machine Learning Library in Python 2020. Available online: https://www.pycaret.org (accessed on 15 January 2024).
Figure 1.
Description of the actions realized in the individual steps of the CRISP-DM methodology and output datasets.
Figure 1.
Description of the actions realized in the individual steps of the CRISP-DM methodology and output datasets.

Figure 2.
Normalized heatmap of each student’s performance in individual micro-learning units and programming code assignments. The students with the lowest performances are ordered at the bottom.
Figure 2.
Normalized heatmap of each student’s performance in individual micro-learning units and programming code assignments. The students with the lowest performances are ordered at the bottom.

Figure 3.
Boxplot of the features related to each student’s performance in modules with micro-learning units and quizzes.
Figure 3.
Boxplot of the features related to each student’s performance in modules with micro-learning units and quizzes.

Figure 4.
Correlation matrix between the attributes, which evaluate the level of comprehension of the micro-learning unit in individual chapters of the course.
Figure 4.
Correlation matrix between the attributes, which evaluate the level of comprehension of the micro-learning unit in individual chapters of the course.

Figure 5.
Boxplot of the features related to each student’s performance in automatically evaluated programming assignments.
Figure 5.
Boxplot of the features related to each student’s performance in automatically evaluated programming assignments.

Figure 6.
Correlation matrix between the attributes, which belong to programming assignments, automatically evaluated by the platform.
Figure 6.
Correlation matrix between the attributes, which belong to programming assignments, automatically evaluated by the platform.

Figure 7.
Visualization of the Elbow method with the suggested number of clusters and principal component analysis curve, which denotes the number of components in relationship with the cumulative explained variance.
Figure 7.
Visualization of the Elbow method with the suggested number of clusters and principal component analysis curve, which denotes the number of components in relationship with the cumulative explained variance.

Figure 8.
Visualization of inter-cluster distance maps for different k values for the clustering dataset with all features.
Figure 8.
Visualization of inter-cluster distance maps for different k values for the clustering dataset with all features.

Figure 9.
Silhouette plots of K-Means clustering for different values of k for features, which represent the grades from micro-learning units with quizzes.
Figure 9.
Silhouette plots of K-Means clustering for different values of k for features, which represent the grades from micro-learning units with quizzes.

Figure 10.
Silhouette plots of K-Means clustering for different k values for features representing the grades from automated programming assignments.
Figure 10.
Silhouette plots of K-Means clustering for different k values for features representing the grades from automated programming assignments.

Figure 11.
Visualization of inter-cluster distance maps for different k values for features representing grades from automatically evaluated programming assignments.
Figure 11.
Visualization of inter-cluster distance maps for different k values for features representing grades from automatically evaluated programming assignments.

Figure 13.
The data distribution between identified clusters for k = 2 and k = 4.

Figure 14.
Contingency matrix describing the relationship between labels assigned to the data belonging to the clusters found for features, which represent grades from different term periods. The results are for the K-Means model with k = 2.
Figure 14.
Contingency matrix describing the relationship between labels assigned to the data belonging to the clusters found for features, which represent grades from different term periods. The results are for the K-Means model with k = 2.

Figure 15.
Contingency matrix describing the relationship between labels assigned to the data belonging to the clusters found for features, which represent grades from different term periods. The results are for the K-Means model with k = 4.
Figure 15.
Contingency matrix describing the relationship between labels assigned to the data belonging to the clusters found for features, which represent grades from different term periods. The results are for the K-Means model with k = 4.


Table 1.
A summary of related scientific publications that dealt with clustering analysis in the learning analytics domain.
Table 1.
A summary of related scientific publications that dealt with clustering analysis in the learning analytics domain.
| Paper | Summary | Dataset | Clustering Method | Number of Clusters | Validation |
|---|---|---|---|---|---|
| Liu [6] | They introduced a study that applies unsupervised learning to identify how students’ engagement and demographic features in online learning activities can affect their learning achievement. | University dataset | K-prototypes | 7 | N/A |
| López et al. [7] | They analyzed the interaction of university students in VLE, comparing clustering and classification methods. They stated that both groups of methods could contribute to a better comprehension of the learning process. | Moodle | Hierarchical method and K-Means method | 4 | N/A |
| Fida et al. [8] | They focused on generating a smarter dataset through a reduced number of features without compromising the number of records. Their approach combined the strengths of classification and clustering for better prediction results. | Students’ Academic Performance Dataset | PAM (Partition Around Medoids), EM (Expectation Maximization) and K- Means | 3 | N/A |
| Palani et al. [9] | They applied clustering using three different techniques to identify students with a low level of engagement in learning. As a result, they identified clusters that can be further analyzed. | OULAD | Gaussian Mixture, Hierarchical and K-prototype | 3 | Dunn’s Index, Silhouette score, and Davies–Bouldin |
| Hooshyar et al. [10] | They provided a detailed review of the clustering algorithms in an educational context. They proposed an evaluation approach that compared several clustering methods using multiple internal and external performance measures for nine real-world educational datasets of different sizes. | Moodle | K-Means, K-Medoids, Expectation–maximization (EM), Agglomerative, Spectral Clustering, DBSCAN, OPTICS | 4 | Dunn’s Index, Silhouette Index, Davies–Bouldin Index, Adjusted Mutual Information, Completeness Index, Jaccard Index, Purity Index, Rand Index, Adjusted Rand Index, Fowlkes–Mallows Index, F-measure, Rogers–Tanimoto, Normalized Mutual Information, Mutual Information, Variation in Information, Geometric Accuracy, Overlapping Normalized Mutual Information |
| Navarro et al. [11] | They compared different clustering algorithms using an educational dataset and recommended the ones with the highest performances. | University Dataset of Students’ Profiles | K-Means, Clara, PAM, FANNY, hierarchical, AGNES, DIANA | 3 | Silhouette coefficient, Dunn’s index |
Table 2.
Basic exploratory data analysis of the input dataset.
| Count | Mean | Std | Min | 25% | 50% | 75% | Max | |
|---|---|---|---|---|---|---|---|---|
| intro | 119.0 | 94.509804 | 30.101066 | 0.0 | 97.25 | 110.0 | 110.00 | 110.0 |
| intro-VPL | 119.0 | 46.196078 | 23.239621 | 0.0 | 40.00 | 60.0 | 60.00 | 60.0 |
| methods | 119.0 | 123.421569 | 59.649544 | 0.0 | 102.50 | 159.0 | 160.00 | 160.0 |
| methods-VPL | 119.0 | 348.843137 | 224.051875 | 0.0 | 107.50 | 346.0 | 584.50 | 630.0 |
| encap | 119.0 | 108.745098 | 58.633901 | 0.0 | 71.75 | 146.5 | 150.00 | 150.0 |
| encap-VPL | 119.0 | 71.598039 | 38.642115 | 0.0 | 40.00 | 100.0 | 100.00 | 100.0 |
| constructors | 119.0 | 79.117647 | 44.749533 | 0.0 | 51.00 | 105.5 | 110.00 | 110.0 |
| constructors-VPL | 119.0 | 112.637255 | 63.217179 | 0.0 | 60.00 | 139.0 | 165.00 | 165.0 |
| classes1 | 119.0 | 52.401961 | 34.236007 | 0.0 | 0.00 | 73.0 | 80.00 | 80.0 |
| classes2 | 119.0 | 109.450980 | 71.353482 | 0.0 | 32.50 | 150.0 | 169.75 | 170.0 |
| classes2-VPL | 119.0 | 54.166667 | 41.345462 | 0.0 | 0.00 | 65.0 | 95.00 | 95.0 |
| static | 119.0 | 57.362745 | 33.316303 | 0.0 | 40.00 | 77.0 | 80.00 | 80.0 |
| static-VPL | 119.0 | 147.950980 | 109.225027 | 0.0 | 38.00 | 170.0 | 270.00 | 270.0 |
| inher | 119.0 | 116.568627 | 75.730569 | 0.0 | 40.00 | 161.5 | 186.50 | 190.0 |
| inher-VPL | 119.0 | 139.941176 | 110.768944 | 0.0 | 27.00 | 158.5 | 270.00 | 270.0 |
| polymorphism | 119.0 | 45.107843 | 31.401238 | 0.0 | 0.00 | 69.0 | 70.00 | 70.0 |
| polymorphism- VPL | 119.0 | 26.647059 | 21.434518 | 0.0 | 0.00 | 45.0 | 45.00 | 45.0 |
Table 3.
The application of different clustering algorithms and performance metrics for the case of the automatic programming code evaluation features and features related to each student’s performance in micro-learning units with quizzes were considered together.
Table 3.
The application of different clustering algorithms and performance metrics for the case of the automatic programming code evaluation features and features related to each student’s performance in micro-learning units with quizzes were considered together.
| Algorithm | Clusters | Silhouette | Calinski–Harabasz | Davies–Bouldin |
|---|---|---|---|---|
| K-Means | 2 | 0.5700 | 161.6648 | 0.6984 |
| K-Means | 3 | 0.4313 | 114.7803 | 1.2559 |
| K-Means | 4 | 0.3747 | 93.1811 | 1.3109 |
| K-Means | 5 | 0.3284 | 81.0733 | 1.4830 |
| K-Means | 6 | 0.3465 | 76.1701 | 1.2466 |
| DBCAN | 3 | 0.4583 | 94.3754 | 1.4969 |
| OPTICS | 4 | −0.0615 | 17.0579 | 1.3876 |
| Affinity Propagation | 10 | 0.3662 | 57.6724 | 1.2593 |
| Agglomerative Clustering | 4 | 0.3688 | 85.9097 | 1.2241 |
| Meanshift | 8 | 0.3891 | 41.8296 | 0.7929 |
| BIRCH | 4 | 0.4499 | 83.2682 | 1.0465 |
Table 4.
The K-Means clustering performance metric values for different k values for features representing grades from the micro-learning units with quizzes in individual course topics.
Table 4.
The K-Means clustering performance metric values for different k values for features representing grades from the micro-learning units with quizzes in individual course topics.
| Clusters | Silhouette | Calinski–Harabasz | Davies–Bouldin |
|---|---|---|---|
| 2 | 0.7363 | 383.3815 | 0.4624 |
| 3 | 0.6896 | 286.8699 | 0.6816 |
| 4 | 0.5769 | 274.3522 | 0.8355 |
| 5 | 0.5605 | 262.4060 | 0.9686 |
| 6 | 0.5601 | 241.8890 | 0.9954 |
Table 5.
The K-Means clustering performance metric values for different k values for features, which represent grades from the programming assignments, automatically evaluated using the micro-learning platform.
Table 5.
The K-Means clustering performance metric values for different k values for features, which represent grades from the programming assignments, automatically evaluated using the micro-learning platform.
| Clusters | Silhouette | Calinski–Harabasz | Davies–Bouldin |
|---|---|---|---|
| 2 | 0.5482 | 162.3892 | 0.7030 |
| 3 | 0.4275 | 121.7160 | 1.1015 |
| 4 | 0.3960 | 100.6032 | 1.0784 |
| 5 | 0.4148 | 91.6369 | 1.1800 |
| 6 | 0.4228 | 81.6195 | 1.1520 |
Table 6.
The K-Means clustering performance metric values for different k values for features from the first term period.
Table 6.
The K-Means clustering performance metric values for different k values for features from the first term period.
| Clusters | Silhouette | Calinski–Harabasz | Davies–Bouldin |
|---|---|---|---|
| 2 | 0.5947 | 132.5591 | 0.7669 |
| 3 | 0.4654 | 109.8245 | 0.8889 |
| 4 | 0.4917 | 118.7943 | 0.8273 |
| 5 | 0.5219 | 128.2155 | 0.8026 |
| 6 | 0.5316 | 133.9519 | 0.7479 |
Table 7.
The K-Means clustering performance metric values for different k values for features from the second term period.
Table 7.
The K-Means clustering performance metric values for different k values for features from the second term period.
| Clusters | Silhouette | Calinski–Harabasz | Davies–Bouldin |
|---|---|---|---|
| 2 | 0.6297 | 204.7539 | 0.5791 |
| 3 | 0.5643 | 167.2016 | 0.7829 |
| 4 | 0.5701 | 144.1638 | 0.9049 |
| 5 | 0.4677 | 133.5979 | 1.0457 |
| 6 | 0.4565 | 123.8955 | 1.0332 |
Table 8.
The K-Means clustering performance metric values for different k values for features from the third term period.
Table 8.
The K-Means clustering performance metric values for different k values for features from the third term period.
| Clusters | Silhouette | Calinski–Harabasz | Davies–Bouldin |
|---|---|---|---|
| 2 | 0.5956 | 182.6024 | 0.6036 |
| 3 | 0.5677 | 150.9572 | 0.8597 |
| 4 | 0.6057 | 167.6004 | 0.7765 |
| 5 | 0.5775 | 177.7359 | 0.7942 |
| 6 | 0.5948 | 187.3231 | 0.7725 |
Table 9.
The Adjusted Rand Index values express the similarity between clustering results with k = 2 for different term periods.
Table 9.
The Adjusted Rand Index values express the similarity between clustering results with k = 2 for different term periods.
| T1 vs. T2 | T2 vs. T3 | T1 vs. T3 |
|---|---|---|
| 0.7660 | 0.7043 | 0.5113 |
Table 10.
The values of the Adjusted Rand Index, which expresses the similarity between the clustering results with k = 4 for different term periods.
Table 10.
The values of the Adjusted Rand Index, which expresses the similarity between the clustering results with k = 4 for different term periods.
| T1 vs. T2 | T2 vs. T3 | T1 vs. T3 |
|---|---|---|
| 0.4258 | 0.6094 | 0.3720 |
Disclaimer/Publisher’s Note: The statements, opinions and data contained in all publications are solely those of the individual author(s) and contributor(s) and not of MDPI and/or the editor(s). MDPI and/or the editor(s) disclaim responsibility for any injury to people or property resulting from any ideas, methods, instructions or products referred to in the content. |
© 2024 by the authors. Licensee MDPI, Basel, Switzerland. This article is an open access article distributed under the terms and conditions of the Creative Commons Attribution (CC BY) license (https://creativecommons.org/licenses/by/4.0/).
Share and Cite
MDPI and ACS Style
Popovych, V.; Drlik, M. Identification of Students with Similar Performances in Micro-Learning Programming Courses with Automatically Evaluated Student Assignments. Appl. Sci. 2024, 14, 3615. https://doi.org/10.3390/app14093615
AMA Style
Popovych V, Drlik M. Identification of Students with Similar Performances in Micro-Learning Programming Courses with Automatically Evaluated Student Assignments. Applied Sciences. 2024; 14(9):3615. https://doi.org/10.3390/app14093615
Chicago/Turabian StylePopovych, Valerii, and Martin Drlik. 2024. "Identification of Students with Similar Performances in Micro-Learning Programming Courses with Automatically Evaluated Student Assignments" Applied Sciences 14, no. 9: 3615. https://doi.org/10.3390/app14093615
Note that from the first issue of 2016, this journal uses article numbers instead of page numbers. See further details here.