
Reconstruction of the Subsurface of Al-Hassa Oasis Using Gravity Geophysical Data
by
 , , , and
Abid Khogali
1 ,
,
Konstantinos Chavanidis
1,
Panagiotis Kirmizakis
1,* ,
,
Alexandros Stampolidis
2 and
and
Pantelis Soupios
1
1
Department of Geosciences, College of Petroleum Engineering & Geosciences, King Fahd University of Petroleum & Minerals, Dhahran 31261, Saudi Arabia
2
School of Geology, Aristotle University of Thessaloniki, 54124 Thessaloniki, Greece
*
Author to whom correspondence should be addressed.
Appl. Sci. 2024, 14(9), 3707; https://doi.org/10.3390/app14093707
Submission received: 3 April 2024
/
Revised: 24 April 2024
/
Accepted: 25 April 2024
/
Published: 26 April 2024
(This article belongs to the Section Earth Sciences)
Abstract
:Al-Hassa city, located in Eastern Saudi Arabia, boasts the world’s largest oasis and the most expansive naturally irrigated lands. Historically, a total of 280 natural springs facilitated significant groundwater discharge and irrigation of agricultural land. Furthermore, the water in certain springs formerly had a high temperature. The spatial variability of the water quality was evident. At the same time, Al-Hassa Oasis is situated on the northeastern side of the Ghawar field, which is the largest conventional onshore oil field in the world in terms of both reserves and daily output (approximately 3.8 mmb/d). The aforementioned traits suggest an intricate subsurface that has not yet been publicly and thoroughly characterized. Due to the presence of significant cultural noise caused by agricultural and nearby industrial activities, a robust, easy-to-use, and accurate geophysical method (gravity) was used to cover an area of 350 km2, producing the 3D subsurface model of the study area. A total of 571 gravity stations were collected, covering the whole Al-Hassa Oasis and parts of the nearby semi-urban areas. The gravity data were corrected and processed, and a 3D inversion was applied. The resulting 3D geophysical subsurface modeling unveiled an intricate subterranean configuration and revealed lateral variations in density, indicating the presence of a potential salt dome structure, as well as fracture zones that serve as conduits or obstacles to the flow of the subsurface fluids. This comprehensive modeling approach offers valuable insights into the subsurface dynamics of the broader study area, enhancing our understanding of its qualitative tectonic and hydraulic features and their impacts on the area’s natural resources, such as groundwater and hydrocarbons.
1. Introduction
The Al-Hassa region in Eastern Saudi Arabia is well-known for being home to the largest oasis in the world and the most extensive naturally irrigated lands on a global scale [1]. Al-Hassa is located next to Ghawar, which is the largest conventional oil field in the world. Due to its historical dependence on more than 280 natural springs, some of which provide warm water for agricultural irrigation [2], the area’s diverse water quality indicates the existence of intricate underground geological formations that require careful investigation.
Prior research on the hydrochemistry and hydrogeology of the Al-Hassa region provides a thorough comprehension of the intricate subsurface conditions in the study area. Bakiewicz et al. [3] studied the hydrogeology of the Umm Er Radhuma aquifer. Subsequently, the authors Sen and Al-Dakheel [4] assessed hydrochemical facies in the same aquifer. Sharaf [5] emphasized the hydrogeological and hydrochemical aspects of groundwater, specifically highlighting the risks of seawater intrusion. In their study, Al Tokhais and Rausch [1] examined the hydrogeology of the Al-Hassa springs and predicted the future availability and quality of water. They concluded that if the current water extraction rates continue, the situation will become increasingly dire. In his 2009 study, Al-Dakheel [6] introduced a spatial modeling approach to analyze changes in groundwater salinity over time. Al-Naeem [7] and Al-Zarah [2] expanded upon this by assessing groundwater suitability for irrigation purposes and analyzing the elemental compositions. Al-Omran et al. [8] analyzed the quality of the groundwater, while Dirks et al. [9] provided further information on the geological aspects of the Umm Er Radhuma aquifer. In their recent studies, Abba, Yassin, Jibril, et al. [10] and Abba, Yassin, Shah, et al. [11] utilized advanced methodologies, such as machine learning and spatial mapping, to examine trace-element pollution and nitrate concentrations, respectively. These studies provided state-of-the-art findings on groundwater susceptibility and pollution in Al-Hassa.
The Ghawar oil field was first discovered in 1948 and began production in 1951. This extensive oil field is projected to maintain its current maximum production capacity of 3.8 million barrels daily until at least 2050. Ghawar is the primary supplier of associated gas for Aramco, and the greater Ghawar area also contains several significant non-associated gas fields.
The genesis of the prolific Ghawar oil field can be traced back to the Amar Collision, occurring approximately between 640 and 620 million years ago (Ma). This collision initiated a series of structural events across the Arabian Plate, giving rise to distinct north-, northeast-, and northwest-oriented structural patterns, such as the En Nala Anticline, Qatar Arch, and Khurais-Burgan Anticline [12,13]. After this, an extensional regime between about 570 and 530 Ma catalyzed the development of the Najd fault system and engendered the formation of northeast-trending rift basins, laying the foundation for the creation of major subsidence zones during Precambrian and Early Cambrian times [12,14,15,16,17]. During this period, the proximity of the Arabian plate to the Equator [15] facilitated the deposition of extensive salt layers within these basins, including the Hormuz, Ghaba, Fahud, and South Oman salt basins [12,18]. Notably, the Hercynian Orogeny during the Devonian period was pivotal in reactivating pre-existing basement structures, thereby generating prominent north–south oriented horst blocks across Central and Eastern Saudi Arabia. These geological events and processes cumulatively contributed to the formation of structural traps favorable for hydrocarbon accumulation, amongst which Ghawar stands as a preeminent example [13].
Geophysical investigations are a set of techniques that are used to analyze and describe the properties of materials in the subsurface. These techniques are indirect and non-invasive, meaning they do not involve direct contact with the studied materials. A comprehensive understanding of the fundamental formations and their structures is essential for conserving natural resources through exploration and exploitation. Both seismic and non-seismic geophysical methods can be used to analyze and track the properties of the subsurface. However, relying solely on one geophysical method is inadequate; to achieve the most favorable result, it is advisable to utilize multiple methodologies and integrate their findings to the fullest extent. Methods and data integration are not always applicable, since sometimes the study areas have cultural noise. The least susceptible to noise geophysical methods should be used to extract any information about the subsurface.
Gravity anomalies result from the heterogeneous distribution of densities within the Earth’s crust. Consequently, profound and broad geological structures, including the delineation of sedimentary basins, hydrocarbon traps, and the boundaries of mineralized zones, can be effectively identified and mapped through gravity surveys. This geophysical method leverages variations in gravity to infer the subsurface’s structural composition, offering insights into both the depth and nature of geological features of interest [19].
In the broader Ghawar structure, positive and negative gravity responses were observed by Edgell [20], Saner et al. [21], and Mukhopadhay et al. [22]. Around 20 km east of the Ghawar structure, the Al-Hassa area in Saudi Arabia has not been extensively studied regarding its geological and geophysical characteristics, despite its importance in the field. Previous investigations by Al-Dakheel et al. [23], Al Tokhais and Rausch [1], and Mahmoudi et al. [24] have provided limited information on the subject.
This study aims to address the lack of research by creating an accurate and high-resolution 3D model of the subsurface using a robust geophysical method. Specifically, this research presents the results of a large-scale geophysical survey over urban, suburban, and agricultural sites using the gravity method to analyze intricate fracture networks and gain insights into the structural development and tectonic past of the Al-Hassa Oasis area in Saudi Arabia. The study area’s subsurface model was acquired through the inversion of three-dimensional (3D) gravity data, and the complex 3D subsurface structure of the Al-Hasa Oasis was reconstructed.
2. Study Area—Geological and Tectonic Settings
The study area is located about 60 km west of the Arabian Gulf, in the eastern province of Saudi Arabia, known for its prominent geological characteristics. It is situated between latitudes 25.351462° and 25.547711°, and longitudes 49.557074° and 49.754603°, covering an area of approximately 350 km2 (Figure 1a–c). The elevations in the area vary between 120 and 220 m above sea level. A sand layer covers the study area and lacks any extended outcrops that can support any geological/tectonic study. Therefore, no geological maps have been published that include information about the types of rocks in the studied area (Figure 1a). Within the study area, there is a spot where rock outcrops, particularly the Hofuf formation, were found. These rock formations would probably extend to other areas in the eastern province.
The region is mainly characterized by sand dunes and Quaternary deposits, with occasional exposed sections that reveal the Upper Miocene to Lower Pliocene Hofuf Formation (Figure 1b). In general, there is a scarcity of published geological research in the area because it is located close to the Ghawar oilfield. Additionally, the groundwater wells in the area lack any information about the types of rocks present. The Hofuf Formation is distinguished by the presence of conglomerates and calcareous sandstones alternating with reddish mudstones and limestones [25]. The Hofuf Formation is located above the Dam Formation and consists of limestones and reddish marls. The Hadrukh Formation follows, consisting of sandstones, limestones, and marls [26]. Following that, the sequence comprises the dolomitic and limestone formations of the Eocene Dammam Formation. The underlying formations include the early Eocene Rus Formation, which is made up of dolomitic limestone and gypsum, and the Paleocene Umm Er Radhuma Formation, which contains limestone and dolomite with quartz geodes and chert nodules [26,27].
The Neogene sedimentary sequence in the Arabian Gulf area is distinguished by an elongated NW-SE asymmetrical basin called the Zagros Syncline, located within the East Arabian Block [26,28]. The basin area is thought to have diminished during the Neogene period, likely due to a global increase in sea levels during the Mid-Oligocene period, followed by the upward movement of the Earth’s crust from the Oligocene to the Miocene epochs [29]. The Hofuf Formation is formed due to the Neogene development of the East Arabian Block. This is supported by features such as grabens, strike–slip faults, and transpressive folds, as documented by Hancock and Kadhi in 1978 [30], Vaslet et al. in 1991 [31], and Weijermars in 1999 [29]. Dome formation in the Arabian–African Shield occurred from the Late Cretaceous to the Eocene, while rift formation and the separation of Africa from Arabia occurred during the Late Eocene to the Oligocene. Tectonic activity occurring from the Late Miocene to the Pliocene caused the Red Sea floor to spread, which resulted in the drainage of the uplifted Arabian Shield and the deposition of substantial clastic sediments. This process led to the formation of the Miocene Hudrukh and Mio-Pliocene Hofuf formations [25]. The topography of the region, which slopes towards the east, allowed for the movement of sediment from west to east because of erosion of the underlying bedrock.
Figure 1.
(a) The coverage of Saudi Arabia by geological maps released by the Saudi Geological Survey is presented by the colored rectangles. A thick black square depicts the location of the study area. (b) Geological map of the wider area (modified from Al-Mahmoud [32]). A red rectangle shows the location of the caves map in Figure 1d. (c) The study area with all the acquired gravity geophysical measurements is presented. The camera icon shows the location of the photo shown in Figure 1f. (d) The fault-zone pattern described by Hussain et al. [33] is depicted. (e) W-E section shows the geologic formations, the groundwater flow (blue and red arrows), and the subsurface deformation due to basement uplift beneath the study area (modified from Al Tokhais and Rausch [1]), and (f) fault-zone field photo showing the major ENE-WSW and NNW-SSE directions observed at an outcrop within the study area.

Hydrogeologically, the area is recharged by the mountainous western part of Saudi Arabia, where fresh groundwater flowing to the east and northeast is observed in many monitoring wells (Figure 1d). A notable gradient in groundwater salinity is observed across the region, escalating from approximately 300 parts per million (ppm) in the west to more than 5000 ppm along the Arabian coast. Intriguingly, a discernible abrupt shift in salinity with depth reveals a distinct stratigraphic influence. Shallow aquifers exhibit comparatively better groundwater quality, whereas deeper (around 800 m) aquifers, particularly within the Aruma Formation, manifest exceedingly saline groundwater [1].
The uplift and formation of the Ghawar anticline induced significant fracturing in the region. The Al-Shubaa outcrop and a southern one display joint systems trending in the NW-SE or NNW-SSE and E-W or ENE-WSW directions, eroded by wave-cut gorges (Figure 1e,f). Fluvial erosion later reshaped these features [27].
3. Gravity Survey
The gravity survey was carried out by the Geophysics lab of the King Fahd University of Petroleum and Minerals in three phases, taking place in the summer of 2021, the summer of 2022, and the spring of 2023. A total of 571 gravity stations were measured, at urban and semi-urban areas north and east of Al Hofuf city, as well as within the Al Hassa National Park area. The data were collected in grids and profiles and cover an area of approximately 350 km2, with varying station spacing (150–900 m) according to local conditions (gridded/profile data, remote/urbanized areas, accessibility, etc.). The characteristics of urban areas (e.g., roads, buildings, telecommunication cables, large metallic objects, buried pipes and cables, and sewers) do not allow for the usage of magnetic or electromagnetic methods, so the gravity method can be used to gain preliminary insights into the subsurface regime of such areas in a quick and cost-effective manner [34]. However, due to the complexity of these areas, there are limitations in the application of the gravity method as well.
The measurements were acquired using two Scintrex CG-5 AUTOGRAVTM gravitometers, which have a high resolution of 1 μGal and use the optimum acquisition parameters depending on the natural and/or cultural noise of the area under investigation. We set the gravitometers to automatically detect and discard spikes caused by high external noise, as well as to consider the Earth’s tide effect and the instrument’s tilt during transportation and make the necessary corrections to the measurements. To avoid the extra minor noise caused by the high air temperature that is typical for the area during the summer months, the data were acquired during the morning hours and stopped before noon. The gravity measurements were taken in sets of three or five, with a duration of 30–60 s, according to the environmental or cultural noise in the nearby area. To ensure high-quality data, any set with a difference of more than 10 μGal was repeated with additional measurements. Stations with a tilt greater than 15 arcsecs were not used, and the gravity readings were repeated. The average standard deviation (SD) for all the acquired data was 0.037 mGal.
Three points were selected to be used as base stations (one for each measurement period), which were located in a central location near the rest of the measurements, in a relatively quiet area (with no external noise sources). Each day, an opening and a closing measurement were taken on the base station.
To estimate the gravitometer’s height correction, the distance between the center of the instrument’s mass and the elevation of the instrument’s location were measured so that every measurement refers to the actual elevation of the topographic relief. The geographic coordinates and elevation of each station were measured by Trimble’s R10 Differential GPS (Global Positioning System), with an accuracy error of less than 1 cm, using either a base station or the KSA-CORS (Kingdom of Saudi Arabia Continuously Operating Reference Station) network (for the measurements that cover wide areas within the city). The latter consists of a service provided for the entire country that increases the geographic and elevation accuracy of measured positioning.
For urban areas, there is a need to minimize the influence of buildings and other relevant constructions on gravity measurements. The mass, height, and vibrations of a tall construction cause the so-called “Building Effect”, which needs to be eliminated from the data by applying the “Building Correction”, using information from detailed ground elevation datasets such as LIDAR [35]. A minimum distance of 75 m is proposed to exist between a large construction and the installed gravity station [35], while in many areas where a distance like this cannot be achieved, smaller distances might be used, up to 30 m [36]. In our survey, due to the densely constructed urban and semi-urban areas, the gravity station locations were selected so that there is a distance greater than 15 m from any small construction (e.g., stone wall) and 30 m from any larger building. This issue did not occur within the National Park and the surrounding area, where the stations were installed in remote locations.
Gravity Data Processing
After their acquisition, the data were imported to Seequent’s Oasis montaj v2023.2 software for processing and enhancement. For the corrections to the raw data, the Gravity and Terrain Correction extension was used; a useful tool integrated within Oasis montaj that handles gravity data obtained from ground surveys. The common gravity corrections of instrumental height and drift were applied to eliminate the factors affecting the measurements’ quality. Since no absolute gravity station was available to use its coordinates and elevation for the latitude correction, the base station of the 2021 survey was used as the reference point, and all gravity measurements were tied based on that point. Earth’s normal gravity was calculated using the 1980 Geodetic Reference System (GRS80) [37] so that the theoretical gravity value of the 2021 base station location was considered equal to zero.
Topographic highs and lows strongly affect the local gravity field, and this dependence should always be considered when processing gravity measurements [36]. The effect of the local topography was reduced after applying the topographic correction using the Oasis montaj standard algorithm. To run the terrain correction algorithm, it is necessary to import a detailed and coarser Digital Elevation Model (DEM) or gridded elevation data for the area of the survey and the wider area, respectively. The software will produce a new grid that represents the terrain corrections; thus, the correction at each gravity station location can be accurately calculated using the methods described by Kane [38] and Nagy [39]. In our study, Shuttle Radar Topography Mapping (SRTM) at a 30 m resolution was used as the local elevation model, and SRTM at 90 m was used as the regional elevation model. The elevations of each gravity station were measured with high accuracy using the Trimble R10 Differential GPS system.
The Free Air and Bouguer corrections were applied to the corrected data to determine the complete Bouguer anomaly (CBA). This anomaly considers the influence of extensive and deep-seated regional structures, as well as shallower local bodies. Adjustments to this overarching workflow may be necessary based on the specific goals of the study and the nature of the survey [34]. In order to separate the influence of the shallow structures, we obtained the residual gravity-field map by calculating and subtracting a first-order polynomial that simulates deeper sources (regional field) from the CBA field.
To continue the process of identifying subsurface geotectonic structures, such as rock contacts and faults, that have a significant difference in density and to compare the results of the gravity analysis with the geology of the study area, we utilized the terracing transformation and the tilt derivative (TDR) filters on the residual field data. The technique of terracing transformation, as described by Cordell and McCafferty [40], can identify distinct regions of uniform gravity-field intensity with well-defined boundaries [41]. To produce the terracing transformation map, we run 30 iterations of the terracing algorithm using Oasis montaj software. The zero contours of the TDR can be utilized to enhance the structural edges [42,43]. This technique can also improve the signals of gravity anomaly sources that are deeper or weaker. The calculation of TDR can be determined using Equation (1):
where ∂G/∂x and ∂G/∂y are the first-order derivatives of the gravity field in the x and y directions, and ∂G/∂z is the first-order vertical derivative. It was applied to the residual gravity-field data to define the locations of structures’ edges corresponding to faults and/or vertical/sloping rock contacts that act as the causative anomaly sources. The dipping direction of the anomaly sources can also be estimated, which dips towards the negative tilt angles.
The tilt-depth method [44] can be utilized to analyze the variations in the depths of the anomaly sources. Given vertical geologic contacts or faults, the depths at which the upper surfaces of the sources are buried can be found by measuring half the physical distance between the corresponding contours of ±45°.
To examine the distribution of rock densities beneath the surface, we generated three-dimensional models using the VOXI Earth Modeling tool within the Oasis montaj software. This software mainly uses the Cartesian cut cell method [42,43] for the inversion process. This approach utilizes a Cartesian voxel comprising prismatic elements, which diminishes computational complexity and saves computation time, while also enabling highly accurate geometric depiction of geological surfaces. By integrating the method into inversion and forward calculations, well-known artifacts that arise from representing topography with prisms of fixed vertical extent are eliminated. To highlight the subsurface basins where tectonic features largely influence fluid circulation, we studied the 3D distribution of the negative density contrast bodies (density lower than the average crustal density of 2.67 g/cm3 that we used).
4. Results
Figure 2 presents the mapping of the resulting complete Bouguer anomaly (CBA). The CBA anomalies range from 20.893 to 24.276 mGal. It is shown that the southwestern part of the study area is dominated by lower CBA values than the rest of the area, whilst the highest values are measured in the southeastern and northern parts of the area under investigation.
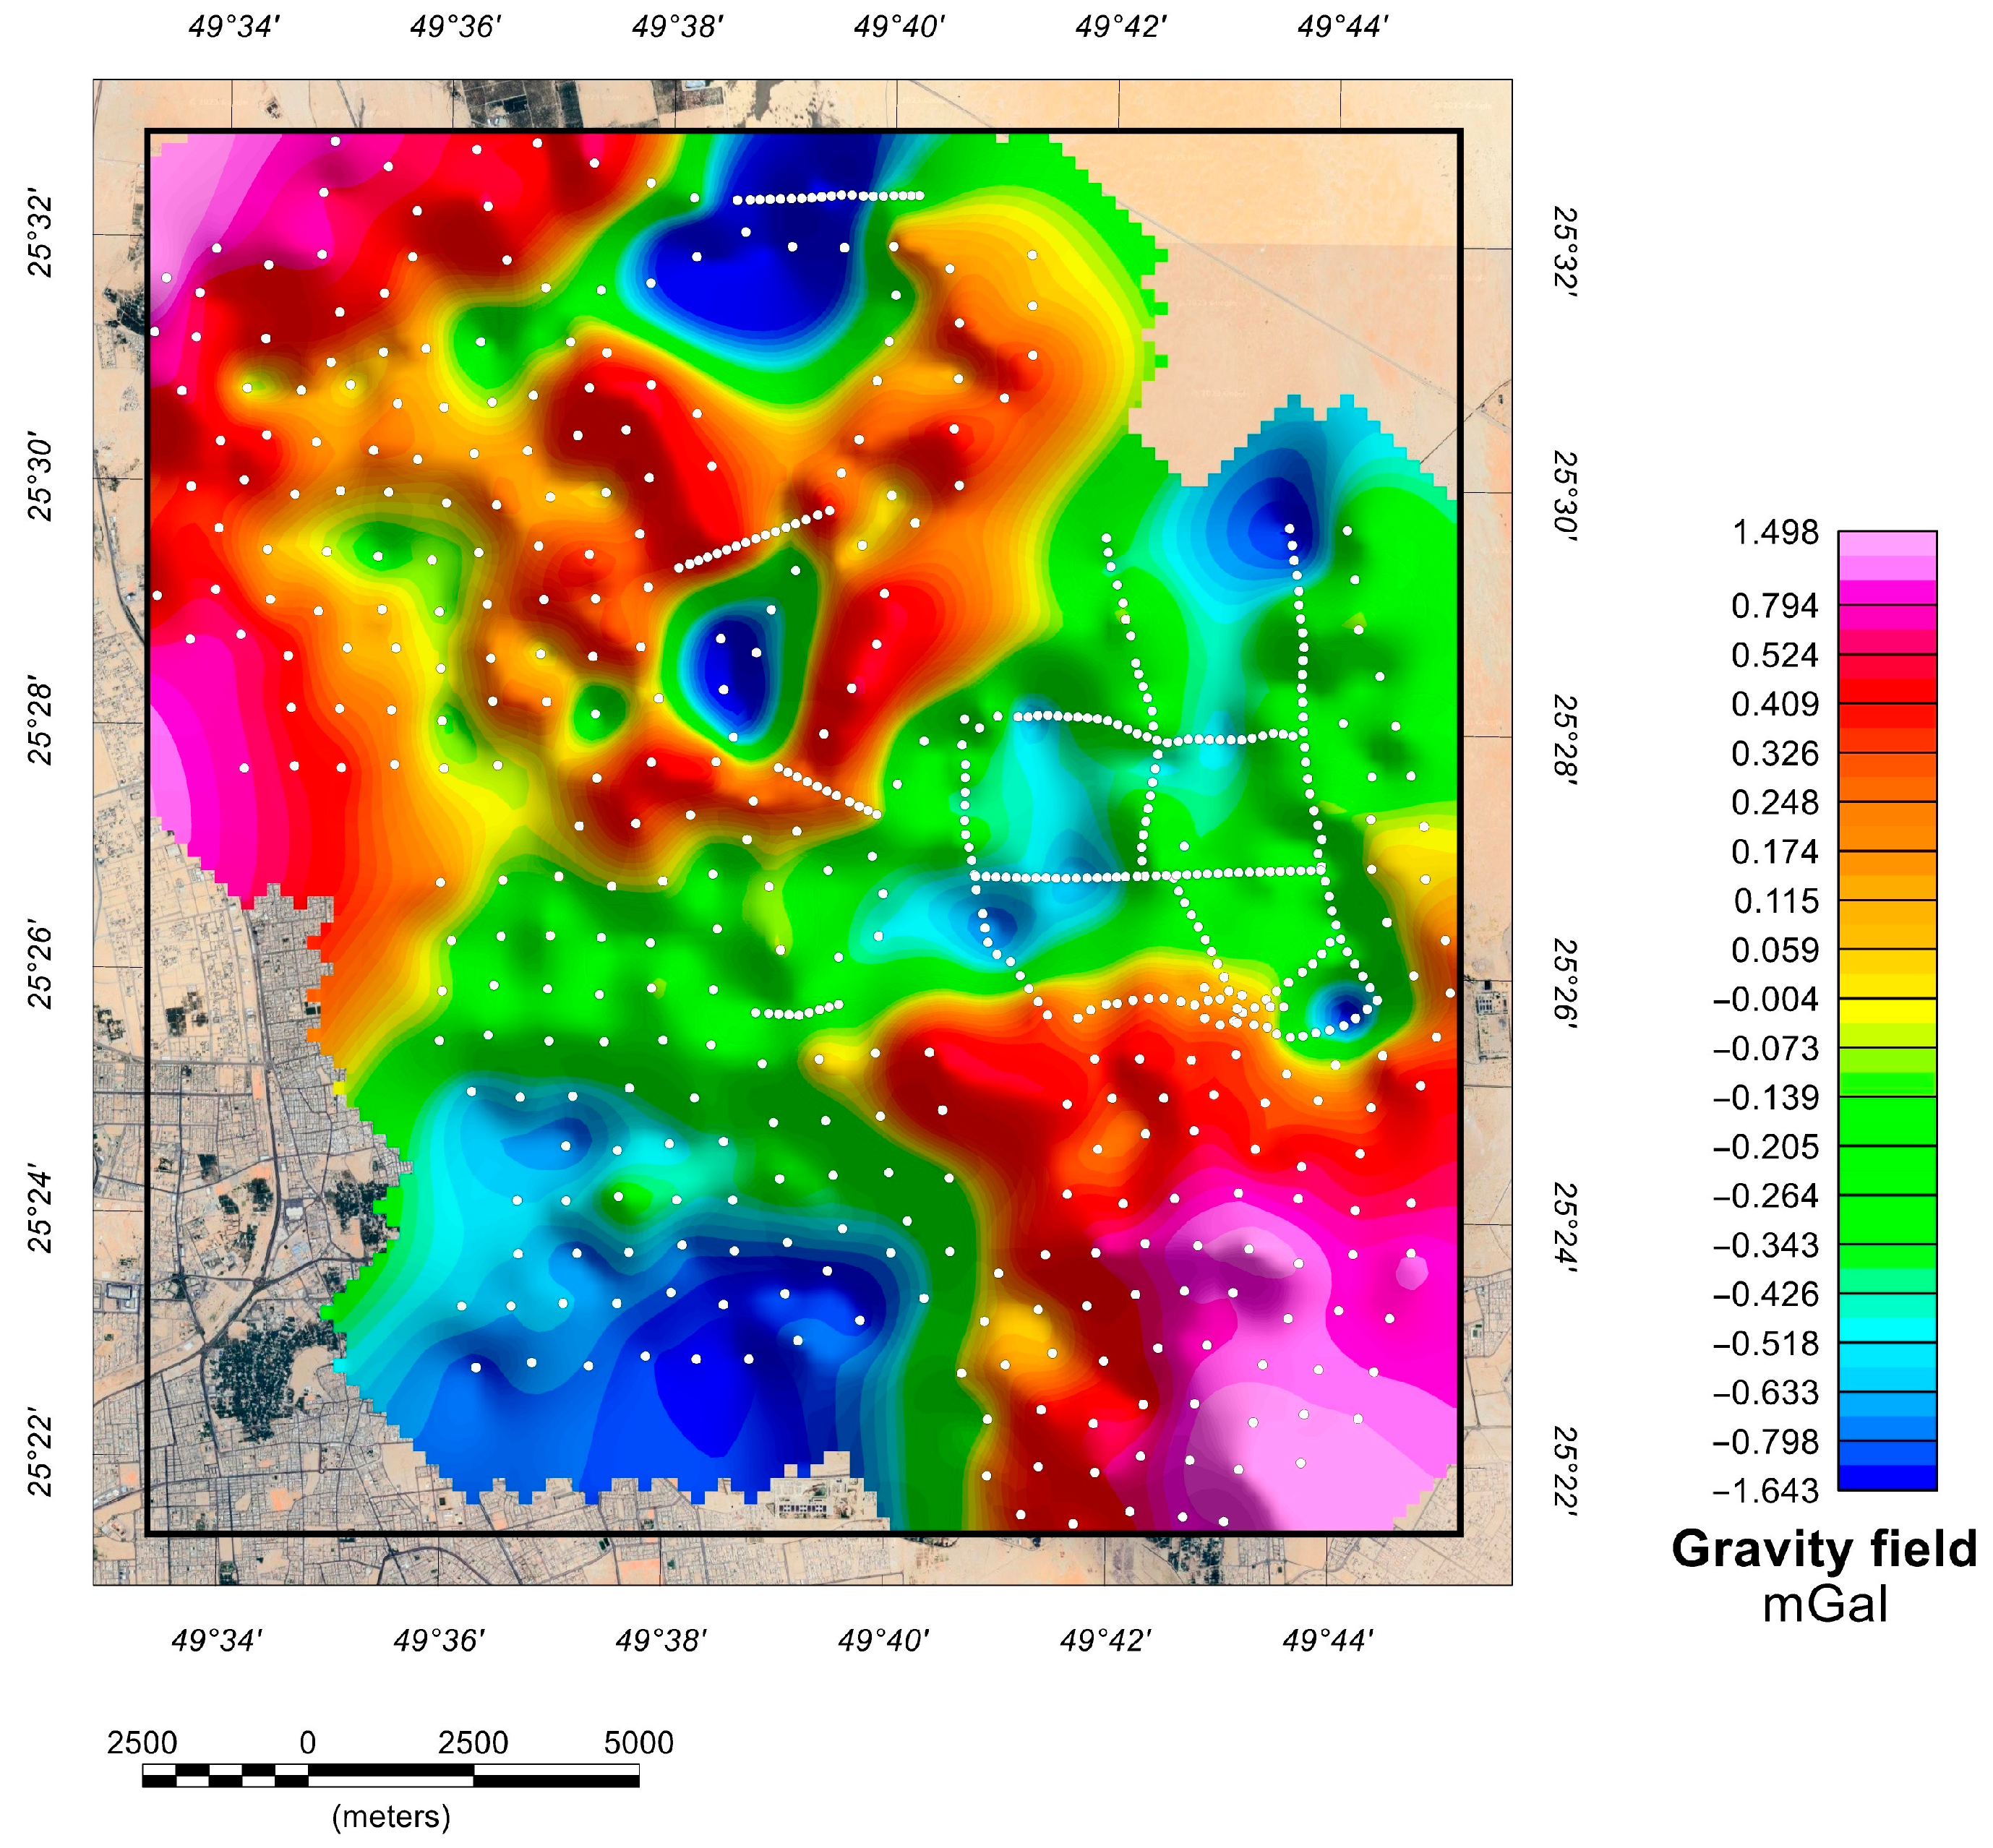
Figure 3 shows the residual gravity field. In the residual field map, which shows the influence of shallow structures on the gravity field, the anomalies range from −1.643 to 1.498 mGal. This indicates a measured signal with a cumulative amplitude of 3.141 mGals. Here, it is important to note that the gravitometer has a precision of 0.001 mGal.
The residual gravity field indicates regions of low gravity anomalies (lower densities) in the southwestern area and locally, in some spots supported by several stations, in the north, northeast, and central part of the study area, represented by the dark-blue color. Conversely, areas of high gravity anomalies, depicted by the colors red and pink, are found in the northwestern and southeastern parts of the study area. The rest of the study area is characterized by mid-to-low gravity anomalies, typically ranging from −0.4 to 0 mGal, represented by green and light-yellow colors.
Figure 4a shows the TDR map generated using the residual gravity field. The TDR’s contours at zero-value were employed to analyze the subsurface lineaments depicted as black lines. The dip direction of the lineaments is also indicated in Figure 4a, represented by the direction of the semi-circles. The subsurface lineaments can be considered as lateral geophysical (density) discontinuities and with low uncertainty can be assumed as fracture zones. Based on this assumption, all lineaments were segmented in equal lengths, and their orientation was recorded and used to prepare the rose diagram in Figure 4b using the GeoRose v0.4.3 software (http://www.yongtechnology.com, accessed on 17 January 2024).
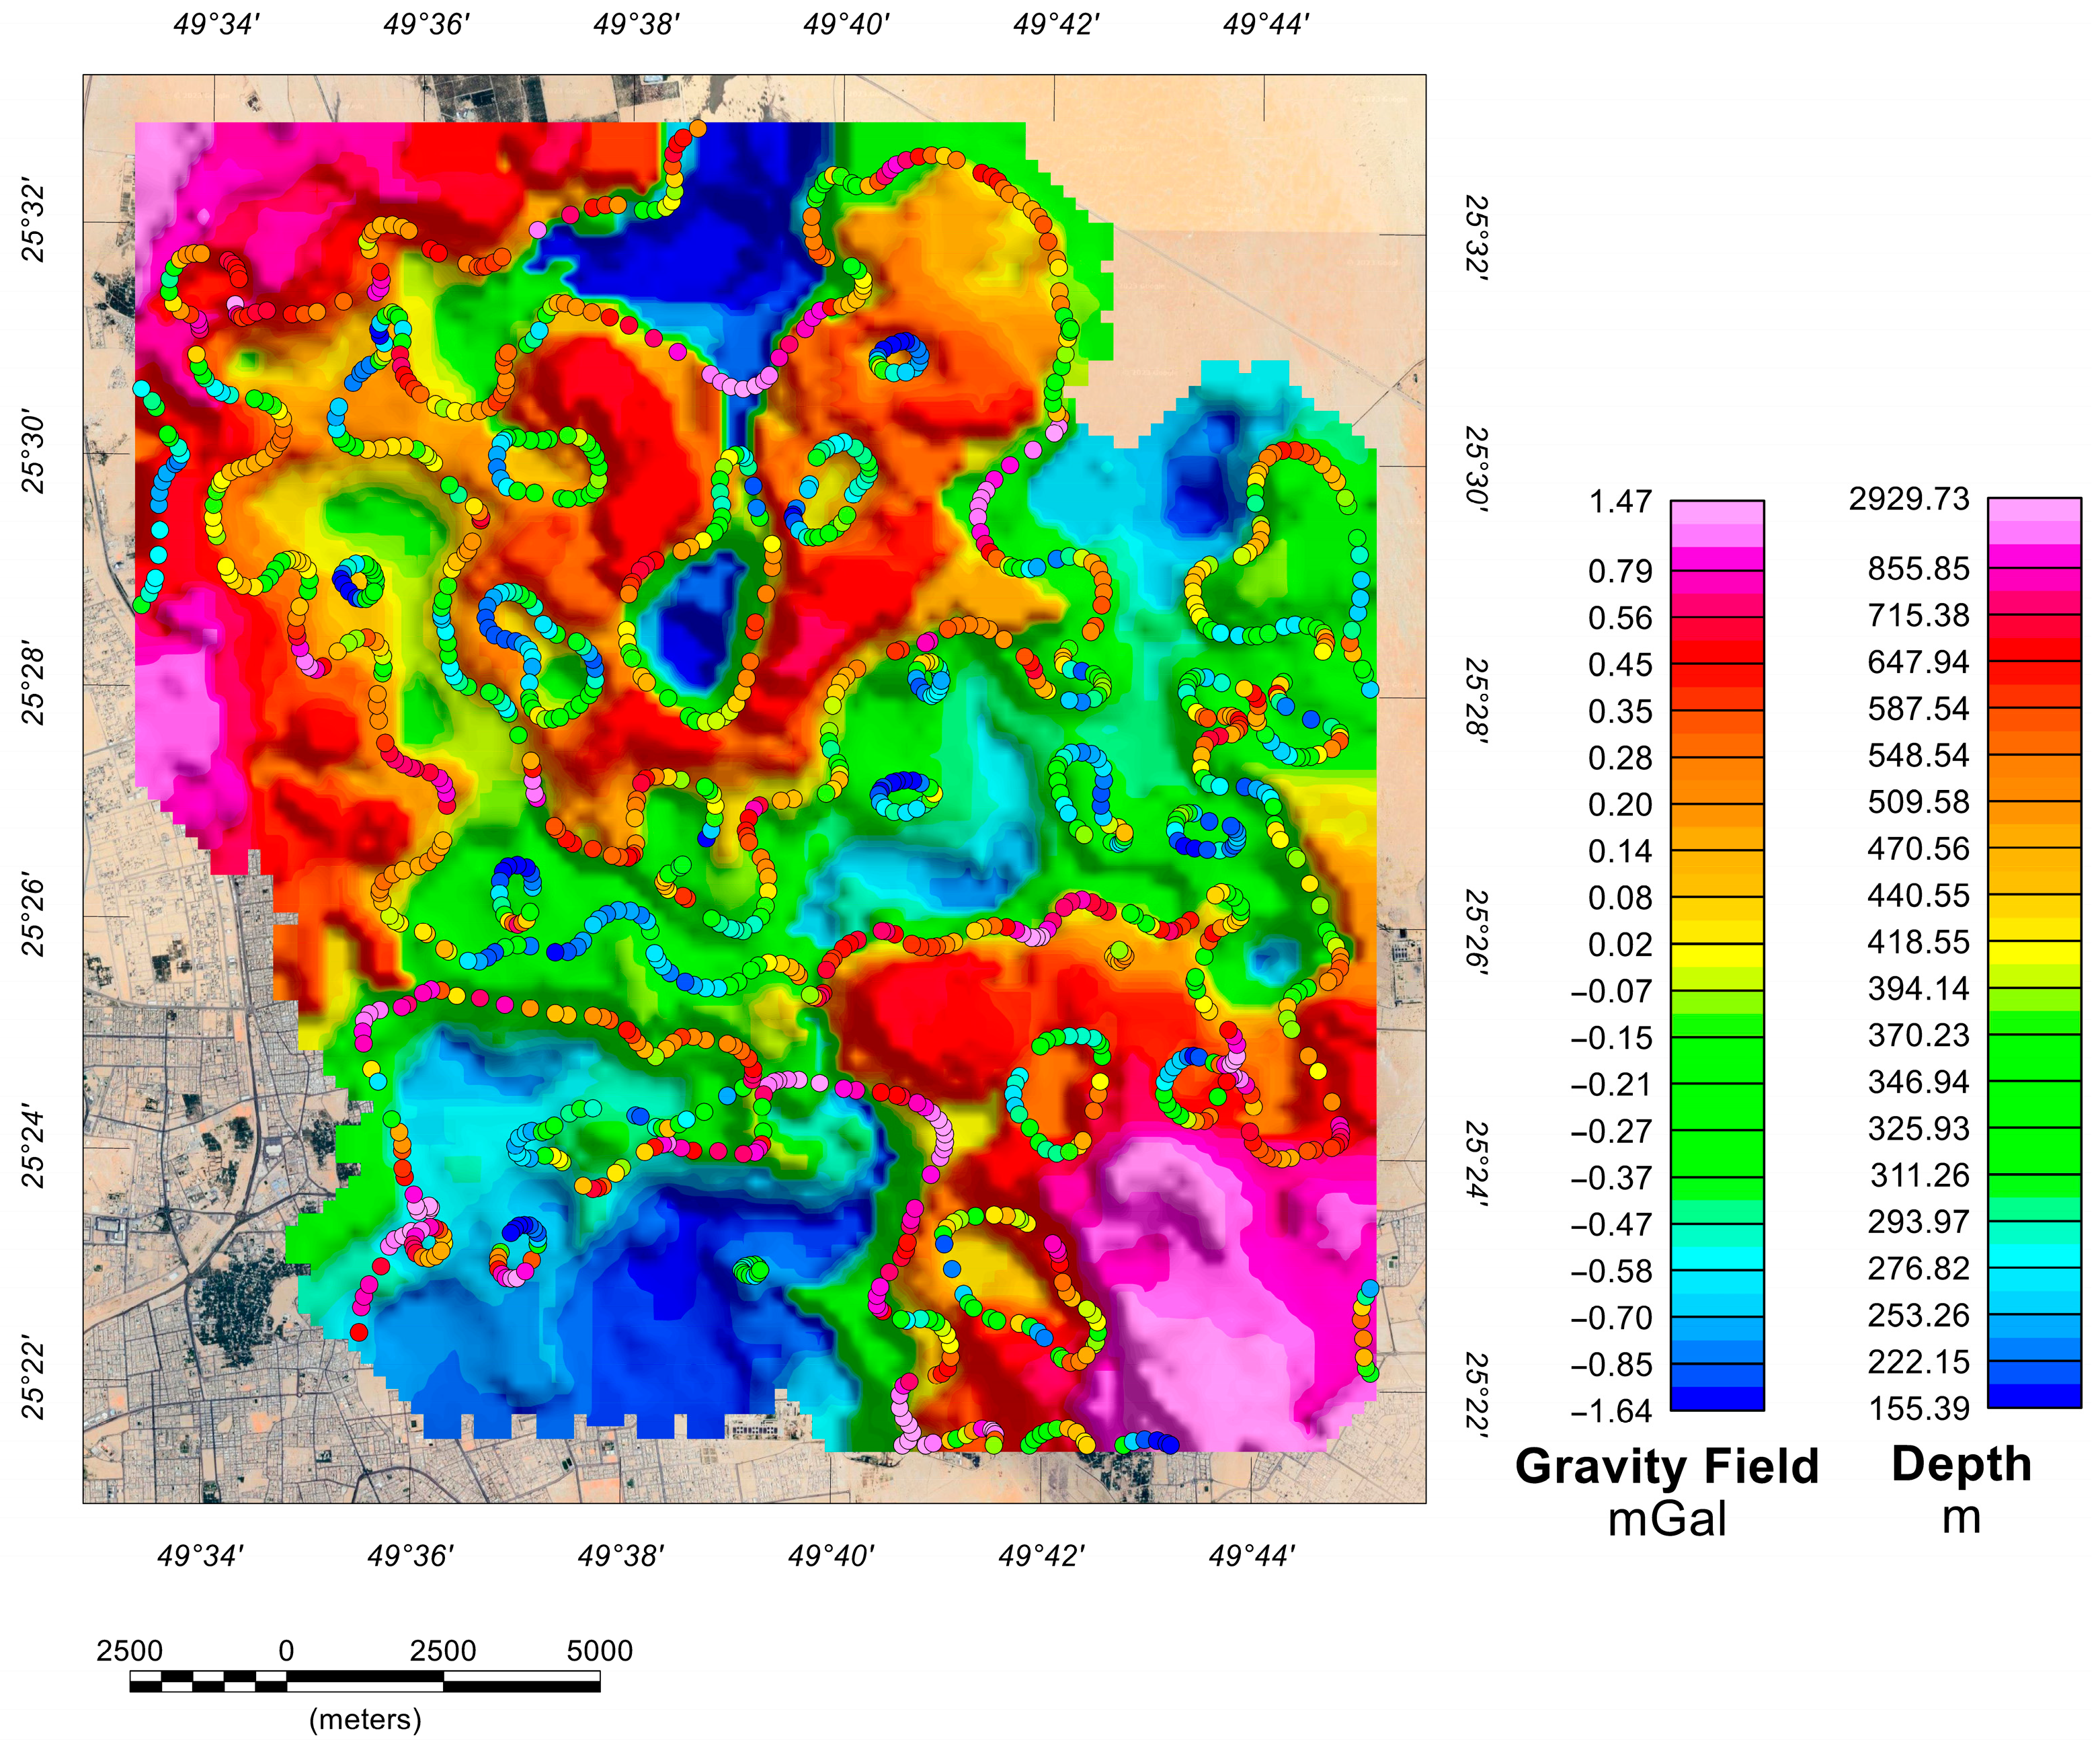
Figure 5, displays the terracing transformation map, resulting in an improvement of the subsurface characteristics, suggesting the presence of similar areas with regards to gravity response. The depth solutions obtained from the tilt-depth method are displayed as colored circles according to their values over the residual gravity field (Figure 5).
A 3D inversion was applied to the gravity data, resulting in the construction of a voxel-based 3D representation of the subsurface density anomalies. This representation depicts the density contrast, which can be either positive or negative, as illustrated in Figure 6a. The area was divided into a mesh consisting of 41 × 43 × 12 voxels in the X (easting), Y (northing), and Z (depth) directions, with a resolution of 500 m. The inversion reached a maximum depth of approximately 4.2 km. To emphasize the presence of bodies with a low-density contrast, we employed upper and lower boundary values of 0.5 g/cm3 and −0.5 g/cm3, respectively, in the inversion procedure for the visualization of the 3D gravity model. The negative (green and blueish color) density anomalies are between −0.002 and −0.48 g/cm3 (Figure 6b).
5. Discussion
A detailed and extensive gravity survey was applied over the Al-Hassa Oasis to characterize the subsurface and reveal any tectonic or geological information. The data possessed significant value, and their analysis aided in my comprehension of the study area’s intricacy and distinctiveness.
The residual gravity field (Figure 3) indicates the influence of shallow structures on the recorded signal. It reveals low gravity anomalies in the southwestern part of the study area and some other areas, namely in the north, northeast, and central parts of the area under investigation. Low-density anomalies (blue and dark-blue colors) are usually represented by fractured/eroded rocks, semi-cohesive sediments, sedimentary rocks, and, sometimes, loose sediments. On the other hand, areas of high gravity anomalies, depicted by the colors red and pink, are found in the northwestern and southeastern parts of the study area. Hard sediments and rock formations usually produce such high anomaly densities. The rest of the study area is characterized by mid-to-low gravity (density) anomalies, typically ranging from −0.4 to 0 mGal, represented by green and light-yellow colors.
Based on the above, the low-density anomalies can be considered as deep basins where only the area they cover can be calculated. Other information, such as the thickness of the sedimentary basin, can be extracted from other results. The high-density anomalies appear next to the basins, with very sharp NNW-SSE and W-E contacts. Assuming that the lateral density change can be considered as a fault and considering the proximity of the study area to the Ghawar anticline, the high-density anomalies are probably uplifted rock formations.
The previous assumption regarding the N-S or NNW-SSE basins and the E-W discontinuities was verified by utilizing the enhancement filters and the produced map showing the TDR, seen in Figure 4a. The lines depicted on the TDR map could be interpreted as either tectonic lineaments or geologic contacts. The dip direction is also specified (Figure 4a). The lineament analysis identified the borders of the geological structures and emphasized the regions where basins (characterized by low density and appearing blue) of the predicted north–south and west–east general orientation are formed. A rose diagram is created to interpret the lineaments (Figure 4b). All linear features (black lines in Figure 4a) were segmented into 100 m length lines, and the strike for each one was recorded. From the total number of linear segments, the rose diagram was constructed where the dominant lineaments in NNW-SSE, NNE-SSW, and E-W orientations were determined. Although those orientations are depicted from the subsurface, they show a good agreement with surface features documented by Saner et al. [21].
The tilt-depth approach was utilized, and the terracing map was estimated to enhance comprehension of the formation and progression of the basins (Figure 5). This investigation presented data on the depths at which geologic contacts and/or tectonic structures are anticipated and provided useful insights for subsurface modeling. The structural basin in the southwestern area of Al-Hassa Oasis is situated at significant depths, with the basin rim being approximately 200 m below the ground surface and extending to a depth of almost 1.8 km. The rest of the basins are shallower.
The obtained data were subjected to 3D inversion to incorporate and portray the complexity of the research area, including changes in density, both in-depth and laterally. Figure 6a displays regions with low density (shown by blue colors) and high density (indicated by pink colors). The low-density structures are observed in a north–south pattern. This is much clearer in Figure 6b, where only the low-density anomalies are shown, represented by the sedimentary basins covering the study area. The figure shows that almost all three basins are formed in the main N-S orientation. These basins are interrupted by higher-density areas, which are represented by the white spaces in between. Furthermore, the 3D model provides additional evidence to corroborate the notion that the southwestern basin is indeed the deepest. The model reveals a substantial structure that extends beyond the boundaries of the area and reaches a maximum depth of 4.2 km.
By utilizing several geophysical techniques and considering additional factors, such as the proximity of the research area to the Ghawar oilfield and the anticipated tectonic characteristics in the region, we can draw the following conclusions based on the findings. The presence of fractures with distinct orientations both at the surface and in the subsurface offers insights into the complex geodynamic history of the region. Surface observations reveal predominantly E-W-oriented fractures, as indicated by Khogali et al. [45]. Conversely, subsurface data obtained from gravity surveys show the coexistence of both N-S and E-W fracture sets. The orientation of the principal stress (σ1), resulting from the Arabian–Eurasian plate collision along the Zagros belt, provides a plausible explanation for the genesis of E-W fractures. This tectonic interaction, characterized by significant compressive forces, will likely induce fracturing perpendicular to the σ1 direction, aligning with the observed E-W fractures.
Conversely, the presence of N-S fractures, particularly noted in the subsurface and absent on the surface, suggests a different mechanism at play. These fractures may be associated with an extensional regime responsible for developing the Najd fault system. Furthermore, the general N-S orientation of outcrop belts and subsurface basins in the Al-Hassa area may derive from the Amar Collision’s imprint, which established N-S trending structural patterns such as Al Nala anticline. This Precambrian event’s legacy, coupled with a subsequent reactivation during the Hercynian Orogeny in the Devonian period, could have further accentuated the N-S structural predisposition. It is crucial to acknowledge the limitation of the outcrop data derived from a single outcrop study, which may not fully represent the area’s complex fracture network. A comprehensive examination of additional outcrops could yield further insights into the interplay of tectonic forces and the development of fractures in the Al-Hassa area. This expanded analysis would enhance our understanding of the subsurface fracture patterns and their implications for hydrocarbon exploration and extraction in the region.
Moreover, the observed density variations contributing to gravity anomalies may also be attributed to salt domes or diapirism, a hypothesis supported by the presence of such structures in the region, such as the Dammam Dome and the North Gulf Salt Basin [13]. This scenario underscores the multifaceted geological processes influencing the area’s subsurface characteristics, further complicating the geophysical interpretation and emphasizing the need for a multi-disciplinary approach for unraveling the geological history and potential resource opportunities in the Al-Hassa region.
6. Conclusions
An extensive gravity survey was conducted in the Al-Hassa Oasis area to develop a detailed and intricate subsurface model of the area being studied. The acquired gravity data indicated that the subsurface geophysical structures in the research area are complex and three-dimensional (3D), characterized by linear anomalies/features with low density. The 3D gravity inversion revealed an intricate subsurface configuration characterized by linear discontinuities oriented in the NNW-SSE and W-E directions. Given the anticipated stress distribution in the wider research region, these discontinuities can be interpreted as fracture zones. Furthermore, the extensive analysis of density variations aligns with the structural characteristics of a salt dome, as explained in the discussion section. Based on the predicted data, it has been concluded that gravity can provide images of anomalies with a relatively minor contrast variation. Geological, geochemical, or other geophysical data, particularly seismic data, could be valuable for validating the generated 3D model for the research region and refining the final conceptual model for the Al-Hassa Oasis area.
Author Contributions
Conceptualization, A.S. and P.S.; methodology, A.S. and P.S.; software, K.C. and A.S.; validation, A.S. and P.S.; formal analysis, A.K., K.C., P.K., and P.S.; investigation, A.K., K.C., P.K., and P.S.; resources, P.S.; data curation, K.C. and A.S.; writing—original draft preparation, A.K., K.C., P.K., A.S., and P.S.; writing—review and editing, A.K., K.C., P.K., A.S., and P.S.; visualization, A.K., K.C., and P.K.; supervision, A.S. and P.S.; project administration, P.S.; funding acquisition, P.S. All authors have read and agreed to the published version of the manuscript.
Funding
This research received no external funding.
Institutional Review Board Statement
Not applicable.
Informed Consent Statement
Not applicable.
Data Availability Statement
The raw data supporting the conclusions of this article will be made available by the authors upon request.
Acknowledgments
The authors would like to acknowledge the technical and financial support provided by the College of Petroleum Engineering and Geosciences (CPG) at King Fahd University of Petroleum and Minerals (KFUPM).
Conflicts of Interest
The authors declare no conflicts of interest. The funders had no role in the design of the study; in the collection, analyses, or interpretation of data; in the writing of the manuscript; or in the decision to publish the results.
References
- Al Tokhais, A.S.; Rausch, R. The Hydrogeology of Al Hassa Springs. In Proceedings of the 3rd International Conference on Water Resources and Arid Environments (2008) and the 1st Arab Water Forum, Riyadh, Saudi Arabia, 16–19 November 2008; Volume 1, pp. 16–19. [Google Scholar]
- Al-Zarah, A. Elemental Composition of Groundwater and Spring Waters in Al-Ahsa Oasis, Eastern Region Saudi Arabia. Trends Appl. Sci. Res. 2011, 6, 1–18. [Google Scholar] [CrossRef]
- Bakiewicz, W.; Milne, D.M.; Noori, M. Hydrogeology of the Umm Er Radhuma Aquifer, Saudi Arabia, with Reference to Fossil Gradients. Q. J. Eng. Geol. 1982, 15, 105–126. [Google Scholar] [CrossRef]
- Sen, Z.; Al-Dakheel, A. Hydrochemical Facies Evaluation in Umm Er Radhuma Limestone, Eastern Saudi Arabia. Groundwater 1986, 24, 626–635. [Google Scholar] [CrossRef]
- Sharaf, M.A.M. Review of the Hydrogeological and Hydrochemical Aspects of Groundwater in the Umm-Er-Radhuma Aquifer System, Arabian Peninsula. J. Afr. Earth Sci. 2001, 33, 349–362. [Google Scholar] [CrossRef]
- Al-Dakheel, Y. Spatial Modeling for Groundwater Salinity: Neogene Aquifer, Al-Hassa, Saudi Arabia. J. Environ. Hydrol. 2009, 17, 13. [Google Scholar]
- Al-Naeem, A. Evaluation of Groundwater of Al-Hassa Oasis, Eastern Region Saudi Arabia. Res. J. Environ. Sci. 2011, 5, 624–642. [Google Scholar] [CrossRef]
- Al-Omran, A.M.; Mousa, M.A.; AlHarbi, M.M.; Nadeem, M.E.A. Hydrogeochemical Characterization and Groundwater Quality Assessment in Al-Hasa, Saudi Arabia. Arab. J. Geosci. 2018, 11, 79. [Google Scholar] [CrossRef]
- Dirks, H.; Al Ajmi, H.; Kienast, P.; Rausch, R. Hydrogeology of the Umm Er Radhuma Aquifer (Arabian Peninsula). Grundwasser 2018, 23, 5–15. [Google Scholar] [CrossRef]
- Abba, S.I.; Yassin, M.A.; Jibril, M.M.; Tawabini, B.; Soupios, P.; Khogali, A.; Shah, S.M.H.; Usman, J.; Aljundi, I.H. Nitrate Concentrations Tracking from Multi-Aquifer Groundwater Vulnerability Zones: Insight from Machine Learning and Spatial Mapping. Process Saf. Environ. Prot. 2024, 184, 1143–1157. [Google Scholar] [CrossRef]
- Abba, S.I.; Yassin, M.A.; Shah, S.M.H.; Egbueri, J.C.; Elzain, H.E.; Agbasi, J.C.; Saini, G.; Usaman, J.; Khan, N.A.; Aljundi, I.H. Trace Element Pollution Tracking in the Complex Multi-Aquifer Groundwater System of Al-Hassa Oasis (Saudi Arabia) Using Spatial, Chemometric and Index-Based Techniques. Environ. Res. 2024, 249, 118320. [Google Scholar] [CrossRef]
- Al-Husseini, M.I. Origin of the Arabian Plate Structures: Amar Collision and Najd Rift. GeoArabia 2000, 5, 527–542. [Google Scholar] [CrossRef]
- Pollastro, R.M. Total Petroleum Systems of the Paleozoic and Jurassic, Greater Ghawar Uplift and Adjoining Provinces of Central Saudi Arabia and Northern Arabian-Persian Gulf; U.S. Geological Survey: Reston, VA, USA, 2003; p. 52. [Google Scholar] [CrossRef]
- Oterdoom, W.H.; Worthing, M.A.; Partington, M. Petrological and Tectonostratigraphic Evidence for a Mid Ordovician Rift Pulse on the Arabian Peninsula. GeoArabia 1999, 4, 467–500. [Google Scholar] [CrossRef]
- Geert, K.; Afifi, A.M.; Al-Hajri, S.A.; Droste, H.J. Paleozoic Stratigraphy and Hydrocarbon Habitat of the Arabian Plate. GeoArabia 2001, 6, 407–442. [Google Scholar] [CrossRef]
- Sharland, P.R.; Casey, D.M.; Davies, R.B.; Simmons, M.D.; Sutcliffe, O.E. Arabian Plate Sequence Stratigraphy—Revisions to SP2. GeoArabia 2004, 9, 199–214. [Google Scholar] [CrossRef]
- Martin, A.Z. Late Permian to Holocene Paleofacies Evolution of the Arabian Plate and Its Hydrocarbon Occurrences. GeoArabia 2001, 6, 445–504. [Google Scholar] [CrossRef]
- Mattes, B.W.; Conway Morris, S. Carbonate/Evaporite Deposition in the Late Precambrian—Early Cambrian Ara Formation of Southern Oman. Geol. Soc. Lond. Spec. Publ. 1990, 49, 617–636. [Google Scholar] [CrossRef]
- Zhang, M.; Qiao, J.; Zhao, G.; Lan, X. Regional Gravity Survey and Application in Oil and Gas Exploration in China. China Geol. 2019, 2, 382–390. [Google Scholar]
- Edgell, H.S. Basement Tectonics of Saudi Arabia as Related to Oil Field Structures. In Basement Tectonics 9; Rickard, M.J., Ed.; Kluwer Academic Publishers: Dordrecht, The Netherlands, 1992; pp. 169–193. [Google Scholar]
- Saner, S.; Al-Hinai, K.; Perincek, D. Surface Expressions of the Ghawar Structure, Saudi Arabia. Mar. Pet. Geol. 2005, 22, 657–670. [Google Scholar] [CrossRef]
- Mukhopadhyay, M.; Mogren, S.; Mukhopadhyay, B.; Venkatesh, K.D.; Elawadi, E. Crustal Control on Basement Uplift beneath the Ghawar Anticline, Saudi Arabia—Gravity Modeling with Receiver Function Constraints. Arab. J. Geosci. 2020, 13, 463. [Google Scholar] [CrossRef]
- Al-Dakheel, Y.Y.; Hussein, A.H.A.; Mahmoudi, A.S.E.; Massoud, M.A. Soil, Water Chemistry and Sedimentological Studies of Al Asfar Evaporation Lake and Its Inland Sabkha, Al Hassa Area, Saudi Arabia. Asian J. Earth Sci. 2008, 2, 1–21. [Google Scholar] [CrossRef]
- Mahmoudi, A.; Al-Barrak, K.; Massoud, M. 2-D Electrical Tomography for Mapping of Aquifers at the New Campus of King Faisl University, Al Hassa, KSA. Int. J. Water Resour. Arid Environ. 2011, 1, 397–410. [Google Scholar]
- Al-Saad, H.; Nasir, S.; Sadooni, F.; Alsharhan, A.S. Stratigraphy and Sedimentology of the Hofuf Formation in the State of Qatar in Relation to the Tectonic Evolution of the East Arabian Block. Neues Jahrb. Geol. Paläontologie Monatshefte 2002, 2002, 426–448. [Google Scholar] [CrossRef]
- Powers, R.; Ramirez, L.; Redmond, C.; Elberg, E. Geology of the Arabian Peninsula; U.S. Geol. Survey: Washington, DC, USA, 1966; Volume 560. [Google Scholar]
- Al-Sayari, S.S.; Zötl, J.G. (Eds.) Quaternary Period in Saudi Arabia; Springer: Vienna, Austria, 1978; ISBN 978-3-7091-8496-7. [Google Scholar]
- Murris, R. Middle East: Stratigraphic Evolution and Oil Habitat. Am. Assoc. Pet. Geol. Bull. 1980, 64, 597–618. [Google Scholar] [CrossRef]
- Weijermars, R. Surface Geology, Lithostratigraphy and Tertiary Growth of the Dammam Dome, Saudi Arabia: A New Field Guide. GeoArabia 1999, 4, 199–226. [Google Scholar] [CrossRef]
- Hancock, P.L.; Kadhi, A. Analysis of Mesoscopic Fractures in the Dhruma-Nisah Segment of the Central Arabian Graben System. J. Geol. Soc. Lond. 1978, 135, 339–347. [Google Scholar] [CrossRef]
- Vaslet, D.; Al-Muallem, M.S.; Maddeh, S.S.; Brosse, J.M.; Fourniquet, J.; Breton, J.P.; Le Nindre, Y.M. Explanatory Notes to the Geologic Map of the Ar Riyad Quadrangle, Sheet 24 I, Kingdom of Saudi Arabia; Saudi Geol. Survey: Jeddah, Saudi Arabia, 1991. [Google Scholar]
- Al-Mahmoud, M. Hydrogeology of the Al-Hassa Oasis; King Fahd University of Petroleum and Minerals: Dhahran, Saudi Arabia, 1987. [Google Scholar]
- Hussain, M.; Al-Khalifah, F.; Khandaker, N.I. The Jabal Al Qarah Caves of the Hofuf Area, Northeastern Saudi Arabia: A Geological Investigation. J. Cave Karst Stud. 2006, 68, 12–21. [Google Scholar]
- Fairhead, D. Advances in Gravity and Magnetic Processing and Interpretation; EAGE Publications B.V.: Utrecht, The Netherlands, 2016; ISBN 9789462821774. [Google Scholar]
- Dilalos, S.; Alexopoulos, J.D.; Tsatsaris, A. Calculation of Building Correction for Urban Gravity Surveys. A Case Study of Athens Metropolis (Greece). J. Appl. Geophys. 2018, 159, 540–552. [Google Scholar] [CrossRef]
- Chavanidis, K.; Stampolidis, A.; Kirmizakis, P.; Tranos, M.; Fedi, M.; Pasteka, R.; Al-Ramadan, K.; Kaka, S.; Tsokas, G.N.; Soupios, P. Gravity Survey on the Oil-Bearing Dammam Dome (Eastern Saudi Arabia) and Its Implications. Remote Sens. 2022, 14, 735. [Google Scholar] [CrossRef]
- Moritz, H. Geodetic Reference System 1980. Bull. Géodésique 1980, 54, 395–405. [Google Scholar] [CrossRef]
- Kane, M.F. A Comprehensive System of Terrain Correction Using a Digital Computer. Geophysics 1962, 27, 455–462. [Google Scholar] [CrossRef]
- Nagy, D. The Gravitational Attraction of a Right Rectangular Prism. Geophysics 1966, 31, 362–371. [Google Scholar] [CrossRef]
- Cordell, L.; McCafferty, A.E. A Terracing Operator for Physical Property Mapping with Potential Field Data. Geophysics 1989, 54, 621–634. [Google Scholar] [CrossRef]
- Li, X. Terracing Gravity and Magnetic Data Using Edge-Preserving Smoothing Filters. Geophysics 2016, 81, G41–G47. [Google Scholar] [CrossRef]
- Miller, H.G.; Singh, V. Potential Field Tilt—A New Concept for Location of Potential Field Sources. J. Appl. Geophys. 1994, 32, 213–217. [Google Scholar] [CrossRef]
- Verduzco, B.; Fairhead, J.D.; Green, C.M.; MacKenzie, C. New Insights into Magnetic Derivatives for Structural Mapping. Lead. Edge 2004, 23, 116–119. [Google Scholar] [CrossRef]
- Salem, A.; Williams, S.; Fairhead, D.; Ravat, D.; Smith, R. Tilt-Depth Method: A Simple Depth Estimation Method Using First-Order Magnetic Derivatives. Lead. Edge 2007, 26, 1502–1505. [Google Scholar] [CrossRef]
- Khogali, A.; Abu-Mahfouz, I.; Arrofi, D.; AlGhamdi, M.; Soupios, P. Structural Analysis of Neogene Sandstone Sequence through Integrated Digital Outcrop Modeling and Field Investigations. J. Struct. Geol. 2024; under review. [Google Scholar]
Figure 2.
The complete Bouguer anomaly map of the Al-Hassa study area. The white points correspond to the locations of the gravity stations.
Figure 2.
The complete Bouguer anomaly map of the Al-Hassa study area. The white points correspond to the locations of the gravity stations.

Figure 3.
The residual gravity-field map with the locations of the gravity stations (white points). The black rectangle indicates the boundaries of the 3D modeling area.
Figure 3.
The residual gravity-field map with the locations of the gravity stations (white points). The black rectangle indicates the boundaries of the 3D modeling area.

Figure 4.
(a) The tilt derivative and the interpreted lineaments (black lines), which correspond to structural edges (tectonic lineaments and/or rock contacts), are presented. (b) Rose diagram of the interpreted lineaments (insert into the Figure with the tilt derivative and the lineaments).
Figure 4.
(a) The tilt derivative and the interpreted lineaments (black lines), which correspond to structural edges (tectonic lineaments and/or rock contacts), are presented. (b) Rose diagram of the interpreted lineaments (insert into the Figure with the tilt derivative and the lineaments).

Figure 5.
The terracing map overlaid by the results of the tilt-depth method (shown as colorful dots). The depth in the depth color bar is positive down.
Figure 5.
The terracing map overlaid by the results of the tilt-depth method (shown as colorful dots). The depth in the depth color bar is positive down.

Figure 6.
(a) The top view of the 3D model of the Al-Hassa Oasis area shows the positive (pink bodies) and negative (blue bodies) density contrast anomalies. (b) 3D model of the study area, showing the negative density (green and blueish color) bodies that correspond to subsurface basins.
Figure 6.
(a) The top view of the 3D model of the Al-Hassa Oasis area shows the positive (pink bodies) and negative (blue bodies) density contrast anomalies. (b) 3D model of the study area, showing the negative density (green and blueish color) bodies that correspond to subsurface basins.

Disclaimer/Publisher’s Note: The statements, opinions and data contained in all publications are solely those of the individual author(s) and contributor(s) and not of MDPI and/or the editor(s). MDPI and/or the editor(s) disclaim responsibility for any injury to people or property resulting from any ideas, methods, instructions or products referred to in the content. |
© 2024 by the authors. Licensee MDPI, Basel, Switzerland. This article is an open access article distributed under the terms and conditions of the Creative Commons Attribution (CC BY) license (https://creativecommons.org/licenses/by/4.0/).
Share and Cite
MDPI and ACS Style
Khogali, A.; Chavanidis, K.; Kirmizakis, P.; Stampolidis, A.; Soupios, P. Reconstruction of the Subsurface of Al-Hassa Oasis Using Gravity Geophysical Data. Appl. Sci. 2024, 14, 3707. https://doi.org/10.3390/app14093707
AMA Style
Khogali A, Chavanidis K, Kirmizakis P, Stampolidis A, Soupios P. Reconstruction of the Subsurface of Al-Hassa Oasis Using Gravity Geophysical Data. Applied Sciences. 2024; 14(9):3707. https://doi.org/10.3390/app14093707
Chicago/Turabian StyleKhogali, Abid, Konstantinos Chavanidis, Panagiotis Kirmizakis, Alexandros Stampolidis, and Pantelis Soupios. 2024. "Reconstruction of the Subsurface of Al-Hassa Oasis Using Gravity Geophysical Data" Applied Sciences 14, no. 9: 3707. https://doi.org/10.3390/app14093707
Note that from the first issue of 2016, this journal uses article numbers instead of page numbers. See further details here.