

Prediction of Delayed Surface Subsidence Based on the Improved Knothe-n Model
1
Hubei Key Laboratory of Disaster Prevention and Mitigation, Three Gorges University, Yichang 443002, China
2
Engineering Research Center of Catastrophic Prophylaxis and Treatment of Road Traffic Safety of Ministry of Education, Changsha University of Science and Technology, Changsha 410114, China
3
School of Architecture and Civil Engineering, Chengdu University, Chengdu 610106, China
4
State Key Laboratory of Geohazard Prevention and Geoenvironment Protection, Chengdu University of Technology, Chengdu 610059, China
*
Author to whom correspondence should be addressed.
Appl. Sci. 2024, 14(9), 3742; https://doi.org/10.3390/app14093742
Submission received: 5 March 2024
/
Revised: 2 April 2024
/
Accepted: 24 April 2024
/
Published: 27 April 2024
(This article belongs to the Special Issue Advances in Disaster Prevention and Reduction for Geotechnical Engineering)
Abstract
:The delayed surface subsidence caused by coal seam mining is a problem that cannot be ignored, while accurate prediction of the surface subsidence provides a guarantee of the safety and stability of the relevant areas. However, the traditional Knothe model has limitations in considering delayed surface subsidence. Because of this, the Knothe-n time function model is segmented and improved by using the data of the subsidence area obtained from a FLAC3D-based numerical model, and the maximum delayed surface subsidence in different periods is calculated. The analytical results are compared with the numerical results to validate the effectiveness of the improved segmented time function model in predicting delayed surface subsidence. The improved model is applied to predict the surface subsidence in the Yutianbao subsidence area. The root-mean-square error between the predicted and measured values for the maximum subsidence monitoring point is 1.12, and the root-mean-square error between the average predicted and measured values for the surface monitoring points is 0.37, which verifies the accuracy of the improved model. The prediction model provides a scientific basis for environmental protection and safety management after coal seam mining.
1. Introduction
Land subsidence is a process that accompanies all mineral and groundwater exploitation. The mining of underground coal seams leads to gravity-driven subsidence and damage to the overlying rock strata. The vertical movement deformation generated within the rock strata is also gradually transferred to the surface, causing surface subsidence. Sun et al. proposed the Analogous Hyperbolic Settlement Model (AHSM) to describe the movement and damage of internal load while employing a unique finite element method to validate the strata movement induced by mining [1]. After the active phase of surface subsidence ends, residual and persistent surface subsidence persists due to the slow release of stress, posing a challenging problem in rock engineering [2], which may lead to the destruction of new buildings, railroads, highways, water conservancy facilities, etc. on the ground, and substantial economic losses [3,4,5]. Before land reuse in the coal mining subsidence area, it is necessary to predict residual subsidence in the area. A comprehensive understanding of the surface subsidence process over time is needed to accurately predict the residual subsidence [6,7,8]. The time function models determining the dynamic subsidence caused by coal mining mainly include the Knothe model, the Boltzmann model [9], the Weibull time series function [10], and the Logistic model [11]. Based on the time function proposed by Polish scholar Knothe in 1952 [12], Chang et al. [13] proposed the segmented Knothe time function model for dealing with the deficiencies of the Knothe time function. Zhang et al. [14] extended the application range of the segmented Knothe time function model and optimized its model parameterization method [15]. Miao et al. [16] used the probability integration model-related theory to construct a model for solving the time function parameters c and τ, and further optimized the segmented Knothe time function model. Liu and Zhang [17,18] proposed an improved power exponential Knothe time function model. Jin et al. [19] applied the monitoring results of InSAR to fit the parameters of the power exponential Knothe time function model. Zhang et al. [20] further modified the traditional Knothe time function model by considering the non-linear mechanical properties of the overlying strata, as well as the non-linear change characteristics of rock strata in bending, breaking, collapse, and surface movement deformation with time after coal seam mining.
In view of this, the prediction of multi-parameter models is more accurate, as they are based on a greater number of parameters. However, the difficulty associated with determining these parameters reduces the practicality of the model [21]. The Knothe-n time function model proposed by Wang [22] is utilized for segmental correction to propose a simple and more accurate prediction model. This improved model often requires a large amount of observation data for validation. To overcome difficulties in human and material resources required for obtaining a large amount of subsidence data, FLAC3D-based numerical simulation [23] is performed to capture the surface residual deformation after underground mining of coal seams, and to further validate the accuracy of the improved time-functional model for subsidence prediction. Finally, a novel Knothe-n segmentation function is obtained.
2. Numerical Simulation Programme
2.1. Project Overview
The Yutianbao coal mining subsidence area is located in Wansheng Economic Development Zone in the southwest of Chongqing Municipality, which is situated in the hilly area on the upper reaches of the Yangtze River at the junction of Sichuan Basin and Yunnan-Guizhou. The terrain is complex and dominated by mountains, hills, and valleys, with an average elevation of 650 m. The rock formations in the area include tuff, coal beds, and marl, with a rock dip angle of 29° and a rich coal resource. The strata include the Longtan Formation of the Permian system, as well as the Changxing Formation, Feixianguan Formation, and Jialingjiang Formation of the Triassic system. Yutianbao coal mine was put into production in 1958 and was shut down in 2016 due to the structural adjustment of national industrial enterprises to resolve overcapacity. The mining depth was from 240 m to −330 m, with a mining thickness of 2 m, and underground mining was adopted. The mined-out mining area was 3.69 km2, the mining area was 10.74 km2, and the proportion of the mined-out mining area was 34.35%. It was a small-scale coal mine. Coal mining destroyed the stress balance, which led to subsidence of the overlying rocks, destroyed the rock structure, and produced ground collapse and cracks. The cracks are perpendicular to the ground surface with an underexposed bottom, presenting an upper narrow and lower wide shape. The subsidence is extensive and is mainly distributed in the mining area and its surrounding areas. Ground elevation is generally lowered, with localized waterlogging in some areas. The surface water level is normal, and the water is weakly alkaline and slightly corrosive. Groundwater resources are abundant and are mainly derived from precipitation and surface water infiltration, and the water level is relatively high. Coal mining has led to surface subsidence, aquifer destruction, and water waste, affecting groundwater flow and storage. Nine subsidence monitoring points are arranged within the region, located respectively in residential clusters at lower elevations within the subsidence-affected area, as shown in Figure 1.
2.2. Numerical Simulation
The mining area is far from seismic fault zones, and the geological structure is relatively stable, with no history of large scale geological movements. Therefore, the influence of structural stress on numerical simulations is neglected. FLAC3D (Fast Lagrangian Analysis of Continua 3D), chosen for numerical simulation, is a piece of continuum mechanics analysis software. Unlike other finite element software, FLAC3D utilizes dynamic motion equations even for static system simulations, eliminating numerical barriers to simulate physically unstable processes. This enables a better simulation of the entire process from imbalance to equilibrium in the model.
Based on relevant survey reports, the modeling process begins by refining the topographic map in CAD, followed by importing it into intermediate software for grid division and preprocessing of the model. This includes establishing the geological strata model within the affected area, dividing rock layers, and partitioning element grids. Finally, the model is imported into FLAC3D for assigning the physical parameters of rock and soil mechanics and conducting model calculations.
The model is 4800 m long and 2700 m wide with 5.04 × 10⁵ elements. The elasto-plastic model serves as the constitutive mechanical model, with the Mohr-Coulomb yield criterion constitutive model chosen for calculation. The stratigraphic lithological parameters are listed in Table 1. The rock strata are regarded as continuous media. The influence of tectonic stress on original rock stress is not considered in the model, and only the self-gravity stress of the rock mass is considered. The model is in a static stress state, with horizontal displacements constrained to the front, back, and sides of the model. The bottom of the model is constrained to horizontal and vertical displacements, and the top of the model is assigned a free boundary. The mining process is divided into three stages: K1, K2, and K3. Profiles I-I’, II-II’, and III-III’ are arranged as shown in Figure 2.
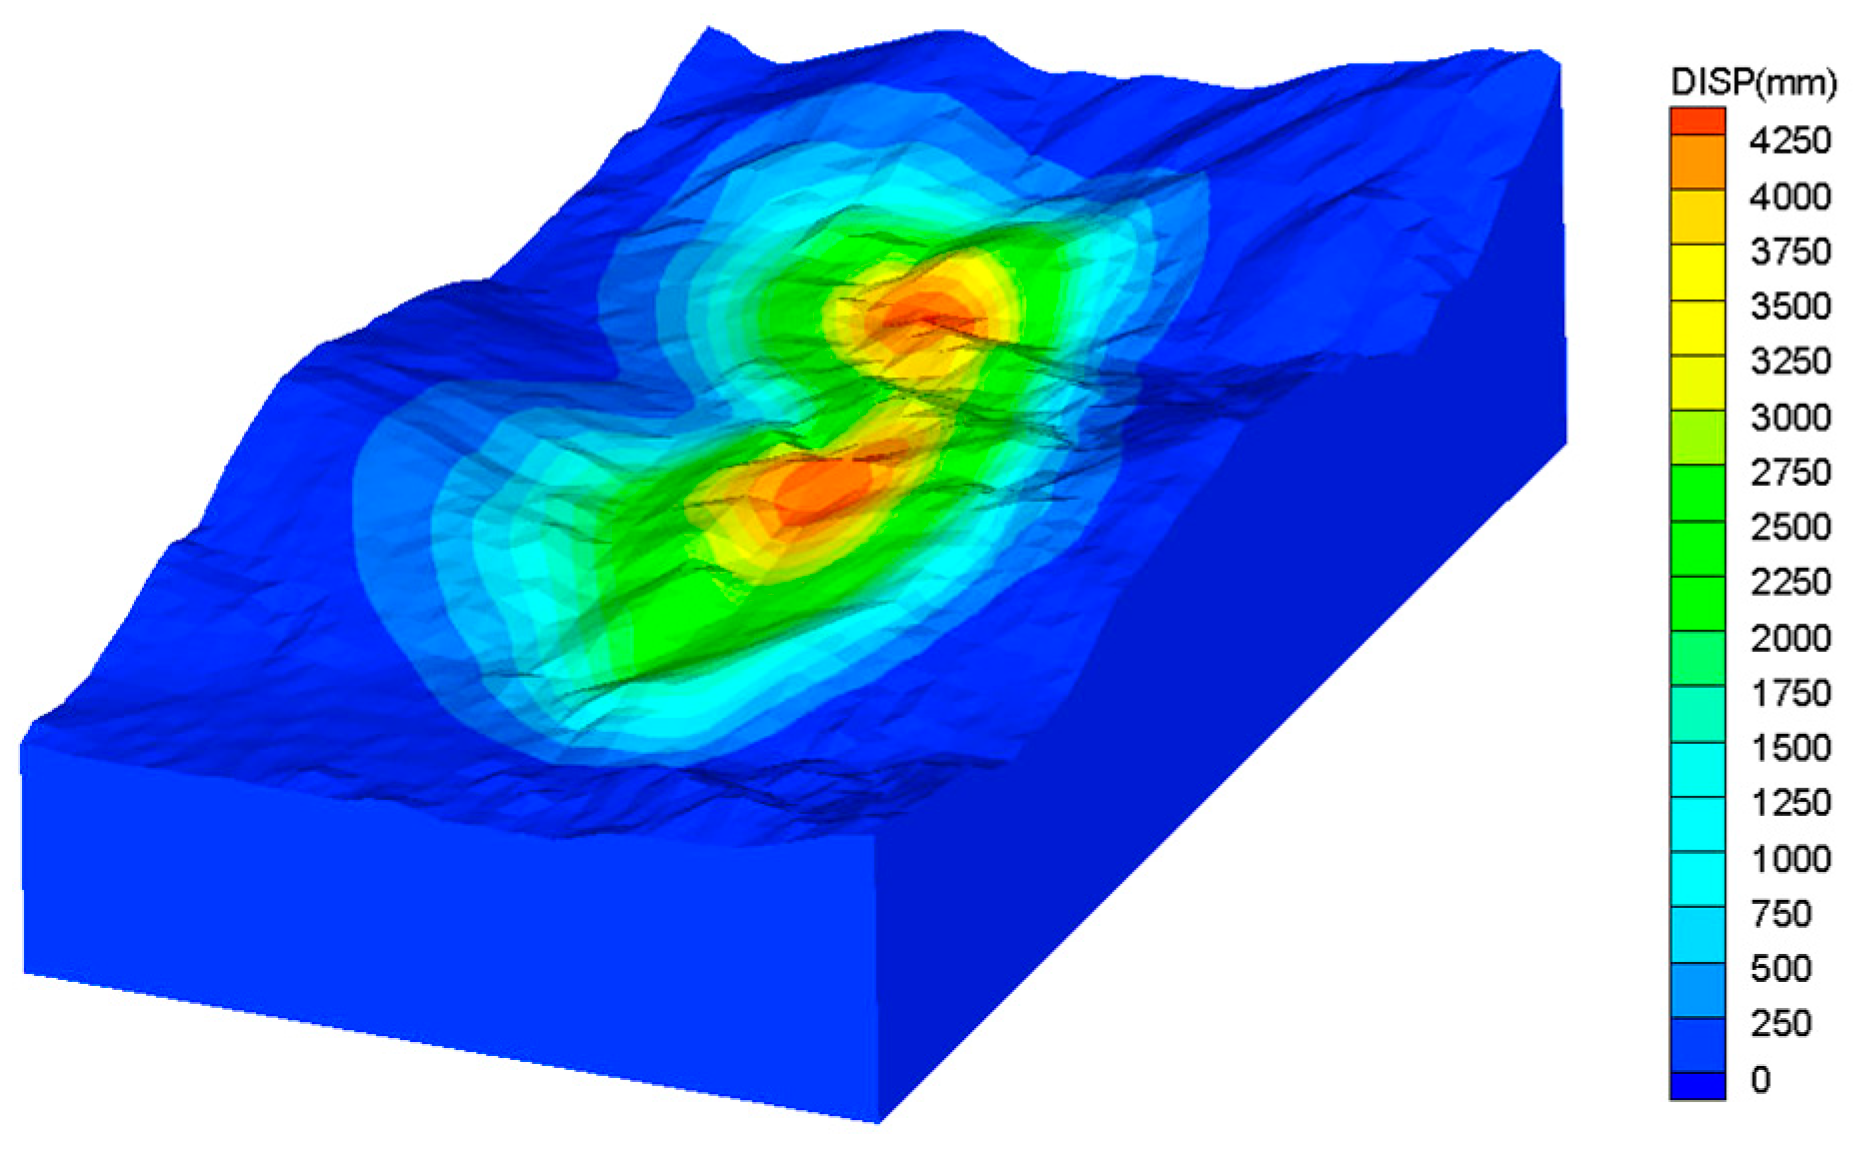
The overall model of the coal seam after mining, as well as the post-mining stress and displacement nephograms of each monitoring profile, are illustrated in Figure 3 and Figure 4, respectively.
Figure 3 reveals that the displacement nephogram of the overall model after coal mining can reflect the subsidence condition of the mining area. There are two subsidence basins in the nephogram, in which the subsidence in the basin where monitoring profile II-II’ is located is slightly larger than that where monitoring profile III-III’ is located, due to the greater subsidence of the mining area. It can be seen from Figure 4 that the displacement and stress fields of the Yutianbao coal mine follow the stress and displacement distribution laws in the roof and floor, as well as the surrounding rocks, after coal mining. The stress field of the mountain has changed greatly after coal seam mining. The boundary stress of the mining area has generally increased, with the monitoring profiles II-II’ and III-III’ reaching −40 MPa. The stress increase of the monitoring profile I-I’ is particularly pronounced in the middle of the concave zig-zag goaf, i.e., the two areas of larger subsidence, where it reaches −42 MPa, which exceeds the tensile strength and leads to cracking of the rock. The displacement nephograms confirm that the largest displacements of the I-I’, II-II’, and III-III’ monitoring profiles are 4.6 m, 4.5 m, and 4.4 m, respectively. The closer the three monitoring profiles are to the mining area from top to bottom, the greater the deformation, and the vertical displacement decreases in all directions. With distance from the mining area as the center, vertical displacement decreases slowly in all directions from the center of the mining area until it approaches zero.
2.3. Numerical Simulation of Delayed Surface Subsidence
The surface subsidence monitoring points WC1–WC9 are located at the edge of the Yutianbao mining area and are close to each other. The average value of the monitoring data of WC1–WC9 is taken as the calculation object to minimize the error. The average surface subsidence values of WC1–WC9 are 17.54 mm from July 2015 to July 2018 and 0.8 mm from February 2018 to July 2018, respectively. The monitored surface subsidence data from February 2018 to July 2018 are listed in Table 2. The numerical simulation of delayed surface subsidence is performed based on the numerical simulation of the Yutianbao mine, where the overall surface subsidence from July 2015 to July 2018 and from February 2018 to July 2018 is simulated. The surface subsidence nephograms are displayed in Figure 5.
Figure 5 confirms large surface subsidence in the middle of both the left and right sides of the mining area. The maximum surface subsidence of 78.2 mm between July 2015 and July 2018 is located in the middle of the left side of the mining area at coordinates of x = 1830 m and y = 970 m. The farther away from the center of the mining area, the smaller the subsidence. The maximum surface subsidence of 8.8 mm between February 2018 and July 2018 is also located in the middle of the left side of the mining area at coordinates of x = 1840 m and y = 990 m. For the Yutianbao coal mine, the subsidence on the left side of the mining area is larger than that on the right side during the residual deformation stage.
3. Knothe-n Time Function Model Improvement
3.1. Knothe-n Time Function
In 1952, Knothe, in Poland, mathematically described the complex spatial and temporal process of surface subsidence caused by underground mining and investigated time-dependent surface movement and deformation. The surface subsidence rate, dw(t)/dt, which is proportional to the difference between the final surface subsidence value, wm, and the dynamic subsidence value at a certain moment, t, w(t), was also obtained. Finally, the time function was obtained as [12]:
where η is the Lithologic time factor.
Although the Knothe time function can predict dynamic subsidence, tilt, curvature, horizontal movement, and horizontal deformation, it cannot reflect the change rule for surface subsidence velocity and acceleration. Therefore, according to the principle of balancing accuracy and practicality, Wang [22] corrected the Knothe time function with a pair of time functions by introducing a power index n in time t. The change rule for the velocity and acceleration curves corresponding to the new Knothe-n model is more in line with the practical situation. The model also contains the time parameters η and n that jointly determine the curve characteristics and solve the Knothe time function. This function can better fit and predict the physical process of subsidence over time at the surface monitoring points in the mining subsidence area and has a wider application range than the Knothe model. Its functional equation is as follows:
where η and n are lithological time coefficients. η determines the duration of the subsidence at the surface monitoring point; and n determines the movement path of the surface monitoring point on the time axis during subsidence, which can be represented by the change rule for subsidence velocity and acceleration.
The corresponding time function is:
The corresponding velocity and acceleration functions are:
Let be equal to 0
According to the principle of differential extrema, the sinking velocity v(t) reaches its maximum when = , the maximum sinking velocity :
Substituting (Equation (6)) into the subsidence time function (Equation (7)) yields the amount of subsidence at the surface observation point when the subsidence rate is maximized:
3.2. Knothe-n Segmented Time Function
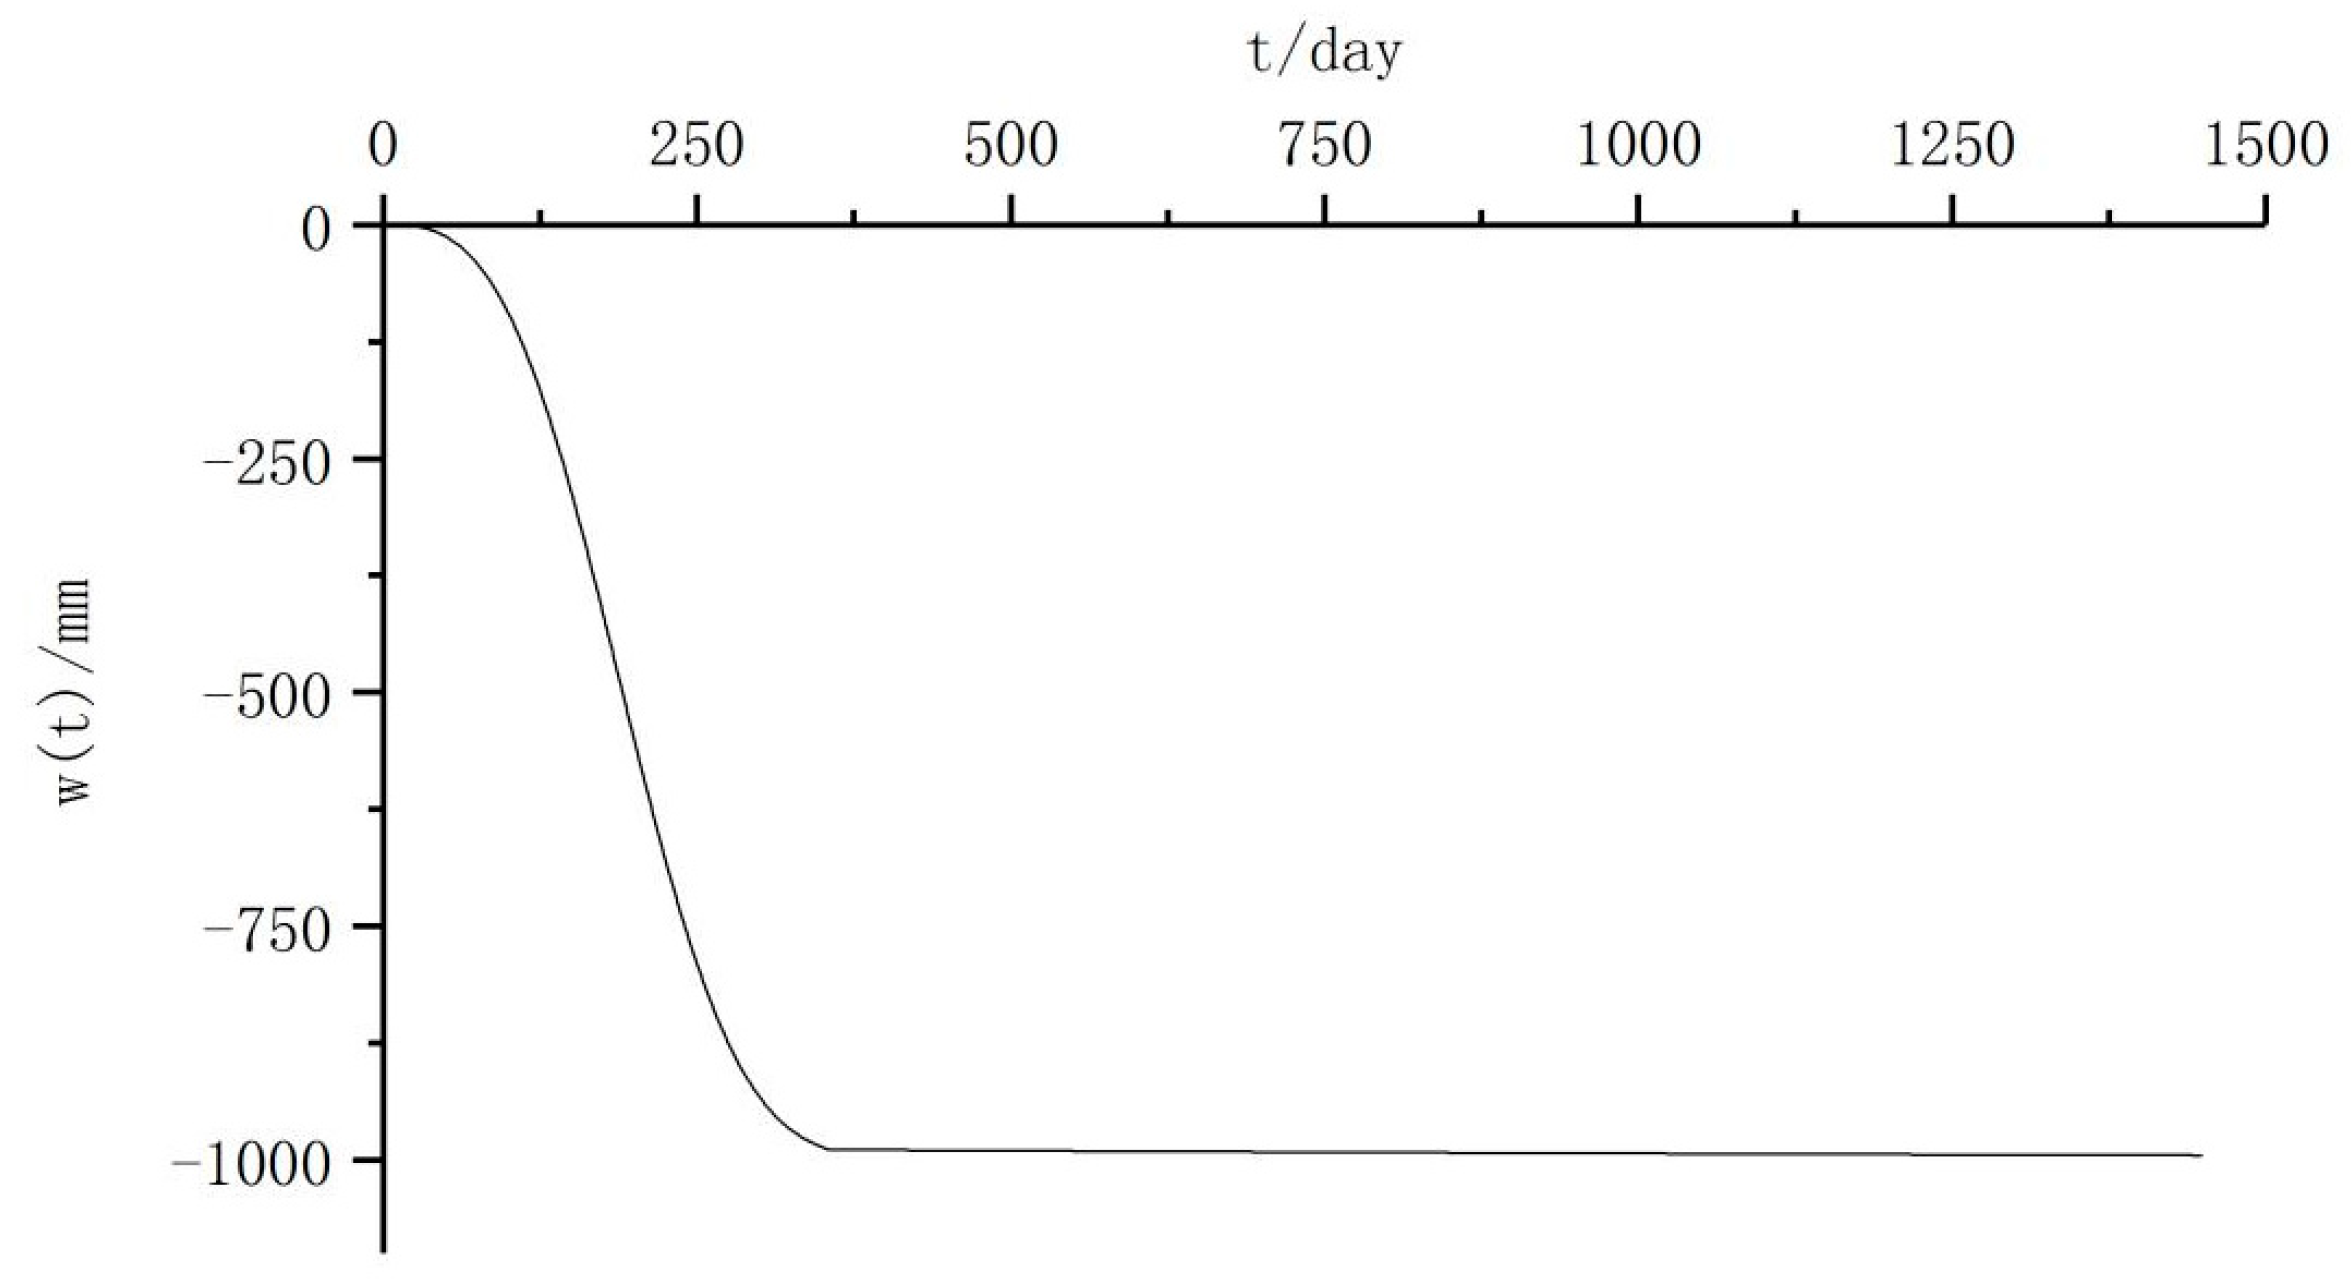
The analysis of the structural features of the Knothe time function model confirms the different significance of the parameters η and n. The parameter n does not affect the beginning and termination moments of the surface subsidence but only affects the process of its medium-term changes. As n decreases, the time at which surface subsidence reaches its maximum rate is delayed. As η decreases, the development rate of the surface subsidence becomes faster, and the time required for subsidence stabilization becomes shorter when the other conditions are constant. To enhance the general applicability of the time function, the fitting of parameters n and η needs to be conducted based on the monitoring data from subsidence points in different subsidence areas. The function should be segmented and adjusted using the maximum subsidence values. Concerning the Yutianbao coal mining subsidence area, the monitored data in terms of subsidence and time at monitoring point WC1 are taken for fitting the parameters n and η by using the least-squares method. The fitting results are = 1 × 10⁻⁷ and n = 3. The simulated maximum surface subsidence at WC1 is 1 × 103 mm. The parameters are substituted into Equation (2) for calculation and plotting of surface subsidence curves, as presented in Figure 6.
Figure 6 demonstrates that the surface subsidence after 612 days reaches a maximum value of 1000 mm. The monitoring data from the existing monitoring points in the Yutianbao mining area reveal that the duration of the recession stage does not coincide with the measured data. To be closer to the actual situation of the project, combining the segmented Knothe time function model proposed by Chang [13] with the variation patterns observed in the measured data, the subsidence process is divided into three stages: the initiation stage, active stage, and decay stage, corresponding to the time when the maximum subsidence rate occurs. Finally, by amplifying the time variation through the exponent n, the function better conforms to the actual deformation pattern, resulting in the improved segmented Knothe-n function, as shown in Equation (9).
where t0 is the initiation time of surface subsidence, d; is the time corresponding to the maximum subsidence rate at ground points, d; and is the duration from coal seam extraction to the stabilization of surface subsidence, d.
The corrected time function curve at = 1 × 10⁻⁷ and n = 3 is calculated by Equation (9), as shown in Figure 7.
To verify the effectiveness of the function when it is used for the recession stage, the continuous 37-month monitoring data at monitoring point WC1 are compared with the predicted data obtained from the time function curve, as indicated in Figure 8.
Figure 8 shows that the overall change rule of the curve is in good agreement with the measured data. The root-mean-square error between the predicted and measured values is 0.91, which indicates that the improved Knothe-n segmented time function model can more accurately characterize the relationship between surface subsidence and time than the single Knothe-n function, and also confirms the correctness and applicability of the present model.
4. Model Validation Results and Analysis
4.1. Feasibility Verification of the Improved Model
Using the improved time function model, calculations of the maximum subsidence in the mining area are compared with numerical simulation results. Additionally, the average subsidence of WC1–WC9 is computed and compared with their measured values again, as shown in Table 3 and Table 4.
Comparison of the calculation results of the improved time function model with the numerical simulation results or measured values fully verifies the feasibility and correctness of the improved segmented time function, which can be used for the prediction of delayed surface subsidence.
4.2. Delayed Surface Subsidence Predicted by Improved Model
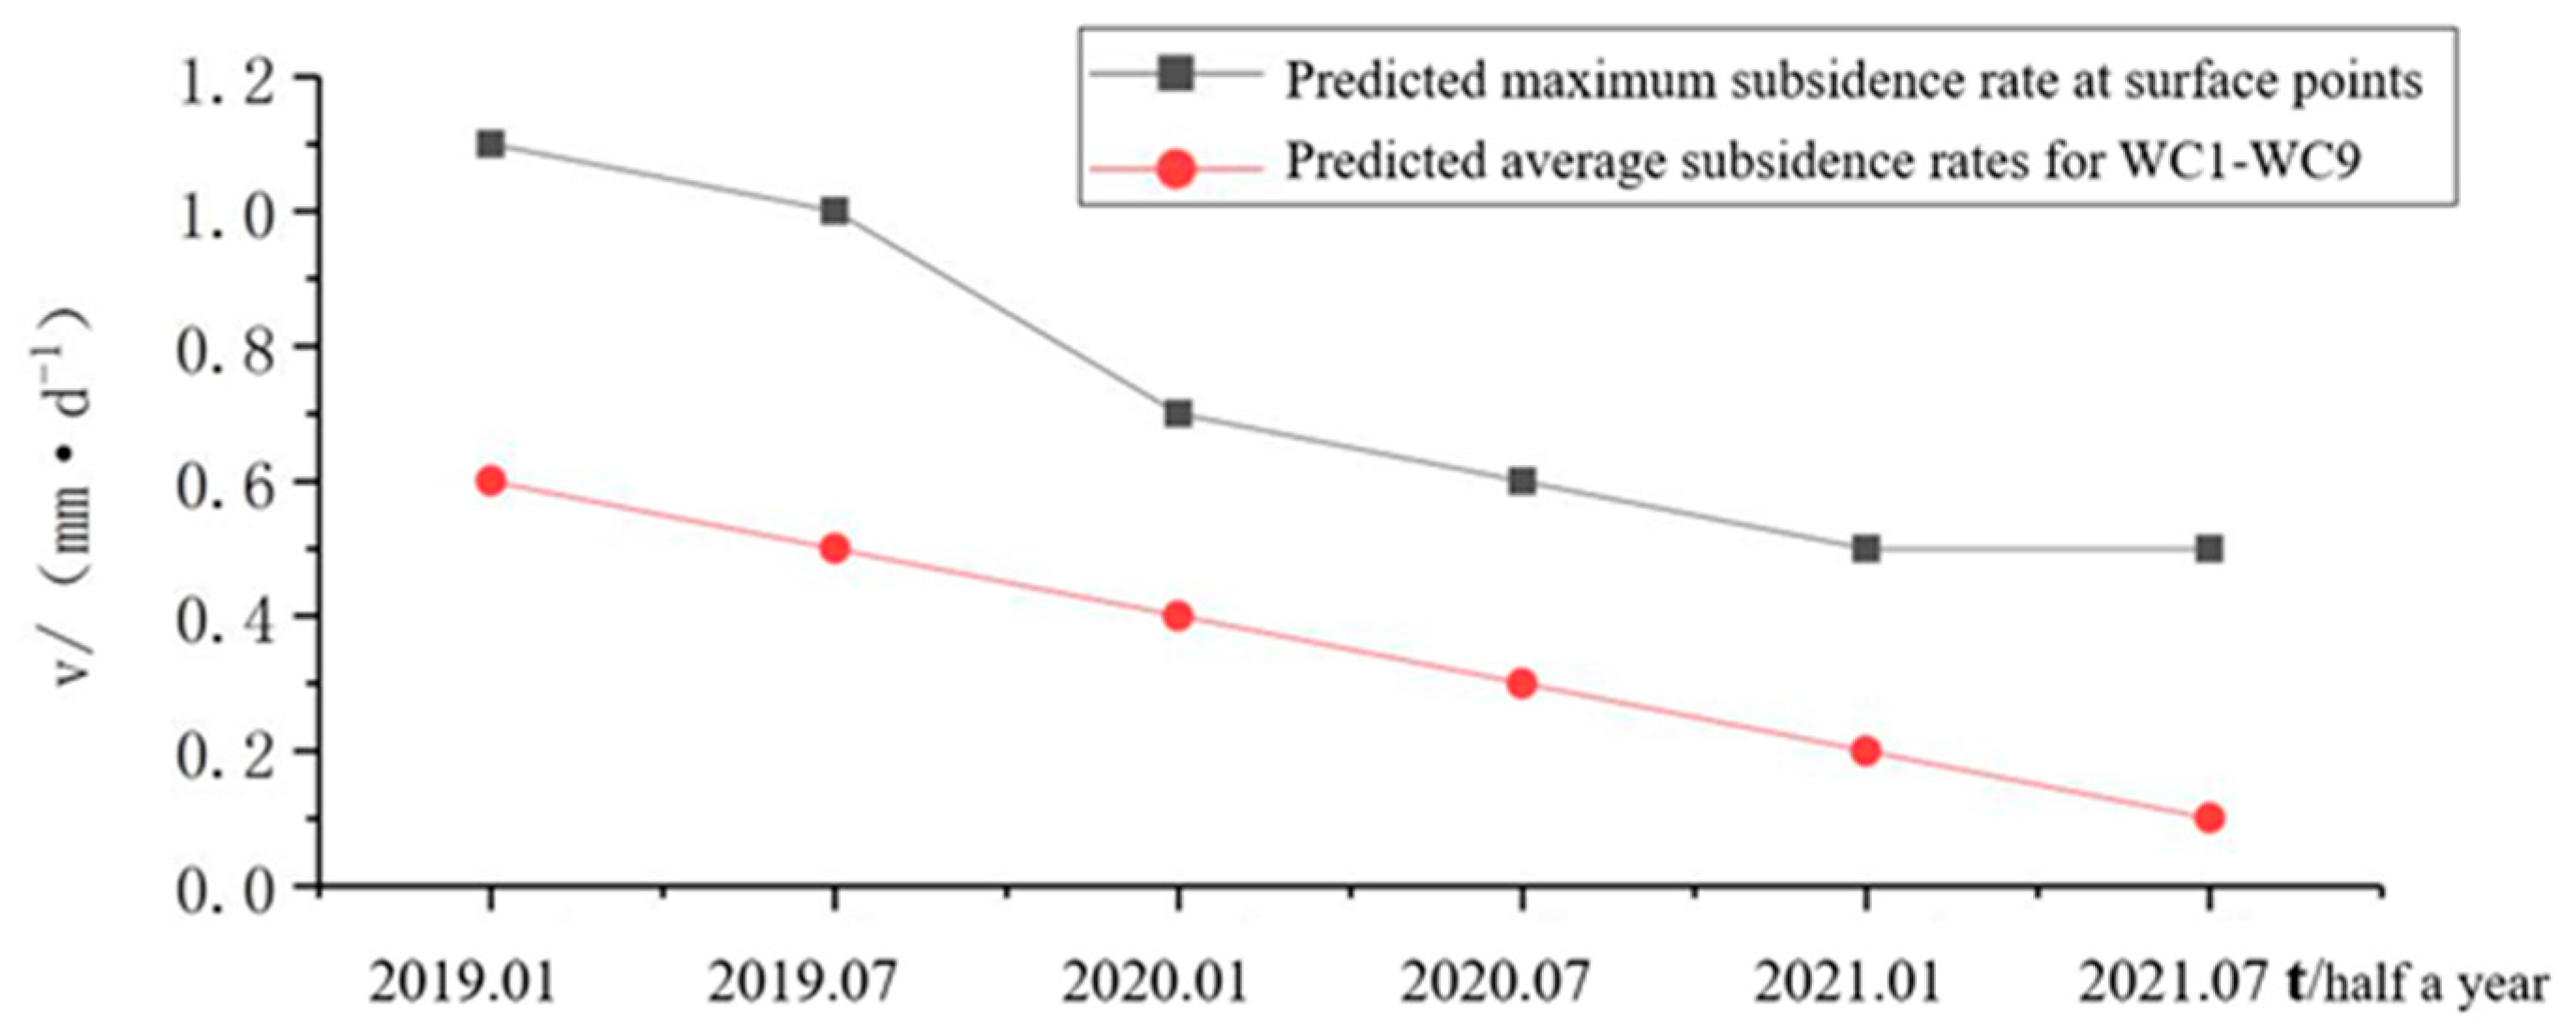
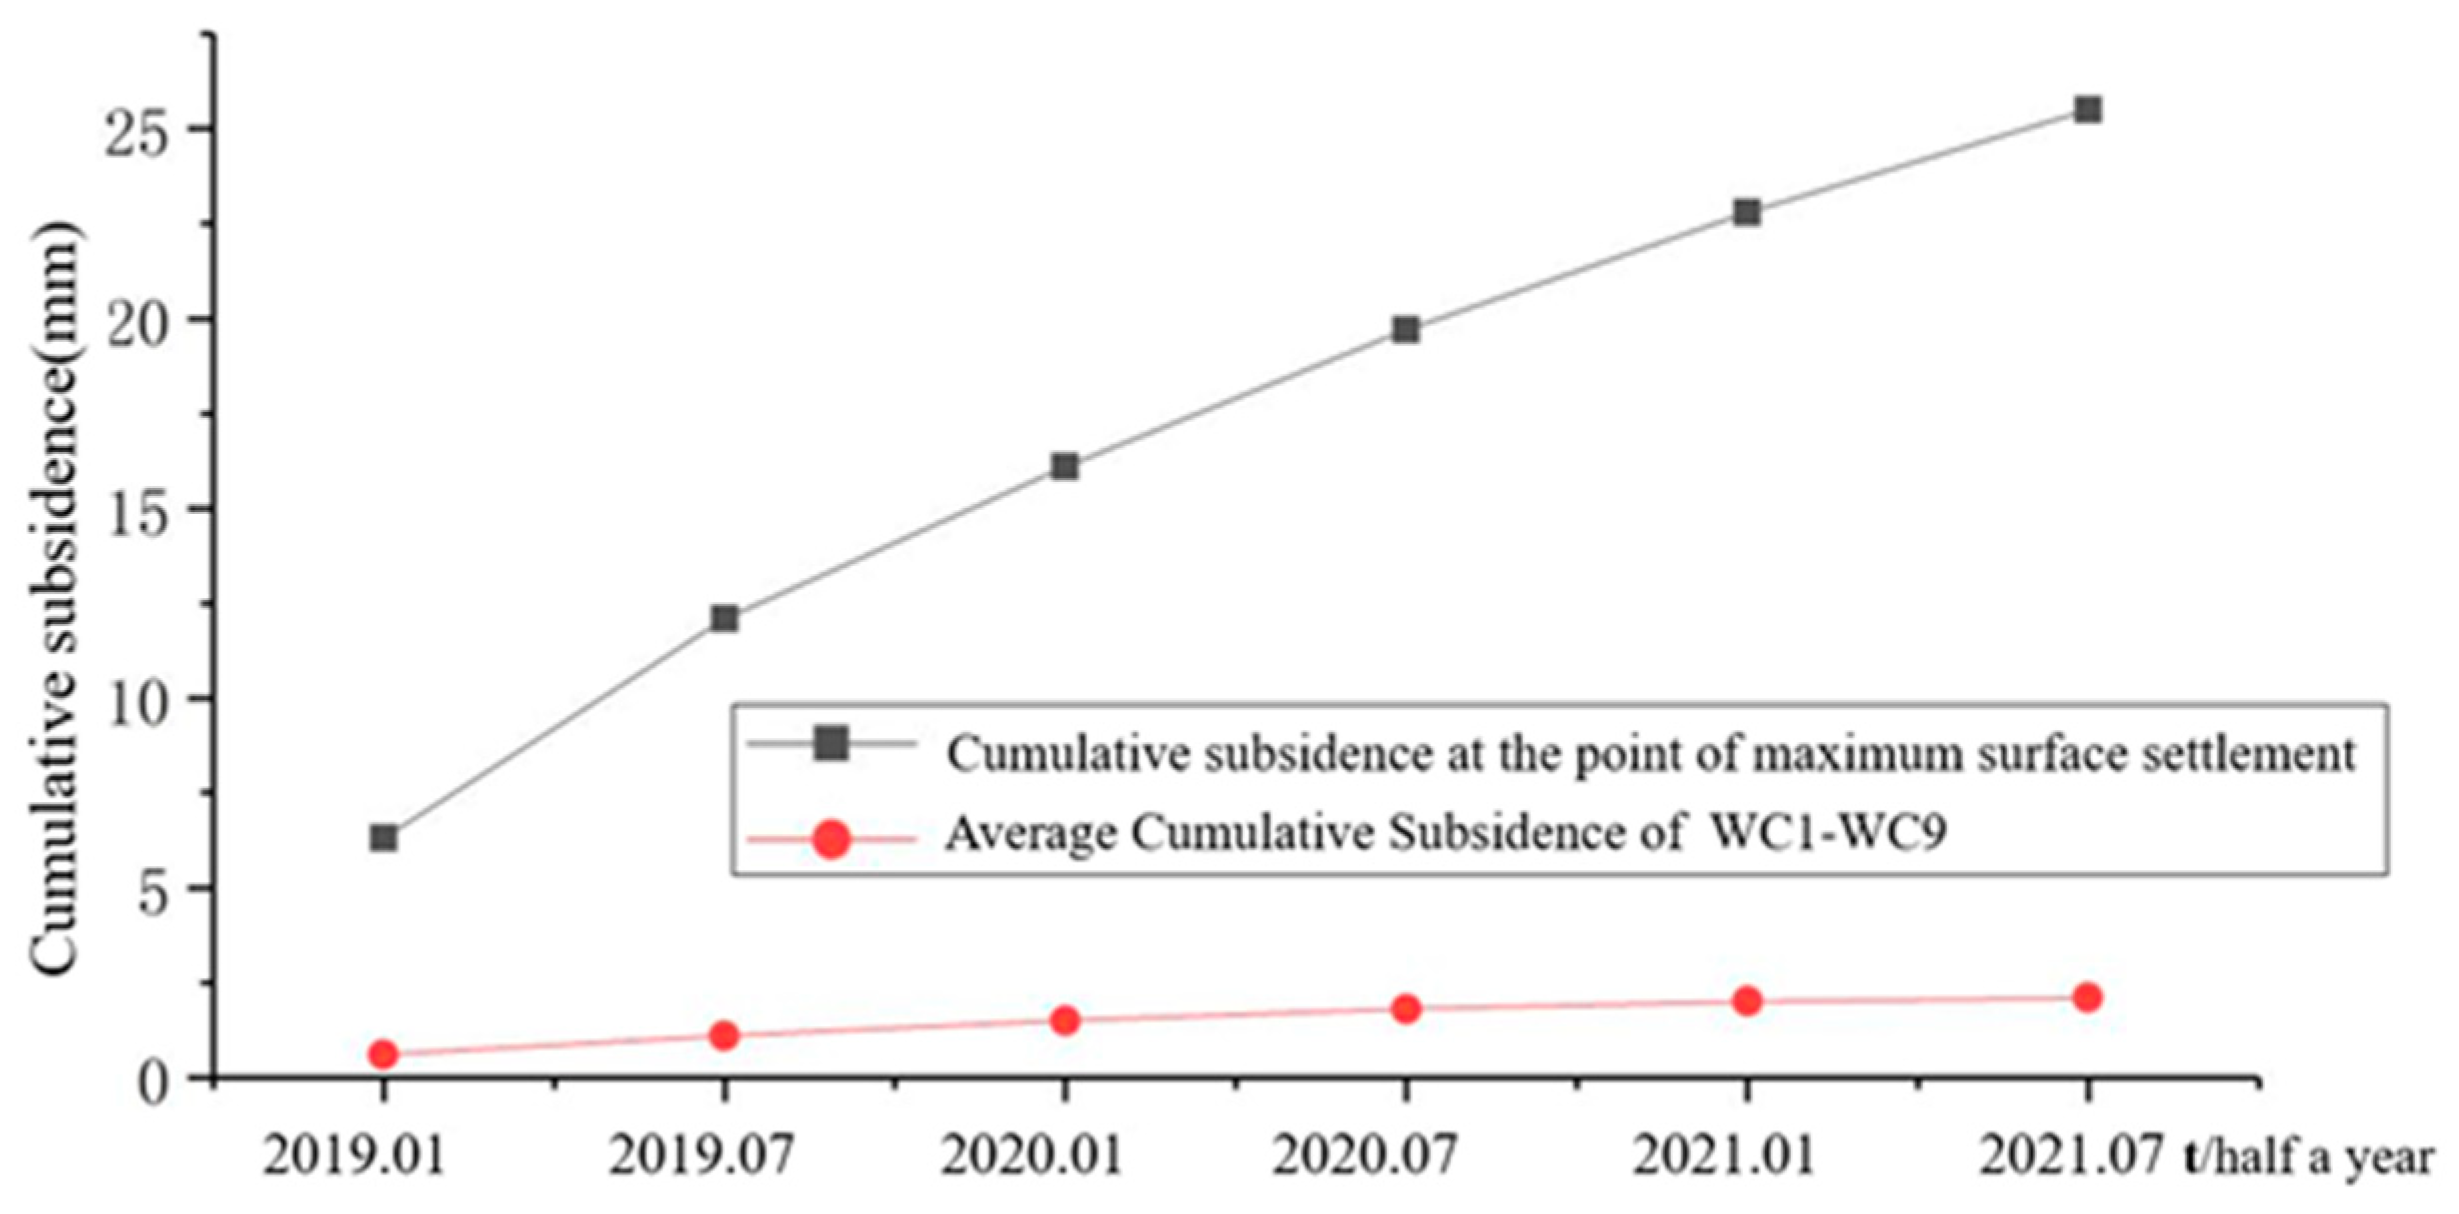
The monthly average maximum subsidence rate, maximum subsidence, and subsidence rate at WC1–WC9 for each half-year period from February 2018 to July 2021 are illustrated in Figure 9, Figure 10 and Figure 11.
As indicated in Figure 9, Figure 10 and Figure 11, between August 2018 and July 2021, the maximum subsidence rate for the area decreases from 1.12 mm/month to 0.51 mm/month, and the average subsidence rate of WC1–WC9 decreases from 0.11 mm/month to 0.02 mm/month, showing a decreasing trend. The maximum surface subsidence for the area is reduced from 6.36 mm to 2.8 mm, and the average subsidence of the WC1–WC9 is reduced from 0.63 mm to 0.1 mm. The maximum cumulative surface subsidence for the area is reduced to 25.51 mm, and the average cumulative surface subsidence at the WC1–WC9 is reduced to 2.13 mm. The maximum subsidence rate and the amount of surface subsidence decreased continuously every six months and finally stabilized.
To further verify the accuracy of the improved model, continuous monitoring was conducted on WC1–WC9 and the maximum subsidence monitoring point from August 2018 to July 2021. A comparison of the monitored results with the predicted results is displayed in Figure 12. The root-mean-square error between the predicted and measured values at the maximum subsidence monitoring point is 1.12, and the root-mean-square error between the predicted and measured values at WC1–WC9 is 0.37.
4.3. Analysis of Results
Refining the Knothe-n model has yielded notable advancements in prediction accuracy, reaffirming the efficacy of the enhanced time function in capturing the evolving relationship between surface subsidence and time. The refined Knothe-n model demonstrates superior predictive capabilities, particularly when factoring in the hysteresis effect. By incorporating additional parameters and implementing segmentation techniques on top of the traditional Knothe time function, we have achieved more precise predictions.
Compared to the original Knothe model [12], our segmented Knothe-n model offers enhanced granularity by delineating the subsidence process into three distinct stages. This segmentation allows for tailored expressions for each stage, enabling better alignment with the nuanced patterns observed in subsidence data and thereby improving predictive accuracy. Furthermore, the introduction of additional parameters enables comparability with the segmentation function refined by Bing Zhang et al. [14]. This multi-parameter approach facilitates parameter adjustments to accommodate varying geological conditions, enhancing the model’s versatility and applicability across different scenarios.
Despite these advancements, it is crucial to acknowledge the limitations of the segmented Knothe-n model. Effective determination of added parameters may necessitate extensive field data, the quality of which directly impacts the accuracy of predictions. Additionally, in cases where the mechanism of ground subsidence is exceptionally complex, a single model may struggle to fully encapsulate all pertinent physical processes.
In conclusion, the refined segmented Knothe-n model represents a significant step forward in subsidence prediction, offering improved accuracy while maintaining practical simplicity. However, ongoing refinement and validation efforts will be necessary to address the inherent complexities and limitations inherent in modeling ground subsidence phenomena.
5. Conclusions
By enhancing the classical Knothe time model with segmental processing, we have refined the Knothe-n time function model, resulting in a simple yet effective approach for predicting hysteresis settlement. Utilizing measured data, relevant parameters, and the intrinsic model of the subsidence area, we conducted numerical simulations in FLAC3D, yielding a wealth of validation data. Remarkably, the numerical simulation results align closely with those of the improved model, offering a promising avenue for future model validation methodologies. Using the coal mining subsidence area of Yutianbao as a case study, we applied the improved model to predict subsidence in the mining area. The root-mean-square error between the predicted and measured values of maximum subsidence at later stages was found to be 1.14, while the root-mean-square error between the average predicted and measured values of monitoring points WC1–WC9 was 0.38. These results affirm the accuracy and practicality of the refined Knothe-n time function model.
Moving forward, it is imperative to further validate the application of the improved Knothe-n model across diverse geological conditions and engineering scenarios. This validation process can benefit from the development of automated parameter estimation techniques, mitigating the influence of human factors on model predictions. Additionally, integrating the improved Knothe-n model with other types of models, such as mechanical models or artificial intelligence models, holds the potential for leveraging the strengths of various approaches to enhance predictive capabilities.
Author Contributions
Monitoring, Data Acquisition, and Methods, J.D.; Methods, Analysis, and Writing, C.T.; Visualization and Writing, X.L. Aids in numerical simulation calculations and thesis revisions, Y.D. All authors have read and agreed to the published version of the manuscript.
Funding
This research was supported in part by the 2021 Open Research Fund of Hubei Key Laboratory of Disaster Prevention and Mitigation, China Three Gorges University, Project Code: 2021KJ07; and in part by the Open Research Fund of Engineering Research Center of Catastrophic Prophylaxis and Treatment of Road and Traffic Safety of Ministry of Education, Changsha University of Science and Technology, Project Code: kfj180404.
Institutional Review Board Statement
Not applicable.
Informed Consent Statement
Not applicable.
Data Availability Statement
Data are contained within the article.
Acknowledgments
This research was supported by the College of Architecture and Civil Engineering, Chengdu University.
Conflicts of Interest
The authors declare no conflicts of interest.
References
- Sun, Y.; Zuo, J.; Karakus, M.; Wang, J. Investigation of movement and damage of integral overburden during shallow coal seam mining. Int. J. Rock Mech. Min. Sci. 2019, 117, 63–75. [Google Scholar] [CrossRef]
- Salmi, E.F.; Nazem, M.; Karakus, M. The effect of rock mass gradual deterioration on the mechanism of post-mining subsidence over shallow abandoned coal mines. Int. J. Rock Mech. Min. Sci. 2017, 91, 59–71. [Google Scholar] [CrossRef]
- Hu, Q.F.; Cui, X.M.; Yuan, D.P.; Deng, X.B. Analysis of the formation mechanism and hazards of surface cracks in thick coal seam mining. J. Min. Saf. Eng. 2012, 29, 864–869. [Google Scholar]
- Guo, G.L.; Wang, Y.H.; Ma, Z.G. A new approach to effective control of coal mine subsidence. J. China Univ. Min. Technol. 2004, 2, 6–29. [Google Scholar]
- Can, E.; Mekik, Ç.; Kuşcu, Ş.; Akçın, H. Monitoring deformations on engineering structures in Kozlu Hard Coal Basin. Nat. Hazards 2013, 65, 2311–2330. [Google Scholar] [CrossRef]
- Chen, Q.F.; Niu, W.J.; Liu, Y.Z. Improvement of Knothe model and analysis of dynamic process of rock movement in fill mining. J. China Univ. Min. Technol. 2017, 46, 250–256. [Google Scholar]
- Yang, L.; Dai, H.Y. Reflections on the calculation method of coal mining subsidence in China. Coal Min. 2016, 21, 7–9+102. [Google Scholar]
- Gonzalez-Nicieza, C.; Alvarez-Fernandez, M.I.; Menendez-Diaz, A.; Alvarez-Vigil, A.E. The influence of time on subsidence in the Central Asturian Coalfield. Bull. Eng. Geol. Environ. 2007, 66, 319–329. [Google Scholar] [CrossRef]
- Yu, Q.G.; Zhang, H.X.; Deng, W.N. Research on dynamic surface subsidence model based on Boltzmann function. Coal Min. 2017, 22, 52–54+44. [Google Scholar]
- Wang, X.H.; Hu, H.F.; Lian, X.G. Dynamic subsidence prediction based on Weibull time series function and negative exponential method. Met. Min. 2015, 8, 158–162. [Google Scholar]
- Xu, H.Z.; Li, X.H. Surface subsidence time function based on logistic growth model. Geotech. Mech. 2005, 26 (S1), 151–153. [Google Scholar]
- Knothe, S. Time influence on formation of a subsidence surface. Arch. Gor. I Hut. 1952, 1, 1. (In Polish) [Google Scholar]
- Chang, Z.Q.; Wang, J.Z. A study on the subsidence time function of the surface point—Improved Knott’s time function. J. Rock Mech. Eng. 2003, 9, 1496–1499. [Google Scholar]
- Zhang, B.; Cui, X.M. Optimization of segmented Knothe time function model for dynamic prediction of mining subsidence. Geotech. Mech. 2017, 38, 541–548+556. [Google Scholar]
- Zhang, B.; Cui, X.M.; Zhao, Y.L.; Li, C.Y. Optimized segmented Knothe time function parameterization method. J. Coal 2018, 43, 3379–3386. [Google Scholar]
- Miao, W.; An, S.K.; Xu, Y.F.; Xue, B.; Zhao, D.R.; Li, H. Optimization and application of mining subsidence prediction model with segmented Knothe time function[J/OL]. Met. Min. 2024, 1–9. [Google Scholar]
- Liu, Y.C.; Cao, S.G.; Liu, Y.B. Improved Knothe surface subsidence time function model. Surv. Mapp. Sci. 2009, 34, 16–17+31. [Google Scholar]
- Zhang, X.R.; Liu, Y.C. Knothe time function and its application in dynamic surface subsidence. Geol. Mapp. 2012, 28, 14–16+20. [Google Scholar]
- Jin, Y.T.; Hu, H.F.; Cai, Y.F. Research on the parameters of SBAS-InSAR mine subsidence monitoring and dynamic prediction model. Coal Technol. 2023, 42, 30–34. [Google Scholar]
- Zhang, L.L.; Cheng, H.; Yao, Z.S.; Wang, X.J. Improvement of Knothe surface dynamic settlement prediction model and its parameter analysis. J. Geotech. Eng. 2023, 45, 1036–1044. [Google Scholar]
- Wang, B.; Xu, J.; Xuan, D. Time function model of dynamic surface subsidence assessment of grout-injected overburden of a coal mine. Int. J. Rock Mech. Min. Sci. 2018, 104, 1–8. [Google Scholar] [CrossRef]
- Wang, Y.; Zhang, K. Research on time function modeling of dynamic subsidence of mining surface. Coal Min. 2017, 22, 68–70. [Google Scholar]
- Xu, D.M. Application of FLAC3D numerical simulation technology in the characterization of overburden transport and damage. Shandong Coal Sci. Technol. 2013, 1, 73–75. [Google Scholar]
Figure 1.
The geological plan of the Yutianbao mining area.

Figure 2.
Three-dimensional model of the study area and layout of the monitoring profile.

Figure 3.
Displacement nephogram of the overall model after coal mining.

Figure 4.
Stress and displacement nephograms of the monitoring profiles after coal mining.

Figure 5.
Surface subsidence nephograms at different stages.

Figure 6.
Surface subsidence curve for η = 1 × 10⁻⁷ and n = 3.

Figure 7.
Corrected time function curve at η = 1 × 10⁻⁷ and n = 3.

Figure 8.
Comparison of predicted and measured subsidence data at WC1 from July 2015 to July 2018.

Figure 9.
Variation of predicted subsidence rate at WC1–WC9 from August 2018 to July 2021.

Figure 10.
Variation of predicted surface subsidence at WC1–WC9 from August 2018 to July 2021.

Figure 11.
Cumulative predicted surface subsidence at WC1–WC9 from August 2018 to July 2021.

Figure 12.
Predicted vs. measured cumulative surface subsidence at monitoring points from August 2018 to July 2021.
Figure 12.
Predicted vs. measured cumulative surface subsidence at monitoring points from August 2018 to July 2021.


Table 1.
List of stratigraphic lithologic parameters.
| Types of Rock | Density ρ (g/cm3) | Elastic Modulus E (MPa) | Poisson’s Ratio v | Bulk Modulus K (MPa) | Shear Modulus G (MPa) | Cohesion c (MPa) | Friction Angle φ (°) | Tensile Strength T (MPa) |
|---|---|---|---|---|---|---|---|---|
| Shale | 2.6 | 23,500 | 0.28 | 17,803.00 | 9179.69 | 15.0 | 42 | 5.0 |
| Coal Seam | 1.3 | 5000 | 0.32 | 4629.63 | 1893.93 | 1.8 | 30 | 0.1 |
| Mudstone | 2.5 | 14,000 | 0.29 | 11,111.11 | 5426.36 | 3.2 | 37 | 1.2 |
Table 2.
Monitored surface subsidence data at WC1–WC9 from February 2018 to July 2018 (mm).
| Date Monitoring Point | February | March | April | May | June | July |
|---|---|---|---|---|---|---|
| WC1 | −16.4 | −16.5 | −16.7 | −16.8 | −17 | −17 |
| WC2 | −17.5 | −17.8 | −18 | −18 | −18 | −18.1 |
| WC3 | −16.4 | −16.6 | −16.7 | −17 | −17 | −17 |
| WC4 | −16.8 | −17.2 | −17.5 | −17.6 | −17.7 | −18 |
| WC5 | −15.9 | −16 | −16.4 | −16.4 | −16.7 | −16.9 |
| WC6 | −16.5 | −16.6 | −17.1 | −17.2 | −17.4 | −17.5 |
| WC7 | −17.3 | −17.3 | −17.4 | −17.7 | −18 | −18.3 |
| WC8 | −17.1 | −17.2 | −17.2 | −17.3 | −17.4 | −17.6 |
| WC9 | −16.3 | −16.5 | −16.6 | −16.8 | −16.8 | −17.1 |
| Average value | −16.7 | −16.9 | −17.1 | −17.2 | −17.3 | −17.54 |
Table 3.
Maximum Settlement Comparison Table.
| Date | Model Calculation Results (mm) | Subsidence Rate (mm/month) | Numerical Simulation Results (mm) | Subsidence Rate (mm/month) | Error Ratio |
|---|---|---|---|---|---|
| July 2015– July 2018 | 75.5 | 2.12 | 78.2 | 2.17 | 3.4% |
| February 2018– July 2018 | 8.56 | 1.4 | 8.8 | 1.5 | 2.7% |
Table 4.
Comparison table for WC1–WC9 average settlement.
| Date | Model Calculation Results (mm) | Subsidence Rate (mm/month) | Monitoring of Subsidence Data (mm) | Subsidence Rate (mm/month) | Error Ratio |
|---|---|---|---|---|---|
| July 2015– July 2018 | 18.09 | 0.47 | 17.5 | 0.49 | 3.2% |
| February 2018– July 2018 | 0.79 | 0.13 | 0.84 | 0.14 | 5.9% |
Disclaimer/Publisher’s Note: The statements, opinions and data contained in all publications are solely those of the individual author(s) and contributor(s) and not of MDPI and/or the editor(s). MDPI and/or the editor(s) disclaim responsibility for any injury to people or property resulting from any ideas, methods, instructions or products referred to in the content. |
© 2024 by the authors. Licensee MDPI, Basel, Switzerland. This article is an open access article distributed under the terms and conditions of the Creative Commons Attribution (CC BY) license (https://creativecommons.org/licenses/by/4.0/).
Share and Cite
MDPI and ACS Style
Dong, J.; Tang, C.; Liu, X.; Dong, Y. Prediction of Delayed Surface Subsidence Based on the Improved Knothe-n Model. Appl. Sci. 2024, 14, 3742. https://doi.org/10.3390/app14093742
AMA Style
Dong J, Tang C, Liu X, Dong Y. Prediction of Delayed Surface Subsidence Based on the Improved Knothe-n Model. Applied Sciences. 2024; 14(9):3742. https://doi.org/10.3390/app14093742
Chicago/Turabian StyleDong, Jianhui, Chengqian Tang, Xiao Liu, and Yangdan Dong. 2024. "Prediction of Delayed Surface Subsidence Based on the Improved Knothe-n Model" Applied Sciences 14, no. 9: 3742. https://doi.org/10.3390/app14093742
Note that from the first issue of 2016, this journal uses article numbers instead of page numbers. See further details here.