1. Introduction
In recent years, many countries around the world have been concentrating on the development of green energy. Human power generation systems, which are CO
2 emission free, inexhaustible and the cleanest of all green energy, have become a topical subject. The human power generation system considered here consists of a brushless DC motor (BLDCM), a three-phase bridge rectifier and a power converter. The system uses kinetic energy to drive a permanent magnet BLDCM to generate three-phase AC voltage which is rectified by a full-wave rectifier. The DC voltage is transformed and exported by the DC converter which is a boost device [
1,
2,
3,
4,
5] that can be used for the conversion of electrical energy from different permanent magnet BLDCM systems. In a human power generation system uneven manual pedaling may result in unstable power output. All generators have different nonlinear P-V characteristic curves at different rotation speeds, and each of these curves has a best maximum power operating point. No recent studies have been made that have resulted in an effective maximum power point tracking strategy for human power generation systems and currently constant voltage output is assumed.
However, many current studies have been made of maximum power point tracking strategy for other kinds of new energy applications. These include P&O [
6] and Extremum Seeking Control (ESC) [
7] which have the advantage of easy and cheap implementation. However, they are not robust and when a steady state is reached output is likely to be subject to perturbation and oscillation around the maximum power point due to external interference. To remedy perturbation at the maximum power point in a human powered system, we propose SMS for MPPT. The precept being that the maximum power point (MPP) condition of INC in the generator P-V characteristic curve is ∂
P/∂
V=0,and the sliding manifold is defined accordingly. The strategy includes two modes, approaching conditions and sliding conditions. In the approaching condition the system trajectory makes timely and effective contact with the sliding manifold. Sliding conditions confine the system to the sliding manifold and the MPP finally reaches the target point. If the operating point is on the left or right side of MPP, the operating point moves against the MPP, this mode operates the system at the MPP effectively. However, SMS is likely to result in high frequency switching or signal input saturation that introduces high frequency noise. This noise can shorten converter and switch life and many studies have been made that propose solutions, including fuzzy theory [
8] and extension theory [
9]. In this study the extension theory has been applied to effectively avoid the shortcomings of high frequency SMS switching, minimize input saturation, and increase the efficiency of both energy conversion and response time.
2. Equivalent Dynamic Mathematical Model of BLDCM
The human power generation system uses a three-phase BLDCM. The generator equivalent circuit is shown in
Figure 1 [
10]. The Resistance of the Coil is
Rs; the self-Inductance of the Coil and Mutual Inductor of the Coil are
L and
M;
ea,
eb and
ec represent the electromotive reaction of the generator;
ia,
ib and
ic represent the phase current;
va,
vb and
vc are the terminal voltages. The dynamic equation of the three-phase BLDCM is expressed as follows: [
11]
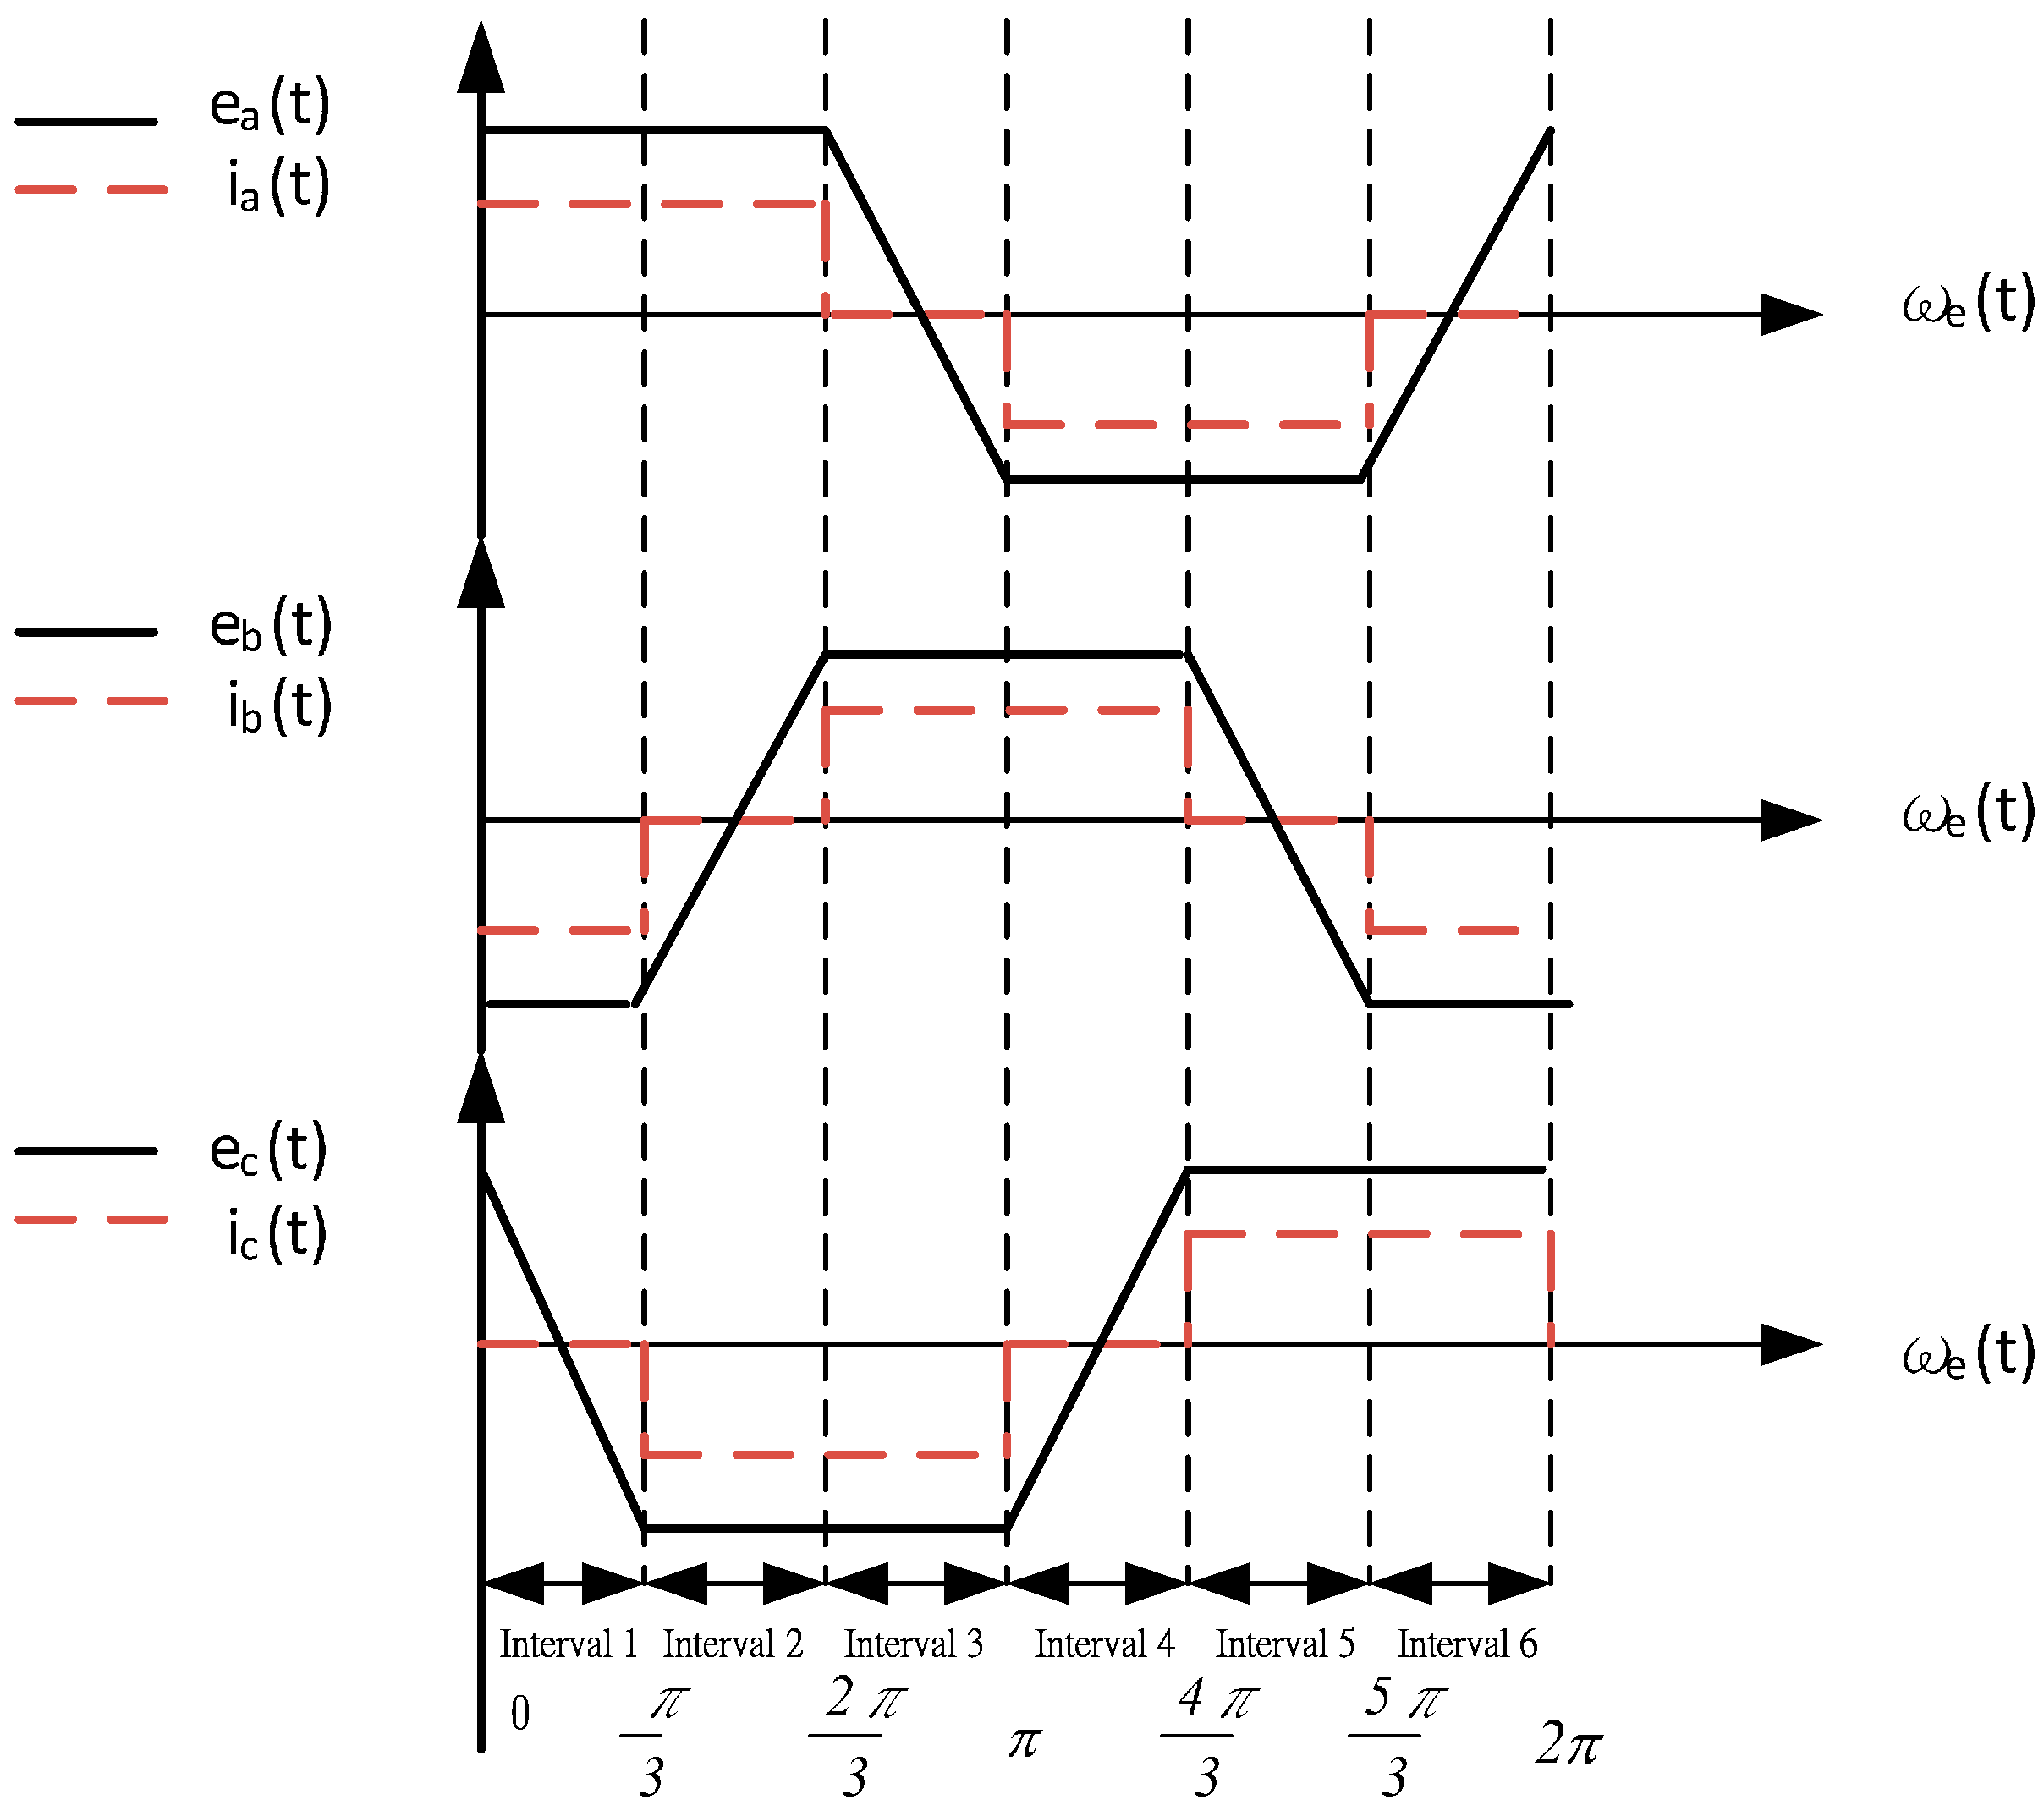
The magnetic flux density distribution of the driven BLDCM in the air gap is a trapezoidal wave as shown in
Figure 2.
Figure 1.
Generator equivalent circuit.
Figure 1.
Generator equivalent circuit.
Figure 2.
Three-phase rectifier circuit waveform timing diagram at fixed DC load.
Figure 2.
Three-phase rectifier circuit waveform timing diagram at fixed DC load.
The three-phase inner electric potential waveform in
Figure 2 can be expressed as Equations (2) to (4), where
is the generator inner electric potential constant;
is the angular-rate of the rotor which is proportional to the mechanical rotation speed and pole of the generator;
is the magnetic flux linkage of the rotator side to stator side. The converter BLDCM power
can be deduced from the three-phase bridge rectifier circuit waveform timing diagram at fixed DC load, expressed as Equation (5).
The relationship between the generator inner electric potential and converter control current is observed, the BLDCM three-phase commutation sequence
,
,
can be defined by Equations (6) to (8) [
12]:
where u(
t) is the unit step function, and n is an integer. The three-phase current distribution is observed, the equivalent DC armature current
of the BLDCM is defined by Equation (9).
The equivalent DC inner electric potential
and transfer power
of the BLDCM can be deduced from Equations (2) to (5) and (9) and (10), expressed as follows:
The equivalent DC dynamics equation of the BLDCM can be obtained by substituting Equations (9) to (12) in Equation (1), and the dynamics equation is expressed by Equation (13).
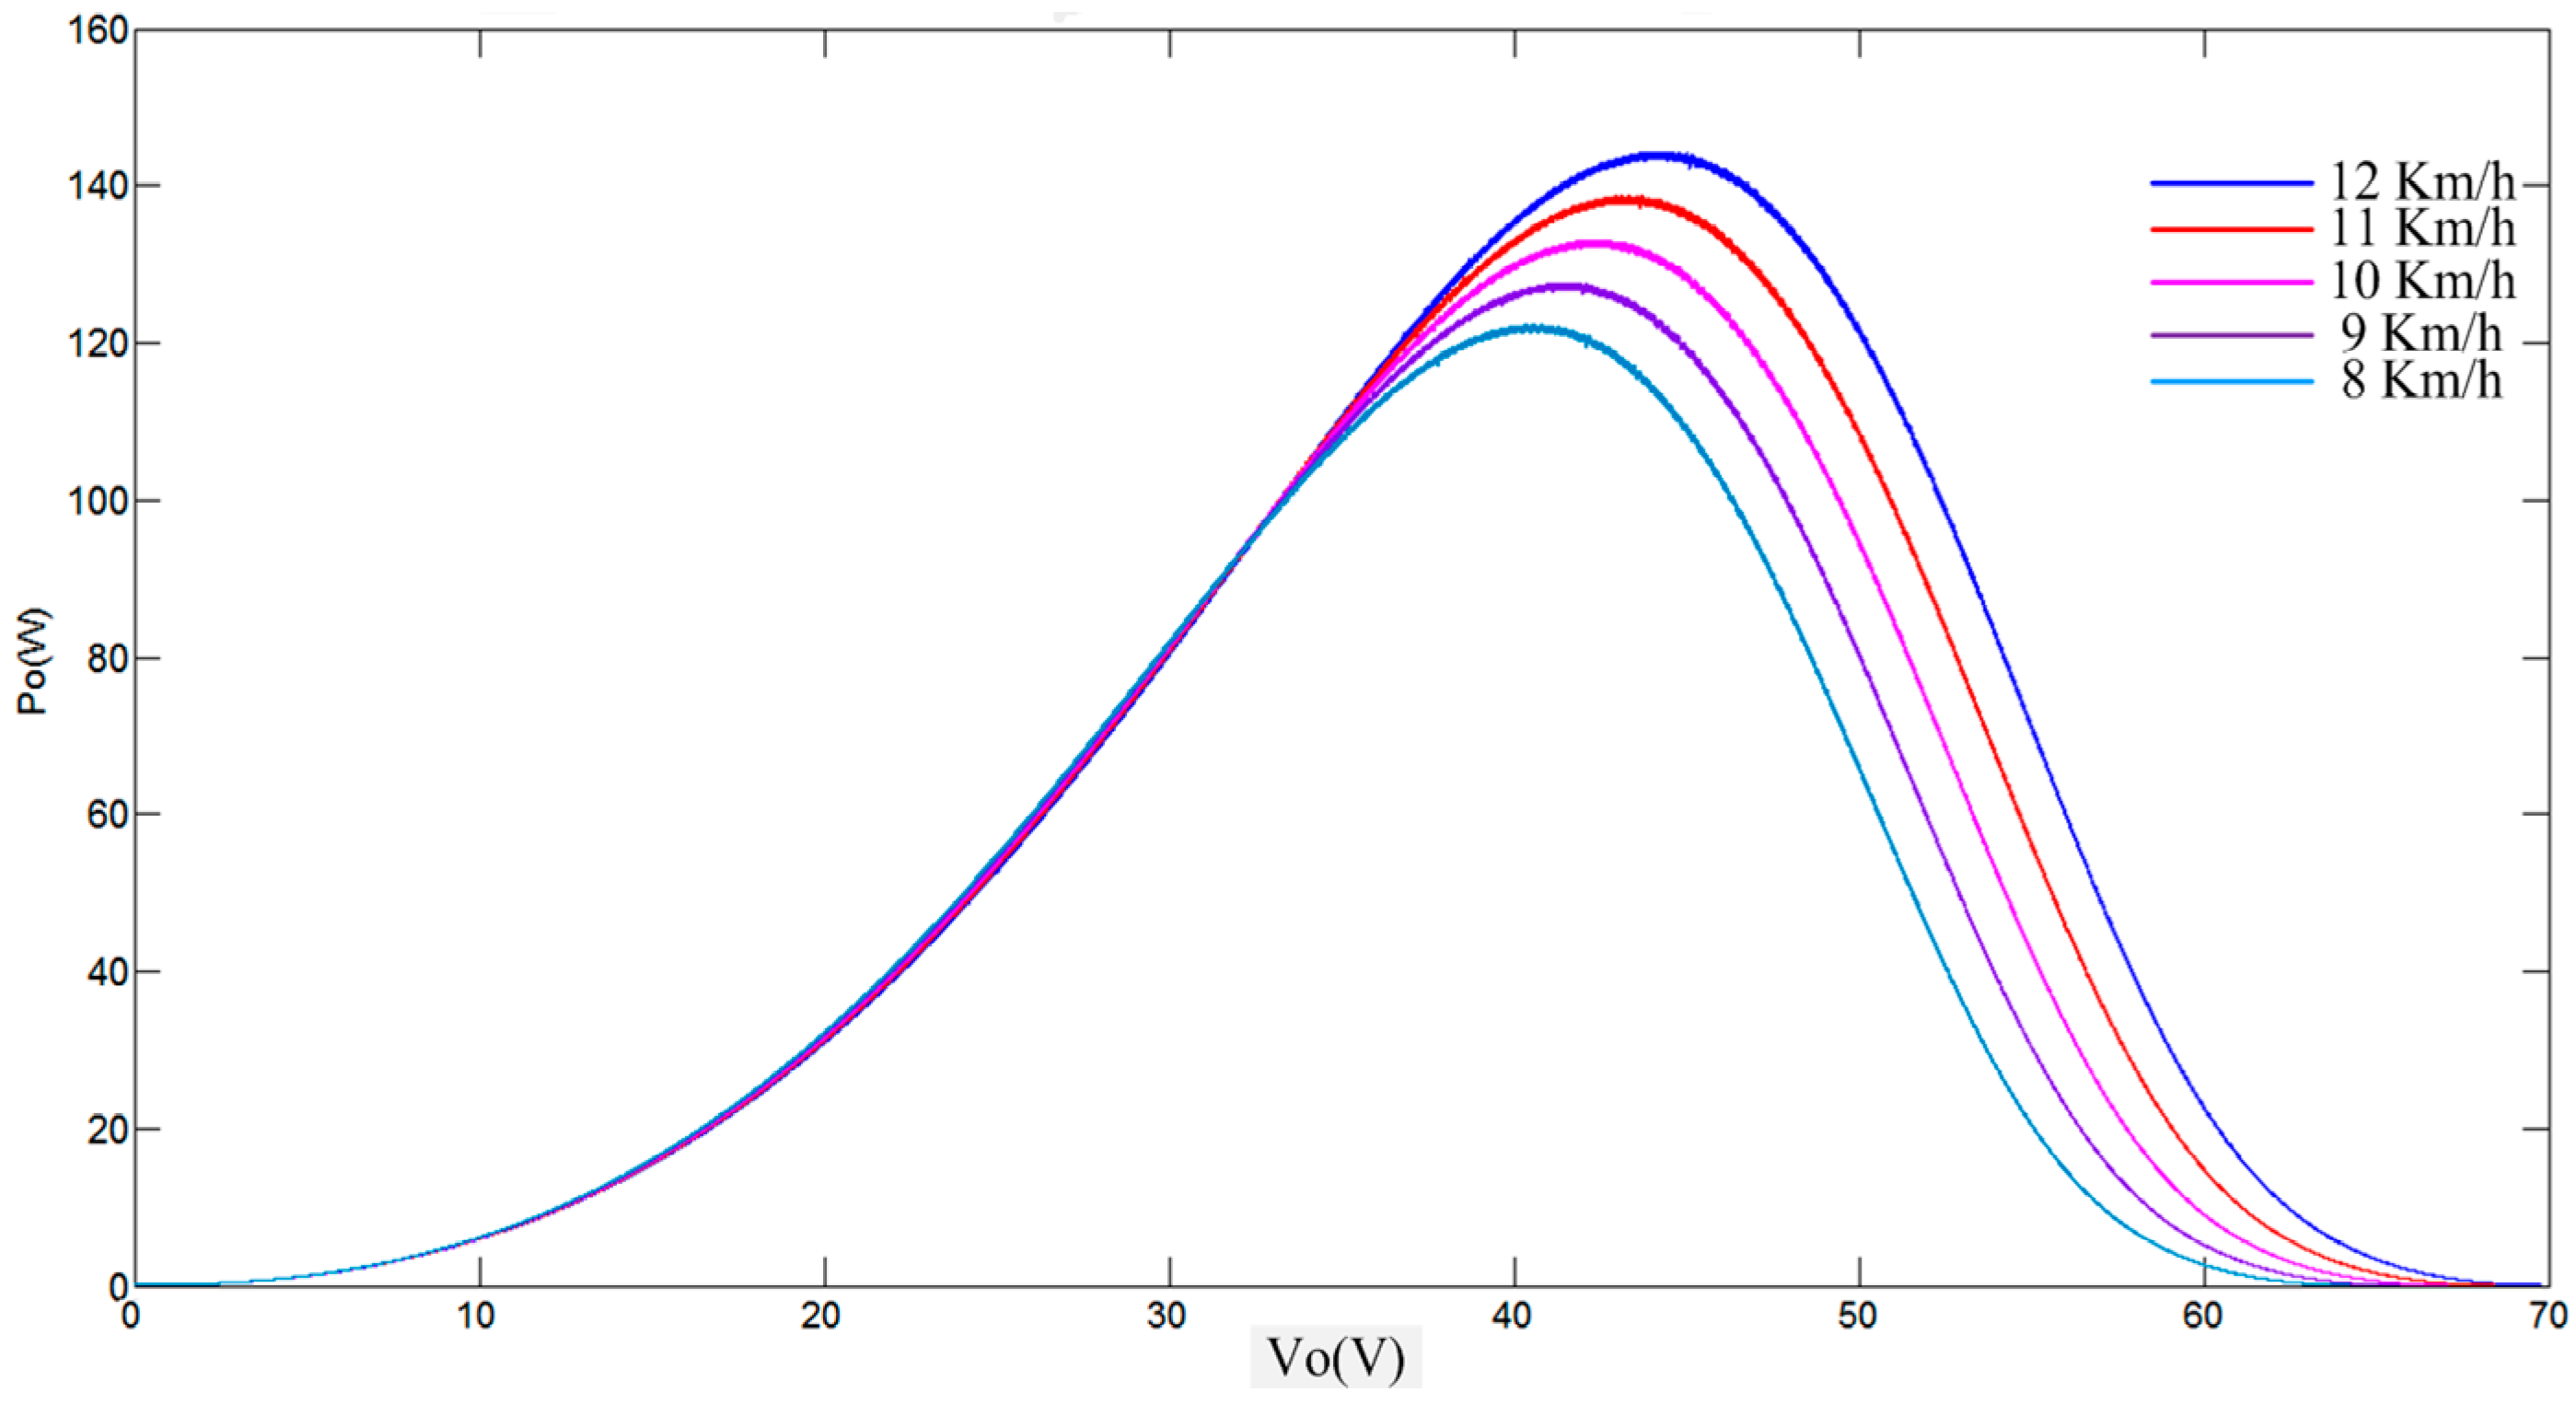
According to the above mathematical model, the human powered generator can be simulated using PSIM, the P-V characteristics curves at different rotation speeds is shown in
Figure 3.
Figure 3.
Characteristics curves of an exercise bike generator.
Figure 3.
Characteristics curves of an exercise bike generator.
As can be seen, the pedal powered exercise bike generates different MPPs at different speeds. The design of a controller to enable operation at MPP at different rotational speeds is a topic of some importance.
3. Boost Converter Design
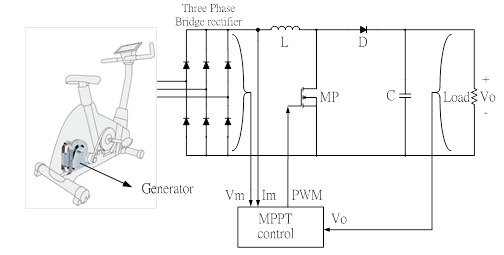
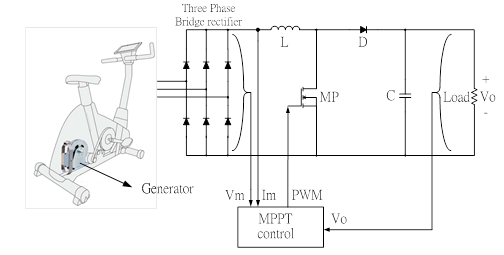
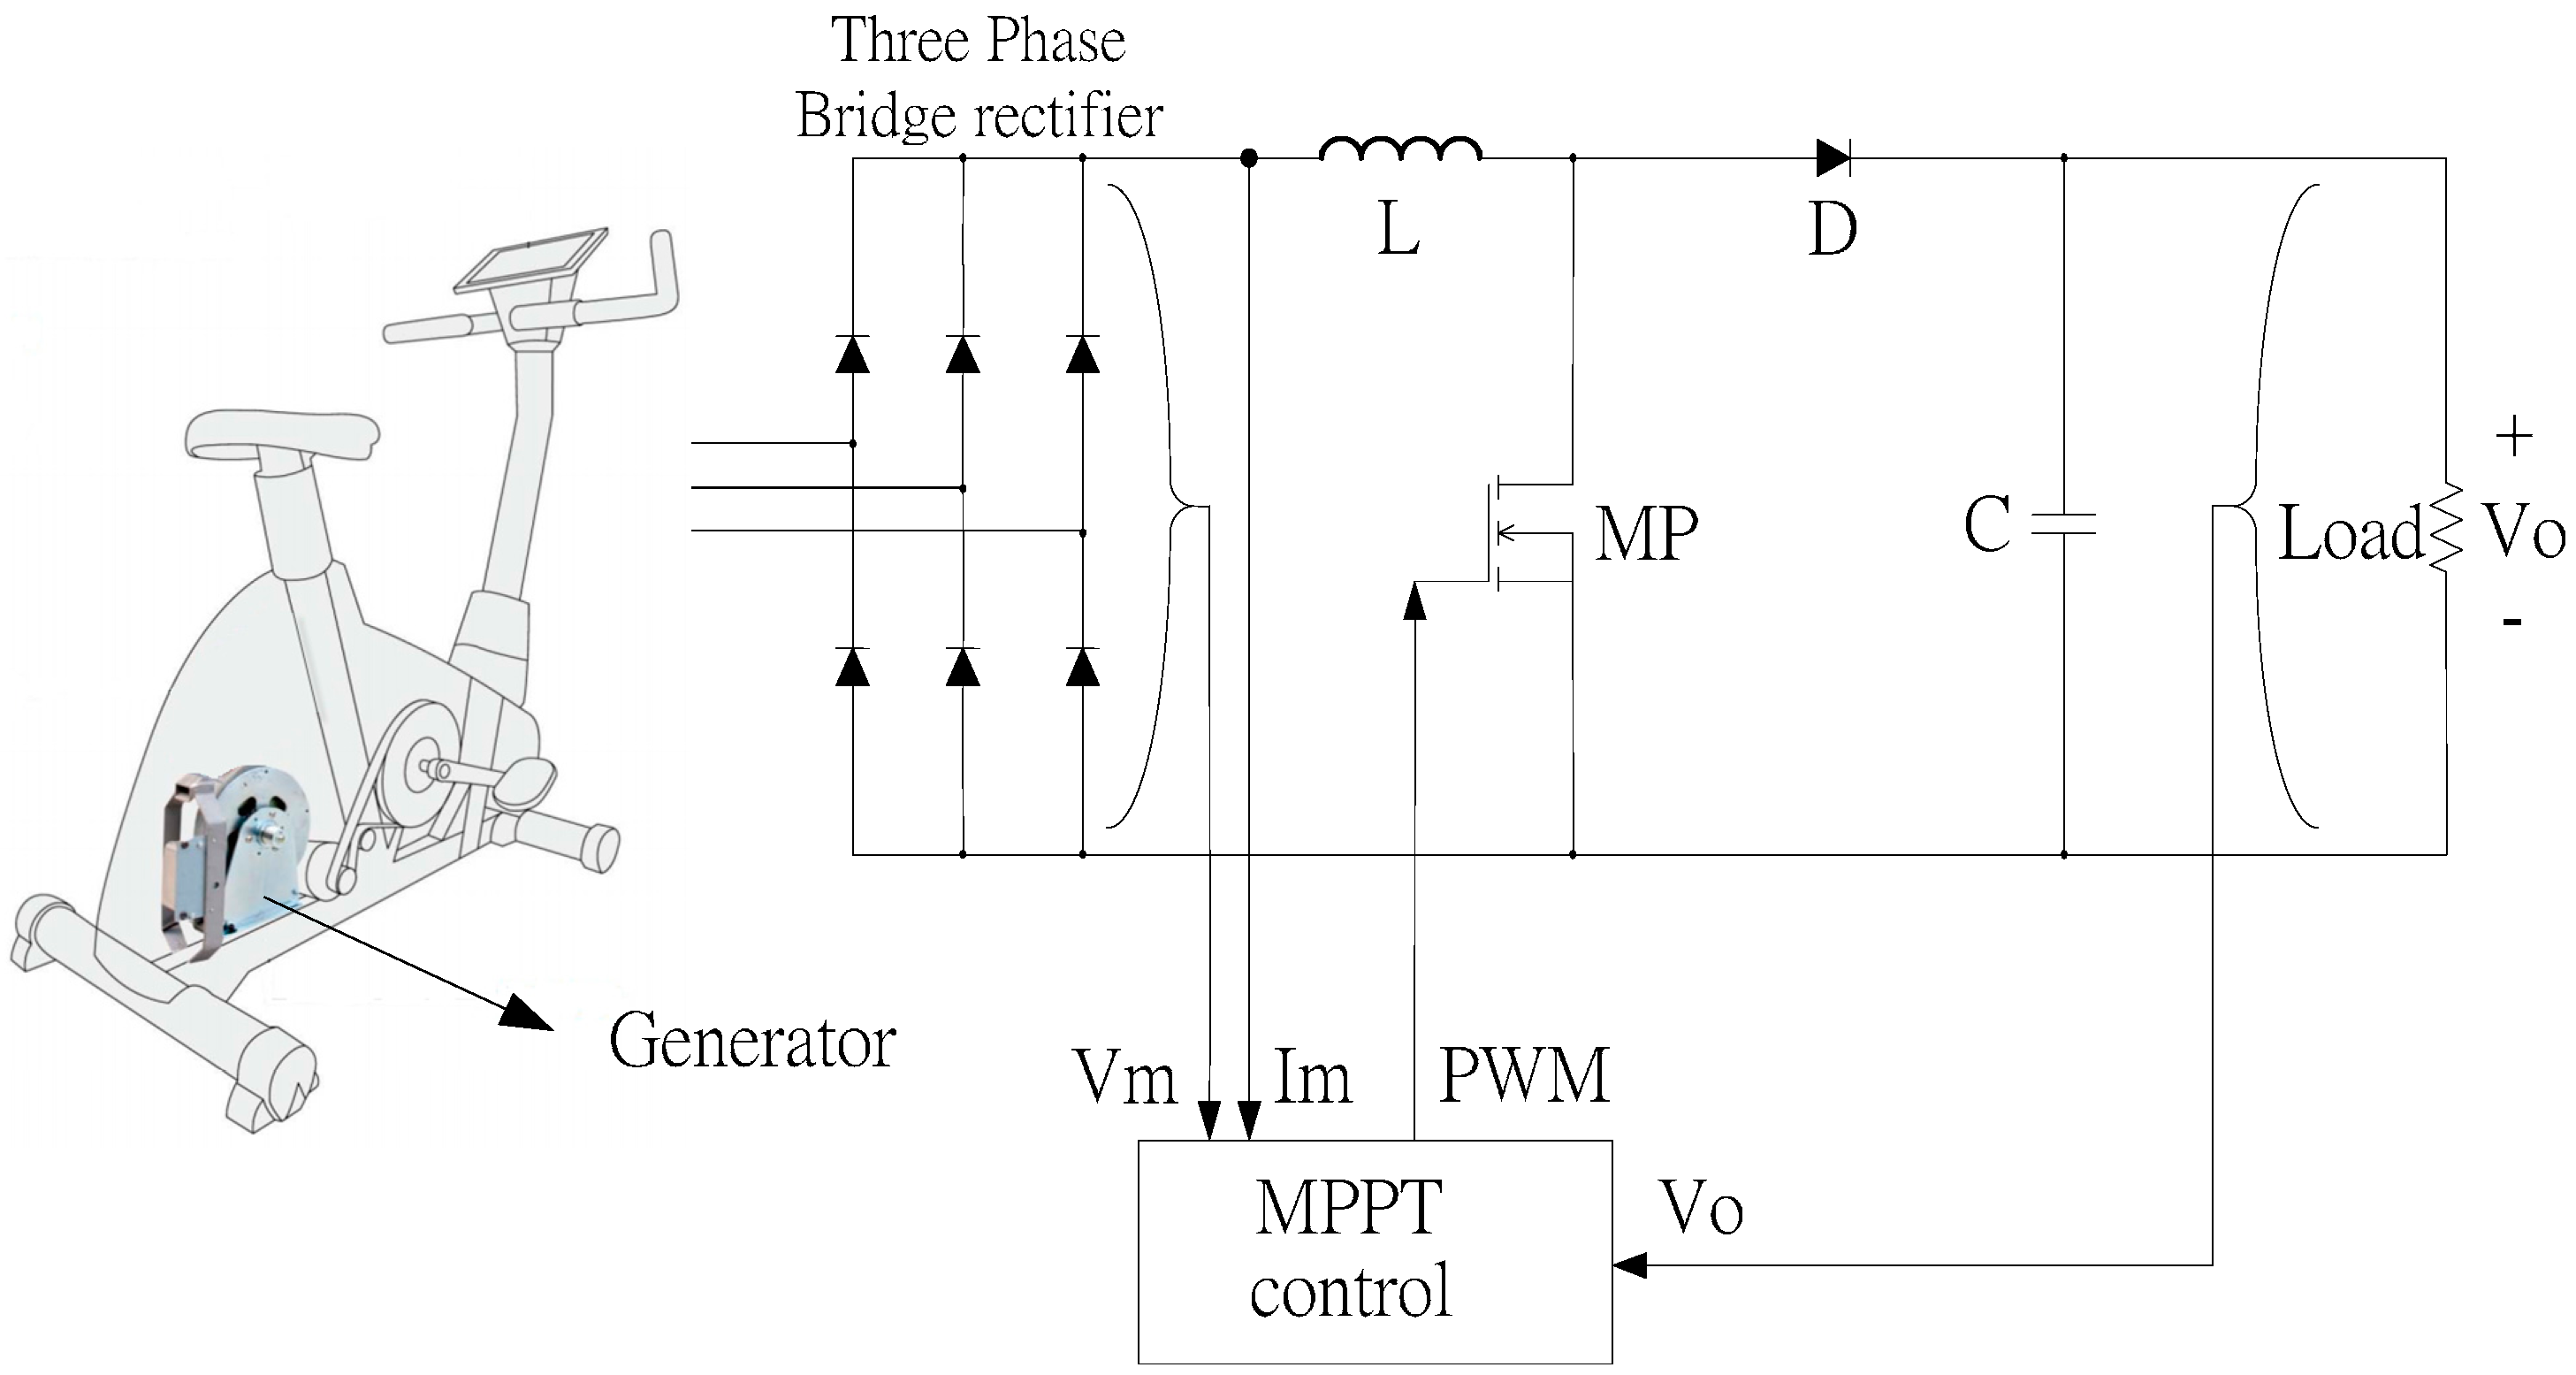
The boost converter of the system consists of an inductance, a capacitor, a diode, and switch components. The human power generation system architecture is shown in
Figure 4. The converter switch employs pulse width modulation (PWM) control to boost the voltage [
13].
Figure 4.
Human power generation system architecture.
Figure 4.
Human power generation system architecture.
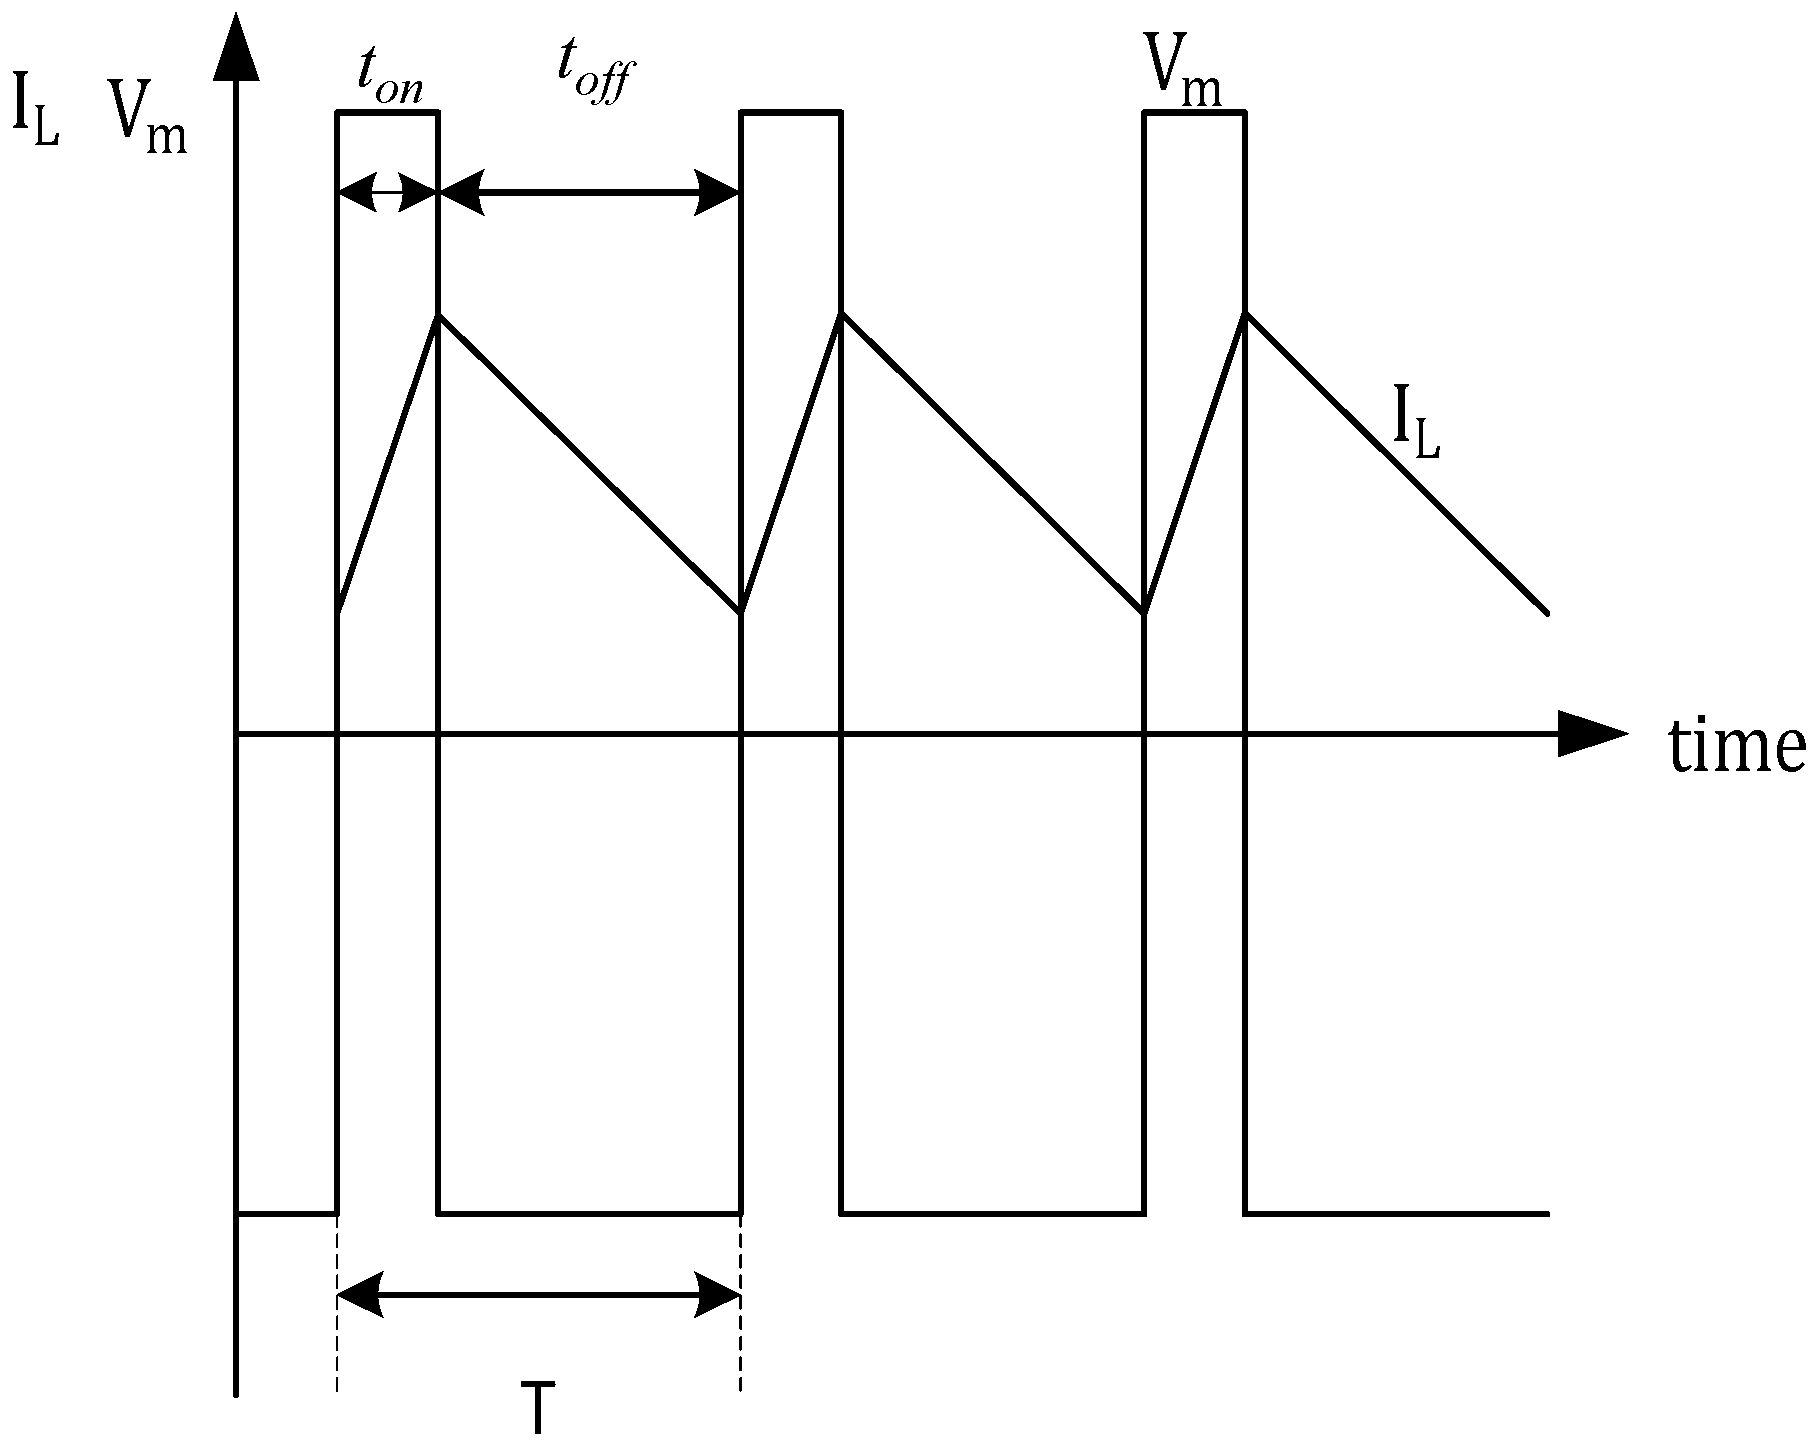
Figure 5 shows the time variation over one cycle, and the switching voltage and inductance current duty cycle ratio. As can be seen in the figure it is assumed that the current is kept constant in the steady state, and the diode and switch have no voltage drop. Therefore, when the switch is on, the terminal voltage is
Vm, with the switch off the terminal voltage is
Vo.
Vm is the input voltage of the generator terminal after three-phase bridge rectification, and
Vm =
Veq. The output voltage is expressed by Equation (14), where
ton is on,
toff is off, and one cycle time is
T = ton + toff, to give Equation (10).
Equation (14) is rearranged to obtain the output voltage and input voltage duty cycle ratio
, expressed by Equation (15).
Figure 5.
Switching voltage and duty cycle.
Figure 5.
Switching voltage and duty cycle.
The boost converter has two states according to the switch MP on the state in
Figure 4.
State 1:
In
Figure 4, when the switch MP is turned on, the diode
D is turned off, and the input voltage flows directly through the inductance
L. The inductance current
IL rises, and the output end depends on capacitor
C which supplies energy to the load. The current
IL flows through the switch to form a loop. The current and voltage Equations (16) and (17) are shown below:
State 2:
When the switch MP is turned off (see
Figure 4), the diode
D is turned on, and the energy stored in the inductance
L is released to the output end. In other words,
IL decreases to zero current, and the switch MP and diode
D then enter the cut-off state. The current and voltage equations are expressed as Equations (18) and (19).
According to Equations (16) to (19), the numerical average rule is substituted in the dynamics Equation (20),
and
are defined and Equations (21) and (22) are obtained. The duty cycle ratio
can be used to control the switch conduction time.
The SMS concept is applied to the design of the duty cycle U to control the switch conduction time, so that the system can generate power at the MPPT at any rotation speed.
4. Controller Design
The sliding mode was first discovered by Russian investigators and has made a significant contribution to the design of multiple system controllers. The first control step [
14,
15], is the designation of the sliding manifold and then a control rule is established that allows the system state to be attracted to the sliding manifold without deviating from it. The system at MPP must satisfy
, and Equation (23) can be obtained [
16].
In Equation (23),
Pm is the input power of the generator after three-phase bridge rectification (
Figure 4),
and
are the input voltage and input current of power generation after rectification. According to Equation (23), the sliding manifold is defined by Equation (24):
When the system is in a sliding condition,
, and the equation is expressed as (25).
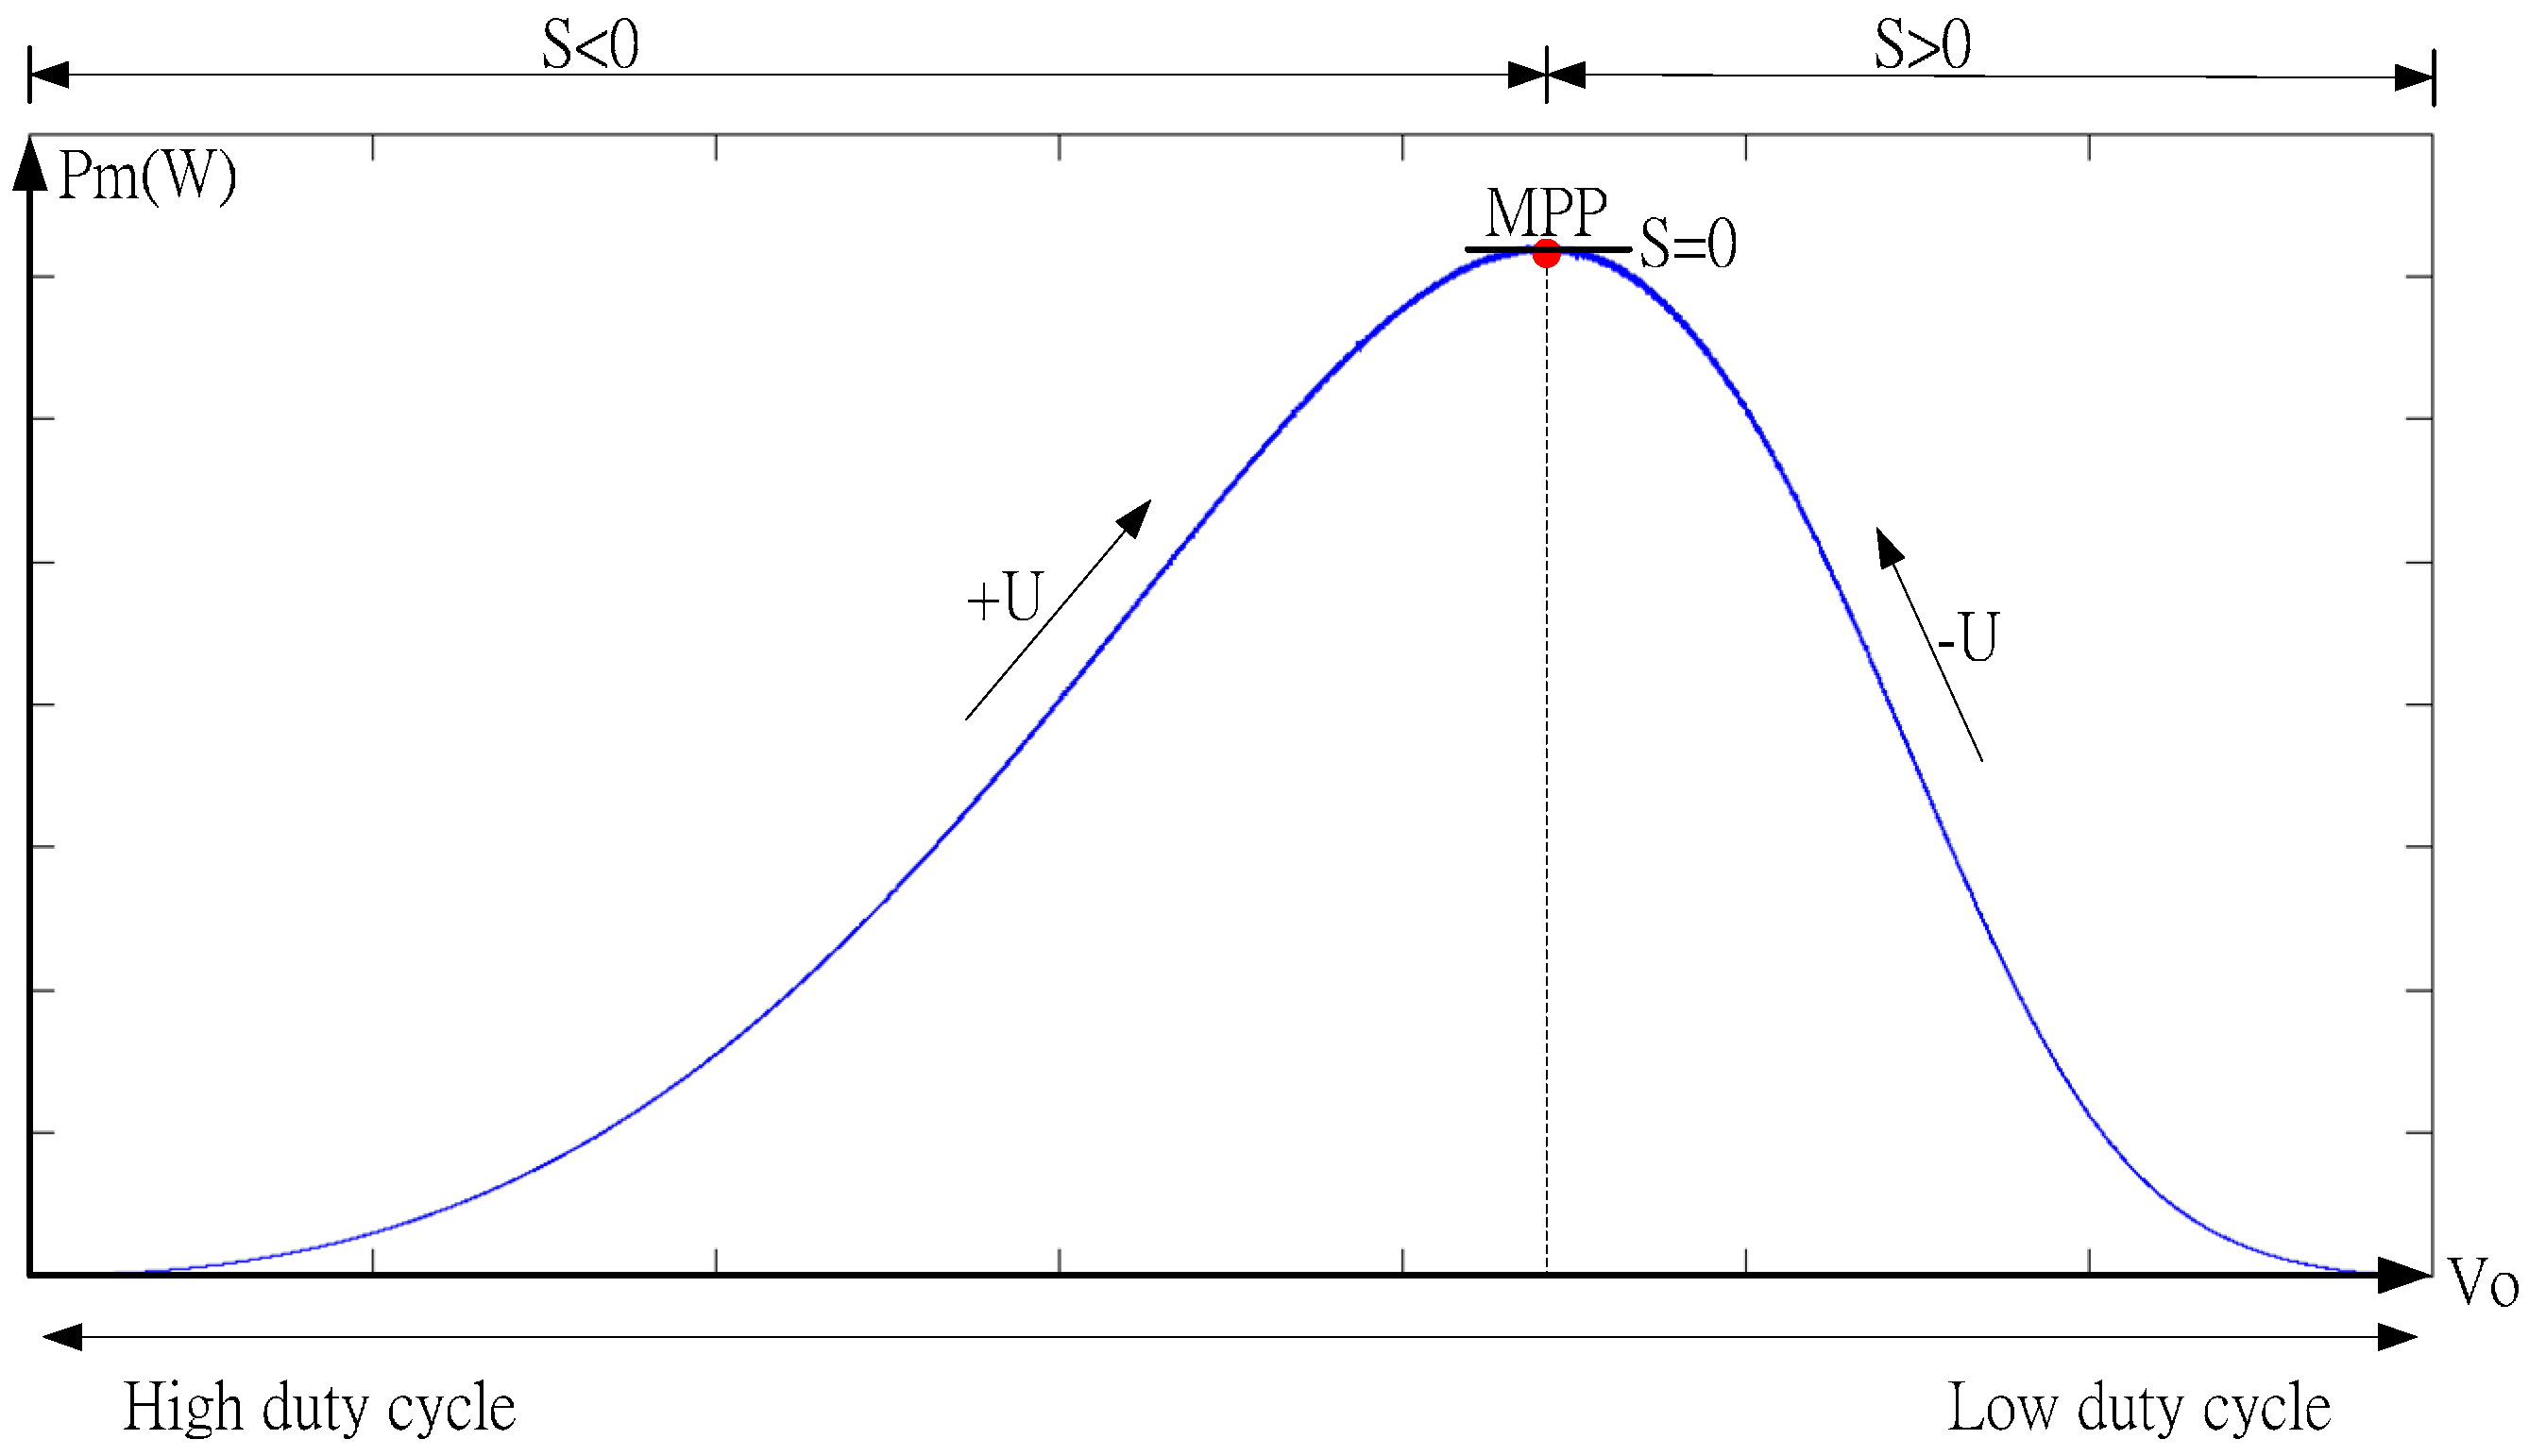
In
Figure 6 it can be seen that the duty cycle ratio and operating voltage of the
S operation mode at MPP are correlated with
. The control switch duty cycle is used to adjust the PWM for MPPT. When the system is in the sliding condition,
, expressed by Equation (26), and the equivalent control
of the sliding manifold is expressed by Equation (27) [
15].
Figure 6.
Duty cycle and operating voltage of MPPT.
Figure 6.
Duty cycle and operating voltage of MPPT.
According to Yau
et al. [
15], the appropriate switchover control law
is selected, in considering the controller saturation effect
, the control law would be as in Equation (28).
According to Chu
et al. and Yao
et al. [
14,
15], the controller (28) enables the system to satisfy Lyapunov theory, expressed by Equation (29), and this proves the stability of SMS and MPPT control of the system.
Also, according to Chu
et al. and Yau
et al. [
14,
15], to avoid the control input
U remaining in a saturated state (
U = 0 or 1) for a long time, or being switched rapidly between two saturation values (which could affect the service life of the switch or cause high frequency switching noise) the value of parameter σ should not be too large,
is recommended. Therefore, intelligent selection of the value of
so the controller will be
is an important factor affecting performance. This will not only prolong component life and avoid faults, but will also reduce high frequency switching noise affecting converter output power
and voltage
. Many recent studies have proposed intelligent theories in renewable energy systems to address this question. For example, Yau
et al. [
16] used fuzzy theory to deal with the MPPT of the controller in a PV Generation System. In this study extension theory [
9,
17] is applied to determine the intelligent selection of parameter σ to reduce the amount of high frequency switching and high frequency noise in the MPP steady state. A flow chart for such a scheme is shown in
Figure 7.
Figure 7.
Extension Sliding Mode Control Flowchart of this scheme.
Figure 7.
Extension Sliding Mode Control Flowchart of this scheme.
5. Simulation and Experimental Results
PSIM was used to simulate three control modes, P&O, SMS, and ESMS, to observe the generator characteristics (and prepare the curves) of the maximum power output of the bike power generation system used in this study.
Figure 8 shows the characteristic relationship between converter output power Po and output voltage Vo at different speeds.
Figure 9a–c show the P&O, SMS, and ESMS converter output power Po and output voltage waveform Vo, at speeds of 7.5Km/H and 12Km/H.
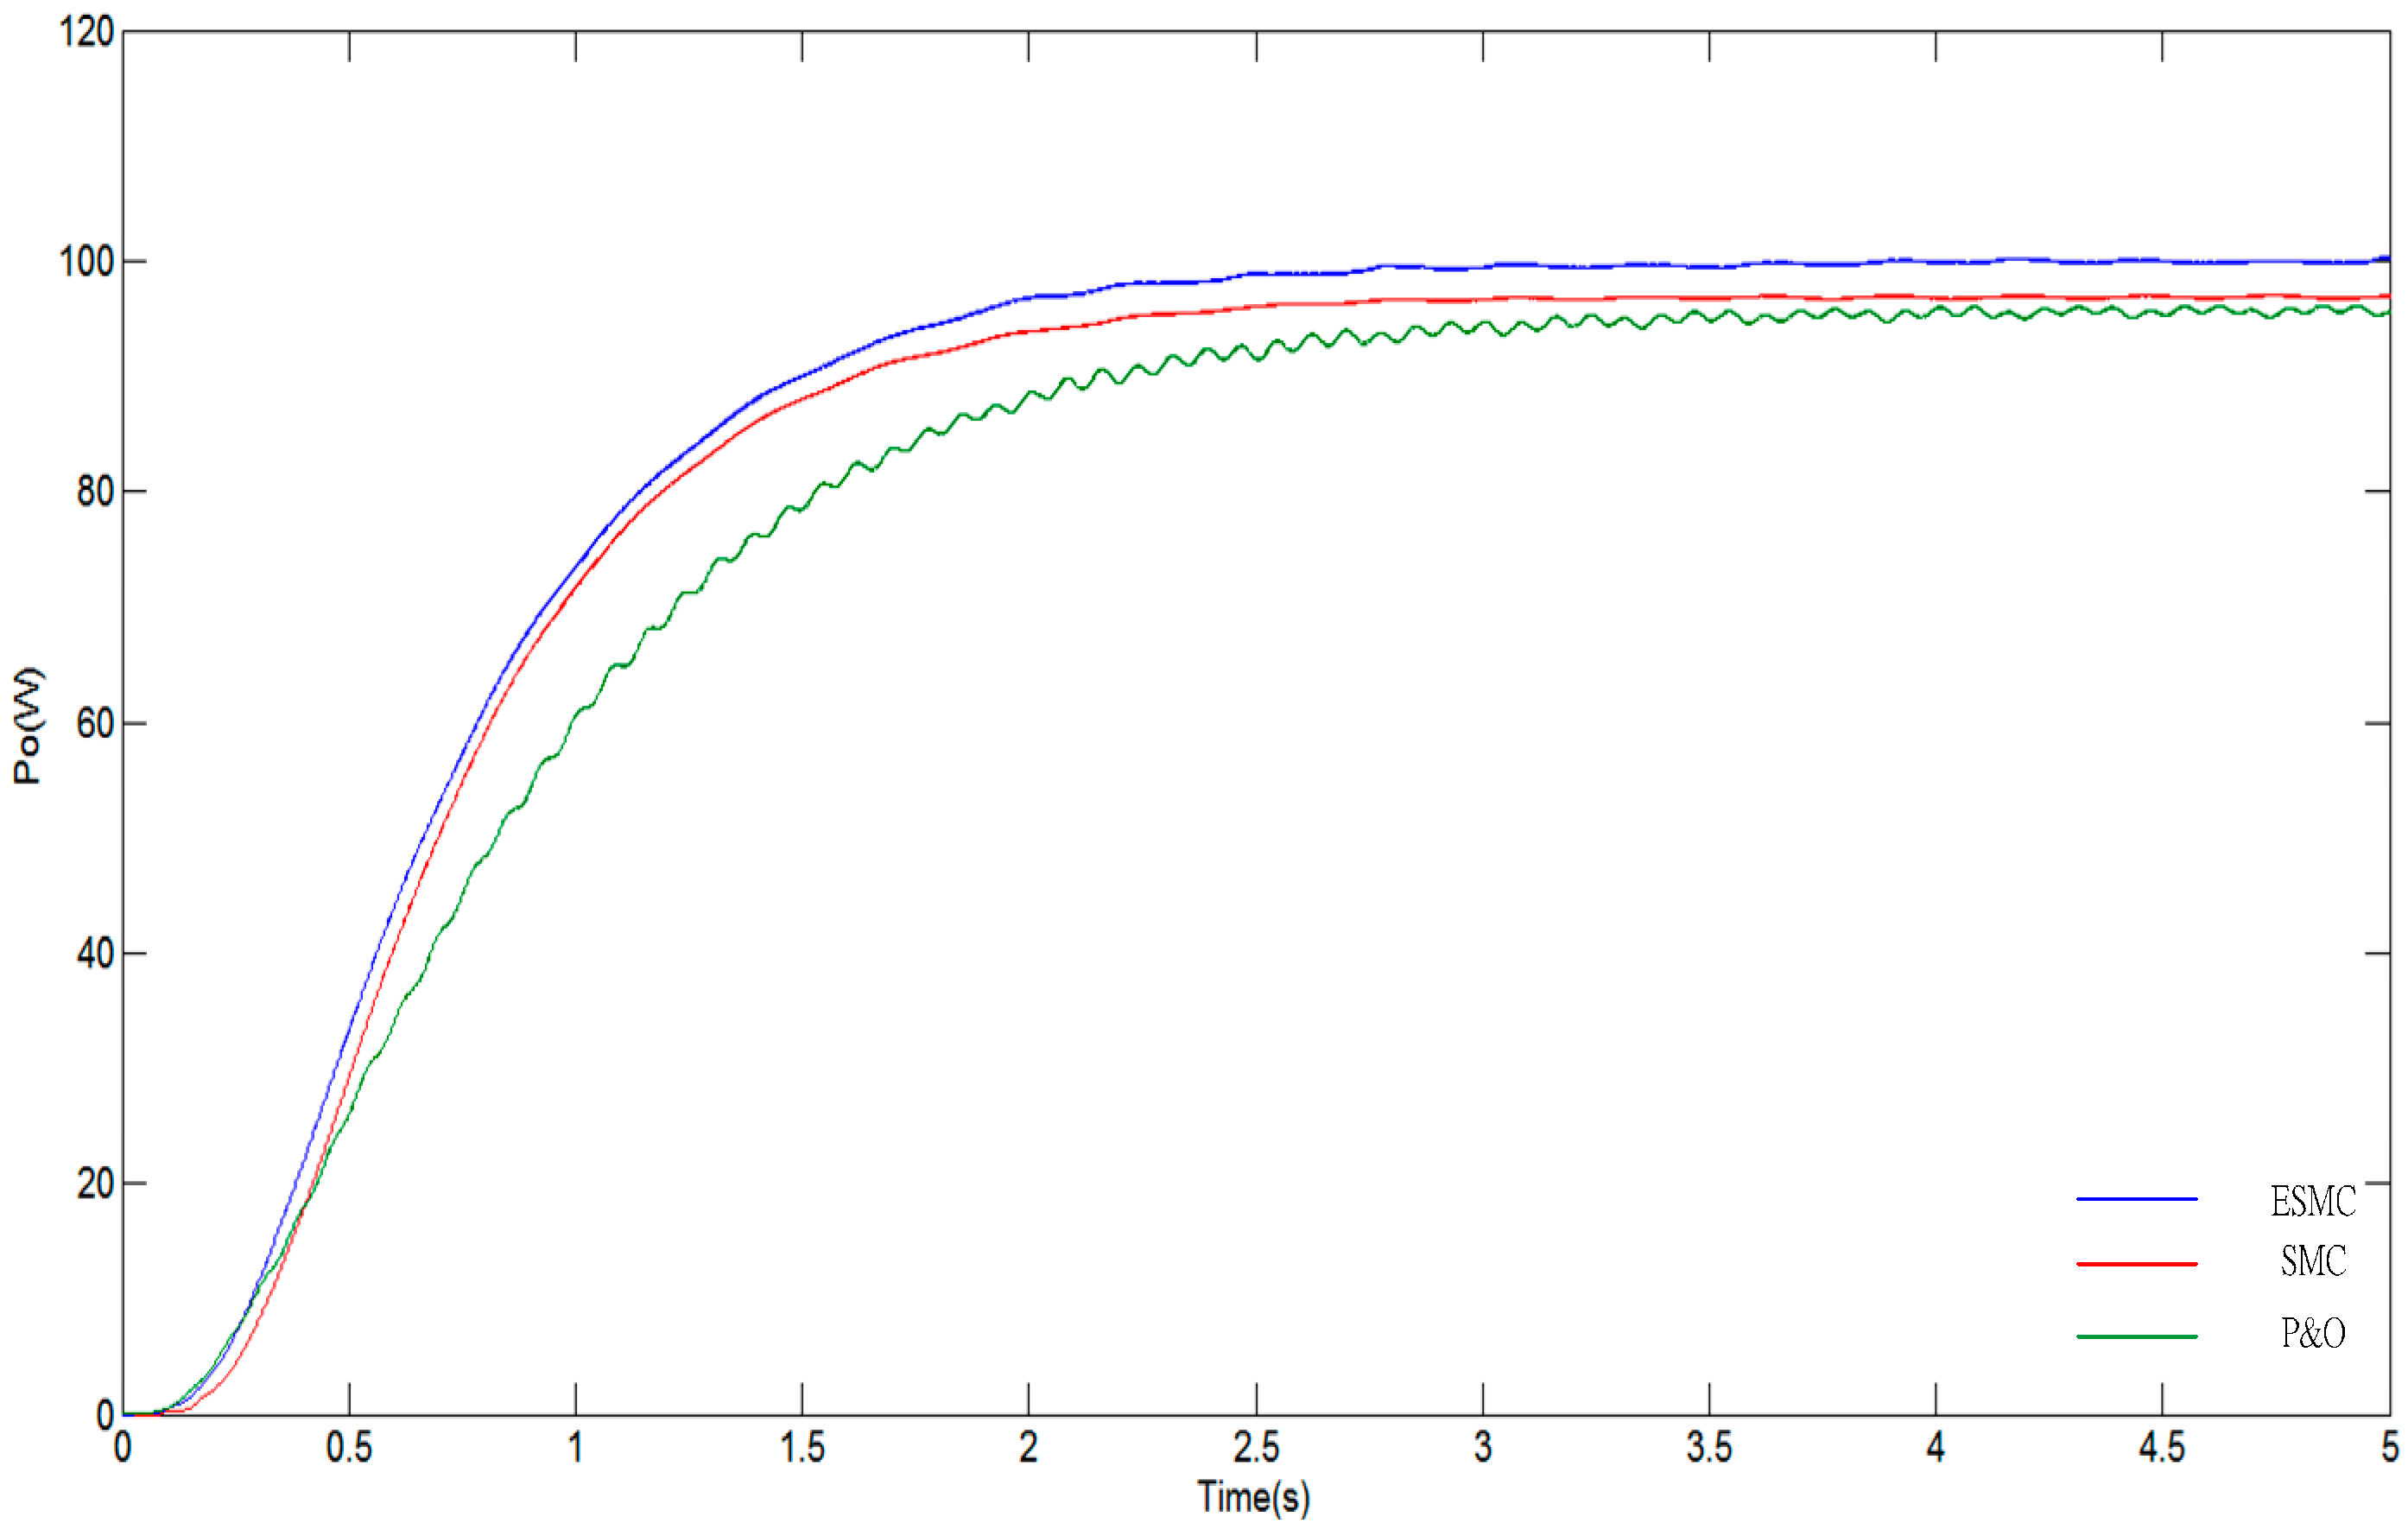
Figure 10 shows the power output from the three control modes at a speed of 7.5Km/H.
Table 1 shows that the ESMS used in this paper has both high response speed and power output.
Figure 8.
Simulated generator P-V characteristics curve.
Figure 8.
Simulated generator P-V characteristics curve.
Figure 9.
(a) P&O at a speed of 7.5 Km/H and 12 Km/H; (b) SMS at a speed of 7.5 Km/H and 12 Km/H; (c) ESMS at a speed of 7.5 Km/H and 12 Km/H.
Figure 9.
(a) P&O at a speed of 7.5 Km/H and 12 Km/H; (b) SMS at a speed of 7.5 Km/H and 12 Km/H; (c) ESMS at a speed of 7.5 Km/H and 12 Km/H.
Figure 10.
Output power of the three control modes.
Figure 10.
Output power of the three control modes.
Table 1.
Characteristics of the three control modes.
Table 1.
Characteristics of the three control modes.
| Methods | P&O | SMS | ESMS |
|---|
| System Properties | |
|---|
| Conversion efficiency η (%) | 93.83% | 96.78% | 99.53% |
| Response speed Time (s) | 3.55 | 3.27 | 2.77 |
| Output power Po (W) at 7.5Km/H | 93.83 | 96.78 | 99.53 |
| Input power Pi (W) | 100 | 100 | 100 |
Figure 11 shows the experimental configuration of maximum power tracking control. A resistance divider and Hall Element were used in the experiment. The Arduino Mega 2560 (Ivrea, Italy) captures voltage and current data for MPPT control calculation and transmits the PWM signal to the boost converter.
Table 2 shows the generator specifications.
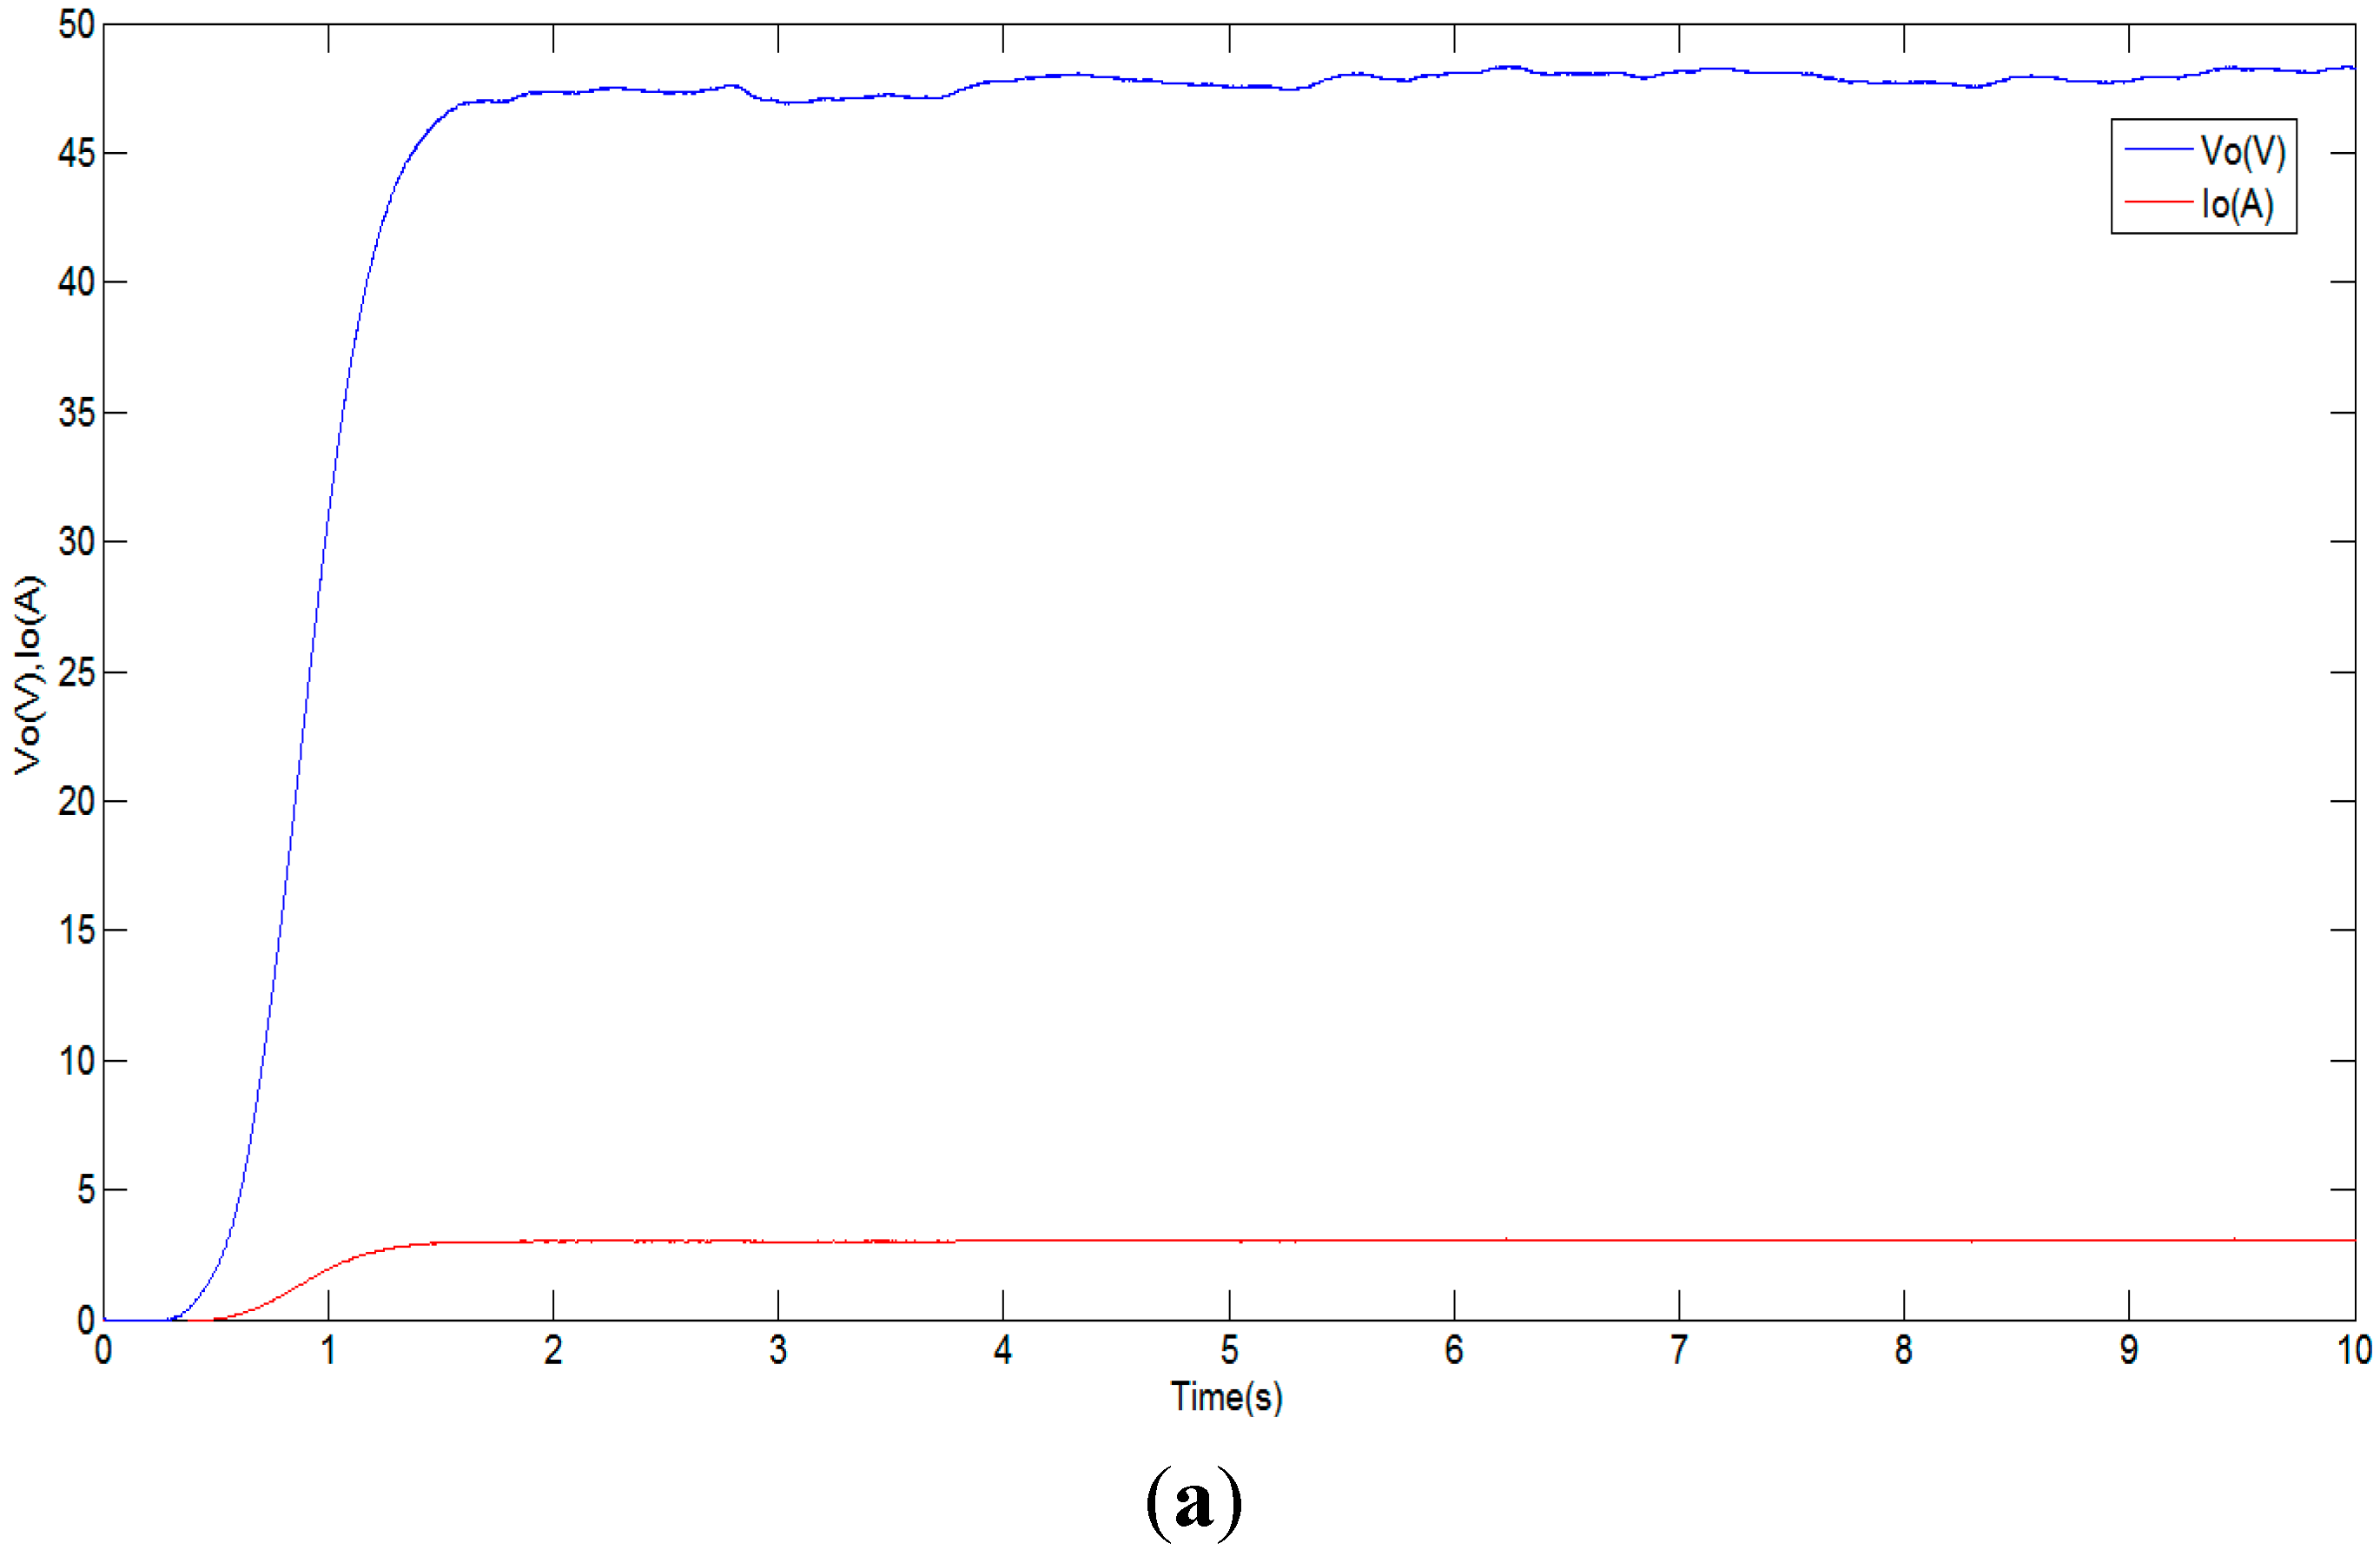
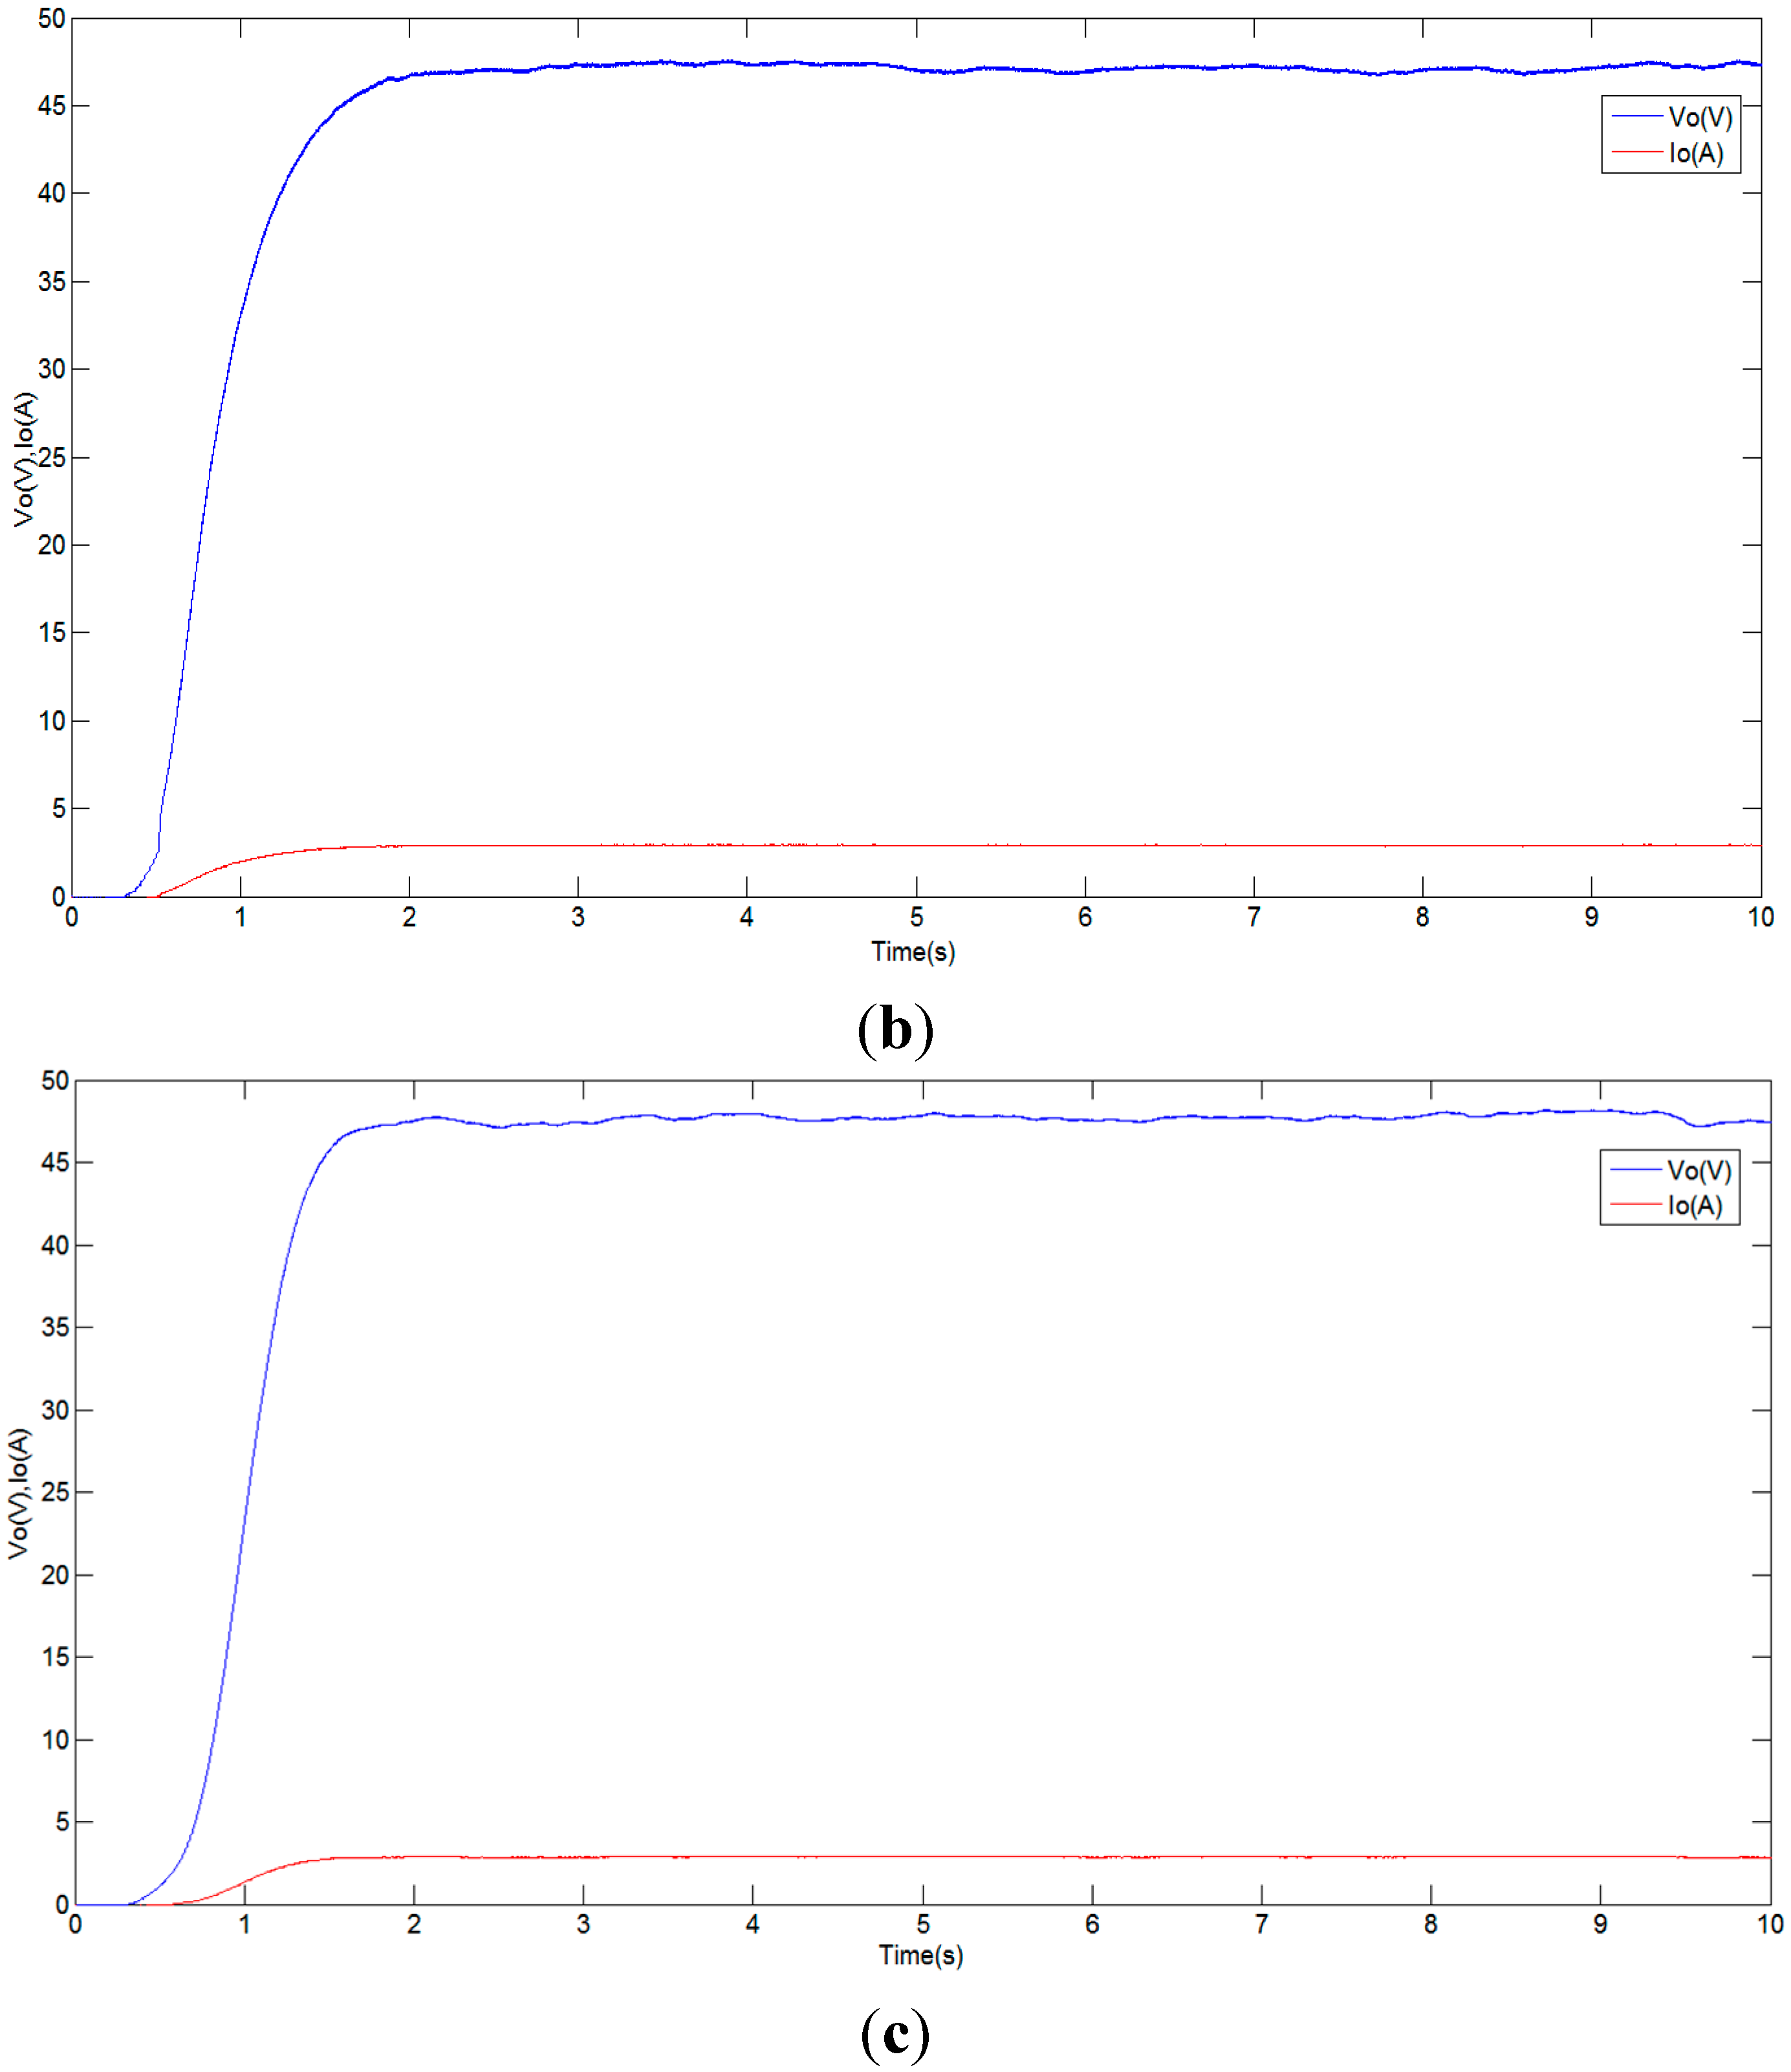
Figure 12a–c show the output voltage Vo and output current waveform Io of the three control modes.
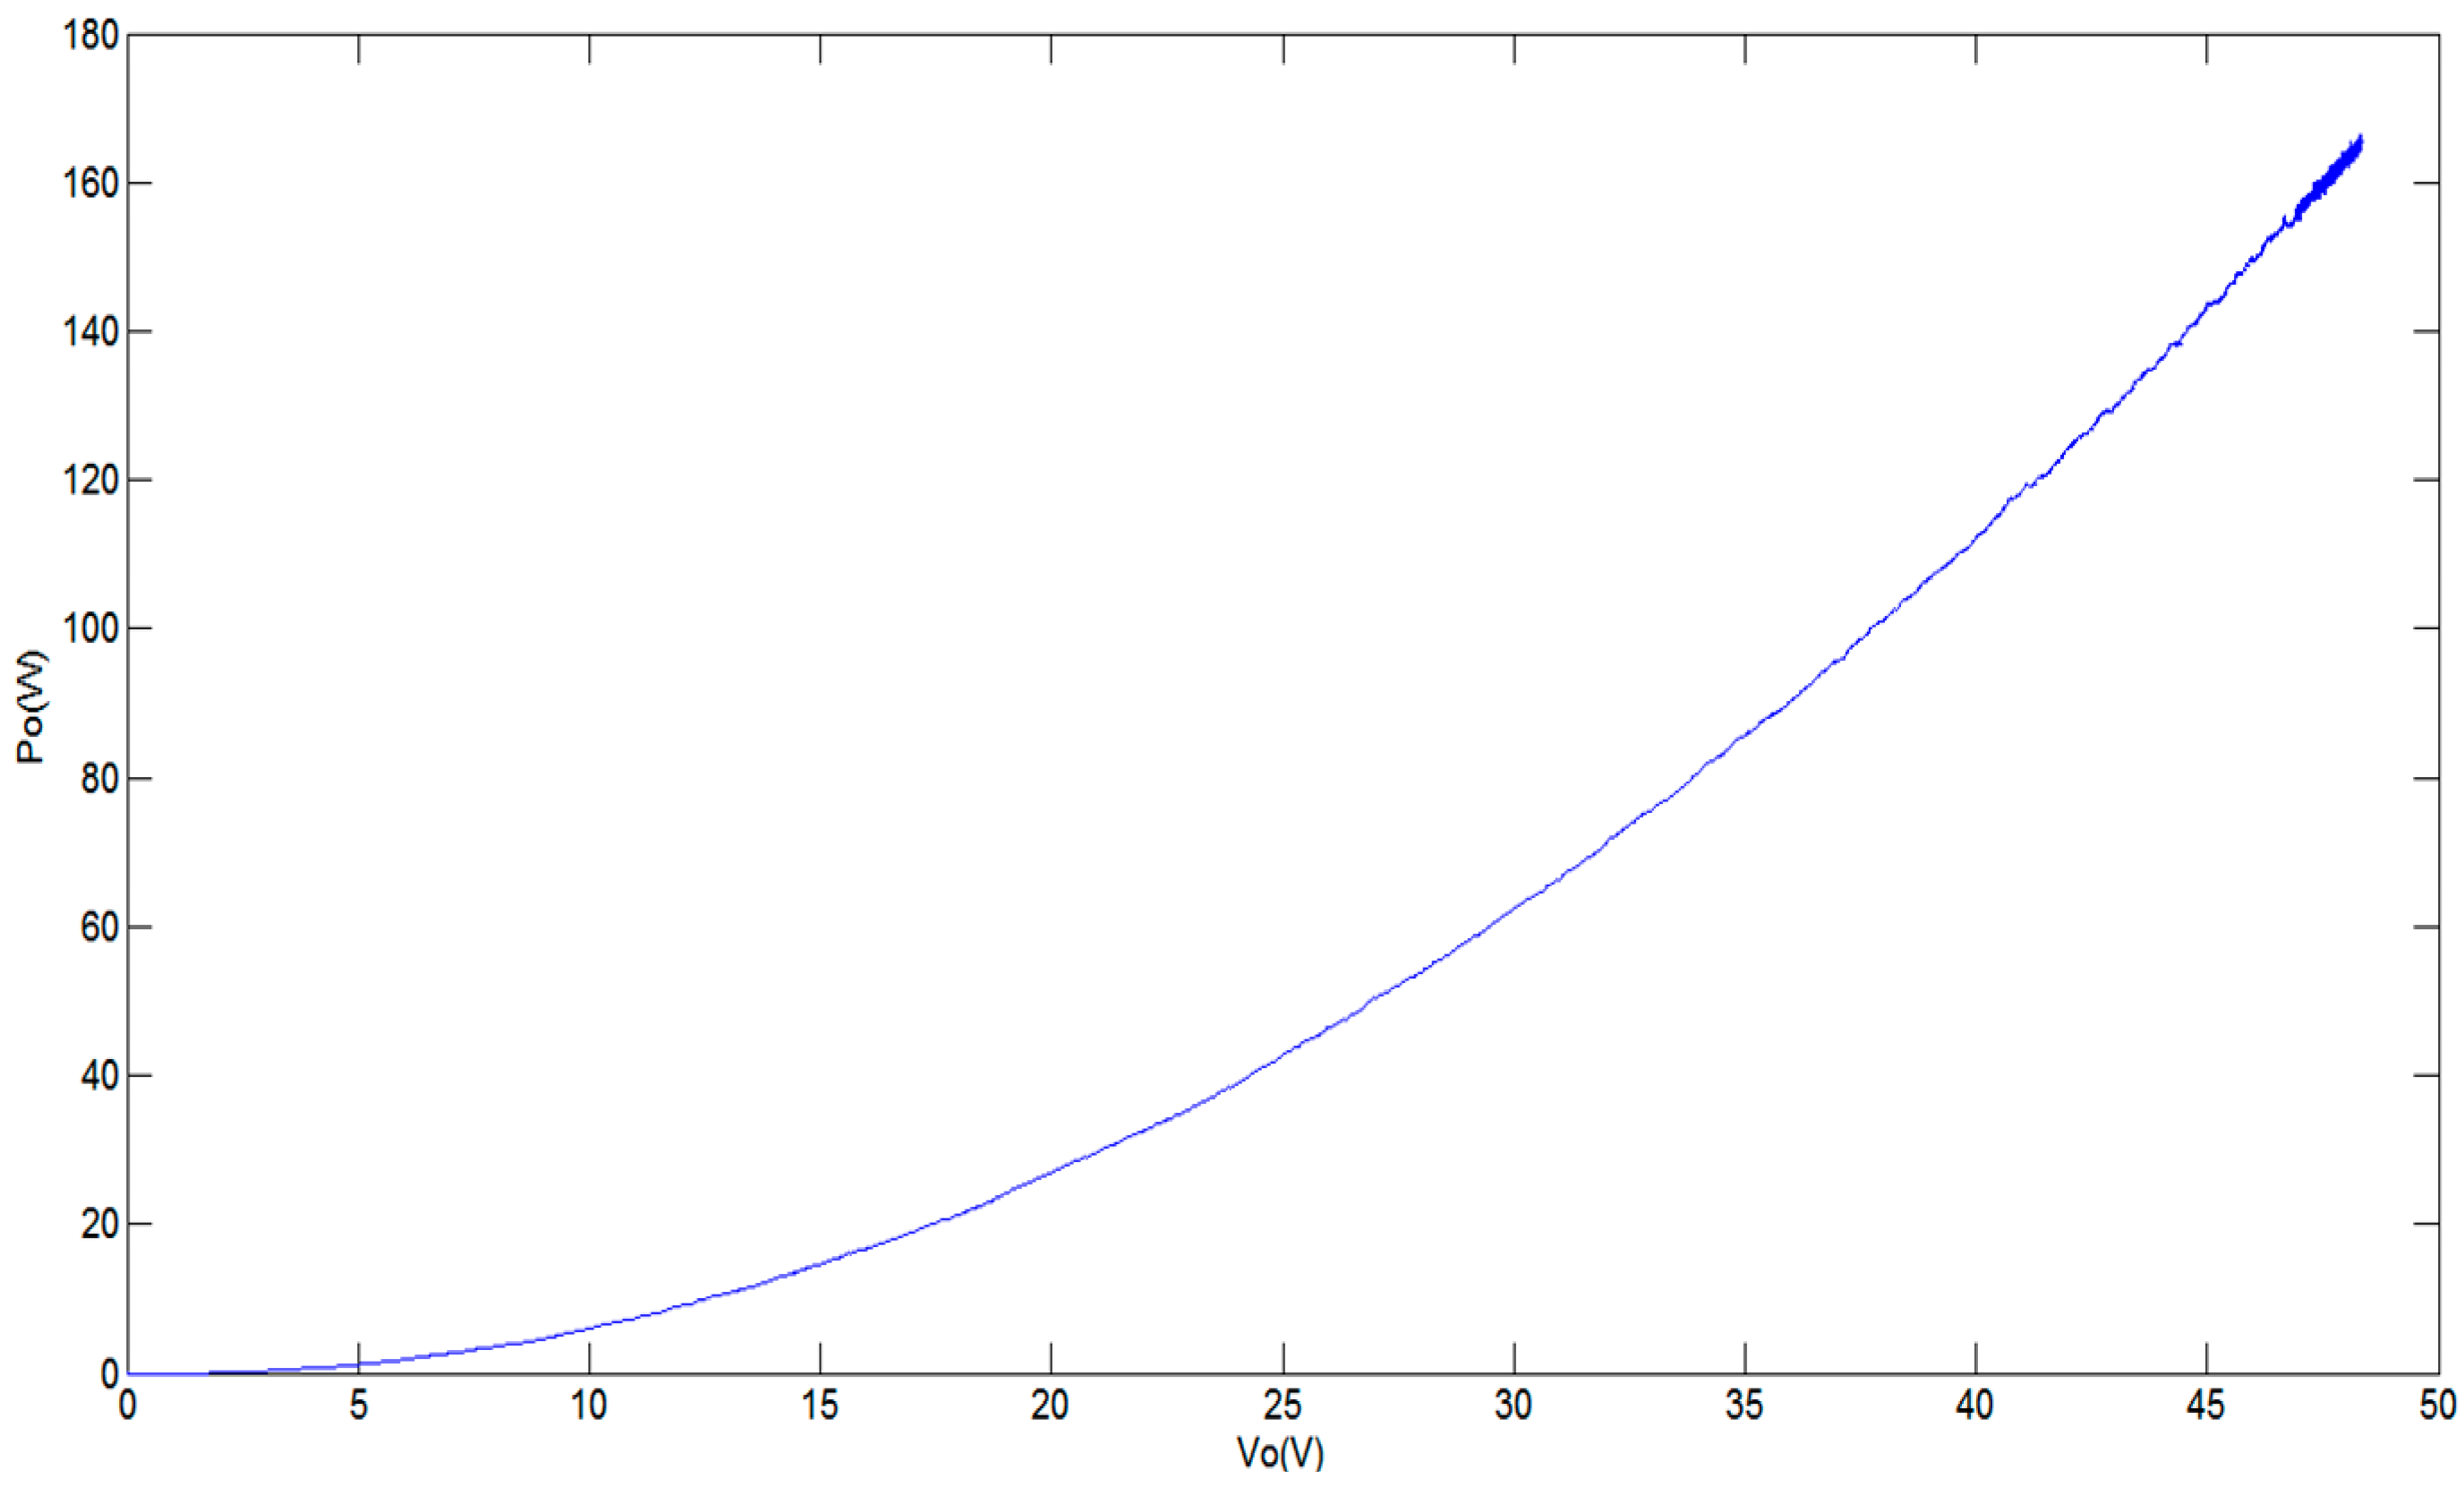
Figure 13 shows the P-V characteristics curve of the actual generator at a speed of 12Km/H using ESMS MPPT control.
Figure 14 shows the actual rotation speed of the generator, the speed is fixed at 12Km/H, converted into an angular-rate of about ω = 100 rad/s.
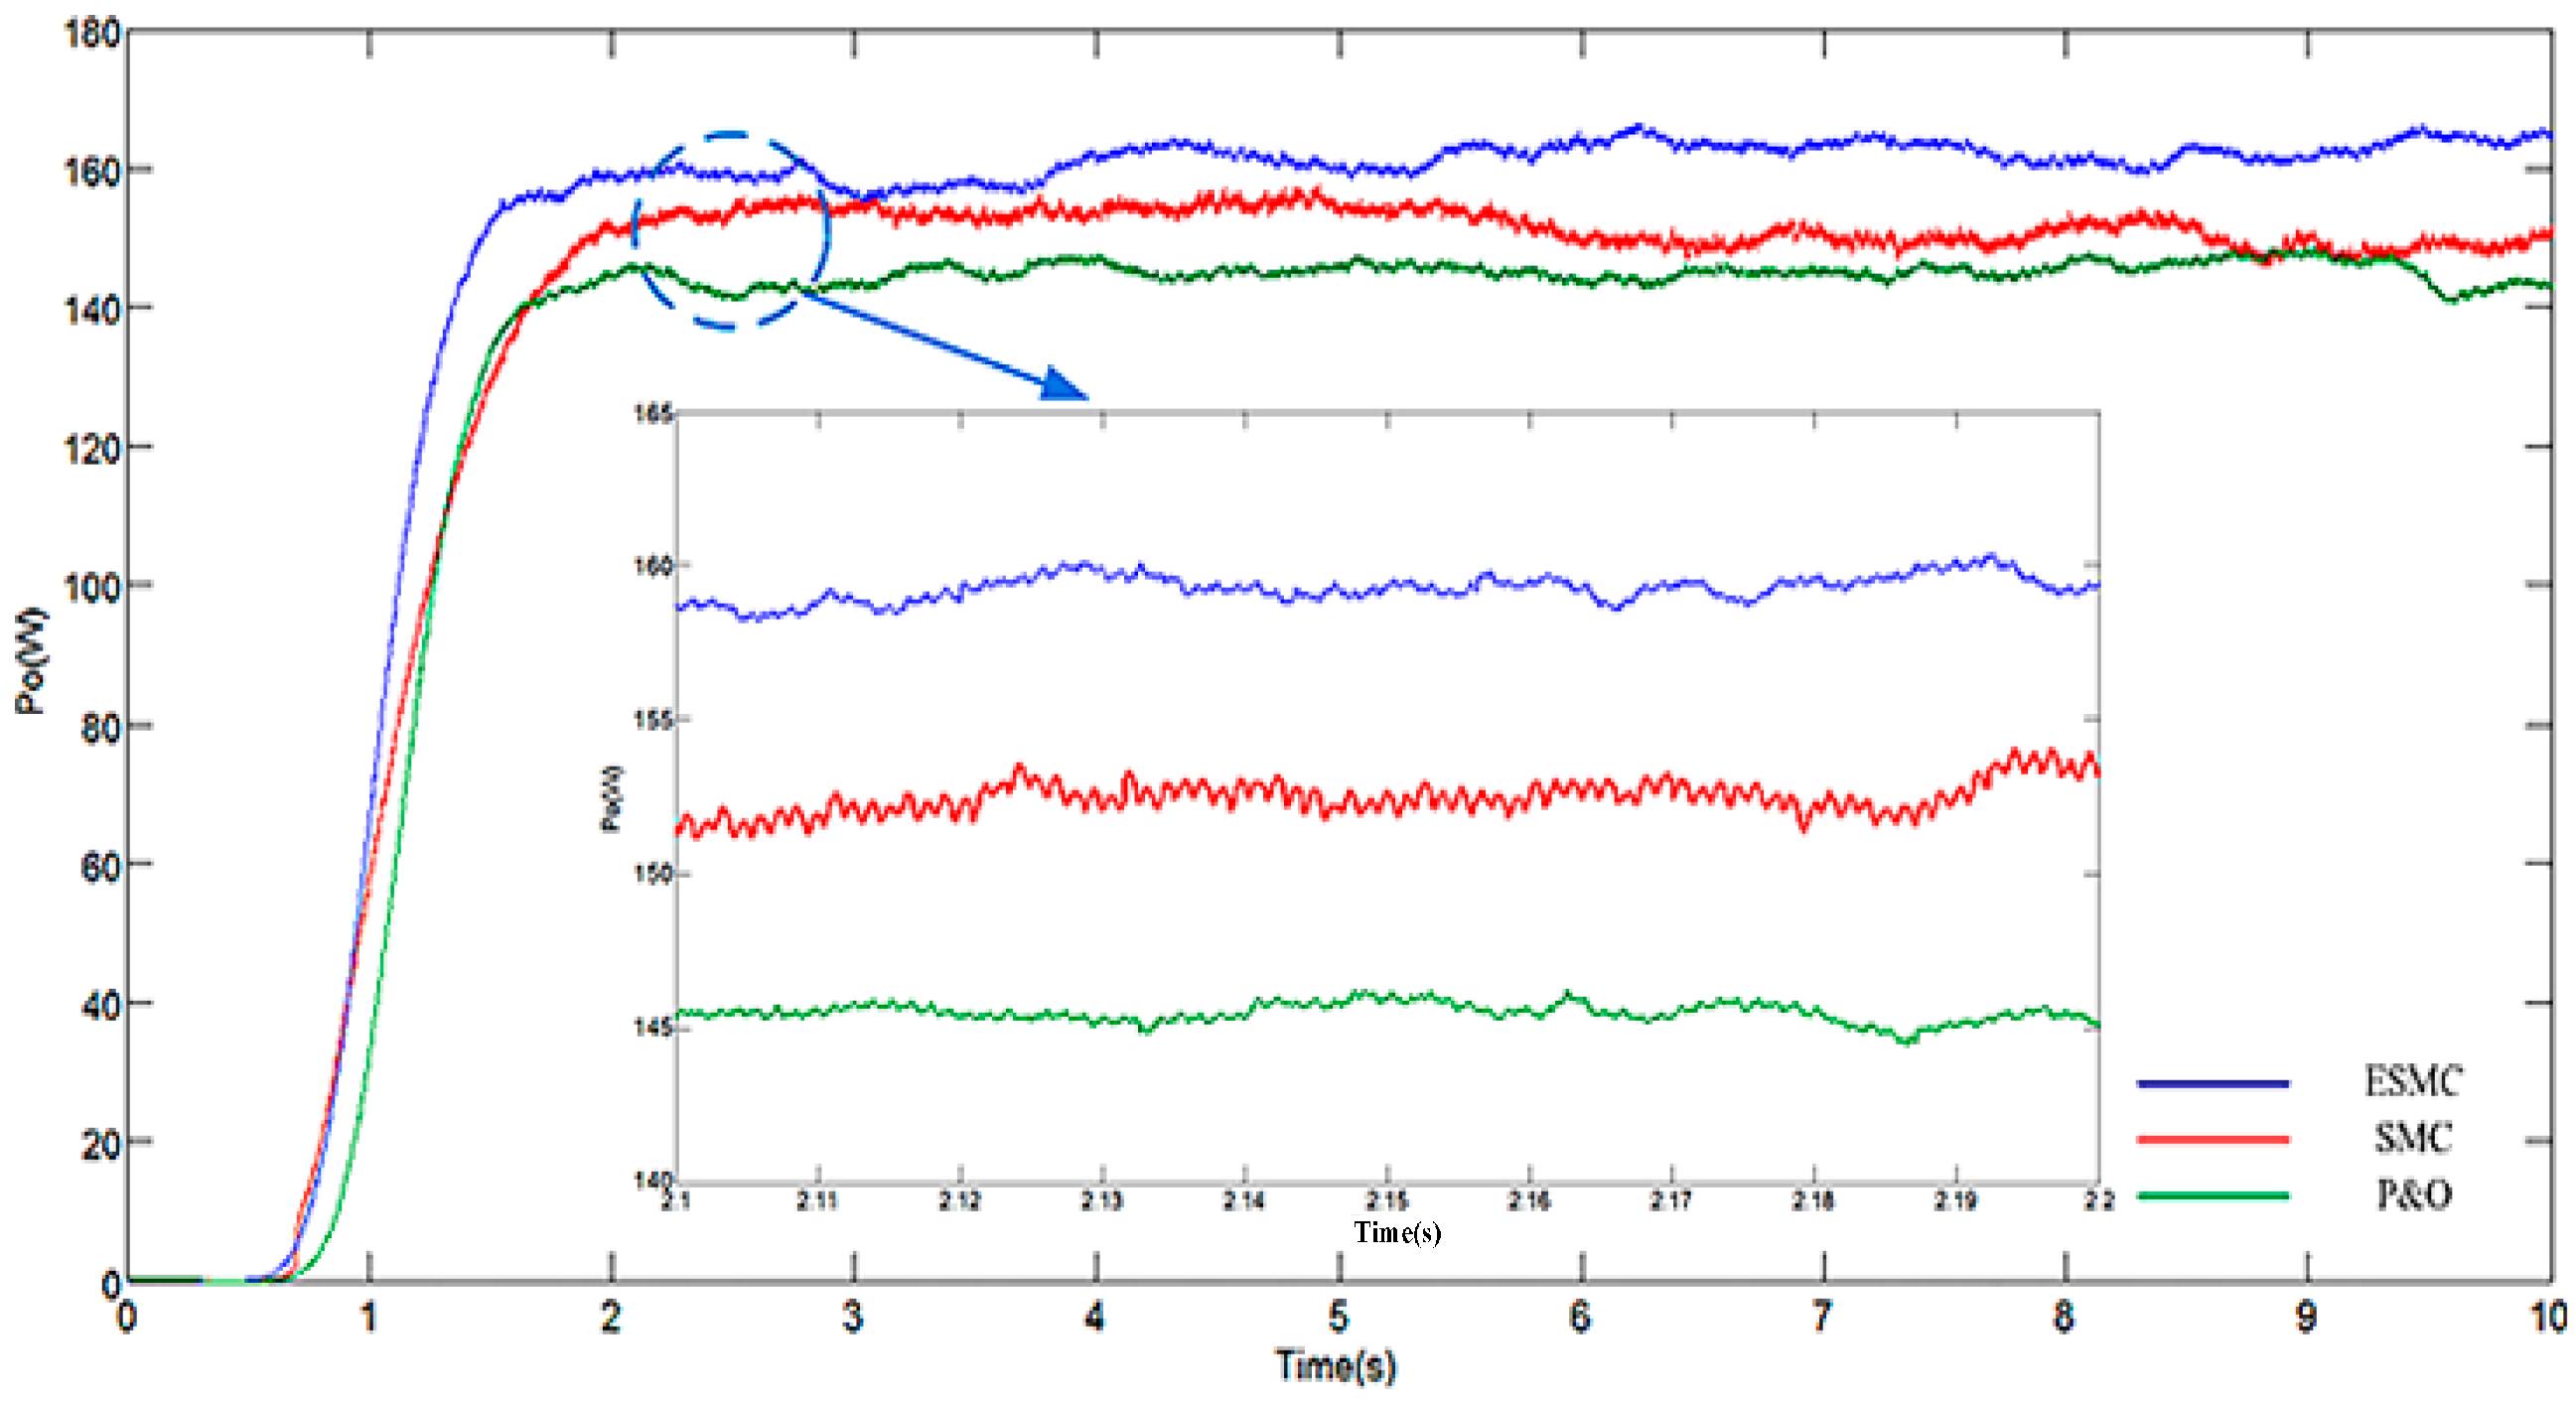
Figure 15 shows the output power Po of the three control modes.
Figure 15 compares the ESMS proposed in this paper with SMS and P&O. It was found that ESMS has a higher tracking response speed, and effectively reduces the noise from high frequency SMS switching. To verify the validity the robustness and stability of this scheme, the experimental results with white noise as external disturbance angular and speeds from ω = 100 rad/s to ω = 118.83 rad/s are shown in
Figure 16. It can be seen that the system can rapidly track change of angular speed ω
to MPPT under external disturbance and the experimental results prove the effectiveness and validity of the method.
Figure 11.
Actual circuit architecture.
Figure 11.
Actual circuit architecture.
Figure 12.
(a)ESMS output voltage (Vo) and current (Io); (b) SMS output voltage (Vo) and current (Io); (c) P&O control output voltage (Vo) and current (Io).
Figure 12.
(a)ESMS output voltage (Vo) and current (Io); (b) SMS output voltage (Vo) and current (Io); (c) P&O control output voltage (Vo) and current (Io).
Figure 13.
ESMS MPPT P-V characteristics curve.
Figure 13.
ESMS MPPT P-V characteristics curve.
Figure 14.
Rotation speed ω (rad/s).
Figure 14.
Rotation speed ω (rad/s).
Figure 15.
Experimental output power of the three control modes.
Figure 15.
Experimental output power of the three control modes.
Figure 16.
Stability and robustness verify at speeds from ω = 100 rad/s to ω = 118.83 rad/s with white noise: (a) Boost converter input power (Pi); (b) Boost converter output power (Po).
Figure 16.
Stability and robustness verify at speeds from ω = 100 rad/s to ω = 118.83 rad/s with white noise: (a) Boost converter input power (Pi); (b) Boost converter output power (Po).
Table 2.
Generator specifications.
Table 2.
Generator specifications.
| Voltage Specification | 220 V |
| Rated Power | 200 W |
| Peak Power | 500 W |
| Rated Speed | 1500 rpm |
| Alternator Efficiency | ≥90% |
| Pole P | 4P |
| Armature Winding Ra | 6.26 Ω |
| Coil Inductance Lm | 0.04 mH |


