1. Introduction
From the moment when health management was focused on the improvement of operational efficiency, flexibility, and responsibility of the staff, setting aside massive systems of production and competitive marketing intensification, Lean thinking has been increasingly applied in hospitals to improve quality and reduce costs [
1]. Womack and Jones [
2] introduced the application of Lean thinking in healthcare services. Some authors advocate Lean practices in health services to eliminate delays, reduce length of stay, repeated encounters, errors and inappropriate procedures [
3]. Other authors, like Spear [
4], state that in order to maximize value and eliminate waste, one must evaluate processes by accurately specifying the value desired by the user. This needs identification of the value stream, elimination of non-value-added steps, and value generation, from the beginning to the end, based on a pull system and the expressed needs of the patient.
Although focused on manufacturing, Lean has proved to help accomplish good results when applied to health care systems [
5,
6], although some authors like França [
7] defend that in practice, the Lean methodology lacks from continuity in hospitals due to the absence of a continual process and gradual improvement. This paper believes that that, by itself, automation cannot offer the necessary levels of organization to address the needs of an efficient organization and maintain, at the same time, quality goals and customer orientation; this article applies the Lean methodology in the centralized laboratory.
Despite the aforementioned critics of the lack of continuity, the organizational and management tools that the Lean system brings when applied to clinical laboratories meant well-needed improvements to our organization. At the same time, we believe it is necessary to apply complementary concepts from the Agile methodology as it brings specifically adaptive and demand-driven philosophy for our customers in the health care industry [
3], managing sudden changes in the quantity and the characteristics of the commands or demand [
8], the increase in the pressure to reduce costs [
5], the increase of the pressure by competitors [
9], the global market [
1], the rapid growth of access to technology, the changes in wages, salaries and professional capabilities, the bio-ecologic responsibility, the scarcity of resources [
10], the technology, the clients and the competitors [
11]. Agile means using market and enterprise knowledge to benefit from profitable opportunities in a volatile market [
12]. Agile is a broad capacity from the company that includes the organizational structures, the information systems, the logistic process, and particularly the mentality [
13]. The Agile approach offers specific characteristics that can be integrated in the management system of the company in an electivity to improve its general efficiency [
14]. These works encouraged us to apply the Agile approach to the necessities of the clinical laboratory.
Choosing among cost efficiency and response capabilities, this is to say, between Lean and Agile, is not well defined. While Lean objectives are stable and made easy with stabilized production, Agile Management is able to adjust its internal structures and processes in response to changes in the environment [
15]. Most companies have products or processes oriented to both types and, because of that a question is raised regarding which are the possibilities to fulfill the double goal of agility and leanness. Naylor [
12] points out that in a total supply situation, a flux strategy is needed to explain which parts of the supply and the production chains are better designed and adapted to be sensitive to the fluctuations of the demand and which ones are better adapted to meet the samples’ production, pick up, and transportation schedules. The companies must understand the uncertainties of their product’s supply and demand first, and then try to meet those with the supply, logistics, and production chain’s strategies [
16]. In this article, we analyze the adaptations designed to be applied to the production chain looking for a cost reduction while keeping the certified and accredited quality goals.
The medical laboratory has evolved adopting the quality tools recommended by the International Organization for Standardization (ISO), from ISO 9001:2008 of quality certification, to DIN EN ISO 15189:2012 of accreditation of competition, which is specific to the medical laboratory. Both tools include Lean thinking and Total Quality Management (TQM), and they have in common the ongoing improvement to offer a greater value to the customers [
9]. The implementation of the Agile system is complicated because of the regulatory restriction of the ISO regulations, which require previous approval of detailed project requirements as well as the foreseeing of the affected areas by the modifications to fulfill the requirements (DIN EN ISO-15189:2012). At the same time, the regulation demands require that the changes in volume and scope of work, staff, and premises, do not affect the quality management system. The advantages of agile workforce have been described in the agility related literature for a long time. A range of attributes that are believed to be associated with the workforce agility has been identified. However, there is a lack of studies that empirically investigate and determine that attribute of the workforce [
16]. For this reason, we apply the development in the phases in which they are adopted in literature [
17], with subsequent incremental developments and abundant documentation, to prove that the process is completely controlled and adapted [
18,
19,
20].
Despite this, we found potential problems to avoid as those described in the literature and it referred to the incapability of working with agile manufacturing in projects with prefixed price [
19]. Other problems in the application were: the creation of the adequate designs to maintain the scarce risk tolerance in the obtained quality from the issued results; keeping up with our goals on measurement uncertainty, detection, and of the typical uncertainty sources on routine measuring methods; the detection of the equipment that presents operational deficiencies, and the adequate moment to apply the corrective measures. As current scientific literature does not provide references on the application of the Agile system to clinical laboratories, this article, based on our experiences, is in the best scientific interest.
The goal of this article is showing that there is flexibility in the adaptability of the clinical laboratory to the sudden changes on the presented activity, caused either by the reduction of the activity of hospitals during the summer holidays or by the modification of the doctor’s demand patterns for seasonal epidemics, health care campaigns, or population migratory movements.
Given the reality of the activity’s fluctuation presented in laboratories, it believed that it is particularly useful to describe and standardize how to modify the active fluxes and resources depending on changes, keeping the certification and accreditation laboratory criteria.
2. Experimental Section
2.1. Materials and Methods
The Laboratori de Referència de Catalunya (LRC) it is a network of eight regional hospitals located in Catalonia. It serves a diverse patient population with origin of hospital, and health center. The LRC was established as a central laboratory in the year 1992. It forms a whole network of laboratories that have evolved towards normalization of laboratory automation similar to that indicated by Armbruster [
21]. The objectives of this project were clinical laboratory performing routine laboratory tests, special biochemistry, hematology and microbiology at the premises of a certified and accredited central laboratory. In addition, we aim to establish a harmonized system for all laboratories rapid response networks, while performing rare tests in each of the laboratories, and in the central laboratory.
The decision to create a laboratory with high level of automation was taken. It was developed as samples of different centers from reaching the central laboratory and develops an organizational system based on re-engineering and compliance requirements externally recognized as the quality certification according to ISO 9001 and accreditation according to ISO 15189. The first raised need was for reductions laboratory cost, the improving of response time and to give a full response to the changing needs that are generated due to the variety of health care facilities, physicians and patients who it serves [
22].
With the goal of adapting the laboratory to the fluctuation of the demand related to the season, we identified the processes and procedures most likely to be adapted to the changing needs of the environment while keeping turnaround times. It analyzed how to maintain the objective analytic quality, the goals of turnaround time, and the reduction of the intensity of the necessary resources. In addition, identifying needs and evaluating the best strategy to reduce the resources. It decided to use a more appropriate strategy and it was assumed the stop of one machine three modules analysis and transposition of the tests into a similar instrument that remains in operation, assuming the total tests.
The laboratory has a volume of samples, mostly of blood, that come from eight different hospitals and five healthcare centers. Those are sent to the central laboratory and consisted of 3,603,320 annual tests (14,298 tests/day) in 2013, and 4,006,873 annual tests (15,900 tests/day) in 2014 (see Annual Reports 2013 and 2014) [
23]. Established agreements to use instrumentation with reagent suppliers based on the number of samples received, assuming increases on the activity in a progressive way and according to the needs of the peripheral centers. The direction of laboratory decided to use modular automated systems “Stand-alone automation” [
21] of Cobas 8000’s clinical laboratory, marketed by Roche
®. There are two modular systems conformed by three analyzers 602, both connected, and also connected to an information system developed and marketed by the same laboratory (Eyra
®). The modular system proves to offer objective benefits like flexibility, ease of implementation, interconnection, validation, and ease of planning, and at the same time that presents a capability to automate components in the analytical procedures [
24]. It implemented a global system consisting of four principal instruments: the classifier with two mirrored units, an analytical unity of spectrophotometric biochemistry, and two immunoassay modules with chemo luminescent detection of three analytical units each.
At the beginning, it did not consider it economically wise to incorporate mechanical chains to distribute the samples, or “task targeted automation,” and join the different modules. In addition, applied Lean thinking technique for circulating samples and technicians, application of 5 s, inventory of reactive and samples, motion of personal and samples, reductions of waiting and delays, overproduction, over processing, and defects of results and reports [
25].
The laboratory information system allows us to track the samples by locating the samples in the modules, informing of the analytical status as well as the alarms generated by the analytical systems. At various time intervals during the day, the laboratory technicians take the samples to the respective module and then to the archive, once the tubes are closed. In case that a doctor calls for additional analysis, the information system activates the added parameters so the analyzers can perform them.
To develop and apply the Agile manufacturing methodologies, it chose an area where the seasonal fluctuations and the operative costs are elevated, which is especially true in the area of the two immunochemical modules with chemiluminescent detector. Yearly, it processes a total of 515,103 measurements of the parameters in
Table 1, which were reduced to 26,928 measurements during August 2014.
Table 1.
Measurements performed in the two analytical modules during 2014 and the goal turnaround times that the laboratory promised to deliver.
Table 1.
Measurements performed in the two analytical modules during 2014 and the goal turnaround times that the laboratory promised to deliver.
| Parameter | Number of Yearly Measurements 2014 | Number of Measurements for August 2014 | Turnaround Time, in Days |
|---|
| Srm-Antibody againts surface Hepatitis B antigen | 5791 | 283 | 2 |
| Srm-Antibody Ig M againts core Hepatitis B antigen | 1487 | 106 | 6 |
| Srm-Antibody againts core Hepatitis B antigen | 12,867 | 720 | 6 |
| Srm-alfa-Fetoprotein | 9098 | 414 | 2 |
| Srm-antibody Ig G Citomegalovirus | 3296 | 186 | 2 |
| Srm-antibody Ig M Citomegalovirus | 3289 | 184 | 3 |
| Srm-Antibody Igg Hepatitis C | 20,980 | 1150 | 3 |
| Srm-Antibody IgG Rubella | 4889 | 322 | 2 |
| Srm-Antibody IgG Toxoplasma gondii | 7299 | 510 | 1 |
| Srm-Antibody IGM Hepatitis A | 1909 | 107 | 2 |
| Srm-Antibody IgM Toxoplasma gond II | 2169 | 165 | 2 |
| Srm-Antibody Treponema pallidum | 7750 | 979 | 2 |
| Srm-Antibody Hepatitis A totals | 653 | 64 | 1 |
| Srm-Antibody against VIH | 19,815 | 1170 | 3 |
| Srm-Carcinoembrionari antígen (CEA) | 19,999 | 1044 | 2 |
| Srm-Prostàtic specific antígen (PSA) | 34,927 | 1257 | 3 |
| Srm-Free Prostàtic específic antígen | 5226 | 182 | 2 |
| Srm-Surface Hepatitis B antígen | 17,553 | 995 | 5 |
| Srm-CA 125 | 4917 | 24 | 5 |
| Srm-CA 15.3 | 6918 | 340 | 3 |
| Srm-CA 19.9 | 9076 | 525 | 3 |
| Srm-Ferritin | 63,289 | 3130 | 3 |
| Srm-Folate | 30,013 | 1530 | 3 |
| Srm-Testosterone | 5967 | 278 | 5 |
| Srm-Tirotropine (TSH) | 99,615 | 5270 | 3 |
| Srm-Free Tiroxin (T4 FREE) | 47,267 | 2234 | 5 |
| Srm-Free Triiodotironine (FT3) | 5808 | 319 | 5 |
| Srm-Vitamine B12 | 32,976 | 1679 | 3 |
| Srm-Vitamine D (25 OH) | 29,661 | 1151 | 2 |
| Total | 515.053 | 26.318 | - |
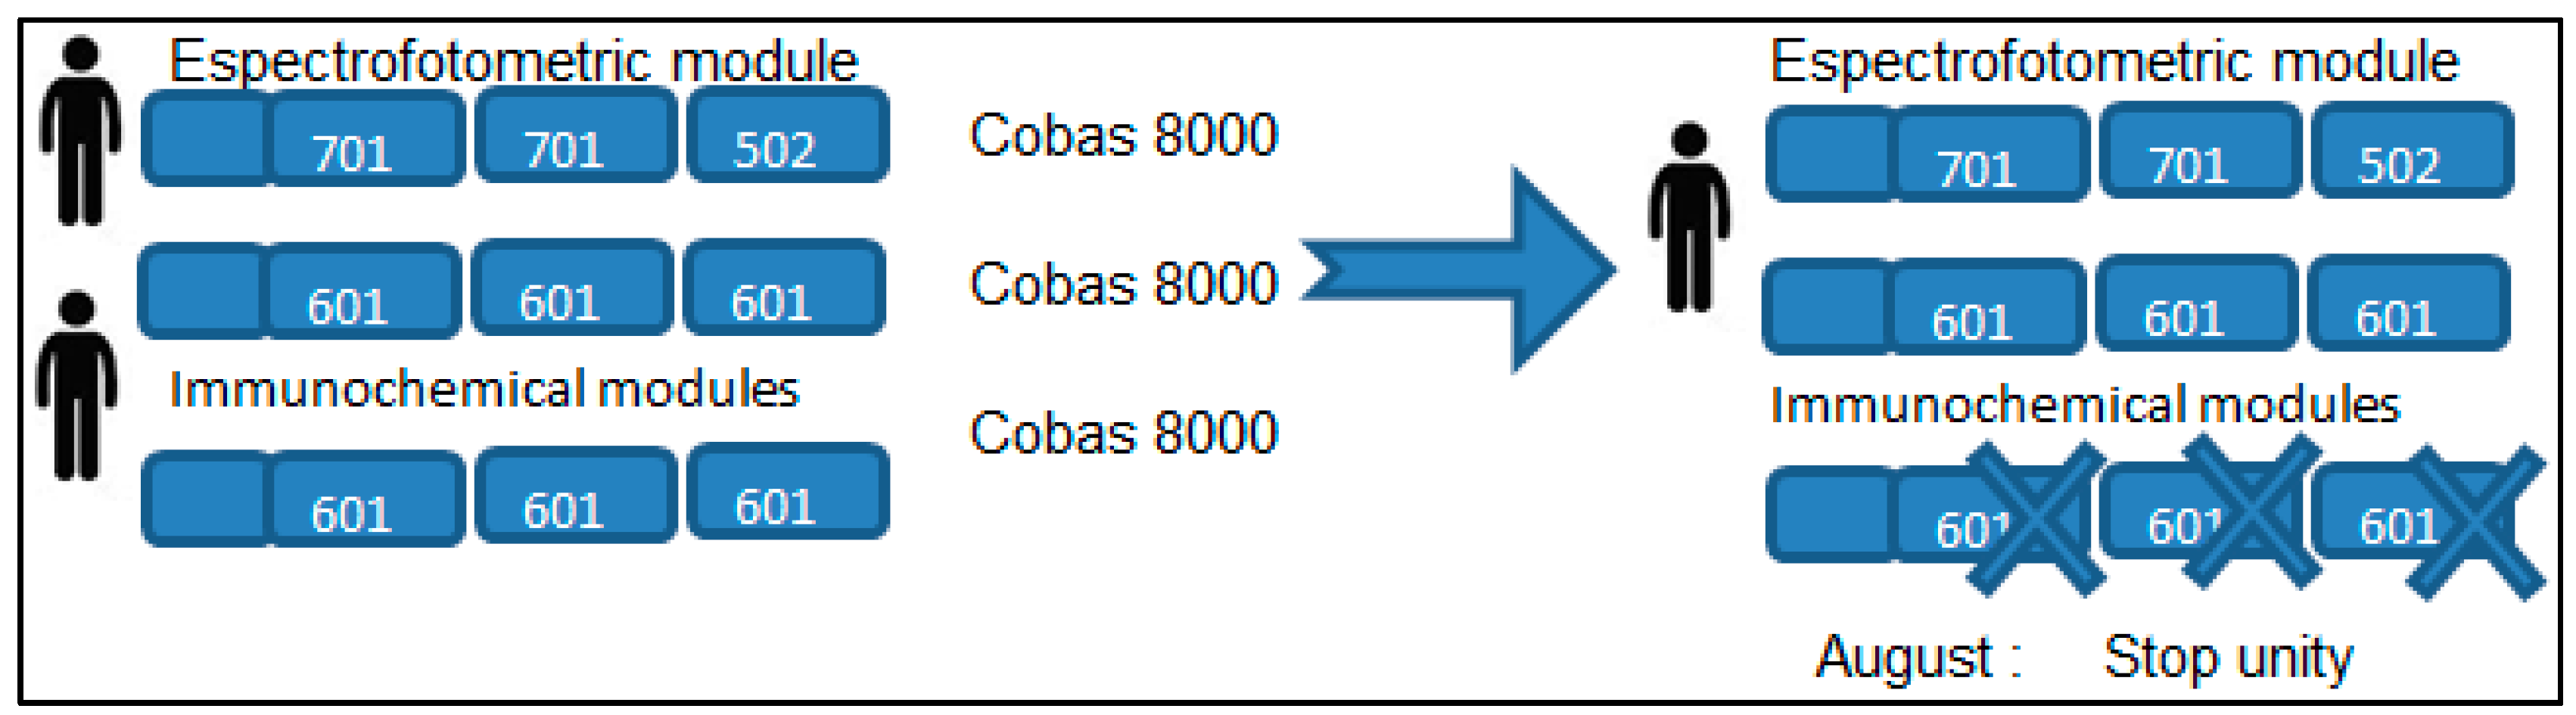
It established as a goal the complete substitution of the performed activity in the second module by incorporating to the first module the methodologies performed in the second, and by closing the second analyzer during the month of August (see
Figure 1). It proceeded to open the analytical channels needed in the first analyzer module along with the initial existing channels to perform the measurements that usually are performed, with priorities in a decreasing order of importance. It can see at the
Table 2 a summary of the picked priorities.
Figure 1.
One operating unit Cobas 8000-701 and two units Cobas 8000-601 with staff allocation and reduction of substitutes during August. Finally, with one unity Cobas 8000-601 operating in month august.
Figure 1.
One operating unit Cobas 8000-701 and two units Cobas 8000-601 with staff allocation and reduction of substitutes during August. Finally, with one unity Cobas 8000-601 operating in month august.
The reduction of the demanded activity during the studied time should be less than 33% of the annual average. Without a significant reduction, it would be optimizing resources, but not applying Agile production systems. In
Figure 2 we can see the evolution of activity during 2014.
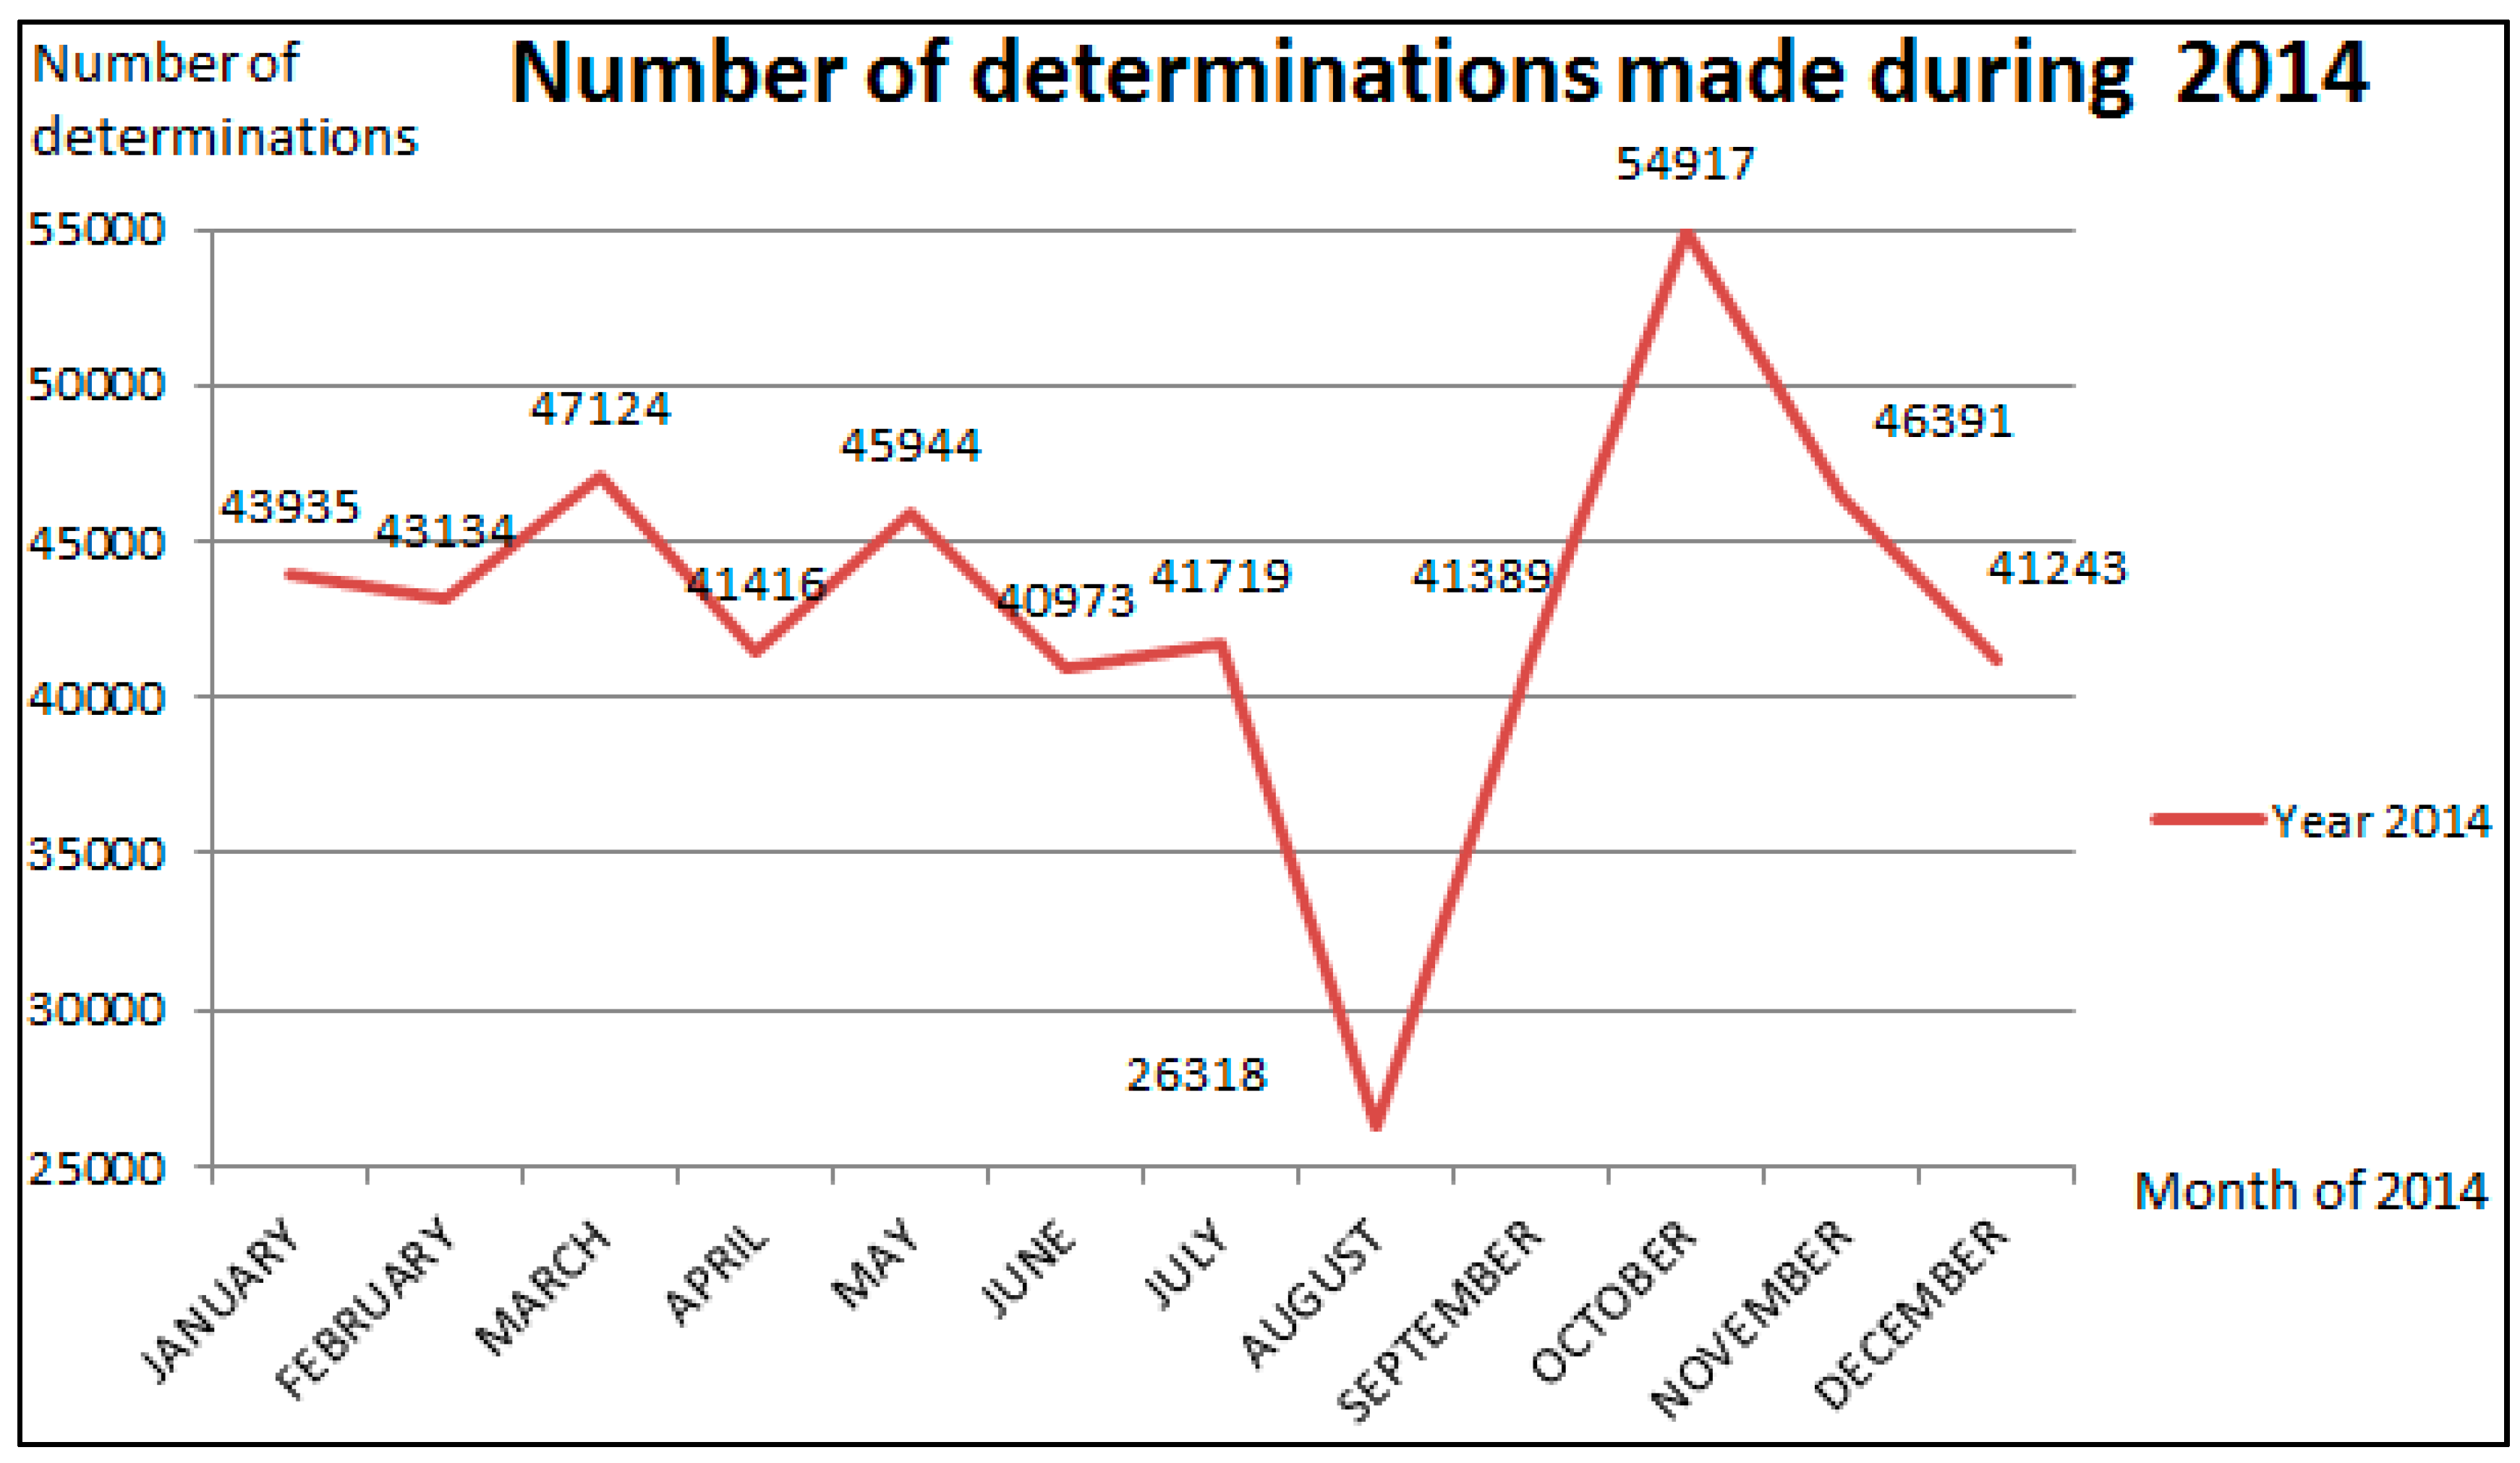
Figure 2.
Measurements performed during 2014. The vertical axis represents the number of measurements performed in the modules system of chemoluminiscence and the horizontal axis represents the months.
Figure 2.
Measurements performed during 2014. The vertical axis represents the number of measurements performed in the modules system of chemoluminiscence and the horizontal axis represents the months.
The daily period activity should be the same as during the rest of the annual period.
During the studied period the turnaround time shouldn’t be significantly different to the rest of the year.
During the period Studied, the analytical variability for each parameter should not be significantly different to the analytical variability during the rest of the year for every parameter.
It should manage the limiting factor that represents the availability of 25 positions of consumable reagent for every module which is translated into a restriction of the number of available measurements to perform the activity without resupplying the machine.
It performed all the activity with no more than two active channels for the module and for every parameter to avoiding an excessive spends of calibrations and quality controls.
Ensure the transferability of results between the tests produced in the month of August and the tests produced the rest of the year and to show the inter-comparability required by ISO 15189:2013.
Table 2.
Goals and limitations of the Agile methodology in the system under study.
Table 2.
Goals and limitations of the Agile methodology in the system under study.
| Priorities | Goal | Limitation |
|---|
| 1 | Perform the activity during the testing period with a 33% under the annual average. | The number of measurements from 1 August to 1 September should be less than the annual average. |
| 2 | Activity sets from 8 a.m. to 10.p.m. | Established time of activity. |
| 3 | Fulfill turnaround time. | The turnaround time for August shouldn’t be significantly different to the rest of the months. |
| 4 | The analytical variability should be ≤ than the quality goal established. | The analytical quality goals for each parameter. |
| 5 | Capacity limited by the availability of 25 positions per analyzer and 3 analyzers by module. | Availability of enough reagent storing capacity in the machine. |
| 6 | Working with less than 2 active channels per module. | Number of channels active to perform the measurements |
| 7 | The difference between measurements performed on different instruments should be less than the analytical quality goal. | Evidence of the inter-comparability of the measurements performed on different machines according to requirements ISO 15189. |
2.2. Availability in Positions of Reagent
The limiting factor is the availability of each analytic model for 25 positions of consumable reagent and the fact that these positions should guarantee the required amount of reagent to perform all the actions without stops for restocking. Furthermore, if it increases the number of channels dedicated to one parameter it can increase the speed of work, increasing however the calibration and quality control costs. Therefore, there is a trade-off between the speed to perform the measurements and the efficiency, the available quantity of reagent, and the technical steps to restock the consumable reagent.
To achieve a balance, it need to perform a swing in the distribution of the activity, avoiding collapses in the modules caused by the demand, by the analysis of the activity data, the number of measurements performed by channel, machine and the module.
As a follow up work methodology it applied Scrum methodology concepts [
26,
27] in which four parts involved in the activity, see
Figure 3, analyzed the follow up of the workload and the reagent necessity by the end of the day. The iteration of the adaptation process with reiteration in the following days, adjusted the fast adaptation of the reagent loading by short daily meetings to analyze the quantity and location of the reagent packages in the analytic modules depending on the activity workload, the demand proportion for those parameters, the analytical speed and the visible load in each waiting station of the analytic modules during the prior day. Our goal was to reach a balanced distribution of the petitioned measurements in channels and modules so the samples were distributed in a way in which the number of measurements was similar for every channel and avoided the analytic system collapse, allowed to perform the measurements before 8pm, ensure the availability of minimum reagent to perform the measurements with the daily demand, and maintained the turnaround time goals without collapsing the managing and waiting stations of each module.
Figure 3.
Follow up work, Scrum model, applied to the continuous adaptation of the reagent loads and the analytical channels.
Figure 3.
Follow up work, Scrum model, applied to the continuous adaptation of the reagent loads and the analytical channels.
2.3. Labor
Reducing the analytical load means a decrease in the profitability of the analytical procedures if it does not do the pertinent actions, as they reduce the viability of the analytical systems and the laboratories. If the periods of time in which the reduction of the activity is a variable that is kept among some manageable values, as the ones presented in this article, the reduction of the staff reduces the inherent costs of the profitability reduction in the processes. This proposal suggests an option to reduce the dedication of the work shifts, one in the morning and one in the afternoon, totaling 14 technical staff hours.
Therefore, to manage this system, spectrophotometry and chemiluminescent immunoassay require a total of 6.9 full time equivalents (ETC) (see
Table 3); of which 1.6 ECT are practitioners assigned to operate the modules during the morning and afternoon shifts, to which the laboratory manager is also included. It requires 5.3 ETC laboratory technicians to process the samples with the modular: 2.65 ECT during the morning shift and 2.6 of ETC during the afternoon shift. Of these, during the analyzed period of time it did not substitute 1.76 ETC during the holiday season that is covered by a reduction of the assistance work of the modular that assist in the functioning system.
We must highlight that we require additional laboratory technicians to perform the coagulation, hematological cytology tests, the blood extensions readings and the transportation of samples to the special chemical zone and the pre-analytical zone.
Table 3.
Measurements performed during the year and number of ECT assigned with the calculation of Measurements per ECT. During the month of August we did not substitute the laboratory technicians and we brought assistance in ECT in the active module.
Table 3.
Measurements performed during the year and number of ECT assigned with the calculation of Measurements per ECT. During the month of August we did not substitute the laboratory technicians and we brought assistance in ECT in the active module.
| Month | Measurements/Month | ECT/Month | Measurements/ECT |
|---|
| January | 43.935 | 1.76 | 24.869 |
| February | 43.134 | 1.76 | 24.415 |
| March | 47.124 | 1.76 | 26.674 |
| April | 41.416 | 1.76 | 23.443 |
| May | 45.944 | 1.76 | 26.006 |
| June | 40.973 | 1.76 | 23.192 |
| July | 41.719 | 1.76 | 23.615 |
| August | 26.318 | 1.56 | 24.828 |
| September | 41.389 | 1.76 | 23.428 |
| October | 54.917 | 1.76 | 31.085 |
| November | 46.391 | 1.76 | 26.259 |
| December | 41.243 | 1.76 | 23.345 |
| Total | 514.503 | - | - |
2.4. Analytical Variability
To be able to compare the analytical variability obtained during the month of August and the one obtained during the rest of the months, it used all the values of the internal quality control obtained during the days of activity in August and compared them with the values obtained in the internal quality control of the pertinent prior and following months. It compared the results lot by lot used of the quality control in the two periods of analysis, it excluded the atypical data using as reference the difference between the first quartile and the third quartile or interquartile value, taking and excluding as a typical value the one set 1.5 times that distance of one of the quartiles and the Shapiro-Wilk test. We identified the results with non-normal distribution with the Shapiro-Wilk test and we applied the Mann-Whitney test for two independent samples and a meaning level of
p < 0.05. For samples with a normal distribution, the
T test of two normal independent samples for a mining level of
p < 0.05. For the statistical computation it used Excel
® along with Real Statistics
® [
28] Inter-comparability of the results were among analytical modules.
To show the inter-comparability required by the ISO 15189:2013 and to guarantee the transferability of the results among redundant modules according to Bland-Altman analysis, EP10a (CLSI). It applied manual criteria and auto-validation with limits established for lot analytical series, analytical quality goals derived from the biological variability theory obtained from the scientific literature for the intern quality control, and total error goals defined by the external quality programs.
It analyzed the same samples with the two analyzers. It identified the module and the analytical channel utilized of each instrument and compared the results obtained during the month of August and the rest of the year.
3. Results and Discussion
3.1. Activity Times
During the time period of this study, we kept the daily activity times without variation, reducing the usage of two work shifts: a morning one from 8 a.m. to 3 p.m., and an afternoon one from 3 p.m. to 10 p.m.
3.2. Activity Performed
The activity performed for the total of parameters defined in
Table 1 during the month of August of 2014 was of 5.2% of the year activity. The average performed during 2014 was of 42,925 measurements per month, meaning that during August we performed 62.2% of the average annual measurements. The evolution of the demand depends on the seasonal period can be seen in
Figure 2.
3.3. Compliance with the Turnaround Times
The turnaround time [
29] is the time required for a result to be used by the petitioning doctor, considered between the entrance of the sample to the laboratory and the inclusion of the result in the electronic clinical history, available to be read by the petitioner. For the analytic parameters included in this article, the LRC has the turnaround time obtained from health care centers and outpatient clinics. The physician has available the analytical results in the computerized clinical history with 92% of the measurements within the established range, see
Table 1. It measures the percentages of non-compliance and we evaluate them by probability of occurrence [
30] see
Figure 4.
Figure 4 shows the representations of the monthly evolution of all parameters. To establish if there are significant differences among the obtained values during the period between January and December of 2014, excluding August and comparing it with the values obtained during August, it analyzed the number of measurements that do not meet the turnaround times for each period and the total delivered results. We applied the Bi nominal distribution model, obtaining the non-compliance percentage.
In
Figure 4, it can see the evolution of the percentage of noncompliance of the turnaround time is shown, in which peaks of noncompliance along the months can be observed. In the figure, one can also see specific cases of non-compliance in a number than can reach up to 14% of one specific parameter. One can also see that the daily incidents that affect the turnaround time are from the noncompliance turnaround delivery times of reagent, as is the case in January and April, to the technical malfunctions experienced in the autoanalyzer during June. Over the months, it can see different percentages of noncompliance that never exceed the 2% and that are caused by several causes of heterogeneous type.
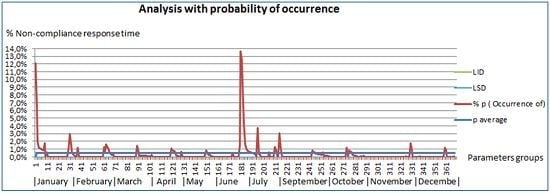
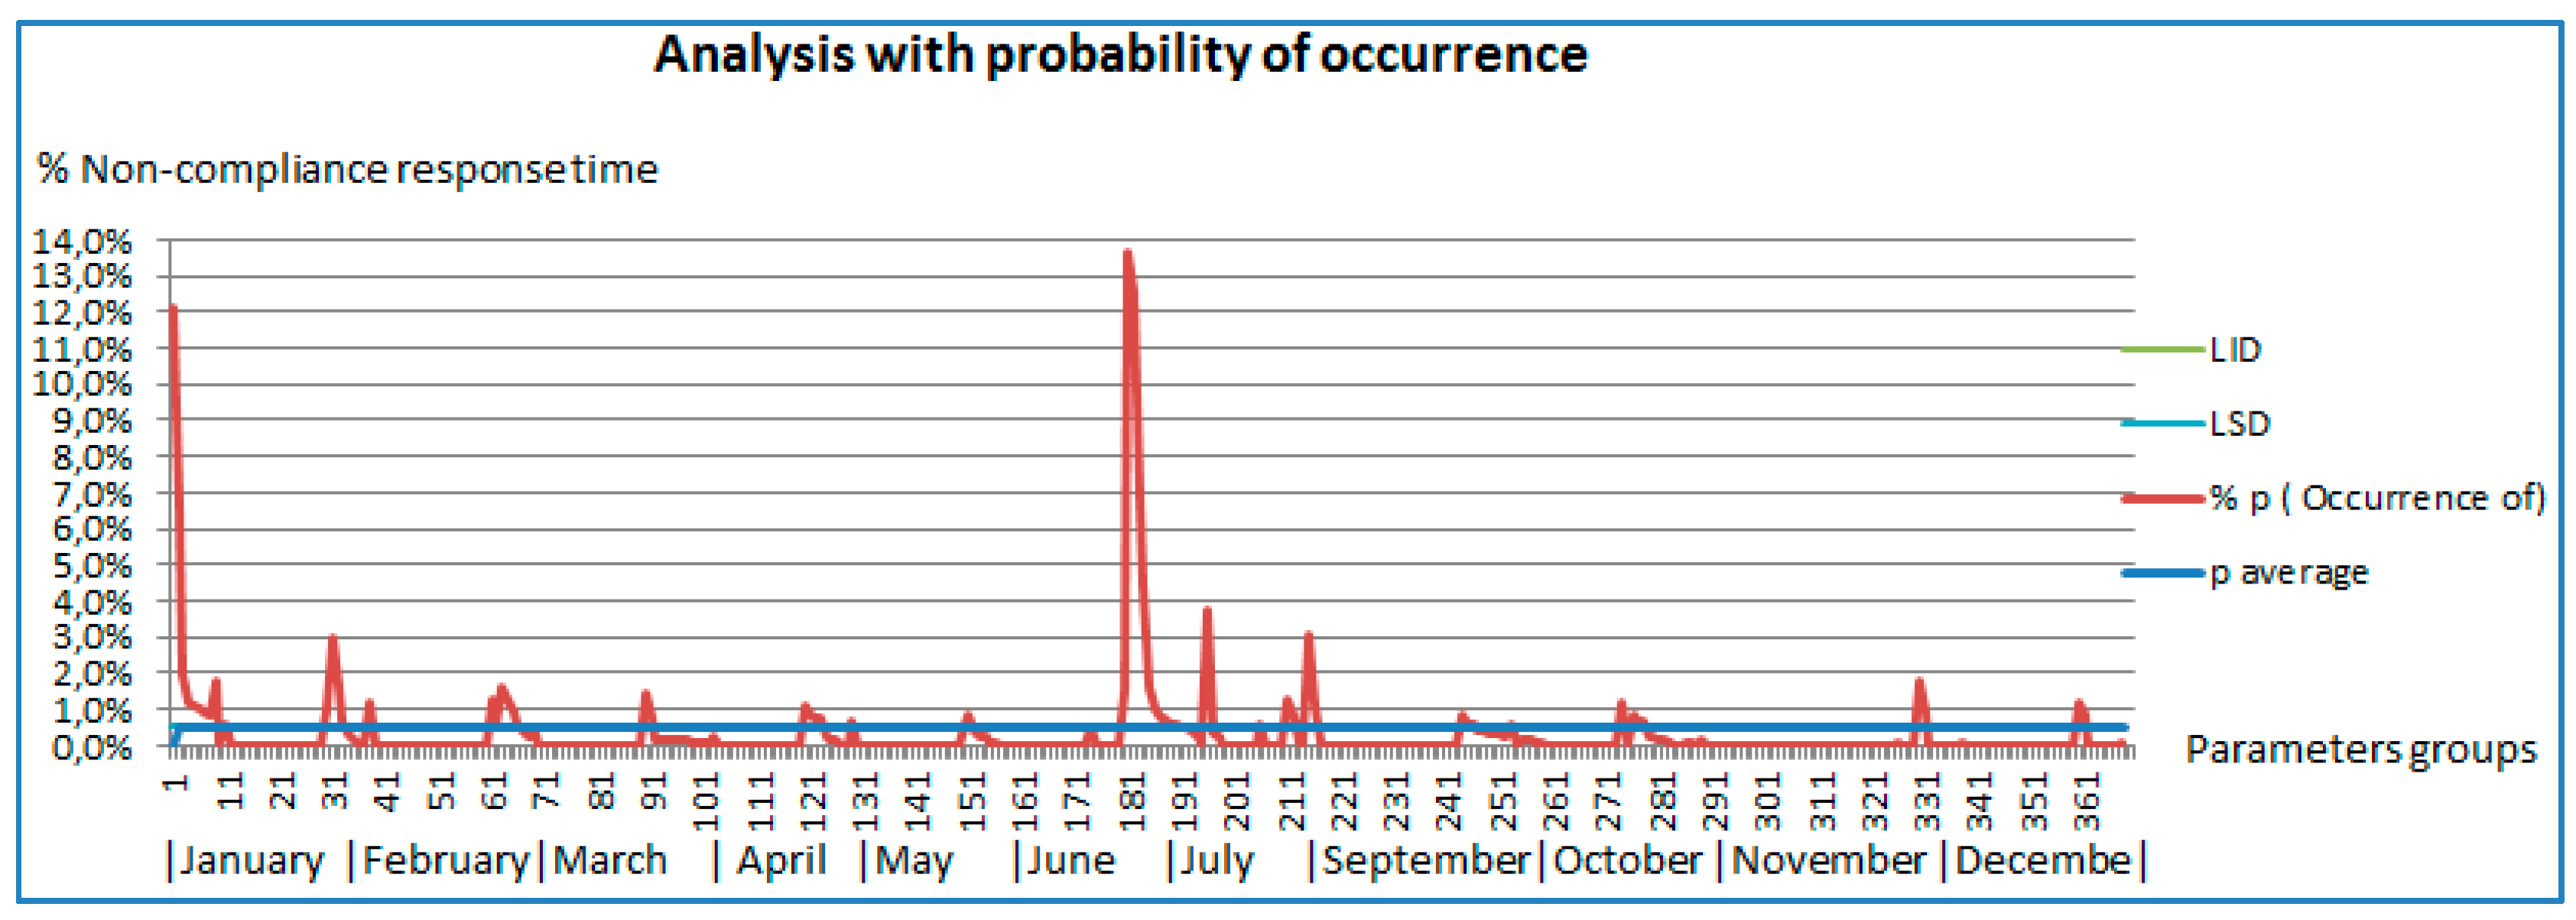
Figure 4.
Analysis with probability of occurrence of low probability events according to Swertward [
30]. Probability of occurrence of measurements that exceeded the turnaround time per parameter during the analyzed month.
Figure 4.
Analysis with probability of occurrence of low probability events according to Swertward [
30]. Probability of occurrence of measurements that exceeded the turnaround time per parameter during the analyzed month.
Where
p/
n are the defects per measurement;
, average probability is 0.5%;
n, the number of samples 2607; and the limits of control are calculated from the following Equations (1) and (2):
By checking the prior graphics, it can see that during the period January–November, without including August, which is the subject of this analysis, the average noncompliance is off 0.5% of the measurements, being having the upper control limit of 1.7% and the lower limit of 0.1%. In the graphic, it can also see that two parameters exceed the 10% limit: one in the month of January and another one in the month of July.
These turnaround times correspond to the parameters of Ac against the against surface Hepatitis B antigen serum of the month of January, with a compliance of 87.9% (12.1% of noncompliance), the CEA of the month of July with a compliance of 87.5% (12.5% of noncompliance), and of the PSA of the month of July with a compliance of 86.3% (13.7% of noncompliance). In the analyzed period of the month of August (see
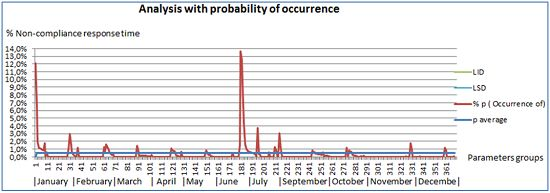
Figure 5), all the turnaround times are within the goals-higher than 90%, with an average of 0.47% of probability of occurrence (noncompliance), an upper control limit of 1.7% and a lower control limit off −1.5%.
Figure 5.
Analysis with probability of occurrence of low probability events according to Swertward [
30]. Probability of occurrence of measurements that exceeded the turnaround time per parameter during the month of August. On the 30th and the 31st it didn’t have not any activity (Saturday, Sunday).
Where
p/
n are the defects per measurement,
is off 0.47%,
n the number of sampling 276, and the control limits are calculated from the following Equations (3) and (4):
Comparative Analysis of the analysed time periods from January to December compared to August.
By applying the binomial model for the percentage of noncompliance cases for a significance level of p < 0.01, it obtain values of noncompliance percentage for the month of August (p = 0.00156) that are within the confidence interval for the noncompliance percentage during the rest of the year p = 0.0014. With a confidence interval from 0.0010 to 0.0021 for a significance level of p < 0.01.
3.4. Analytical Variability
The results from comparing lot by lot the data from every quality control from the month of August and the months of July and September are shown in
Table 4. There, one can see the results of the comparative statistical analysis for the two levels of quality control. On the one hand, the N1 quality control has a value within the technical reference values. On the other hand, the quality control level N2 has a value within the pathological values. In the columns Quality Control N1 and Quality Control N2, it describe the statistical procedure that it applied, and it mention if there is statistical significance or not. On the results, we discovered that both in normal and non-normal distributions, it can’t dismiss the initial hypothesis in which it was established that there is no statistical significance of the analysed data of the data analyzed are different.
Table 4.
Statistical technique applied to each level of quality control per parameter and its meaning, incorporated as a unique analytical unit.
Table 4.
Statistical technique applied to each level of quality control per parameter and its meaning, incorporated as a unique analytical unit.
| Parameter | Quality Control N1 | Quality Control N2 |
|---|
| Srm-Antibody against surface Hepatitis B Antigen | Mann-Whitney not significant p > 0.05; N1:340; N2:91 | T test for two independent, normal samples p > 0.05; N1:323; N2:85 |
| Srm-Antibody Ig M against core Hepatitis B Antigen | Mann-Whitney significant p > 0.05; N1:26; N2:26 | Mann-Whitney not significant p > 0.05; N1:63; N2:63 |
| Srm-Antibody against core Hepatitis B Antigen | Mann-Whitney not significant p > 0.01; N1:84; N2:84 | Mann-Whitney not significant p > 0.01; N1:84; N2: 84 |
| Srm-alfa-Fetoprotein | Mann-Whitney not significant p > 0.01; N1:332; N2:27 | Mann-Whitney not significant p > 0.01; N1:331; N2:23 |
| Srm-Antibody Ig G against Citomegalovirus | Mann-Whitney not significant p > 0.05; N1:54; N2:31 | Mann-Whitney not significant p > 0.01; N1:53; N2:32 |
| Srm-Antibody Ig M against Citomegalovirus | Mann-Whitney not significant p > 0.05; N1:78; N2:31 | Mann-Whitney not significant p > 0.05; N1:44; N2:29 |
| Srm-Antibody IgG against Hepatitis C | Mann-Whitney not significant p > 0.05; N1:54; N2:31 | Mann-Whitney not significant p > 0.01; N1:53; N2:32 |
| Srm-Antibody IgG against Rubella | Mann-Whitney not significant p > 0.05; N1:78; N2:31 | Mann-Whitney not significant p > 0.05; N1:44; N2:29 |
| Srm-Antibody IgG against Toxoplasma gondii | Mann-Whitney not significant p > 0.01; N1:192; N2:27 | Mann-Whitney not significant p > 0.01; N1:203; N2:27 |
| Srm-Antibody IgM against Hepatitis A | T test for two independent, normal samples p > 0.05; N1:69; N2:71 | Mann-Whitney not significant p > 0.01; N1:66; N2:199 |
| Srm-Antibody IgM against Toxoplasma gondii | Mann-Whitney not significant p > 0.05; N1:159; N2:25 | Mann-Whitney not significant p > 0.05; N1:92; N2:26 |
| Srm-Antibody against Treponema pallidum | Mann-Whitney not significant p > 0.05; N1:55; N2:9 | Mann-Whitney not significant p > 0.01; N1:206; N2:33 |
| Srm-Antibody against Hepatitis A totals | Mann-Whitney not significant p > 0.05; N1:126; N2:22 | Mann-Whitney not significant p > 0.01; N1:89; N2:19 |
| Srm-Antibody against HIV | Mann-Whitney not significant p > 0.05; N1:137; N2:27 | Mann-Whitney not significant p > 0.05; N1:115; N2:26 |
| Srm-Carcinoembrionari Antigen (CEA) | T test for two independent, normal samples p > 0.05; N1:399; N2:30 | T test for two independent, normal samples p > 0.05; N1:78; N2:71 |
| Srm-Prostàtic Specific Antigen (PSA) | Mann-Whitney not significant p > 0.05; N1:64; N2:314 | Mann-Whitney not significant p > 0.05; N1:64; N2:79 |
| Srm-Free Prostatic Specífic Antigen | Mann-Whitney significant p > 0.05; N1:64; N2:314 | T test for two independent, normal samples p > 0.05; N1:64; N2:79 |
| Srm-Surface Hepatitis B Antigen | T test for two independent, normal samples p > 0.05; N1:487; N2:15 | Mann-Whitney not significant p > 0.01; N1:489; N2:18 |
| Srm-CA 125 | Mann-Whitney not significant p > 0.05; N1:72; N2:72 | T test for two independent, normal samples p > 0.05; N1:90; N2:68 |
| Srm-CA 15.3 | T test for two independent, normal samples p > 0.05; N1:414; N2:73 | T test for two independent, normal samples p > 0.05; N1:244; N2:73 |
| Srm-CA 19.9 | Mann-Whitney not significant p > 0.05; N1:449; N2:77 | Mann-Whitney not significant p > 0.05; N1:445; N2:75 |
| Srm-Ferritin | Mann-Whitney not significant p > 0.05; N1:505; N2:66 | Mann-Whitney not significant p > 0.05; N1:504; N2:74 |
| Srm-Folate | T test for two independent, normal samples p > 0.05; N1:438; N2:161 | T test for two independent, normal samples p > 0.05; N1:795; N2:69 |
| Srm-Testosterone | Mann-Whitney not significant p > 0.01; N1:197; N2:18 | Mann-Whitney not significant p > 0.05; N1:185; N2:13 |
| Srm-Tirotropine (TSH) | Mann-Whitney not significant p > 0.05; N1:501; N2:30 | Mann-Whitney not significant p > 0.01; N1:143; N2:34 |
| Srm-Free Tiroxin (T4 free) | T test for two independent, normal samples p > 0.05; N1:70; N2:401 | T test for two independent, normal samples p > 0.05; N1: 63; N2:394 |
| Srm-Free Triiodotironine (FT3) | Mann-Whitney not significant p > 0.05; N1:116; N2:26 | Mann-Whitney not significant p > 0.05; N1:185; N2:25 |
| Srm-Vitamine B12 | Mann-Whitney not significant p > 0.05; N1:222; N2:573 | Mann-Whitney not significant p > 0.01; N1:218; N2:450 |
| Srm-Vitamine D (25 OH) | Mann-Whitney not significant p > 0.05; N1:194; N2:194 | Mann-Whitney not significant p > 0.05; N1:184; N2:184 |
3.5. Guarantee of Transferability of Results
To assess the transferability of results between different machines and positions, we perform the assessment of patient samples analyzed by the two machines. All are compared by Bland-Altman charts [
31].
From the Bland-Altman charts (see
Figure 6,
Figure 7,
Figure 8,
Figure 9,
Figure 10,
Figure 11 and
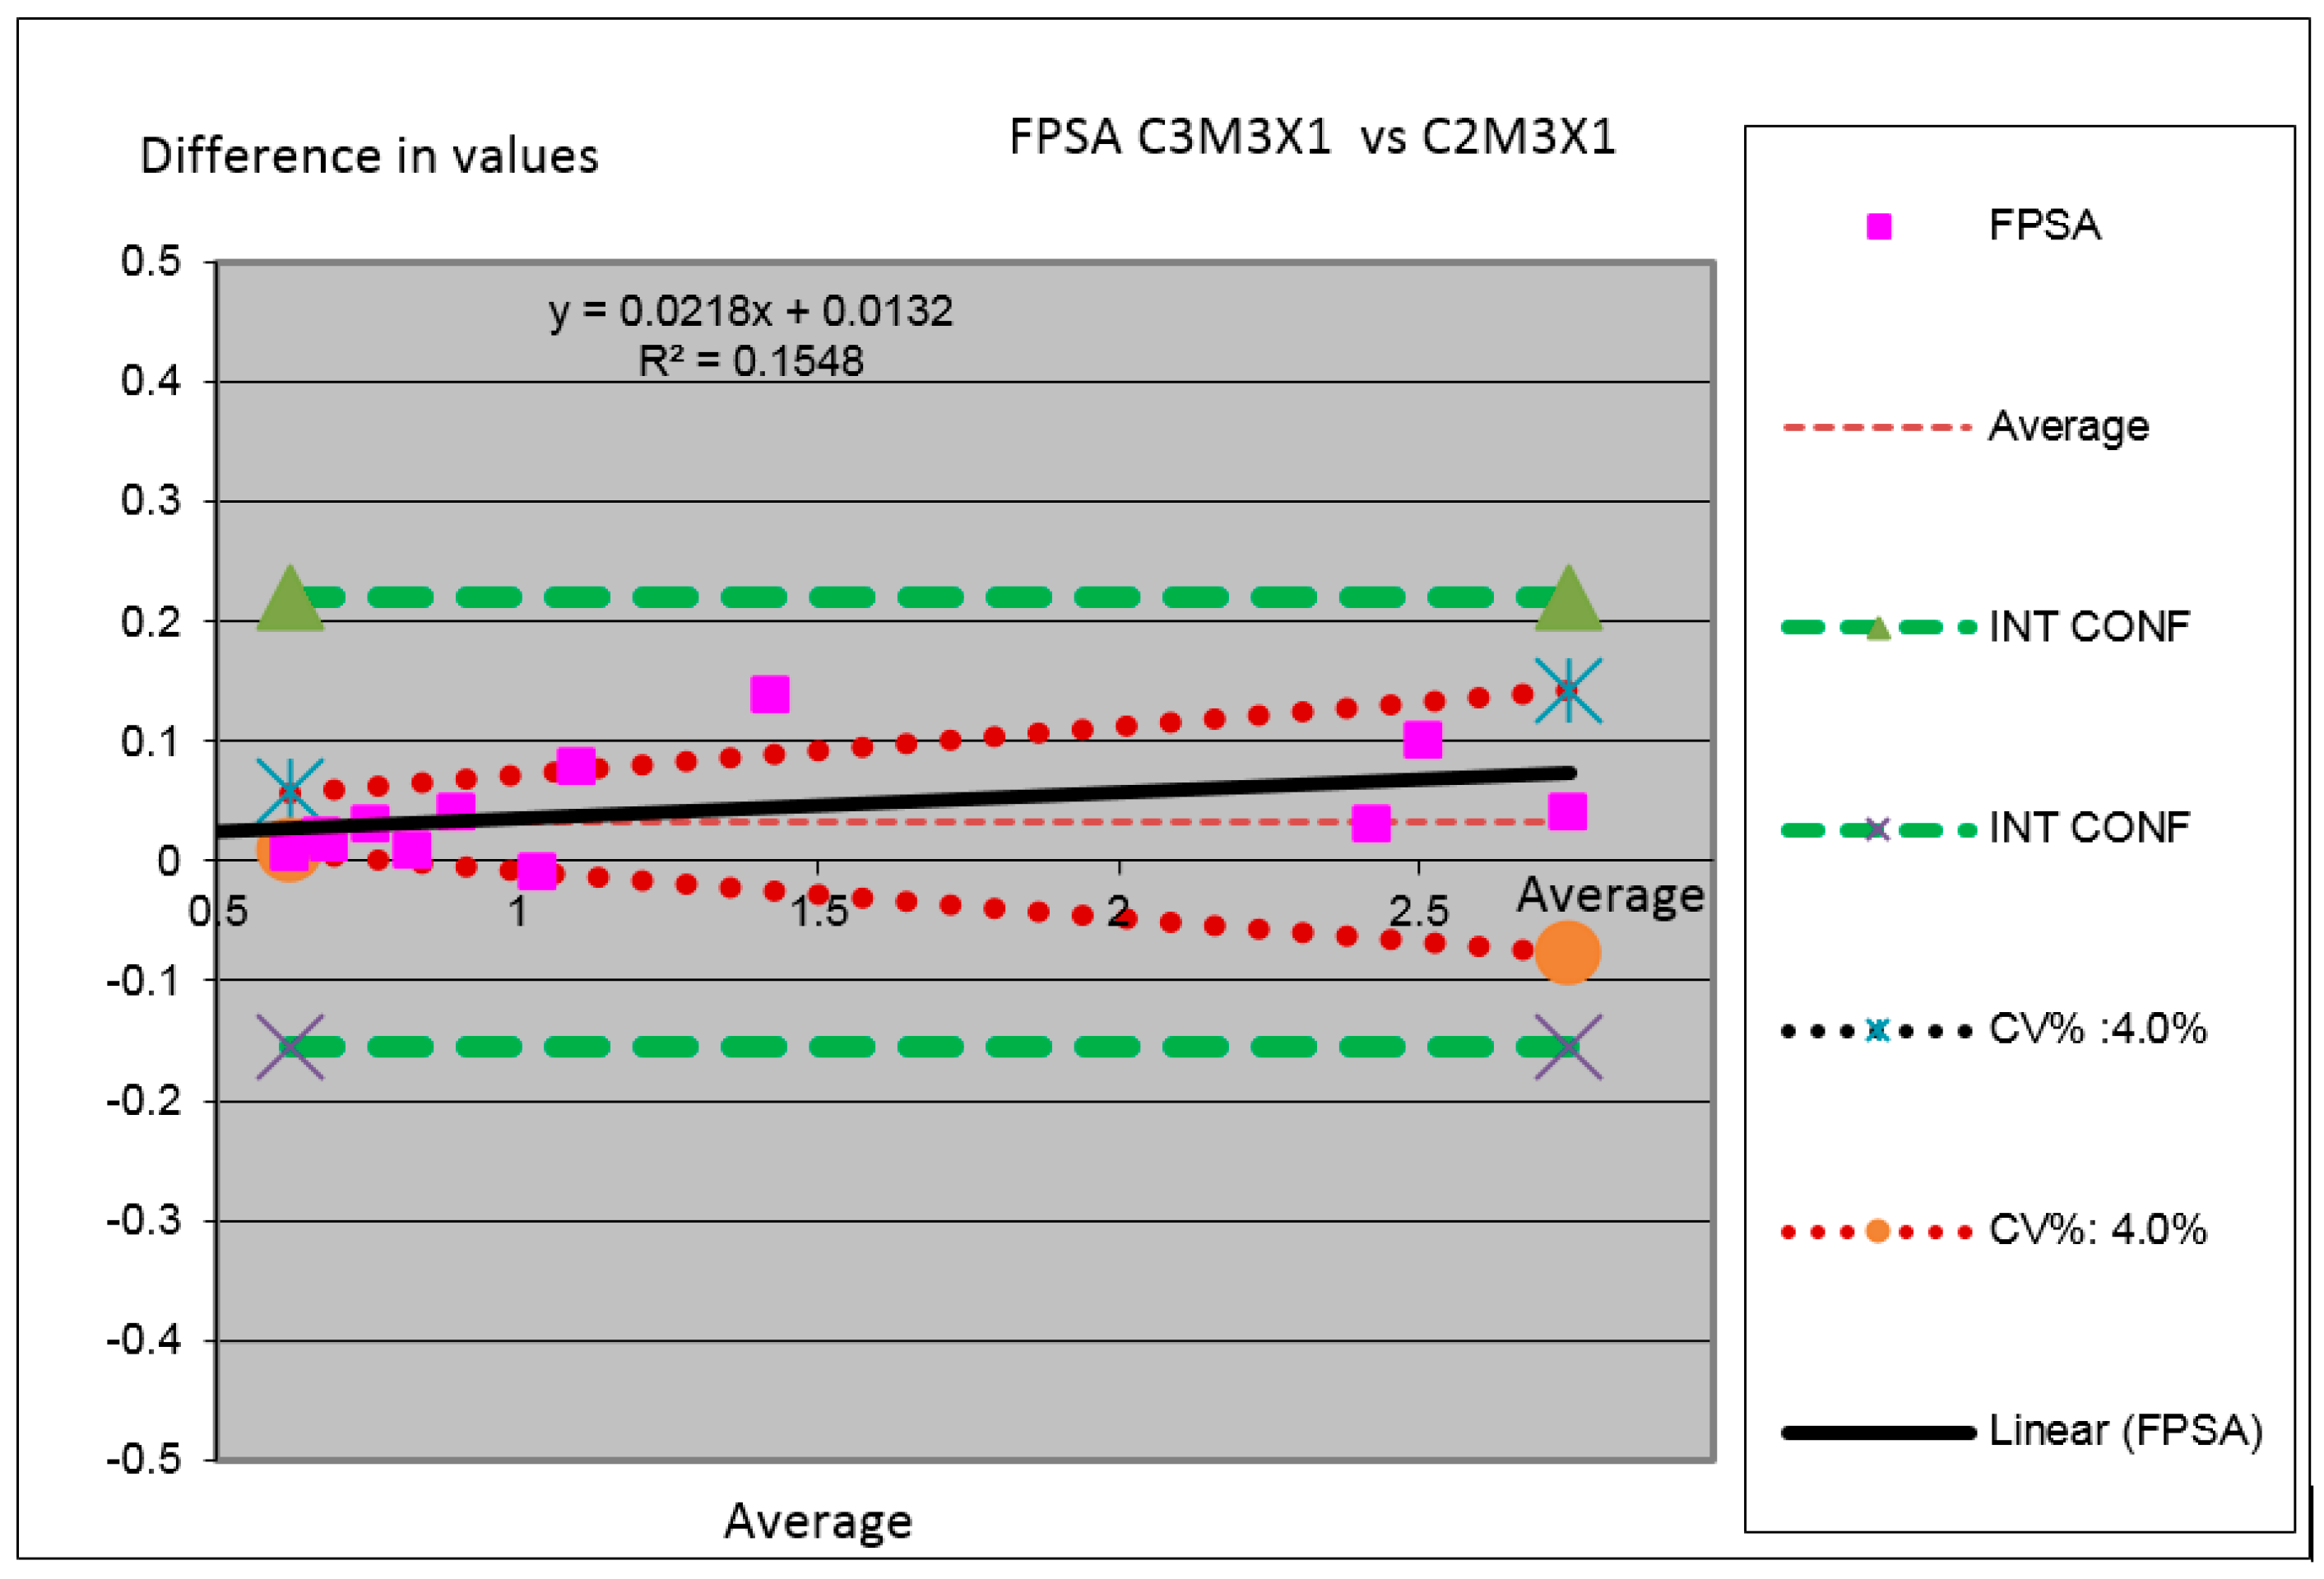
Figure 12) one can see the lines of the confidence intervals among which it need to contain the zero value. The continuous red lines correspond to the values of the maximum analytical quality goals obtained from the error goals for the Spanish external quality control program of the analytical laboratories of the Fundació Pel Control de Qualitat dells Laboratories Clínics (FPCQLC). In the charts, it also identifies the analysers and the analytical modules and the operative channels of each module.
Figure 6.
Comparison between modules for the TSH parameter in which it have compared the results obtained by the measurements performed in the two machines (Analyser C3 substituted by C2 in which the Module 2 is substituted by the module M1 and the channel X2 is substituted by the channel X1).
Figure 6.
Comparison between modules for the TSH parameter in which it have compared the results obtained by the measurements performed in the two machines (Analyser C3 substituted by C2 in which the Module 2 is substituted by the module M1 and the channel X2 is substituted by the channel X1).
Figure 7.
Comparison between modules for the Vitamin B12 parameter in which we have compared the results obtained by the measurements performed in the two machines (Analyzer C3 substituted by C2 in which the Module 1 is substituted by the Module M2 and the Channel X1 is substituted by the Channel X1).
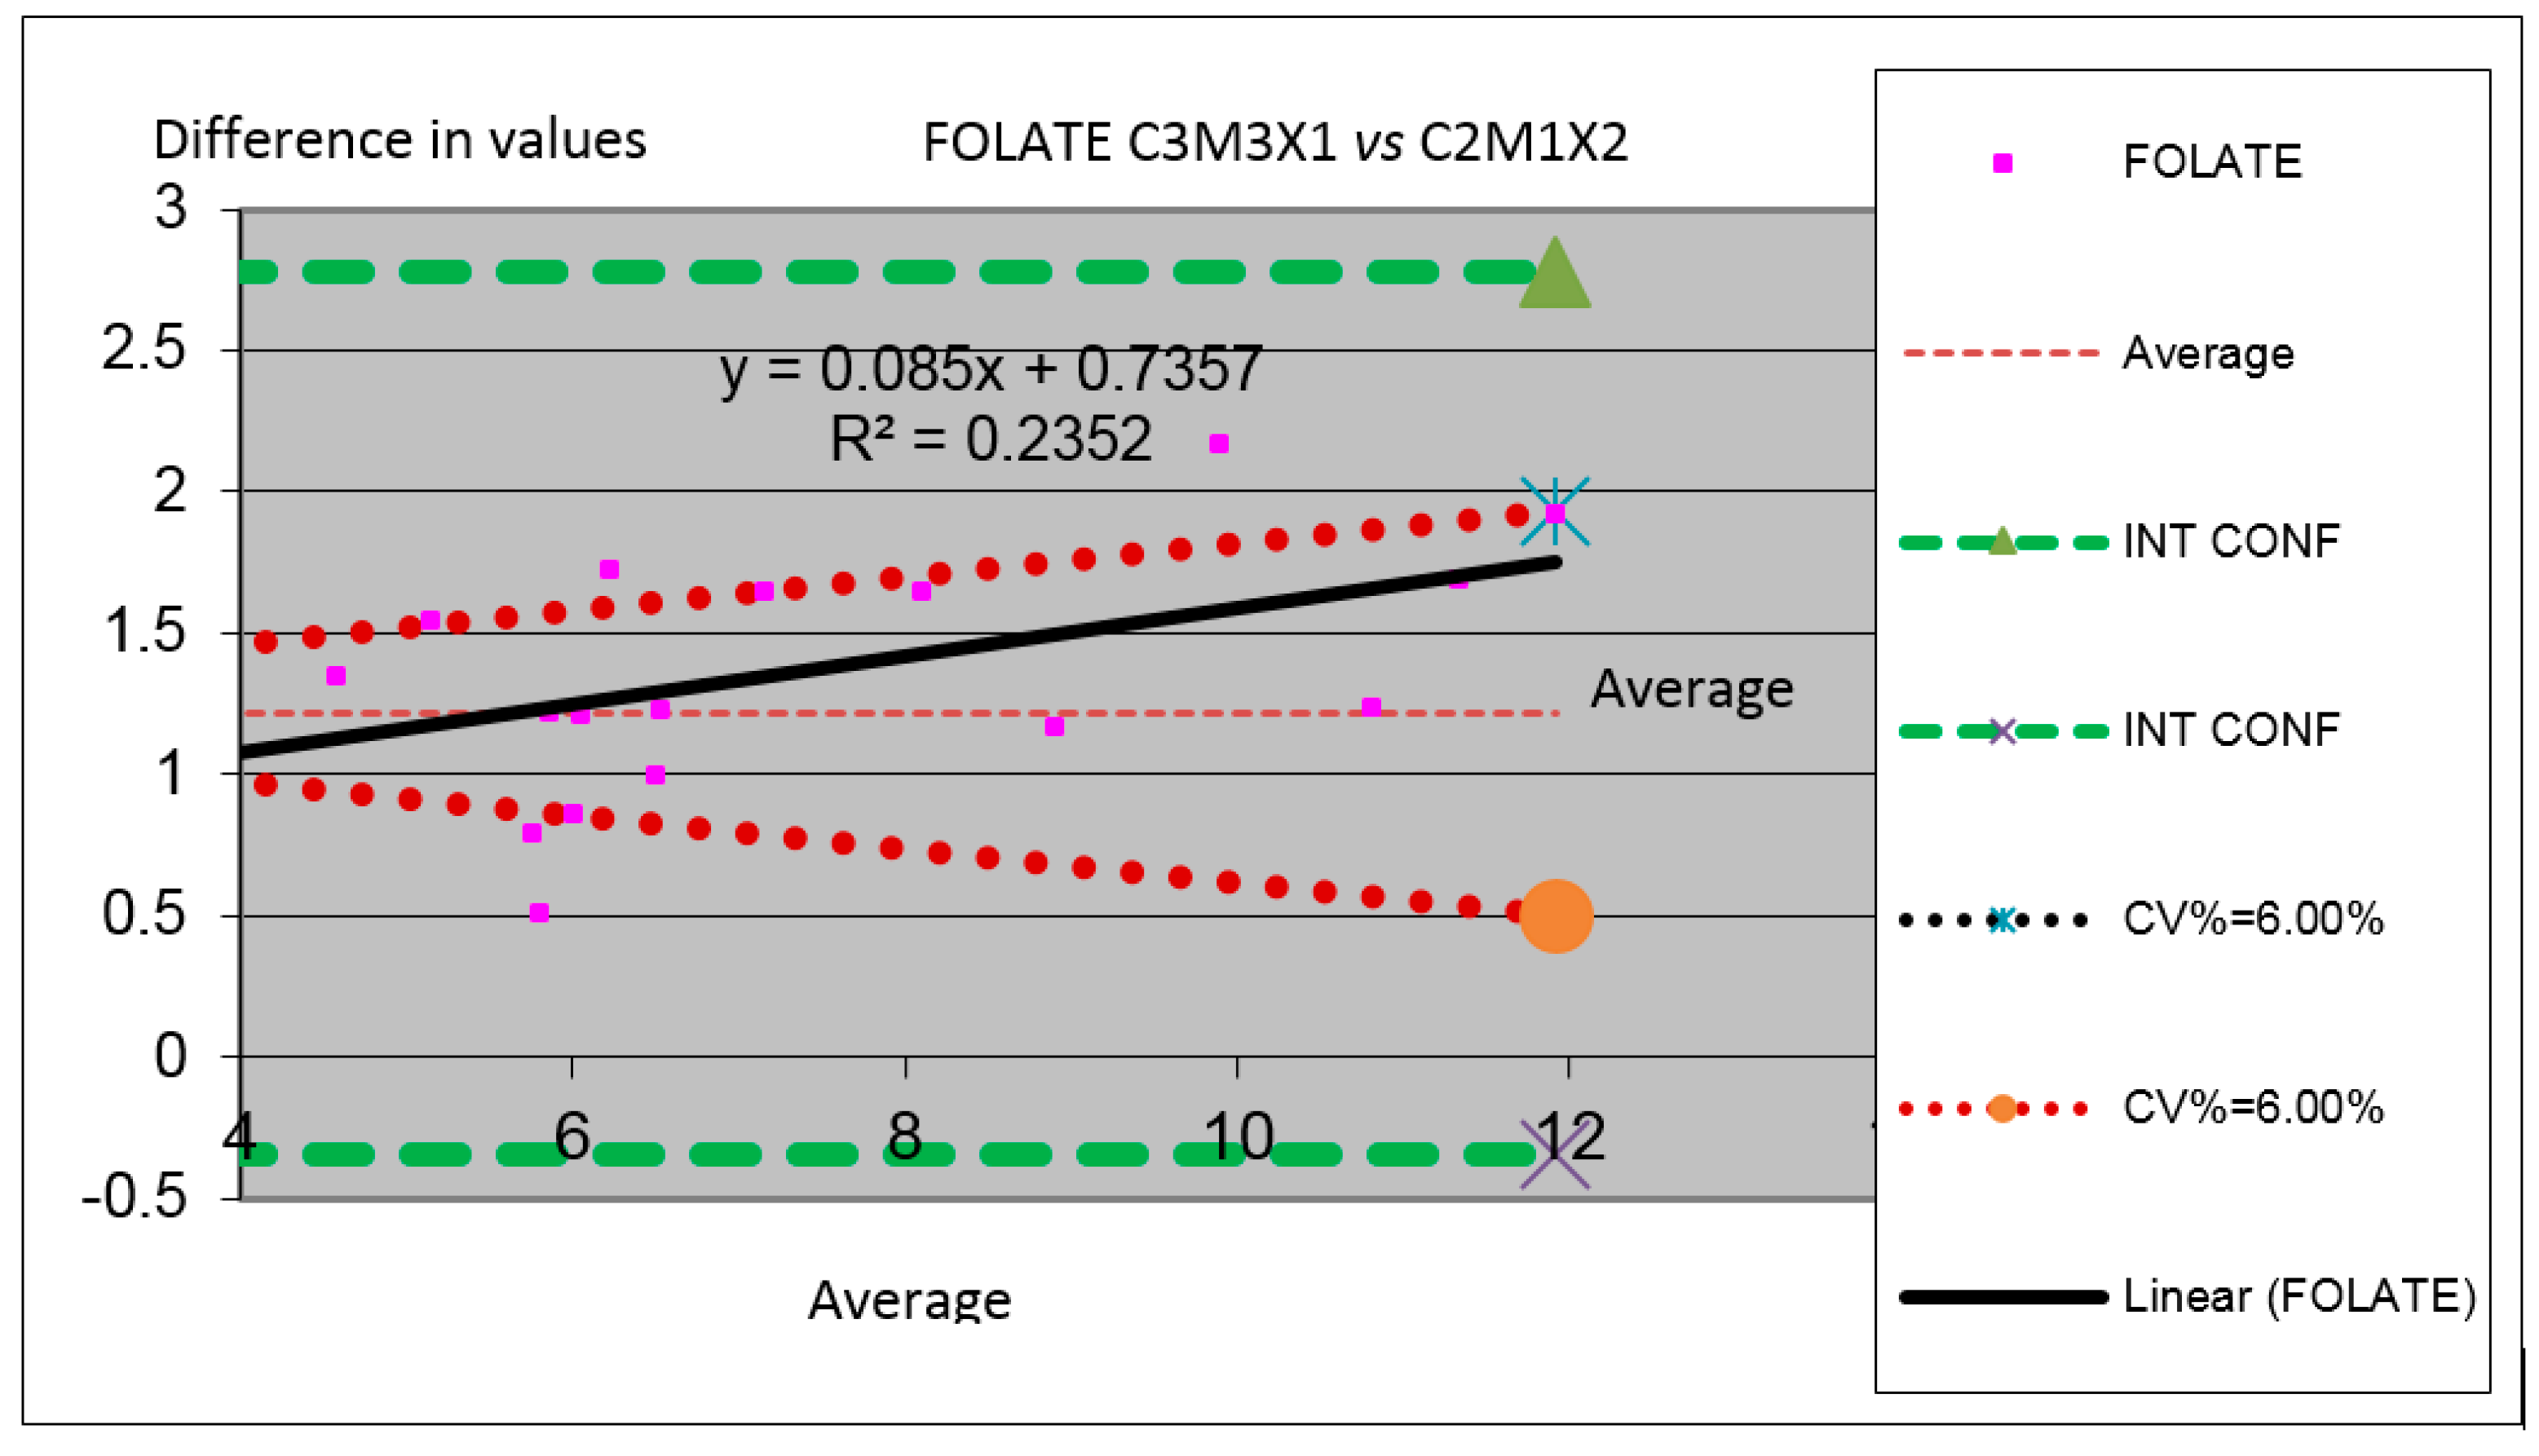
Figure 8.
Comparison between modules for the Folate parameter in which we have compared the results obtained by the measurements performed in the two machines (Analyzer C3 substituted by C2 in which the Module 3 is substituted by the Module M1 and the Channel X1 is substituted by the Channel X2).
Figure 8.
Comparison between modules for the Folate parameter in which we have compared the results obtained by the measurements performed in the two machines (Analyzer C3 substituted by C2 in which the Module 3 is substituted by the Module M1 and the Channel X1 is substituted by the Channel X2).
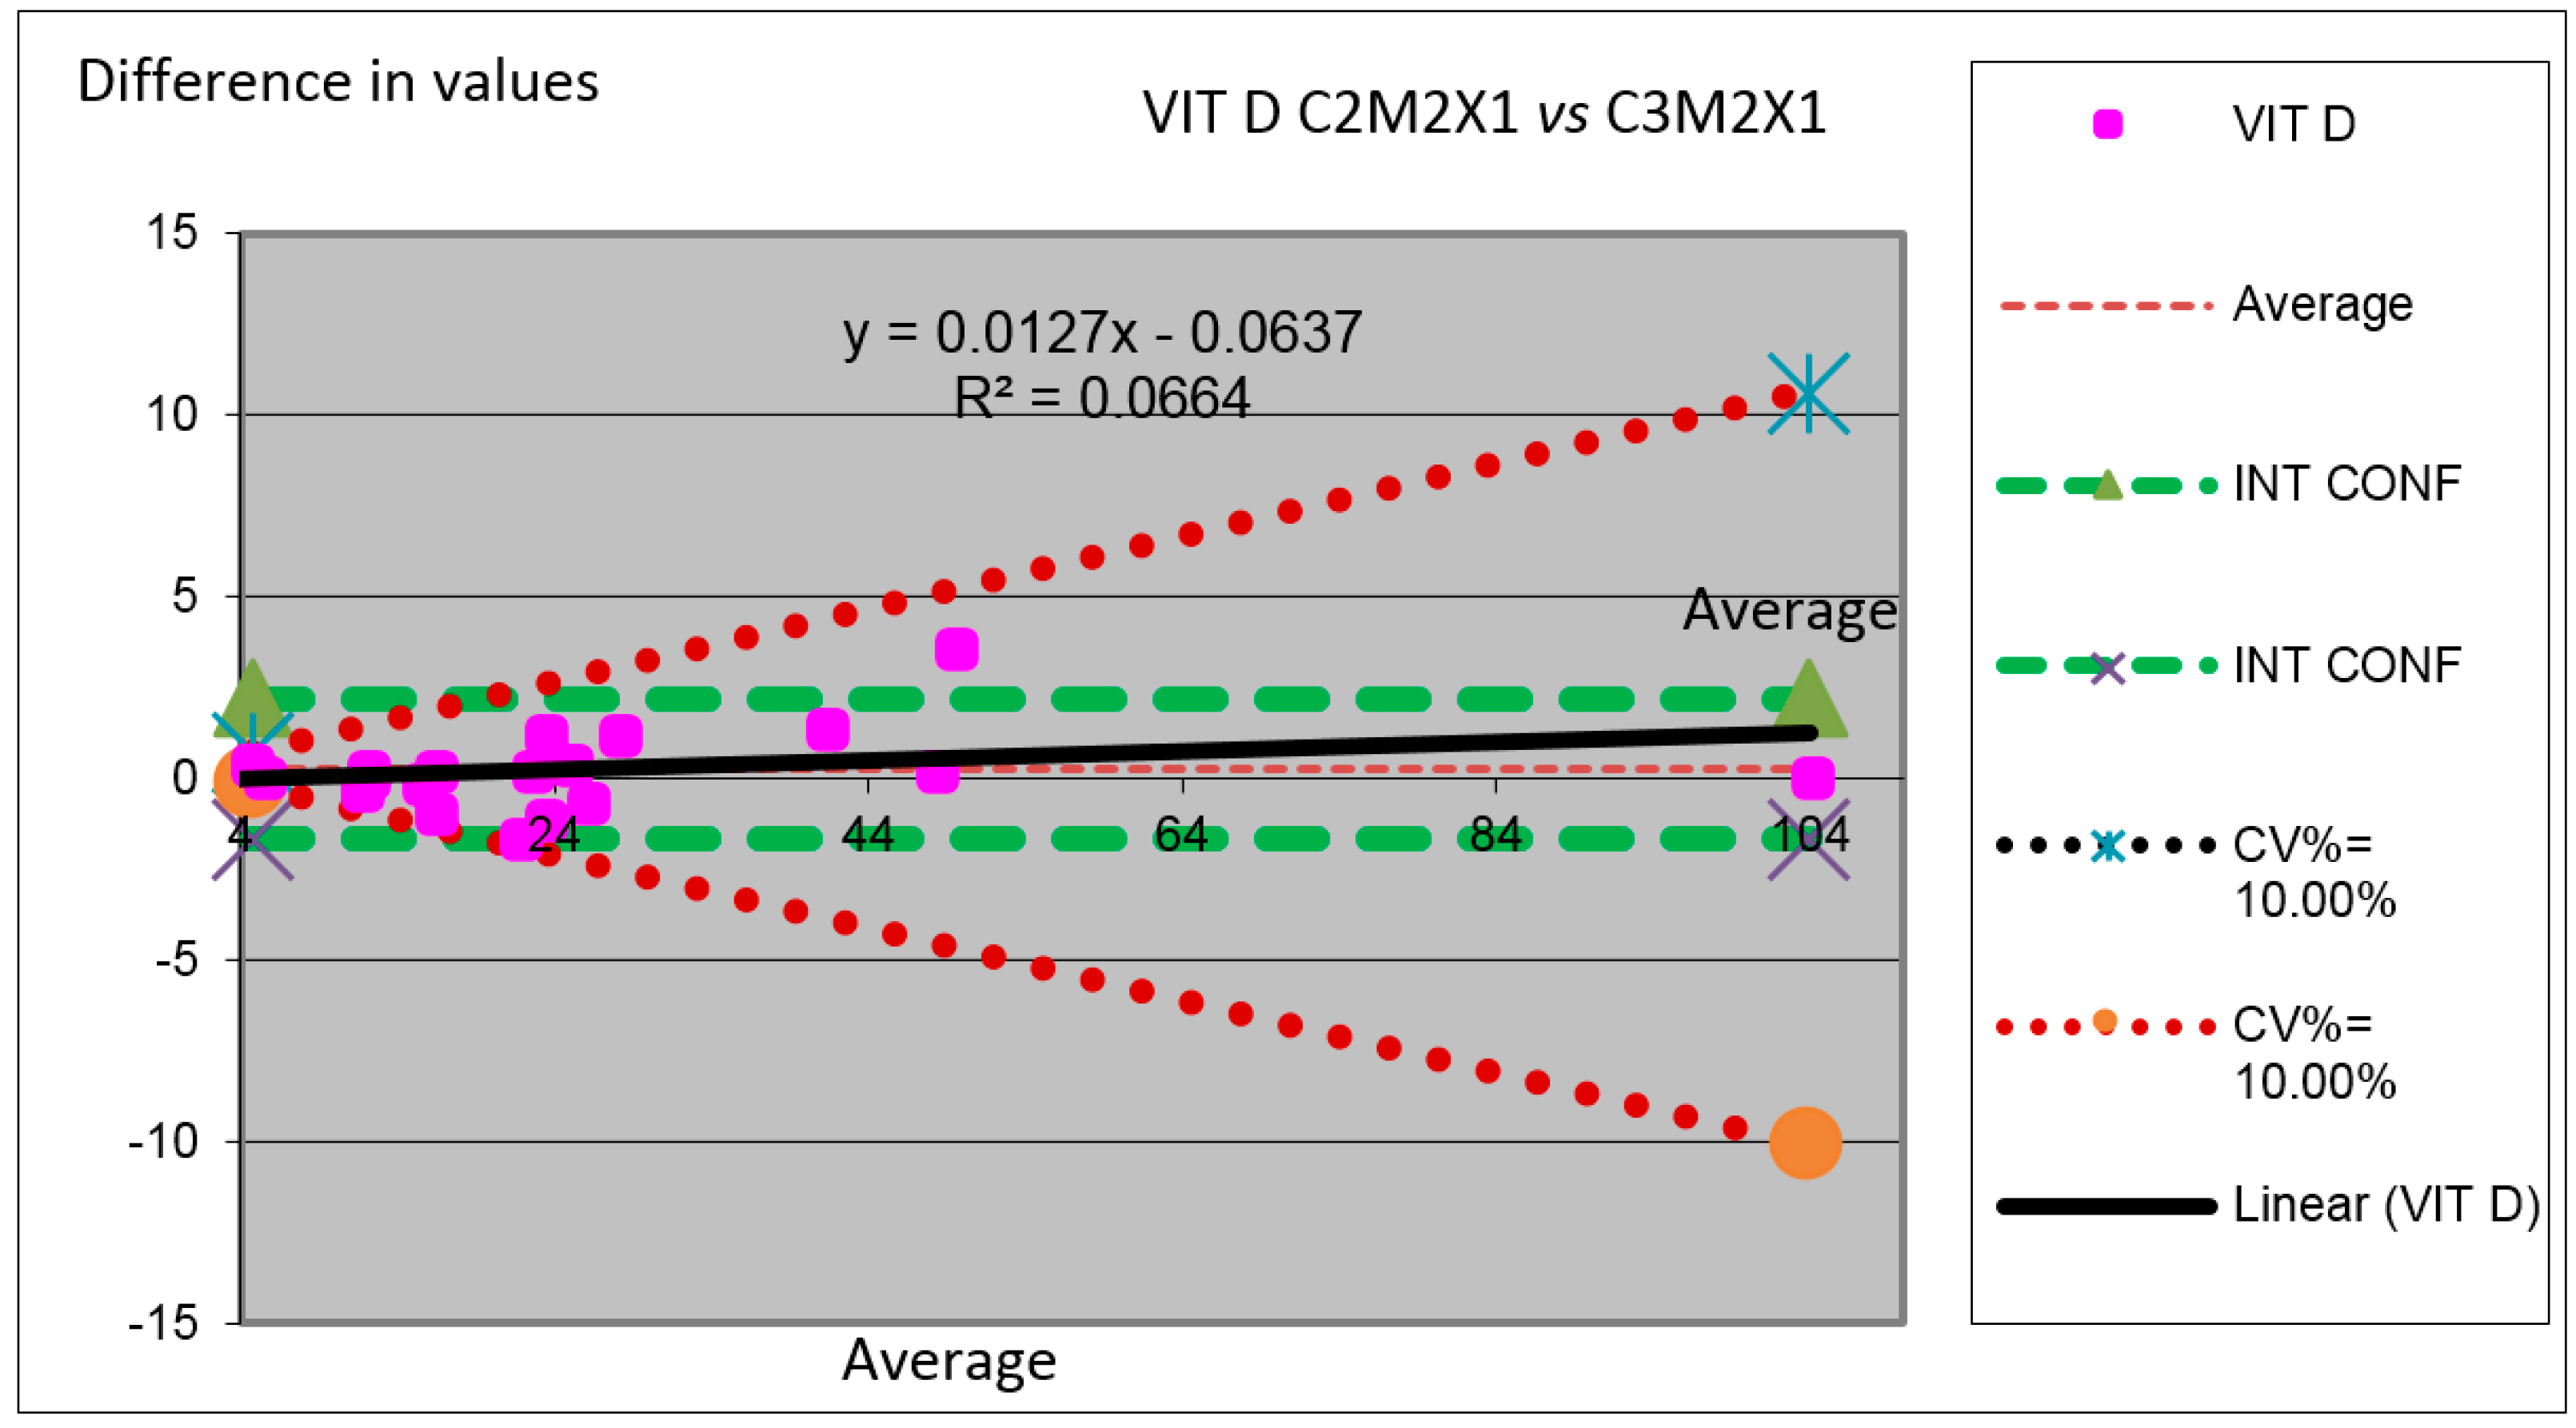
Figure 9.
Comparison between modules for the Vitamin D parameter in which we have compared the results obtained by the measurements performed in the two machines (Analyzer C3 substituted by C2 in which the Module 2 is substituted by the Module M2 and the Channel X1 is substituted by the Channel X1).
Figure 10.
Comparison between modules for the Ferritin parameter in which we have compared the results obtained by the measurements performed in the two machines (Analyzer C3 substituted by C2 in which the Module 3 is substituted by the Module M3 and the Channel X2 is substituted by the Channel X2).
Figure 11.
Comparison between modules for the parameter Free T4 in which we have compared the results obtained by the measurements performed in the two machines (Analyzer C3 substituted by C2 in which the Module 2 is substituted by the Module M3 and the Channel X1 is substituted by the Channel X1).
Figure 11.
Comparison between modules for the parameter Free T4 in which we have compared the results obtained by the measurements performed in the two machines (Analyzer C3 substituted by C2 in which the Module 2 is substituted by the Module M3 and the Channel X1 is substituted by the Channel X1).
Figure 12.
Comparison between modules for the Free Prostatic Specific Antigen (FPSA) parameter, in which we compared the results obtained by the measurements performed in the two machines (Analyzer C3 substituted by C2 in which the Module 3 is substituted by the Module M3 and the Channel X1 is substituted by the Channel X1).
We did not perform any comparatives from techniques that do not require machine transfer.
In
Figure 6 one can observe parameter TSH for comparing the value obtained for the same serums of different samples in both instrumental arrangements analyzed. One can see the minimal difference between the results of analyzers.
In
Figure 7 one can observe parameter Vitamin B 12 for comparing the value obtained for the same serums of different samples in both instrumental arrangements analyzed. One can see the minimal difference between the results of analyzers.
In
Figure 8 one can observe parameter Folate for comparing the value obtained for the same serums of different samples in both instrumental arrangements analyzed. One can see the deviation into the interval of confidence between the results of analyzers.
In
Figure 9 one can observe parameter Vitamin D for comparing the value obtained for the same serums of different samples in both instrumental arrangements analyzed. One can see the minimal difference between the results of analyzers.
In
Figure 10 it can observe parameter Ferritin for comparing the value obtained for the same serums of different samples in both instrumental arrangements analyzed. It can see the minimal difference between the results of analyzers with a less tendency to target.
In
Figure 11 one can observe parameter Free T4 (FT4) for comparing the value obtained for the same serums of different samples in both instrumental arrangements analyzed. One can see the minimal difference between the results of analyzers with a less tendency to target and confidence interval.
In
Figure 12 one can observe parameter Free Prostatic Specific Antigen (FPSA) for comparing the value obtained for the same serums of different samples in both instrumental arrangements analyzed. One can see the minimal difference between the results of analyzers.
3.6. Profitability
During the analysis period, it performed the measurements requested in
Table 1 and
Table 3 at the first machine. It kept staffing levels equal to the prior and following periods without substituting technicians during their holiday period.
Therefore, the profitability of the sample accumulation in one module occurs by the amount of 1.76 equivalents to full time (ECT) of laboratory technician during the analysed month.
The capacity to keep a unit active and to be able to substitute the two analytical units is obtained by increasing 1.56 ECT of the ECT provisions of the active units affected by the reduction of activity, which also affects the rest of the laboratory. The activity in measurements per unit of ECT of the rest of the units is also affected, reducing the ECT provisioned by the increase of ECT to the unit we are analysing.
In terms of staff, the profitability of relocating the activity in the machines has been equal to the avoided cost of hiring two substitute technicians for 7 h for the morning shift and afternoon shift and the increase of the performance of the units that are with complete staff and with a reduced analytical charge in 37.4%.
4. Discussion
In our field, the hospitals and health care centers, one can observe how the variability in the analytical demand is concentrated in the month of August and that it is reduced up to a 38.7%. During the months of July and September, the activity does not exceed the average annual value, and during the month of October, it observes an increase of a 28% compared to the average annual value. Two other factors that can modify this variability with random increments in the demand are epidemic cases like Influenza A, cold and heat wave, etc. and holiday and national holiday periods in which health care organizations observe an activity decrease in outpatient visits and hospital stays, with a reduction of the active personnel and the number of beds.
In our case, we work according to the conditions we imposed on ourselves to be able to talk about a necessary adaptation and to be able to differentiate an optimization of our systems’ resources from a production adaptation point of view, keeping the laboratory activities from 8 a.m. to 10 p.m. without the need of changes during the month of August.
The evolution of the turnaround times obtained during the year shows a better fulfillment than the minimum goal established by the laboratory (92%). However, we found specific noncompliance events during the months of January and July. Those noncompliance events were caused by a lack of reagent supply. The specific events may be overlooked in big activity volumes without a detailed monitoring. It is for that reason that the tracking of the noncompliance of the turnaround times by the analysis of probability of occurrence and the application of binomial statistics allows us to visualize those cases of noncompliance, making it necessary to find the cause and to eventually be able to foresee these fluctuations. The use of the method applied in this article is not common in the bibliography, since it requires showing evidence with a system sensitive enough to visualize the significant differences that are produced.
In nowadays laboratories, in which the efficiency and effectiveness parameters are adjusted, the adaptation of the analytical systems to the sudden demand reduction and increase, without affecting the quality goals and service provision, becomes of paramount importance.
Keeping the analytical variability is evidenced by the comparison of the variability of the internal quality control levels for the same control lots. The lots of quality control happen in time, and are substituted by new lots with similar characteristics when they surpass their expiration dates. We work with significance levels equal to <0.05 and with significance level equal to <0.01 for Srm-Ac totals against surface Hepatitis B Antígen, Srm-Alfa-Fetoprotein, Srm-Antibody IGG Hepatitis C, Srm-Antibody IgG Toxoplasma gondii, total Srm-Antibody Treponema pallidum, total Srm-Antibody Hepatitis A totals, Srm-Surface Hepatitis B Antigen, Srm-Testosterone. In these parameters, except for Srm-Testosterone and Srm-Alfa-Fetoprotein, the obtained results give us data references to a cut point that separates the positive and the negative results, identifying the presence or lack of antibodies and, therefore, despite performing continued and normal measures, it finally obtain dichotomic values (positive/negative) and the lack of statistical significance does not lose statistical power.
To prove that there are not significant differences we chose to consider that the detectable minimal different size among the average values should be less than 1DS in the average values with equal variances. The size of the samples it is using is performed with values from 30 to 500 measurements, and it considers it to be balanced and to have enough analytical power in the statistical calculations and results. On the other hand, the sample size analysis per parameter is the total of obtaining data, with most of the parameters having a number higher than 30 data, which means that the statistical power is strong.
The Bland-Altman charts show proof of the transferability of the obtained results when it change analyser, following the recommendations of the Clinical and Laboratory Standards Institute (CLSI) [
32,
33]. This proves that the analytical systems are in a situation of comparable maintenance and in the same operative status.
Finally, and as it expected, the use of a replicated analytical system is capable to keep and ensure the quality control results of the transferred parameters of a system to its twin. For the homologation of the ISO 15189 accreditation [
34], it is necessary to prove that the quality control and the turnaround time goals are maintained in the transferability of the techniques from one machine to another.
In our case, the study was targeted to proof the increase of the economic performance of the system, although small, during a specific period. However, it thought that the experience, in other circumstances, when presented with other situations, can also ensure that none of the turnaround time or the established quality goals is affected. The situations that can occur are, among others, the operations of operative maintenance of the analytical systems, the update of analytical software or the adaptations by increases and decreases of the analytical demand. These situations are frequent.
In this article, it reduced the need to substitute two laboratory technicians during the period in which the reduction of the demand is stronger, without decreasing the analytical quality and the turnaround times. Analysing the fluctuations of the demand in a consistent way, it can get to plan the need of materials and machinery in clinical laboratories, adapting them to the changes caused by the different needs of hospitals and health care centers.
The application of the Lean-Agile methodology allows us to adopt concepts, methodologies, and goals to approach strategies and challenges that laboratories have in front now with less and less room for maneuver.
In summary, the fluctuations in the analytical demand are a permanent issue, in clinical laboratories that has to be taken into account to improve the profitability of the systems, but that can also be presented in different circumstances like the parameter demand with seasonal variations, the demands with a reduction of the turnaround time, and others. Customer orientation often requires fluxes and circuit modifications to offer the adequate response. The need to fulfill the requirements of the certifying and accrediting regulations demands adequate adaptations of the existing processes and methodologies to face the current changing landscape of the certified and accredited clinical laboratories.


 ,
, 
