Article

Photonic Crystal-Based Sensors for Detecting Alcohol Concentration

1
Graduate Institute of Electro-Optical and Materials Science, National Formosa University, Yunlin 63208, Taiwan
2
Department of Biotechnology, National Formosa University, Yunlin 63208, Taiwan
*
Author to whom correspondence should be addressed.
Appl. Sci. 2016, 6(3), 67; https://doi.org/10.3390/app6030067
Submission received: 31 December 2015 / Revised: 28 January 2016 / Accepted: 2 February 2016 / Published: 26 February 2016
(This article belongs to the Special Issue Selected Papers from the 2015 International Conference on Inventions)

Abstract

:
Polystyrene (PS) opal and titania (TiO2) inverse opal films were fabricated by the self-assembly colloidal crystal template technique. Based on Bragg’s law, these sensors were used to detect the different concentrations of ethanol solution. The results indicated that TiO2 inverse opal films were advantageous over PS opal film for detecting the ethanol concentration. TiO2 inverse opal films sintered at 600 °C retained the highest sensitivity for ethanol concentration identification, since the anatase phase was transformed into the rutile phase, which resulted in an enhancement of the refractive index, i.e., an increase in the amount of the red shift.

Graphical Abstract

1. Introduction

Photonic crystals are promising materials for applications in optoelectronics and photonics as well as in the field of optical sensing. Photonic crystals are dielectric or metalodielectric materials whose periodic spatial variation of dielectric functions are achieved using advanced nano-structuring techniques and leads to formation of spectral photonic band gaps or stop gaps [1]. Photonic crystal sensors exploit the sensitivity of photonic crystal dispersion bands to the modification of their refractive index and periodicity modulation by gases or fluids. Optical sensing can be realized in the simplest form by detecting alteration of the photonic crystal reflectivity or transmission spectra due to the infiltration of photonic crystal voids by various materials [2].
Sensors based on optical measurements have generally proven to be faster, safer, and easier to implement than those employing electrical measurements [3]. In addition, it has recently been demonstrated that this three-dimensionally porous material showed perfectly optical sensing properties [4]. The electrochemical etching and photolithography were typical methods used for fabrication of three-dimensionally porous materials [5,6]. However, the typical methods are relatively complicated, requiring a controlled etching process in a hydrofluoric acid solution or expensive photolithography procedures. In contrast, the fabrication of three-dimensionally porous materials from assembly of colloidal particles is process simple, cost effectiveness and extensibility to large-scale production. The process of this technique mainly involved the three steps. First, colloidal microspheres are organized onto the substrate to form the template by the self-assembly method. Second, particular material is infiltrated in the interstice of the microspheres. Third, the template is removed.
Currently, the ethanol concentration is mostly determined by the alcohol meter in the market. This is mainly based on the refractive index change of the wines to calculate the concentration. The alcohol meter is only suitable for measuring the ethanol concentration in the distilled liquors but is not suitable for brewed alcoholics. Surface Plasmon Resonance (SPR) [7] is another powerful inspection apparatus which can measure the ethanol concentration precisely, but the cost of the system is high and the operation procedure is complicated. Many of the critical system parameters of the SPR system, such as the incident angle, optical glass, and gold layer thickness, have to be controlled precisely to realize the high sensing performance [8].
In 2007, Potyrailo et al. [9] found that the iridescent scales of the Morphosulkowskyi butterfly produce a different optical response when exposed to different vapors. This optical response dramatically outperforms that of existing nano-engineered photonic sensors. To achieve a proper vapor response in nano-fabricated photonic structures, the combined effect of the structure surface properties and the detected vapor properties (surface tension, molar volume, and molecular shape and size of the vapors) must be considered. To develop an effective and simple mean for detection of the ethanol concentration, we consider using the iridescent photonic sensors because the iridescent scales of the M. butterfly produce a different optical response when it was exposed to different chemical solvents. Owing to the inspiration from the nano-photonic sensors of the butterfly wings, we would attempt to prepare a sensor that could quantitatively identify the ethanol concentration of difference ethanol concentration solutions. Compared with other methods for ethanol concentration measuring, the advantage of the nano-engineered photonic sensor is low cost, non-polluting and highly sensitive. Although the sensitivity of the SPR approach (typically 10−5 nm−1) is around 100 times higher than the present photonic crystal system, the SPR setup is quite complicated [8]. In this work, we utilize iridescent photonic materials to assess the ethanol concentration in difference ethanol concentration solutions. As compared to the SPR approach, the present method is easy to implement and operate, and the sensitivity is indeed high enough for many practical purposes.
Chiappini et al. [10] prepared a large well-ordered polystyrene crystal opal by spin-coating technique in 2009. The effective refractive index and the diameter of the colloid spheres can be estimated from the reflectance measurements at different angles. Moreover, the photonic crystal effect has been exploited to create a chemical sensor, in fact optical measurements have evidenced that the polymer composite structure presents a different optical response as a function of the solvent applied on the surface [11]. In addition to the polymer composite structure system, a silole-infiltrated SiO2 inverse opal photonic crystal film was prepared from the work of Yuqi’s group [12]. Based on the reversible aggregation state transfer and the adsorption–desorption of organic vapors, the effective refractive index of the film varied repeatedly, which caused the reversible stop band shift and color change.
In addition, several groups have obtained inverse opal structures by using colloidal crystals of polystyrene or silica microspheres as templates. The template is infiltrated with a variety of different background materials, such as ceramic precursors [13,14,15], metals and polymers [16,17,18] or semiconducting nanoparticles [19]. Then the template is removed by calcinations in the case of polystyrene or by etching with HF in the case of silica templates. Recently, highly ordered titania inverse opal films have been fabricated by using silica opal films as templates. The ability to do this is attributed to the good heat treatment features of the silica opal films. However, stern removal conditions of silica microspheres render the fabrications of inverse opal structures limited. Because polystyrene colloidal crystals are notable for their easy removal, an inverse opal scaffold structure with a high refractive index [20] can be prepared for rapid quantitative analysis of ethanol concentration. Here, a polystyrene microsphere was chosen as the template, and TiO2 was chosen as the inverse opal structure material in this study.

2. Experimental Section

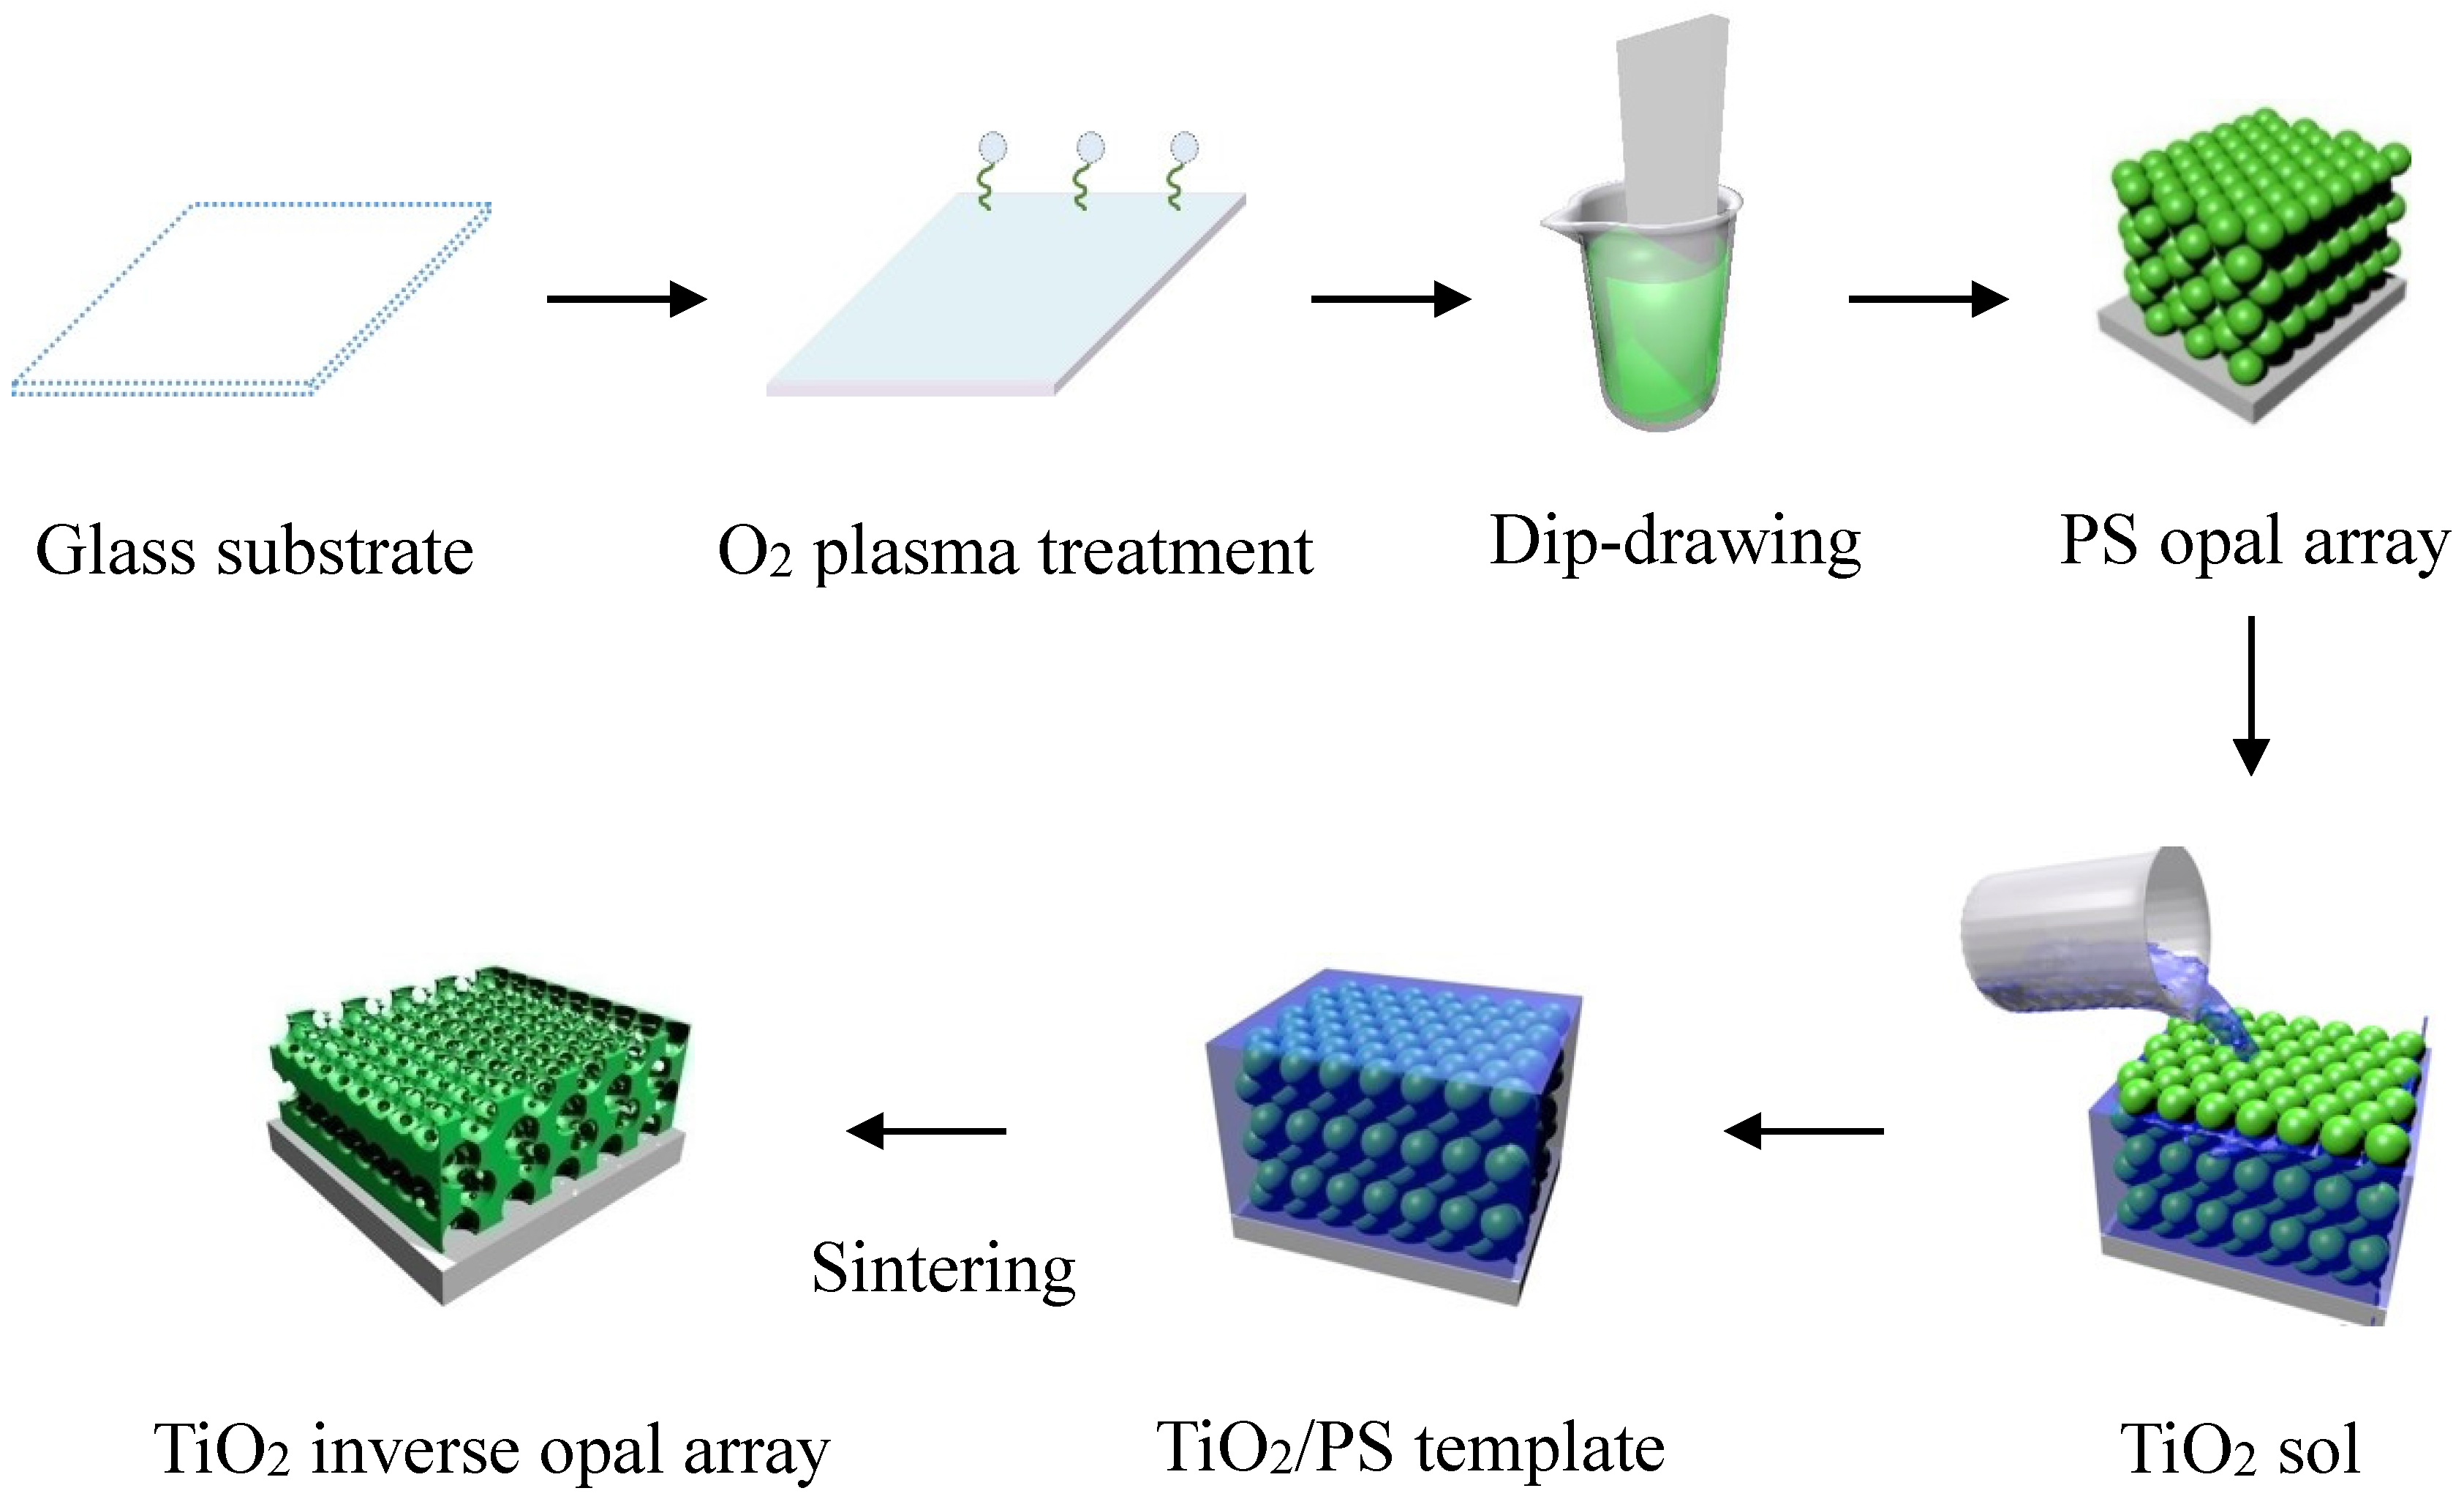
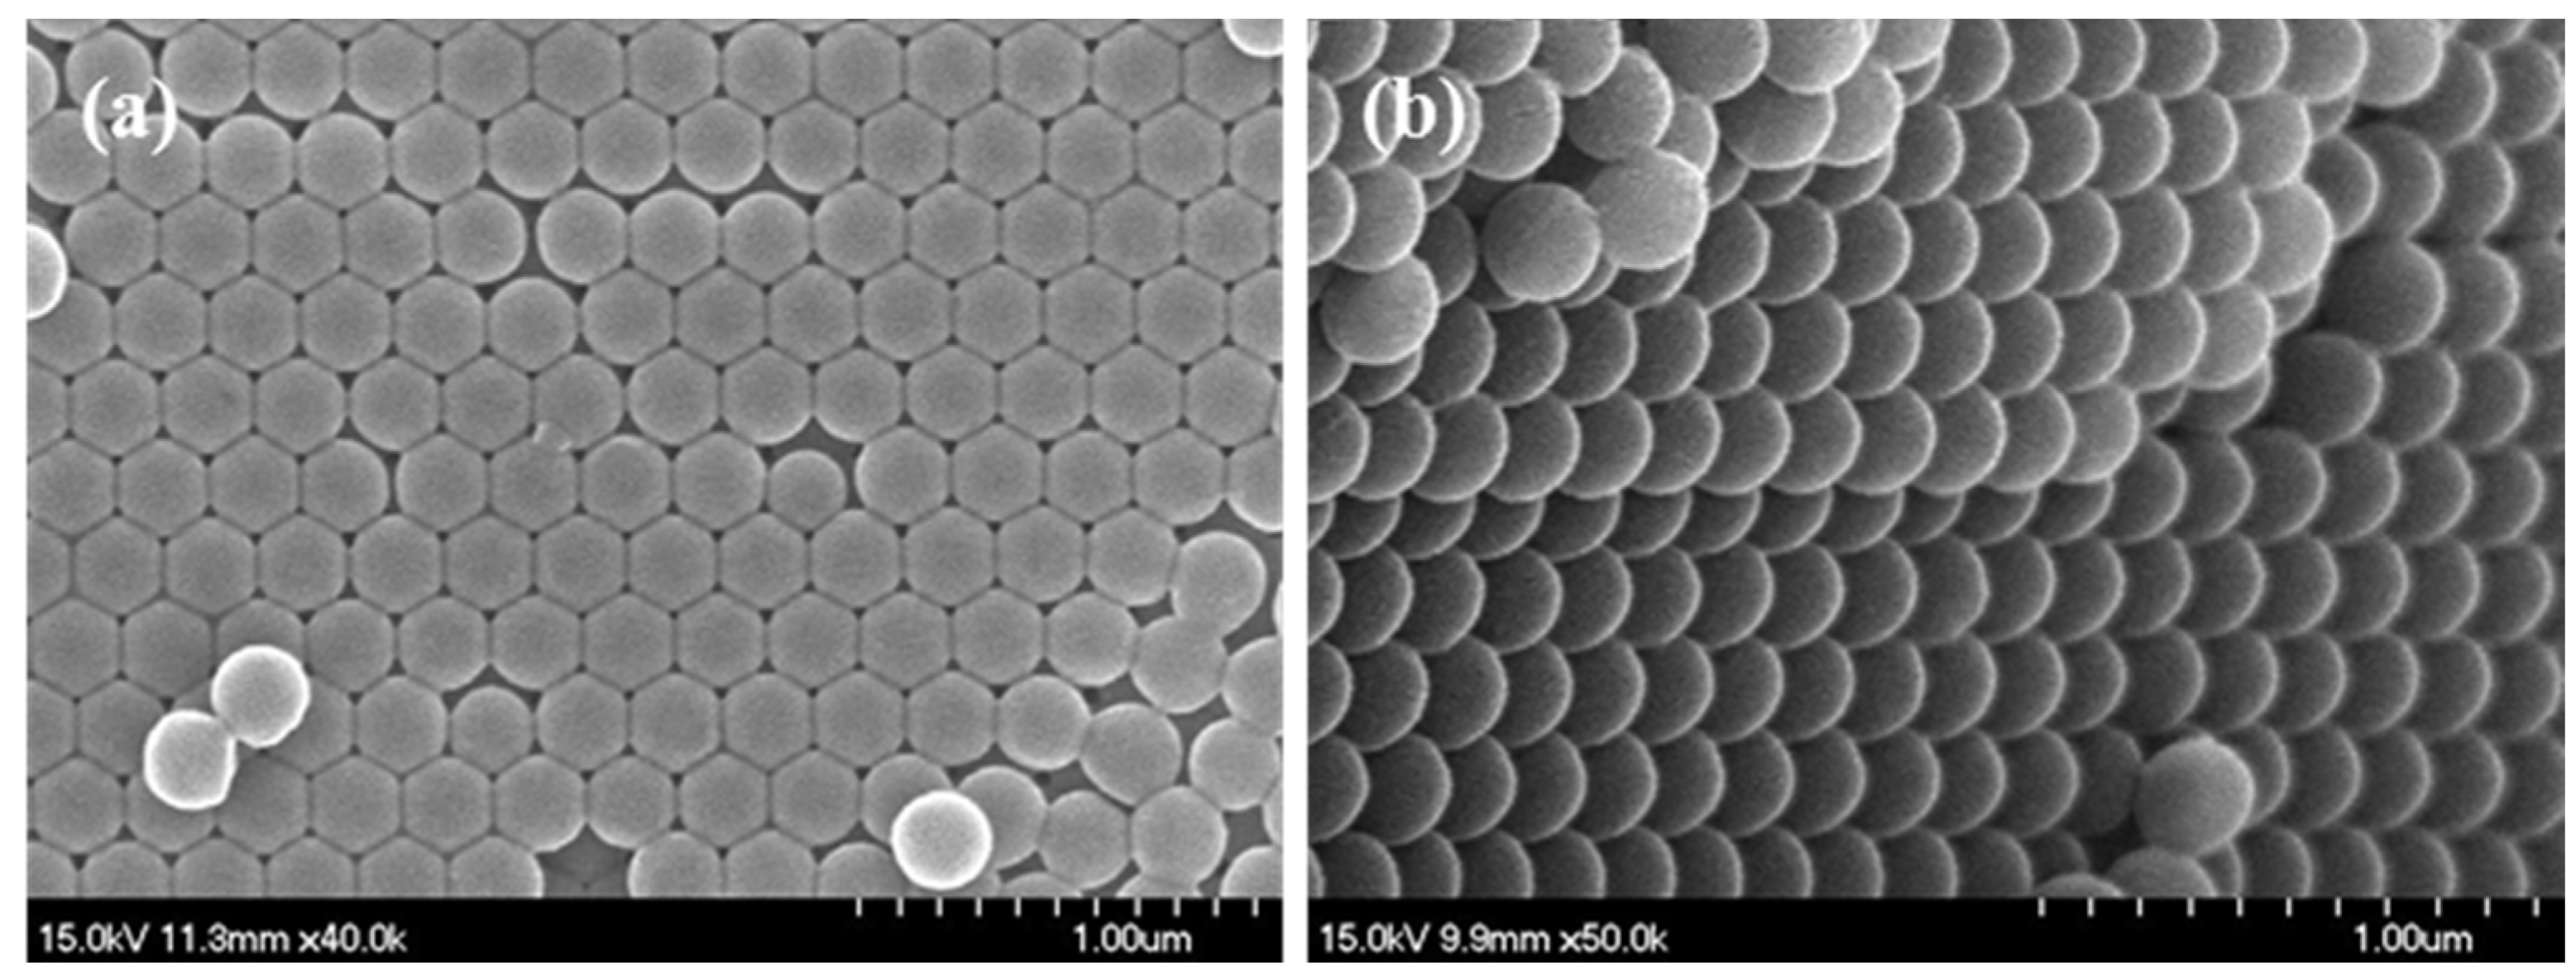
2.1. Preparation of the Polystyrene (PS) Opal Array

PS microspheres were synthesized by following polymerization procedures. A mixture of 90 mL deionized water, 10 mL Styrene (St), and 40 mg 4-styrenesulfonic acid sodium salt (NaSS) were added to a four-necked flask equipped with a reflux condenser and a mechanical stirrer. After being homogeneously mixed, the temperature of the reaction mixture was raised to 70 °C. A deoxygenated water solution with 0.9 mg potassium persulfate (KPS) was added, and the emulsion was mixed for 24 h. [21,22].
The usual method of treating the colloidal photonic crystals with a face-centered cubic (FCC) structure involves a modified Bragg’s law. A green light can be easily observed by the naked eyes. To obtain a green (λ = 495 to 510 nm) reflection from the PS photonic crystal array, the required particle size should be around 223–273 nm after calculation from the following Equations (1) and (2) [23] with the incident angle assumed to be 20°:
D = λ 2 2 3 ( n 2 s i n 2 θ )
where D is the size of the PS microspheres, λ is the reflection wavelength of the PS photonic crystals array (or the opal-like structure), θ is the angle of incidence of the light, and n is the average refractive index of the PS photonic crystals array.
n = n s p h e r e 2 × 0.74 + n a i r 2 × 0.26
where nsphere is the refractive index of PS (n = 1.600) and nair is the refractive index of air (n = 1.000).
An ordered periodic PS microspheres array, i.e., PS opal structure, can be formed because the PS microspheres were given enough time to balance the surface electrostatic repulsion and van der Waals attraction at the interface between the suspension and air as the hydrophilic substrate was slowly drawn out from the PS suspension solution. The substrate surface became hydrophilic by using oxygen plasma (PCD-150, All Real Technology Co., Ltd., Kaohsiung, Taiwan) treatment was carried out at a pressure of 300 mTorr, with 20 sccm oxygen flow under 100 W electric power. Then, the PS suspension was diluted with deionized water to 30 wt %, and dip-drawing was conducted at rates of 1 μm/s [24], and a close packed opal photonic crystals array was formed.

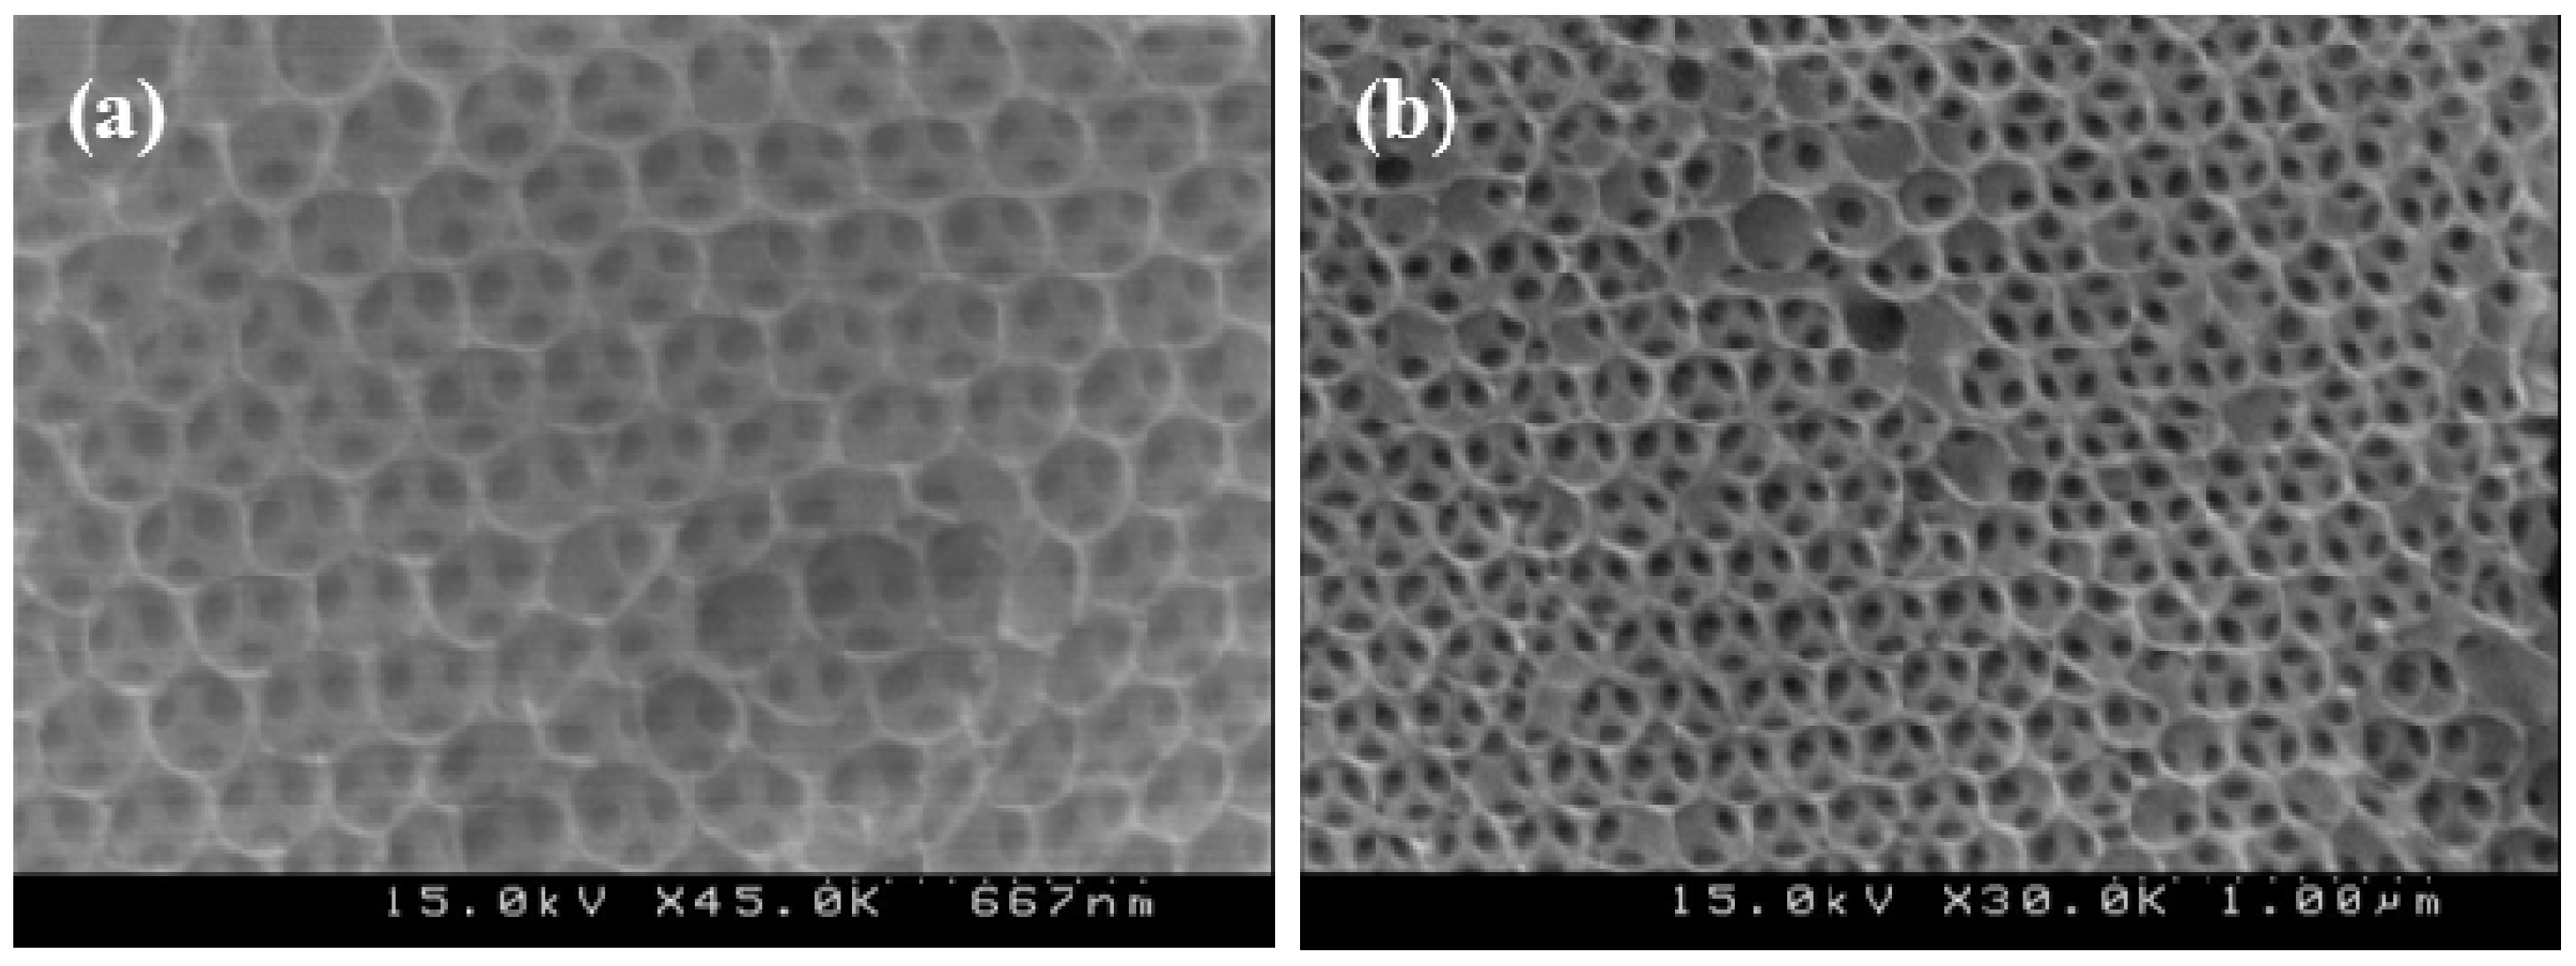
2.2. Preparation of the TiO2 Inverse Opal Structure

The TiO2 sol was prepared by mixing 0.1 mL deionized water, 6 mL anhydrous ethanol, 6 mL diethanolamine, and 1 mL titanium tetraisopropoxide were homogeneously mixed in an Erlenmeyer flask to obtain a stable and transparent sol [25,26]. Several droplets of the TiO2 sol were dropped onto the PS colloidal crystal array using a quantitative pipette, which could infiltrate the interstices between microspheres. Then, the sample was exposed to the atmosphere so the hydrolysis reaction could be completed within 2 h. Finally, the well-filled samples were sintered in an oven (the heating ramp was 5 °C/min) at 500 or 600 °C, held for two hours, and cooled down naturally along with the oven. In this process, the polystyrene spheres were removed by sintering, and the amorphous phase of titania could transform to a crystalline phase (anatase or rutile). The phase transition leads to a change in optical properties, such as the refractive index, the absorbance, or the fluorescence.

2.3. Preparation of the Ethanol Concentration Identification Sensor

A sensor for detecting the ethanol concentration can be formed by attached the PS opal array or TiO2 ordered porous (or inverse opal) structure on a hydrophilic treated glass substrate, as shown in Figure 1.

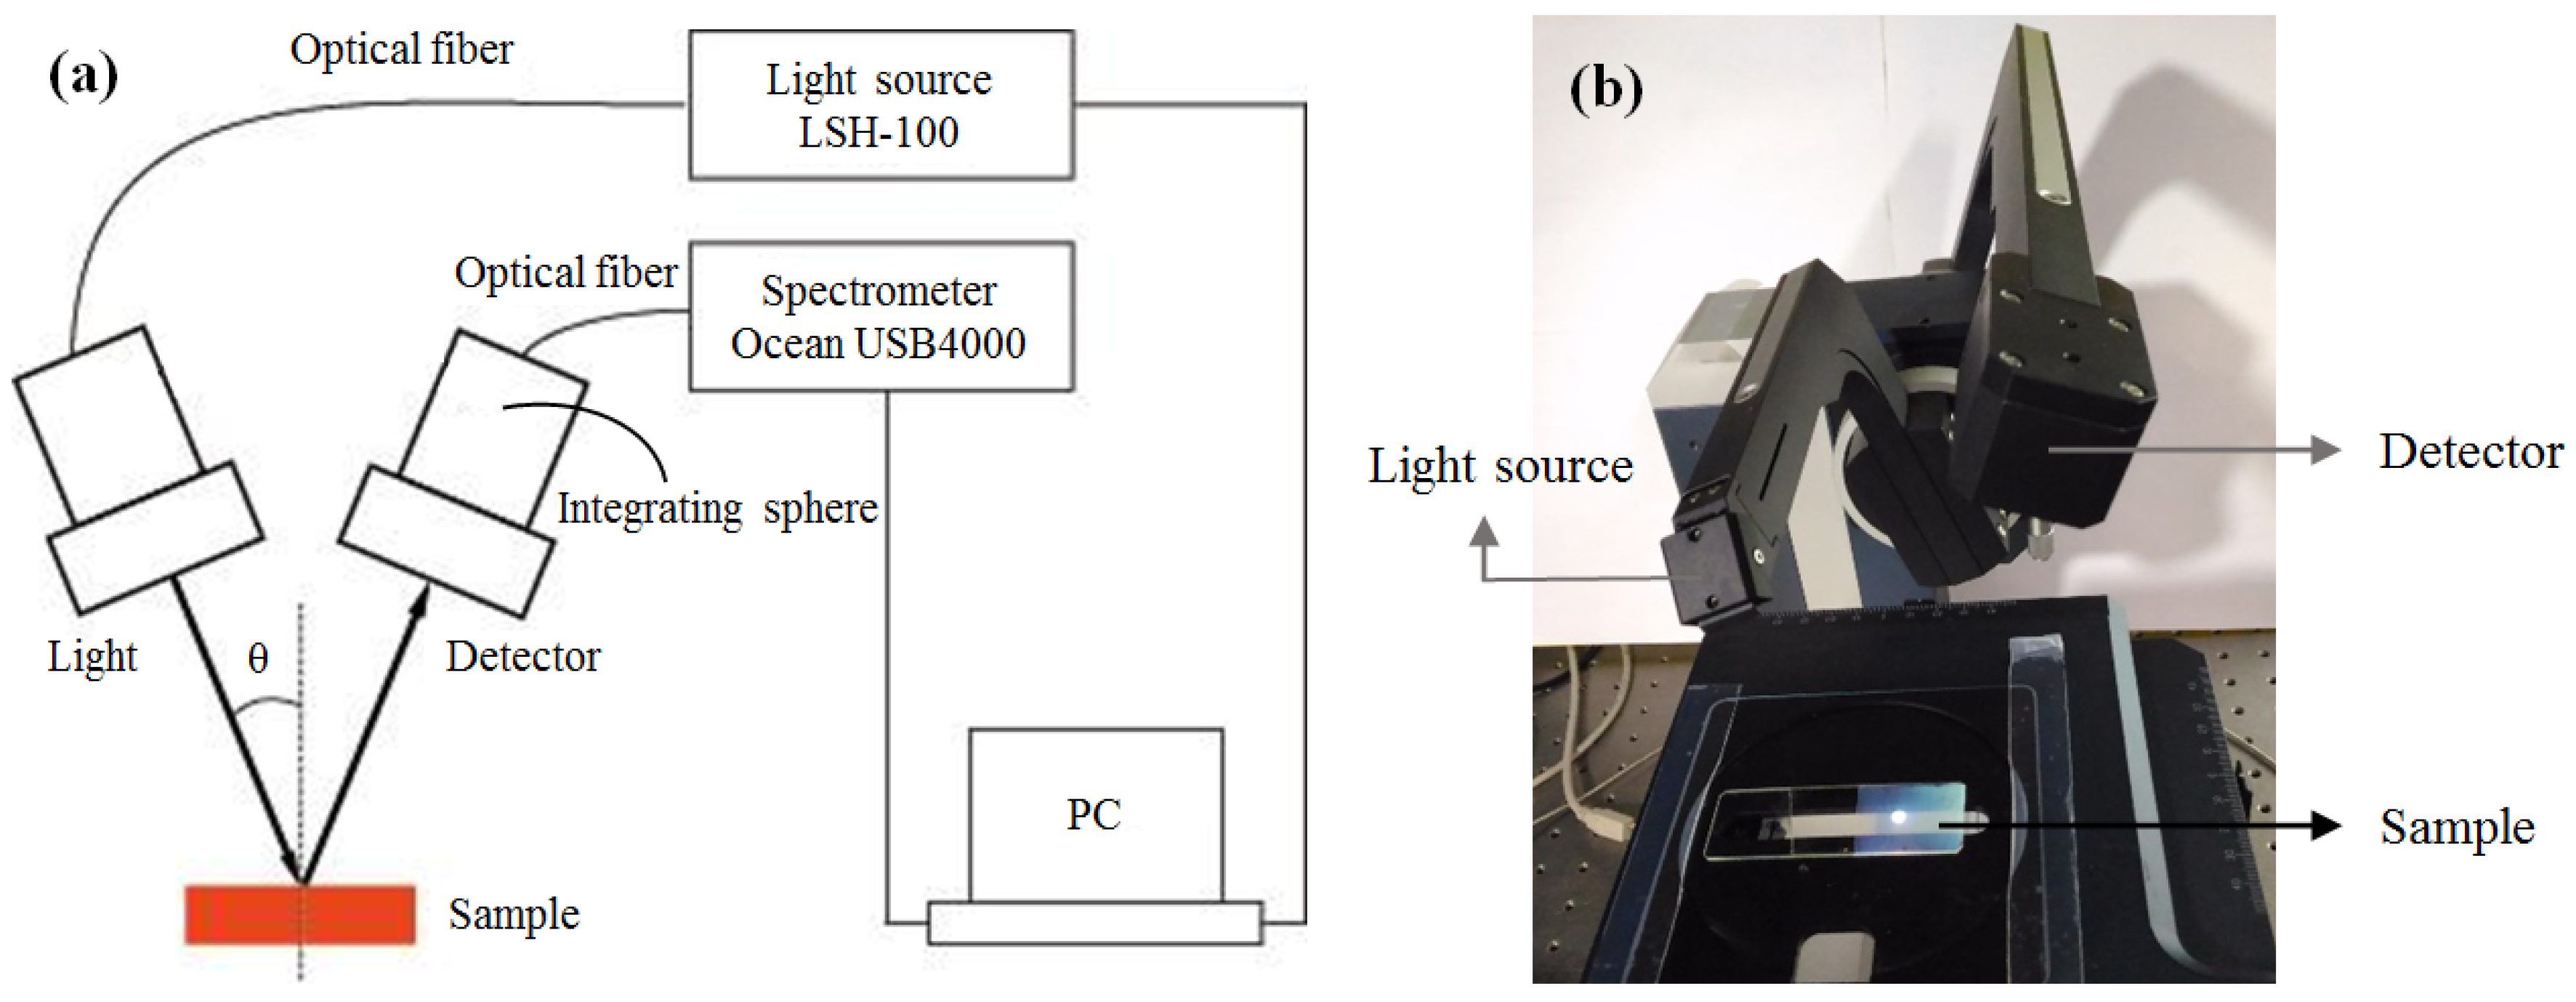
2.4. Characterizations

The average diameter of the PS microspheres was determined by atomic force microscopy (AFM, Digital Instruments, DI 3100, Bresso, Italy). The morphology of the PS opal and TiO2 inverse opal arrays was examined by a field-emission scanning electron microscope (FE-SEM, JEOL JSM-6700F, Tokyo, Japan) operating at a 15 kV accelerating voltage under the secondary-electron image mode. The samples were coated with a thin layer of gold by vapor deposition using a vacuum sputter (Sputter JEOL JFC-1100C, Tokyo, Japan) prior to FE-SEM characterization. The X-ray diffraction (XRD) data of the TiO2 samples sintered at different temperatures was obtained using a Bruker, D8 DISCOVER XRD system (Billerica, Massachusetts, MA, USA). Each sample was scanned with Cu Kα radiation (30 kV, 20 mA) at a continuous scan rate of 5°/min. The reflectance spectra can be observed by the variable angle multifunctional optical characteristic measuring system (MFS-630, Hong-Ming Technology Co., Ltd., New Taipei City, Taiwan) (see Figure 2) as the ethanol are dropped onto the opal and inverse opal films, respectively. The apparatus was equipped with a halogen light source (LSH-100, Taiwan Fiber Optics, Inc., Taichung, Taiwan) and a barium sulfate coated standard integrating sphere was placed inside the detector module. The MFS-630 is a high resolution spectrometer capable of measuring absorbance, transmittance, and reflectance of solid (film) samples in the visible range (from 400 to 800 nm). The spectra data were recorded by the optical fiber spectrometer (Ocean Optics USB4000, Dunedin, FL, USA). Sample and the MFS-630 apparatus were covered under an acrylic rectangular box to reduce the interference from environment during testing. The refractive indices of difference ethanol concentration solutions were measured by Abbe refractometer (MAOAN, WYA-2S, Jinan Mao An Instrument Co., Ltd., Jinan, China). The sample is placed between the illuminating and measuring prisms. The rotating knob is used to align the X mark with the shadow boundary on the telescope crosshairs, and the refractive index is recorded with four decimal places from the scale.

3. Results and Discussion

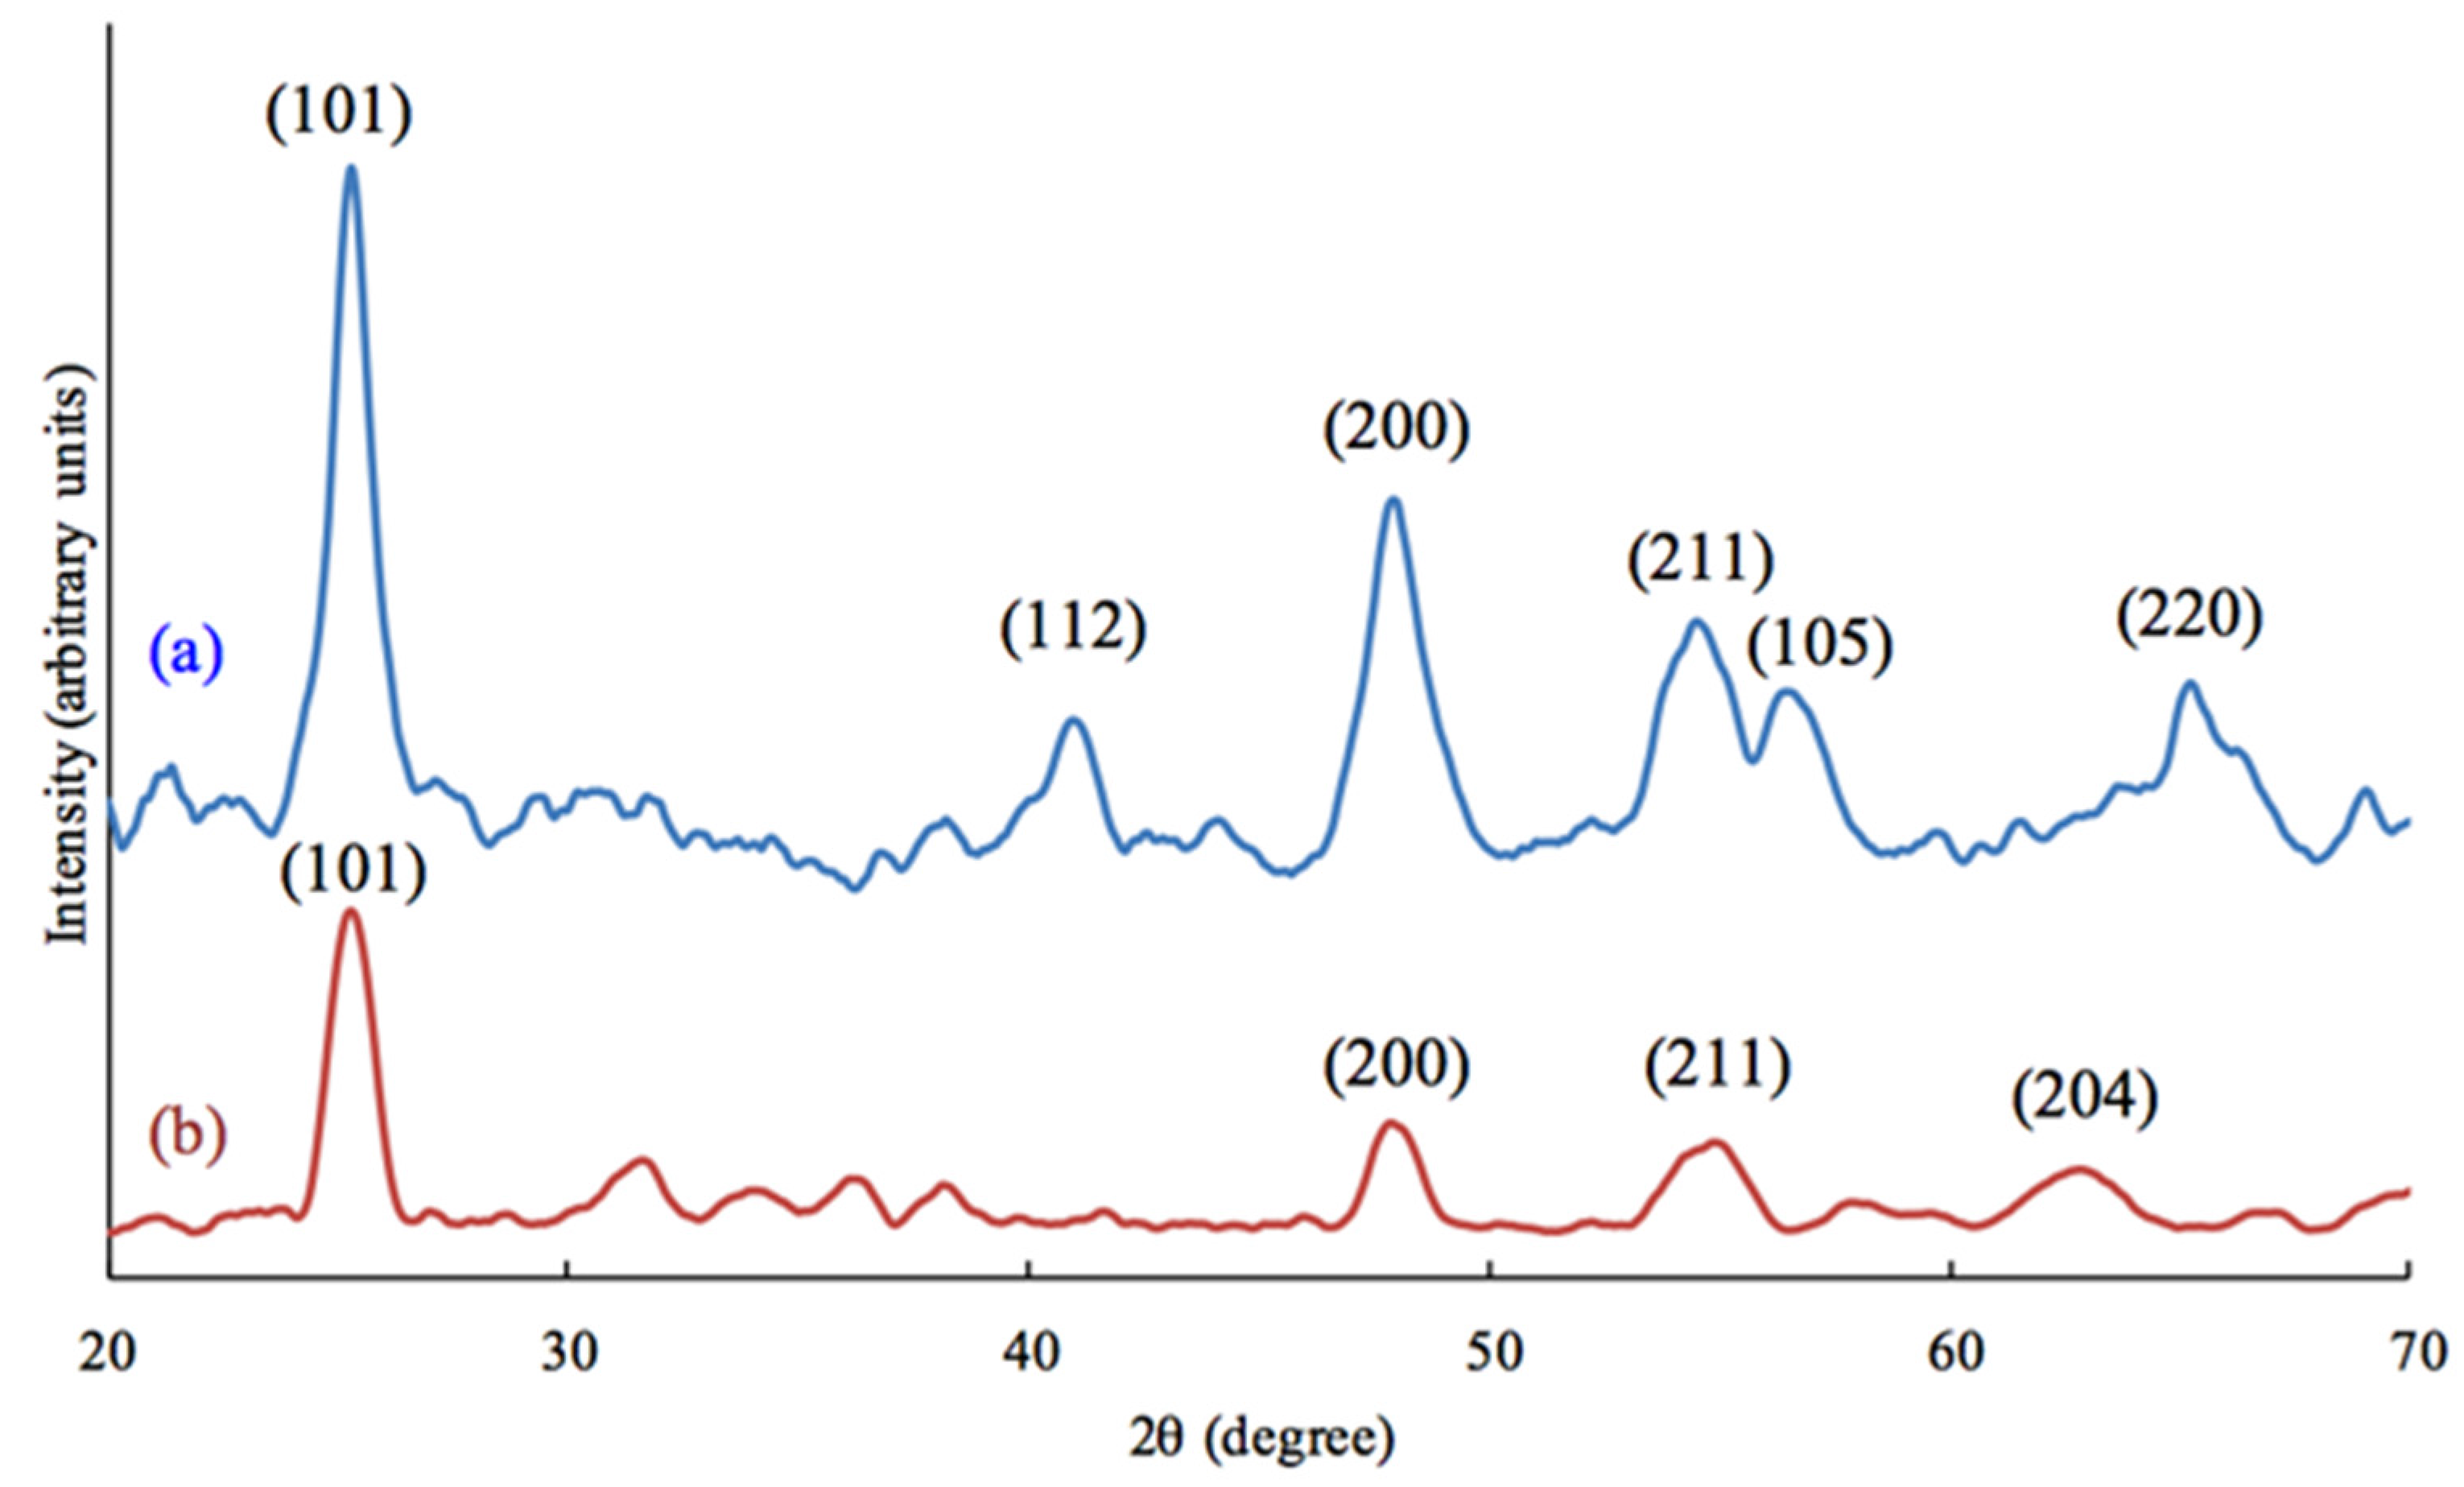
3.1. Characterization of the PS Opal and TiO2 Inverse Opal Structures

Figure 3 shows the surface micro profile of the monodispersed PS microarray by AFM. The line profile of the a-b direction exhibited that the average feature size of the PS hemispherical part and the spacing is 244 nm in width. AFM images also noted that a close-packed and ordered arrangement of the synthesized PS microsphere array could be obtained by the self-assembly dip-drawing method.
Figure 4a,b respectively show the FE-SEM image of the surface topography and the cross-sectional image of the self-assembled PS opal structure at dip-drawing rate of 1 μm/s. Though some local defects and vacancies existed in the PS opal structure, most of PS microspheres are uniformly dispersed and arranged in a compact-ordered periodic structure. The orderly arrangement of the PS microspheres was due to van der Waals attraction and electrostatic repulsion between the microspheres, which were balanced at the air/suspension interface [24].
Figure 5a,b are the FE-SEM images of TiO2 structure after 2 h sintering at 500 and 600 °C, respectively. From Figure 5, we found that after high temperature sintering, the PS microspheres that had been covered by TiO2 sol were removed. The titania sintered at 600 °C has dense porous structure packing, the average dimension of the air-hollows is ~200 nm. This value is smaller than the diameter of the synthesized PS microspheres (244 nm) used to form the template, which demonstrates that shrinkage occurs during the sintering process. This fact is not surprising given that the PS microspheres are mesoporous and, in the early stages of sintering, probably decrease in size as water vapor is released from the pores [10].
Figure 6a,b illustrated the XRD patterns of TiO2 sintered at 500 and 600 °C, respectively. The amorphous phase of titania could be transformed to the anatase crystalline phase when titania was sintered at 600 °C [27]. For the sample sintered at 600 °C, the characteristic peaks associated with the 500 °C structure (d112, d105, and d220) disappeared, and a new characteristic peak (d204) was detected. The anatase peaks were weakened, and the characteristic peaks of the rutile phase were enhanced, demonstrating that a phase transformation occurred in titania during the sintering process at 600 °C.
The reproducibility of the PS opal and TiO2 inverse opal structures is affected by the following factors: (1) Environmental interference: a slight shaky vibration should be avoided during preparing the opal films, since the PS microarray is prepared by a slow self-assembled dip-drawing method. Undoubtedly, the dip-drawing rate is also an important fabricating parameter for preparing a perfect microarray; (2) Pre-treatment of glass substrate: The PS microspheres cannot be easily attached on the glass substrate owing to the hydrophobic surface. Therefore, oxygen plasma treatment is required; (3) The quality of the PS suspension: The particle size distribution of the synthesized PS microspheres should be very uniform in size. Furthermore, the stacking thickness of the PS microspheres on the substrate is primarily controlled by the concentration of PS suspension; (4) The sintering temperature: the structural phases and the optical properties of the TiO2 inverse opal were strongly affected by the thermal treatment procedures.

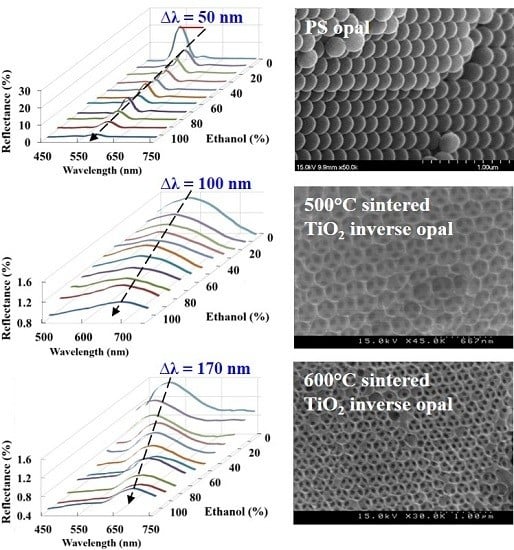
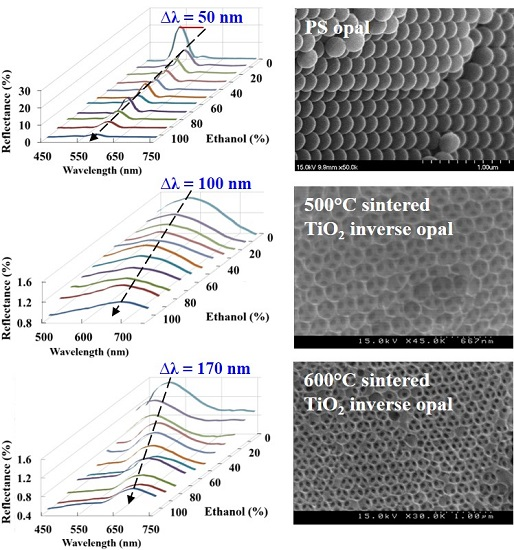
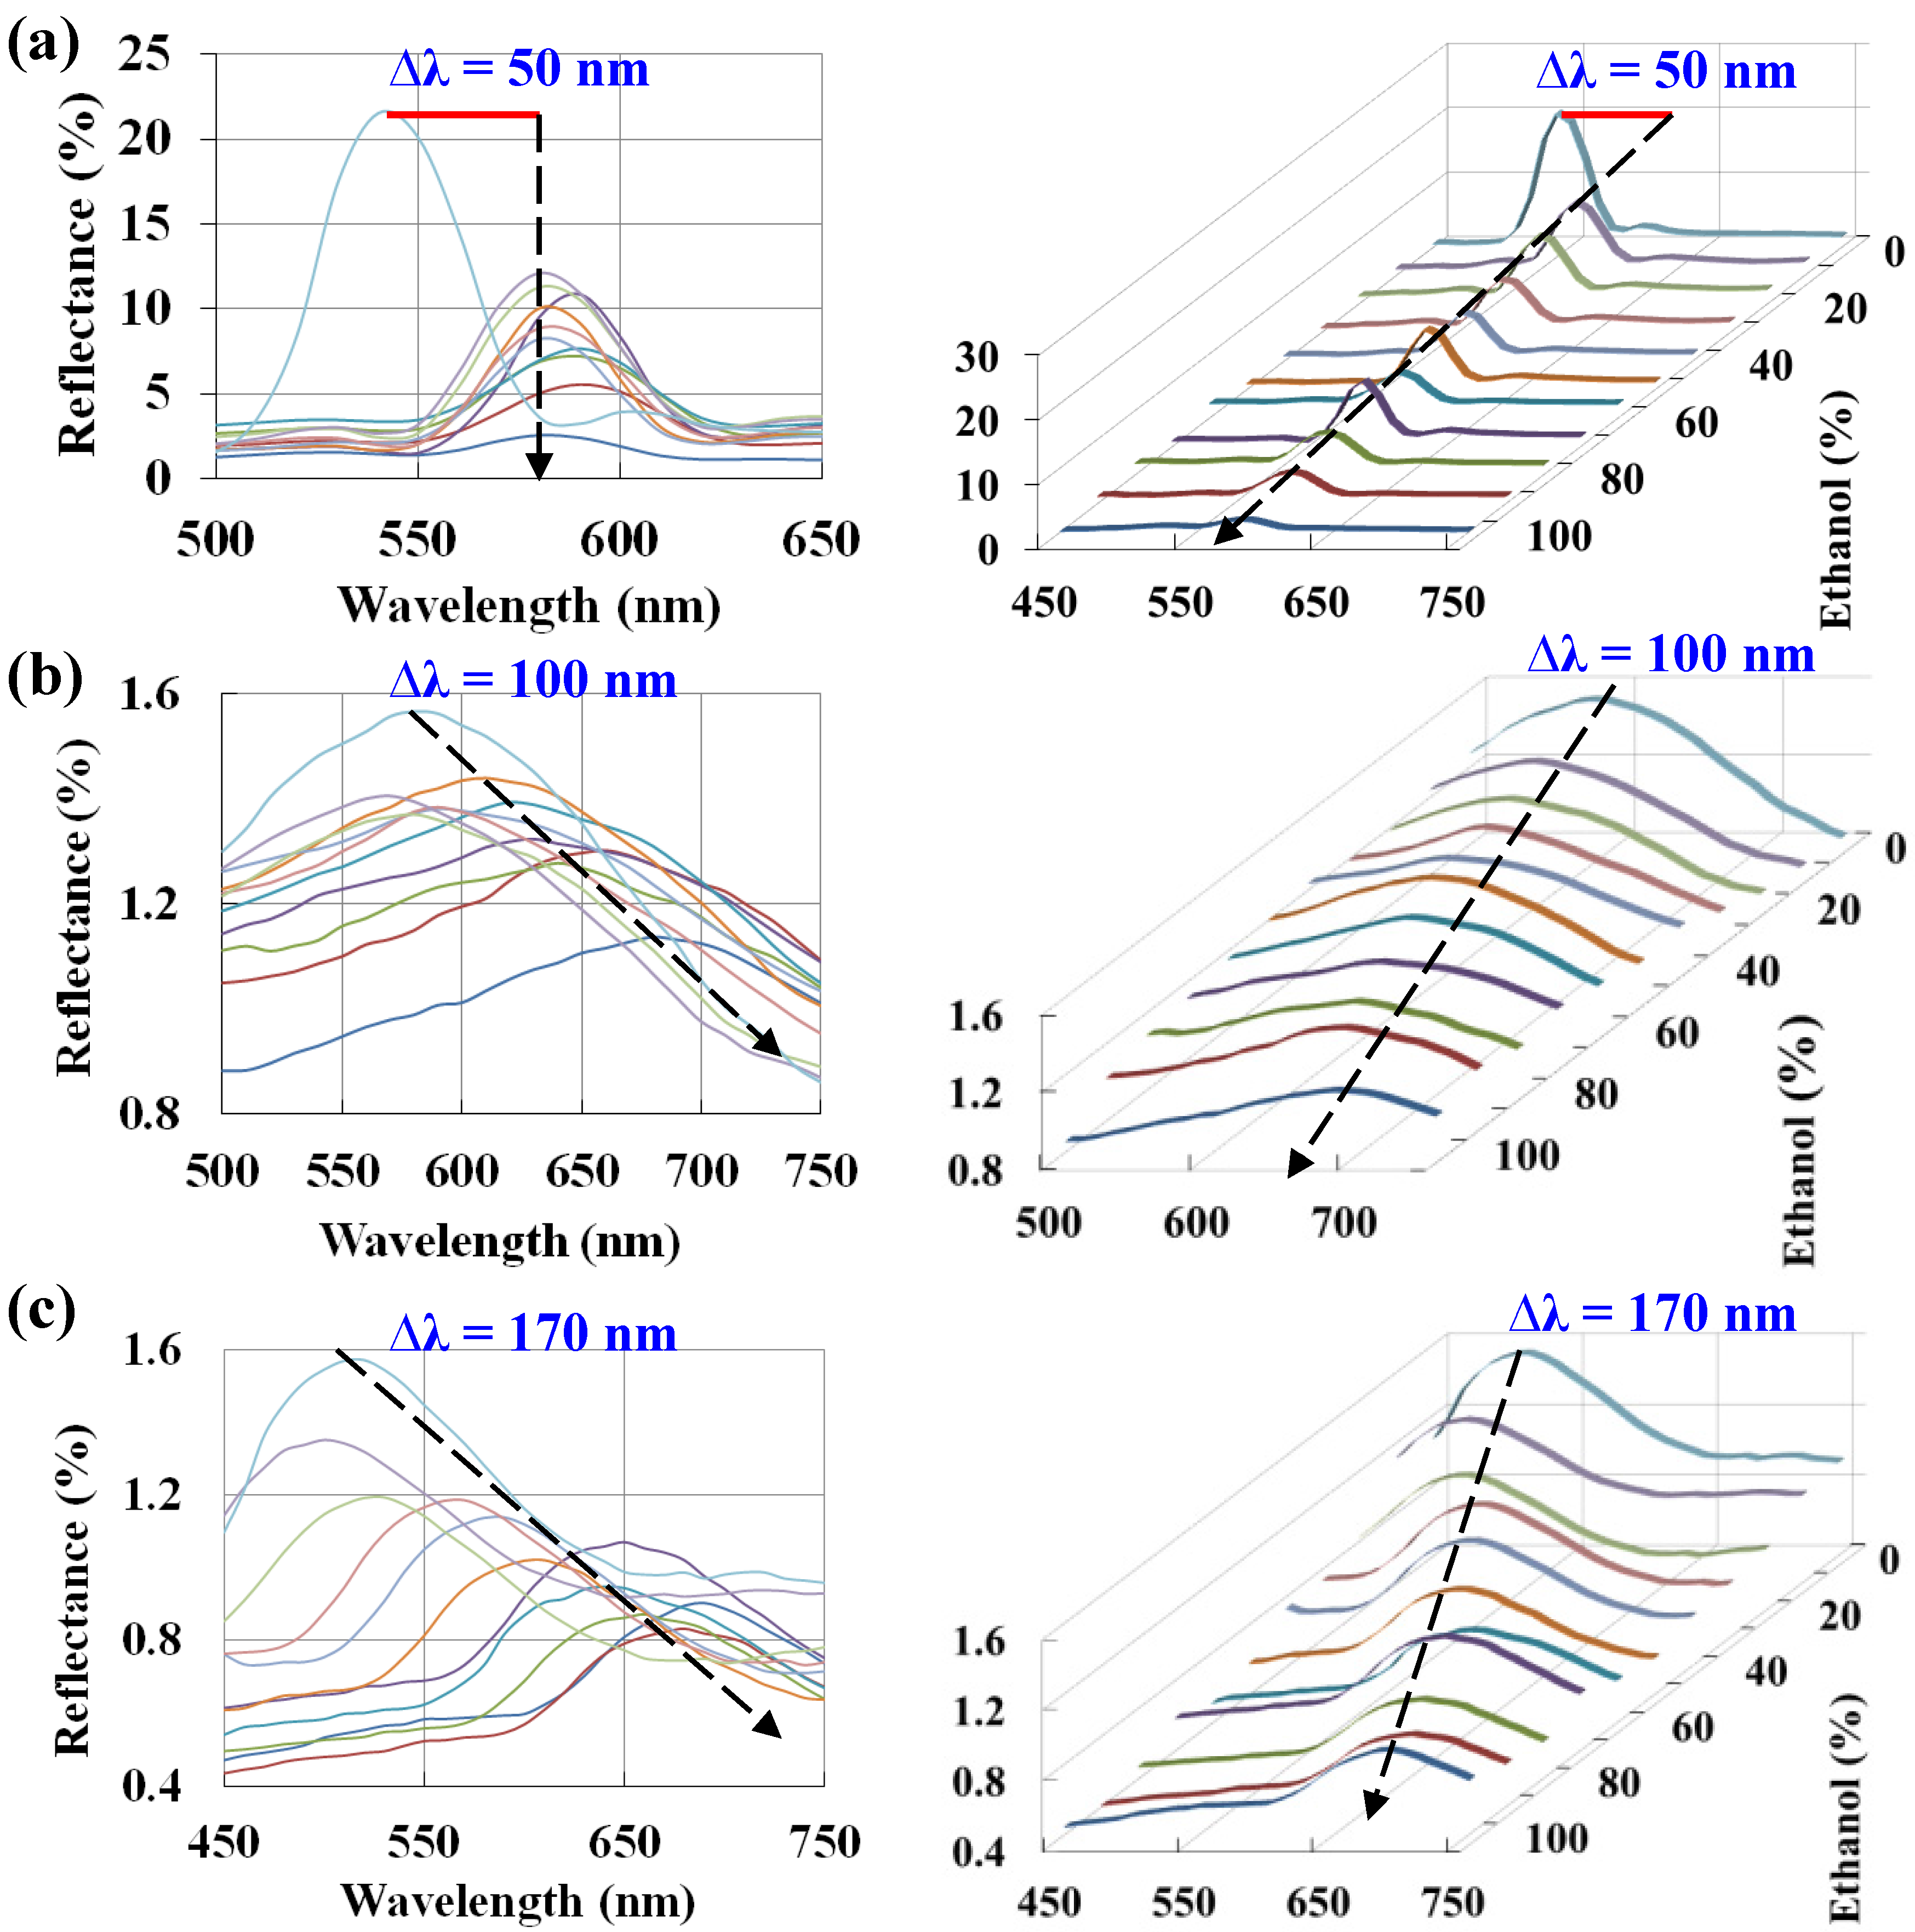
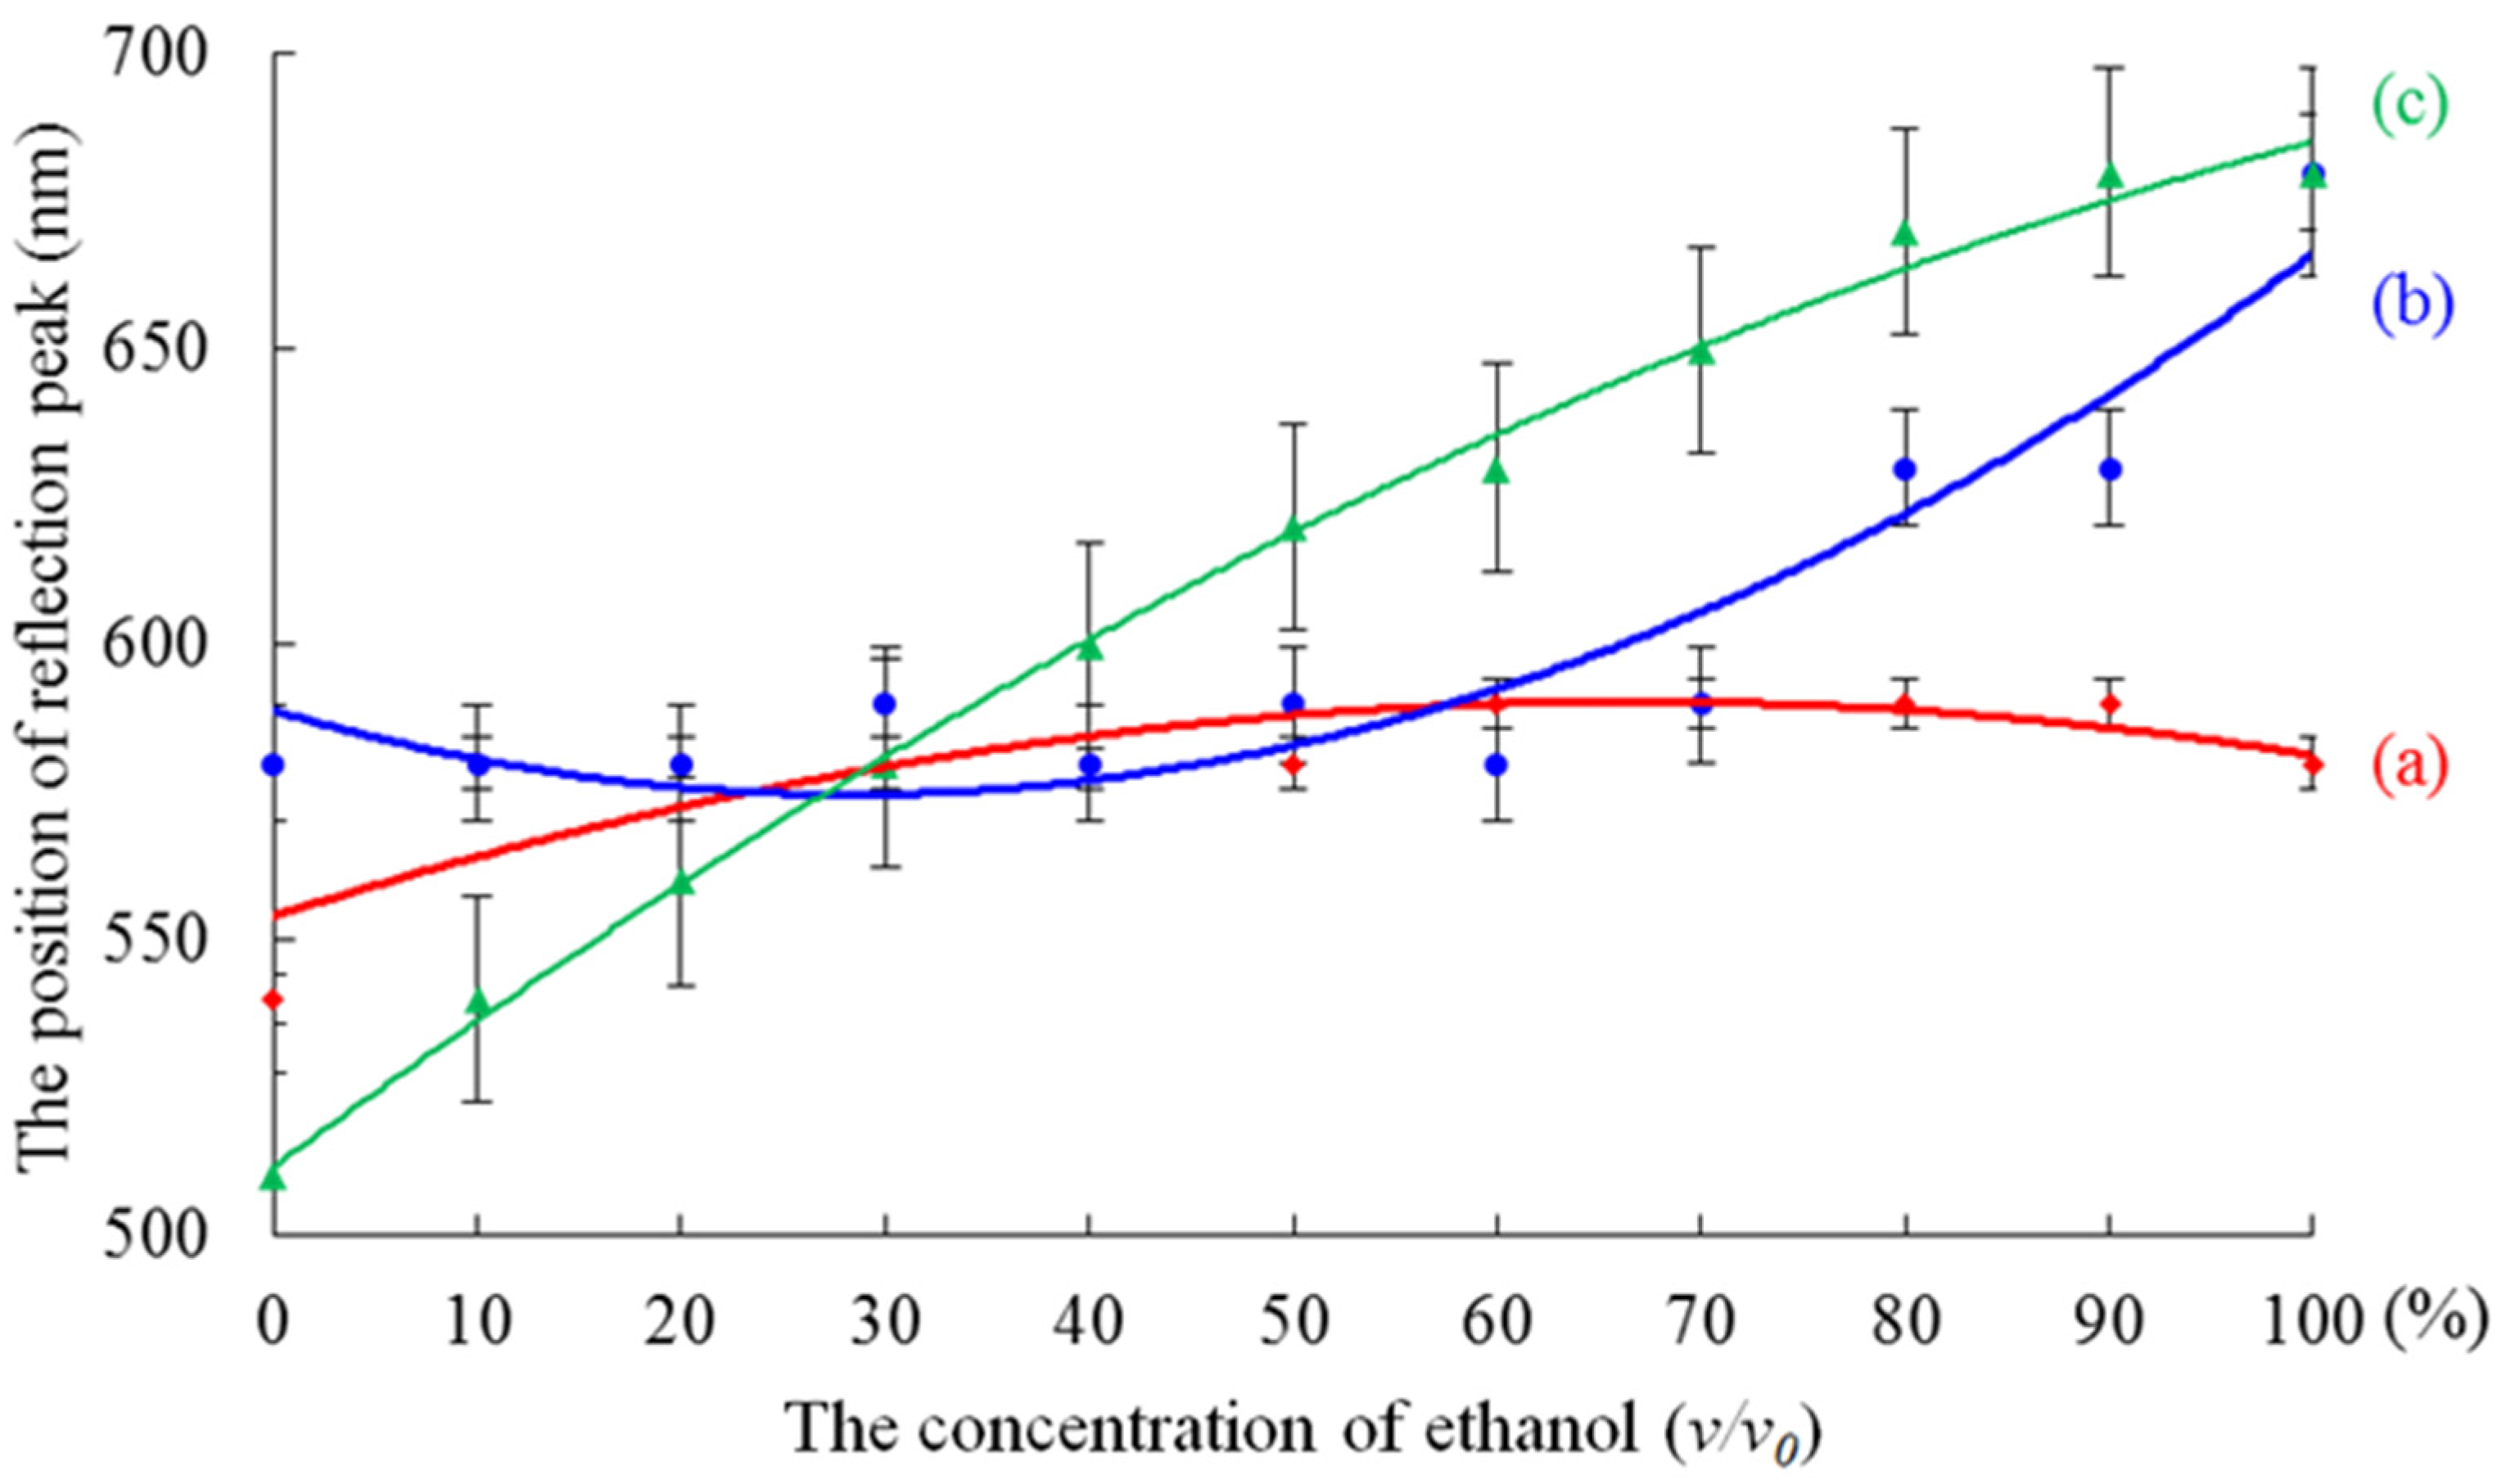
3.2. Ethanol Concentration Examined by PS Opal and TiO2 Inverse Opal Structures

The photonic band gap of inverse opals depends on the refractive index contrast between the crystal and the pore fluid. A change of refractive index of the pore fluid causes variations in the photonic band gap which can be observed as change in the wavelength of reflected light of the crystal (color change). Based on this principle, we used for identification of ethanol concentration [28].
The reflectance peak shift (∆λ = 50 nm) of the PS opal sensor response with different ethanol concentrations in Figure 7a is unremarkable. On the other hand, the red shift for the 600 °C sintered TiO2 sensor is 170 nm, as shown in Figure 7c, which is higher than that for the sensor sintered at 500 °C (∆λ = 100 nm), as shown in Figure 7b. That is, the 600 °C sintered sensor could detect the ethanol concentration better than the sensor sintered at 500 °C. Therefore, the TiO2 inverse opal structure is more suitable for quantitatively detecting the ethanol concentration than PS opal structure. It is evident that the 600 °C sintered TiO2 film is the best candidate for an ethanol concentration sensor. Moreover, because the TiO2 inverse opal structure in our work has a reflectance peak shift of ∆λ = 170 nm, it should more easily recognize the ethanol concentration previously developed sensors (∆λ = 15 nm in [3]). The main peaks reflected from the PS opal and TiO2 inverse opal sensors with different ethanol concentrations are listed in Table 1. In addition, the weaker reflectance might be resulted from the random scattering of the imperfect films after TiO2 sols sintering.
The reflectance peak positions from the PS opal, 500 and 600 °C sintered TiO2 inverse opal sensors with different ethanol concentrations were plotted in Figure 8a–c, respectively. Here, we just determined the peak maximum from the spectra in Figure 7 at the measuring range (450–750 nm) of the apparatus. In our measurement, a piece of a microscope glass substrate was used as the background reference. A nonlinear relationship between the ethanol concentrations and the corresponding reflectance peak positions was fitted by a second degree polynomial function also shown in Figure 8. The reflectance peak shift with the ethanol concentration from the PS opal is smallest, as shown in Figure 8a. This result revealed that the resolving power greatly declined for ethanol concentration detecting. Therefore, the more difference of the refractive indices between the inverse opal sensor and ethanol concentration, the higher reflectance peak shift can be obtained, as shown in Figure 8b,c. The red shift for the 600 °C sintered TiO2 sensor is greater than that for the sensor sintered at 500 °C, because the former with a higher refractive index. Furthermore, the curve (c) in Figure 8 shown that the 600 °C sintered TiO2 inverse opal sensor retains a strong but not a perfect linear relationship between the red shift and the ethanol concentration in the region between 10% and 80% (v/v0). The red shifts of the peak position were observed with the increasing the ethanol concentration because the average of refractive index (na) of inverse opal are increasing and cause a red shift reflectance peak position. The trend curve in Figure 8c is consistent with the refractive index of ethanol-water mixture [29]. At higher ethanol concentration (>80%), the red shift reaches a plateau, which defines the detection limit of the TiO2 inverse opal film sensor. These results are also consistent with the previously reported results using a surface plasmon resonance (SPR) sensor [30]. In this study, we found that 600 °C sintered TiO2 sensor not only retains a good fit but also possesses high precision. Consequently, the 600 °C sintered TiO2 sensor is the optimal candidate from the studied samples for ethanol concentration detection.
From the experiment results, we found that the pore size and incident angle also affect the sensitivity of the sensor [31]:
λ max = 1.633 D i n v e r s e   o p a l ( n a 2 s i n 2 θ )
n a 2 = ( 1 f ) × n t i t a n i a 2 + f × n e t h a n o l 2
where λmax is the wavelength of the maximum reflectance peak, Dinverse opal is the average center-to-center distance between spheres or pores, θ is incident angle of light, and na is the average refractive index of the structure. Furthermore, ntitania is the refractive index of titania, nethanol is the refractive index of different ethanol concentrations, and f is the packing factor (=0.74) of the crystal structure, the results indicate that the structure is a well-ordered 3D face centered cubic order structure [10].
From the work of Zheng’s group described in [3], the TiO2 pore size is 210 nm and the incident angle is 90°; however, in our work, the TiO2 pore size is 200 nm, and the incident angle is 20°. (The refractive index of the 500 °C sintered TiO2 inverse opal is 2.50 from [3].). According to Equations (4) and (5), λmax should be 485 nm for the sample in [3] and 670 nm for the sample in our work. Therefore, the ethanol detectability of the TiO2 inverse opal structure prepared in this study is much better than the one proposed by Zheng’s group. Furthermore, as we consider the impact of the refractive index on the sensitivity of the TiO2 inverse opal, λmax for the 600 °C sintered TiO2 inverse opal structure is better than the 500 °C sintered one. In particular, because the λmax values are 674 nm and 670 nm for the 600 and 500 °C sintered TiO2, respectively, the corresponding refractive index are n600°C = 2.52 [20] and n500°C = 2.50.
A key performance indicator of integrated optical devices for applications in sensing is the ability to detect small refractive index changes. For resonant devices, this ability is expressed in terms of the wavelength change induced by a refractive index change. The sensitivity (S) can be defined by calculating the shift in wavelength per unit change in refractive index from the following Equation (5) [32,33]:
S = λ n a   ( n m / R I U )
The wavelength (λmax) is determined with reference to the refractive index of the average refractive index of the structure (na). If the refractive index of the structure is altered by ∆na, the wavelength of the maximum reflectance peak shifts by ∆λ, the units by nm/RIU (refractive index unit, RIU). As the increasing of ethanol concentration from 10% to 80%, the red shift for the 600 °C sintered TiO2 sensor is 130 nm (see Table 2). According to Equations (4) and (5), the sensitivity value of the 600 °C sintered TiO2 inverse opal sensors is approximate 9090 nm/RIU, which is higher than that of the LSPR (190 nm/RIU) [34] and the planar SPR technique (3100 to 8800 nm/RIU) [35]. The results show that it is possible to distinguish ethanol concentration in the range between 10% and 80%, if only the peak shift is taken into account. The sensitivity was enhanced about 73.4%, as we calculated and compared them from typical method (5242 nm/RIU, ∆n = 0.0248) and the present method (9090 nm/RIU, ∆na = 0.0143) in Table 2. Our experimental results show that the sensitivity is not consistent with the predicted value by the Equation (5). However, similar results were also observed in the ref. [3] for a PS inverse opal structure. Their sample shows that a peak wavelength shift of ~120 nm as the ethanol concentration varies from 10% to 80% and the sensitivity is approximately 4800 nm/RIU.
Finally, these results also revealed that 600 °C sintered TiO2 inverse opal structure possesses the highest sensitivity for ethanol concentration because the refractive index of the titania structure is altered with the sintering temperature. Different sintering temperatures form different crystalline phases. As the sintering temperature increased from 500 to 600 °C, the anatase phase of TiO2 in the inverse opal structure is gradually reduced, while the rutile phase is increased [20], increasing the refractive index [36]. The peak position of reflectance spectra can be used for detecting the organic solvents with different refractive indices. This TiO2 inverse opal could be used for quantitative detection of common organic solutions in the corresponding range [3]. As shown in Equations (3) and (4), the sensitivity of the ethanol concentration could be enhanced as na was increases because the red shift (∆λ) increases with λmax.

4. Conclusions

In conclusion, the three-dimensional nanoporous inverse opal films display perfect optical sensing properties. The peak positions of the reflectance spectra can be used for detecting the ethanol concentration with different refractive indices. The sensitivity is enhanced by choosing titanium dioxide inverse opal film as the sensor. This TiO2 inverse opal could be used for quantitative detection of the ethanol concentrations in the corresponding range. From the results, the 600 °C sintered TiO2 film not only retains highest sensitivity from the studied samples for identifying the ethanol concentration. The 600 °C sintered TiO2 inverse opal structure possesses the highest sensitivity for ethanol concentration because the majority of the anatase phase was transformed into the rutile phase at the higher sintering temperature, resulting in an increase in the refractive index and the amount of the red shift. Despite this, the SPR approach is a more exact system than the present one. However, compared to the SPR approach, the chemical sensor based on TiO2 inverse opal film has several advantages. First, the low-cost fabrication is rapid. Second, the high-temperature (600 °C) sintered TiO2 inverse opal film has a higher refractive index and good hydrophilic surface, which provides a high-sensitivity optical sensor. A chemical sensor based on inverse opal films has the potential to be a powerful tool for the fast screening pesticide residues in fruits and vegetables or to be a next generation senor for identifying gas concentrations in the future.

Acknowledgments

The authors gratefully acknowledge research funding from the Ministry of Science and Technology of Taiwan (MOST 103-2221-E-150-021).

Author Contributions

Hsin Her Yu conceived and designed the experiments and the whole concept; Wen-Kai Kuo and Hsueh-Ping Weng performed the experiments and analyzed the data; Hsin Her Yu, Jyun-Jheng Hsu and Hsueh-Ping Weng drafted the manuscript; Hsin Her Yu, Wen-Kai Kuo and Jyun-Jheng Hsu revised the whole manuscript.

Conflicts of Interest

The authors declare no conflict of interest.

Abbreviations

PS
Polystyrene
SPR
Surface Plasmon Resonance
FCC
Face-centered cubic
AFM
Atomic Force Microscopy
XRD
X-ray diffraction
RIU
Refractive index unit

References

  1. Nishijima, Y.; Ueno, K.; Juodkazis, S.; Mizeikis, V.; Misawa, H.; Tanimura, T.; Maeda, K. Inverse silica opal photonic crystals for optical sensing applications. Opt. Express 2007, 15, 12979–12988. [Google Scholar] [CrossRef] [PubMed]
  2. Holtz, J.H.; Asher, S.A. Polymerized colloidal crystal hydrogel films as intelligent chemical sensing materials. Nature 1997, 389, 829–832. [Google Scholar] [CrossRef]
  3. Li, J.; Zheng, T. A comparison of chemical sensors based on the different ordered inverse opal films. Sens. Actuators B Chem. 2008, 131, 190–195. [Google Scholar] [CrossRef]
  4. Convertino, A.; Capobianchi, A.; Valentini, A.; Cirillo, E.N. A new approach to organic solvent detection: High-reflectivity Bragg reflectors based on a gold nanoparticle/Teflon-like composite material. Adv. Mater. 2003, 15, 1103–1105. [Google Scholar] [CrossRef]
  5. Gu, Z.Z.; Horie, R.; Kubo, S.; Yamada, Y.; Fujishima, A.; Sato, O. Fabrication of a metal-coated three-dimensionally ordered macroporous film and its application as a refractive index sensor. Angew. Chem. 2002, 114, 1201–1204. [Google Scholar] [CrossRef]
  6. Torres-Costa, V.; Agulló-Rueda, F.; Martín-Palma, R.J.; Martínez-Duart, J.M. Porous silicon optical devices for sensing applications. Opt. Mater. 2005, 27, 1084–1087. [Google Scholar] [CrossRef]
  7. Matsubara, K.; Kawata, S.; Minami, S. Optical chemical sensor based on surface plasmon measurement. Appl. Opt. 1988, 27, 1160–1163. [Google Scholar] [CrossRef] [PubMed]
  8. Kuo, C.Y.; Lu, S.Y.; Chen, S.; Bernards, M.; Jiang, S. Stop band shift based chemical sensing with three-dimensional opal and inverse opal structures. Sens. Actuators B Chem. 2007, 124, 452–458. [Google Scholar] [CrossRef]
  9. Potyrailo, R.A.; Ghiradella, H.; Vertiatchikh, A.; Dovidenko, K.; Cournoyer, J.R.; Olson, E. Morpho butterfly wing scales demonstrate highly selective vapour response. Nat. Photonics 2007, 1, 123–128. [Google Scholar] [CrossRef]
  10. Chiappini, A.; Armellini, C.; Chiasera, A.; Ferrari, M.; Fortes, L.; Gonçalves, M.C.; Righini, G.C. An alternative method to obtain direct opal photonic crystal structures. J. Non-Cryst. Solids 2009, 355, 1167–1170. [Google Scholar] [CrossRef]
  11. Zhang, Y.; Qiu, J.; Gao, M.; Li, P.; Gao, L.; Heng, L.; Tang, B.Z.; Jiang, L. A visual film sensor based on silole-infiltrated SiO2 inverse opal photonic crystal for detecting organic vapors. J. Mater. Chem. C 2014, 42, 8865–8872. [Google Scholar] [CrossRef]
  12. Chiappini, A.; Armellini, C.; Carpentiero, A.; Minati, L.; Righini, G.C.; Ferrari, M. Solvent sensitive polymer composite structures. Opt. Mater. 2013, 36, 130–134. [Google Scholar] [CrossRef]
  13. Wijnhoven, J.E.; Vos, W.L. Preparation of photonic crystals made of air spheres in titania. Science 1998, 281, 802–804. [Google Scholar] [CrossRef]
  14. Holland, B.T.; Blanford, C.F.; Do, T.; Stein, A. Synthesis of highly ordered, three-dimensional, macroporous structures of amorphous or crystalline inorganic oxides, phosphates, and hybrid composites. Chem. Mater. 1999, 11, 795–805. [Google Scholar] [CrossRef]
  15. Norell, M.A.; Makovicky, P.; Clark, J.M. Porous silica via colloidal crystallization. Nature 1997, 389, 447–448. [Google Scholar] [CrossRef]
  16. Tessier, P.M.; Velev, O.D.; Kalambur, A.T.; Rabolt, J.F.; Lenhoff, A.M.; Kaler, E.W. Assembly of gold nanostructured films templated by colloidal crystals and use in surface-enhanced Raman spectroscopy. J. Am. Chem. Soc. 2000, 122, 9554–9555. [Google Scholar] [CrossRef]
  17. Yin, J.S.; Wang, Z.L. Template-assisted self-assembly and cobalt doping of ordered mesoporous titania nanostructures. Adv. Mater. 1999, 11, 469–472. [Google Scholar] [CrossRef]
  18. Velev, O.D.; Tessier, P.M.; Lenhoff, A.M.; Kaler, E.W. Materials: A class of porous metallic nanostructures. Nature 1999, 401, 548. [Google Scholar] [CrossRef]
  19. Vlasov, Y.A.; Yao, N.; Norris, D.J. Synthesis of photonic crystals for optical wavelengths from semiconductor quantum dots. Adv. Mater. 1999, 11, 165–169. [Google Scholar] [CrossRef]
  20. Yu, Y.Y.; Yu, H.H. High refractive index organic-inorganic composites with TiO2 nanocrystal. Thin Solid Films 2013, 529, 195–199. [Google Scholar] [CrossRef]
  21. Kuo, W.K.; Kuo, G.F.; Lin, S.Y.; Yu, H.H. Fabrication and characterization of artificial miniaturized insect compound eyes for imaging. Bioinspir. Biomim. 2015, 10, 056010. [Google Scholar]
  22. Kuo, W.K.; Weng, H.P.; Hsu, J.J.; Yu, H.H. A bioinspired color-changing polystyrene microarray as a rapid qualitative sensor for methanol and ethanol. Mater. Chem. Phys. 2016. [Google Scholar] [CrossRef]
  23. Liu, K.; Schmedake, T.A.; Tsu, R. A comparative study of colloidal silica spheres: Photonic crystals versus Bragg’s law. Phys. Lett. A 2008, 372, 4517–4520. [Google Scholar] [CrossRef]
  24. Shieh, J.Y.; Kuo, J.Y.; Weng, H.P.; Yu, H.H. Preparation and evaluation of the bioinspired PS/PDMS photochromic films by the self-assembly dip-drawing method. Langmuir 2013, 29, 667–672. [Google Scholar] [CrossRef] [PubMed]
  25. Waterhouse, G.I.; Waterland, M.R. Opal and inverse opal photonic crystals: Fabrication and characterization. Polyhedron 2007, 26, 356–368. [Google Scholar] [CrossRef]
  26. Cao, Y.; Wang, Y.; Zhu, Y.; Chen, H.; Li, Z.; Ding, J.; Chi, Y. Fabrication of anatase titania inverse opal films using polystyrene templates. Superlattices Microstruct. 2006, 40, 155–160. [Google Scholar] [CrossRef]
  27. Asiah, M.N.; Mamat, M.H.; Khusaimi, Z.; Achoi, M.F.; Abdullah, S.; Rusop, M. Thermal stability and phase transformation of TiO2 nanowires at various temperatures. Microelectron. Eng. 2013, 108, 134–137. [Google Scholar] [CrossRef]
  28. Amrehn, S.; Wu, X.; Schumacher, C.; Wagner, T. Photonic crystal-based fluid sensors: Toward practical application. Phys. Status Solidi A 2015, 212, 1266–1272. [Google Scholar] [CrossRef]
  29. Herráez, J.V.; Belda, R. Refractive indices, densities and excess molar volumes of monoalcohols + water. J. Solut. Chem. 2006, 35, 1315–1328. [Google Scholar] [CrossRef]
  30. Zhao, X.J.; Wang, Z.; Xu, H.Y.; Liang, F.; Zhang, H.Q.; Jin, Q.H. Studies on surface plasmon resonace sensor. Chem. J. Chin. Univ. 1998, 198, 1214–1218. [Google Scholar]
  31. Park, S.H.; Xia, Y. Assembly of mesoscale particles over large areas and its application in fabricating tunable optical filters. Langmuir 1999, 15, 266–273. [Google Scholar] [CrossRef]
  32. Di Falco, A.; O’Faolain, L.; Krauss, T.F. Chemical sensing in slotted photonic crystal heterostructure cavities. Appl. Phys. Lett. 2009, 94, 063503. [Google Scholar] [CrossRef]
  33. Cennamo, N.; Massarotti, D.; Conte, L.; Zeni, L. Low cost sensors based on SPR in a plastic optical fiber for biosensor implementation. Sensors 2011, 11, 11752–11760. [Google Scholar] [CrossRef] [PubMed]
  34. DeLouise, L.A.; Kou, P.M.; Miller, B.L. Cross-correlation of optical microcavity biosensor response with immobilized enzyme activity. Insights into biosensor sensitivity. Anal. Chem. 2005, 77, 3222–3230. [Google Scholar] [PubMed]
  35. Roper, D.K. Determining surface plasmon resonance response factors for deposition onto three-dimensional surfaces. Chem. Eng. Sci. 2007, 62, 1988–1996. [Google Scholar] [CrossRef] [PubMed]
  36. Ting, C.C.; Chen, S.Y.; Liu, D.M. Structural evolution and optical properties of TiO2 thin films prepared by thermal oxidation of sputtered Ti films. J. Appl. Phys. 2000, 88, 4628–4633. [Google Scholar] [CrossRef]
Figure 1. Schematic diagram of the polystyrene (PS) opal and TiO2 inverse opal sensor preparation.
Applsci 06 00067 g001
Figure 2. (a) Detail of the apparatus geometry and experimental; (b) The top view of the variable angle multifunctional optical characteristic measuring system (MFS-630).
Applsci 06 00067 g002
Figure 3. The AFM image of the PS opal structure: (a) Average diameter of PS microspheres was labeled; (b) A profile line a–b was exhibited on the top surface of the PS microspheres array; (c) 3D image of the ordered close-packed PS opal structure.
Applsci 06 00067 g003
Figure 4. The (a) top view and (b) cross sectional scanning electron microscope (SEM) images of the PS opal structure.
Applsci 06 00067 g004
Figure 5. The SEM images of the TiO2 inverse opal structure sintered at (a) 500 °C and (b) 600 °C. The dark and hollow regions are air pores, and the bright regions are TiO2.
Applsci 06 00067 g005
Figure 6. The XRD patterns of the titania inverse opal sintered at (a) 500 °C and (b) 600 °C.
Applsci 06 00067 g006
Figure 7. The ethanol concentration-dependent reflectance spectra of the (a) PS opal sensor; (b) 500 °C and (c) 600 °C sintered TiO2 inverse opal sensor. (left: 2D diagram; right: 3D diagram)
Applsci 06 00067 g007
Figure 8. The relationship between red shift of reflectance spectra and the ethanol concentration (v/v0): (a) PS opal; (b) 500 °C and (c) 600 °C sintered TiO2 inverse opal sensors. Error bars represent standard deviation based on data from three measurements.
Applsci 06 00067 g008
Table 1. The reflectance peak position of different ethanol concentrations dropped onto polystyrene (PS) opal structure as well as 500 and 600 °C sintered TiO2 inverse opal structures.
Ethanol Concentration (%) (v/v0)Refractive Index (by Abbe Refractometer, at 26 ± 0.5 °C)PS Opal StructureTiO2 Inverse Opal Structure Sintered Temperature
λ (nm)λ (nm)(500°C)λ (nm)(600°C)
1001.3601580670670
901.3625590630680
801.3623590620670
701.3616590590650
601.3598580580630
501.3571580590620
401.3536580580600
301.3488570590580
201.3429570580560
101.3375560580540
01.3324540570510
∆λ (λmax − λmin)-50100170
Table 2. Calculating the sensitivity of the 600 °C sintered TiO2 inverse opal sensors by Equations (4) and (5).
Ethanol Concentration (v/v0)Refractive Index from Table 1Average Refractive Index (na) from Equation (4)The Wavelength (λ) from Table 1
80%1.36231.7391670 (nm)
10%1.33751.7248540 (nm)
-n = 0.0248na = 0.0143∆λ = 130 (nm)
Sensitivity (S)5242 nm/RIU9090 nm/RIU-

