Article

Adequacy of Technical and Commercial Alternatives Applied to Machine Tool Verification Using Laser Tracker

1
Design and Manufacturing Engineering Department, Universidad de Zaragoza, Zaragoza 50018, Spain
2
Mechanical Engineering Department, Universidad de Zaragoza, Zaragoza 50018, Spain
*
Author to whom correspondence should be addressed.
Appl. Sci. 2016, 6(4), 100; https://doi.org/10.3390/app6040100
Submission received: 4 March 2016 / Revised: 23 March 2016 / Accepted: 25 March 2016 / Published: 7 April 2016

Abstract

:
Besides presenting a volumetric verification technique that allows characterization of the different geometric errors of a machine tool (MT) depending on its kinematic chain and geometry through a kinematic model, this paper investigates the influence of measurement tools and techniques available on the final accuracy of the MT. Volumetric verification based on a laser tracker (LT) relates the coordinates of the tool with the coordinates of the LT, including it into the kinematic model. Using a non-lineal optimization process, approximation functions that characterize the joint influence of MT geometric errors are obtained. However, measurement data will be affected by previous compensation of the MT, the accuracy of the measurement system, LT measurement technology, the type of retroreflector used, and techniques used to improve data accuracy, among other sources of errors. This paper studies the adequacy of different commercial alternatives such as: retroreflectors, LTs from different manufacturers, etc., that can be applied in MT verification using a long-range MT. As the accuracy is strongly affected by the uncertainty of its angular encoders, the multilateration technique tries to improve data accuracy using only LT radial information. Nonetheless, a new bundle adjustment which uses radial and angular information is presented in current metrology software. This paper studies both techniques and analyzes their adequacy for MT verification too.

1. Introduction

The development and evolution of the technological field in the machine tool (MT) industry has provided continuous improvements in the characteristics and properties of MTs. So, customers are demanding improvements in the accuracy of the work performed as well as increased capacity and reliability of production systems.
However, many current production systems are obsolete and cannot achieve the required specifications. To avoid excessive errors and decay of the dimensional quality of parts, it is necessary to perform routine maintenance to approximately indicate the MT’s errors and, when necessary, to realize a complete verification of and compensation for its errors. One of the principal ways to reduce machine errors is through processes involving positioning accuracy, because geometric errors result from structural elements that affect the repeatability and accuracy of the machine.
Nowadays, there are two different methods of measurement: direct methods, which study the effect of individual errors, and indirect methods, which study the combined effect of errors. Historically, the accuracy of MTs have been guaranteed by using direct measurement methods, in which errors of each axis of movement are measured independently [1,2,3,4]. The main disadvantage of this type of measurement lies in the fact that the verification time required is much higher than that of indirect measurement methods [4]. Meanwhile, indirect methods reduce this time by providing global information about the influence of all geometric errors of the MT (volumetric error) by measuring a set of verification points in the MT workspace using multi-axis movement of the MT [5,6,7,8,9,10,11,12].
Techniques that use indirect measurement systems such as ball bars, laser tracers (LCs), laser trackers (LTs), and so on to characterize geometric errors using the kinematic model of the MT are called volumetric verification methods [5,6,7,8,13]. The verification of long-range MTs using interferometric measurement systems such as LTs and LCs is based on non-linear optimization techniques [6,7,8]. Researchers have studied the parameters of the regression function used, optimization methodology, distribution of measured points, techniques of multilateration, LT self-calibration to improve data accuracy, and so on [14,15,16,17,18,19].
This paper is focused on studying and comparing different commercial alternatives to deal with volumetric verification of long-range MTs. To do this, the same MT is verified using three different LTs from leading manufacturers using a traditional spherically mounted retroreflectors (SMR) or a new motorized retroreflector (active target). Moreover, the paper investigates trilateration and bundle adjustment techniques in verification as techniques for improving the accuracy of measurement with LTs and their influence on the verification of a real machine.

2. Features of the Machine Tool Taken into Consideration in Volumetric Verification

The principal aim of volumetric verification is to mathematically characterize the combined effect of all geometric errors of the MT for further compensation; using the kinematic model of the MT, the difference between theoretical points introduced for numerical control (NC) and measurement of nominal points with an LT is found. Therefore, the kinematic model of the MT and its control software must be obtained and studied before carrying out verification.

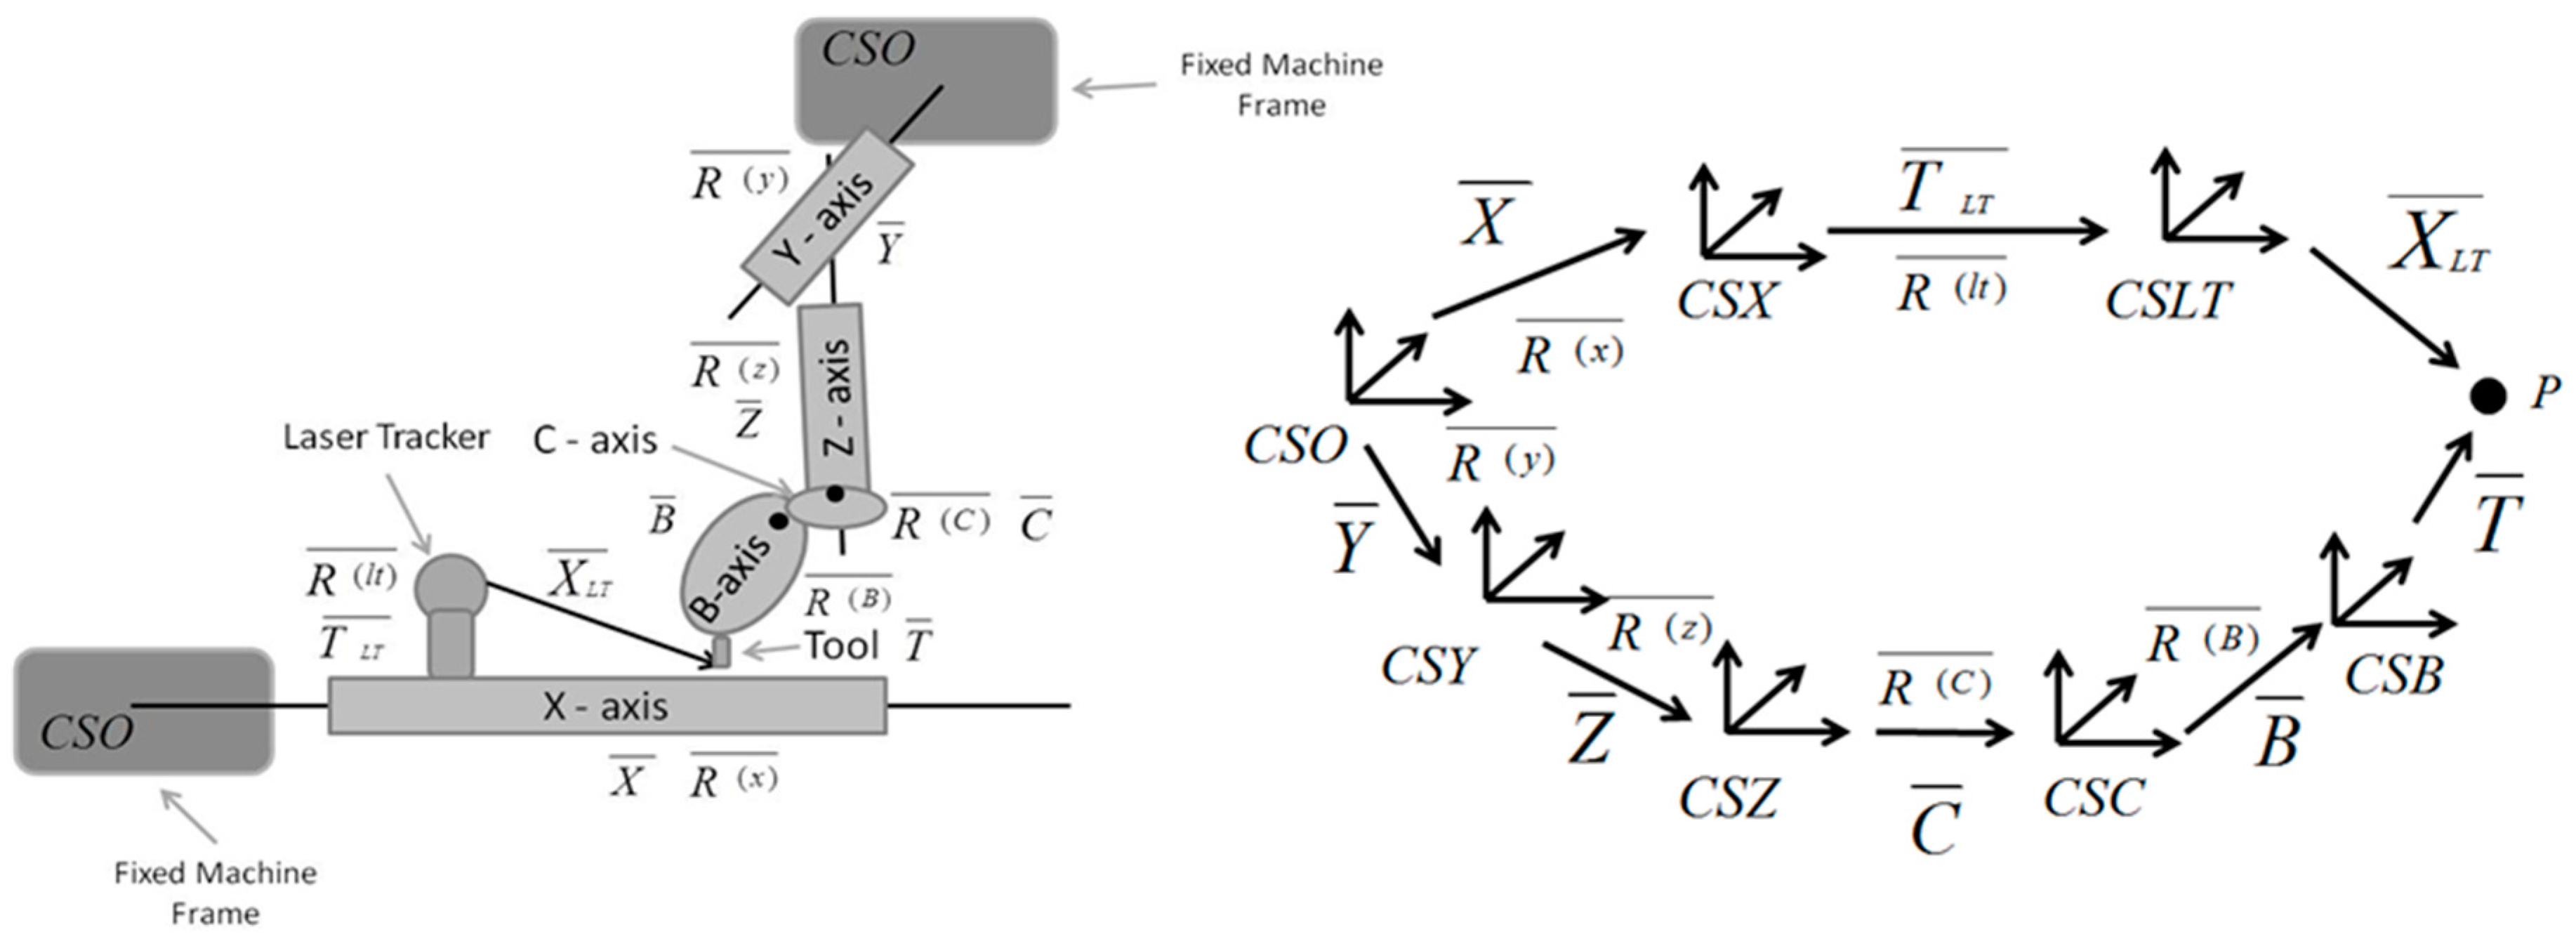
2.1. Structural Configuration and Kinematic Model of the Machine Tool

An MT is a compound machine that carries out work and generates metal chips. MTs are classified as compound machines that transmit power (thermal, hydraulic, electrical) and machines that do not start making metal chips (cutting, stamping, compression).
Within these two groups, the combination of different structural elements such as guides, joints, or screws that define the kinematic structure of the MT shapes its kinematic chain. Assuming that moving cars of the kinematic chain are rigid bodies, transformation and rotation matrices can be implemented by using a mathematical model (kinematic model) based on the MT configuration [6,7,11,13]. Then, the position of the tool with regard to the part to be machined is obtained in relation to the programmed nominal position, the position of the tip of the tool with respect to the reference machine (offsets), and the geometric errors of the axes.
To obtain the combined effect of all geometric errors of the MT through its kinematic model, the measurement system (LT) must replace the part and the retroreflector must replace the tool (Figure 1). The kinematic model of the MT to be verified is represented by XFYZCB, where F determines the fixed part of the machine, the X-axis drives the worktable, Y and Z are combined to actuate the tool, and the C/B rotational axis allows head orientation, providing five degrees of freedom to the MT (Figure 1, Table 1).
As a result of studies performed on this MT, its axes of rotation relative to C and B were locked. The final structural configuration of the MT to be verified is XFYZ, with six geometric errors per axis (position, horizontal and vertical straightness, yaw, pitch, and roll) and three squareness errors associated.
The equation of movement that relates the nominal coordinates of the MT with measured coordinates of the LT is presented in Equation (1).
X L T ¯ =   R L T 1 ¯   ( R X 1 ¯   ( R y ¯   ( R z ¯   T ¯ +   Z ¯ ) +   Y ¯ Z ¯ ) T L T ¯ )
where the components of the equations are constituted as follows: T ¯ is the offset of the tool.
T ¯ = ( x t y t z t )
R k ¯ represents the rotational error matrix in the axis k of the tool with k = x, y, z.
R ( k ) ¯   = ( 1 ε z ( k ) ε y ( k ) ε z ( k ) 1 ε x ( k ) ε y ( k ) ε x ( k ) 1 )
X ¯ represents the linear error vector in the x-axis of the milling machine.
X ¯ = ( x +   δ x ( x ) δ y ( x ) δ z ( x ) )
Y ¯ represents the linear error vector in the y-axis of the milling machine.
Y ¯ = ( δ x ( y ) y · ε x y y + δ y ( y ) δ z ( y ) )
Z ¯ represents the linear error vector in the z-axis of the milling machine.
Z ¯ = ( δ x ( z ) z · ε x z δ y ( z ) z · ε y z z + δ z ( z ) )
where ε x ( k ) ,   ε y ( k ) ,   and   ε z ( k ) are three rotation errors of an axis k = x, y, z; δ k ( k ) is the position error of the axis k = x, y, z; δ k ( j ) with kj is the straightness error in the k direction; and ε x y ,   ε x z ,   and   ε y z are squareness errors.
T L T ¯ represents the translation vector between the coordinate systems of the machine, CSO, and laser tracker, CSLT.
T L T ¯ = ( o X L T o Y L T o Z L T )
R L T ¯ represents the rotation matrix θ between CSLT and CSO around a unitary vector u = (ux, uy, uz), where u x 2 + u x 2 + u x 2 = 1 .
X L T ¯ represents the coordinates of a machine point measured with an LT.
X L T ¯ = ( X L T Y L T Z L T )

2.2. Control System of the Machine Tool

Currently, new compensation systems have been developed by control system manufacturers, such as Siemens’ Volumetric Compensation System (VCS), Heidenhain’s Kinematic Comp, and Fanuc’s 3D Compensation/3D Rotary Compensation, which use the approximation function of each geometric error of the MT to compensate for the influences of errors [20,21].
However, the most common method of compensating for geometric errors of an MT is based on the compensation table of the MT control software. Generally, not all geometric errors of the MT have their own compensation tables. In the same way, some MTs have their own control routines to compensate for errors during the machining process using a personal computer (PC) [22].
Otherwise there is another way to compensate for the influence of geometric error: by numerical control (NC) program reconstruction [23]. This method uses the kinematic model of the machine as a post-processor of the NC. Therefore, the MT accuracy is improved regardless of the control of the machine as this is not employed in the compensation. So, a new post-processor has been developed following this scheme:
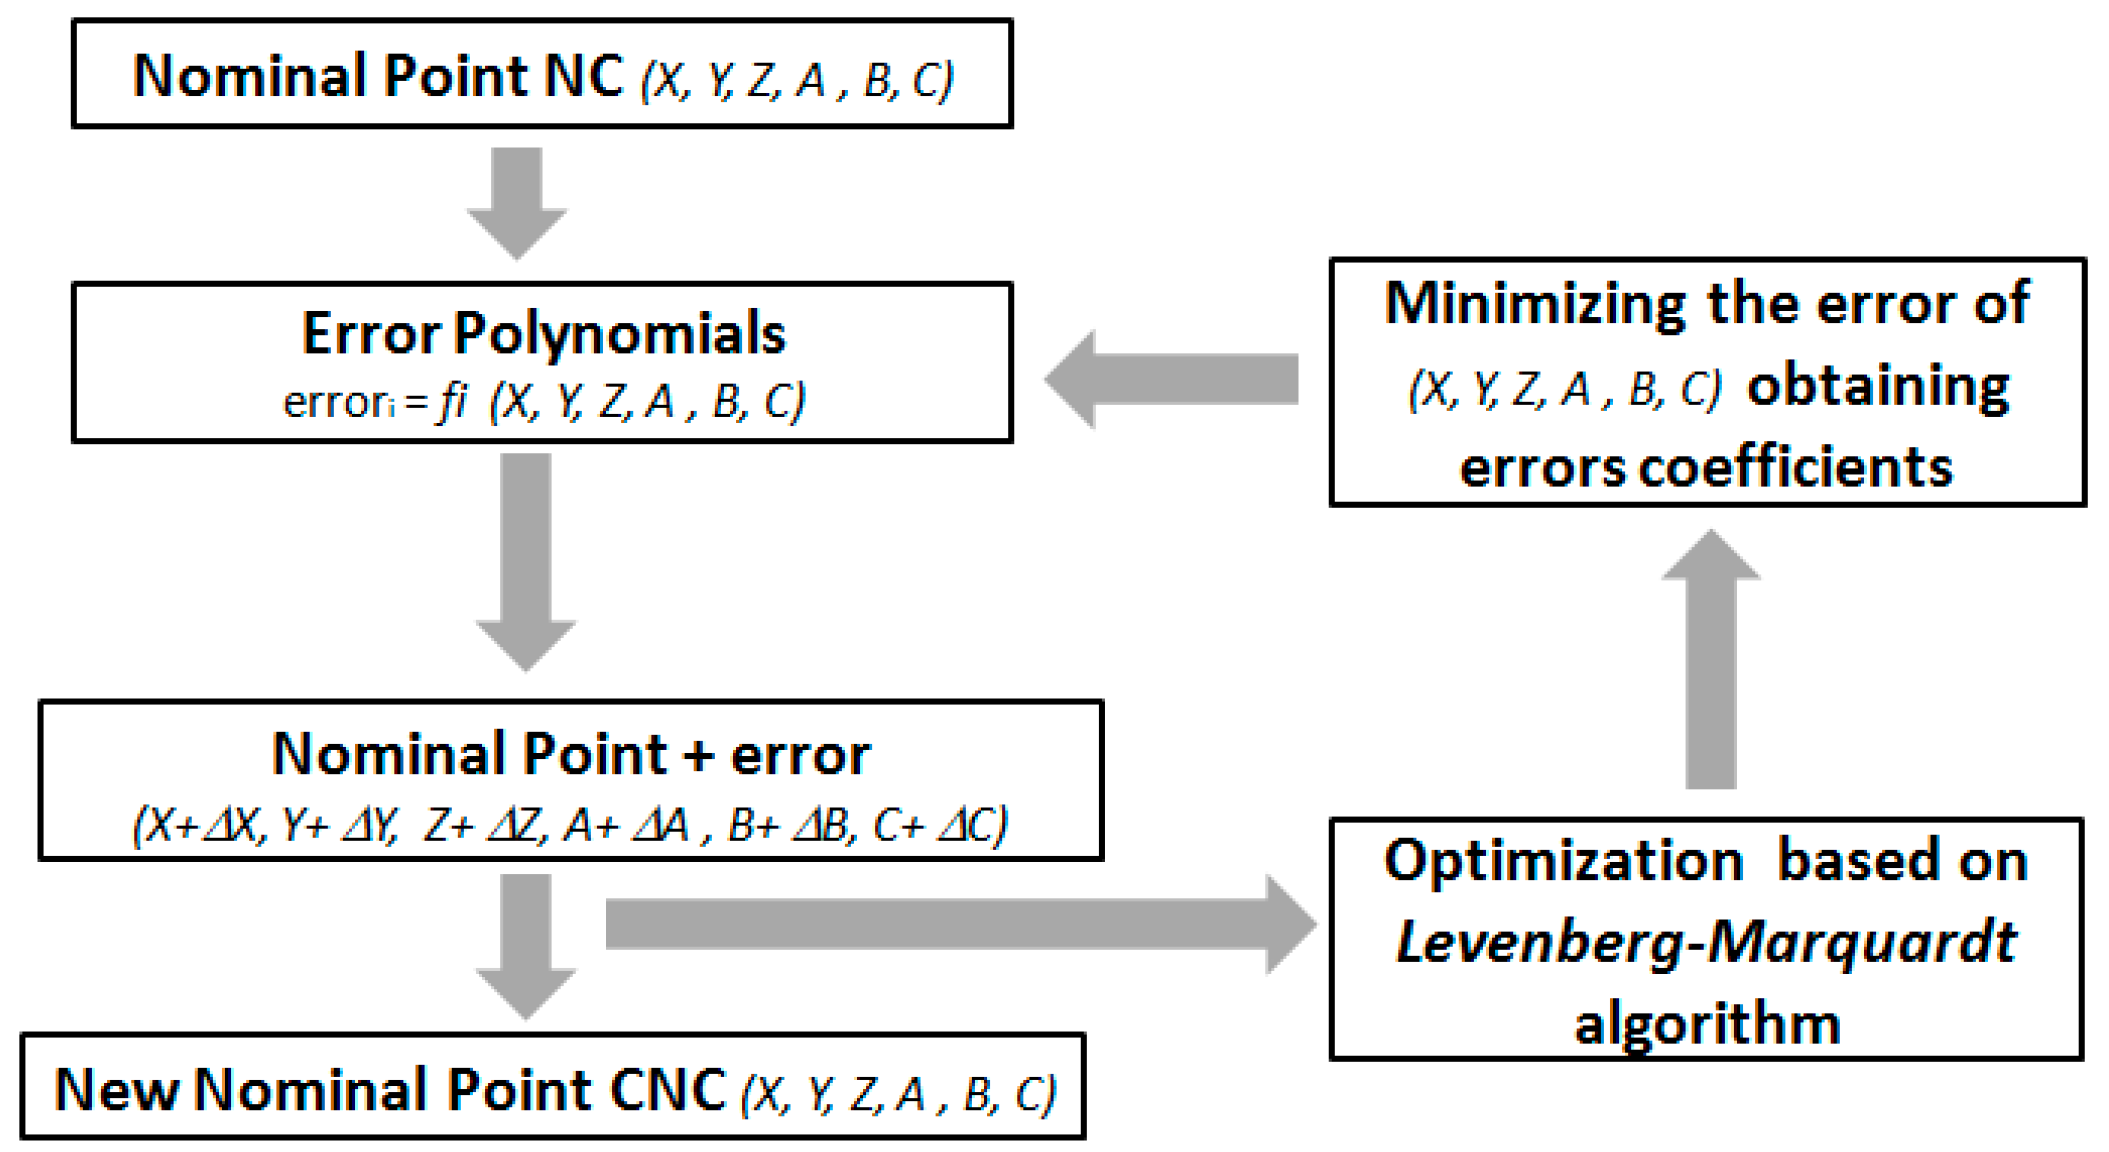
  • Nominal coordinates of a point from the original NC are introduced into the kinematic model of the machine, where they are treated by approximation functions obtained in the verification process.
  • The kinematic model provides the coordinates of a new point associated with another error measured in the verification.
  • Through a process based on the Levenberg–Marquardt method, the software looks for the point coordinates where the influence of geometric errors is smallest. It takes into consideration the nominal coordinates and their nominal error.
Once all the nominal points have been compensated, the software (Figure 2) provides a new NC program with which the accuracy of the obtained approximation functions is validated and a more accurate part is made.
Due to its flexibility, this method was selected in this paper as the ideal one to perform the compensation for the geometric errors in this MT, allowing us to carry out all of the required tests.

3. Laser Tracker as a Measurement System

An LT is a portable measurement system that provides the position of a point in spherical coordinates. This position is determined by comparing a measurement beam and a reference beam from the combination of a laser interferometer and the readings of the azimuth and polar coordinates of the angular encoders. Due to its versatility, LTs are used in many industrial applications such as in metrology and quality departments. Due to its long measurement range, accuracy, and versatility, the LT was selected as an adequate measurement system for volumetric verification, allowing the purchase of a dedicated system to be avoided and reducing costs.
The three biggest LTs manufacturers are Leica Geosystems, Faro Inc. (formerly SMX, Lake Mary, FL, USA), and API (Automated Precision Inc., Rockville, MD, USA). All of them have their own design and system characteristics. Also, the origins of their own coordinate systems are in different places (Figure 3).
The main sources of errors in LT accuracy that affect verification are divided into errors due to environmental influences, assembly, and calibration errors, errors of LT components such as encoders or sensors, and errors due to the retroreflector and measurement technologies [24,25,26,27,28].

3.1. Laser Tracker Measurement Technologies

Currently, there are two different types of technologies used in LTs to determine the distance measurement: incremental distance measurements with an interferometer and a frequency-stabilized helium-neon laser (IFM), and absolute distance measurement (ADM) with an electronic control that analyzes the beam signal to determine its time of flight, providing the distance from the LT to the retroreflector. Meanwhile the measuring beam cannot be broken in IFM mode; if it is broken in ADM mode, the beam can be recovered and the measurement can continue. However, ADM is less accurate than IFM. The difference in accuracy between the two measurement techniques is shown in [24].

3.2. Retroreflector

A retroreflector is an item or surface that reflects light back towards the source regardless of the angle of incidence. This behavior is not equivalent to a mirror since it only reflects beams of light in the direction of incidence.
The most commonly used retroreflectors are the SMR and cat’s eye. A traditional corner cube retroreflector SMR of 1.5″ has an incidence angle of ±30°, while a cat’s eye has an approximate angle of ±90°. As in MT verification the LT replaces the part and the retroreflector is placed on the tool, the relative movement between LT and retroreflector causes its angle of incidence to exceed these values. As shown by [28], the incidence angle between beam and retroreflector affects the measurement coordinates and workspace to be verified.
Since 2010, a new motorized target retroreflector (Active Target) developed by API allows any API LT to automatically position itself, so it will never lose the beam. The Active Target reflector works in a similar way to any SMR. The difference is that the Active Target features motorization technology that automatically positions the reflector adjusting the beam so it is perpendicular to the reflector.

3.3. Measurement Uncertainty

As a result of the design, calibration, and accuracy of components used, the LT has a measurement uncertainty [24,25,26]. Therefore, manufacturers provide specifications of their LTs, and their accuracy is evaluated based on the standards ISO DIS 10360-10 and ASME B 89.4.19-2005. In order to reduce measurement uncertainty as a result of LT angular encoders, different multilateration techniques can be used, and the ones most commonly used in MT verification are studied in Section 4.

4. Laser Multilateration in Machine Tool Verification

Of all the random sources of errors of an LT, the measurement noise that is formed by interferometer uncertainty and angular encoder uncertainty is the greatest contributor to the measurement uncertainty. Thus, angular uncertainty is removed using multilateration techniques; and point coordinates using only radial information of the points measured from at least three different positions (trilateration techniques) is obtained.
However, new metrology software includes angular information in the solution, allowing each individual measurement to be weighted based upon its type and accuracy; this is known as bundle or weighted adjustment trilateration [17,18].

4.1. Traditional Trilateration Technique

Trilateration aims to obtain a point with less involvement of the measurement uncertainty. Therefore, it uses only the radial component of each LT to determine points’ coordinates. To do this, the new point is defined as the intersection of the three spheres that define the radial component of each LT, with (xi, yi, zi) defining the center of a sphere LTi (i = 1, 2, 3).
R i 2 = ( x x i ) 2 + ( y y i ) 2 + ( z z i ) 2    with  i = 0 , , 3
The equations system defined by LT coordinates can be solved analytically. However, the most useful technique, thanks to its accuracy, is trilateration using optimization [14,15]. This technique is based on an iterative process of parameter identification. The producer minimizes the difference between distances measured for each LT (Equation (10)).
R e s t 2 = j = 1 n i = 1 4 { [ ( x m j X i ) 2 + ( y m j Y i ) 2 + ( z m j Z i ) 2 ] 1 2 ( d i ) } 2
The value Rest is the difference between the radial coordinate of point Pj measured with LTi (dij) and the distance between the coordinate system of point Pj (xmj, ymj, zmj). The difference is calculated in the LT coordinates system, with (Xi, Yi, Zi) coordinates of the LT in the reference coordinate system (Figure 4). Parameters to be identified in the optimization process can be reduced if a new reference system of the LT is created as shown in Figure 4 [14,15].
Therefore, parameters to be identified are the LT positions X1, X2, and Y2, and the multilateralized coordinates xm,j, ym,j, and zm,j with j = 1 n (n = number of points). These parameters are obtained by non-lineal optimization techniques based on the Levenber-Marquadt algorithm as shown in Figure 5.

4.2. Weighted Trilateration

A weighted or bundle adjustment is a numerical adjustment that uses redundant measurements to obtain the best possible coordinates of a point. It simultaneously varies the positions of the measurement system and point until the sum of squares is minimized.
There are several studies of different bundle adjustment techniques [17,18]. However, their operating principle is the same: the importance of different parameters in the optimization process in relation to the uncertainty of the components of the LT is controlled. Generally, LT uncertainty is characterized in relation to standard deviations. Weighted trilateration gives greater weight to more accurate measurements than less accurate measurements (Equations (12)–(14)):
H ± σ H
V ± σ V
R ± σ R
where H is the horizontal angle, V is the vertical angle, and R is the radial coordinate of an LT.
The gradual increase in the use of this technique, as well as a greater demand for more accurate measurements, has led to the introduction of dynamic weights. For example, the weight associated with the angular measurement of an LT varies in relation to the range and angle measurement accuracy (Equations (15)–(17)) [28]:
H ± σ H ( θ )
V ± σ V ( ϕ )
R ± σ R ( R )

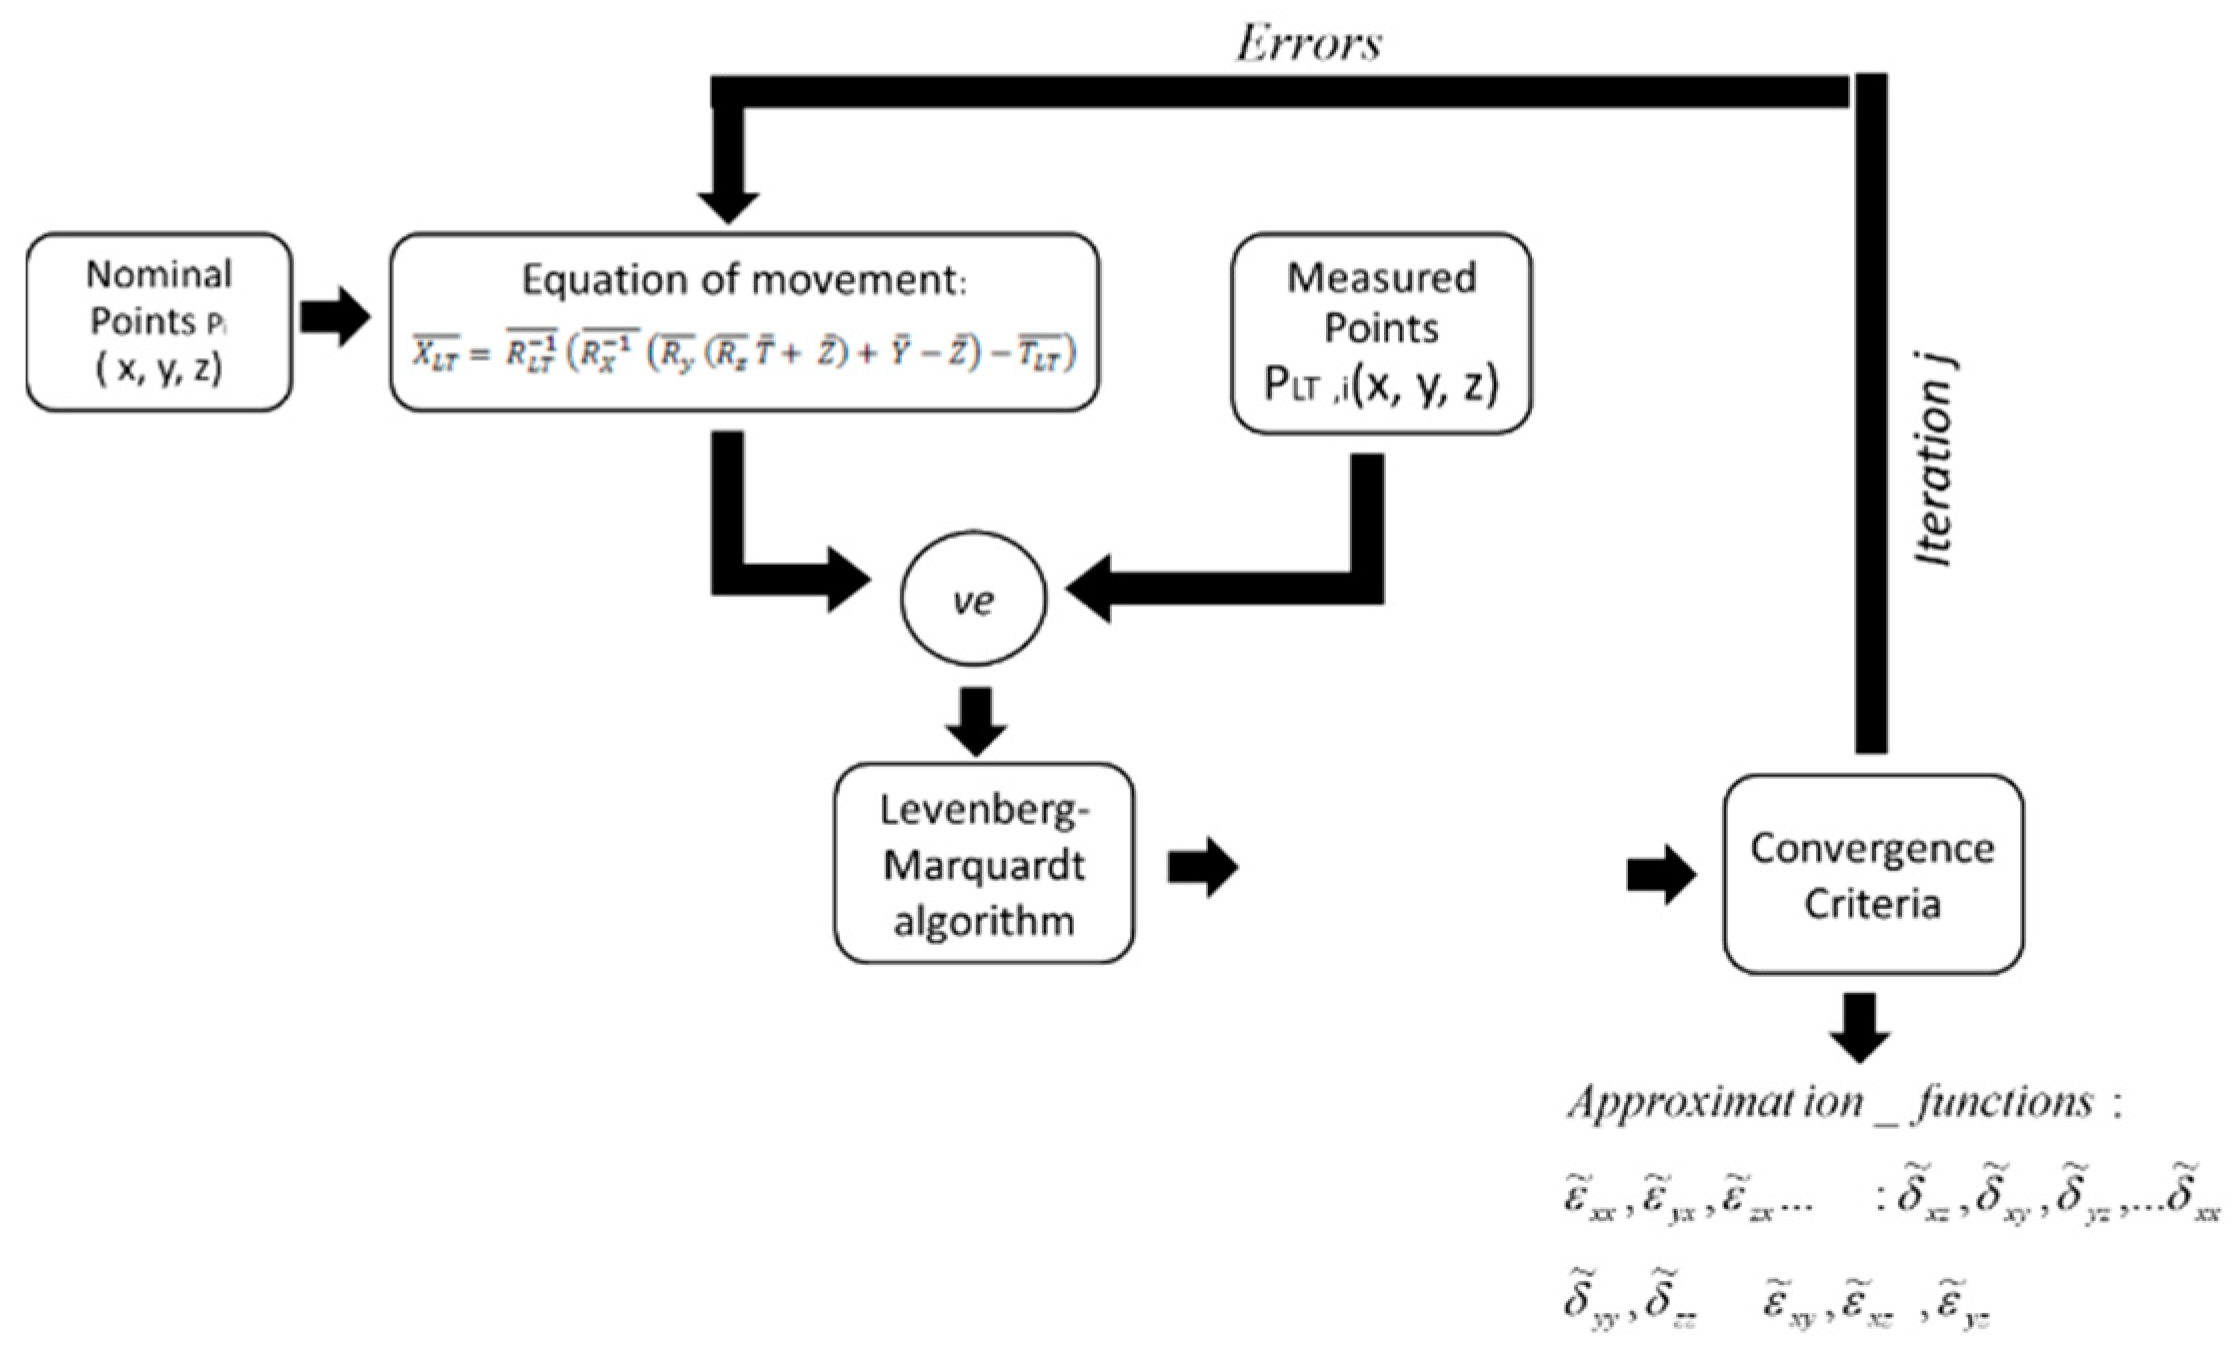
5. Working Principle of Volumetric Verification

Volumetric verification aims to reduce the influence of geometric results based on volumetric error from LT measurement. This is obtained using the kinematic model of the machine including the measurement system on it (as shown in Section 2).
The relationship that provides this equation generates a non-linear equation system. Using the Levenberg–Marquardt algorithm in a non-lineal optimization process, the approximation functions of geometric errors are obtained reducing the volumetric error.
The working principle is shown in Figure 6. Nominal points introduced in the machine kinematic model are influenced by the geometric errors of the machine, modifying the point coordinates. As the error values are not known, regression functions provide the values of each error at each point to approximate the geometric errors of the kinematic model.
To reduce the volumetric error of the machine, the values of the coefficients that define the regression functions change during the optimization process. When the verification process is complete, one of the convergence criteria is fulfilled. Then, the regression functions obtained define the approximation function of each geometric error.

6. Working Principle of Volumetric Verification

Besides studying the adequacy of volumetric verification to improve the accuracy of long-range MTs, tests were conducted with the aim of studying and comparing the equipment and techniques that currently exist. For this purpose, the linear axis of a Zayer TB5000 machine center was tested with all of them, providing relevant information to management and metrology departments as well as researchers interested in the use of LT and multilateration techniques.

6.1. Verification of Machine Tool Using API Motorized Retroreflector with and without Previous Compensation

The use of a motorized retroreflector as an active target allows us to increase the MT workspace to be verified. This is especially relevant when the part to be machined is above the axes of movement, because the LT must replace the part to show the same errors as the part (Figure 7), and the incidence angles of the SMR and cat’s eye reflectors are limited. However, the motorized retroreflector can only be used by the API LT in ADM mode.
Using an MT workspace with 0 mm ≤ X ≤ 5050 mm, 0 mm ≤ Y ≤ 2050 mm, 0 mm ≤ Z ≤ 750 mm, C = 0°, and B = 0°, the system can verify a workspace of 0 mm ≤ X ≤ 5000 mm, 0 mm ≤ Y ≤ 2000 mm, 0 mm ≤ Z ≤ 750 mm, C = 0°, and B = 0° using as intervals 500 mm to the X-axis, 500 mm to the Y-axis, and 250 mm to the Z-axis. It provides a verification mesh with 219 points (Figure 7).
Based on information of reference [27] the preheating of the MT is carried out using specific NC cycles. It is formed with the eight points that define the large workspace of the machine and its diagonals. This vacuum cycle prior to capturing points is repeated for 45 min until all MT components are hot.
Among the non-geometric errors of the MT such as repeatability, deformations, and so on, one of the most relevant is the backlash error of the axis of movement. It is not introduced in the kinematic model of the machine. However, to reduce its influence, verification points are measured twice; in the first measurement the effect of backlash has a certain direction while in the second one it has the opposite direction. In this case, the coordinates of the measured point are the average of the coordinates obtained in the backward and forward measurements. In the same way, temperature variations should be controlled during verification, preventing the occurrence of thermal gradients due to light sources, air currents, and so on. This source of error changes the machine structure and affects the measured points. Therefore, it is necessary to monitor the temperature variations during and between tests.
Firstly, the current status of the machine and the suitability and performance of its compensation were analyzed. For this purpose, the accuracy of the MT was obtained using verification points with and without compensation. The variations in the temperature of the environment during measurement and validation are presented in Figure 8. The variation is approximately 1 °C in both cases. Variation between measurements is also reduced because both points are measured twice. Consequently, temperature variations are not depreciable but assumable. However, temperature influence is deeply studied in order to reduce it [29,30]. This one is not considered in the verification process proposed but it is minimized.
Calibration times are divided in three steps with three different times, preparation, acquisition, and identification:
Preparation is the step which requires more time. It is approximately 2 h. It is because LT should be located on the correct place in order to maximize the workspace of the MT to verify. Moreover, the LT requires as little as 30 min of heating time before measure. Additionally, a numerical control program (NC) taking into consideration characteristic of the MT to verify should be created to automatize data capture.
Acquisition or data captured time is presented in Figure 8, 1 h, it is time required to measure all verification points of the NC created previously. This information is used to obtain approximation functions of each MT geometric error during identification process.
Identification was carried out approximately in 20 min using optimization process (Section 5). Once it is finished, MT compensation can be carried out. Therefore, the MT verification required approximately 3 h 30 min.
On analyzing the initial errors after thermal variations, the results displayed in Figure 9, which represent an error histogram of verification points, show that its current compensation reduces the maximum error from 246.3 to 197.7 µm, the average volumetric error from 112.9 to 83.1 µm, and the minimum error from 15.1 to 10.1 µm. Therefore, it reduces the average positioning error of the MT by 26.5%.
The current MT compensation method is based on compensation tables provided by manufacturers, which are not easy to access or use. Therefore, compensation was carried out using an NC post-processor. In the same way, as volumetric verification is a mathematical correction that cannot provide a complete physical meaning to the approximation function obtained, verification can be carried out when MT compensation software is activated (verification with compensation).
Table 2 shows the results of the adequacy of approximation with and without previous compensation using simple polynomials of degree three as regression functions.
When compensation prior to verification is studied, it can be observed that the maximum error is reduced by 40 µm, while the average volumetric error is reduced by 30 µm. In the same way, if compensation is inactive in data acquisition (verification without compensation), the average error reduction is reduced to 57.4 µm. Therefore, volumetric verification improves the accuracy of the MT by 49%, whereas an improvement of 26% was obtained with the previous method. In the same way, if data with prior verification is used, the approximation functions obtained reduce the error to 58%. This is because the residual errors of previous compensation are the result of uncompensated geometric errors. Therefore, the MT has been compensated after volumetric verification, providing an increase of MT positioning accuracy.
The histograms in Figure 10 show that the global error of the machine has been reduced. However, to find out how errors are distributed in the MT workspace, color maps such as that in Figure 11 are studied. It shows that volumetric verification provides a homogeneous correction on the whole of the MT workspace, avoiding areas of failure at the ends of the axes of movement. Among the non-geometric errors of the MT such as repeatability, deformations, and so on, one of the most relevant is the backlash error of the axis of movement. It is not introduced in the kinematic model of the machine. However, to reduce its influence, verification points are measured twice; in the first measurement, the effect of backlash has a certain direction while, in the second one, it has the opposite direction. In this case, the coordinates of the measured point are the average of the coordinates obtained in the backward and forward measurements. In the same way, temperature variations should be controlled during verification, preventing the occurrence of thermal gradients due to light sources, air currents, and so on. This source of error changes the machine structure and affects the measured points. Therefore, it is necessary to monitor the temperature variations during and between tests.

6.2. Influence of Laser Tracker (LTs)’ Measurement Characteristics on Verification Results

As the active target cannot be used with LTs from different manufacturers, it is replaced by a traditional retroreflector, the Spherically Mounted Retroreflector, SMR-1.5″. The workspace of the MT to be verified is reduced because the angle of vision of the SMR is ±30°. Therefore, the characteristics of the new verification process are defined below:
MT workspace: XFYZ: 0 mm ≤ X ≤ 5050 mm, 0 mm ≤ Y ≤ 2050 mm, 0 mm ≤ Z ≤ 750 mm, C = 0°, and B = 0°; MT workspace to be verified: 0 mm ≤ X ≤ 2000 mm, 0 mm ≤ Y ≤ 1000 mm, 0 mm ≤ Z ≤ 450 mm, C = 0°, B = 0°, X-axis interval = 250 mm, Y-axis interval = 250 mm, and Z-axis interval = 150 mm.
To analyze the influence of the LT on verification, the same mesh of points was measured with three LTs from three different manufacturers with the measurement specifications presented in Table 3.
Although the influence of geometric errors on verification points is the same for all LTs, the MT errors that each LT provides are different due to the different sources of error such as SMR errors, LT measurement characteristics, non-geometrical error, thermal variations, and so on. By measuring the same mesh of points simultaneously with all LTs, the influence of extra error in the measurement data is only the result of the LT characteristics and SMR errors.
Table 4 presents the results of the identification process using the three LTs independently. The initial errors that each LT provides are different. LT A provides an average initial error of 33 µm using IFM technology, which is smaller than the errors of 40 and 54 µm provided by LTs C and B using ADM. Thus IFM may introduce less error than ADM technology. Similarly, LT C introduces less error than LT B using the same technology. If the final average error is analyzed, all LTs provide similar results. Therefore, the approximation functions obtained with LT B compensate for non-geometric errors.

6.3. Influence of Improving Data Accuracy through Traditional or Weighted Trilateration

In MT verification, the spatial LT distribution is strongly affected by the MT configuration and visibility of the reflector.
To find out whether the new weighted trilateration is better than traditional trilateration reducing the increase of radial noise influences on final MT positioning errors, three LTs were positioned so as to create a spatial angle of approximately 36° (Figure 12), which is far from the ideal distribution of 90° [24].
In this test, all LTs simultaneously measured the same points, avoiding the influences of thermal variation and SMR error when both techniques were compared, because the input data were the same for both. Once the points had been measured and the verification points of each LT had been created, two meshes of points were created. A weighted trilateration mesh was created using Spatial Analyzer software (SA 2015.02.25, New River Kinematic, Williamsburg, VA, USA, 1994), while traditional trilateration was carried out using Matlab algorithms (2013a, MathWorks, Natick, MA, USA, 1984).
The results in Table 5 show that multilateration provides an average initial error similar to verification with only one LT when using both multilateration techniques. In the same way, the residual error obtained is similar. Consequently, bundle adjustment and trilateration have similar behavior in the verification of this MT.
Although multilateration might improve the MT’s accuracy, as shown by the synthetic results [14], poor relative positioning of LTs does not improve verification results using weighted trilateration. Therefore, the LT’s positioning must be studied carefully to avoid unnecessary measurements, as it is the most influential factor.

7. Conclusions

Volumetric verification is a real solution in MT verification. Thanks to it, mathematical compensation can be used to improve MT accuracy, even if previous compensation is not eliminated. Previous compensation of the MT provides a volumetric error reduction of the MT of 26.7%. Meanwhile, volumetric verification reduces the volumetric error by between 49.7% and 58.7%.
The use of the Active Target as a retroreflector has led to an increase in the size of the MT workspace verified from 0.9 to 7.5 m3. This retroreflector is especially useful when the LT is associated with an axis of movement and the available space limits the visibility of a traditional retroreflector. In relation to the LT measurement technique, both ADM and IFM provide similar results. However, the influence of measurement noise in volumetric error is smaller when using IFM mode. In the same way, the use of a multilateration technique that eliminates the influence of angular measurement noise might improve the verification process. However, the radial noise has been increased by the same order as the angular reduction due to the spatial angle between the LTs. This behavior could not be improved using weighted trilateration.

Acknowledgment

This work was supported by Spanish Government (Ministry of Economy and Competitiveness) through the research project METRAP—Development of new techniques of verification and compensation of manufacturing systems for traceable in-process metrology (DPI2013-46979-C2-1-P), Scientific and Technical Research of Excellence Development National Program, and by Aragon Government (Department of Industry and Innovation) through the Research Activity Grant for research groups recognized by the Aragon Government (2014-T62 Manufacturing Engineering and Advanced Metrology Group).

Author Contributions

Sergio Aguado and Jorge Santolaria design the expreiments; David Samper, Jesús Velazquez, Sergio Aguado and Jorge Santolaria developed required software; Carlos Javierre, Ángel Fernández, Jorge Santolaria and Sergio Aguado performed the experiments; Jesús Velázquez, Sergio Aguado and David Samper analyzed the data; Sergio Aguado wrote the paper.

Conflicts of Interest

The authors declare no conflict of interest.

References

  1. Chen, J.S.; Kou, T.W.; Chiou, S.H. Geometric error calibration of multi-axis machines using an auto-alignment laser interferometer. Precis. Eng. 1999, 23, 243–252. [Google Scholar] [CrossRef]
  2. Barakat, N.A.; Elbestawi, M.A.; Spence, A.D. Kinematic and geometric error compensation of a coordinate measuring machine. Int. J. Mach. Tools Manuf. 2000, 40, 833–850. [Google Scholar] [CrossRef]
  3. Kunzmann, H.; Trapet, E.; Wäldele, F. A uniform concept for calibration, acceptance test, and periodic inspection of coordinate measuring machines using reference objects. Ann. CIRP 1990, 39, 561–564. [Google Scholar] [CrossRef]
  4. Schwenke, H.; Knapp, W.; Haitjema, H.; Weckenmann, A.; Schmitt, R.; Delbressine, F. Geometric error measurement and compensation of machines—An update. CIRP Ann. Manuf. Technol. 2008, 57, 660–675. [Google Scholar] [CrossRef]
  5. Zargarbashi, S.H.H.; Mayer, J.R.R. Assessment of machine tool trunnion axis motion error, using magnetic double ball bar. Int. J. Mach. Tools Manuf. 2006, 46, 1823–1834. [Google Scholar] [CrossRef]
  6. Schwenke, H.; Franke, M.; Hannaford, J.; Kunzmann, H. Error mapping of CMMs and machine tools by a single tracking interferometer. CIRP Ann. Manuf. Technol. 2005, 54, 475–478. [Google Scholar] [CrossRef]
  7. Aguado, S.; Samper, D.; Santolaria, J.; Aguilar, J.J. Identification strategy of error parameter in volumetric error compensation of machine tool based on laser tracker measurements. Int. J. Mach. Tools Manuf. 2012, 53, 160–169. [Google Scholar] [CrossRef]
  8. Aguado, S.; Samper, D.; Santolaria, J.; Aguilar, J.J. Towards an effective identification strategy in volumetric error compensation of machine tools. Meas. Sci. Technol. 2012, 23. [Google Scholar] [CrossRef]
  9. Uriarte, L.; Zatarain, M.; Axinte, D.; Yagüe-Fabra, J.; Ihlenfeldt, S.; Eguia, J.; Olarra, A. Machine tools for large parts. CIRP Ann. Manuf. Technol. 2013, 62, 731–750. [Google Scholar] [CrossRef]
  10. Zhenya, H.; Jianzhong, F.; Liangchi, Z.; Xianhua, Y. A new error measurement method to identify all six error parameters of a rotational axis of a machine tool. Int. J. Mach. Tools Manuf. 2015, 88, 1–8. [Google Scholar]
  11. Velenosi, A.; Campatelli, G.; Scippa, A. Axis geometrical error analysis through a performace test to evaluate kinematic error in a five axis tilting-rotary table machine tool. Precis. Eng. 2015, 39, 224–233. [Google Scholar]
  12. Wenjie, T.; Weiguo, G.; Dawei, Z.; Tian, H. A general approach for error modelling of machine tools. Int. J. Mach. Tools Manuf. 2014, 79, 17–23. [Google Scholar]
  13. Slocum, A.H. Precision Machine Design; ISBN 0-13-690918-3. Society of Manufacturing Engineers: Dearborn, MI, USA, 1992. [Google Scholar]
  14. Aguado, S.; Santolaria, J.; Samper, D.; Aguilar, J.J. Influence of measurement noise and laser arrangement on measurement uncertainty of laser tracker multilateration in machine tool volumetric verification. Precis. Eng. 2013, 37, 929–943. [Google Scholar] [CrossRef]
  15. Aguado, S.; Santolaria, J.; Samper, D.; Aguilar, J.J. Study of self-calibration and multilateration in machine tool volumetric verification for laser tracker error reductions. J. Eng. Manuf. 2013. [Google Scholar] [CrossRef]
  16. Linares, J.M.; Chaves-Jacob, J.; Schwenke, H.; Longstaff, A.; Fletcher, S.; Flore, J.; Uhlmann, E.; Wintering, J. Impact of measurement procedure when error mapping and compensationg a small CNC machine using a multilateration laser interferometer. Precis. Eng. 2014, 38, 578–588. [Google Scholar] [CrossRef]
  17. Predmore, C.R. Bundle adjustment of multi-position measurement using the Mahalanobis distance. Precis. Eng. 2010, 34, 113–123. [Google Scholar] [CrossRef]
  18. Meid, A.; Sandwith, S. Dynamic Weighting of Laser Tracker Measurement for Bundle Adjustment. Available online: http://www.leica-geosystems.fr/fr/bundle_sandwith.pdf (accessed on 5 April 2016).
  19. Sandwith, S.; Predmore, R. Real Time 5-Microm Uncertainty with Laser Tracking Interferometer Systems using Weighted Trilateration. Available online: http://www.kinematics.com/images/TrilaterationPaperR1.pdf (accessed on 5 April 2016).
  20. Kono, D.; Marsubara, A.; Yamaji, I.; Fujita, T. High-precision machining by measurement and compensation of motion error. Int. J. Mach. Tools Manuf. 2008, 48, 1103–1110. [Google Scholar] [CrossRef] [Green Version]
  21. Khan, A.W.; Chen, W. A methodology for systematic geometric error compensation in five-axis machine tools. Int. J. Adv. Manuf. Technol. 2011, 53, 615–628. [Google Scholar] [CrossRef]
  22. She, C.H.; Chang, C.C. Design of a generic five-axis postprocessor based on generalized kinematics models of machine tool. Int. J. Mach. Tools Manuf. 2007, 47, 537–545. [Google Scholar] [CrossRef]
  23. Gui, G.; Lu, Y.; Li, J.; Gao, D.; Yao, Y. Geometric error compensation software system for CNC machine tool based on NC program reconstructing. Int. J. Adv. Manuf. Technol. 2012, 63, 169–180. [Google Scholar]
  24. Conte, J.; Majarena, A.C.; Aguado, S.; Acero, R.; Santolaria, J. Calibration strategies of laser trackers based on network measurements. Int. J. Adv. Manuf. Technol. 2016, 83, 1161–1170. [Google Scholar] [CrossRef]
  25. Teoh, P.; Shirinzadeh, B.; Foong, C.; Alici, G. The measurement uncertainties in the laser interferometry based sensing and tracking technique. Meas. Sci. Technol. 2002, 32, 135–150. [Google Scholar] [CrossRef]
  26. Zhuang, H.; Motaghedi, S.H.; Roth, Z.S.; Bai, Y. Calibration of Multi-Beam Laser Tracking Systems. Robot. Comput. Integr. Manuf. 2003, 19, 301–314. [Google Scholar] [CrossRef]
  27. Aguado, S.; Samper, D.; Santolaria, J.; Aguilar, J.J. Protocol for machine tool volumetric verification using a commercial laser tracker. Int. J. Adv. Manuf. Technol. 2014, 75, 425–444. [Google Scholar] [CrossRef]
  28. Cheu, X.; Zhang, G.X.; Zhao, S.Z.; Duan, F.J. Analysis and measurement fir the optical error of the cat’s eye retro-reflector. J. Phys. Conf. Ser. 2006, 48, 64–68. [Google Scholar]
  29. Mian, N.S.; Fletcher, S.; Longstaff, A.P.; Myers, A. Efficient estimation by FEA of machine tool distortion due to environmental temperature perturbations. Precis. Eng. 2013, 37, 372–379. [Google Scholar] [CrossRef]
  30. Gebhardt, M.; Mayr, J.; Furrer, N.; Widmer, T.; Weikert, S.; Knap, W. High precision grey-box model for compensation of thermal errors on five-axis machines. CIRP Ann. Manuf. Technol. 2014, 63, 509–512. [Google Scholar] [CrossRef]
Figure 1. Kinematic chain and kinematic model of Zayer TB 5000 machine tool (MT).
Applsci 06 00100 g001
Figure 2. Working principle of post-processor software.
Applsci 06 00100 g002
Figure 3. Laser trackers from different manufactures.
Applsci 06 00100 g003
Figure 4. Trilateration and multilateration coordinate system.
Applsci 06 00100 g004
Figure 5. Scheme of multilateration optimization.
Applsci 06 00100 g005
Figure 6. Procedure for the identification of errors.
Applsci 06 00100 g006
Figure 7. MT volumetric verification using Active Target.
Applsci 06 00100 g007
Figure 8. Evolution of environmental temperature: data acquisition (a) and validation results (b).
Applsci 06 00100 g008
Figure 9. Error histograms before verification with MT compensation inactive (a) and active (b).
Applsci 06 00100 g009
Figure 10. Error histograms after compensation with MT compensation inactive (a) and active (b).
Applsci 06 00100 g010
Figure 11. Color map of error distribution: before (a) and after compensation (b).
Applsci 06 00100 g011
Figure 12. MT verification through simultaneous measurement by trilateration.
Applsci 06 00100 g012
Table 1. Nomenclature of kinematic chain of Zayer TB 5000 machine tool (MT).
SymbolDefinitionSymbolDefinition
CSOCoordinate system of the machine tool (MT) X ¯ Linear error vector in the X-axis
CSYCoordinate system of the Y-axis Y ¯ Linear error vector in the Y-axis
CSZCoordinate system of the Z-axis Z ¯ Linear error vector in the Z-axis
CSCCoordinate system of the C-axis C ¯ Linear error vector in the C-axis
CSBCoordinate system of the B-axis B ¯ Linear error vector in the B-axis
CSXCoordinate system of the X-axis T L T ¯ Translation vector CS0-CSLT
CSLTCoordinate system of the laser tracker (LT) X L T ¯ Coordinates of the LT
R ( x ) ¯ Rotational error matrix of the X-axis T ¯ Offset of the tool
R ( y ) ¯ Rotational error matrix of the Y-axis R ( c ) ¯ Rotational error matrix of the C-axis
R ( z ) ¯ Rotational error matrix of the Z-axis R ( b ) ¯ Rotational error matrix of the B-axis
PNominal MT coordinates--
Table 2. Verification results using Active Target.
Compensation TableError (µm)
MaximumAverageMinimum
Compensation inactivated246.3112.915.1
Compensation activated197.783.110.1
Verification without compensation221.557.415.1
Verification with compensation105.547.14.5
Table 3. Laser tracker specifications.
Laser TrackerABC
Measurement volume---
Horizontal (°)±235°±320°±360°
Vertical (°)±45°77°/−60°77.9°/–52.1°
Range (m)0–40 m0–30 m0–60 m
Measurement Technology---
IFMSiSiNo
ADMNoSiSi
Accuracy---
Angular0.14 arcs3.5 µm/m20 µm + 5 µm/m
Absolute accuracy±10 µm/m±5 ppm16 µm + 0.8 µm/m
Table 4. Verification results in relation to laser tracker (LT) used.
Laser TrackerABC
Maximum initial error (µm)66.5102.980.9
Average initial error (µm)33.554.140.1
Minimum initial error (µm)8.06.98.9
Maximum final error (µm)54.786.762.6
Average final error (µm)22.328.925.5
Minimum final error (µm)5.14.47.2
Table 5. Verification results using trilateration with simultaneous measurement by three LTs.
Laser TrackerABCTraditional TrilaterationWeighted Trilateration
Maximum initial error (µm)66.5102.980.975.080.9
Average initial error (µm)33.554.140.138.240.0
Minimum initial error (µm)8.06.98.97.98.8
Maximum final error (µm)54.786.762.664.371.3
Average final error (µm)22.328.925.521.725.7
Minimum final error (µm)5.14.47.22.55.3

