Article

A FBG Intensity Modulation System Combined with an Optical Whispering Gallery Mode Edge Filter

Department of Mechanical Engineering, National Kaohsiung University of Applied Sciences, Kaohsiung 807, Taiwan
*
Author to whom correspondence should be addressed.
Appl. Sci. 2016, 6(4), 92; https://doi.org/10.3390/app6040092
Submission received: 26 November 2015 / Revised: 3 March 2016 / Accepted: 21 March 2016 / Published: 28 March 2016

Abstract

:
In this study, we demonstrated an edge filter–based fiber Bragg grating (FBG) intensity modulation system to realize strain measurement. In order to establish a precise and highly sensitive intensity modulation system, we utilized a bent single-mode fiber to induce whispering gallery mode (WGM) interference as an edge filter and combined that with a FBG sensor. The interference spectra of the attenuation band for the WGM edge filter were tuned by adjusting the bending radii. In addition, we compared and analyzed the signals from the proposed vibration interrogating system and a strain gauge. The measured voltage signals from the proposed interrogation system were in close agreement with measured strains of the strain gauge. The experimental results showed that when the resonant wavelength of the WGM edge filter was 1535.10 nm, the filtration was better and the noise was lower within 100 Hz. Moreover, as the frequency of piezoelectric transducer (PZT) was at 400 and 1000 Hz, the better signal-to-noise ratios (SNRs) of 28.54 and 25.97 were measured at wavelength 1542.05 nm of the edge filter.

1. Introduction

The conventional electrical strain gauge still has some inevitable defects, although it has been developed for decades. The flaws, for instance include the noises induced by the unstable input voltage, electromagnetic interference, impairment by vapor corrosion, and the limited room of the wire distribution, among others. Consequently, we employ optical fiber sensors to realize a strain sensing system to reduce these weaknesses. Optical fibers have some specific properties that include being light in weight, small in size, high in sensitivity, immune to electromagnetic interference, and resistant to corrosion, among others. Therefore, optical fibers are not only used extensively in the field of communications but are also increasingly being used in the fields of mechanics, aviation engineering, and biotechnology. Applications of optical fibers in theoretical research, the production of optical fiber elements and optical fiber sensors, and the use of optical fibers in mechanisms of modulation and demodulation have thus been widely studied [1,2].
In this study, we utilized the operating principle of the whispering gallery mode (WGM) to fabricate the WGM edge filter and combined that with a fiber Bragg grating (FBG) sensor to build up an intensity modulation system. The whispering gallery phenomenon refers to the observations that sonorous vibrations have a tendency to cling to a concave surface [3]. The microbent optical fiber-induced WGM is sensitive to the outside changes and can be adopted as the optic fiber sensor [4,5,6,7,8] and the edge filter [9,10,11]. There are a variety of applications for WGM in bent optical fiber. R. Morgan et al. first determined that a smaller diameter and a larger bending angle would induce an increasingly apparent interference spectrum [4]. Haran et al. [5] also showed that bent optical fibers would radiate light to the cladding and cause internal total reflection at the cladding and air boundary which would result, in turn, in the formation of WGM. In this way, a temperature sensor element was realized, and Haran et al. reported that the greater the bending angle was, the greater the amplitude that occurred [5]. Nam et al. utilized the WGM to produce a temperature sensor and observed that a wavelength drift of the two main peaks in the optical spectra was caused by increasing the temperatures [6]. Subsequently, Raikar et al. further demonstrated the relationship between the single-mode fiber bending loss and temperatures. They discovered that if the bending angle was increased, the transmission loss of the optical fiber became more severe [7]. More recently, Wang et al. demonstrated that two photodiodes could be placed at both ends of a slightly bent optical fiber to measure the output power and to use the translation platform displacement to adjust the bending losses, which formed a simple power measurement system [8]. A number of important studies on optical fiber edge filters have also been conducted. First, Wang et al. used bent optical fiber as an edge filter and constructed a system for the measurement of wavelengths. The experimental results showed that the effective measurement range for the wavelengths was from 1500 to 1550 nm [9]. Then, Wang et al. built a proportional wavelength measurement system using the same technique [10]. In 2008, Rajan et al. reported that they used a 3 dB coupler to build a proportional wavelength measurement system [11]. Although the applications of WGM seem to have already been largely developed, it is still not easy to control the factors that affect the performance of the bent optical fibers. Hence, there has been no research thus far adopting and discussing the effect of using the WGM to model an intensity modulation system. In this paper, we utilized bending single-mode fibers to induce the WGM effect and combined that with a FBG sensor to construct an intensity modulation system. The experiments utilized a piezoelectric transducer (PZT) to cause the vibrations, and the optical signals were transformed into voltage signals to compare with the strain signals.

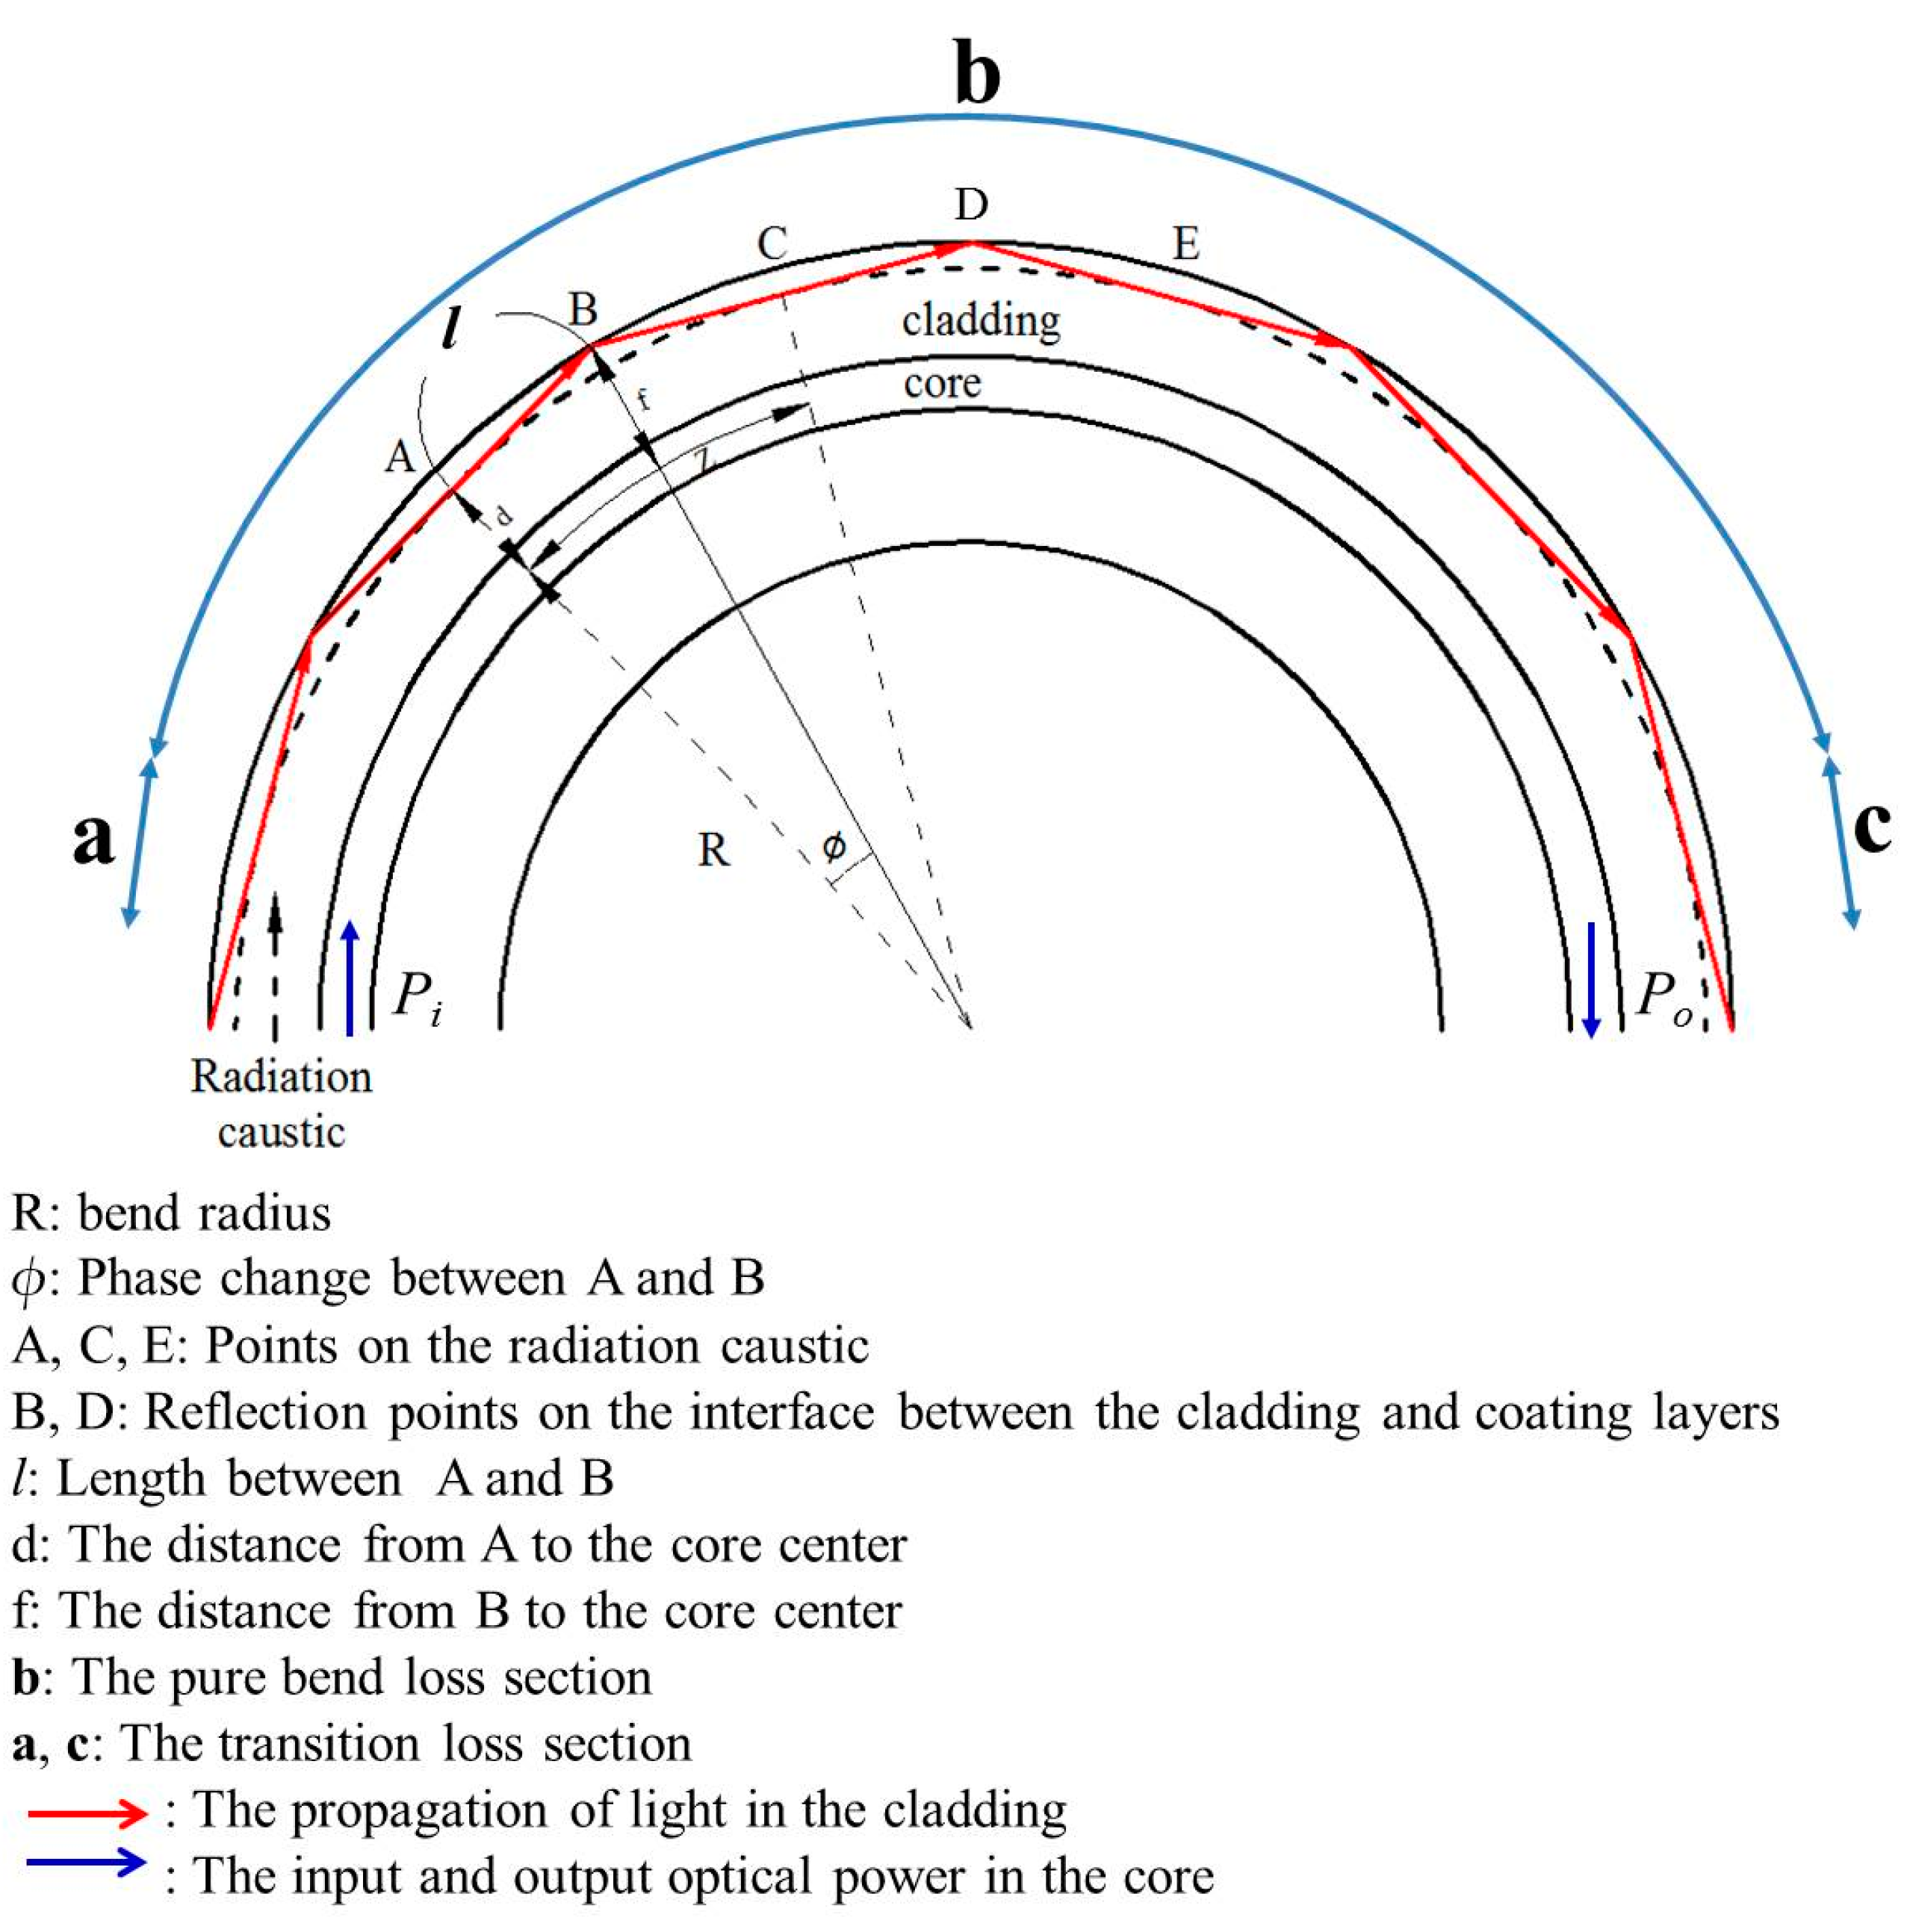
2. The Operating Principles of the Whispering Gallery Mode (WGM) Edge Filter

2.1. The Bend Loss for Single-Mode Optical Fibers

In 1976, Dietrich Marcuse offered a new kind of method for calculating the bend loss of a bent optical fiber that could also be used to calculate the general bending radiation loss [12]. In 1986, Harris et al. also investigated the bend loss of a high-numerical-aperture single-mode fiber as a function of the wavelength and bend radius [13]. In 1992, H. Renner proposed a simple approach to calculate the bending losses of coated single-mode fibers and indicated that the losses of the fundamental mode in single-mode fibers are influenced by their fiber bending curvatures [14]. In single-mode optical fibers, the light lost from the fundamental mode at a bend comprises two components. One is the transition loss and the other is the pure bend loss. The transition loss arises from the fundamental mode to leaky core modes when there is a variation in curvature of the fiber axis. On the other hand, the pure bend loss results from the continual loss of guidance at the outer portion of the evanescent field of the fundamental mode. Assuming that a bend of radius R in a step index single-mode fiber with a core of radius a and refractive index nco is surrounded by a cladding of refractive index ncl, this is shown in Figure 1. The ratio of the output to the input power, neglecting the intrinsic attenuation of the fiber, for the fundamental mode can be presented as [13]:
P o P i = P o P i | a × P o P i | b × P o P i | c
where Pi and Po are the input and output optical power; the arc b expresses the pure bend loss section and the arcs a and c illustrate the transition loss section.
Due to the symmetry, the transition components are equal so that
P o P i | a = P o P i | c
and the pure bend loss component can be expressed by
P o P i | b = exp ( 2 α L )
where L is the length of arc b.
We substitute Equations (2) and (3) into Equation (1) and rewrite it as follows:
ln ( p o P i ) = 2 α L + 2 ln ( P o P i ) | a
The pure bend loss coefficient 2α for the fundamental mode is given as follows [12,13]:
2 a = π κ 2 2 γ 3 / 2 V 2 R K + 1 2 ( γ a ) exp ( 2 3 γ 3 β 2 R )
where K + 1 ( γ a ) is a modified Hankel function, a is the radius of the fiber core and R is the bend radius. κ = ( n c o 2 k 2 β 2 ) 1 / 2 , wherer n c o is the refractive index of the core. k = 2 π λ , wherer λ is the wavelength in free space. β = n c l k ( 1 + b Δ ) , where b = ( β / k ) 2 n c l 2 n c o 2 n c l 2 ,   Δ = ( n c o 2 n c l 2 ) / 2 n c o 2 , and n c l is the refractive index of the cladding. V = a k ( n c o 2 n c l 2 ) 1 / 2 , and γ = ( β 2 n c l 2 k 2 ) 1 / 2 .
It can be seen from Equations (1)–(5) that when light propagates through the bend optical fiber, the bend loss will occur and is inversely proportional to the bend radius.

2.2. Phase Difference Formula

The strength of the coupling between the WGM and the fundamental mode depends on the coupling distance d , which is shown in Figure 2. The coupling distance d is related to the bend radius and wavelength and is expressed by the following equation [13]:
d = R [ ( β λ / 2 π n c l ) 1 ]
The total power coupled from the WGM and the fundamental mode over the bending length is not only dependent on the coupling distance but also on the phase differences between these two modes. When the light is transmitted in the core of the bending fiber, some rays would radiate to the cladding and travel in a direction that is tangential to the radiation caustic. The points B and D in Figure 1 show that the reflection occurs between the cladding and the air. The reflected ray would transmit tangentially along the radiation caustic to the next reflection point. Then the radiation forms the WGM, which is confined by the cladding interface. Because the fundamental mode and the WGM transmit in different optical paths, the phase change would occur when the coupling is generated. The phase difference can be calculated as [13]:
2 π n c l ( l A B + l B C ) λ + ϕ Z β = m 2 π
l A B = l B C = [ ( R + f ) 2 ( R + d ) 2 ] 1 / 2
where φ is the phase change, β is the propagation constant, and m is an integer of value 1, 2, 3, etc. The curve Z of the optical fiber core can be expressed as:
Z = 2 R tan 1 [ l A B / ( R + d )
On substituting Equations (8) and (9) into Equation (7), we would obtain a phase change function of bend radius R when the coupling occurs at the bend radii determined by the integer m.

3. Experimental Section

3.1. Experimental Setup for Resonant Wavelength Measurement of the Whispering Gallery Mode (WGM) Edge Filter

For the optical fiber utilized in this experiment, the coating layer was first removed. In order to moderate the bending-induced internal stress and allow for a smaller bent radius, the single-mode optical fiber was immersed in the buffered oxide etch (BOE) solution to partially etch the cladding layer. After that, the diameter of the etched fiber is approximately 75 μm, and then the etched one was sandwiched in a plastic plate and fixed on a micro-translation stage in a U shape. The arrangement of the U-shaped bending optical fiber is shown in Figure 2. When the superluminescent diode (SLD) broadband light source transmitted the light into the etched optical fiber, an interference spectrum occurred due to the bending of the fiber. Moreover, we could not only control the distances of the micro-translation stage to adjust the bending curvature but could also tune the wavelength of the attenuation band of the WGM edge filter. Figure 3 illustrates the interference spectra of the WGM edge filter with a different bent radius from 4.52 to 4.66 mm. According to Equations (1)–(5), we can find that when the bent radius of the fiber decreases, the bend loss increases and we can obtain the result from Figure 3. However, while the bent radius of fiber still decreases, the bend loss will become slightly smaller. That is because some light would reenter due to coupling by the leaky core mode and cladding mode to the fundamental mode. Figure 4 shows the relationship of the bending-induced resonant wavelength and the distinct bent radius for WGM edge filter. From the results of the bending fiber experiment, we can obtain a filter in a fast method to replace the expensive electric filter to achieve an all-fiber measurement system. In the experiments of the static and dynamic mode, the peak of the resonant wavelength of the FBG sensor was 1553.30 nm. According to the results of performances of the WGM edge filter, the corresponding resonant wavelengths of the WGM edge filter were 1531.10, 1542.05, 1547.40 and 1551.40 nm when the bending radius of the optical fiber was set at 4.62, 4.60, 4.59 and 4.58 mm, respectively. Figure 5 shows the corresponding positions of the resonant wavelength between the FBG sensor and the WGM edge filter. The purpose of above-mentioned procedure is to ensure the intensity modulation system can acquire better signals for experiments.

3.2. Experimental Setup for Static and Dynamic Mode Measurement of the Fiber Bragg Grating (FBG) Intensity Modulation System Based on the WGM Edge Filter

The main purpose of the experiments was to test the feasibility of the intensity modulation system. We utilized a FBG sensor combined with a WGM edge filter as the modulation mechanism. The interference spectra of the FBG sensor and WGM edge filter were measured via the interrogation mechanism, and those were sequentially transformed into electric signals to analyze and compare with the signals of the strain gauge under different frequencies generated by the PZT. Before we began utilizing the intensity modulation system to measure the dynamic vibrating signals, we had to execute a static mode experiment to calibrate the voltage and signals of the modulation system to lower noise signals. Moreover, we could investigate the characteristics of the vibrating interrogation system through the results of the static experiment. Figure 6 shows the experimental setup of the FBG intensity modulation system based on the WGM edge filter. First, we applied a power supply to generate the external voltage, with the range of the voltage being from 0 to 5 V in increments of 0.5 V. Additionally, we used a photo detector (PD) to transform the optical signals into electric signals in order to compare them with the signals of the strain gauge. The FBG sensor and strain gauge were adhered to the PZT and could be vibrated at different frequencies by applying different voltages. The vibrating frequency of the PZT ranged from 5 to 1000 Hz as the applied voltage was increased. As the PZT vibrated at various frequencies, the structure of the FBG sensor would move back and forth, inducing the resonant wavelength of the FBG to be red-shifted or blue-shifted. We utilized the distinct interference spectra of the WGM filter as the bandpass filter to screen the optical spectra of the FBG sensor. Additionally, we used a PD to transform the optical signals into electric signals for comparison with the signals of the strain gauge in order to further analyze the differences between them.

4. Results and Discussion

In this study, we utilized a FBG sensor combined with a WGM edge filter to establish an intensity modulation system. We measured the opto-electrical signals of the modulation system and the strain signals of the strain gauge in two distinct modes. First, we used the vibrating interrogation system to perform static mode experiments and calibrate the system. In the next step, we utilized the modulation system to interrogate the signals under different vibrating frequencies generated by the PZT. Figure 7 shows the relationships between the opto-electrical signals and the strain values of the strain gauge for the different resonant wavelengths of the WGM edge filter. The sensitivities of the intensity modulation system were 4.919 × 10⁻⁵, 4.573 × 10⁻⁵, 3.395 × 10⁻⁵ and 3.02 × 10⁻⁵ V/με. According to the results of the experiments, we can state that when the trough of the WGM edge filter gets closer to the FBG resonant peak, the sensitivity of the modulation system would be lower. Consequently, we can utilize the voltage as a function of strain to calculate the measured signals from the system. Figure 8a–f shows the dynamic voltage signals of the FBG intensity modulation system and the oscillating strain values of the strain gauge. The dip of the resonant wavelength for the WGM edge filter was 1535.10 nm. As the vibrating frequency was at 5, 20, 60, 100, 400, and 1000 Hz, the values of the signal-to-noise ratio (SNR) were 21.2, 19.07, 22.55, 23.14, 20.72, and 22.69, respectively. From the results of the experiment, we discovered that the FBG sensor interrogation system would have better efficiency in terms of filtration and a small noise signal at 100 Hz but that the voltage and the strain signals would exhibit phase differences when the frequency of the PZT was over 100 Hz. The SNRs of the other three sets of dynamic mode tests with different wavelengths of the WGM edge filter are summarized in Table 1. Based on the results of the experiments, we found that when the wavelength of the WGM edge filter was 1535.10 nm, the lowest noise signal and the best efficiency in terms of filtration were acquired within 100 Hz and that the voltage signals were consistent with the signals of the strain gauge. It can be seen from Table 1 that as the wavelength of the WGM edge filter was 1542.05 nm, the highest SNRs were measured at the frequencies of 400 and 1000 Hz. The results also showed that when the peak of the resonant wavelength of the FBG corresponded to the positive slope region of the interference spectra, which was some distance away from the trough, the signal-to-noise ratio was greater. However, when the peak of the resonant wavelength of the FBG corresponded to the positive slope region, which was close to the trough, the signal-to-noise ratio was smaller.

5. Conclusions

In this study, we utilized a FBG sensor and WGM edge filter to construct an intensity modulation system. Additionally, we interrogated and measured the vibration strain signals in order to compare them with the opto-electrical signals recorded from the FBG sensor combined with the WGM edge filter to verify the feasibility of the intensity modulation system. When the PZT was vibrating at different frequencies, the FBG sensor adhered to the PZT would fluctuate and the spectra of the resonant wavelength would be recorded and compared with the signals of the strain gauge. According to the results of the experiments, when the resonant wavelength of the WGM edge filter was 1535.10 nm, the filtration was better and the noise was lower within 100 Hz. Moreover, as the frequency of PZT was at 400 and 1000 Hz, a better SNR was measured at wavelength 1542.05 nm of the edge filter. The intensity modulation system consisting of a FBG sensor combined with a WGM edge filter thus exhibited the characteristics of precision and high sensitivity. It can be concluded that this intensity modulation system could potentially be used to measure high frequency mechanical vibration.

Acknowledgments

This work was funded by the Ministry of Science and Technology, Taiwan (grant number MOST 103-2221-E-151-009-MY3).

Author Contributions

Chia-Chin Chiang, Tao-Hsing Chen, and Liren Tsai conceived and designed the experiments, and analyzed the data; Chien-Chang Huang performed the experimental works and analyzed the data; Sheng-Feng Wang analyzed the data and wrote the paper.

Conflicts of Interest

The authors declare no conflict of interest.

References

  1. Lee, B. Review of the present status of optical fiber sensors. Opt. Fiber Technol. 2003, 9, 57–79. [Google Scholar] [CrossRef]
  2. Wu, J.-Z.; Chao, J.-C.; Hu, J.-Y.; Chiang, C.-C. Fabrication of the long bragg grating by excimer laser micro machining with high-precision positioning XXY platform. Smart Sci. 2014, 2, 20–23. [Google Scholar]
  3. Rayleigh, L. CXII. The problem of the whispering gallery. Lond. Edinb. Dublin Philos. Mag. J. Sci. 1910, 20, 1001–1004. [Google Scholar] [CrossRef]
  4. Morgan, R.; Barton, J.; Harper, P.; Jones, J.D. Wavelength dependence of bending loss in monomode optical fibers: Effect of the fiber buffer coating. Opt. Lett. 1990, 15, 947–949. [Google Scholar] [CrossRef] [PubMed]
  5. Haran, F.; Barton, J.; Kidd, S.; Jones, J. Optical fibre interferometric sensors using buffer guided light. Meas. Sci. Technol. 1994, 5, 526–530. [Google Scholar] [CrossRef]
  6. Nam, S.H.; Yin, S. High-temperature sensing using whispering gallery mode resonance in bent optical fibers. IEEE Photonics Technol. Lett. 2005, 17, 2391–2393. [Google Scholar]
  7. Raikar, U.; Lalasangi, A.S.; Kulkarni, V.K.; Pattanashetti, I. Temperature dependence of bending loss in single mode communication fiber: Effect of fiber buffer coating. Opt. Commun. 2007, 273, 402–406. [Google Scholar] [CrossRef]
  8. Wang, P.; Semenova, Y.; Wu, Q.; Farrell, G. A macrobending fiber based micro-displacement sensor utilizing whispering-gallery modes. In Proceedings of the 20th International Conference on Optical Fibre Sensors, Edinburgh, UK, 5 October 2009.
  9. Wang, Q.; Farrell, G.; Freir, T. Study of transmission response of edge filters employed in wavelength measurements. Appl. Opt. 2005, 44, 7789–7792. [Google Scholar] [CrossRef] [PubMed]
  10. Wang, Q.; Rajan, G.; Wang, P.; Farrell, G. Resolution investigation of a ratiometric wavelength measurement system. Appl. Opt. 2007, 46, 6362–6367. [Google Scholar] [CrossRef] [PubMed]
  11. Rajan, G.; Semenova, Y.; Farrell, G.; Wang, Q.; Wang, P. Investigation of the influence of 3 dB coupler on ratiometric wavelength measurements. In Proceedings of the Optical Sensors 2008, Strasbourg, France, 7 April 2008.
  12. Marcuse, D. Curvature loss formula for optical fibers. JOSA 1976, 66, 216–220. [Google Scholar] [CrossRef]
  13. Harris, A.; Castle, P.F. Bend loss measurements on high numerical aperture single-mode fibers as a function of wavelength and bend radius. J. Lightwave Technol. 1986, 4, 34–40. [Google Scholar] [CrossRef]
  14. Renner, H. Bending losses of coated single-mode fibers: A simple approach. J. Lightwave Technol. 1992, 10, 544–551. [Google Scholar] [CrossRef]
Figure 1. The input power Pi and output power P0 transmission and the optical path formation of the whispering gallery mode generated in a bending single-mode optical fiber.
Applsci 06 00092 g001
Figure 2. Schematic diagram of the microbending translation system for the whispering gallery mode (WGM) edge filter. SLD: superluminescent diode; OSA: optical spectrum analyzer.
Applsci 06 00092 g002
Figure 3. The interference spectra of the WGM edge filter with different bent radii for etched single-mode fiber.
Applsci 06 00092 g003
Figure 4. The measured resonant wavelength as a function of bent radius for WGM edge filter.
Applsci 06 00092 g004
Figure 5. The interference spectra of WGM edge filter corresponding to the resonant wavelength peak of the fiber Bragg grating (FBG) sensor.
Applsci 06 00092 g005
Figure 6. Schematic diagram of the experimental structure of the FBG intensity modulation system based on a WGM edge filter. PD: photo detector.
Applsci 06 00092 g006
Figure 7. The relationships between the voltage signals of the intensity modulation system and the signals of the strain gauge.
Applsci 06 00092 g007
Figure 8. The dynamic voltage signals of the FBG interrogation system (the dip of the resonant wavelength of the WGM was 1535.10 nm) and the oscillating values of the strain gauge adhered on the PZT. The frequencies of the PZT were (a) 5 Hz; (b) 20 Hz; (c) 60 Hz; (d) 100 Hz; (e) 400 Hz; and (f) 1000 Hz, respectively.
Applsci 06 00092 g008
Table 1. The signal-to-noise ratio (SNR) of the fiber Bragg grating (FBG) interrogation system based on whispering gallery mode (WGM) edge filter. PZT: piezoelectric transducer.
Frequency of PZT (Hz)Wavelength of WGM (nm)SNRWavelength of WGM (nm)SNRWavelength of WGM (nm)SNR
51542.0519.231547.4015.051551.404.18
2018.1413.626.65
6020.0114.6110.18
10021.0917.779.08
40028.5421.3613.12
100025.9723.4512.72

