1. Introduction
The adoption of thermal energy storage systems (TESS) technologies is an effective solution for building energy management that makes good use of the energy potential of the local environment. Concepts involving phase change material (PCM) are now technically mature for incorporation into buildings, and among the existing concepts of TESS, PCM-to-air thermal storage can readily be integrated into ventilation systems as a means to shave peak heating loads [
1]. Similar systems have been proposed for cooling purposes, as presented in [
2]. We have developed a PCM storage component presented in [
3,
4], which comprises a set of PCM elements embedded in metallic plates and separated by fins. The component was designed to store heat during off-peak hours by means of heat pump that drives hot air through the attached heat exchanger. The stored energy can then be released during the peak period to provide heat and thus reduce the heating load of the building. To be an effective solution, the system must fully compensate for the heat pump so that it can be deactivated without consequence to indoor thermal comfort. To meet this requirement the component was sized to deliver a steady 1 kW supply of heat during a period of 2 h. A full scale arrangement of the component was constructed and instrumented for testing under laboratory conditions.
We have taken the experimental results as basis for considering the strategies in simulating such type of PCM storage. The work presented in this paper offers answers to some of the general questions that be posed before beginning a numerical study of PCM heat storage and adopt the simplest one according to the precision required. This is generally not provided in the articles presenting PCM storage modelling. Efforts to simulate heat transfer in a PCM (Phase Change Material) storage device are generally led by considerations of Biot number and material thickness, of 2D versus 1D representation, and of possible hysteresis effects arising from the characterisation of the PCM using differential scanning calorimetry (DSC). The PCM was modelled adopting equivalent thermophysical properties during the phase change. An equivalent heat capacity and thermal conductivity were provided for an appropriate description of energy release and storage in the process of solidification and melting. The geometry of the metal container induces 2D effects that are generally neglected in the numerical modelling. The thickness of the plates (about 2 cm) is sufficiently large to require the modelling of conduction in the PCM, but can also induce convection.
Experimental results are presented and compared for both a 1D and 2D model of the PCM device. It was concluded that a 2D representation is essential for configurations, like the case study and geometry we had, with a large difference in thermal conductivity between PCM and metal casing.
Two curves of equivalent heat capacity (measured via DSC) were introduced for heating and cooling phases. Comparisons to experimental results indicated significant errors in the models during melting and solidification of the PCM, which could be reduced by instead adopting the mean of the two heat capacity curves. The rate of temperature change during the experiments and for the DSC characterisation was analysed and found to explain well the observations. In particular, as novelty, two peaks of equivalent heat capacity have been observed with DSC when the rate is very low instead of only one peak using current rate: and that explains the real behaviour in the experiments.
The remainder of this paper is structured as follows. In
Section 2, the storage system is presented in detail, with particular attention made to its geometry, and the PCM it contains (Mikrotek 37 paraffin [
5]). In
Section 3, 1D and 2D numerical models of the system are introduced. Comparisons of predicted behaviour to experimental data are presented for a typical charging and discharging cycle in
Section 4. Both models were constructed neglecting convection in the PCM whilst in its liquid phase, and assuming a simplified treatment of the interaction between trapped and the PCM. The issue of hysteresis effects was analysed by introducing different curves of equivalent heat capacity for the heating and cooling modes, using data from the DSC tests at very low temperature evolution rate, more adapted to model better the real behaviour.
2. Experimental Facility
2.1. Heat Storage Integrated into an Air-Supply System
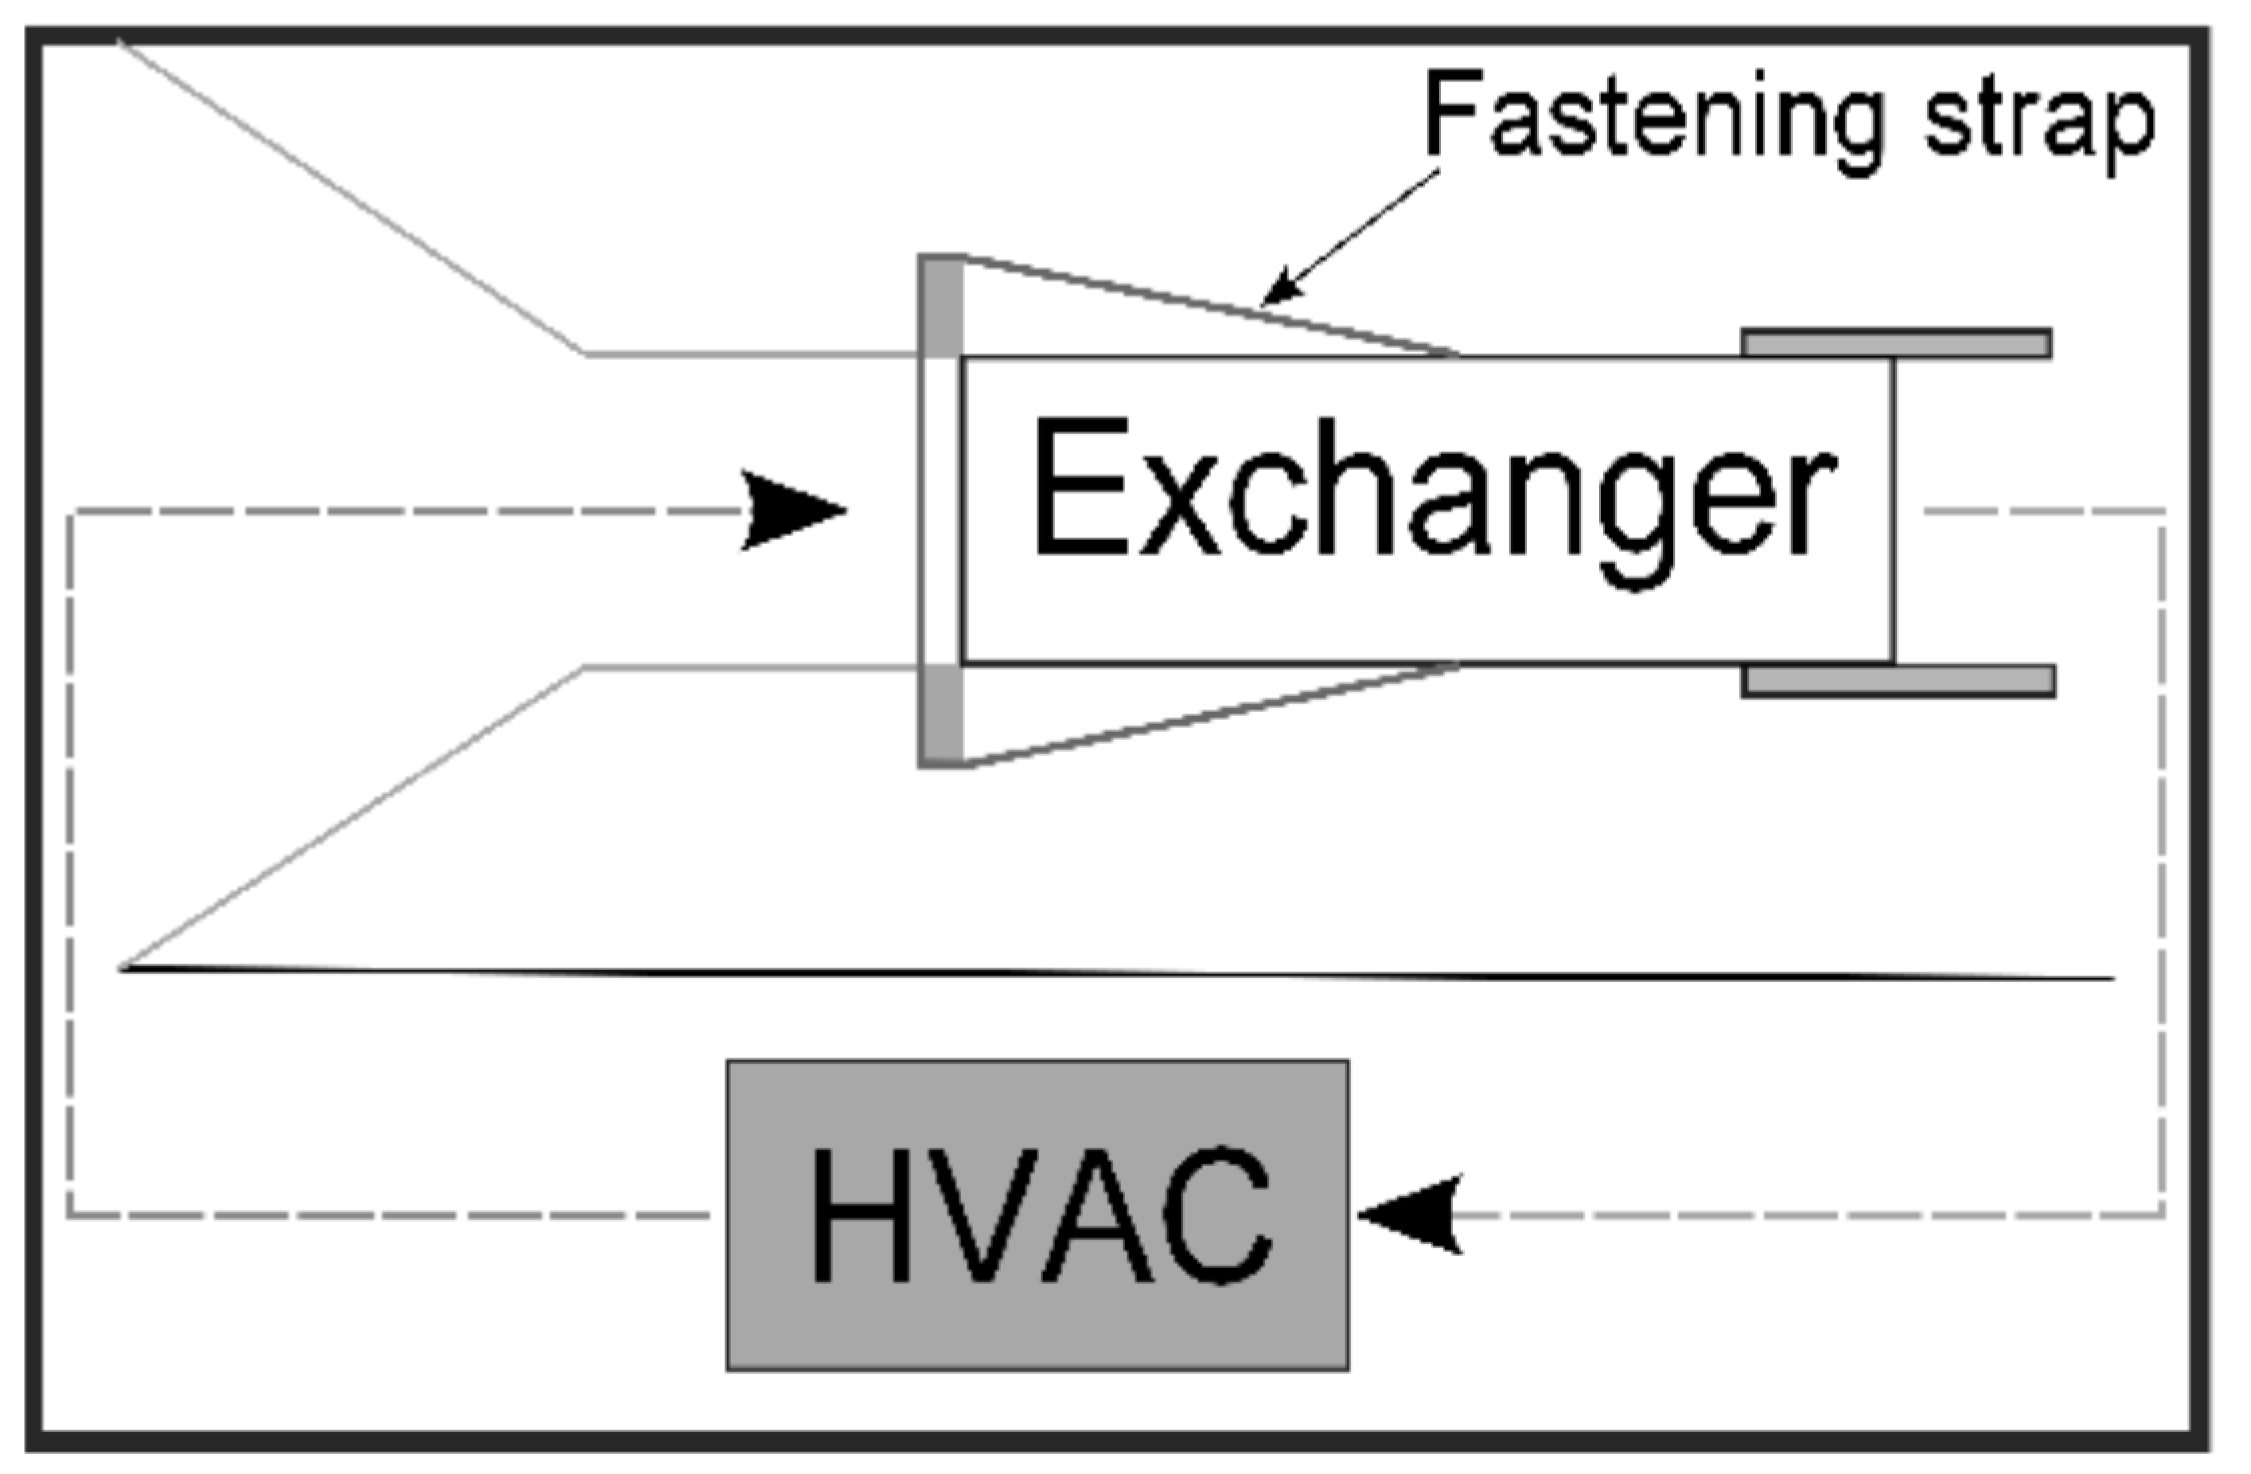
The heat storage component was housed in a closed-loop wind tunnel (with recycling of exhaust air). The experimental facility (see
Figure 1) provides an air supply equivalent to a complete HVAC (Heating, Ventilating and Air Conditioning) system and allows tests of components of up to 2.50 m in length within the upper part of the tunnel. The storage component was placed in the test section as shown in
Figure 2. Note that the 1 m
2 cross-section of the component is slightly smaller than the air inlet. The test rig was designed to ensure good air-tightness, and upstream and downstream elements were added to regulate the airflow crossing the test component.
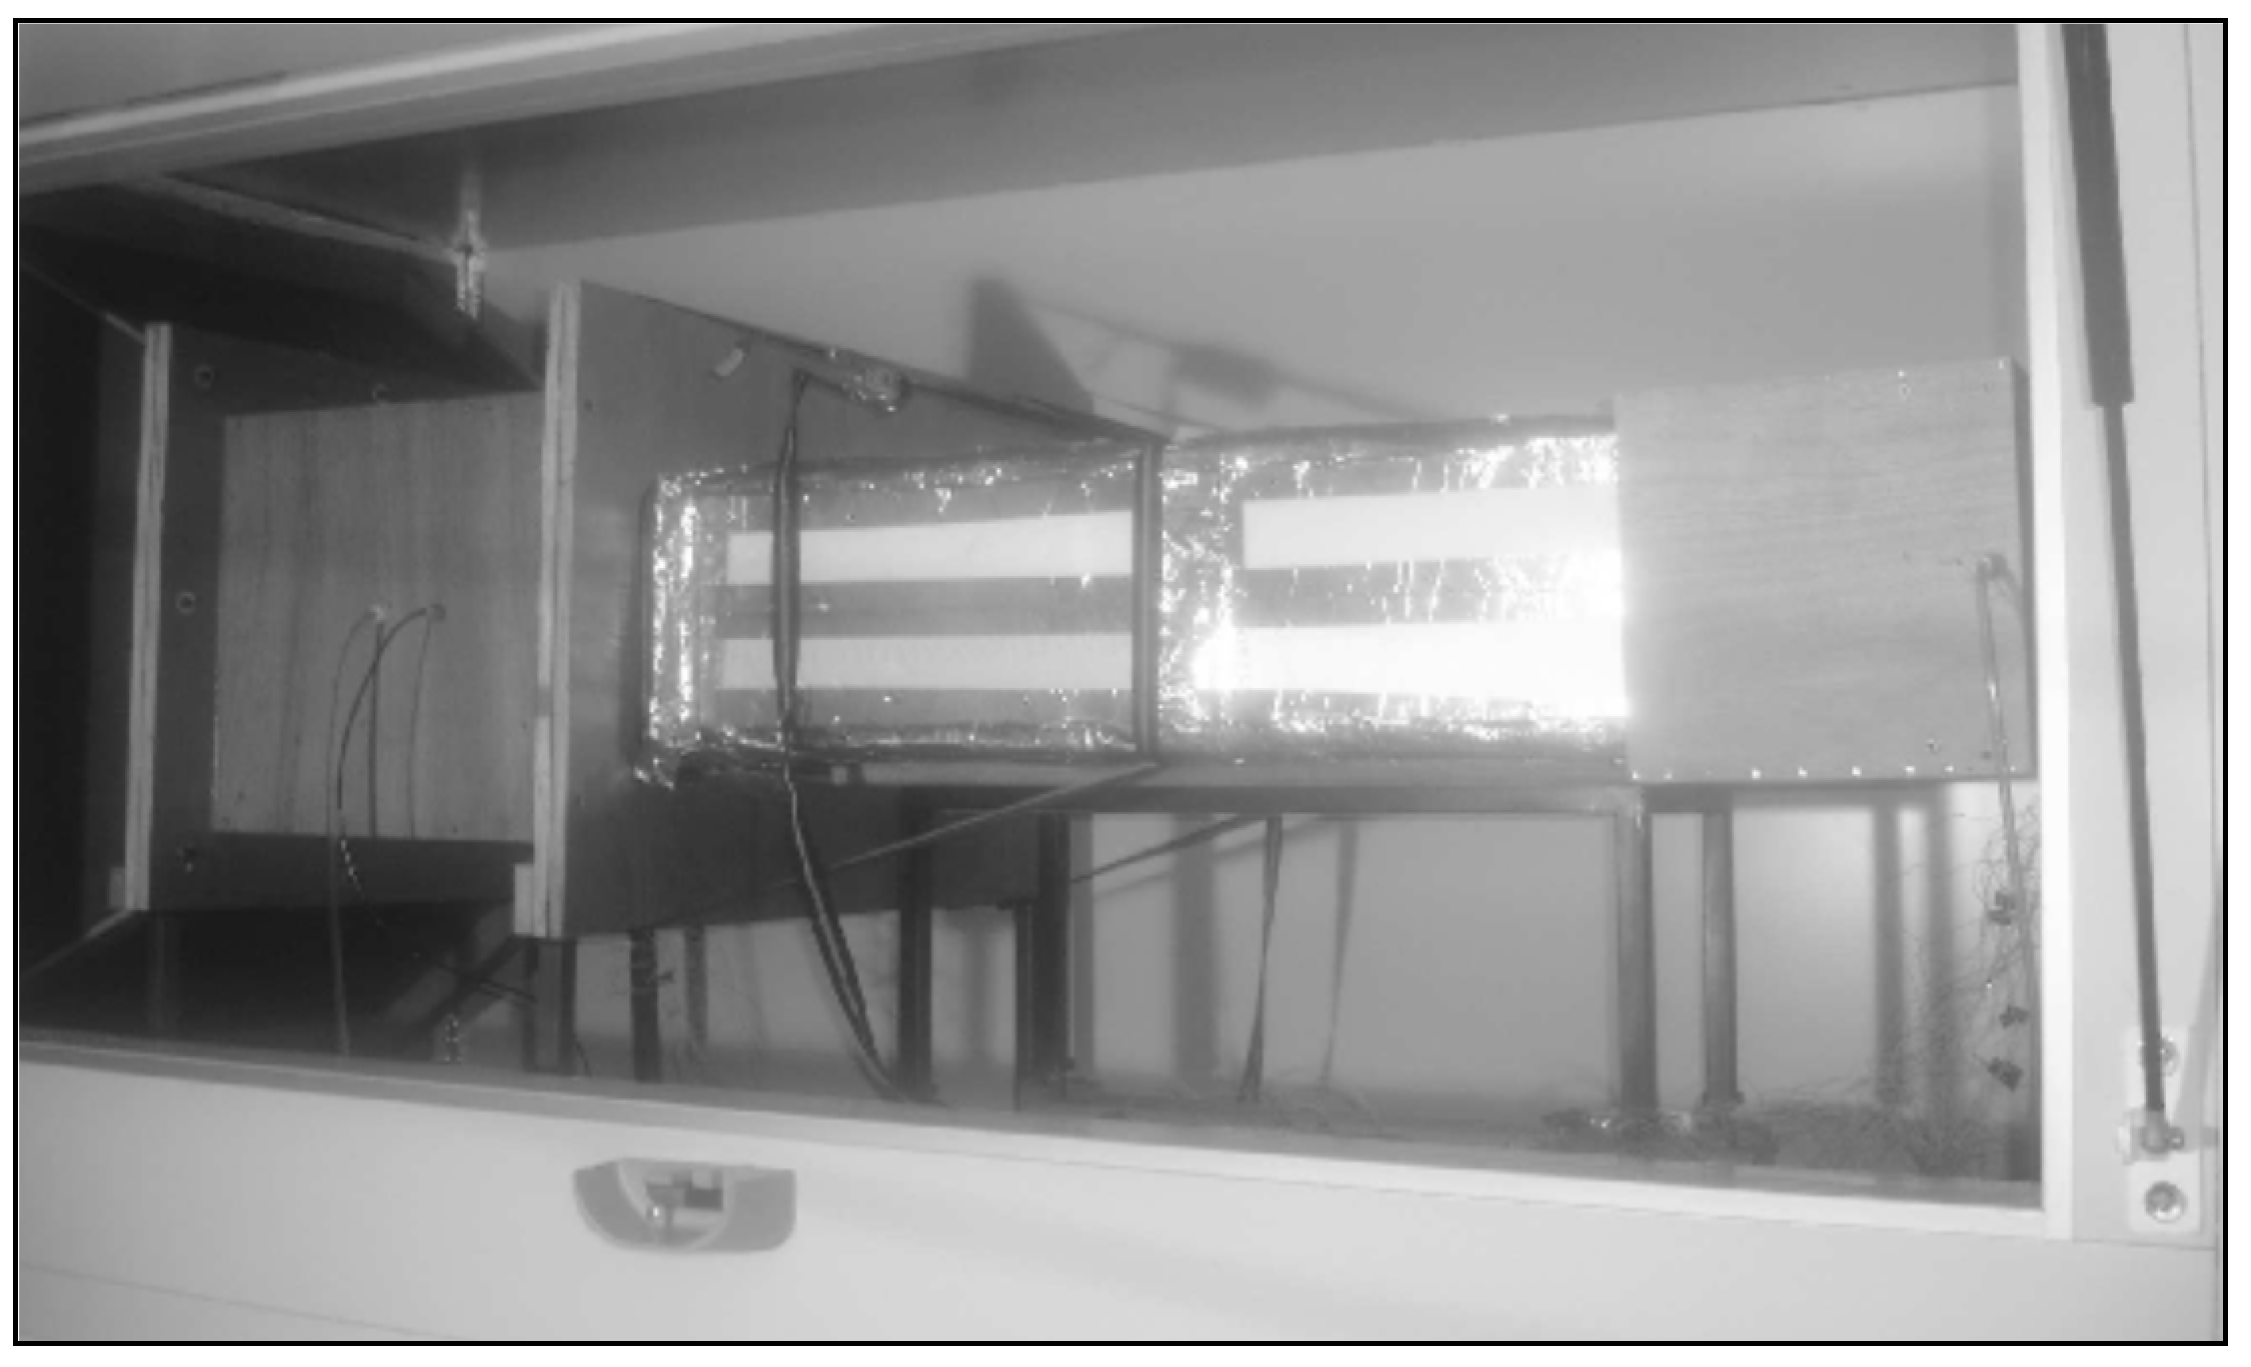
The upstream element section comprised a smooth reduction in cross-section to the target diameter (30° slope), followed by a section of duct with constant cross-section in order to stabilise the airflow. The overall length of the upstream section is 1.00 m.
The downstream section comprises a single 0.40 m long constant cross-section duct. Its cross-section is slightly greater than the duct containing the heat storage component. Air-tightness was achieved by means of a plastic film secured with aluminium tape. Polystyrene sheets were added inside to extend ensure a smooth variation in cross-section. A photograph of the heat storage component installed in the air-supply test rig is given in
Figure 2.
2.2. PCM Container Design
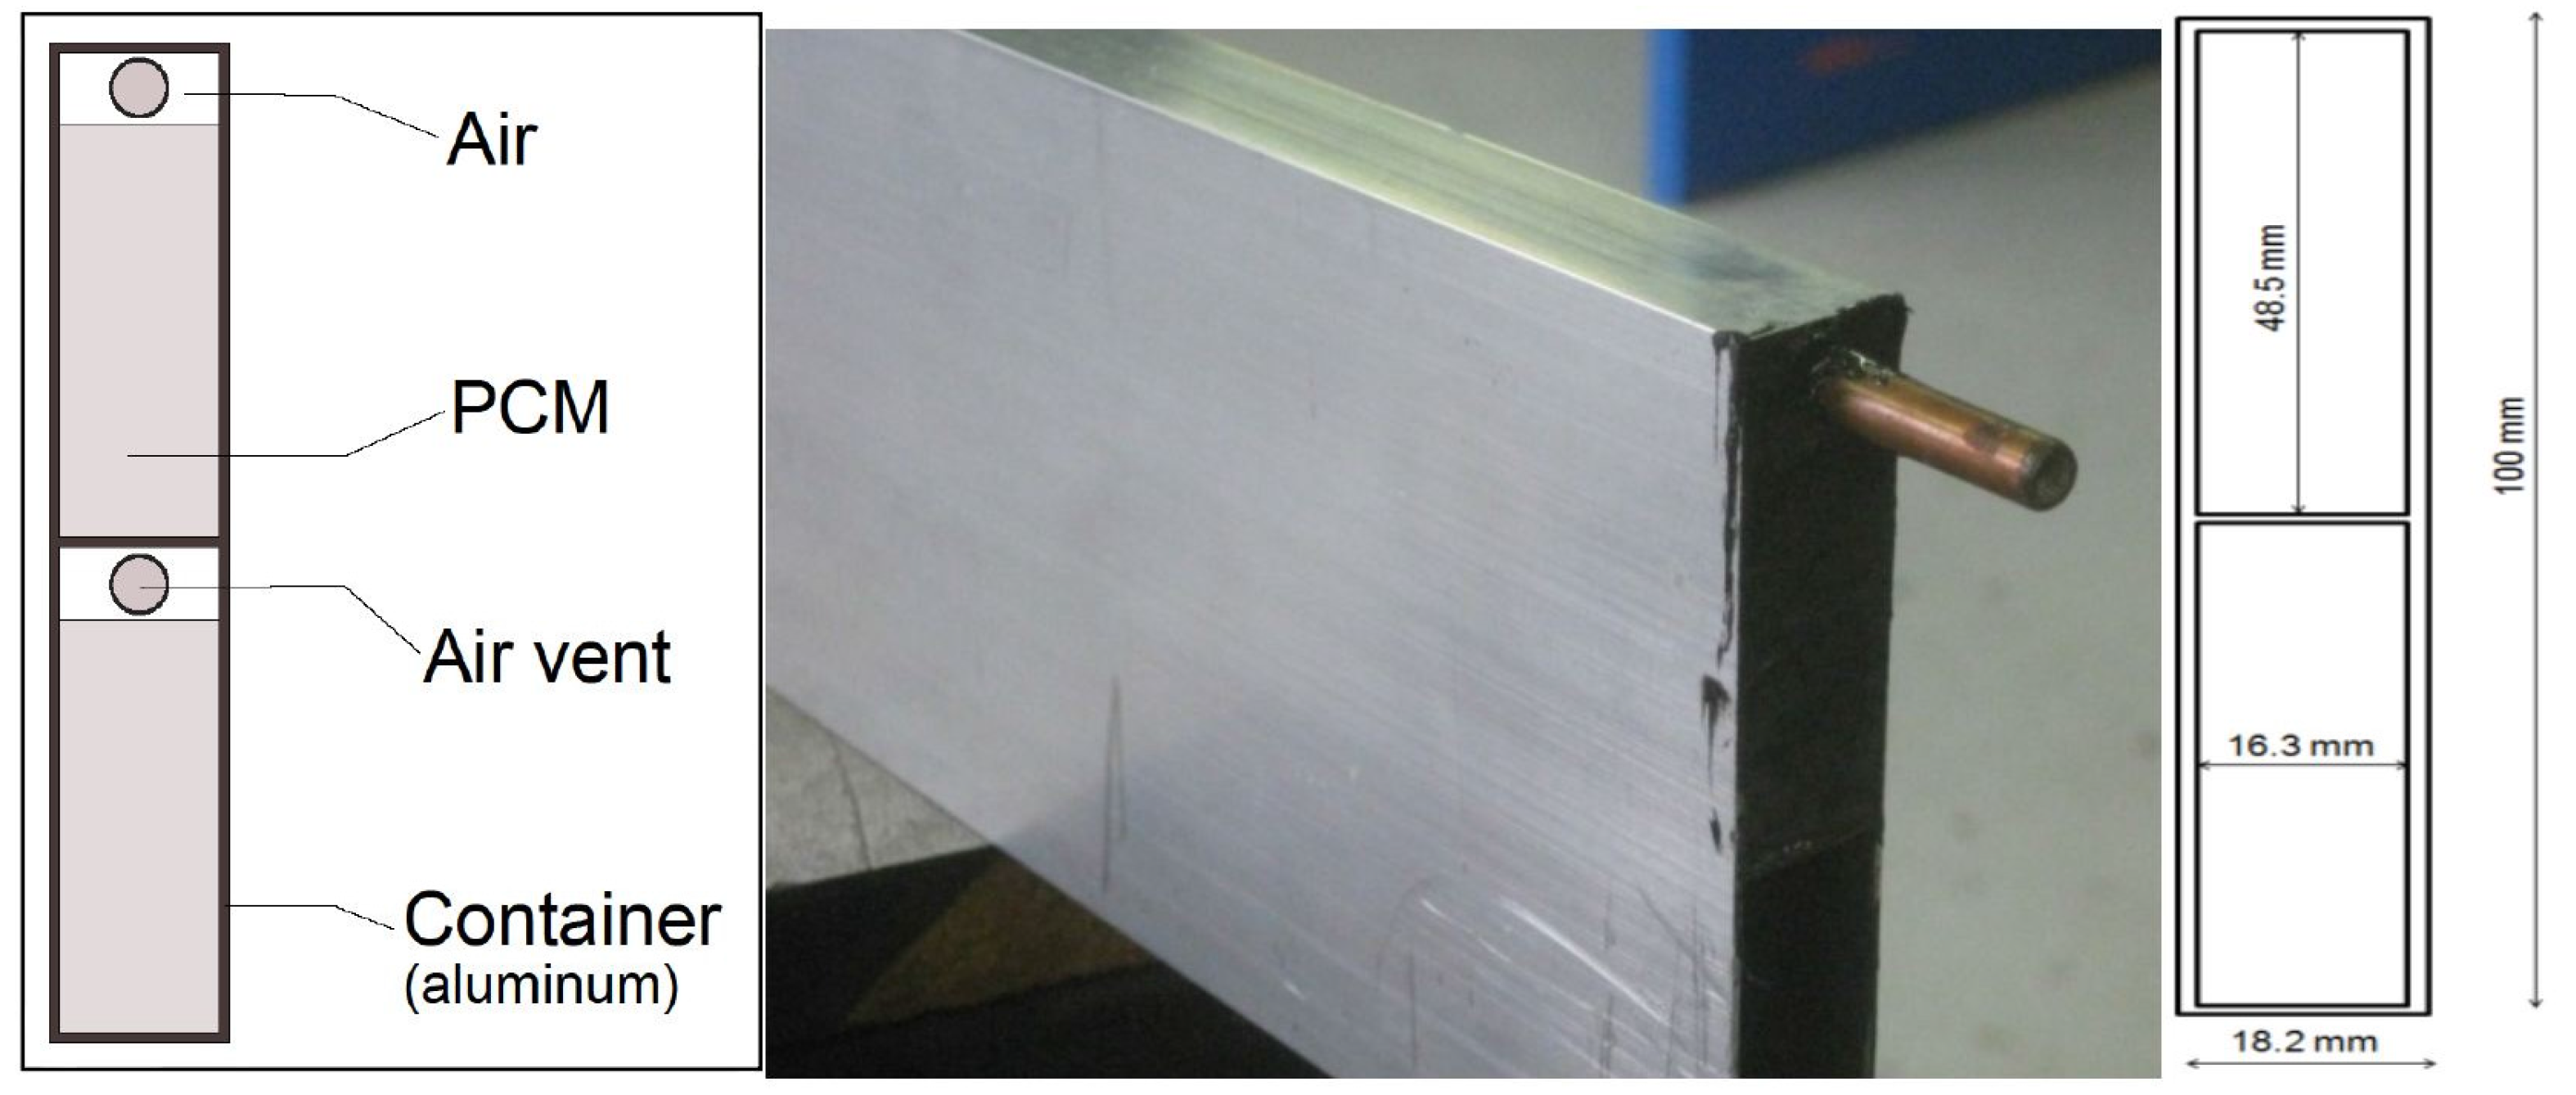
Arrays of 34 plane-parallel aluminium containers were filled with PCM, each with dimensions: 0.018 m × 0.200 m × 1.000 m. Each container included two identical cavities that were sealed with aluminium sidings (0.016 m × 0.016 m × 0.048 m) and silicone caulk. When empty, the total mass of the containers was 18.53 kg. When filled with PCM, this total mass increased to 27.88 kg.
As detailed in
Table 1, the selected PCM undergoes a significant change in density when it melts. To prevent leakage, the cavities were only partially filled and copper tube air vents were added at the top of the aluminium sides as shown in
Figure 3. No mass losses were observed during the test programme.
2.3. Heat Storage Component Design
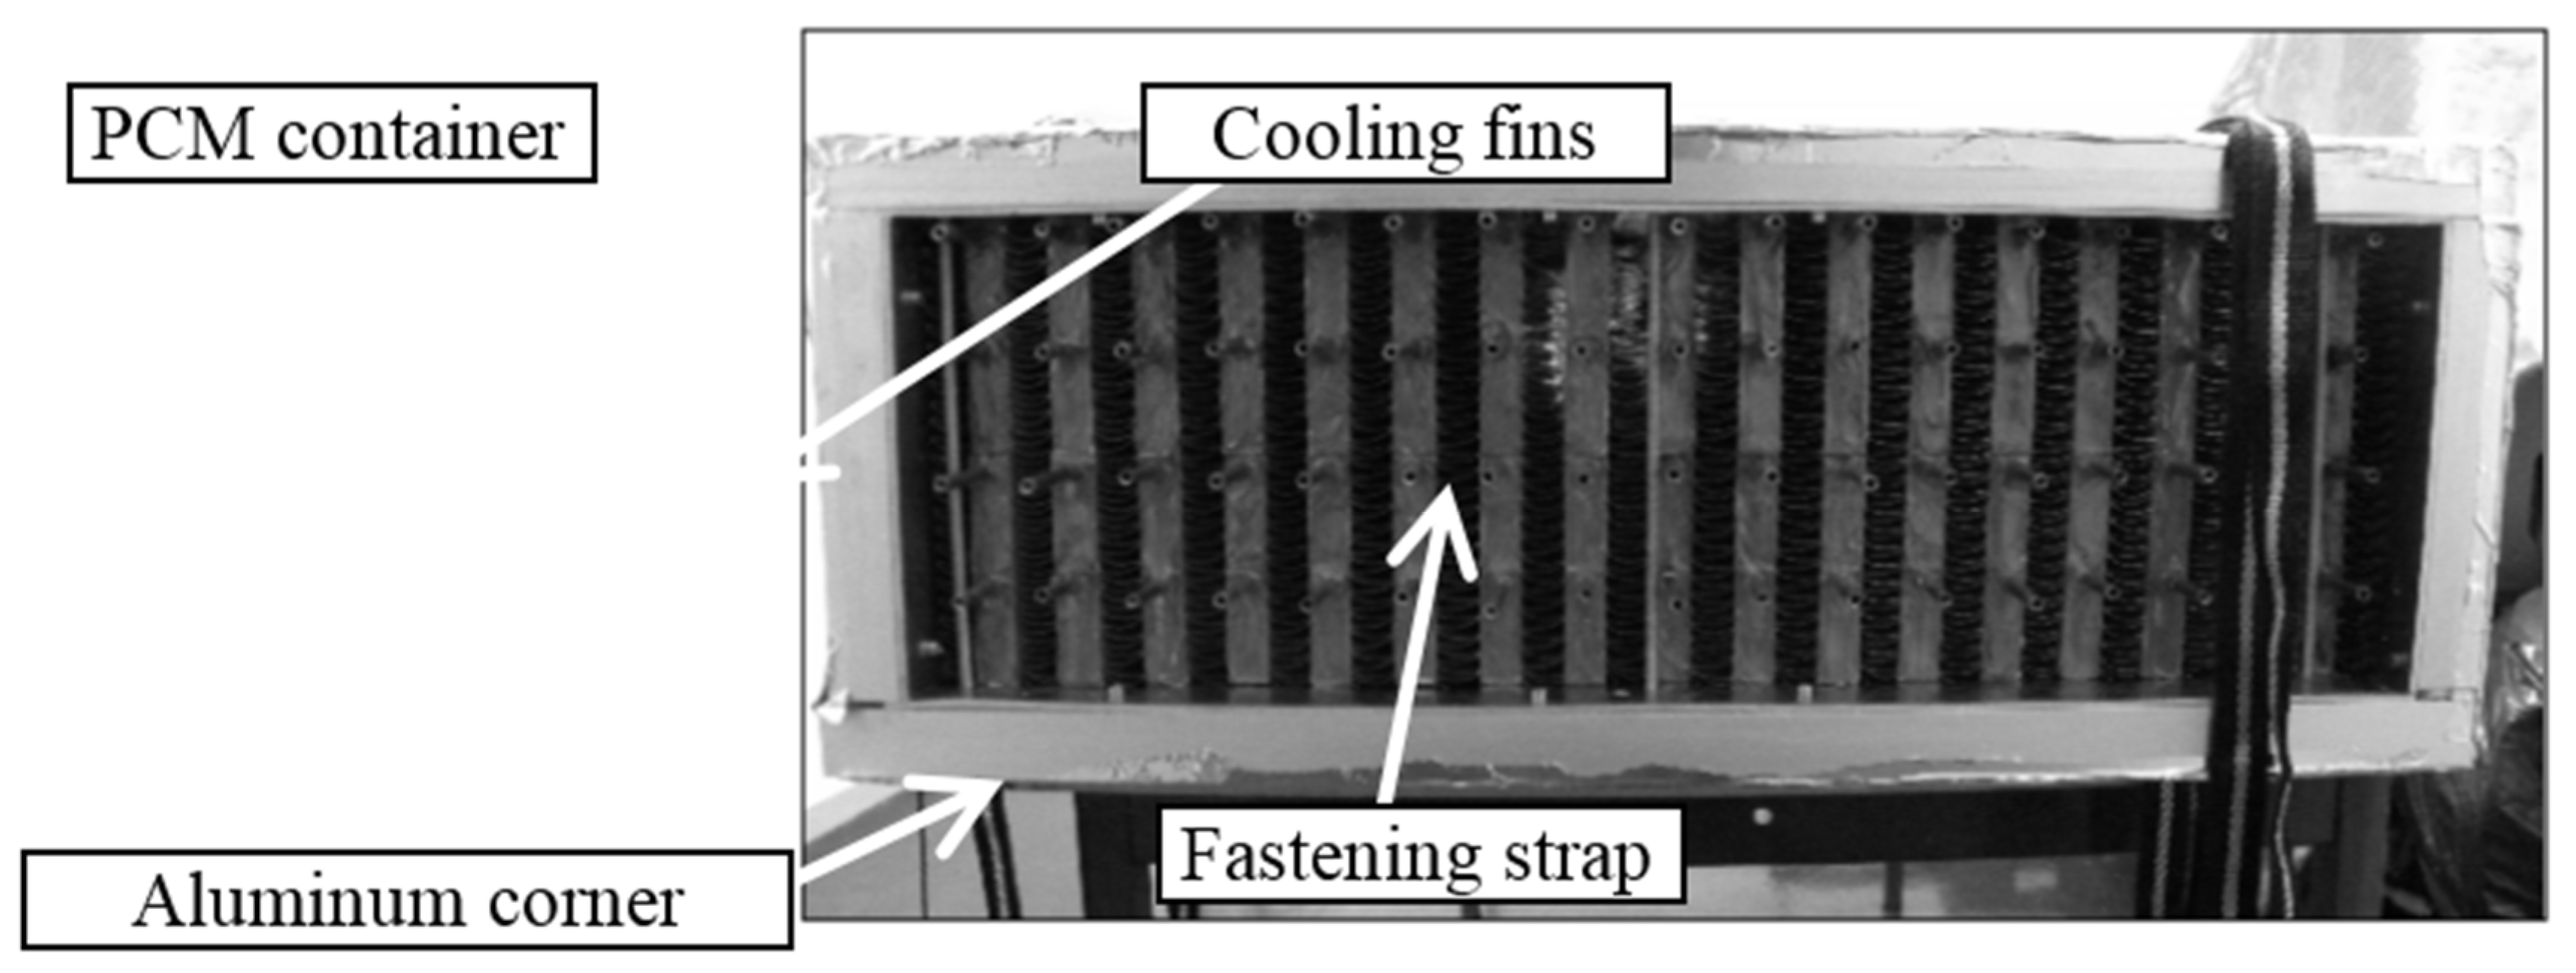
The complete heat storage component comprises the 34 containers described above, plus a set of cooling fins (of mass 4.69 kg). The containers are stacked in two layers, to give an arrangement of 17 blocks (0.400 m × 0.018 m × 1.000 m). These blocks are separated by fins of identical cross-section (see
Figure 4), which were designed such that the air streams between adjacent blocks were split equally across 50 channels (0.080 m × 0.018 m × 1.000 m).
The whole assembly is surrounded with aluminium plates and the overall cross-section is 0.20 m × 0.63 m. These aluminium plates were mechanically attached with aluminium rails, screws and nuts, located on the outer side of the heat storage unit. Finally, the storage was insulated using a 0.04 m thick layer of polystyrene foam and mineral wool.
2.4. PCM Properties
The commercially available paraffin product, Microtek 37 [
5] was chosen for the PCM.
For the use as heating storage placed behind a heat pump (with air flow reaching about 45 °C), it was necessary to find a material with a melting temperature under 45 °C but higher than 25 °C, necessary for thermal comfort. Paraffin is also well adapted to a multiple phase changing without loose in performance.
The thermal properties of the material were measured, and a summary can be found in
Table 1.
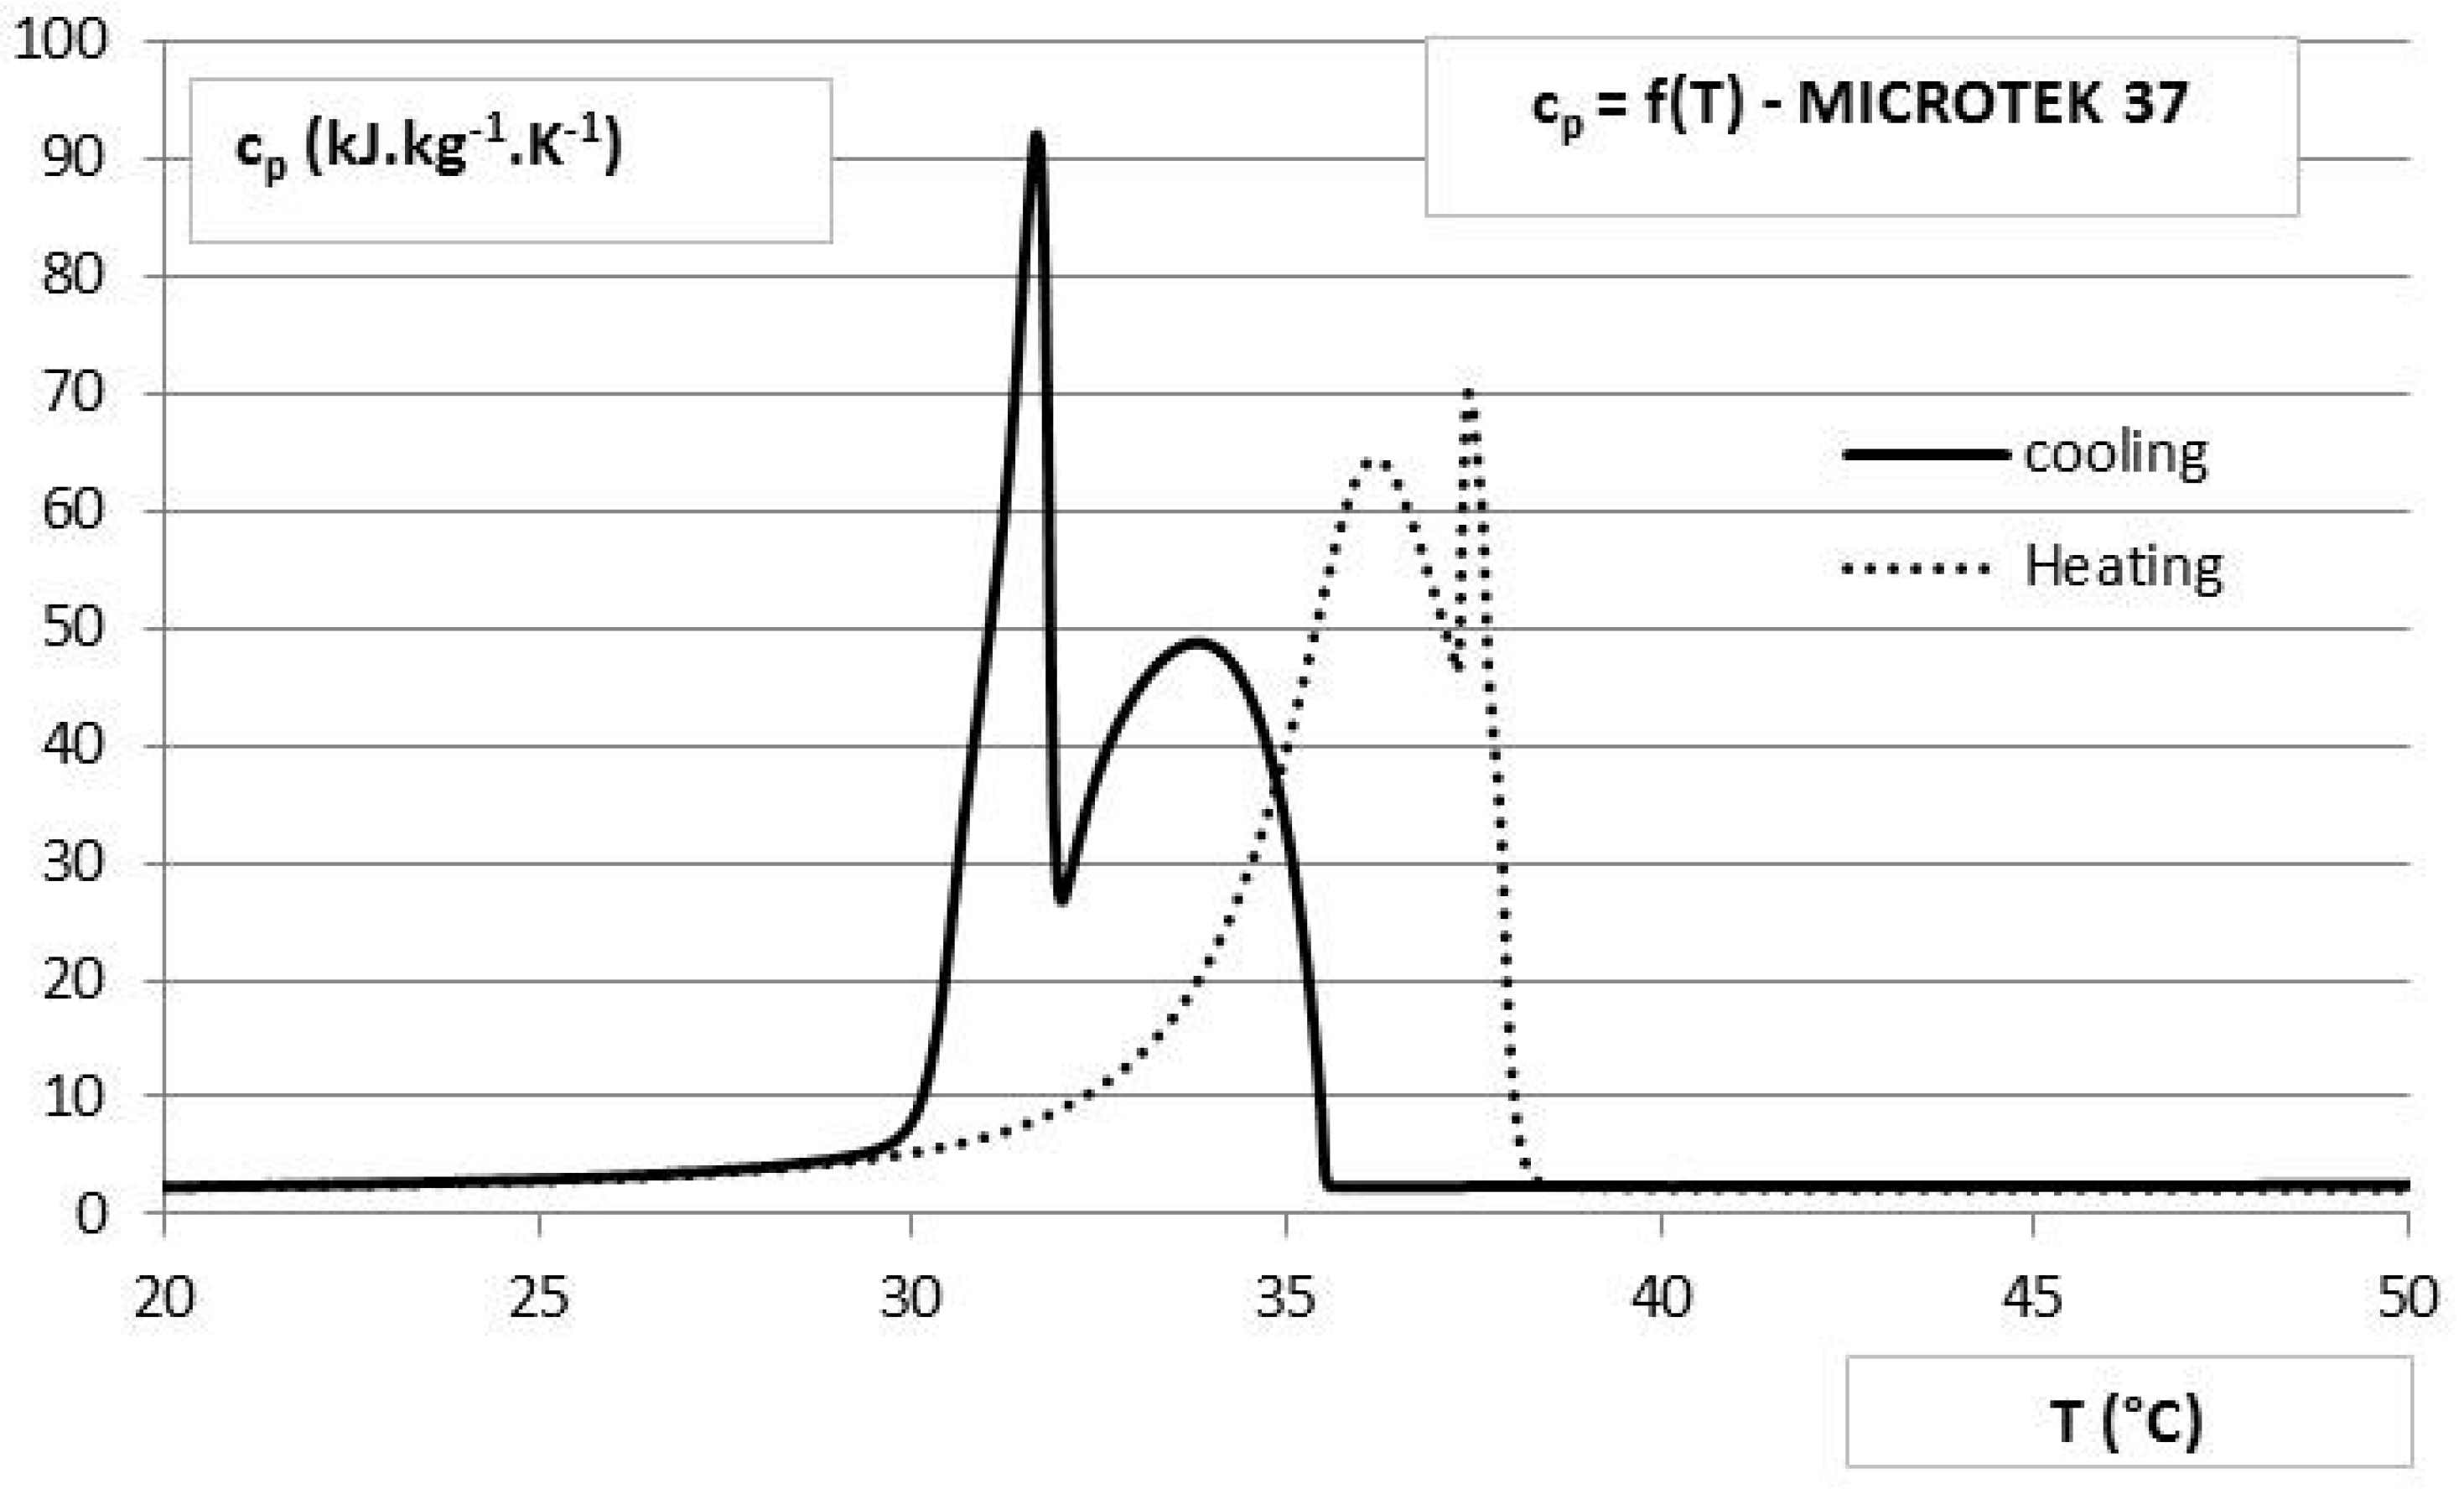
The heat of fusion was measured for a 405.05 ± 0.05 mg sample, using the DSC method under a steady rate of heating and cooling of 0.15 °C·min
−1. This rate was taken for the validation because it corresponds to a low rate made possible with the technique of the micro DSC (SETARAM Instrumentation, Caluire, France) that needs a higher mass for a better precision considering the heat flow resolution. Moreover, this rate corresponds to a close value of the temperature evolution in the process. The double peak that is possible to observe for very low temperature evolution of DSC is characteristic of the impure composition of the commercial product. For this same product, and for a rate of 1 °C·min
−1, only one peak appears (see reference [
3]). Phase change occurs when the temperature rises through the range 30 to 38 °C, with a major peak capacity observed at 37.2 °C. By the same method the heat of solidification was also measured, which was found to agree within 0.1% of the value obtained for melting heat, albeit with a peak at a lower temperature than when the sample is melting (major peak at 31.7 °C).
The constituent paraffin of Microtek 37 belongs to the saturated hydrocarbon family. Sharma summarizes the advantages and disadvantages of these substances as paraffin for use in a PCM device [
6]. Non-toxic and recyclable, paraffin offers high chemical stability, allowing it to undergo a large number of melting and solidification cycles without it separating. It also has a relatively high latent heat of fusion and, as it does not exhibit super cooling, nucleating agents are not necessary. Drawbacks include a rather low thermal conductivity of solid paraffin, and a significant hysteresis in curves of equivalent heat capacity when characterised using DSC. A further disadvantage is the reliance on fossil petroleum to produce commercially available paraffin [
7].
In a study by the International Energy Agency [
8] it has been shown that DSC measurements are sensitive to the rate of heating and cooling of the scan and the mass of the sample. Thus for faster tests (or smaller sample mass), the measured heat capacity curve is distorted and shifted towards higher temperatures in the heating case and lower temperatures in the cooling case.
Since experimental curves obtained by DSC are the basis of simulations and dictate the rise and fall in temperature offset, systematic variations arising from the method with which they have been measured can have a considerable impact upon the predicted behaviour of a system. Indeed, a study addressing this issue has been presented in [
9,
10]. In that work, an experimental procedure was implemented that entailed a series of temperature rises and descents in order to give a better indication of the macroscopic behaviour in the case of partial melting. It was then possible to deduce the preferable way to model the thermal behaviour of PCM using appropriate specific heat capacity curves obtained by DSC depending on the phase. Despite this improved method, some inaccuracies remain, and in particular the case of temperature changes near melting or solidification peaks. In addition, the rate of temperature variation in the material is variable, which is not the case for curves derived from DSC determined with a constant rate of temperature evolution and with a given mass. Given the complexity of heat transfer phenomena in PCM and the error attributed to the DSC characterisation method further experimental investigations are needed to study other candidate materials and to assess the behaviour of full-scale components. Date from the latter are also essential for the validation of advanced numerical models.
2.5. Instrumentation
The experiment was designed to allow the estimation of heating power, which was calculated using Equation (1):
QV is the airflow rate (m3·s−1);
ΔTA is the temperature difference between the inlet and the outlet sections of the heat storage component (K).
ρ
A can be estimated with Equation (2), considering air as an ideal gas:
The flux density obtained by dividing the power P by the exchange surface S = 6.8 m2 (between containers and flowing air).
In order to obtain an accurate estimation of these quantities the airflow rate and ΔTA must be measured with good precision. The airflow rate was monitored by the air-supply system. Corrections were however necessary to account for air leakage, and this was achieved using a unidirectional hot wire anemometer that was positioned downstream of the apparatus. The anemometer sensor was sensitive to air speeds ranging from 0.05 to 2.50 m·s−1 with an accuracy of 4%.
To measure the temperature distribution in the system, an array of more than thirty thermocouples were inserted at various locations inside the heat storage component. The mean of the two temperature measurements taken in the middle of two containers located in the centre and on the edge of the heat storage will be presented in a later section of this paper. Model data-comparisons relied upon thermocouples that were installed in the middle of the cavities filled with PCM. Four thermocouples placed on the surface of each instrumented container provided the necessary boundary conditions for the model. The air temperature in the channel was not considered as a boundary condition as this would have introduced an uncertainty in the evaluation of the convective heat transfer coefficient.
3. Modelling
Simulations of PCM heat storage solutions have previously been proposed using analytical [
11], semi-analytical [
12] and empirical [
13] models. Such simplified descriptions of a system are useful at an early stage of design. In order to address technical design considerations however, more detailed numerical models are required to predict the behaviour of the storage unit. In [
13], a simplified heat storage model is proposed neglecting conduction in the PCM slab. A finite difference approach was adopted to discretize the conservation laws, and the governing differential equations were solved using an explicit scheme. In the model introduced in [
14], conduction heat transfer was considered along the airflow direction for a PCM slab. For small values of the Biot number (3), these simplified models are adequate because temperature gradients within the storage material can be ignored. For configurations implying a large Biot number, as would typically be encountered for a storage material with a low thermal conductivity, an accurate prediction of the transient response of the unit can only be obtained by modelling conduction in the PCM slab itself.
Several experimental studies [
13,
15,
16] have considered systems with a Biot number near to or less than unity. Experimental data from higher Biot number configurations are needed, firstly to understand the influence of the temperature gradient in the plate on the energy storage and release, and secondly to validate numerical models taking into account such non-negligible temperature gradients in the slab. The configuration described in
Section 2 represents a system with an associated value over
Bi =
4. Hence, a detailed calculation of conduction inside the PCM is mandatory.
In [
17], 2D conduction in a PCM slab was solved via an implicit scheme, for finite volume discretization and enthalpy formulation. Only advection and convection terms were taken into account in the energy balance of the flowing air. In [
18], the 2D conduction problem was solved using the equivalent heat capacity method. The variation of thermal conductivity in the PCM slab was not modelled. In [
19], another study also took into account the variation in conductivity and was validated with experimental data. In that study, an encapsulated PCM device was considered without a metallic container. Consequently, qualitative differences to transversal heat transfer should be expected with the configuration studied in the present work.
For the present study we have constructed 2D and 1D models of the heat storage container responsible for the complex heat transfer phenomena, using COMSOL Multiphysics simulation platform [
20]. It is a powerful code for modelling and solving various sciences and engineering problems based on the Finite Element (FE) method. The software is particularly well suited for the treatment of multiphysical and non-linear problems where several phenomena are involved, giving rise to non-linear behaviour, as in the case for the present study.
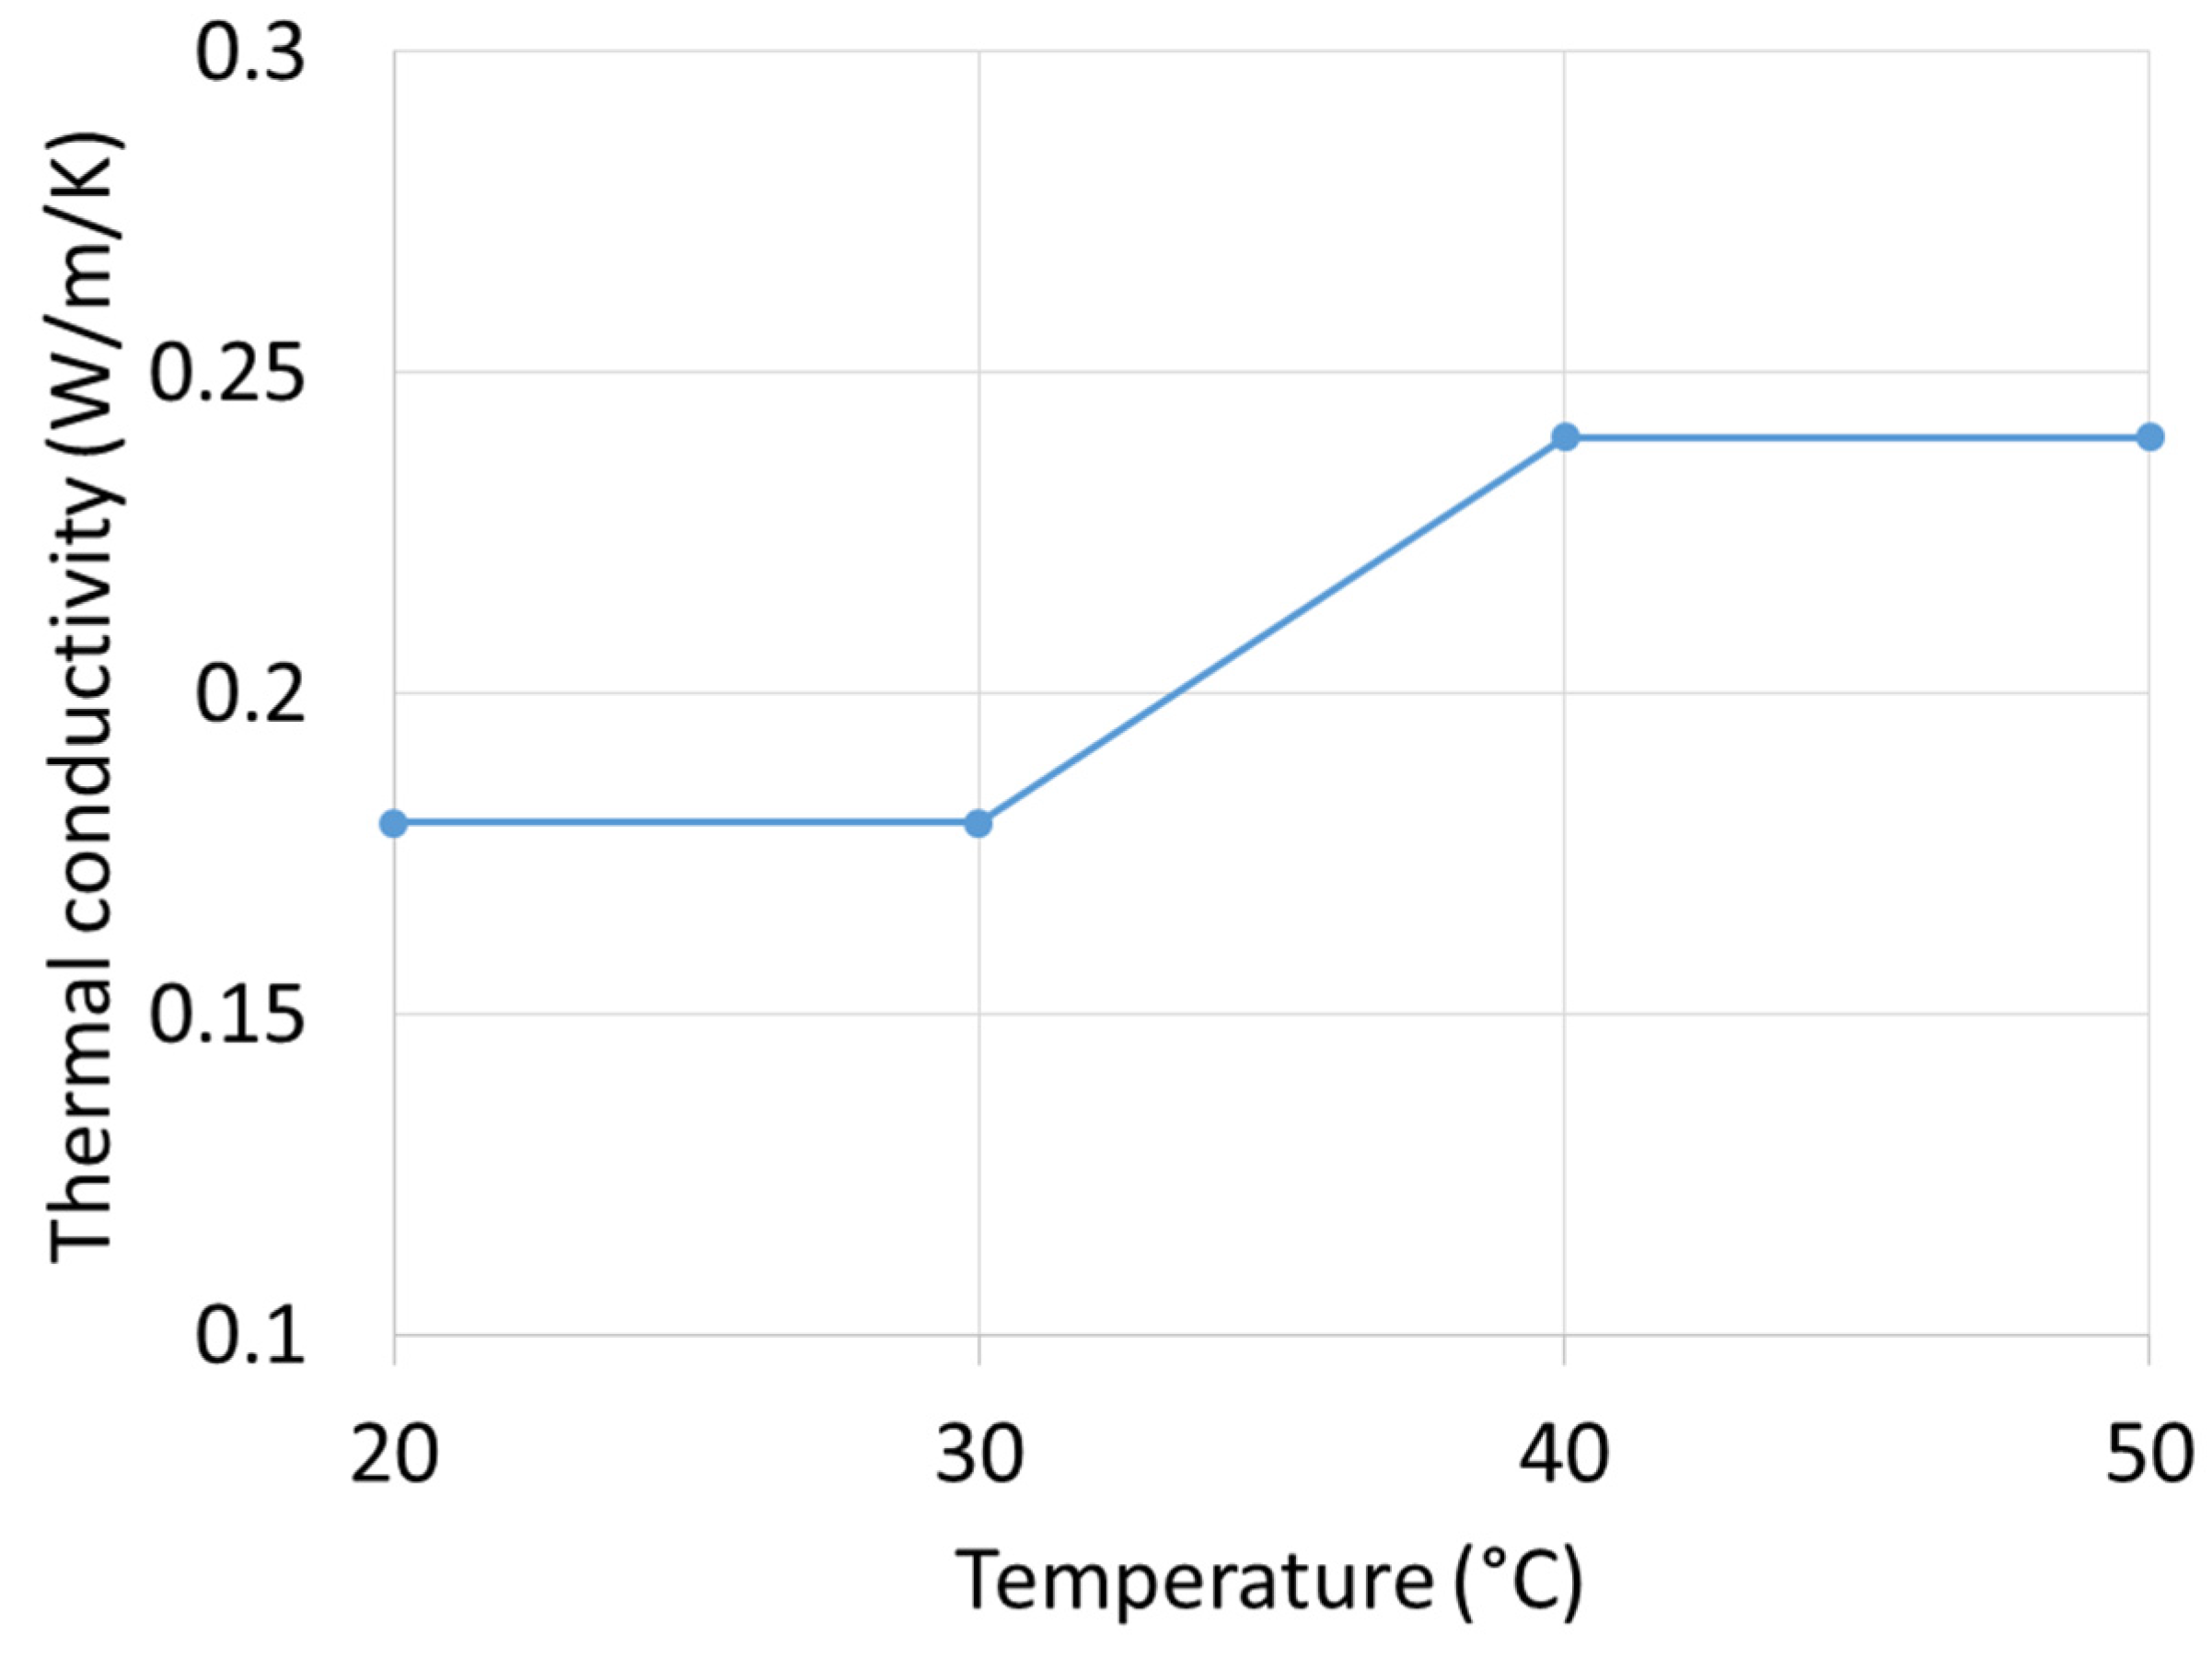
The apparent heat capacity of the PCM was modelled according to
Figure 5 and its thermal conductivity is illustrated in
Figure 6. For the aluminium components of the system the model assumes constant thermophysical properties: ρ
alu = 2700 kg·m
−3 and
cp alu = 897 J·kg
−1·K
−1.
For the 2D model, the mesh generated by COMSOL to discretise the heat storage system consists mainly of triangular elements for the PCM domain and edge elements for the aluminium container. Complete mesh consists of more than 1700 elements with a minimum quality of 0.7 and an average quality: 0.9.
The time discretization was realized according to the backward differentiation formula with a maximum time step equal to 1 min. The MUMPS solver was selected to solve the linear system representing the model, which is defined by some 3738 degrees of freedom. For the model, the container was 85% filled with PCM, to allow for an air space on the upper side. Only heat conduction was considered for the PCM and air; the copper vents were neglected.
4. Results
4.1. Experimental Conditions
For the case in study the airflow rate was set to 300 m3·h−1 for the duration of the experimental trial experiment. The objective was to observe the complete PCM melting and solidification cycle. To achieve this, the inlet air temperature was switched between two set point values (20 °C and 45 °C) starting at the higher temperature, before being set to the lower level for a period of 8 h, and then returned to the upper level for a further 8 h. The temperature at the centre of the container and the heat flux at surface were monitored and compared with the model.
Heating power
P is calculated as prescribed by Equation (1). By convention, a positive value corresponds to a discharge of heat from the storage component to the air stream. The method to evaluate the airflow rate
QV, temperature difference Δ
TA and experimental uncertainties was presented in [
4]. At 300 m
3·h
−1, the total stored energy of about 2.3 kWh was discharged over a 3 h period, with peak flux of 1620 ± 225 W. The heat output reached 1025 ± 187 W after the first 30 min, and remained greater than 522 ± 157 W for a period of about 2 h 15 min.
4.2. Heat Flux Density at Container Surface Analysis
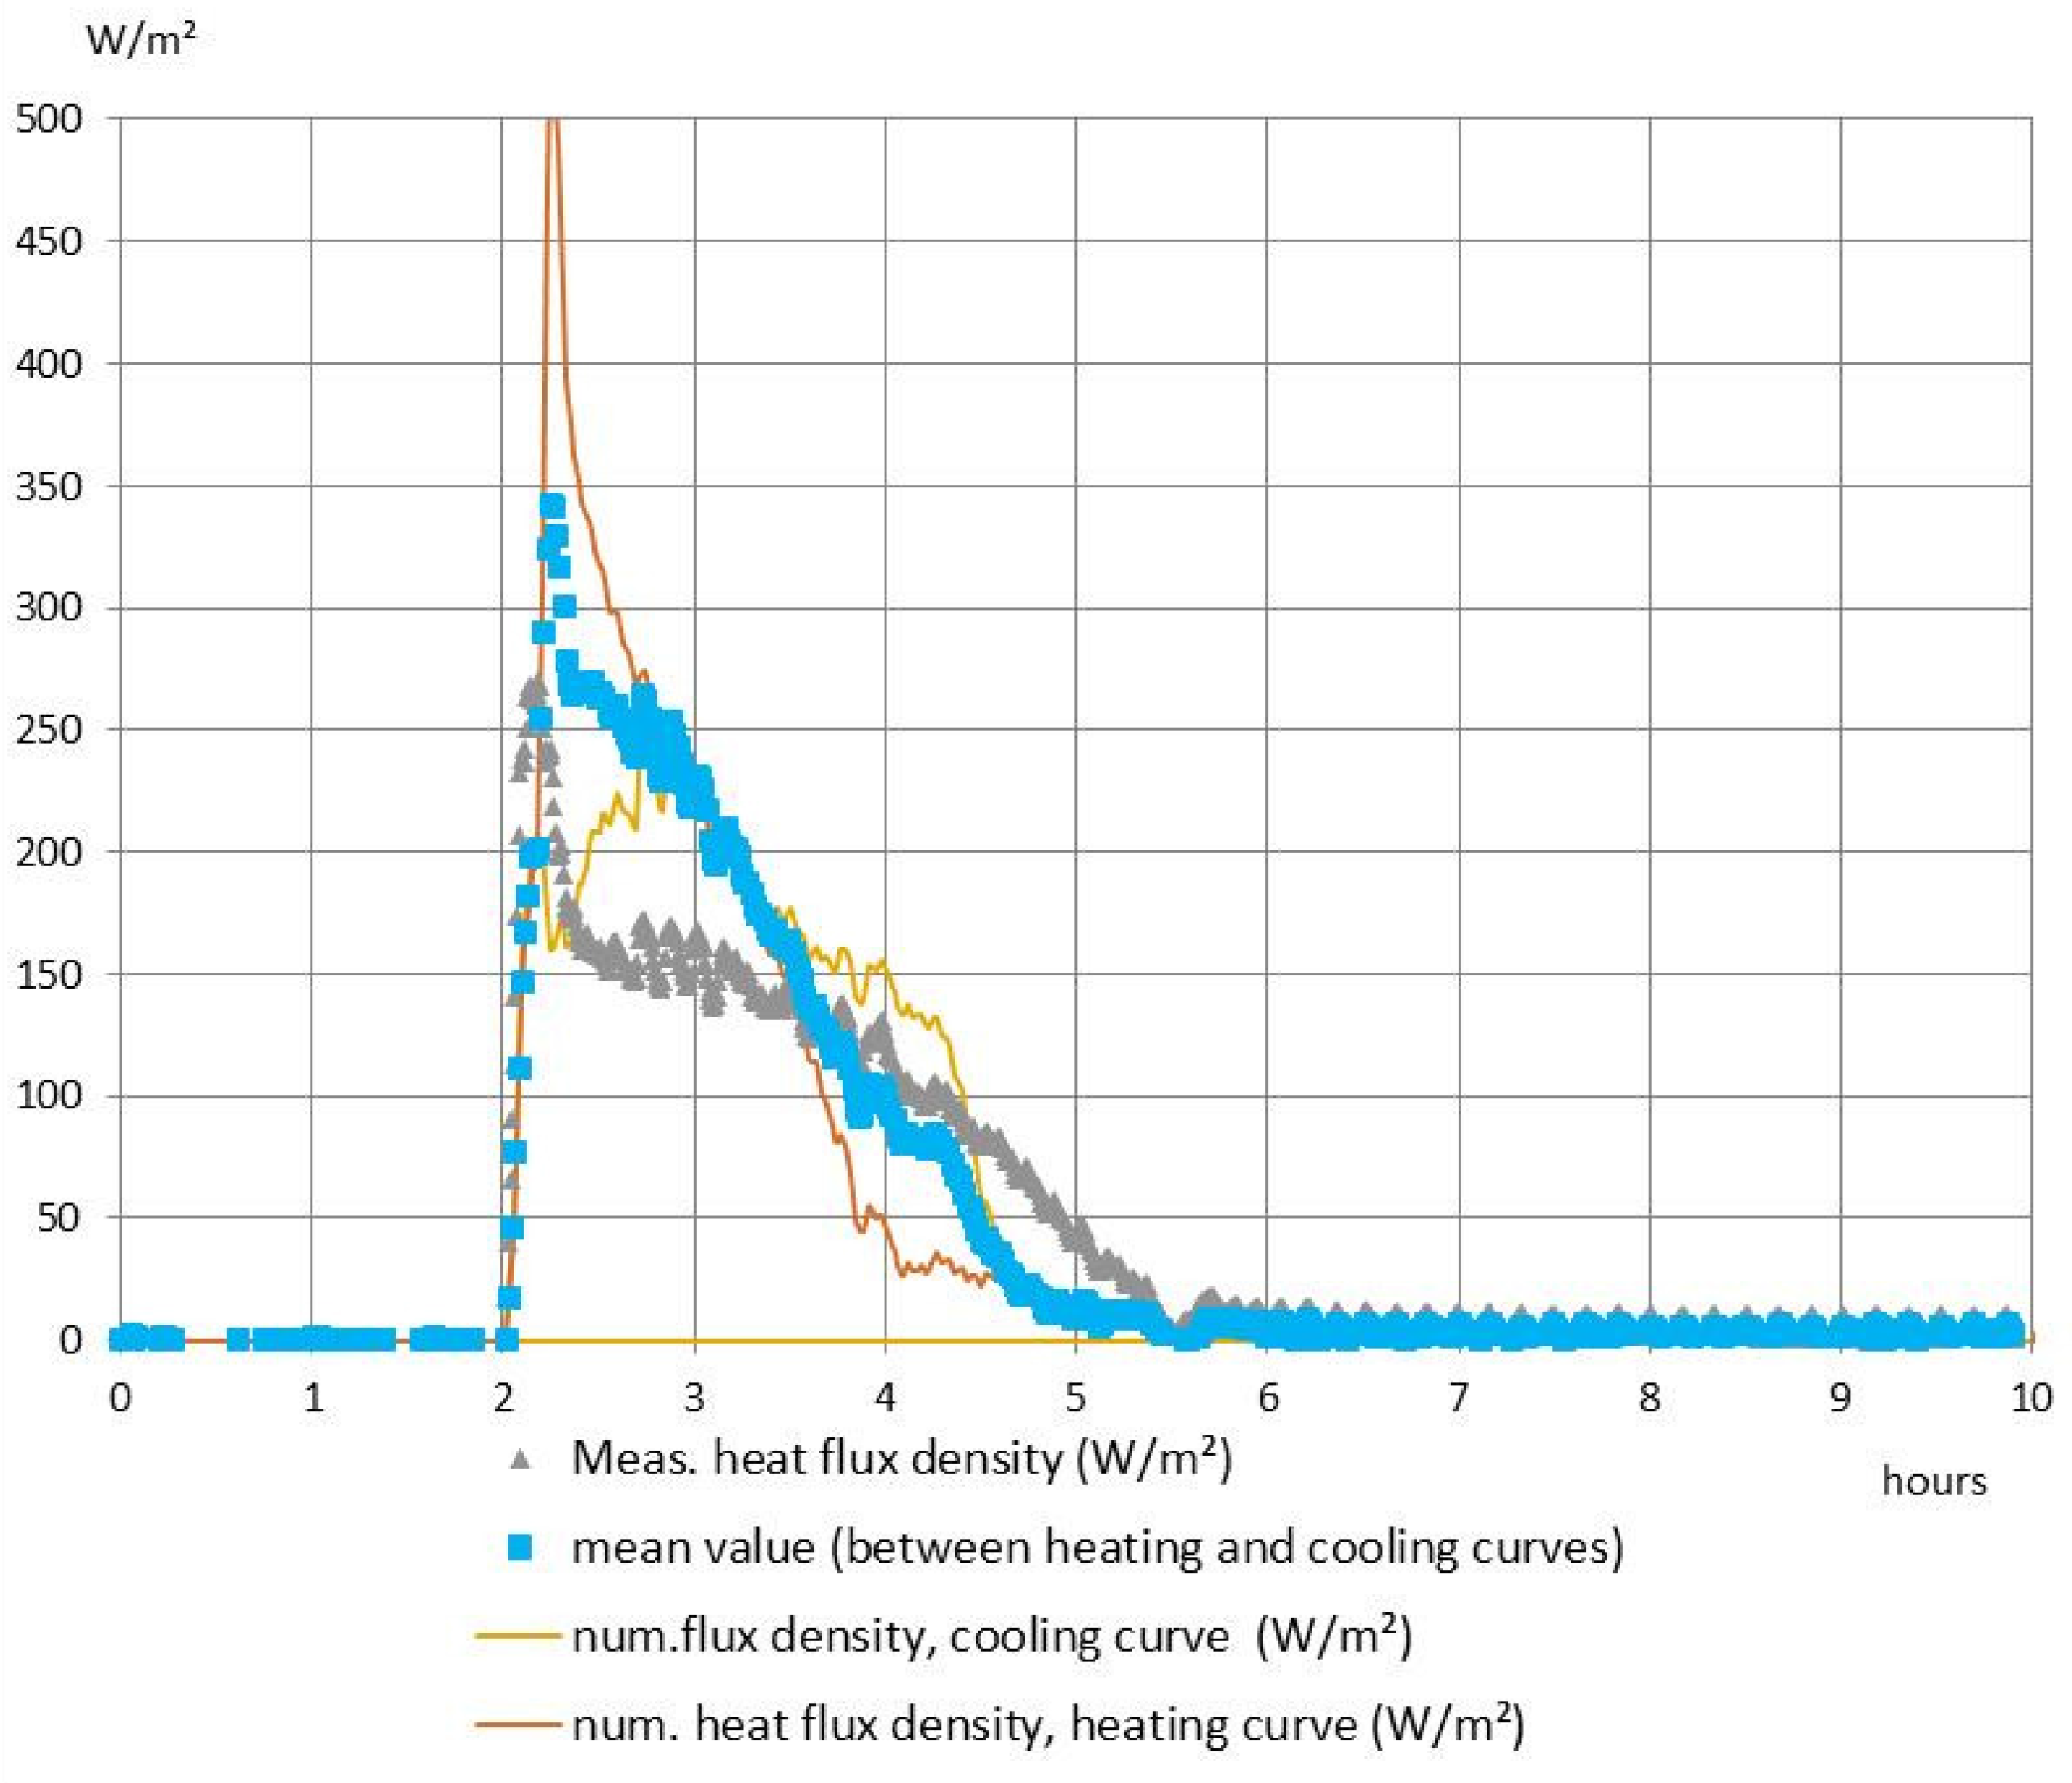
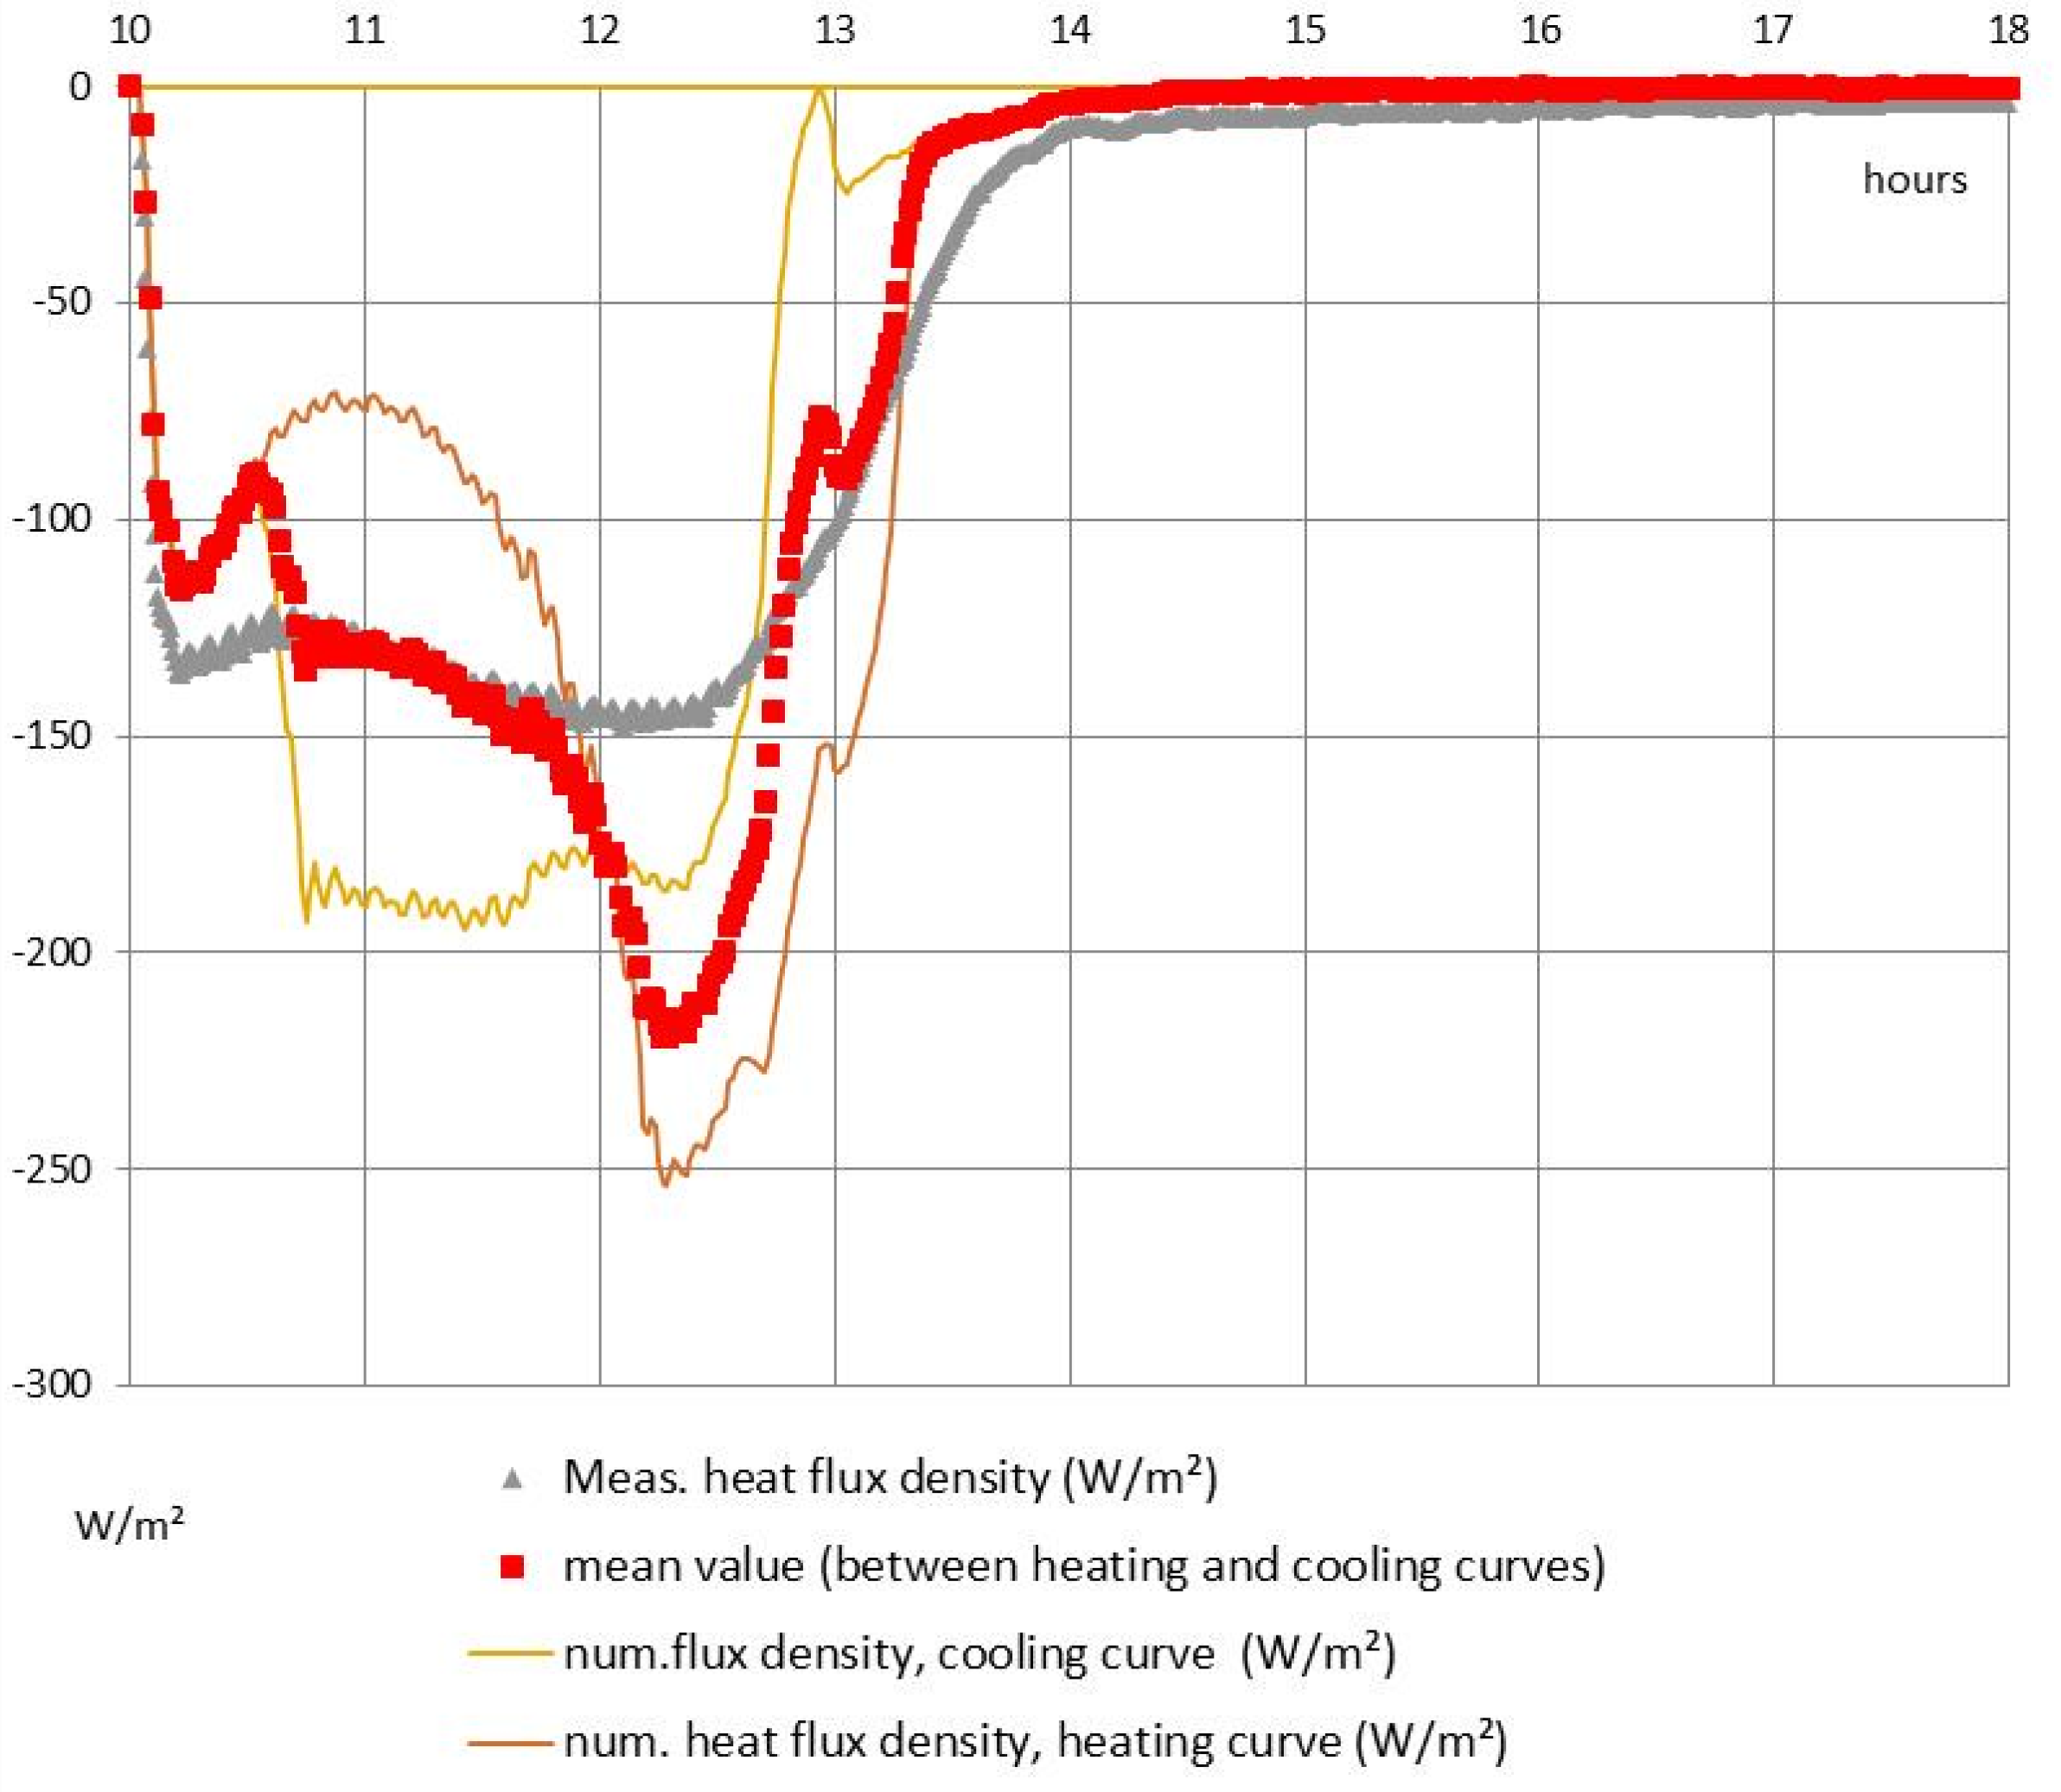
Figure 7 and
Figure 8 present the 2D results of heat flux density on the container surface taking into account distinct heat capacity curves (measured by DSC) for heating and cooling modes. The mean value obtained with the two heat fluxes (given with the two DSC curves) is also reported in the figures. Comparing the numerical prediction to experimental results some differences are evident that can be explained in part by the imprecision introduced by the DSC characterisation and also because of complex phenomena occurring in the PCM during solidification or melting. The experimental measurement of heat flux is a further source of uncertainty. For cooling case, the cooling DSC curve gives a closer agreement than the heating curve, and results in a good prediction of maximal heat flux density. From an energetic perspective, the integral of the two curves (model and experiment) are also in good accordance with data.
For the heating case, the mean result between the two curves follows most closely the experimental value.
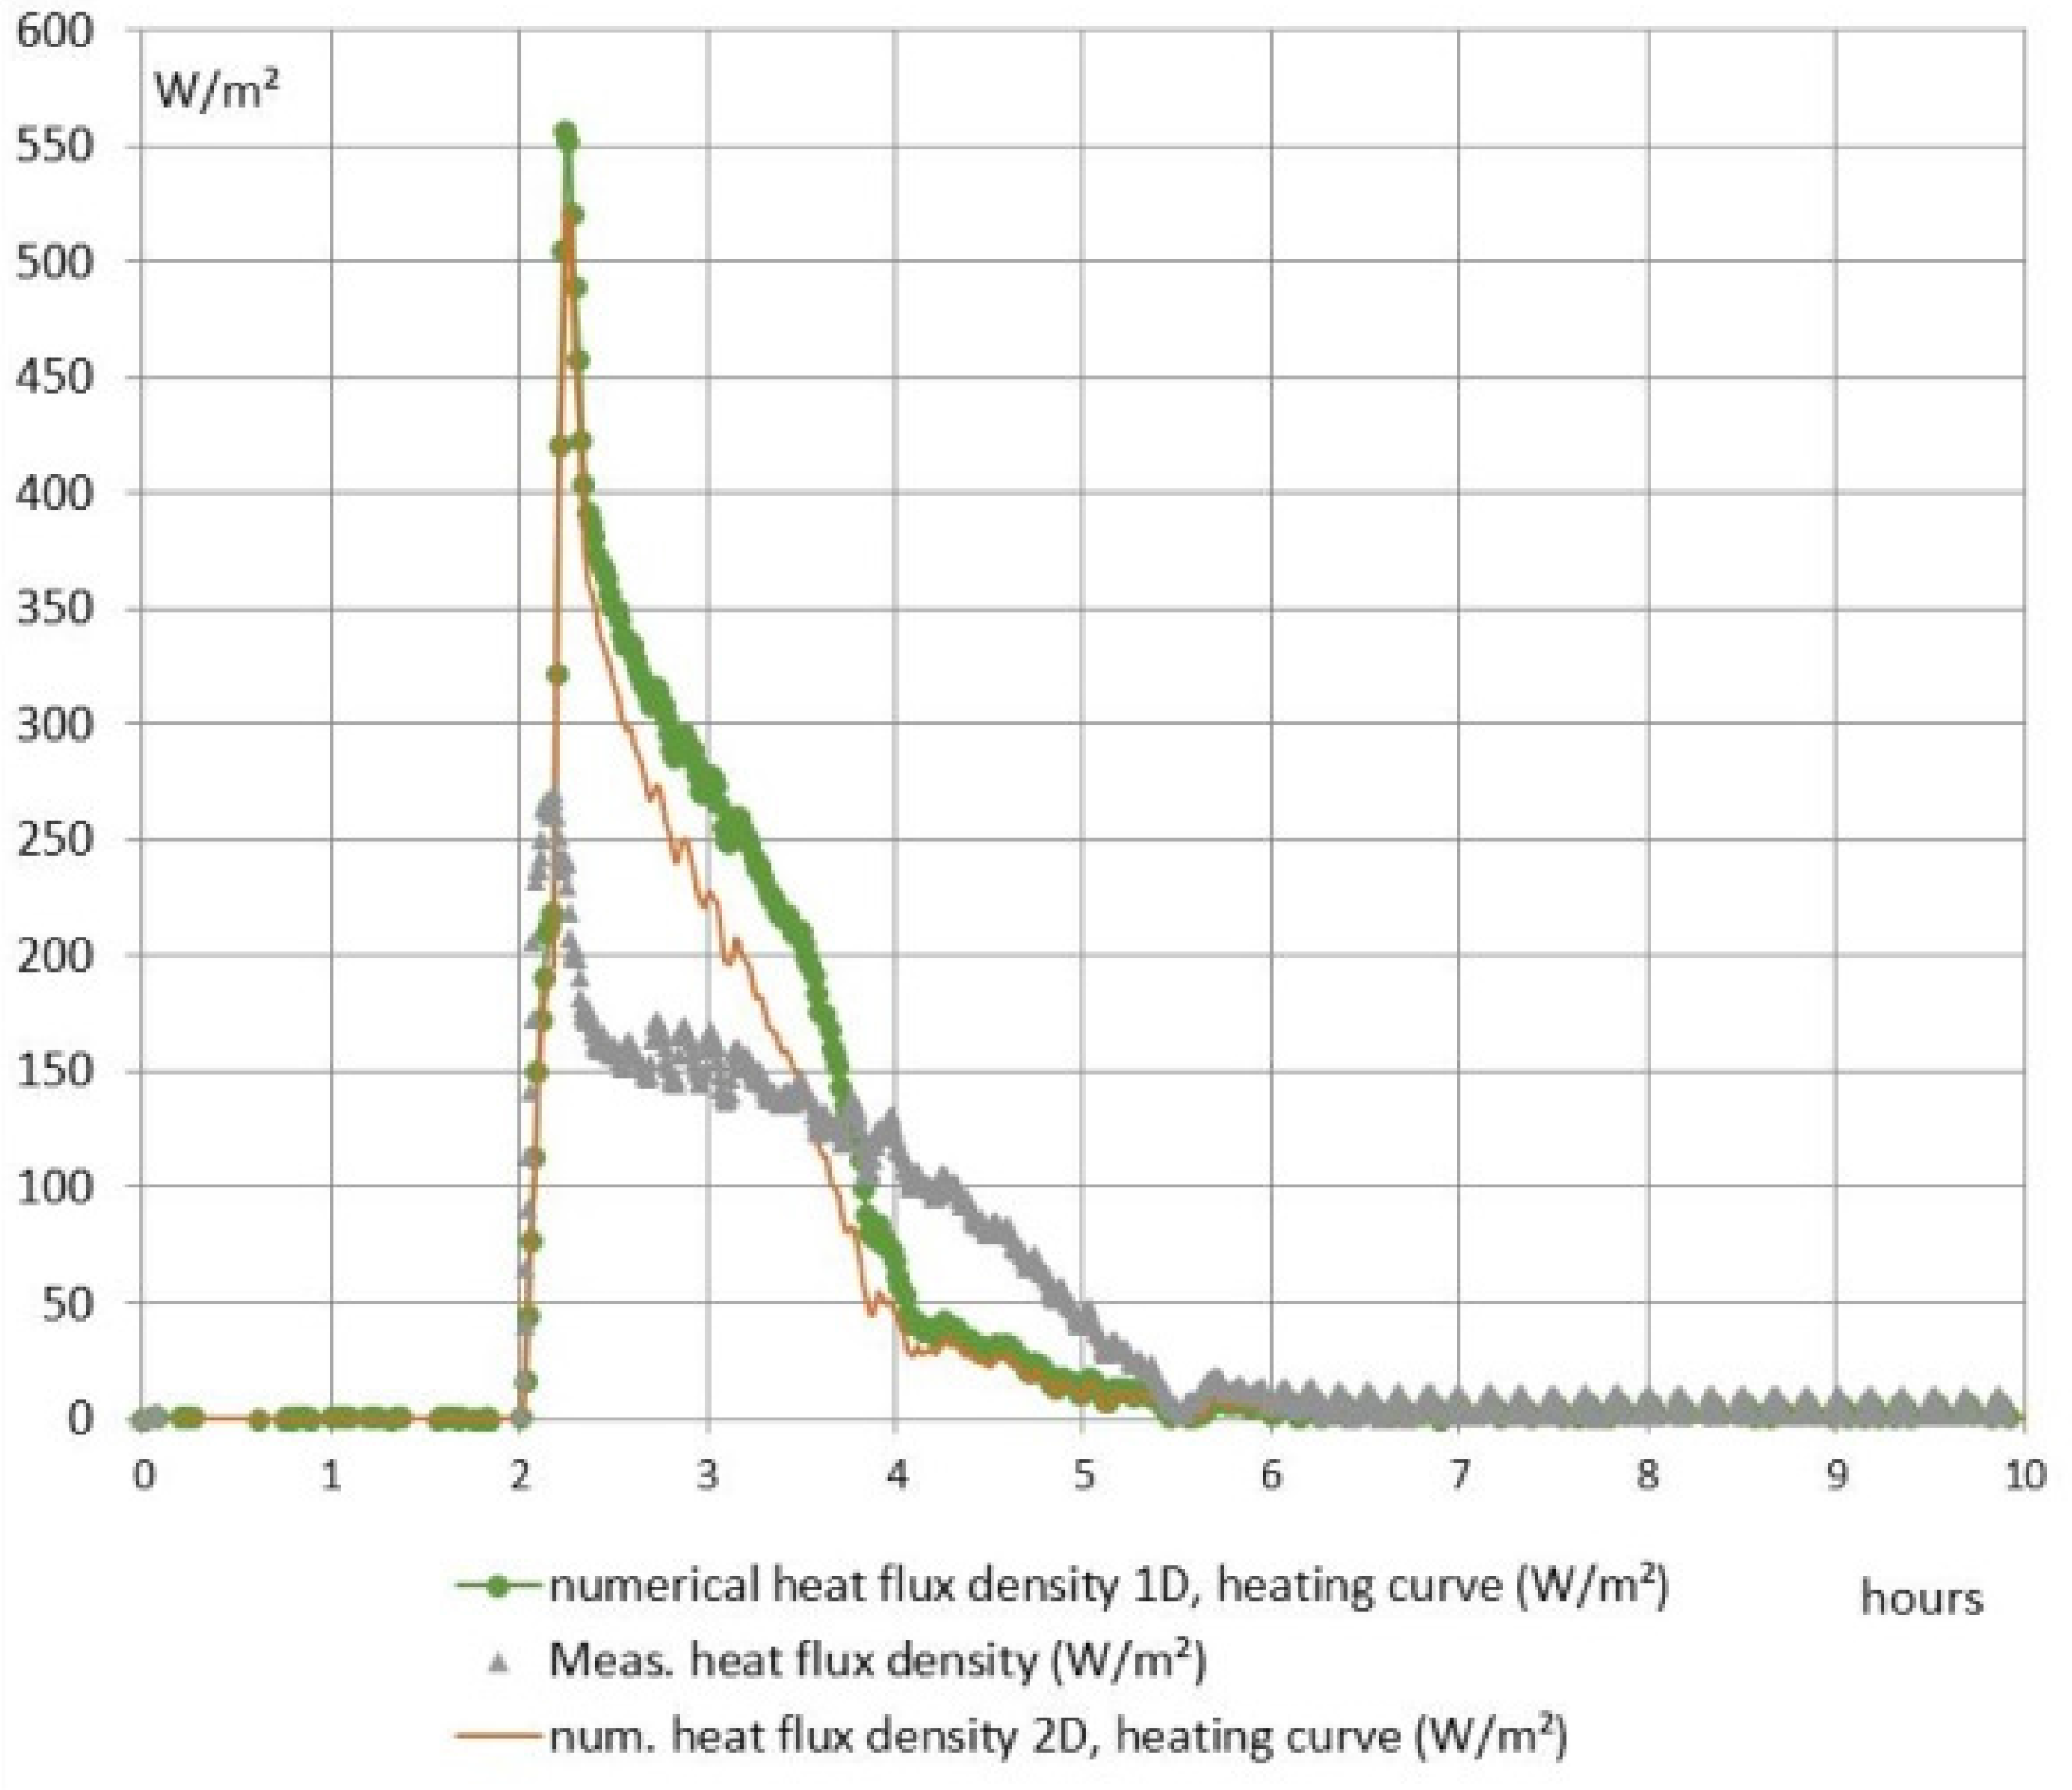
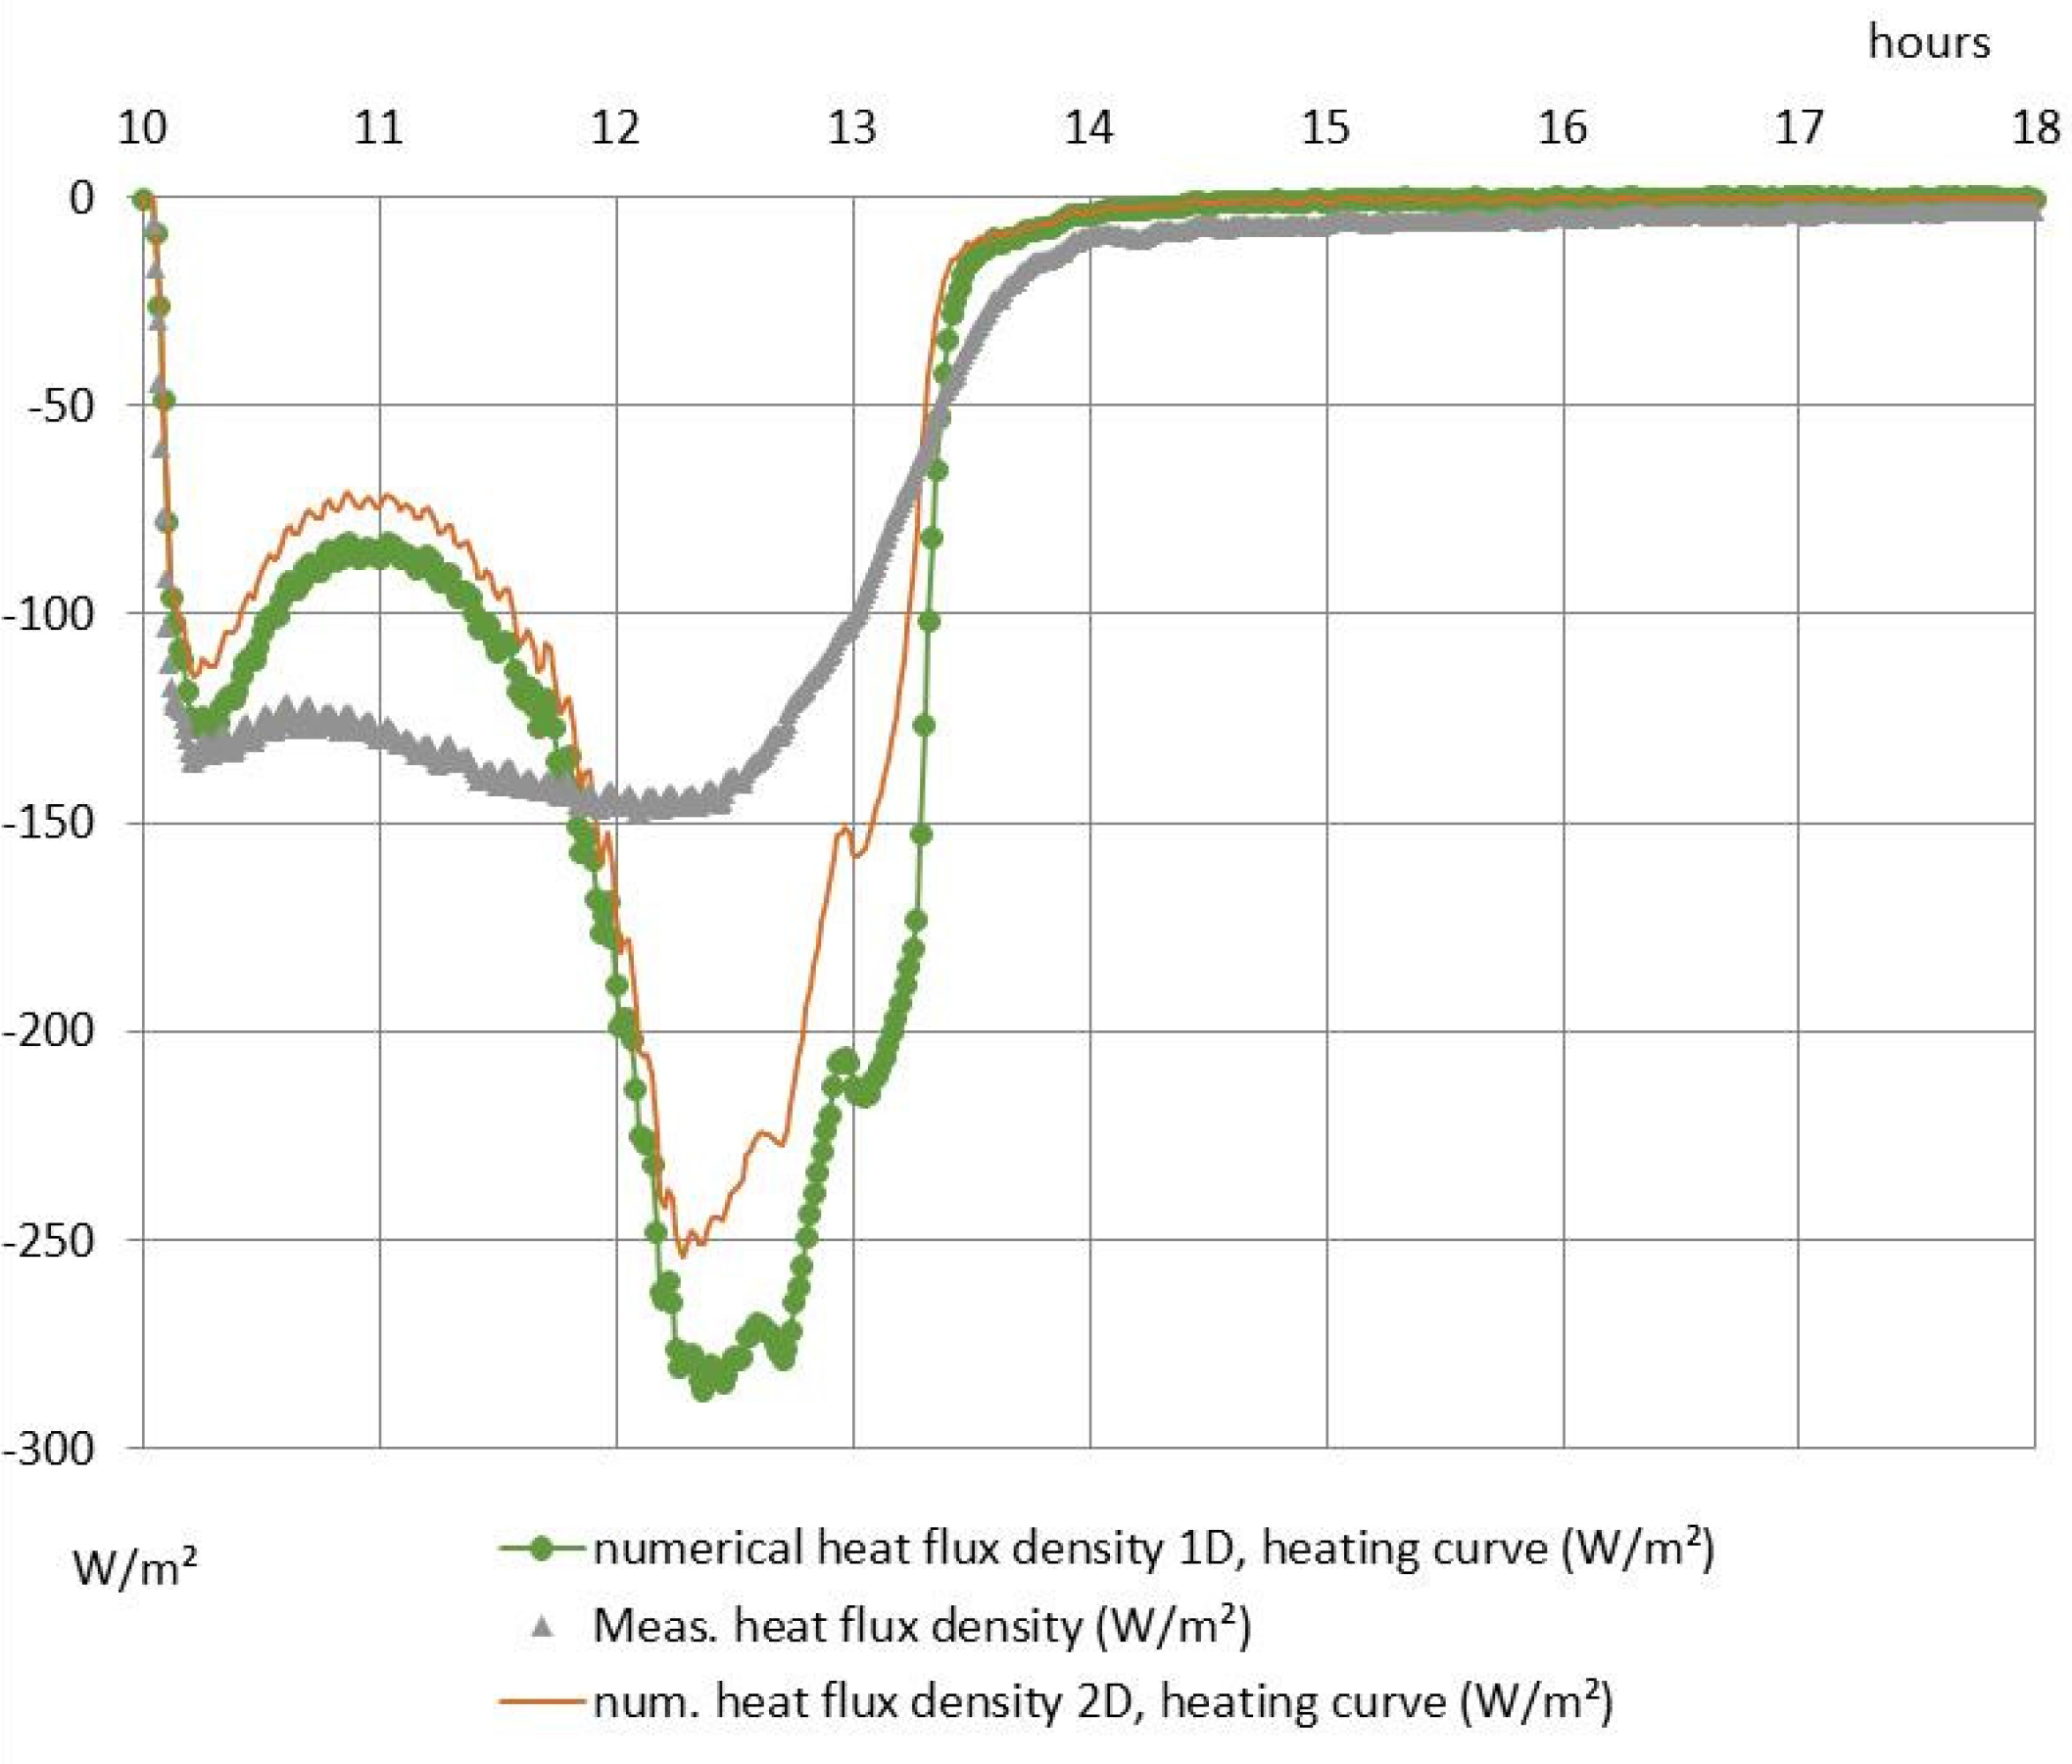
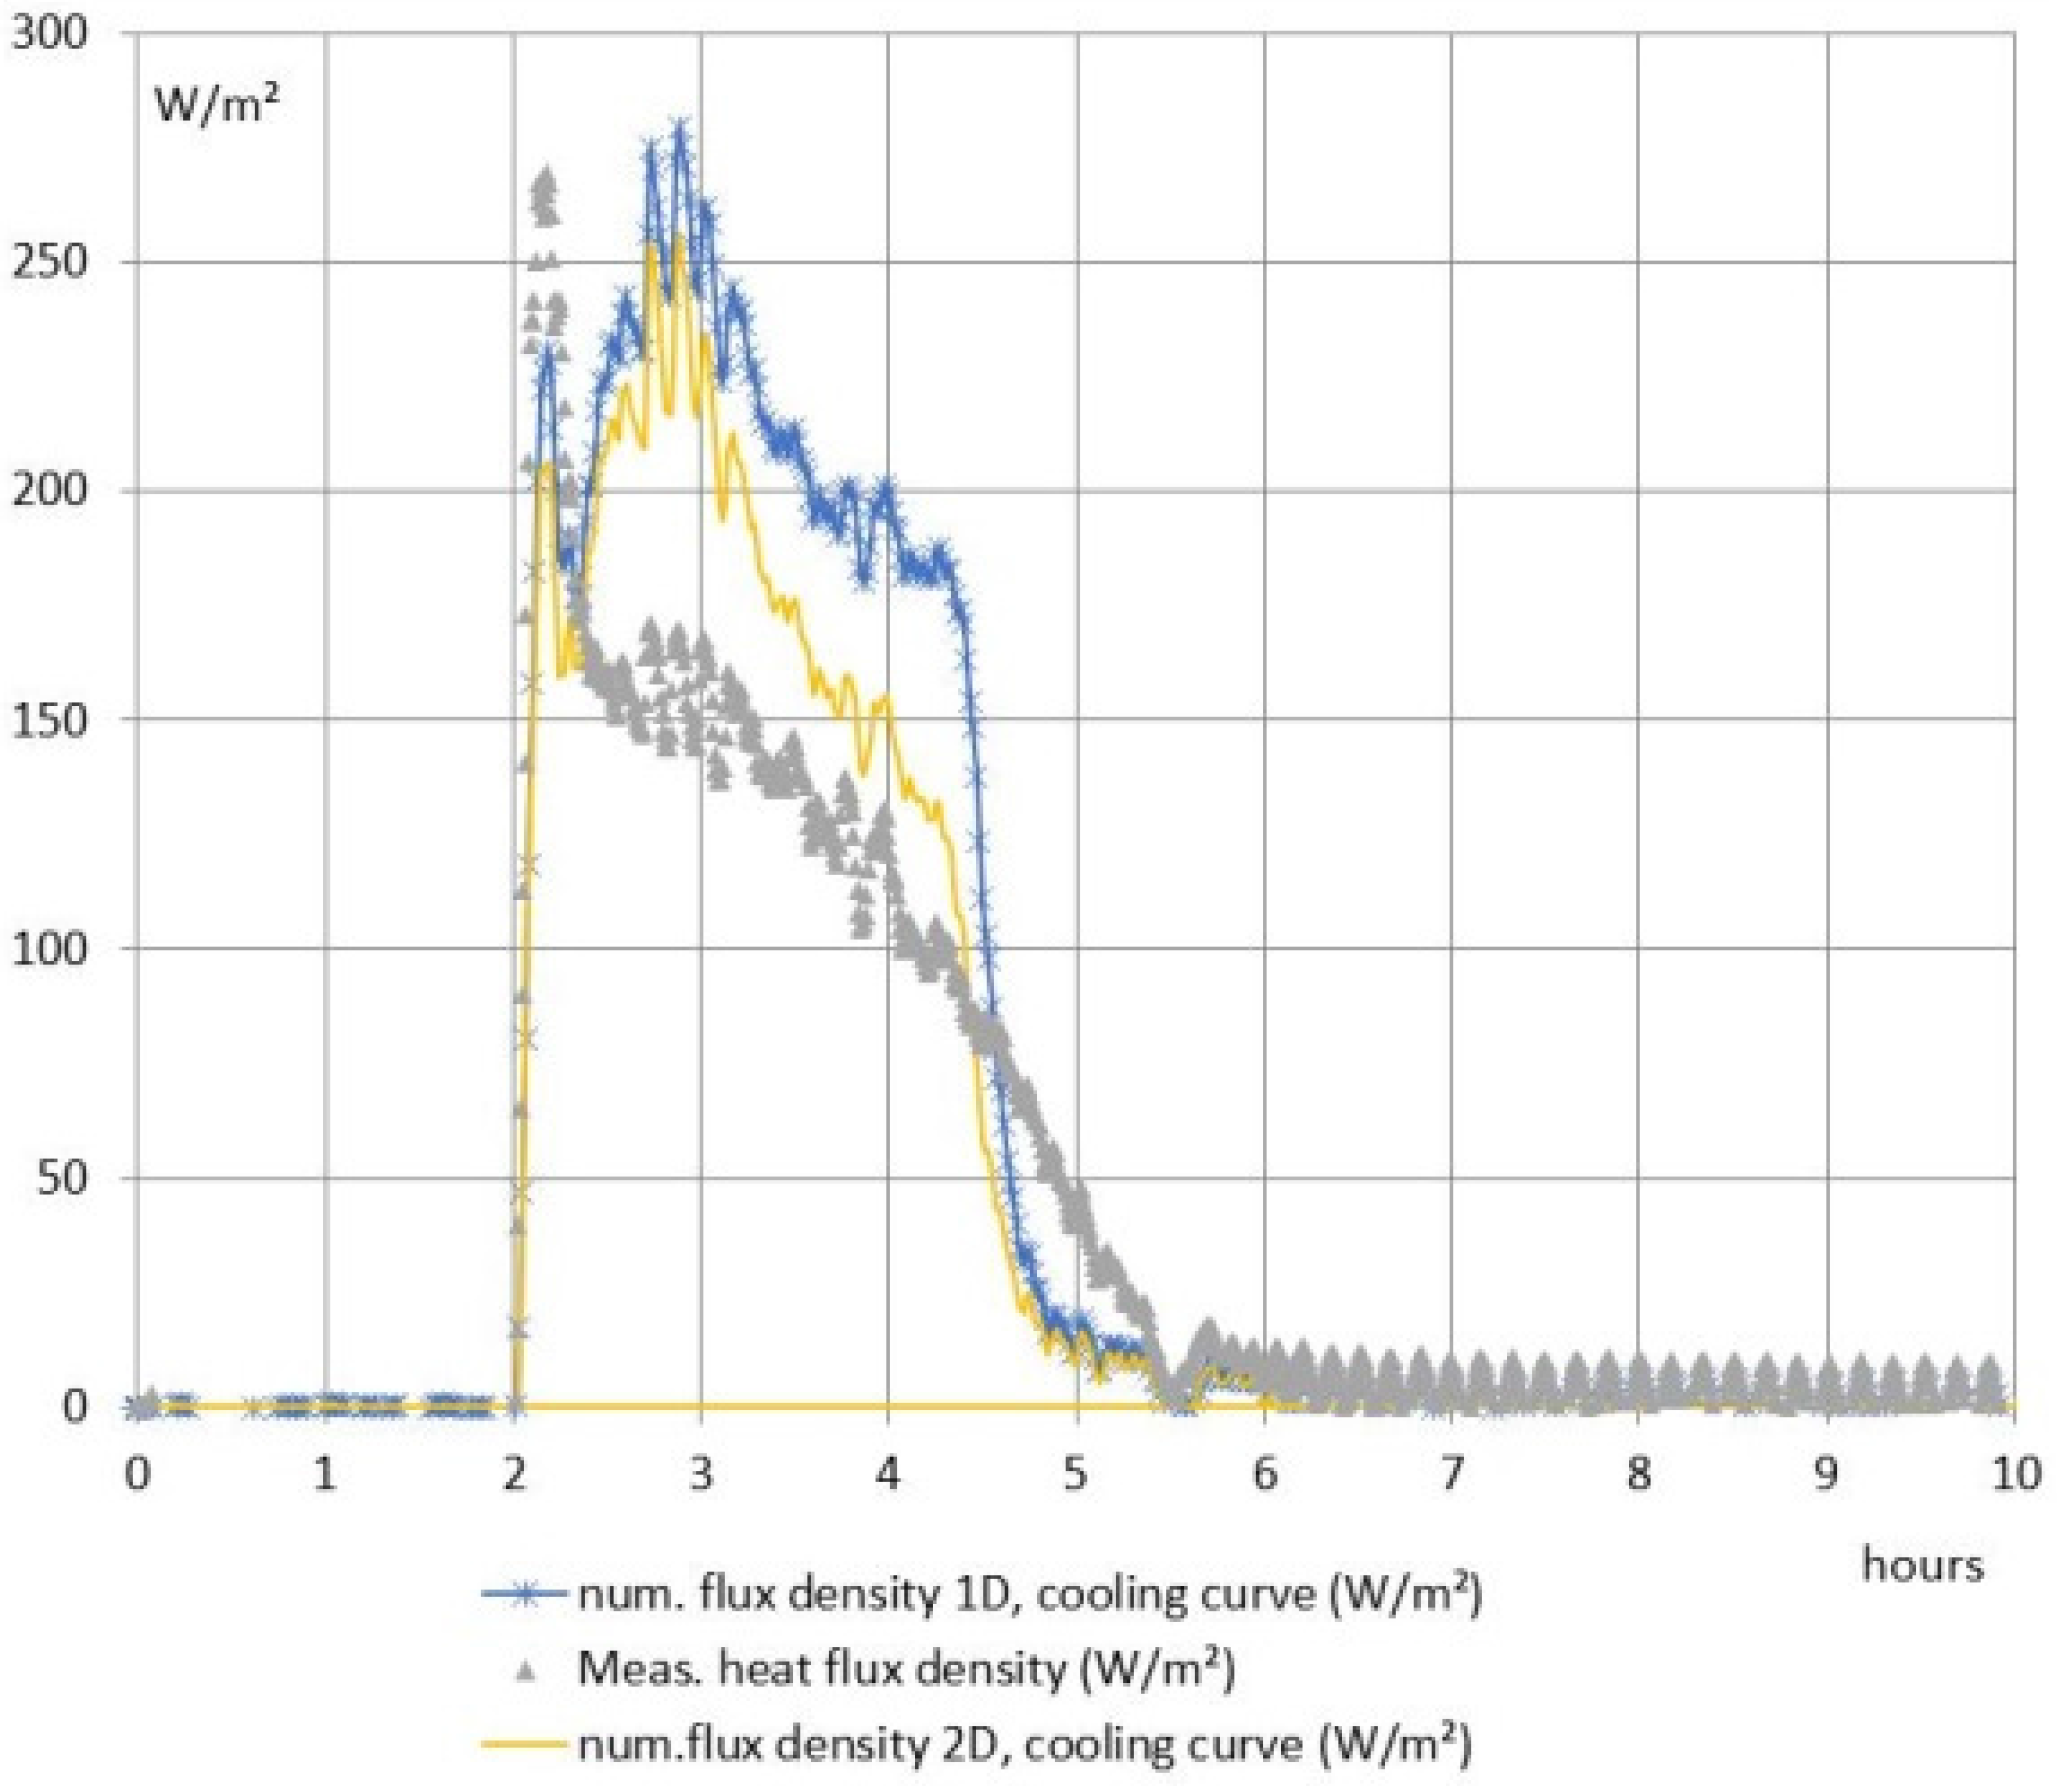
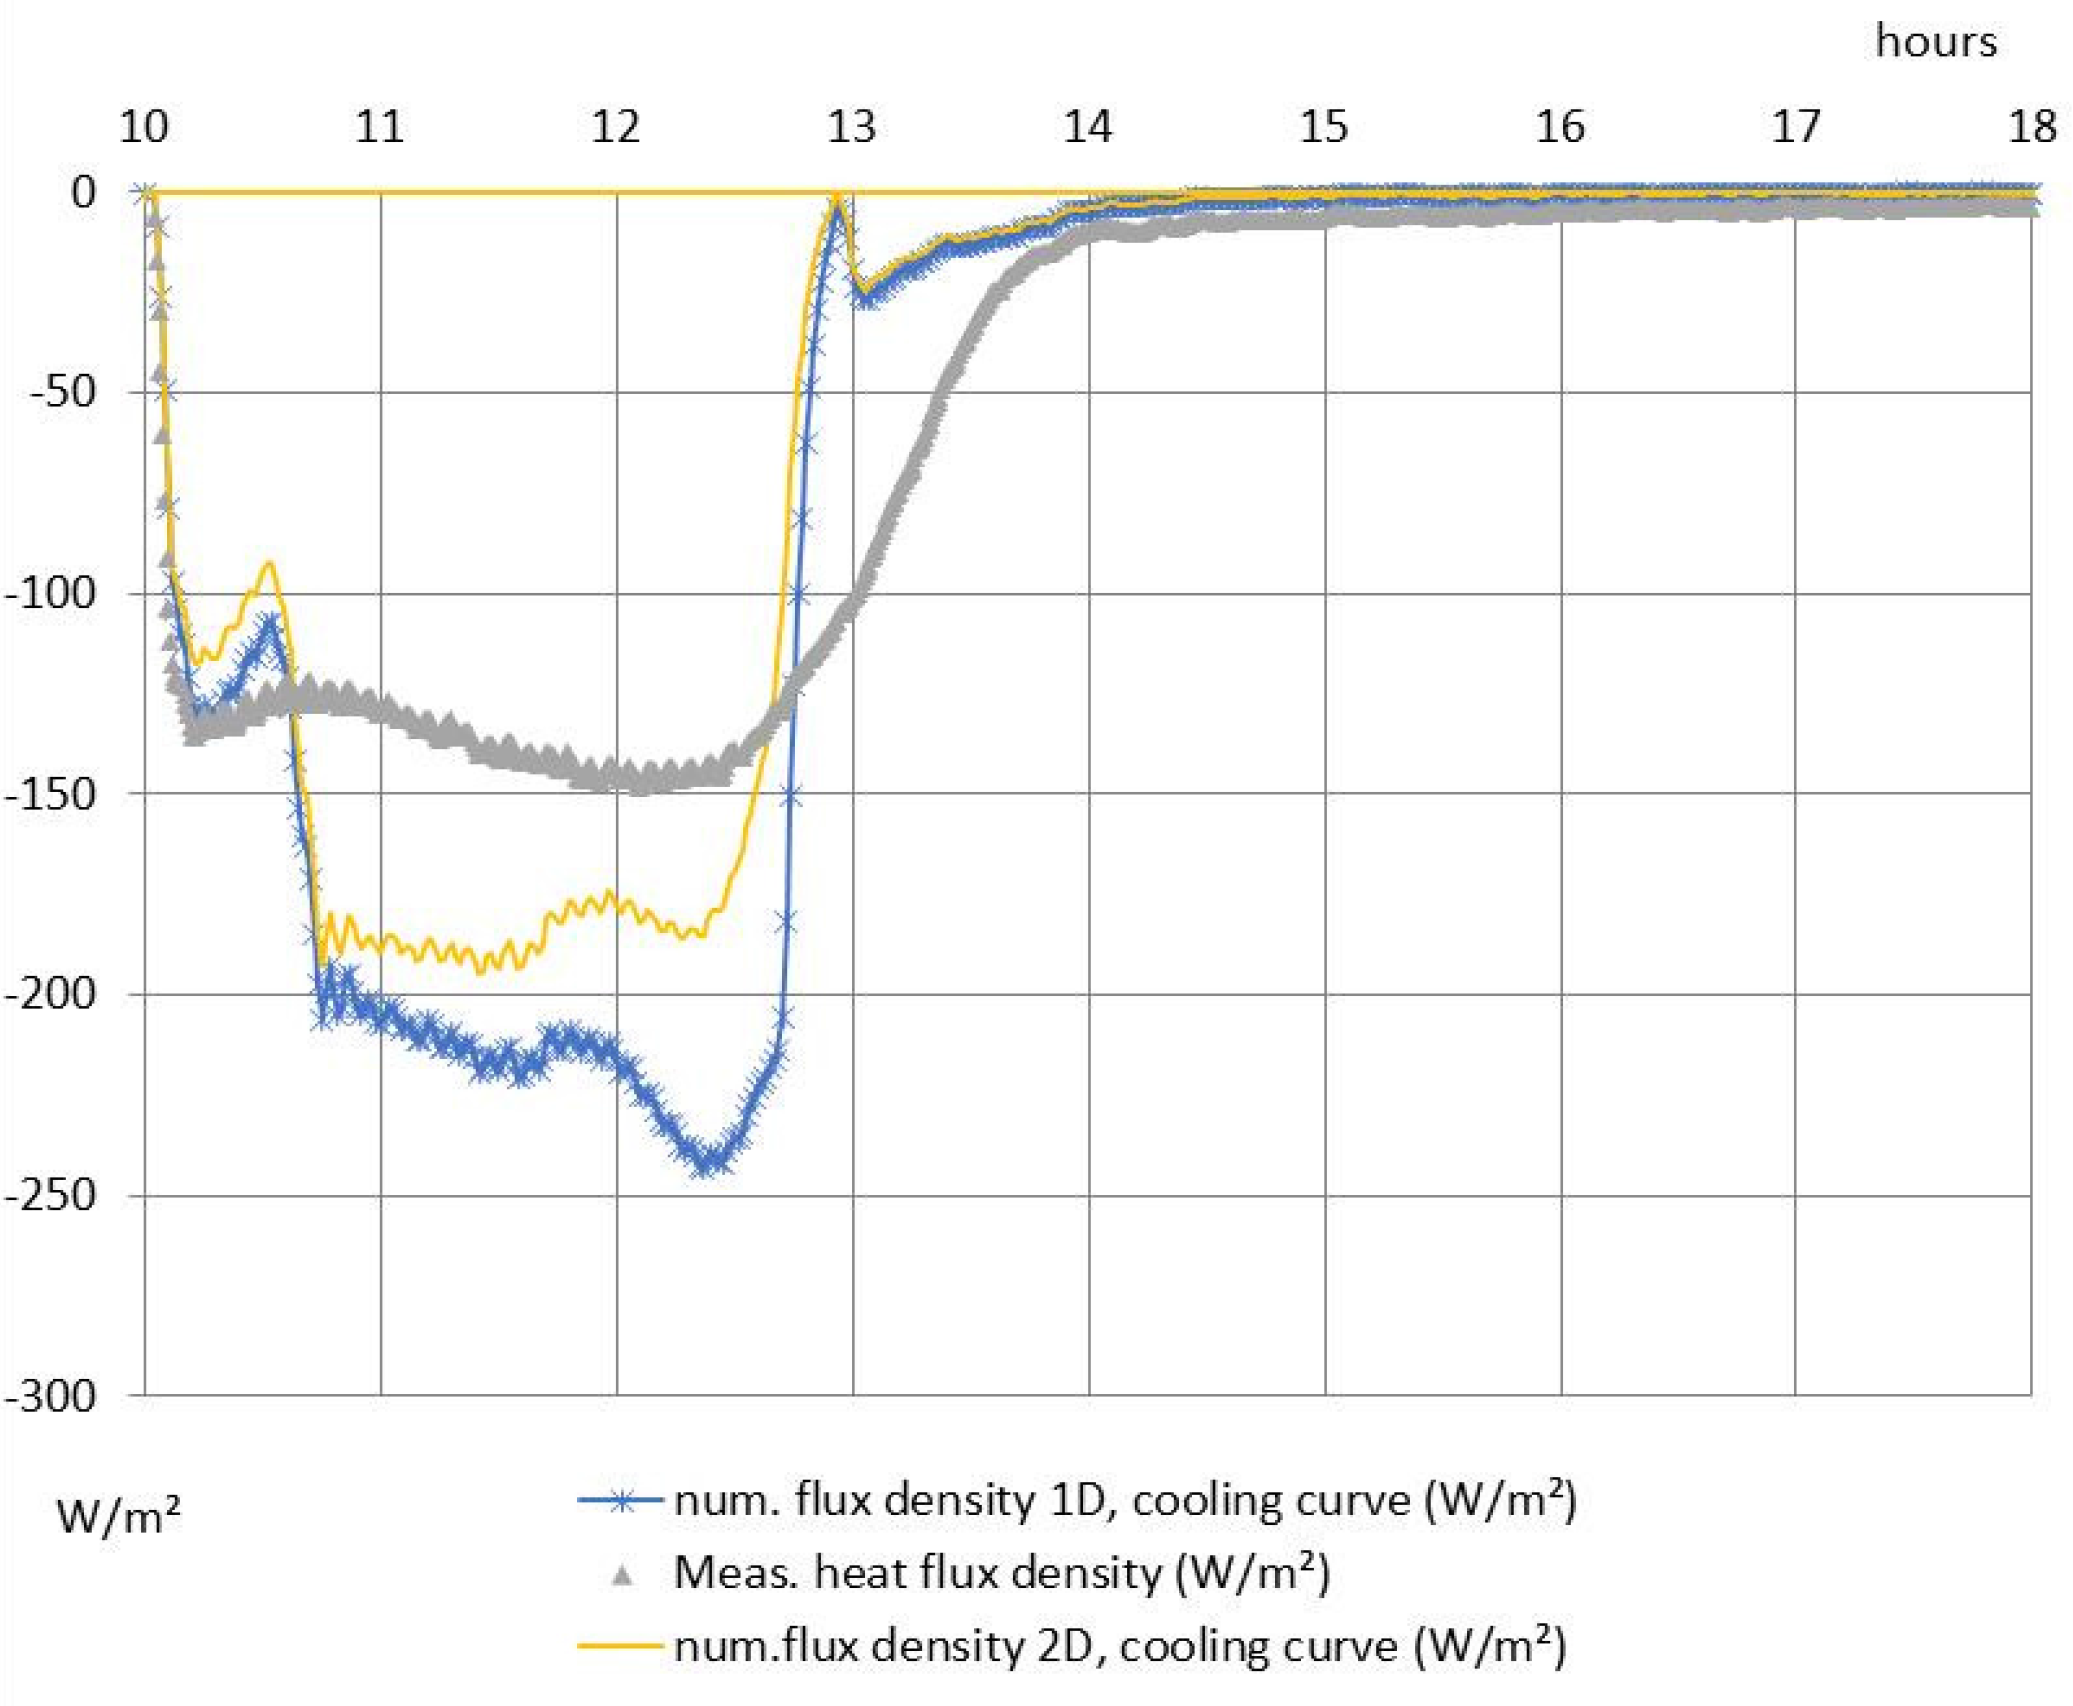
In
Figure 9,
Figure 10,
Figure 11 and
Figure 12 the results of the 1D and 2D modelling approaches are compared to experimental data. For all cases presented, the 2D results provide a better approximation of the experimental data. This observation is attributed to the large difference in conductivity of the PCM and of aluminium components.
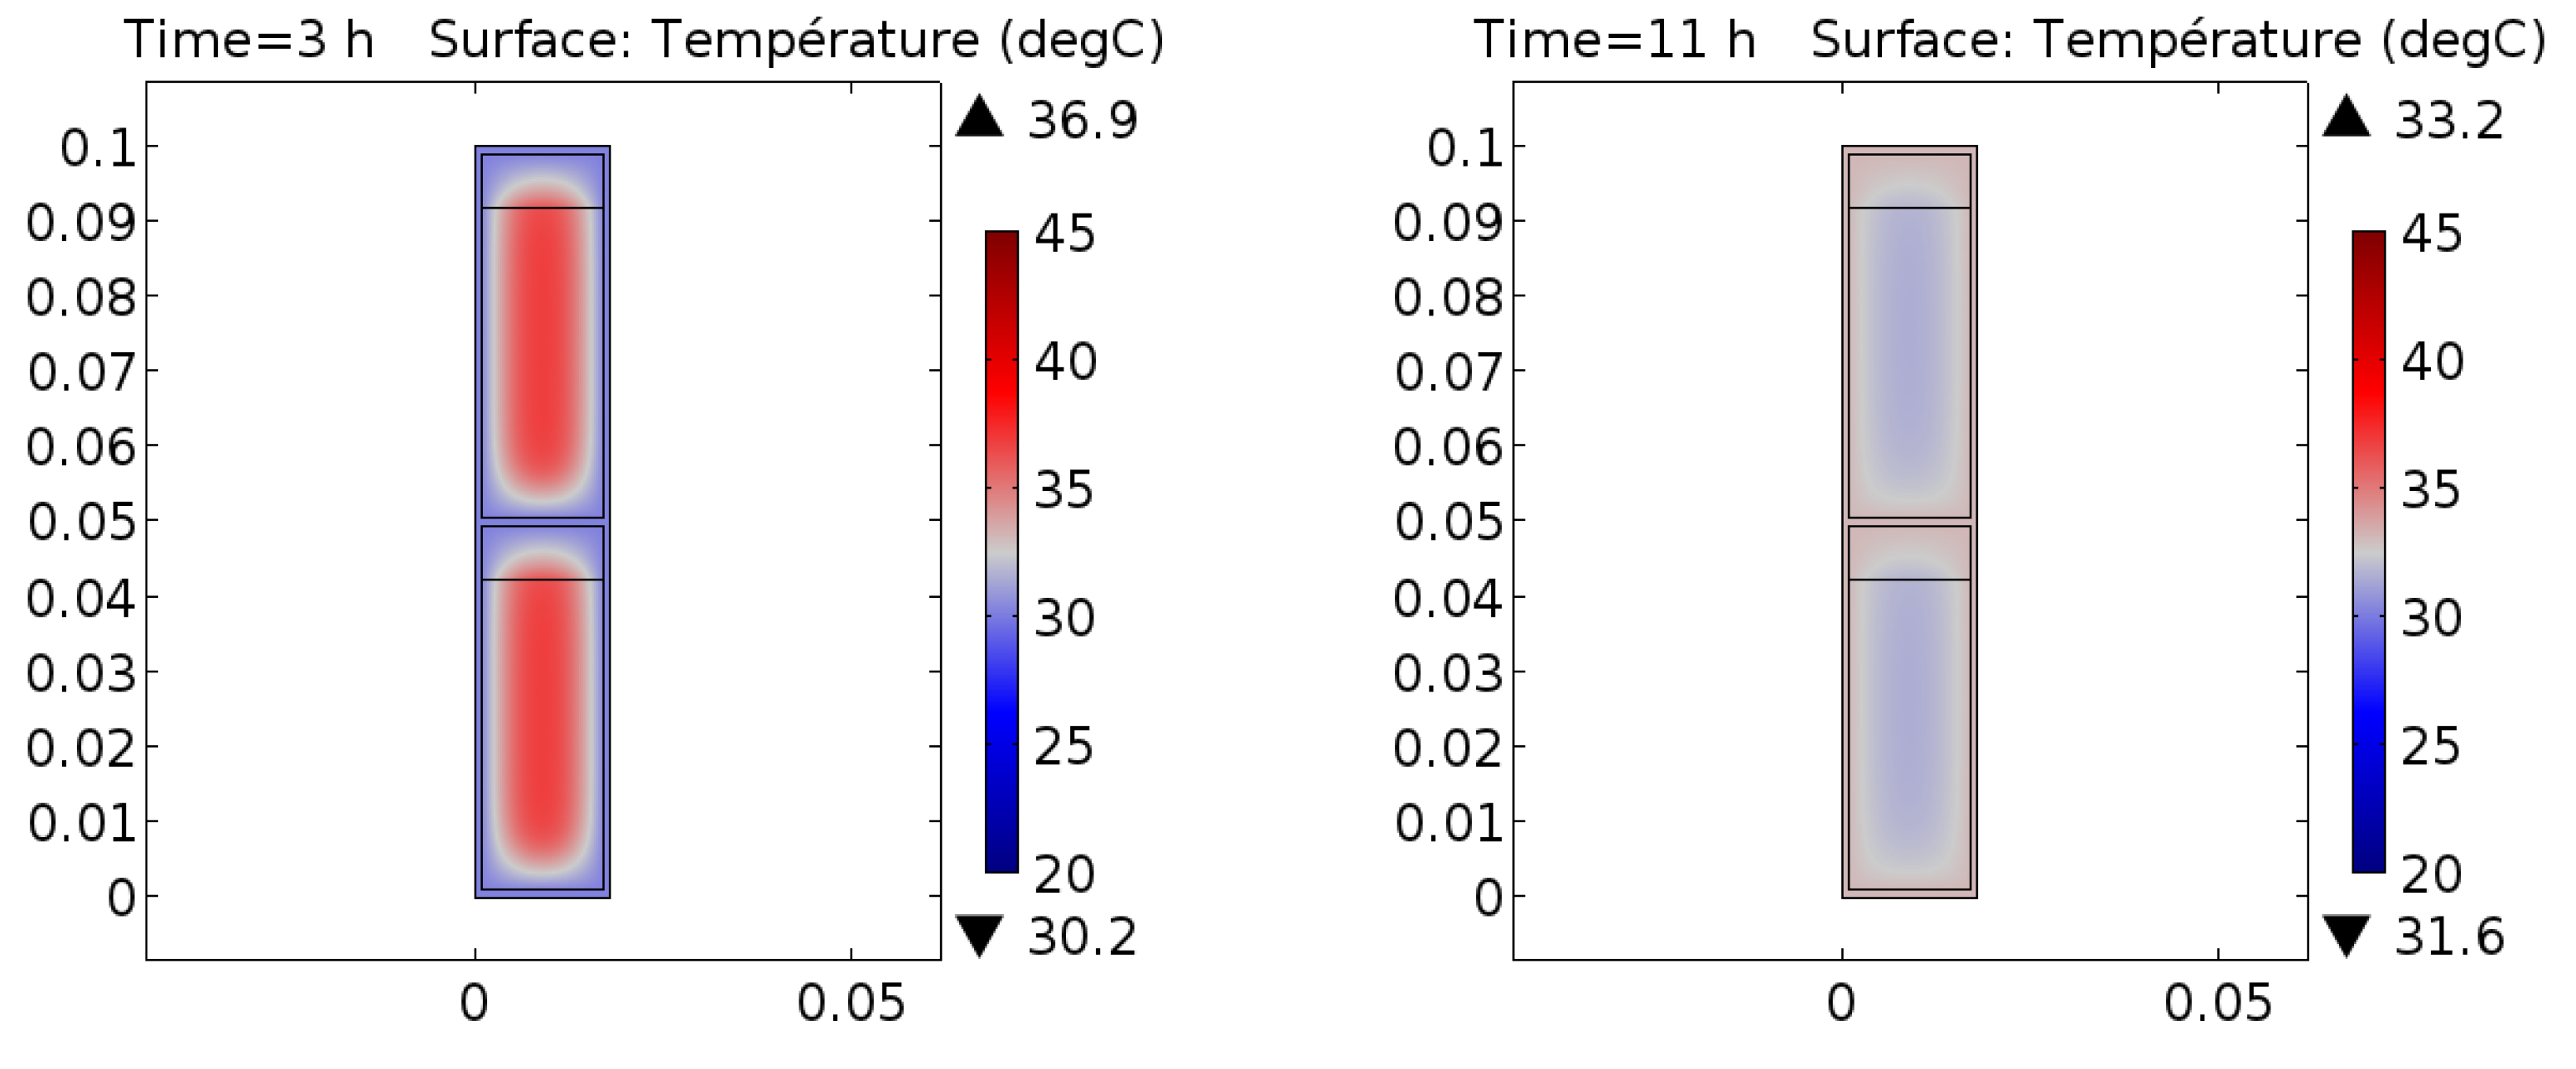
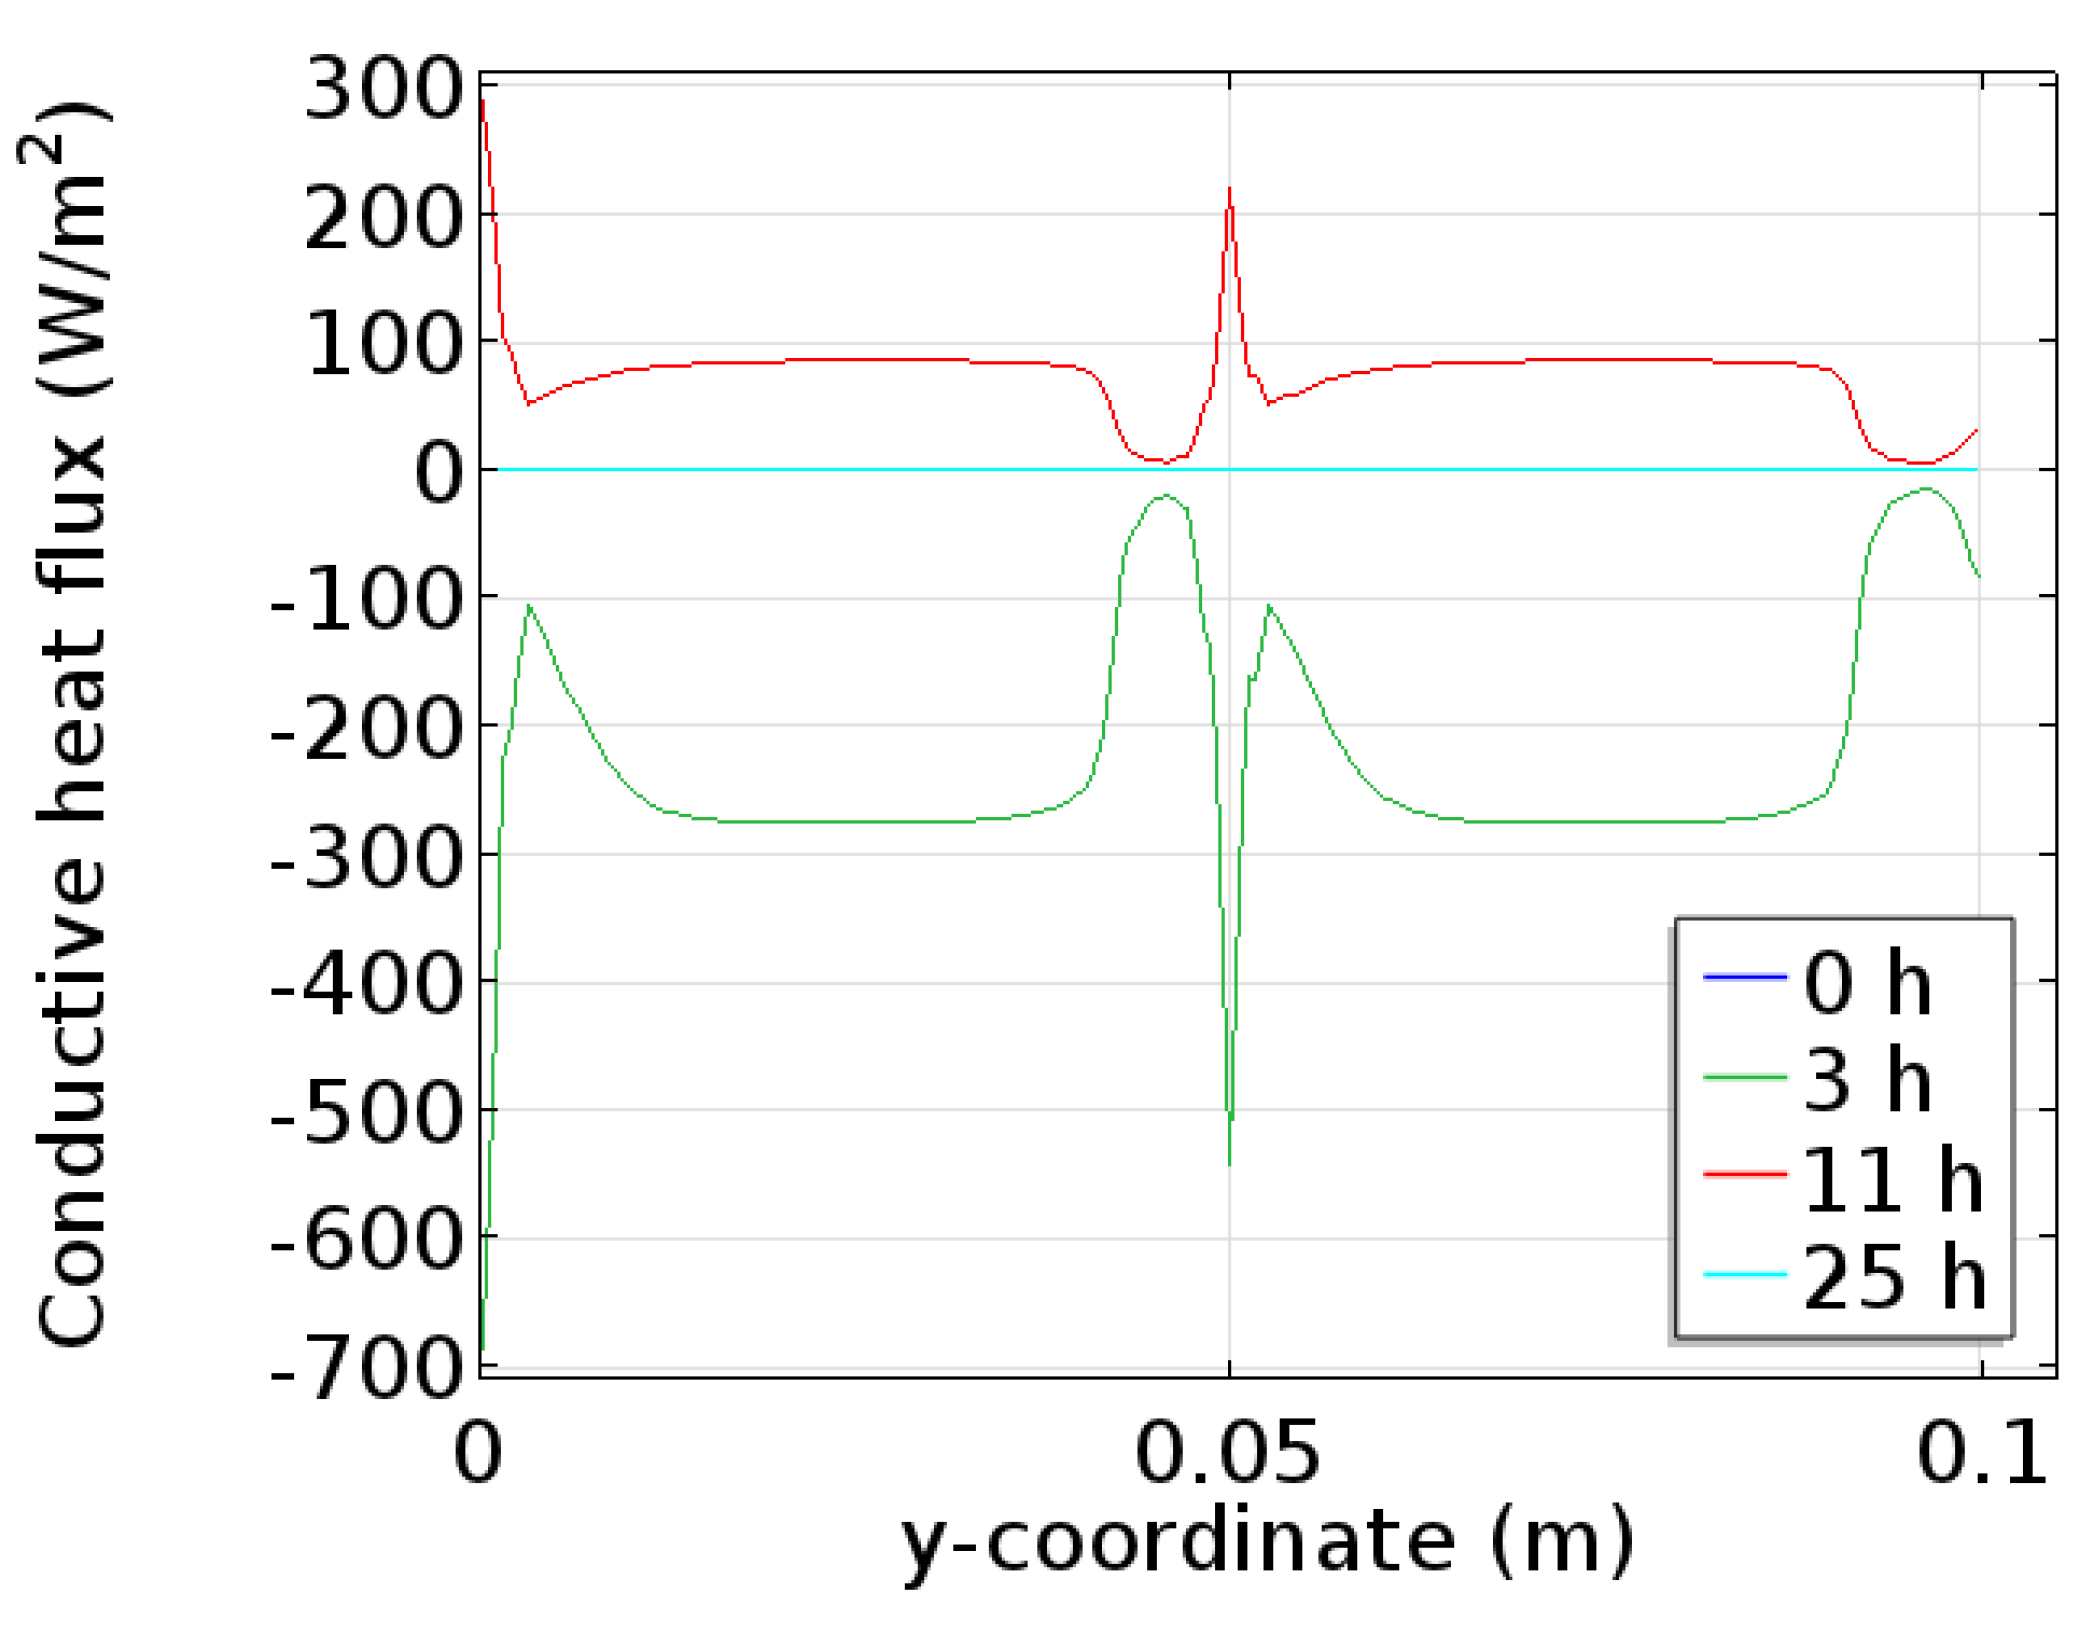
Figure 13 and
Figure 14 illustrate the impact of the aluminium ribs and the air gap in the distribution of internal temperatures and surface heat flux density. During the solidification mode, the aluminium ribs are found to increase the mean flux density by a factor of 2 or 3, some 3 h after the start of the trial. The air enclosures, because of their low thermal conductivity, serve to reduce the exchanged flux density.
4.3. Analysis of Temperature at the Centre of the Container
For this measure, 1D and 2D models are found to offer similar predictions. For the 2D model, the reported temperature corresponds to the middle of the cavity, near the centre of PCM, and because of symmetry, no noticeable difference is observed with the 1D result.
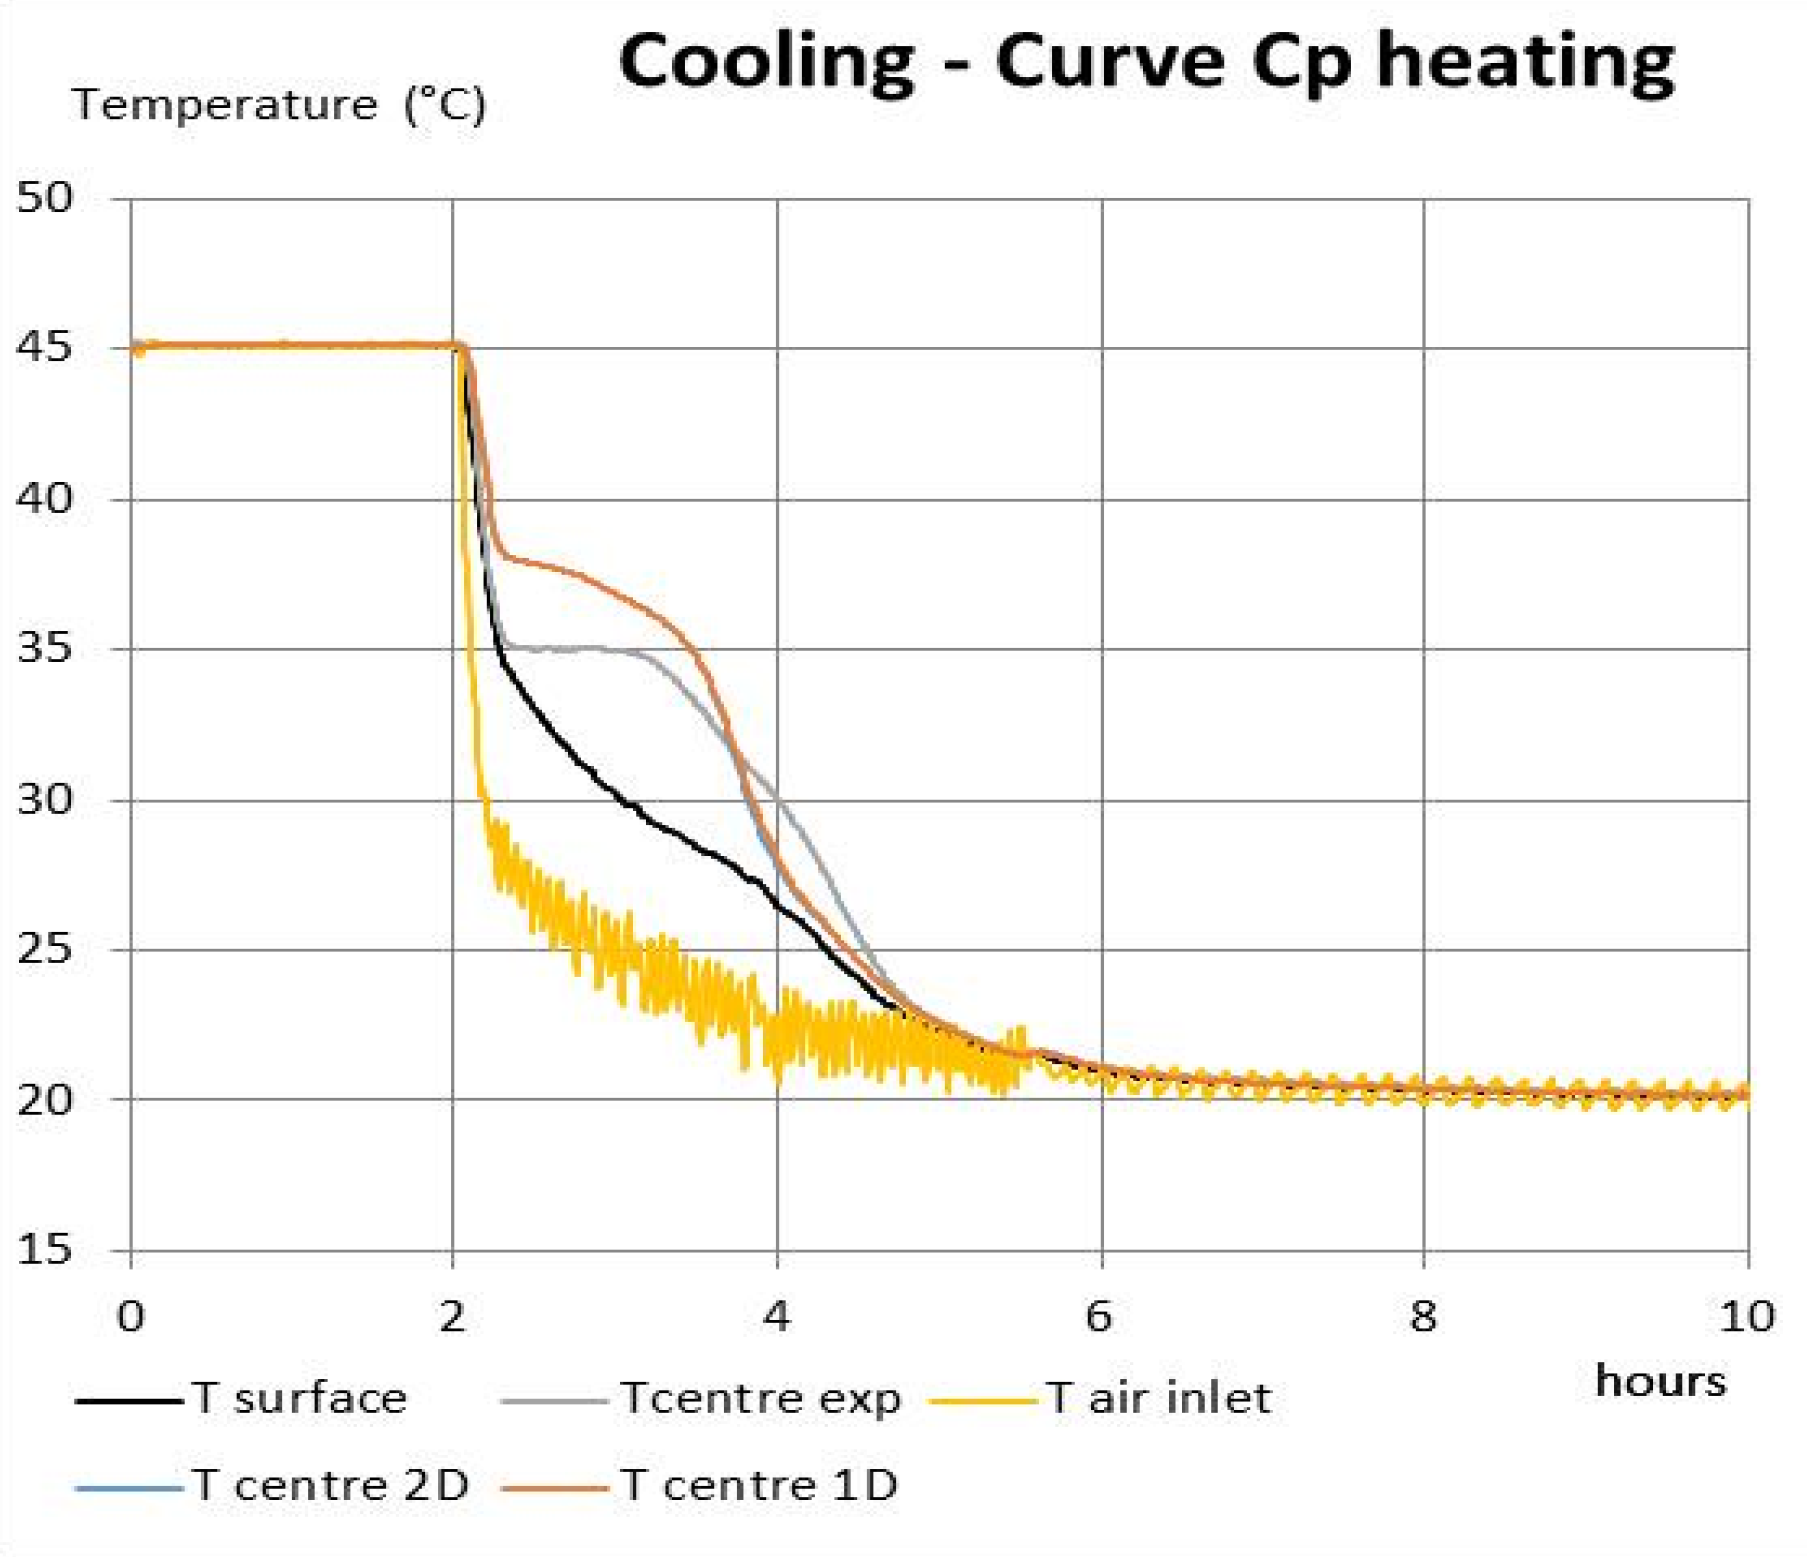
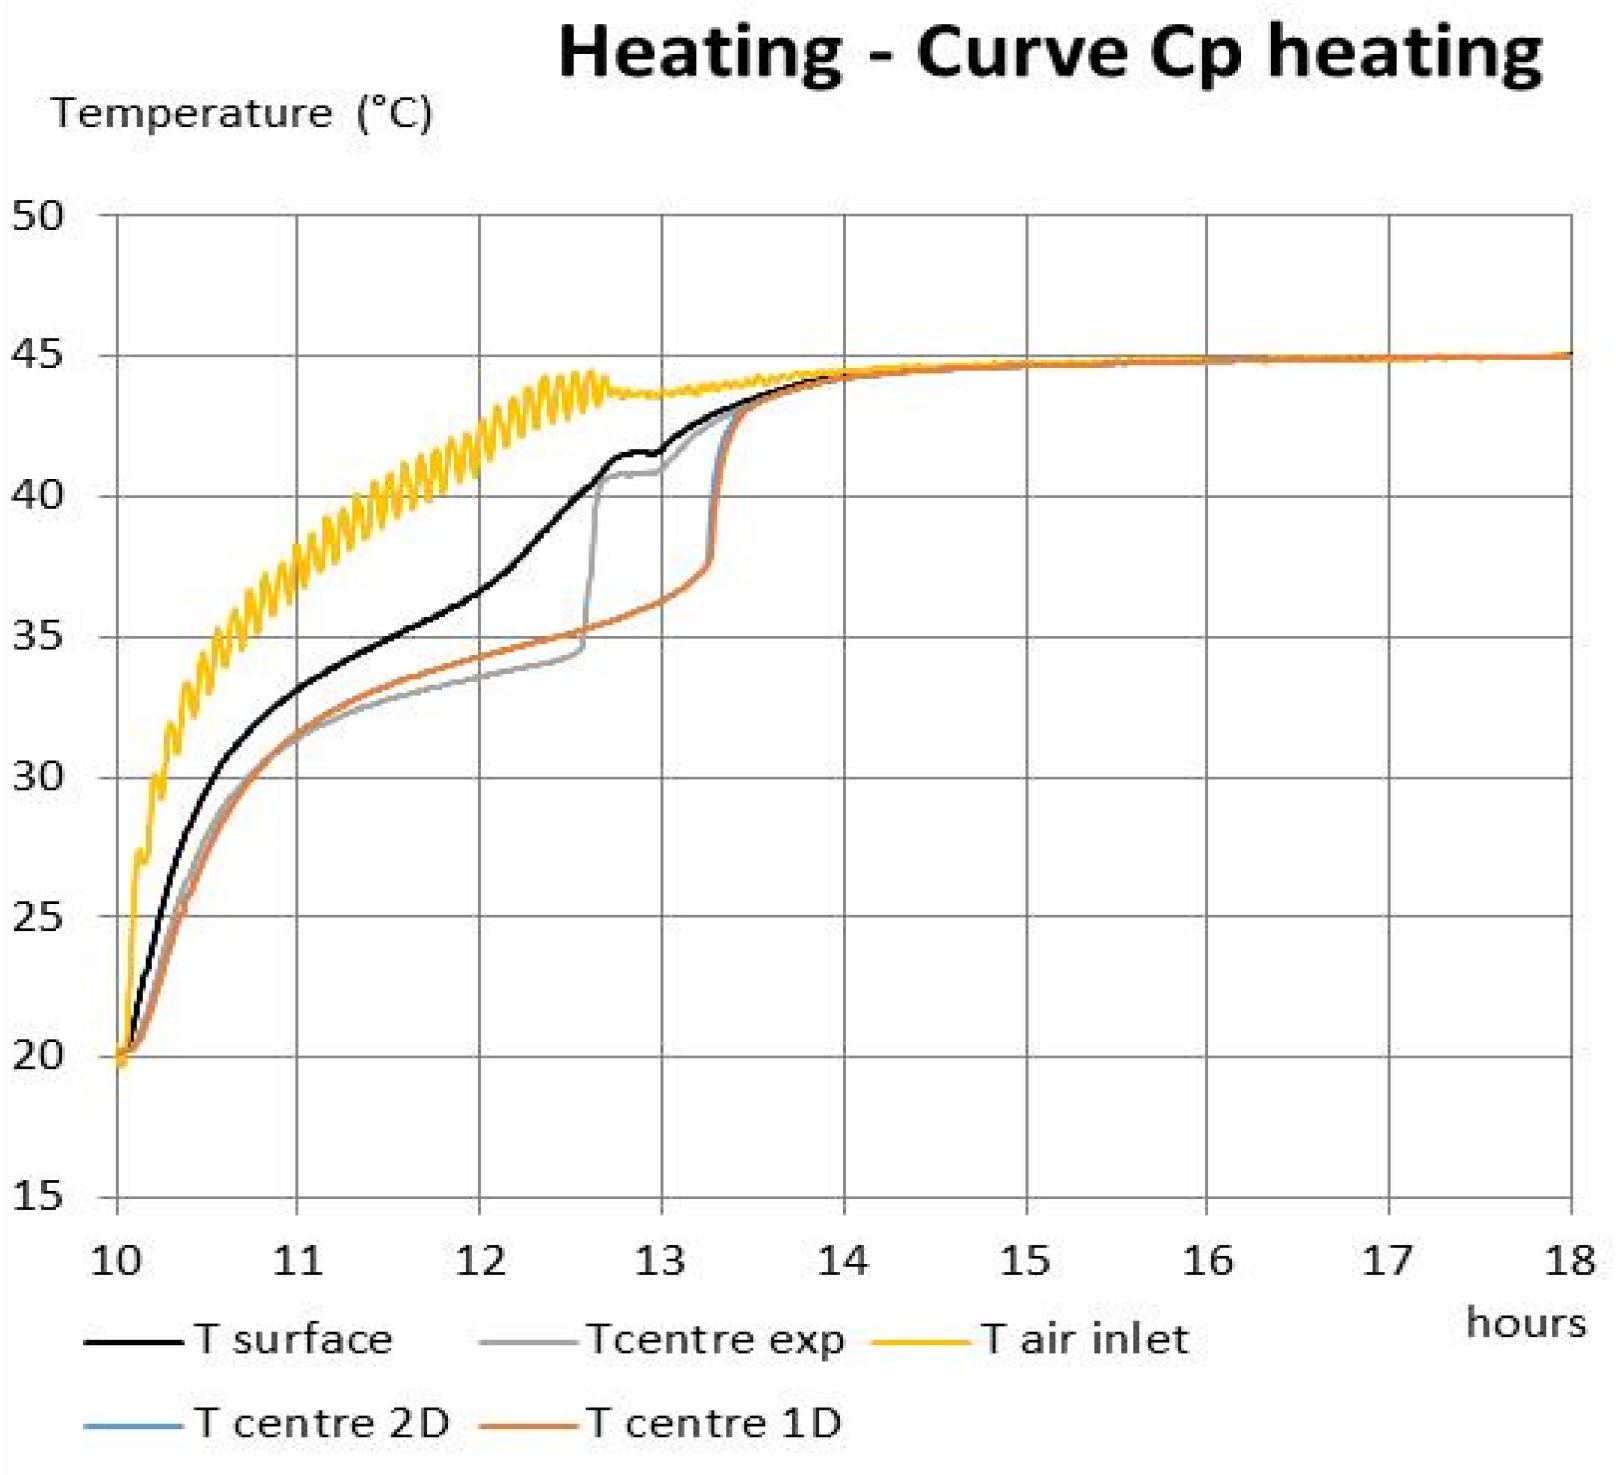
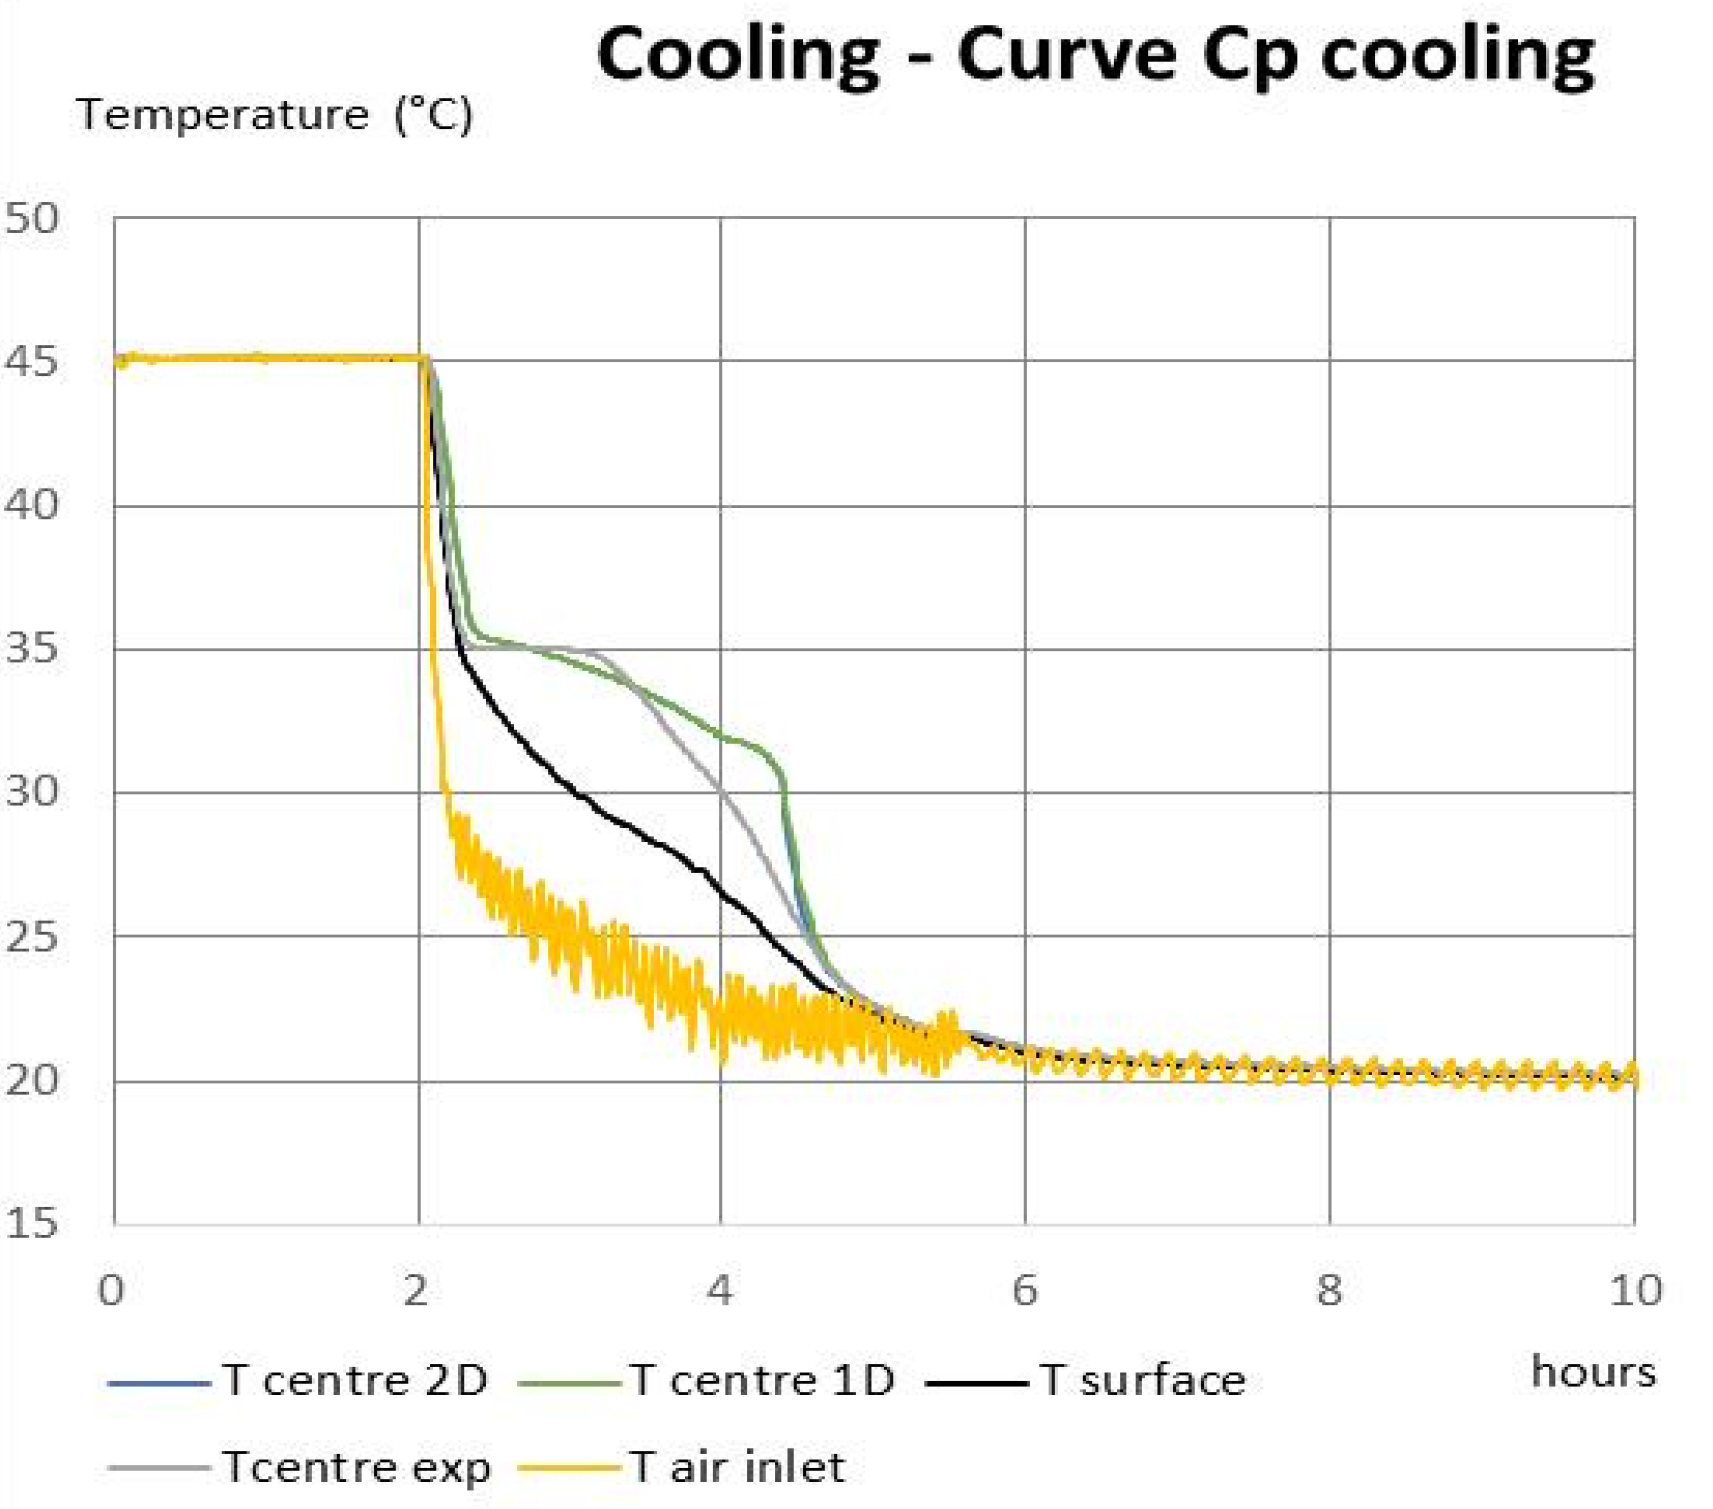
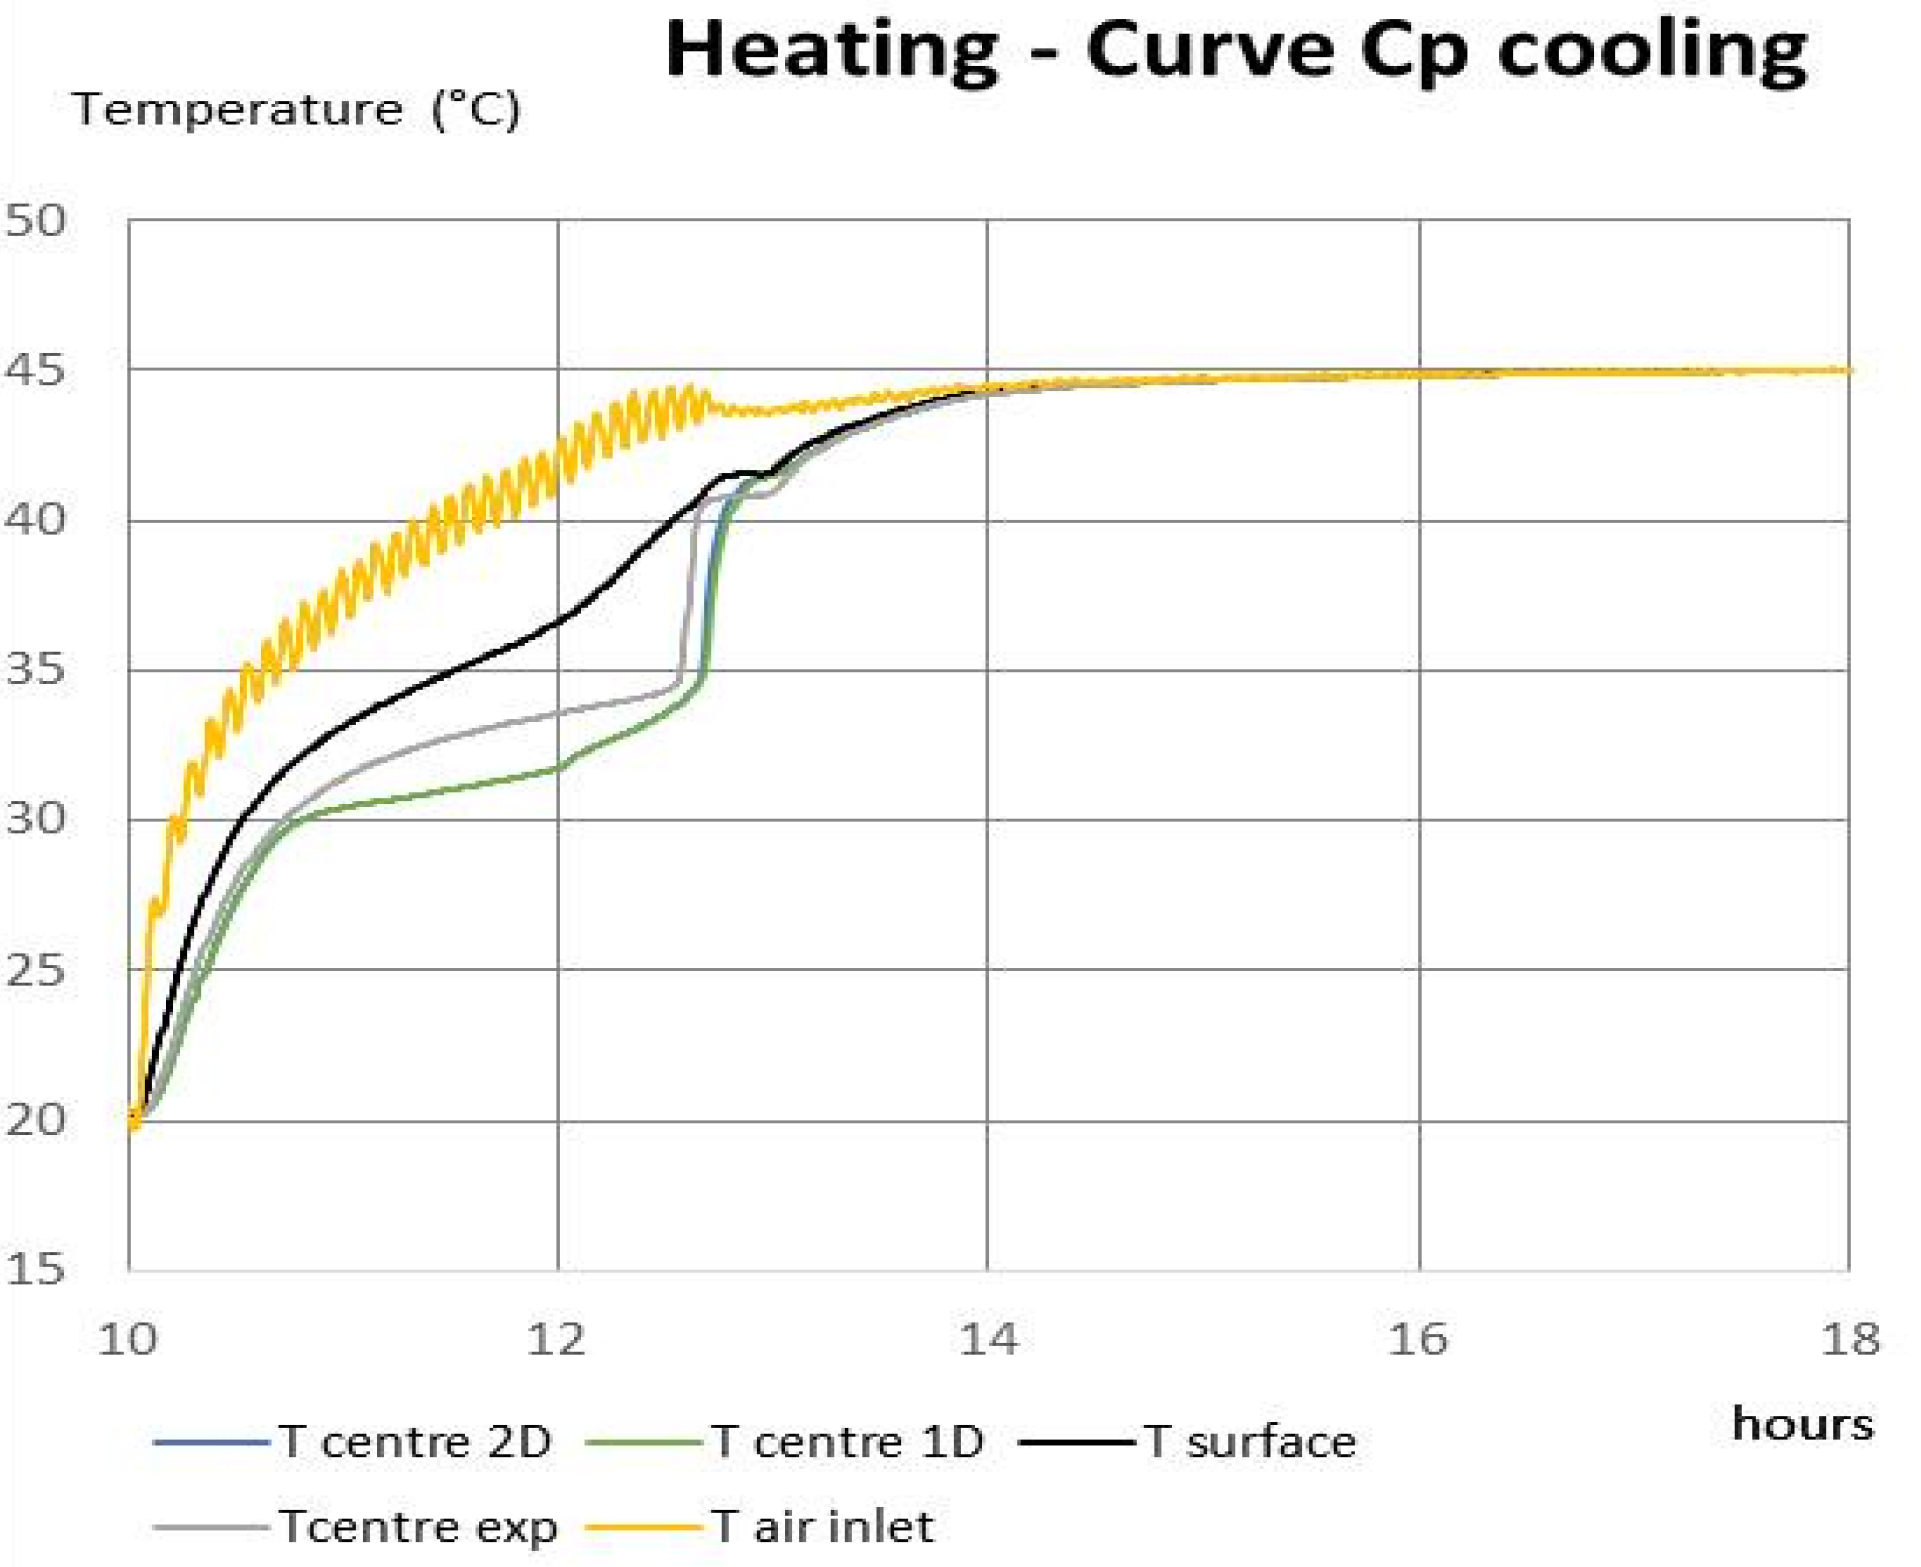
In
Figure 15,
Figure 16,
Figure 17 and
Figure 18 show, for experimental temperature evolution at the centre of the PCM steps for 35 °C and 32 °C for cooling and 34 °C and 40 °C for heating: this can be explained by the two peaks observed in the DSC curves. For the most part, the numerical results differ only slightly from the observed behaviour, with marginal improvements depending on whether the cooling or heating curve of
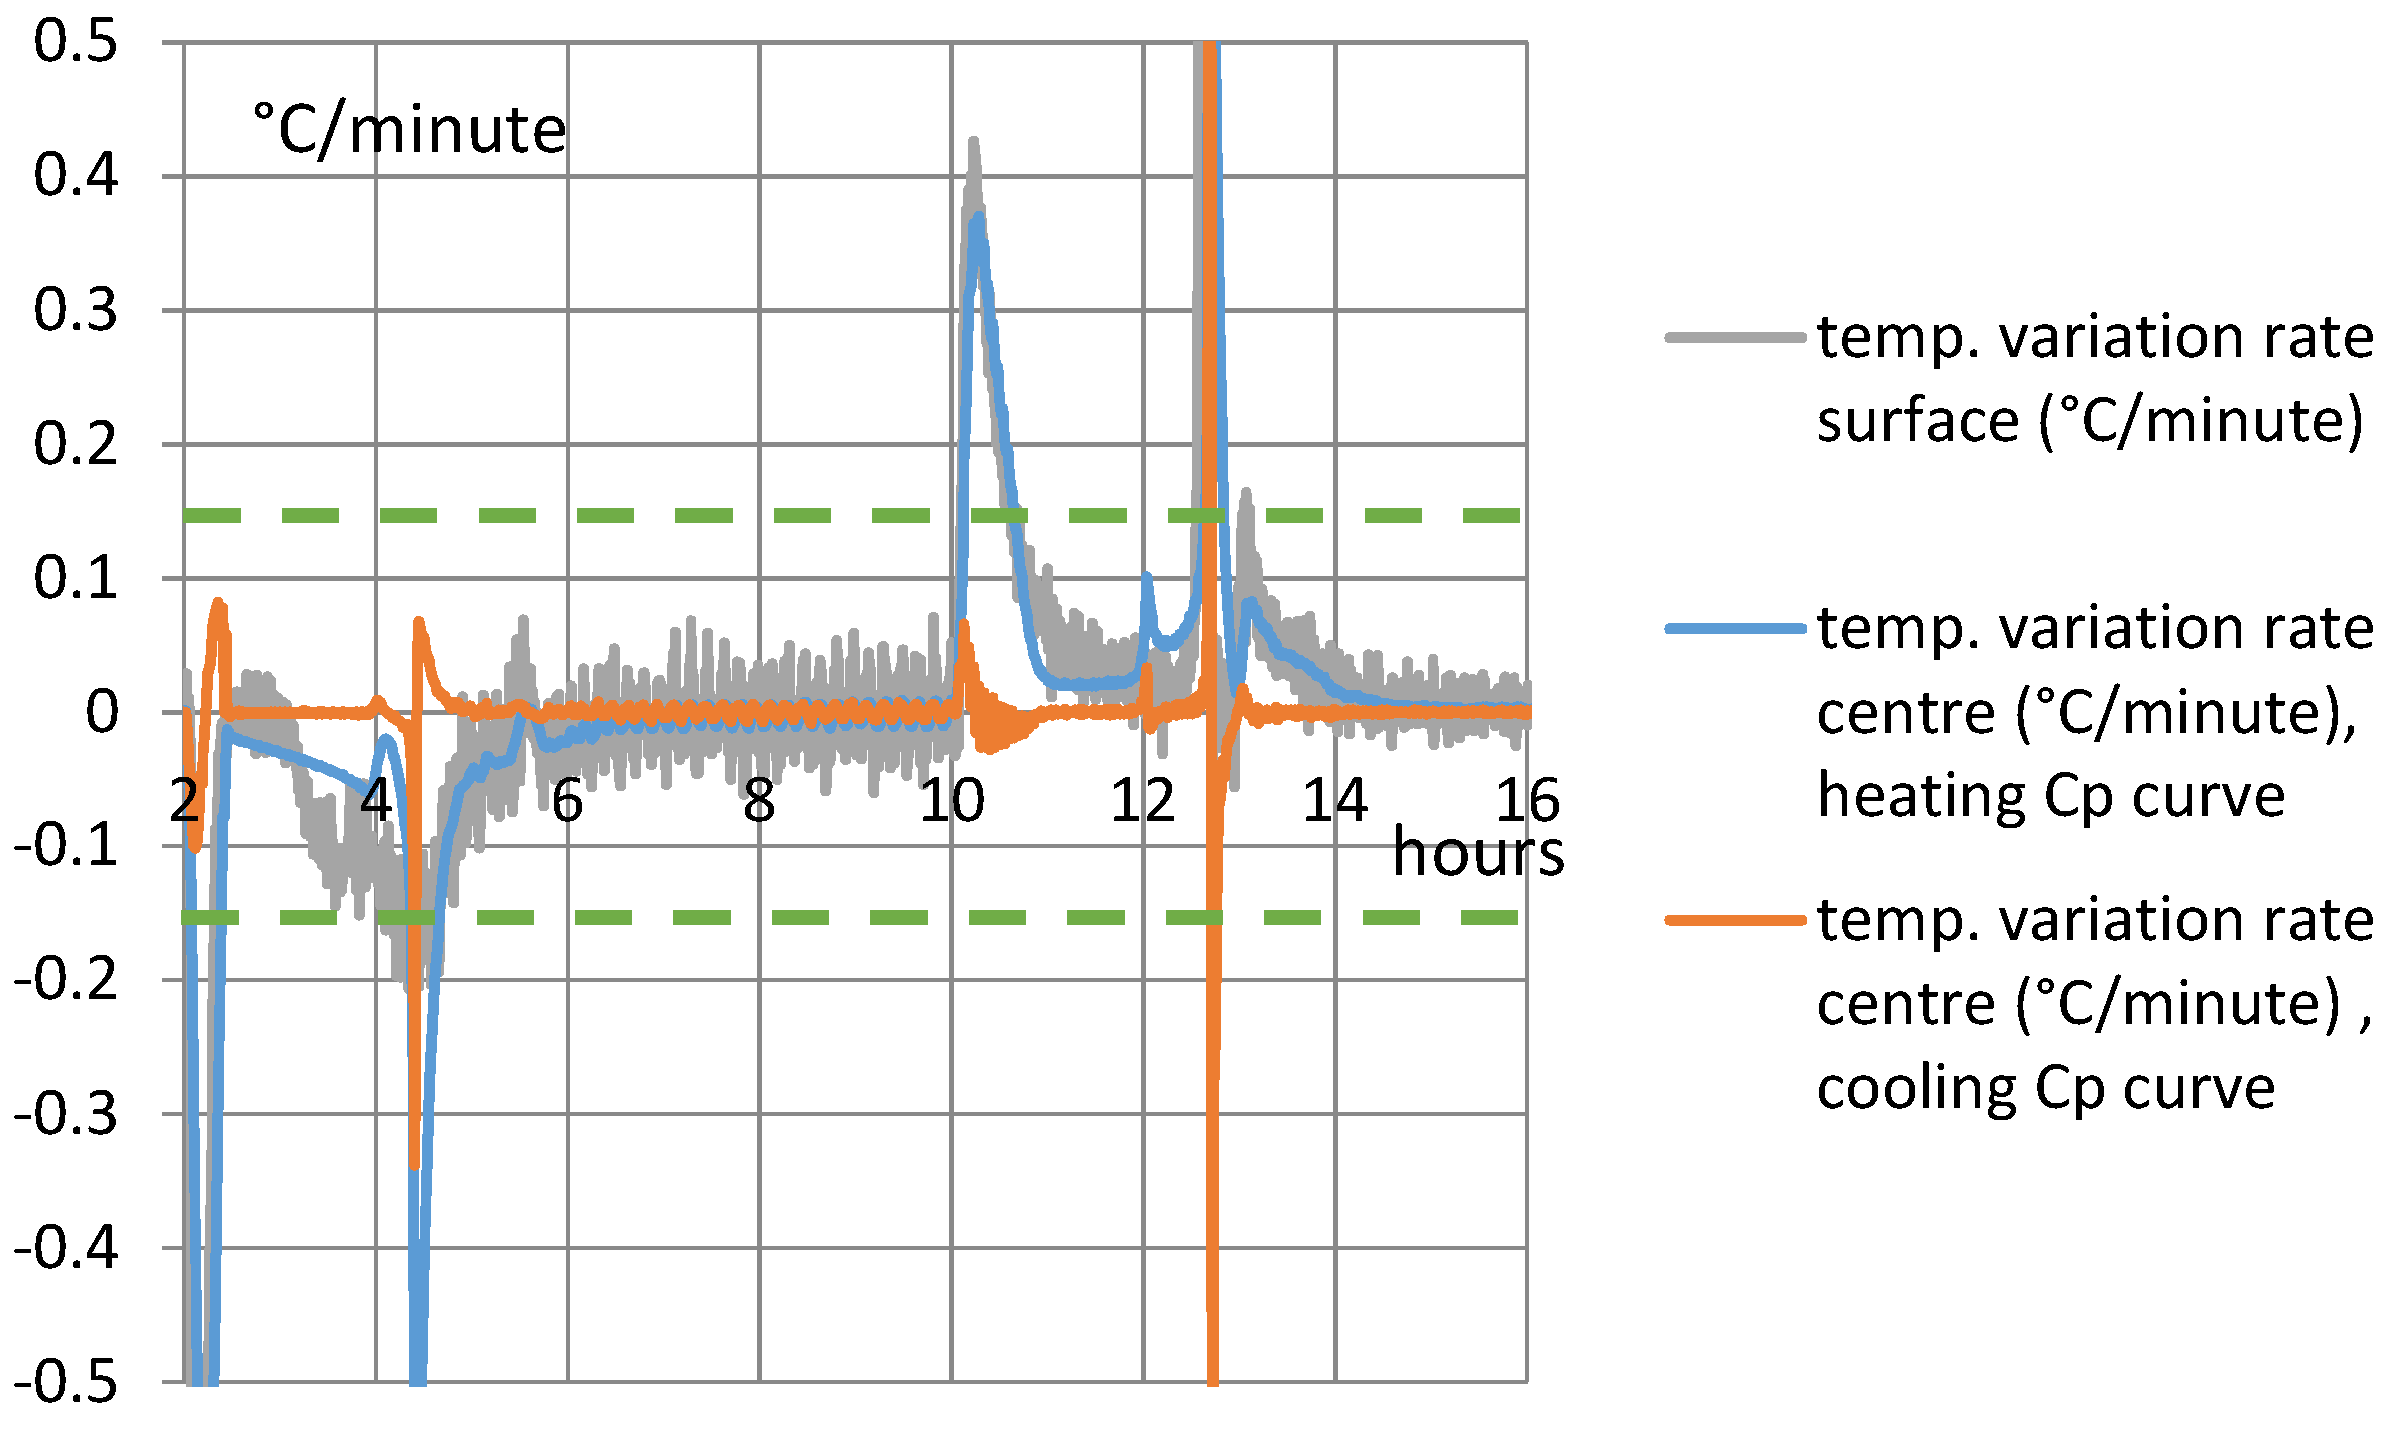
cp has been used for the calculation. In
Figure 19 the rate of temperature change is present at two points in the PCM: at the surface and at the centre of the container (for the two 2D results). The temperature of the PCM was assumed to lie this range.
Intervals of ±0.15 °C/minute shown by dotted lines in the figure indicate the rate used for the DSC characterisation of cp for cooling and heating. Clearly a much large rate is observed at the start of surface temperature change and during the onset of phase change. These peaks last less than 30 min each and the model seems to give satisfactory results. At other times, a much lower rate than 0.15 °C/minute is observed, and for very low variations, the two DSC curves should coincide. The low rate indicates that the cp value in the model is thus an underestimation during this period of low variation, and it explains that the solidification (and melting) is delayed.
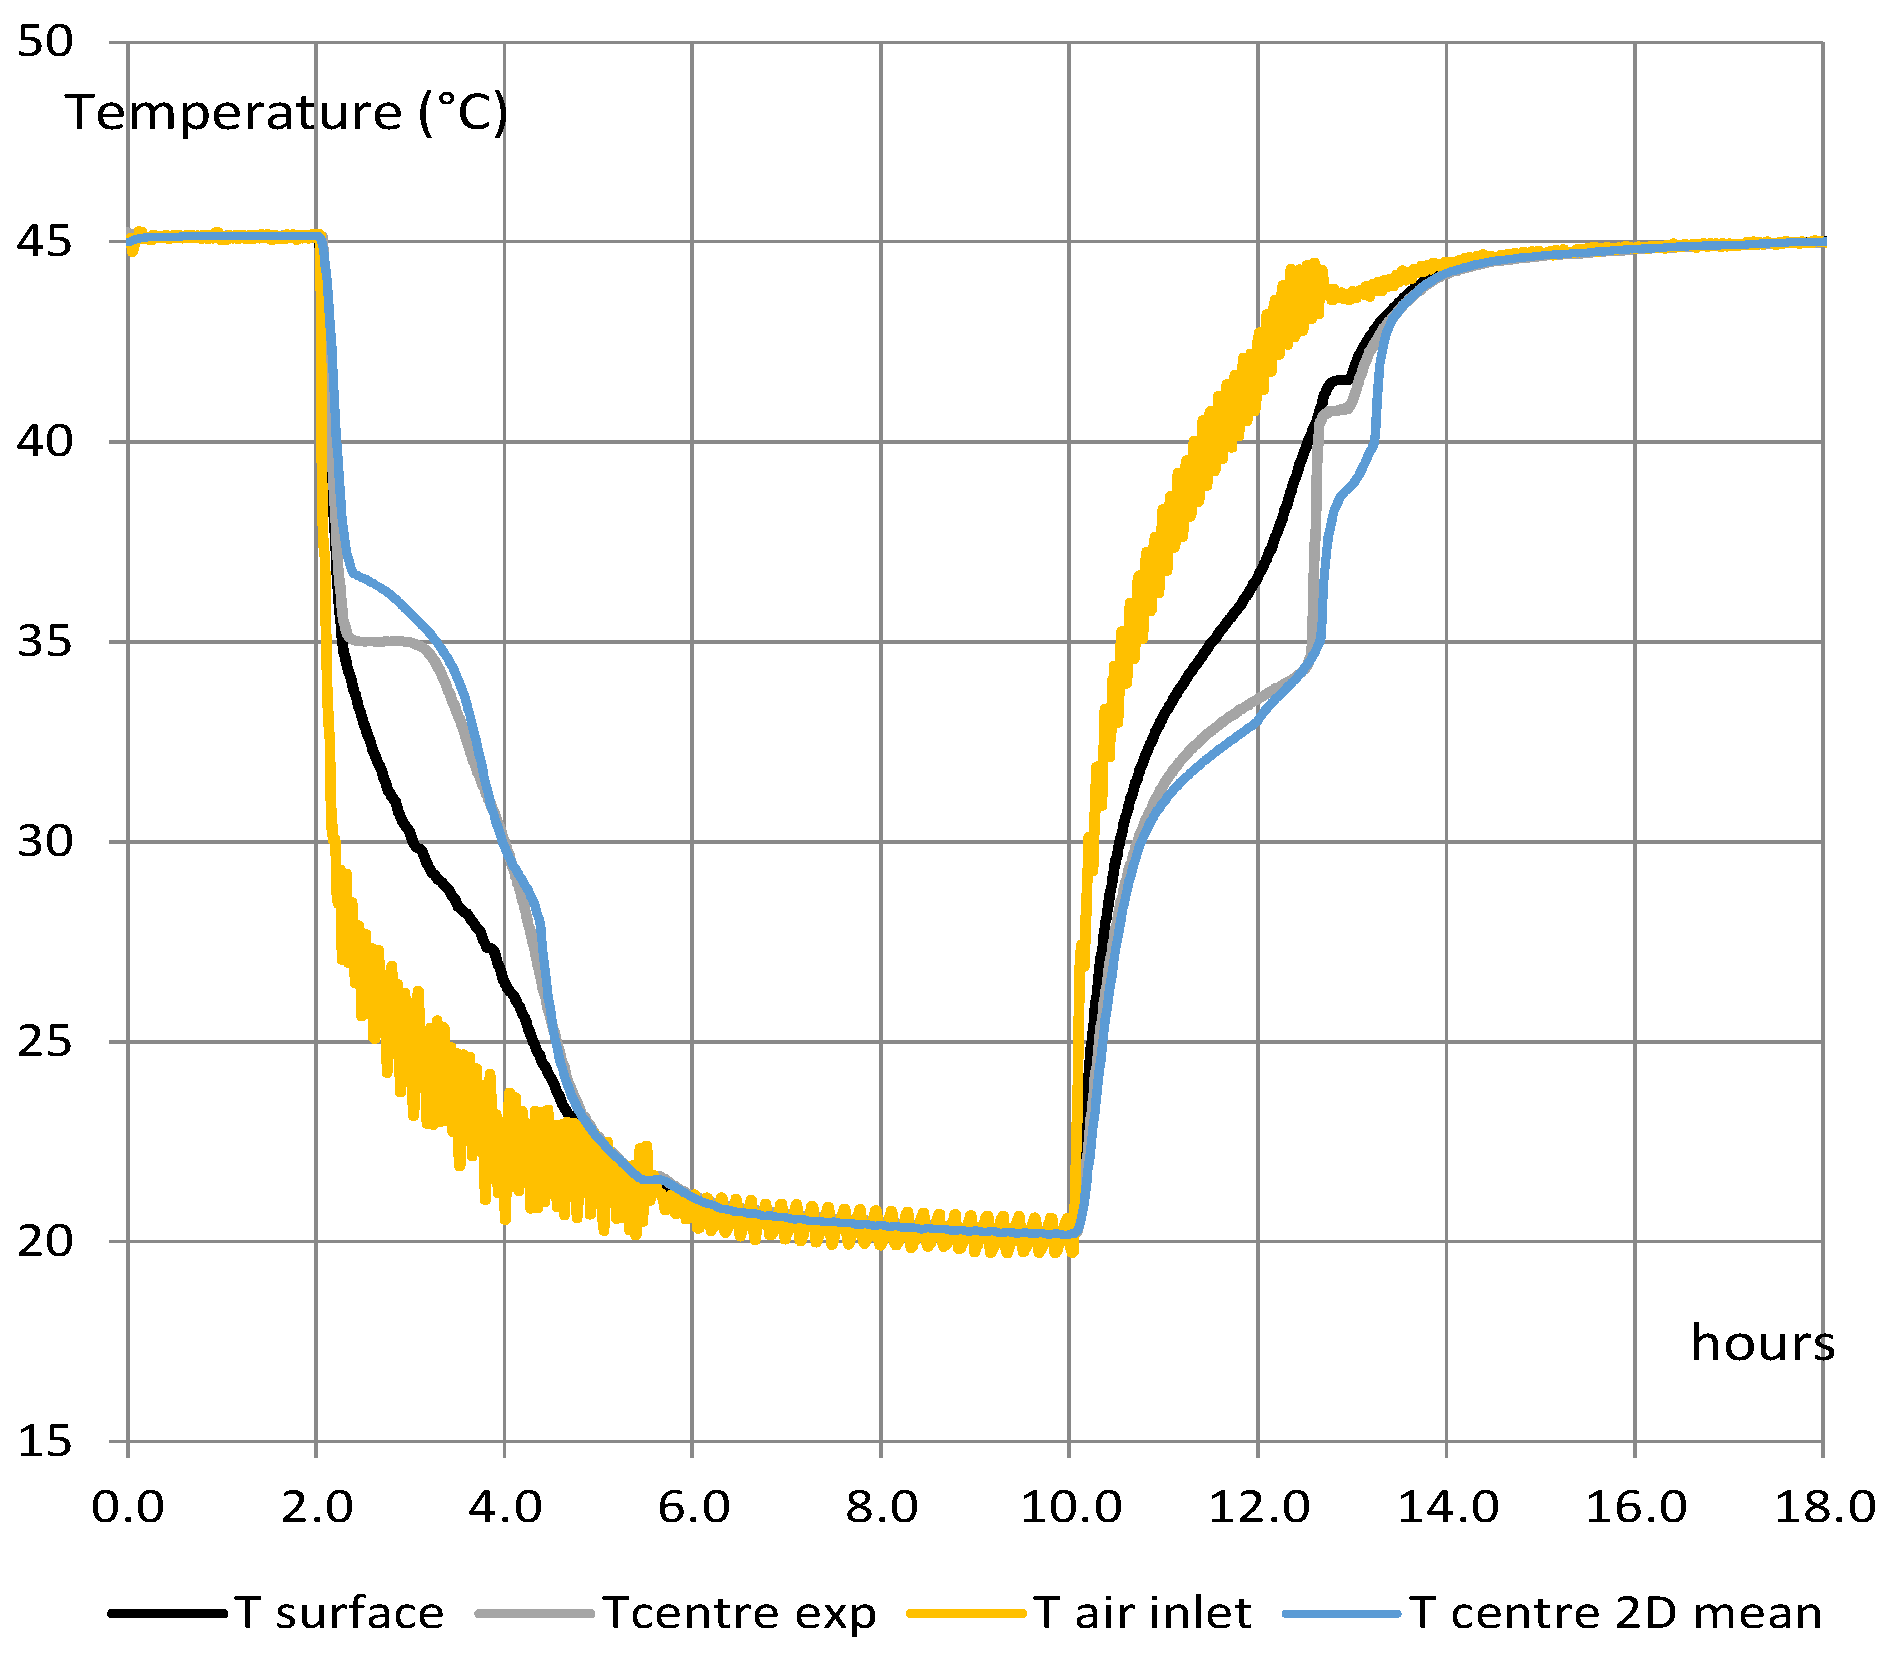
A solution to this discrepancy is thus to consider the mean result between the two predictions. As can be seen in
Figure 20, this modification is found to improve the agreement with experimental data.
Convection has been neglected in our model but, in fact, it seems to affect the behaviour in liquid state. The Rayleigh number for a fluid is a dimensionless number associated with buoyancy-driven flow, also known as free convection or natural convection. Under a value of 2 × 10
3, it can be considered only conduction transfer. In our case, the Rayleigh number has given a value of about 5 × 10
4 that can explain that convection is not completely negligible.
Figure 20 shows effectively that the model gives temperatures lower than experimental one during heating. Convection enhances the heating speed. In references [
21,
22], free convection is considered like an increase of thermal apparent conductivity depending on the Rayleigh number evolution. During cooling, the model gives higher results than experiments that can also be explained by the higher apparent conductivity of the PCM.
5. Conclusions
A numerical model of heat conduction in a PCM device has been constructed to predict the behaviour of a full-scale experimental component containing paraffin. The PCM was modelled using an equivalent heat capacity during the phase transition, and a variable thermal conductivity as a function of temperature. Both 2D and 1D pure conductive models were considered in order to demonstrate and evaluate the importance of edge effects. Hysteresis effects were also taken into account by adopting different curves of equivalent heat capacity for heating and cooling modes (based on DSC data). The overall behaviour of the PCM storage unit was well described by the model. Some quantitative discrepancy was observed between the models and data however, both during melting and solidification. This error was reduced by adopting the mean value of the curves during the melting phase. The origin of the model–data disparity was found to be different rates of temperature change during experiments.
The work presented in this paper offers answers to the some of the general questions that be posed before beginning a numerical study of PCM heat storage. Critically, it is important to model thermal conduction through the PCM slabs for configurations with Biot numbers greater then unity. A 2D model gives better results than a 1D description for systems where the material used for the container has a very different thermal conductivity to the PCM. Hysteresis phenomena related to DSC characterisation (generally in paraffin) was not found to be a significant source of error. Where both heating and cooling DSC curves are available, better with low temperature evolution range, it is recommended to consider the mean value of the two results. In particular, as novelty, two peaks of equivalent heat capacity have been observed with DSC when the rate is very low instead of only one peak using current rate, which explains the real behaviour in the experiments.
For the present study, this was found to improve model accuracy both in terms of temperature variation and heat flux density, even if convection should be considered for better results.
Acknowledgments
The experimental results used in this work have been obtained with the support of the French ANR project STOCKAIR2 with the reference: ANR-2010-STKE-010.
Author Contributions
J.V. conceived, designed and performed the experiments and developed the main analysis. A.T. performed the numerical simulations. The paper was written equally by both the authors.
Conflicts of Interest
The authors declare no conflict of interest.
Nomenclature
| Bi | Biot number |
| cp | heat capacity (kJ·kg−1·K−1) |
| e | thickness (m) |
| hc | convective heat transfer coefficient (W·m−2·K−1) |
| P | heating power (W) |
| QV | airflow rate (m3·s−1) |
| S | surface exchange with air of the containers (m2) |
| T | temperature (°C) |
| t | time (s) |
| Greek symbols |
| ρ | density (kg·m−3) |
| λ | thermal conductivity (W·m−1·K−1) |
| Δ | difference |
| Subscripts |
| a | air |
| alu | aluminium |
| HVAC | Heating Ventilation Air Conditioning |
| meas | measured |
| PCM | phase change material |
| sim | simulated |
| v | ventilation |
| Constants |
| heat capacity of air = 1004 J·kg−1·K−1 |
| Abbreviations |
| DSC | Differential Scanning Calorimetry |
| PCM | Phase Change Material |
| TESS | Thermal Energy Storage Systems |
References
- Virgone, J.; Kindinis, A. Peak power reduction using a PCM storage coupled with a heat pump in a ventilation system. In Proceedings of the 12th International Conference on Energy Storage, Lleida, Spain, 16–18 May 2012; p. 9.
- Lazaro, A.; Dolado, P.; Marin, J.M.; Zalba, B. PCM-air heat exchangers for free-cooling applications in buildings: Empirical model and application to design. Energy Convers. Manag. 2009, 50, 444–449. [Google Scholar] [CrossRef]
- Labat, M.; Virgone, J.; David, D.; Kuznik, F. Experimental assessment of a PCM to air heat exchanger for heating peak loads shaving. In Proceedings of the 2nd International Conference on Sustainable Energy Storage, Dublin, Ireland, 19–21 June 2013; p. 6.
- Labat, M.; Virgone, J.; David, D.; Kuznik, F. Experimental assessment of a PCM to air heat exchanger storage system for building ventilation application. Appl. Therm. Eng. 2014, 66, 375–382. [Google Scholar] [CrossRef]
- Microtek laboratories inc. MPCM 37D Microencapsulated Phase Change Material. Phase Change: 37 °C, 98.6 °F. Available online: http://www.microteklabs.com/pdfs/MPCM-37D%20Product%20Data%20Sheet.pdf (accessed on 20 June 2016).
- Sharma, S.; Sagara, K. Latent heat storage materials and systems: A review. Int. J. Green Energy 2005, 2, 1–56. [Google Scholar] [CrossRef]
- Virgone, J.; Lepers, S.; Kuznik, F.; Reisdorf, R.; Sallé, H.; Johannes, K.; Noël, J.; Rouchon, G.; Covalet, D.; Palomo, E.; et al. Rapport final du projet PREBAT IMPCBAT, Intégration des Matériaux à Changement de Phase dans le Bâtiment; ANR; ADEME: Paris, France, 2008; p. 168. [Google Scholar]
- Borderon, J. Integration des Matériaux à Changement de Phase Comme Systeme de Regulation Dynamique en Renovation Thermique. Ph.D. Thesis, École nationale des travaux publics de l’État, Cedex, France, 31 October 2012. [Google Scholar]
- Borderon, J.; Virgone, J.; Cantin, R. Prise en compte du phénomène d’hystérésis d’un matériau à changement de phase. In Proceedings of the Xième Colloque Interuniversitaire Franco-Québécois Sur la Thermique des Systèmes (CIFQ), Reims, France, 3–5 June 2013.
- Hauer, A.; Mehling, H.; Schossig, P.; Yamaha, M.; Cabeza, L.; Setterwall, V.M.F. Implementing Agreement on Energy Conservation through Energy Storage, Annex 17, Advance Thermal Energy Storage through Phase Change Materials and Chemical Reactions—Feasibility Studies and Demonstration Projects; IEA: Pairs, France, 2005. [Google Scholar]
- Dubovsky, V.; Ziskind, G.; Letan, R. Analytical model of a PCM-air heat exchanger. Appl. Therm. Eng. 2011, 31, 3453–3462. [Google Scholar] [CrossRef]
- Vakilaltojjar, S.; Saman, W. Analysis and modelling of a phase change storage system for air conditioning applications. Appl. Therm. Eng. 2001, 21, 249–263. [Google Scholar] [CrossRef]
- Hed, G.; Bellander, R. Mathematical modelling of PCM air heat exchanger. Energy Build. 2006, 38, 82–89. [Google Scholar] [CrossRef]
- Rostamizadeh, M.; Khanlarkhani, M.; Sadrameli, S.M. Simulation of energy storage system with phase change material (PCM). Energy Build. 2012, 49, 419–422. [Google Scholar] [CrossRef]
- Zalba, B.; Marin, J.M.; Cabeza, L.F.; Mehling, H. Free-cooling of buildings with phase change materials. Int. J. Refrig. 2004, 27, 839–849. [Google Scholar] [CrossRef]
- Vakilaltojjar, S. Phase Change Thermal Storage System for Space Heating and Cooling. Ph.D. Thesis, University of South, Adelaide, Australia, 2000. [Google Scholar]
- Halawa, E.; Bruno, F.; Saman, W. Numerical analysis of a PCM thermal storage system with varying wall temperature. Energy Convers. Manag. 2005, 46, 2592–2604. [Google Scholar] [CrossRef]
- Mosaffa, A.; Ferreira, C.I.; Talati, F.; Rosen, M. Thermal performance of a multiple PCM thermal storage unit for free cooling. Energy Convers. Manag. 2013, 67, 1–7. [Google Scholar] [CrossRef]
- Arzamendia Lopez, J.P.; Kuznik, F.; Baillis, D.; Virgone, J. Numerical modelling and experimental validation of a PCM to air heat exchanger. Energy Build. 2013, 64, 415–422. [Google Scholar] [CrossRef]
- Sharifi, N.P.; Freeman, G.E.; Sakulich, A.R. Using COMSOL modeling to investigate the efficiency of PCMs at modifying temperature changes in cementitious materials—Case study. Constr. Build. Mater. 2015, 101, 965–974. [Google Scholar] [CrossRef]
- Farid, M.M.; Husian, R.M. An electrical storage heater using the phase change method of heat storage. Energy Convers. Manag. 1990, 30, 219–230. [Google Scholar] [CrossRef]
- Farid, M.M.; Hamad, F.A.; Abu-Arabi, M. Melting and solidification in multi-dimensional geometry and presence of more than one interface. Energy Convers. Manag. 1998, 39, 809–818. [Google Scholar]
Figure 1.
Scheme of the air supply system.
Figure 1.
Scheme of the air supply system.
Figure 2.
Photograph of the storage component installed in the closed-loop air-supply system.
Figure 2.
Photograph of the storage component installed in the closed-loop air-supply system.
Figure 3.
Schematic diagrams and photograph of a single container filled with phase change material (PCM).
Figure 3.
Schematic diagrams and photograph of a single container filled with phase change material (PCM).
Figure 4.
Front view of the heat storage system.
Figure 4.
Front view of the heat storage system.
Figure 5.
Equivalent heat capacity of the Microtek 37 from DSC (Differential Scanning Calorimetry) measurement.
Figure 5.
Equivalent heat capacity of the Microtek 37 from DSC (Differential Scanning Calorimetry) measurement.
Figure 6.
Thermal conductivity of PCM in the model.
Figure 6.
Thermal conductivity of PCM in the model.
Figure 7.
2D results of mean heat flux to surface container for cooling case: heating, cooling heat capacity curves and mean value.
Figure 7.
2D results of mean heat flux to surface container for cooling case: heating, cooling heat capacity curves and mean value.
Figure 8.
2D results of mean heat flux to surface container for heating case: heating, cooling heat capacity curves and mean value.
Figure 8.
2D results of mean heat flux to surface container for heating case: heating, cooling heat capacity curves and mean value.
Figure 9.
Comparison between 1D and 2D results for heat density to surface container. Cooling case—heating heat capacity curve.
Figure 9.
Comparison between 1D and 2D results for heat density to surface container. Cooling case—heating heat capacity curve.
Figure 10.
Comparison between 1D and 2D results for heat density to surface container. Heating case—heating heat capacity curve.
Figure 10.
Comparison between 1D and 2D results for heat density to surface container. Heating case—heating heat capacity curve.
Figure 11.
Comparison between 1D and 2D results for heat flux density to container surface. Cooling case—cooling heat capacity curve.
Figure 11.
Comparison between 1D and 2D results for heat flux density to container surface. Cooling case—cooling heat capacity curve.
Figure 12.
Comparison between 1D and 2D results for heat flux density to container surface. Heating case—cooling heat capacity curve.
Figure 12.
Comparison between 1D and 2D results for heat flux density to container surface. Heating case—cooling heat capacity curve.
Figure 13.
Internal distribution of temperatures predicted by the 2D model at two instances in the trial: 3 h after the start time, when the PCM is solidifying; and 11 h after the start when the PCM is melting.
Figure 13.
Internal distribution of temperatures predicted by the 2D model at two instances in the trial: 3 h after the start time, when the PCM is solidifying; and 11 h after the start when the PCM is melting.
Figure 14.
Heat flux density distribution on the surface of the container obtained with the 2D model. The heat flux is counted here positive when the heat goes to the inside of the material. No flux is exchanged at the start of the trial, or after 25 h.
Figure 14.
Heat flux density distribution on the surface of the container obtained with the 2D model. The heat flux is counted here positive when the heat goes to the inside of the material. No flux is exchanged at the start of the trial, or after 25 h.
Figure 15.
Temperature variation at the centre of the container. Cooling case with the heating cp curve.
Figure 15.
Temperature variation at the centre of the container. Cooling case with the heating cp curve.
Figure 16.
Temperature variation at the centre of the container. Heating case with the heating cp curve.
Figure 16.
Temperature variation at the centre of the container. Heating case with the heating cp curve.
Figure 17.
Temperature variation at the centre of the container. Cooling case with the cooling cp curve.
Figure 17.
Temperature variation at the centre of the container. Cooling case with the cooling cp curve.
Figure 18.
Temperature variation at the centre of the container. Heating case with the cooling cp curve.
Figure 18.
Temperature variation at the centre of the container. Heating case with the cooling cp curve.
Figure 19.
Rate of temperature variation at the centre of the container. Heating case with cooling cp curve.
Figure 19.
Rate of temperature variation at the centre of the container. Heating case with cooling cp curve.
Figure 20.
Comparison of measured and calculated temperature variation at the centre of the container comparison showing the mean of the modelled values and experiment results.
Figure 20.
Comparison of measured and calculated temperature variation at the centre of the container comparison showing the mean of the modelled values and experiment results.
Table 1.
Thermal properties of the material.
Table 1.
Thermal properties of the material.
| Property | Solid State | Liquid State |
|---|
| Density (kg·m−3) | 870 ± 9 | 779 ± 8 |
| Thermal conductivity (W·m−1·K−1) | 0.24 ± 0.01 | 0.18 ± 0.01 |
| Heat capacity (kJ·kg−1·K−1) | 2.360 ± 0.01 (at 20 °C) | 2.453 ± 0.01 (at 45 °C) |
| Latent heat of fusion heating (kJ·kg−1·K−1) between 16 to 42 °C | 230 ± 5 |
| Latent heat of fusion cooling (kJ·kg−1·K−1) between 18 to 36 °C | 229 ± 5 |
© 2016 by the authors; licensee MDPI, Basel, Switzerland. This article is an open access article distributed under the terms and conditions of the Creative Commons Attribution (CC-BY) license (http://creativecommons.org/licenses/by/4.0/).


