Article

Distinguishing Bovine Fecal Matter on Spinach Leaves Using Field Spectroscopy

1
School of Biosystems and Food Engineering, University College Dublin, Dublin 4, Ireland
2
Environmental Microbial and Food Safety Laboratory, US Department of Agriculture, Agricultural Research Service, Beltsville Agricultural Research Center, Beltsville, Maryland, MD 20705, USA
*
Author to whom correspondence should be addressed.
Appl. Sci. 2016, 6(9), 246; https://doi.org/10.3390/app6090246
Submission received: 6 May 2016 / Revised: 29 July 2016 / Accepted: 23 August 2016 / Published: 30 August 2016
(This article belongs to the Special Issue Applications of Hyperspectral Imaging for Food and Agriculture)

Abstract

:
Detection of fecal contaminants on leafy greens in the field will allow for decreasing cross-contamination of produce during and post-harvest. Fecal contamination of leafy greens has been associated with Escherichia coli (E. coli) O157:H7 outbreaks and foodborne illnesses. In this study, passive field spectroscopy measuring reflectance and fluorescence created by the sun’s light, coupled with numerical normalization techniques, are used to distinguish fecal contaminants on spinach leaves from soil on spinach leaves and uncontaminated spinach leaf portions. A Savitzky-Golay first derivative transformation and a waveband ratio of 710:688 nm as normalizing techniques were assessed. A soft independent modelling of class analogies (SIMCA) procedure with a 216 sample training set successfully predicted all 54 test set sample types using the spectral region of 600–800 nm. The ratio of 710:688 nm along with set thresholds separated all 270 samples by type. Application of these techniques in-field to avoid harvesting of fecal contaminated leafy greens may lead to a reduction in foodborne illnesses as well as reduced produce waste.

1. Introduction

The production of contaminant-free fresh produce for human consumption is needed in order to reduce the occurrence of foodborne illnesses [1]. Leafy greens have been associated with several outbreaks of Escherichia coli (E. coli) O157:H7 [2]. Fresh fruit and vegetables are susceptible to fecal contamination from livestock, wild, or domestic animals entering the growing field, manure fertilizer, and irrigation water containing animal feces [3,4]. E. coli O157:H7 commonly resides in the intestines of animals, and when transferred to humans via food it can cause foodborne illnesses and death [5]. Foods consumed fresh, such as leafy greens, have a higher risk of causing foodborne illness because there is no lethal phase for bacteria, such as heating to kill pathogens [6]. The United States Center for Disease Control and Prevention (CDC) estimated that in 2014 alone there were 19,542 infections, 4445 hospitalizations, and 71 deaths due to foodborne diseases [7]. A device to identify fecal matter would offer the producer a powerful tool as a first step in assessing if E. coli O157:H7 exists in a produce field.
There is a need to detect pathogenic bacteria infected fecal matter on leafy greens in the field prior to harvesting. An imaging device could be used as the first step in this process by locating fecal matter. There are many benefits to avoiding the harvesting of contaminated produce, including: (1) cross-contamination can be avoided during harvesting and downstream processes; (2) reduction of leafy green produce waste and (3) reduction of downtime required for cleaning and sanitizing equipment.
Solar radiation on a leaf is reflected, transmitted, or absorbed by the leaf’s surface [8]. Solar radiation emits both ultraviolet and visible light. In the red and far red spectral regions of the solar response from green vegetation, both fluorescence and reflectance typically contribute to the response signal [9,10]. Absorbed solar energy that is not used in the photosynthesis process is emitted as fluorescence at longer wavelengths or as heat [11]. Guanter et al. [12] stated that ~1% of the solar radiation absorbed by leafy greens is emitted as chlorophyll a fluorescence. Campbell et al. [11] reported that on average 10%–20% of the response recorded at 685 nm on vegetation foliar samples from simulated solar radiation was due to chlorophyll a fluorescence; however, artificial light sources cannot reproduce the fine spectral profile of sunlight [13]. Fluorescence emissions from foliage occur throughout the ultraviolet and visible region and have peaks at 340, 445, 530, 685 and 740 nm [9,10]. Campbell et al. [11] reported that between 680 and 725 nm vegetation has relatively low reflectance due to strong chlorophyll a light absorption. Rapid hyperspectral fluorescence imaging technology for detection of fecal contamination on fresh produce has been developed by Everard et al. [1]. This technology is restricted by light conditions as directly reflected light can saturate the fluorescence emission signal of interest. Everard et al. [1] reported that chlorophyll fluorescence emission peaks near 685 and 740 nm for fresh leafy greens shift towards the blue region of the spectrum as the leaf decays (over the 27-day storage period studied); these emission peak shifts are similar but less extensive than the peak shifts towards the blue region observed for the chlorophyll peaks in fecal matter. The ratio of the fluorescence peaks at 685 and 740 nm has also been shown to be related to vegetation vigor [14].
Milton et al. [13] reviewed developments in the area of field spectroscopy and specifically in the establishment of field spectroscopy for calibration of airborne and satellite sensors. To be of practical use, field spectroscopy must be repeatable under varying environmental conditions. A limitation to using a reference panel during field spectroscopy is that illumination conditions will often change during the lag in time between reference panel measurement and target surface measurement, such as those brought on by changes in cloud cover [13]. “Single-beam” field spectroradiometers are more cost effective than “dual beam” because they work on the basis that the same spectrometer measures the reference panel and target, with the spectral reference taken before and after the target scan. The assumption with this technique is that the illumination changes in a predicable manner between scans, which is not likely due to episodic changes, such as the passage of sub-visual clouds through the direct solar radiance [13]. Dual-beam field spectroradiometers use two spectrometers to measure a reference panel and the target simultaneously, with the added complexity of requiring two well matched detectors [13]. Therefore, a field spectroscopy system which negates the need for reference panel measurements would eliminate these complexities.
Passive optical methods require an understanding of the illumination conditions. Clear atmospheric conditions, including low atmospheric water vapour and aerosol content, are preferred [13]. For non-Lambertian surfaces, variations in solar zenith and atmospheric haze will also add to variability in field spectroscopy [15].
In this study, we assess the use of normalizing algorithms for detection of fecal matter on spinach leaves for passive field spectroscopy. Spectral responses to solar electromagnetic energy are measured for fecal contaminants on spinach leaves, soil on spinach leaves, and uncontaminated spinach leaf portions. First derivative and ratio normalizing techniques are used to take advantage of the differences in the spectral profiles among these sample types; this technique aims to negate the need for calibration using a reference panel, which is unreliable due to atmospheric or environmental changes during the lag time between reference panel and target scans.

2. Materials and Methods

2.1. Sample Preparation

Spinach leaves (Spinacia oleracea) were purchased from a local food store in Beltsville, MD, USA in the form of loose leaves that were packaged as a pre-washed “ready-to-eat” product. Fecal matter from Holstein cows was obtained at the Dairy Operations Unit, Beltsville Agricultural Research Center, Agricultural Research Service, United States Department of Agriculture, Beltsville, MD, USA. Fecal matter was dried in a forced air oven at 80 °C for 16 h. A grinder (Sample Grinder, C.W. Brabender Instruments Inc., South Hackensack, NJ, USA) was used to reduce the dried fecal particulate sizes to less than 2 mm; this was to ensure the large fibrous fecal matter particulates were not excluded during the pipette contaminant application technique. The dried and ground fecal matter was reconstituted using distilled water to its original moisture level. The contaminant was applied to each leaf on its adaxial surface by applying a droplet of fecal matter (0.25 mL, approximately 12–15 mm diameter) using a pipette. A soil contaminant droplet, diluted to 1:2 with distilled water, was also applied in a similar way to each leaf. The leaves were then left for 16 h at room temperature in air-tight plastic containers to allow the droplets to dry before scanning. As a consequence of drying the contaminants at room temperature for 16 h, fresh leaves wilted slightly. Compositional analyses of the fecal matter and soil samples were carried out and the results can be seen in Table 1. Moisture content of both fecal matter and soil were determined using a forced air oven at 105 °C for 24 h. The organic matter content of the fecal matter was determined using a Paragon Furnace (Paragon Industries, Mesquite, TX, USA) at 550 °C. The organic matter content of soil was determined using the Walkley Black Colorimetric method [16]. All compositional analyses were carried out in triplicate.

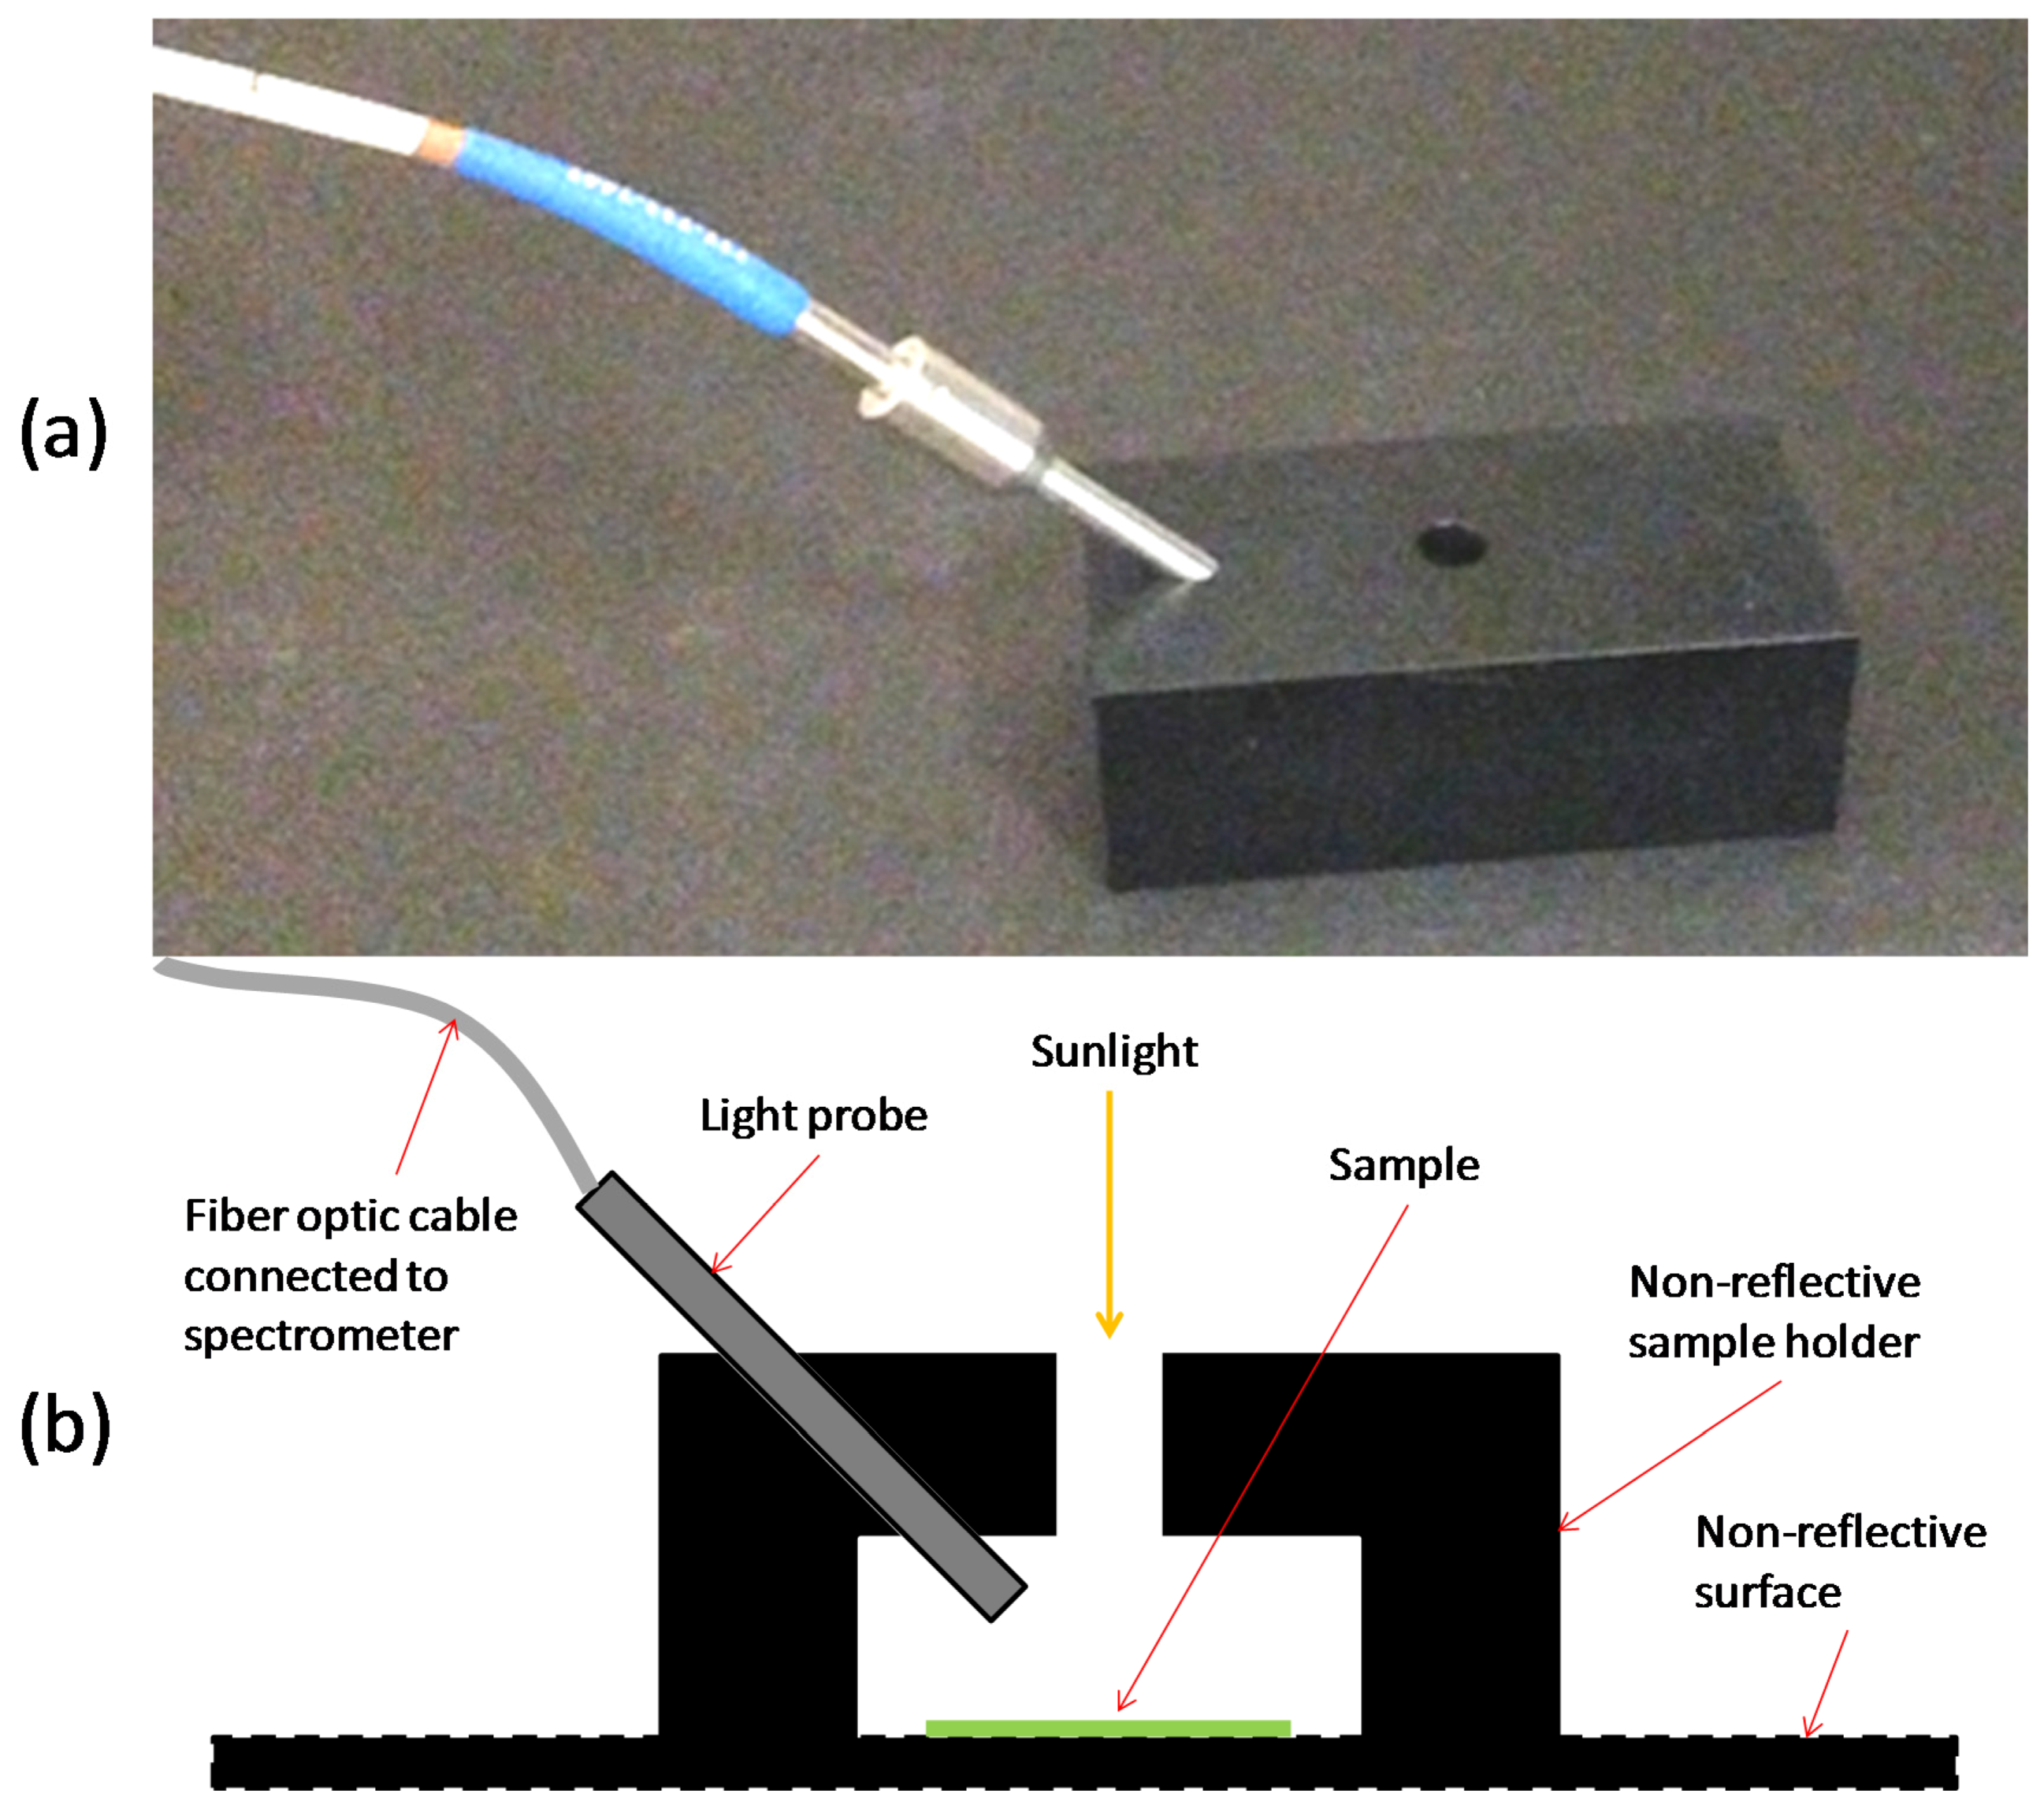
2.2. Field Spectroscopy

Spectral responses to solar radiation, for fecal matter on leaf, soil on leaf, and uncontaminated leaf portion, were recorded on five different days at the Beltsville Agricultural Research Center. Leaves were scanned on five different days with varying atmospheric conditions. Each leaf was scanned at three different areas on the leaf, i.e., at the fecal contaminated area, at the soil contaminated area, and at an uncontaminated area. On each of the five test days, 18 leaves were analysed (5 × 18 = 90). Table 2 shows the sun’s position as recorded at the Beltsville Agricultural Experimental Station and the weather conditions at the nearby College Park Airport weather station (KCGS) on the five days of experimentation. Spectral responses were recorded between 1 and 2 p.m. on each day to minimize sun position variation.
Harvested and prepared leaf samples were placed on a non-reflective material and scanned in a field, at the Beltsville Agricultural Research Center, under direct sun light. Samples were placed under a reflection probe holder (RPH-1, OceanOptics, Oxford, UK), which allows the sun’s radiation to be focused on a 10 mm diameter circular section of the leaf and for the response to be detected at a 45° angle using a fiber optic probe and cable (QR600-7-UV-125F, OceanOptics) connected to a spectrometer (USB2000, OceanOptics; Figure 1).
Spectra were captured using a computer and OceanView software (Version 1.5.0, OceanOptics, 2013) from 368 to 1048 nm at 2048 wavebands. The dark reference was captured after placing the reflection probe holder on non-reflective black material and completely covering the light inlet with non-reflective black material. The sample spectra were captured by placing the reflection probe holder on the leaf, with the light inlet directly above the sample type being analyzed. A “scan to average” of five was used, i.e., the average of five consecutive scans was recorded. Integration time (time taken to scan a single spectrum) was automatically selected for each sample, and thus was dependent on the solar radiation intensity. Average spectra for each sample were saved as ASCII files for later analysis.

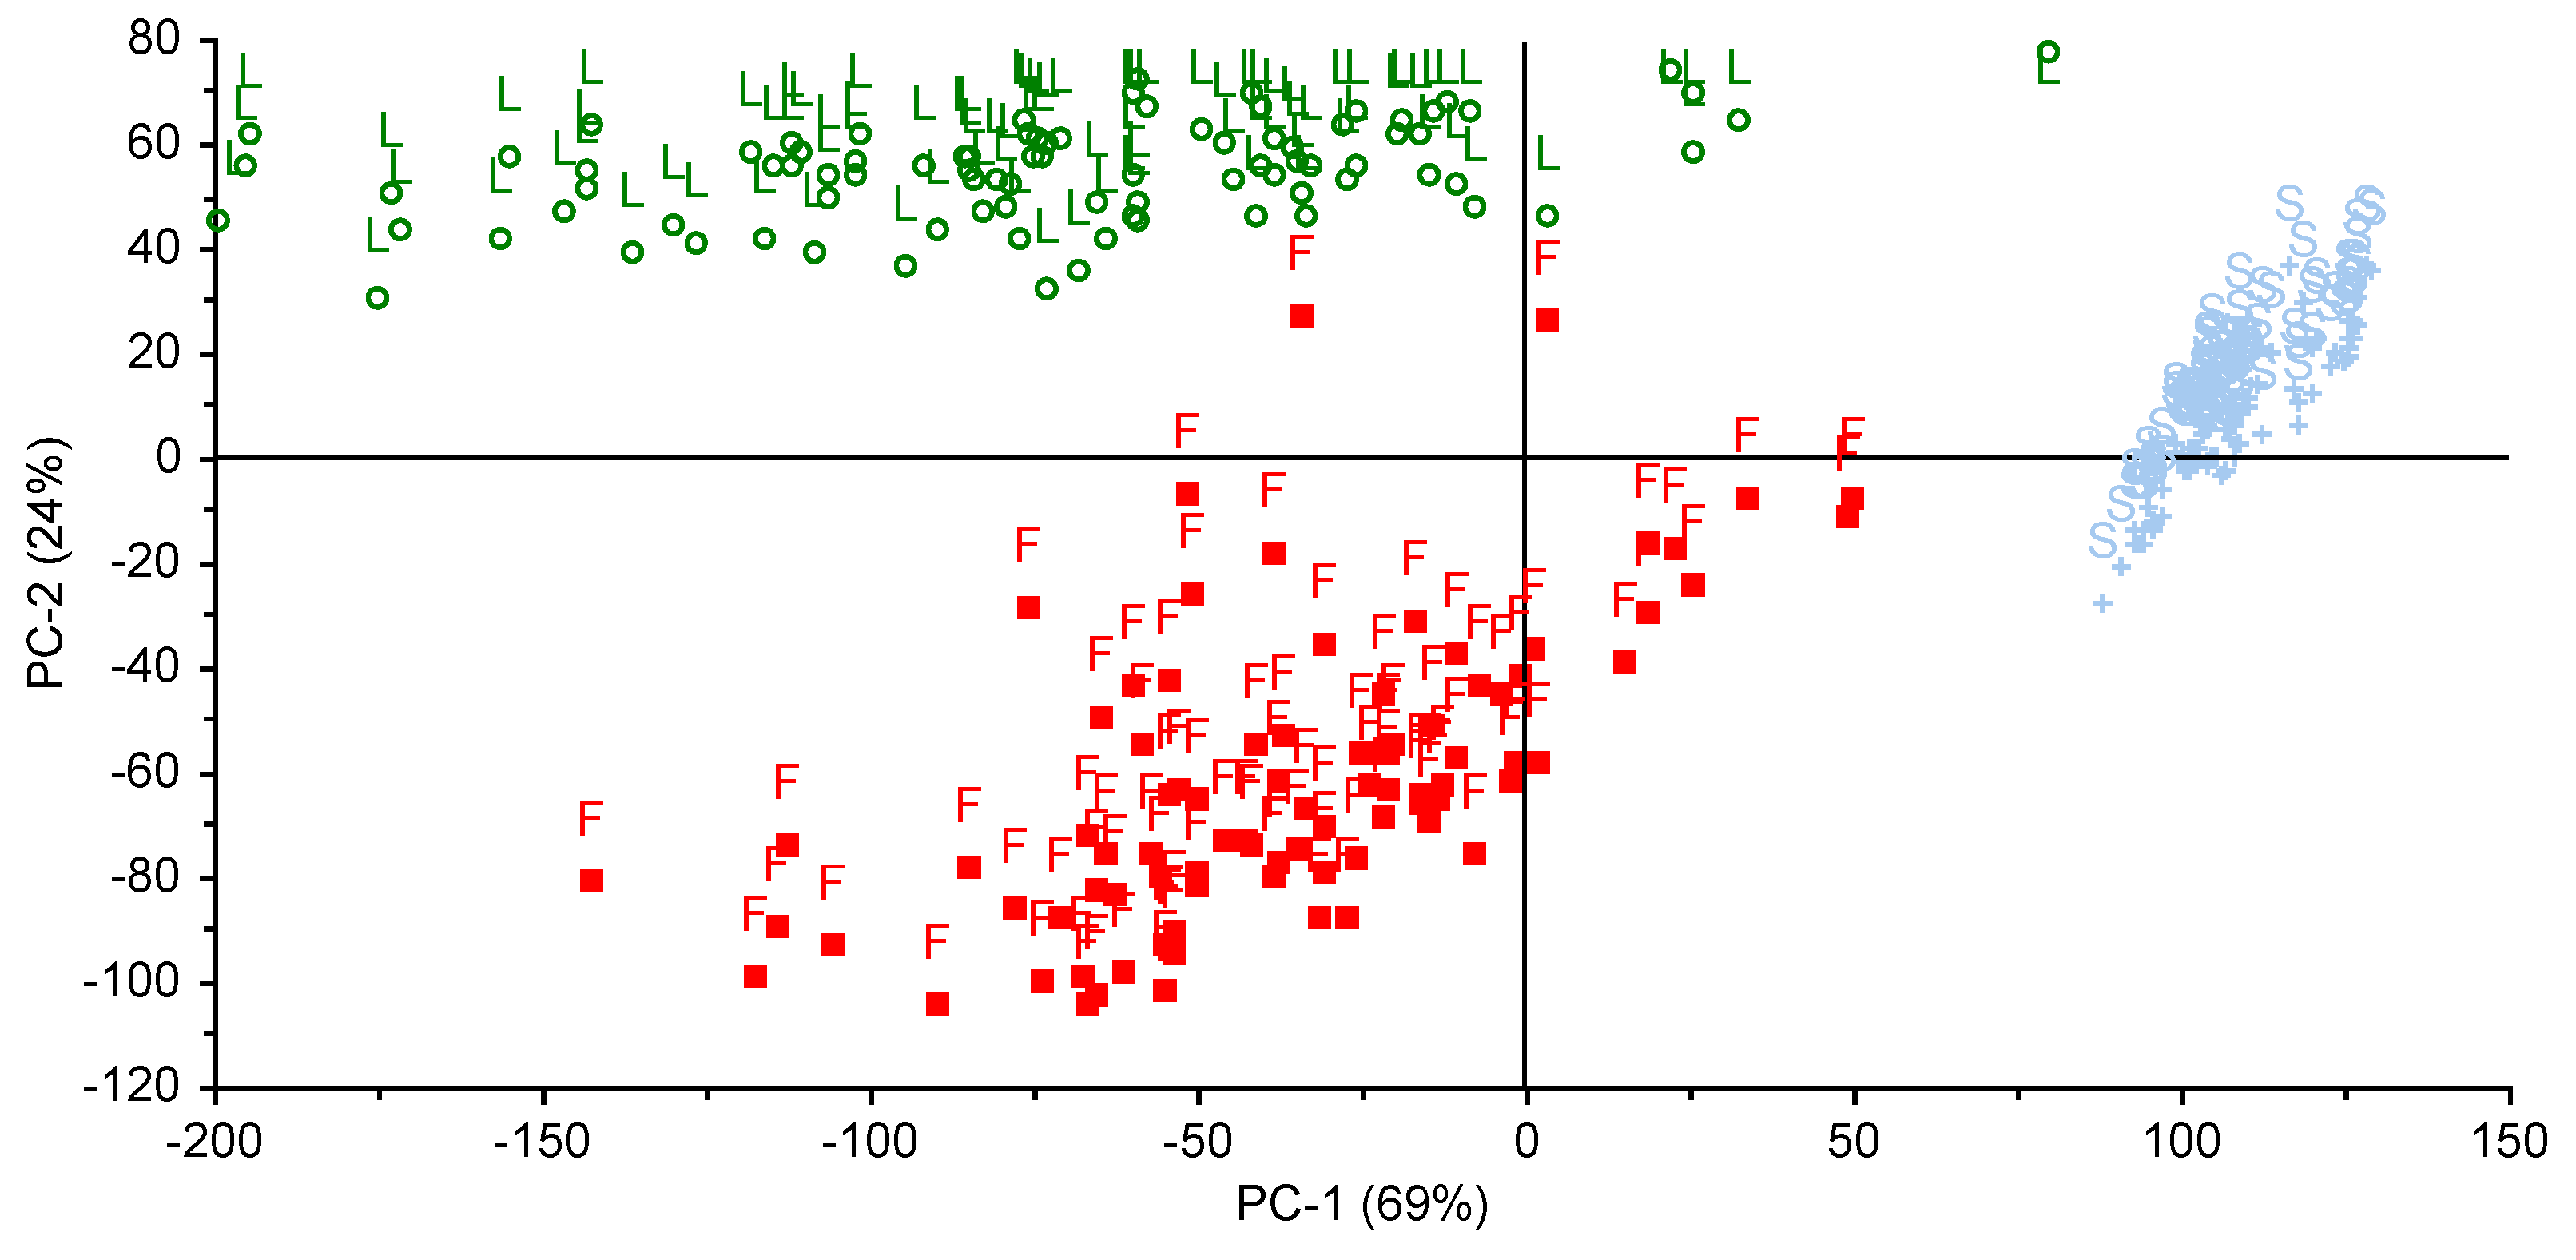
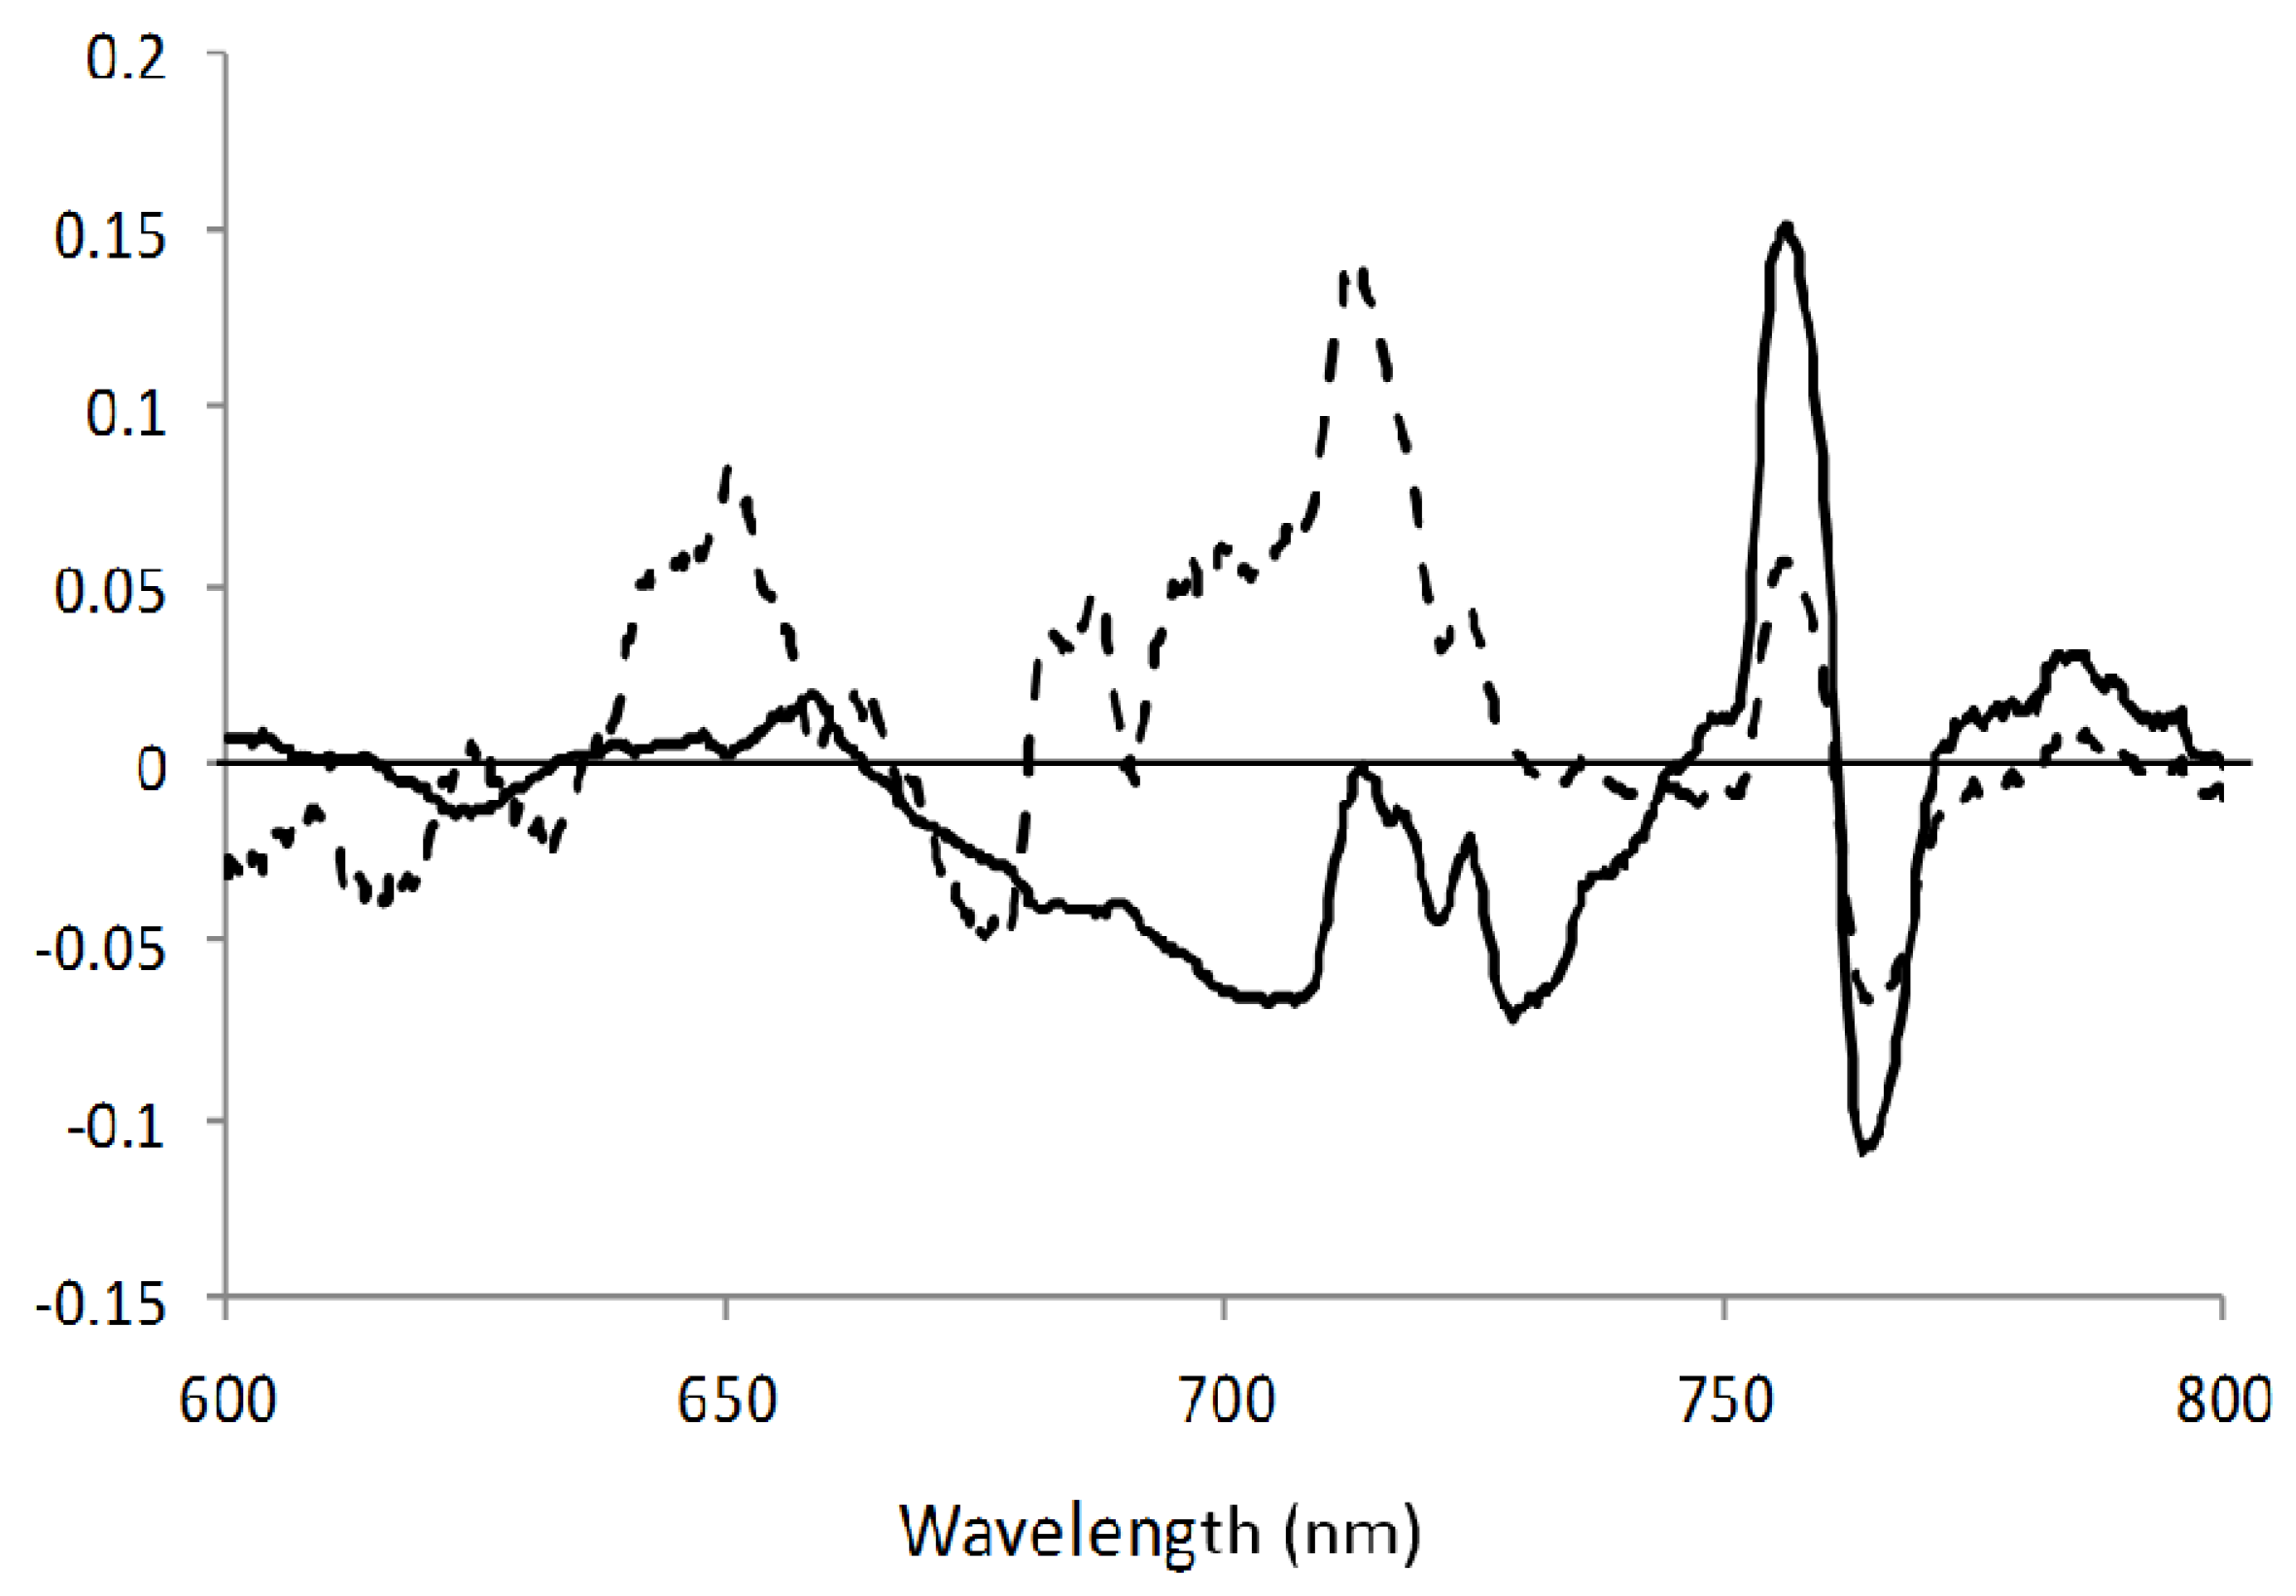
2.3. Spectroscopic Data Analysis

Normalization techniques were used to assess if spectral profiles can be used to distinguish fecal contamination on spinach leaves from both soil on leaves and uncontaminated leaves at differing solar radiation intensities. The first normalization technique used was a Savitzky-Golay first derivative transformation of the spectra with 11 smoothing points. After applying the derivative, principal component analysis was carried out on the 270 samples (90 × 3) using the full spectrum range scanned, from 368 to 1048 nm (2048 wavelengths), and also on a limited range (600–800 nm, 592 wavelengths), with a maximum of seven principal components for each range. This spectroscopic analysis was carried out using The Unscrambler X software package (v10.1, CAMO Software AS, Oslo, Norway, 2010). To validate the method for prediction of sample type, the data set was divided into training and test sets. The training set consisted of the samples scanned on the first four days of experimentation (216 samples), and the test set consisted of the samples scanned on the fifth day of experimentation (54 samples). Three PCA models were developed for the three sample types using the training set, and a SIMCA (soft independent modelling of class analogies) procedure was used to predict the test set sample types.
The second normalization technique was a two-waveband ratio algorithm, 710:688 nm. This algorithm took advantage of the increased absorption of light reported between 680 and 725 nm due to the presence of chlorophyll a [11]. Inverted peaks at 688 nm and peaks at 710 nm were observed on typical reflectance spectral profiles for both fecal matter on leaf and uncontaminated leaf. The algorithm was applied to all samples for validation.

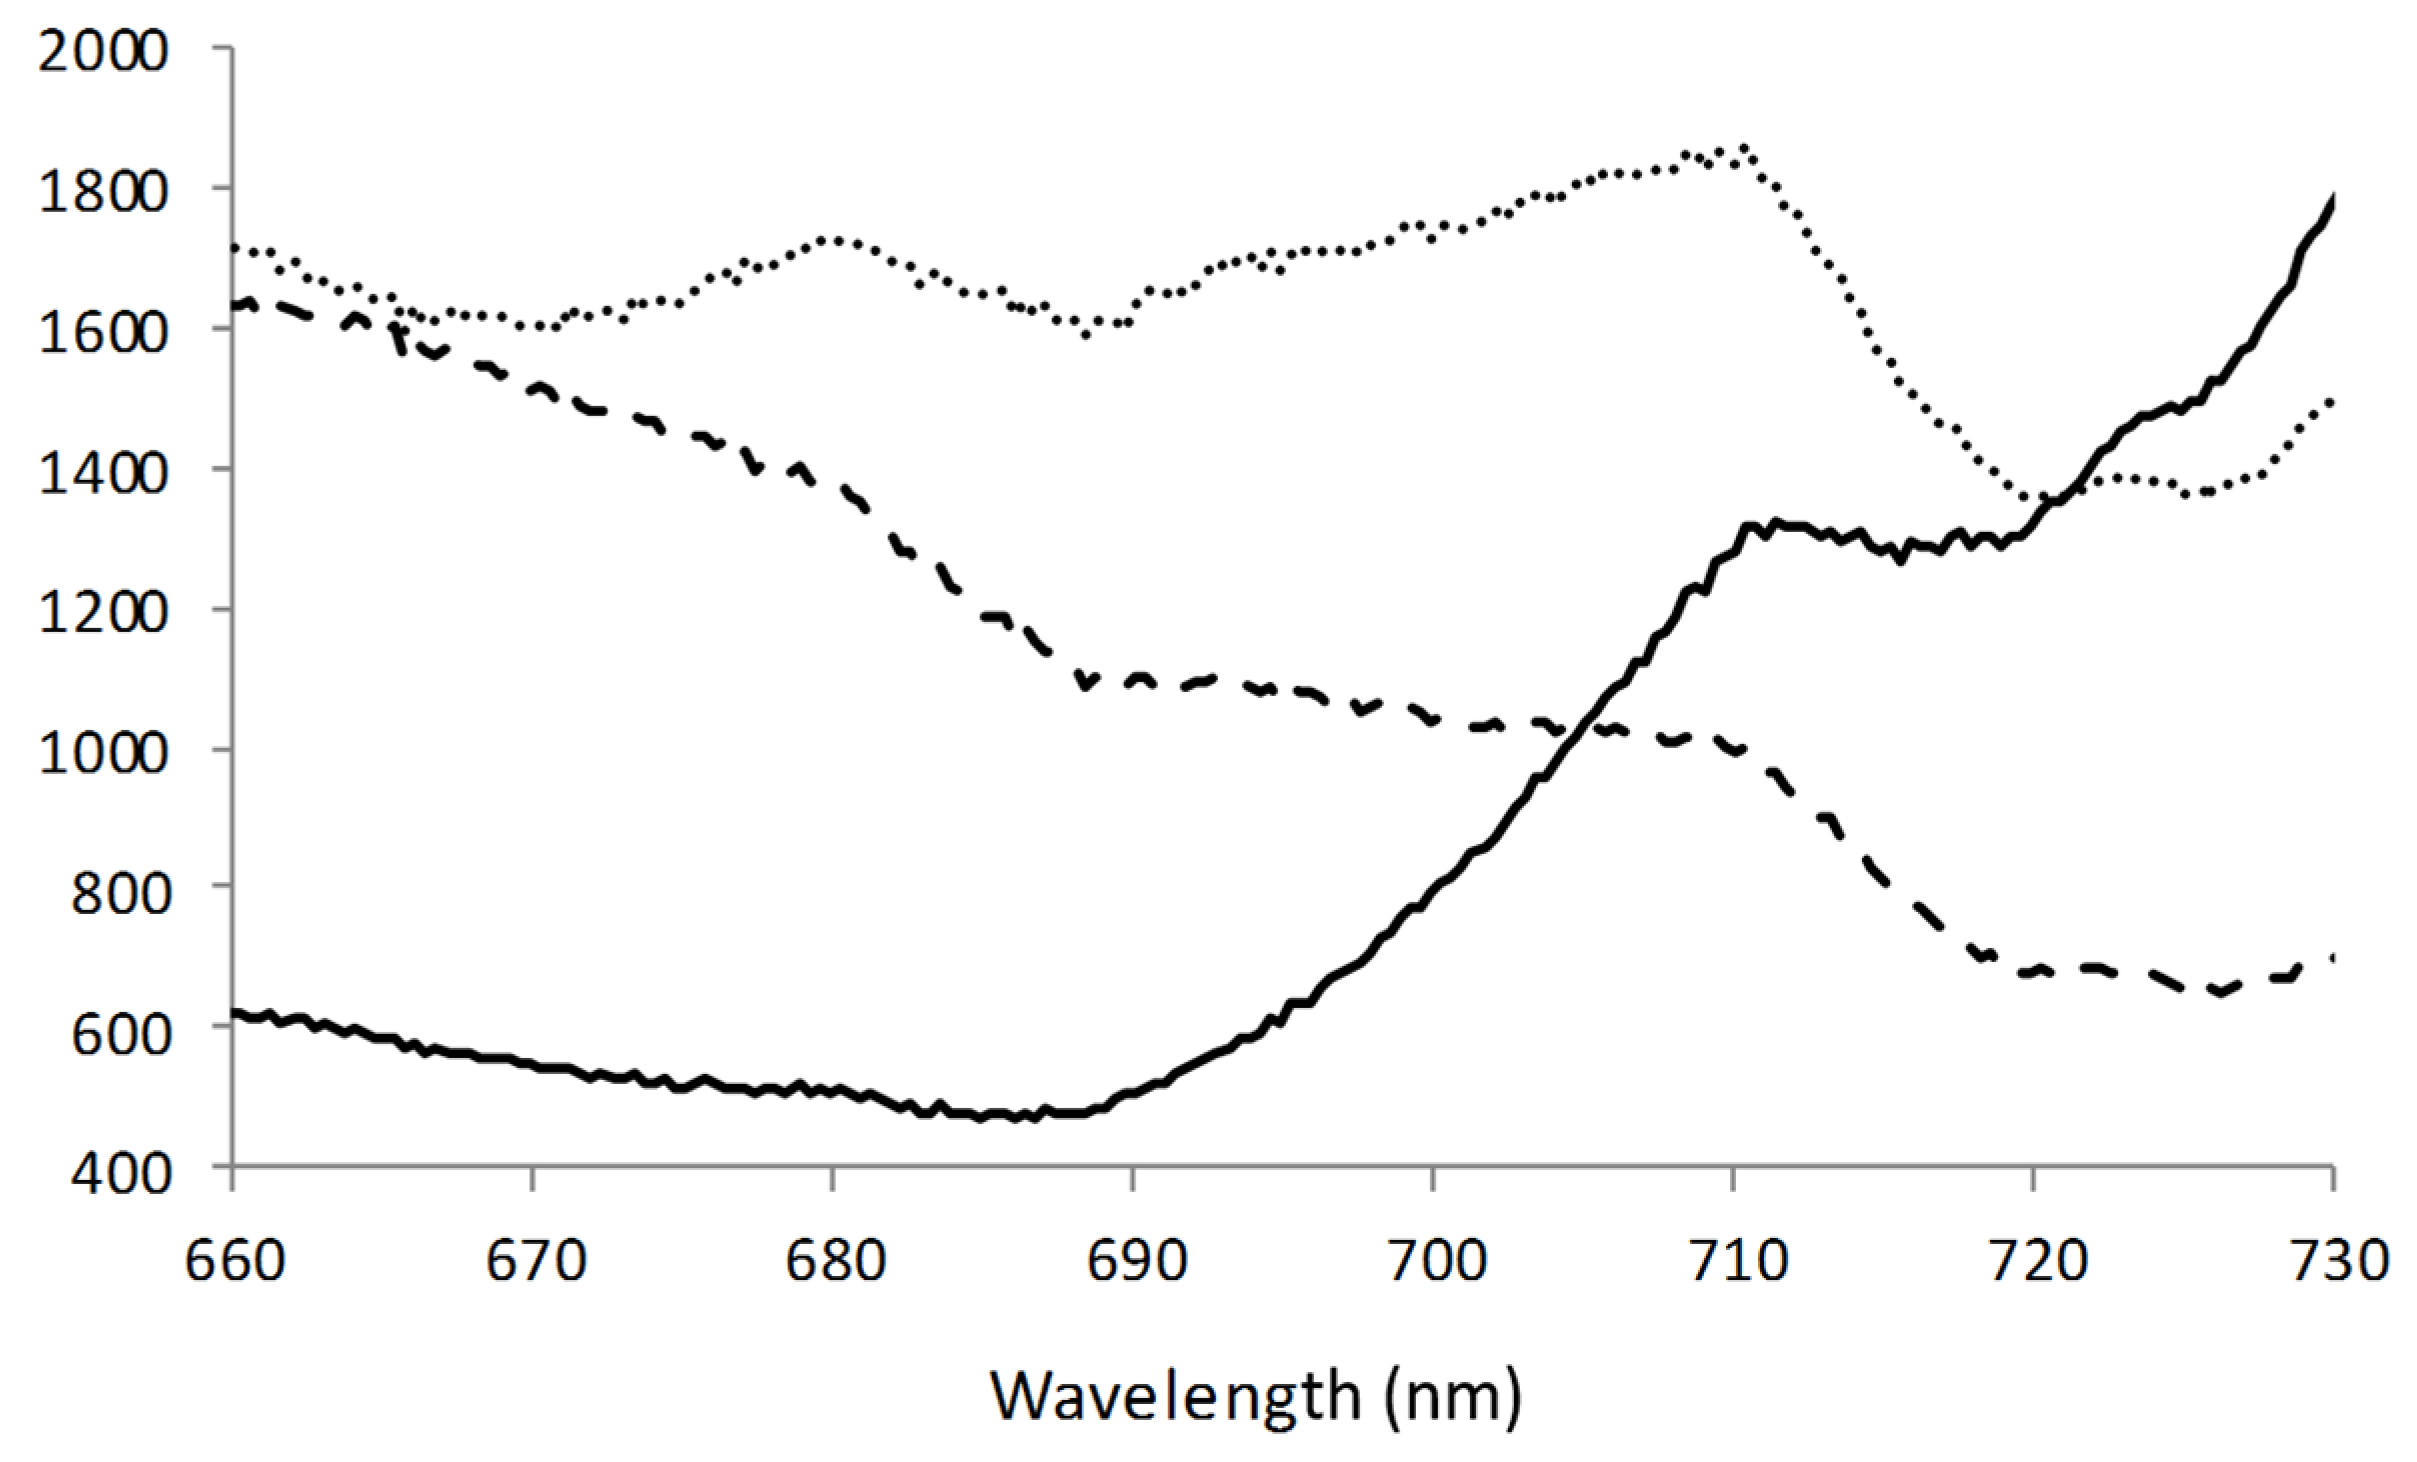
3. Results and Discussion

The Savitzky-Golay first derivative transformation normalization technique was applied to the spectral data and then principal component analysis (PCA) was used to assess if the three sample types can be distinguished from one another. Figure 2 shows the PCA scores plot for all samples over the five test days using the full spectrum recorded, i.e., 368–1048 nm. All the soil on leaf samples are clearly separated from the fecal on leaf and uncontaminated leaf samples along the first principal component (PC1) axis. The fecal on leaf and uncontaminated leaf samples are clearly grouped together; however, they are separated by both PC1 and PC2. PC1, PC2, and PC3 represented 61%, 28% and 4% of the total variation explained by the model, respectively. It was decided to crop the spectral range to 600–800 nm to focus on important chlorophyll response wavelengths, including the reported strong chlorophyll a light absorption range from 680 to 725 nm [11]. Figure 3 shows the PCA scores plot using this spectra range for all samples over the five test days; PC1, PC2, and PC3 explained 69%, 24% and 3% of the variation in this model. In this PCA model, the soil on leaf samples are clearly distinguished from both fecal matter on leaf and uncontaminated leaf along the PC1 axis, and the fecal matter on leaf and uncontaminated leaf are clearly distinguished along the PC2 axis. As can be seen in Figure 4, the loading plot for this model, PC1 is heavily loaded near 756 and 764 nm, and PC2 has high loading values near 712 nm. The loadings plot shows the relationships between the original variables and the first two principal components in the PCA model. Both PCA models show that the three sample types are clearly distinguished into well-defined groups on the PC1 versus PC2 scores plots.
To validate the technology and technique as a potential system to predict sample type, a SIMCA calibration model was developed using a training data set consisting of the spectral data recorded over the first four testing days. This model was subsequently used to predict the sample types from a test set, which consisted of the remaining fifth testing day’s spectra. The spectral range of 600 to 800 nm was used for this validation. The fecal matter on leaf, soil on leaf, and uncontaminated leaf PCA models used five, four, and four principal components, respectively. The test showed that the SIMCA procedure correctly classified 100% of the 54 new samples at the 5% significance level, based on statistical tests performed on the sample-to-model distances.
Compared to PCA, the waveband ratio is a statistically simpler technique, and it takes into consideration the slope changes observed between 688 and 710 nm among the different sample types (Figure 5). It was observed that both the fecal matter on leaf and uncontaminated leaf samples had positive slopes from 688 to 710 nm, while the soil on leaf had negative slopes. The uncontaminated leaf samples had higher positive slopes than the fecal on leaf samples. To validate this method, the ratio of 710:688 nm was calculated for all 270 samples. As can be seen in Table 3, the range of values for this ratio for each sample type does not overlap; therefore threshold values can be applied to distinguish the different sample types from the ratio of 710:688 nm.
The sun and weather conditions over the five days of experimentation, as seen in Table 2, did not affect the fecal matter identification rate. Both normalization techniques used in this study are dependent on the assumption that as the sun’s light intensity changes, it changes by the same magnitude at each wavelength used. It is outside the scope of this study to observe changes in the sun’s light profiles at different times of day or year or at different positions in the sky. Milton et al. [13] stated that “the dominant paradigm of field spectroscopy is based on relative measurements, in which the radiance of the target is compared with that of a reference panel”; however, in this study, if the assumption of linear response holds, calibration of the instrument is not necessary.
The implementation of these field spectroscopy techniques has potential in a multispectral imaging monitoring system for the early detection of fecal contaminated leafy greens in-field. The use of fluorescence and reflected light from the sun has several benefits for in-field operation over an electrically powered light source. The main issue with using an electrically powered light source for field monitoring is the need to ensure constant illumination conditions; this would require a constant power supply and a barrier to keep out natural light.
Field spectroscopy has been used to identify materials on the basis of its specific absorption and reflectance properties [17]. Optical spectral sensing technologies have a role to play in the detection of fecal matter on fresh leaves [1,18]. Once key wavebands are identified with the aid of multivariate analysis, they can be implemented into multispectral imaging systems. Reducing data processing time by reducing the number of wavebands in the processing algorithm can make real-time image analysis easier to carryout. The waveband ratio normalization technique presented here has a simpler algorithm than the PCA technique. Detection of fecal contamination on leafy greens in the field is more advantageous than post-harvesting detection. In-field detection of contaminated areas can allow the producer to avoid that area during harvest, thus preventing cross-contamination by the harvester or at a downstream processing phase. In-field detection of fecal matter, as a food safety risk reduction strategy, can be used to reduce harmful pathogenic bacteria from entering the food system and potentially causing foodborne illnesses [19].

4. Conclusions

Field spectroscopy with two different spectral normalization techniques was successfully used to distinguish fecal matter on spinach leaves from soil on spinach leaves and uncontaminated spinach leaf portions. The detection of fecal contamination in-field can allow the producer to leave contaminated produce in the field by avoiding contaminated areas during harvesting. This technology has the potential to reduce the risks of foodborne illnesses caused by fecal matter containing pathogenic bacteria entering the human food supply. It may also alleviate the need for harvest and process equipment downtime for cleaning and sanitizing after potential contamination.

Acknowledgments

This publication has emanated from research conducted with the financial support of the European Union’s Seventh Framework Programme (FP7) under the Marie Curie International Outgoing Fellowships for Career Development (FP7-PEOPLE-2011-IOF).

Author Contributions

Colm D. Everard, Moon S. Kim and Colm P. O’Donnell conceived and designed the experiments; Colm D. Everard performed the experiments; Colm D. Everard analyzed the data; Moon S. Kim contributed reagents/materials/analysis tools; Colm D. Everard wrote the paper.

Conflicts of Interest

The authors declare no conflict of interest.

References

  1. Everard, C.D.; Kim, M.S.; Cho, H.; O’Donnell, C.P. Hyperspectral fluorescence imaging using violet LEDs as excitation sources for fecal matter contaminate identification on spinach leaves. J. Food Meas. Charact. 2016, 10, 56–63. [Google Scholar] [CrossRef]
  2. Brandl, M.T. Plant lesions promote the rapid multiplication of Escherichia coli O157:H7 on postharvest lettuce. Appl. Environ. Microbiol. 2008, 74, 5285–5289. [Google Scholar] [CrossRef] [PubMed]
  3. U.S. Food and Drug Administration. Analysis and Evaluation of Preventive Control Measures for the Control and Reduction/Elimination of Microbial Hazards on Fresh and Fresh-Cut Produce; Center for Food Safety and Applied Nutrition, US FDA: Washington, DC, USA, 2001.
  4. Xicohtencatl-Cortes, J.; Sánchez Chacón, E.; Saldaña, Z.; Freer, E.; Girón, J.A. Interaction of Escherichia coli O157:H7 with leafy green produce. J. Food Prot. 2009, 72, 1531–1537. [Google Scholar] [PubMed]
  5. Armstrong, G.L.; Hollingsworth, J.; Morris, J.G., Jr. Emerging foodborne pathogens: Escherichia coli O157:H7 as a model of entry of a new pathogen into the food supply of the developed world. Epidemiologic Rev. 1996, 18, 29–51. [Google Scholar] [CrossRef]
  6. Wiederoder, M.S.; Liu, N.; Lefcourt, A.M.; Kim, M.S.; Lo, Y.M. Use of a portable hyperspectral imaging system for monitoring the efficacy of sanitation procedures in produce processing plants. J. Food Eng. 2013, 117, 217–226. [Google Scholar] [CrossRef]
  7. Center for Disease Control and Prevention (CDC). Preliminary incidence and trends of infection with pathogens transmitted commonly through food—Foodborne diseases active surveillance network. Morb. Mortal. Wkly. Rep. 2015, 64, 495–499. [Google Scholar]
  8. Kim, M.S.; Chappelle, E.W.; Corp, L.A.; McMurtrey, J.E. The contribution of chlorophyll fluorescence to the reflectance spectra of green vegetation. In Proceedings of the IGARSS '93–IEEE International Geoscience and Remote Sensing Symposium, Tokyo, Japan, 18–21 August 1993; pp. 1325–1328.
  9. Lichtenthaler, H.K.; Buschmann, C.; Rinderle, U.; Schmuck, G. Application of chlorophyll fluorescence in ecophysiology. Radiat. Environ. Biophys. 1986, 25, 297–308. [Google Scholar] [CrossRef] [PubMed]
  10. Chappelle, E.W.; Kim, M.S.; Mulchi, C.L.; Daughtry, C.S.T.; McMurtrey, J.E.; Corp, L.A. Laser Induced Fluorescence (LIF) as a Remote Sensing Tool: A Review; Technical Report for NASA Goddard Space Flight Center: Greenbelt, MD, USA, January 1999. [Google Scholar]
  11. Campbell, P.K.E.; Middleton, E.M.; Corp, L.A.; Kim, M.S. Contribution of chlorophyll fluorescence to the apparent vegetation reflectance. Sci. Total Environ. 2008, 404, 433–439. [Google Scholar] [CrossRef] [PubMed]
  12. Guanter, L.; Rossini, M.; Colombo, R.; Meroni, M.; Frankenberg, C.; Lee, J.E.; Joiner, J. Using field spectroscopy to assess the potential of statistical approaches for the retrieval of sun-induced chlorophyll fluorescence from ground and space. Remote Sens. Environ. 2013, 133, 52–61. [Google Scholar] [CrossRef]
  13. Milton, E.J.; Schaepman, M.E.; Anderson, K.; Kneubühler, M.; Fox, N. Progress in field spectroscopy. Remote Sens. Environ. 2009, 113, S92–S109. [Google Scholar] [CrossRef]
  14. Lichtenthaler, H.K.; Rinderle, U. The role of chlorophyll fluorescence in the detection of stress conditions in plants. Crit. Rev. Anal. Chem. 1988, 19, S29–S85. [Google Scholar] [CrossRef]
  15. Kriebel, K.T. Average variability of the radiation reflected by vegetated surfaces due to differing irradiations. Remote Sens. Environ. 1978, 7, 81–83. [Google Scholar] [CrossRef]
  16. Walkley, A.; Black, I.A. An examination of the Degtjareff method for determining soil organic matter and a proposed modification of the chromic acid titration method. Soil Sci. 1934, 37, 29–38. [Google Scholar] [CrossRef]
  17. Meroni, M.; Colombo, R. 3S: A novel program for field spectroscopy. Comput. Geosci. 2009, 35, 1491–1496. [Google Scholar] [CrossRef]
  18. Everard, C.D.; Kim, M.S.; Lee, H. A comparison of hyperspectral reflectance and fluorescence imaging techniques for detection of contaminants on spinach leaves. J. Food Eng. 2014, 143, 139–145. [Google Scholar] [CrossRef]
  19. Ivnitski, D.; Abdel-Hamid, I.; Atanasov, P.; Wilkins, E. Biosensors for detection of pathogenic bacteria. Biosens. Bioelectron. 1999, 14, 599–624. [Google Scholar] [CrossRef]
Figure 1. Reflection probe holder allowing the sun’s radiation to be focused on a 10 mm diameter circular section of the sample and for the response to be detected at a 45° angle using a fiber optic probe and cable connected to a spectrometer. (a) Picture of the apparatus; (b) schematic of the cross-sectional area.
Applsci 06 00246 g001
Figure 2. Principal component analysis scores plot of showing PC1 (principal component 1) vs. PC2 using spectra from 368 to 1048 nm. ▪ and F, fecal matter on leaf; + and S, soil on leaf; o and L, uncontaminated leaf.
Applsci 06 00246 g002
Figure 3. Principal component analysis scores plot of showing PC1 (principal component 1) vs. PC2 using spectra from 600 to 800 nm. ▪ and F, fecal matter on leaf; + and S, soil on leaf; o and L, uncontaminated leaf.
Applsci 06 00246 g003
Figure 4. Loadings plot for principal component model developed using all 270 samples over the five test days in the range of 600 to 800 nm. PC1 (――) and PC2 (——) explain 69% and 24% of the variation in the model, respectively.
Applsci 06 00246 g004
Figure 5. Typical spectral profiles recorded from 660 to 730 nm for fecal on leaf (• •), soil on leaf (——), and uncontaminated leaf samples (――).
Applsci 06 00246 g005
Table 1. Compositional indices, with standard deviations, of fecal matter and soil samples. MC, moisture content; OM, organic matter content; db, dry basis.
SampleMC, g 100 g−1OM, g 100 g−1 (db)
Fecal Matter88.0 ± 0.388.6 ± 0.1
Soil19.2 ± 1.12.1 ± 0.3
Table 2. The sun’s position recorded at the Beltsville Agricultural Experimental Station. Weather conditions recorded at the nearby College Park Airport weather station (KCGS) on the five days of experimentation, at experimentation start time.
DateSun’s ElevationSun’s AzimuthTemperature (°C)Humidity (%)Conditions
9 July 201573.07°169.72°3155Scattered Clouds
10 July 201572.95°169.67°2751Scattered Clouds
15 July 201572.22°169.56°2578Clear
17 July 201571.88°169.59°2661Overcast
21 July 201571.15°169.74°2966Overcast
Table 3. Range of values for the ratio of 710:688 nm calculated for each sample type.
Sample TypeMinimum Value ObservedMaximum Value Observed
Fecal Matter on Leaf1.051.67
Soil on Leaf0.850.95
Uncontaminated Leaf2.033.75

