Article

RCLED Optimization and Nonlinearity Compensation in a Polymer Optical Fiber DMT System

1
School of Electronic and Information Engineering, Qingdao University, 308 Ningxia Road, Qingdao 266071, China
2
School of Information Science and Engineering, Southeast University, Nanjing 210096, China
3
Department of Electromechanical Engineering, University of Macau, Macau SAR 999078, China
*
Author to whom correspondence should be addressed.
Appl. Sci. 2016, 6(9), 260; https://doi.org/10.3390/app6090260
Submission received: 19 July 2016 / Revised: 6 September 2016 / Accepted: 6 September 2016 / Published: 13 September 2016
(This article belongs to the Special Issue Optical Modulators and Switches)

Abstract

:
In polymer optical fiber (POF) systems, the nonlinear transfer function of the resonant cavity light emitting diode (RCLED) drastically degrades the communication performance. After investigating the characteristics of the RCLED nonlinear behavior, an improved digital look-up-table (LUT) pre-distorter, based on an adaptive iterative algorithm, is proposed. Additionally, the system parameters, including the bias current, the average electrical power, the LUT size and the step factor are also jointly optimized to achieve a trade-off between the system linearity, reliability and the computational complexity. With the proposed methodology, both the operating point and efficiency of RCLED are enhanced. Moreover, in the practical 50 m POF communication system with the discrete multi-tone (DMT) modulation, the bit error rate performance is improved by over 12 dB when RCLED is operating in the nonlinear region. Therefore, the proposed pre-distorter can both resist the nonlinearity and improve the operating point of RCLED.

1. Introduction

Owing to the advantages of bend insensitivity, easy installation and robustness to the electromagnetic interference, the step-index polymer optical fiber (SI-POF) with a large core diameter becomes a popular transmission medium in short range communications, and can be used in a variety of applications [1,2,3,4,5]. Additionally, in the POF networking, the discrete multi-tone (DMT) modulation [6,7,8] with a bit-loading algorithm has been an efficient solution to maximize the system capacity [9]. However, the DMT signal is extremely sensitive to the nonlinear behavior of the SI-POF systems [10], and the low-cost resonant cavity light emitting diode (RCLED) is the main device that causes the nonlinearity due to the following two reasons [11]:
(1)
The nonlinear transition noise caused by the electro-optical (E/O) converter;
(2)
The clipping noise caused by the minimum turn-ON voltage and the maximum saturation voltage (SAV) or maximum permissible voltage.
To relieve the nonlinear distortions and improve the performance of the POF transmission, the RCLED must operate in the linear range. However, for the consideration of high power efficiency, the RCLED operating in the nonlinear region with signal compensation is preferred. In the existing works, the nonlinear distortion is mainly studied in the communication system with white LED [12,13], but few studies focus on the POF system with the nonlinear RCLED. Additionally, the RCLED has a larger bandwidth than the white LED, and the characteristics of the E/O converter are also different. Therefore, these existing methods for the white LED cannot be adopted directly in the POF system with RCLED. A look-up-table (LUT) pre-distorter is proposed to compensate the RCLED nonlinearity [14], but the parameters are fixed, thus it is inflexible for different DMT transmissions, which should be further developed for practical transmission. In addition, the bit redundancy is very large in the training procedure. Moreover, the power back off, the peak-to-average power ratio (PAPR) reduction and the iterative signal clipping technique can also be also for the nonlinearity mitigation [15,16], but the system complexity is increased and the bandwidth efficiency is sacrificed.
In this paper, the RCLED optimization and the nonlinearity compensation on the DMT modulation over a SI-POF link are first investigated. The transfer function of RCLED is measured and the nonlinear characteristics are theoretically analyzed. Joint optimizations are implemented to obtain the favorable linear region of RCLED and the appropriate operating points. To resist the RCLED nonlinearity at a high operating point, an improved digital LUT pre-distorter, based on an adaptive iterative algorithm is proposed in the DMT transmitter to compensate the nonlinear distortion. Moreover, a practical SI-POF with 50 m transmission is also realized to show the performance improvement with the proposed nonlinearity compensation method.
The remainder of this paper is organized as follows. Section 2 presents the measurements of RCLED and introduces a polynomial fitting to model the static power transfer function. The E/O nonlinear transition noise and the threshold clipping noise are theoretically analyzed in Section 3. In Section 4, an improved digital LUT pre-distorter with a least mean square (LMS)-based iterative algorithm is proposed. Section 5 gives the results and discussions. Section 6 concludes this paper.

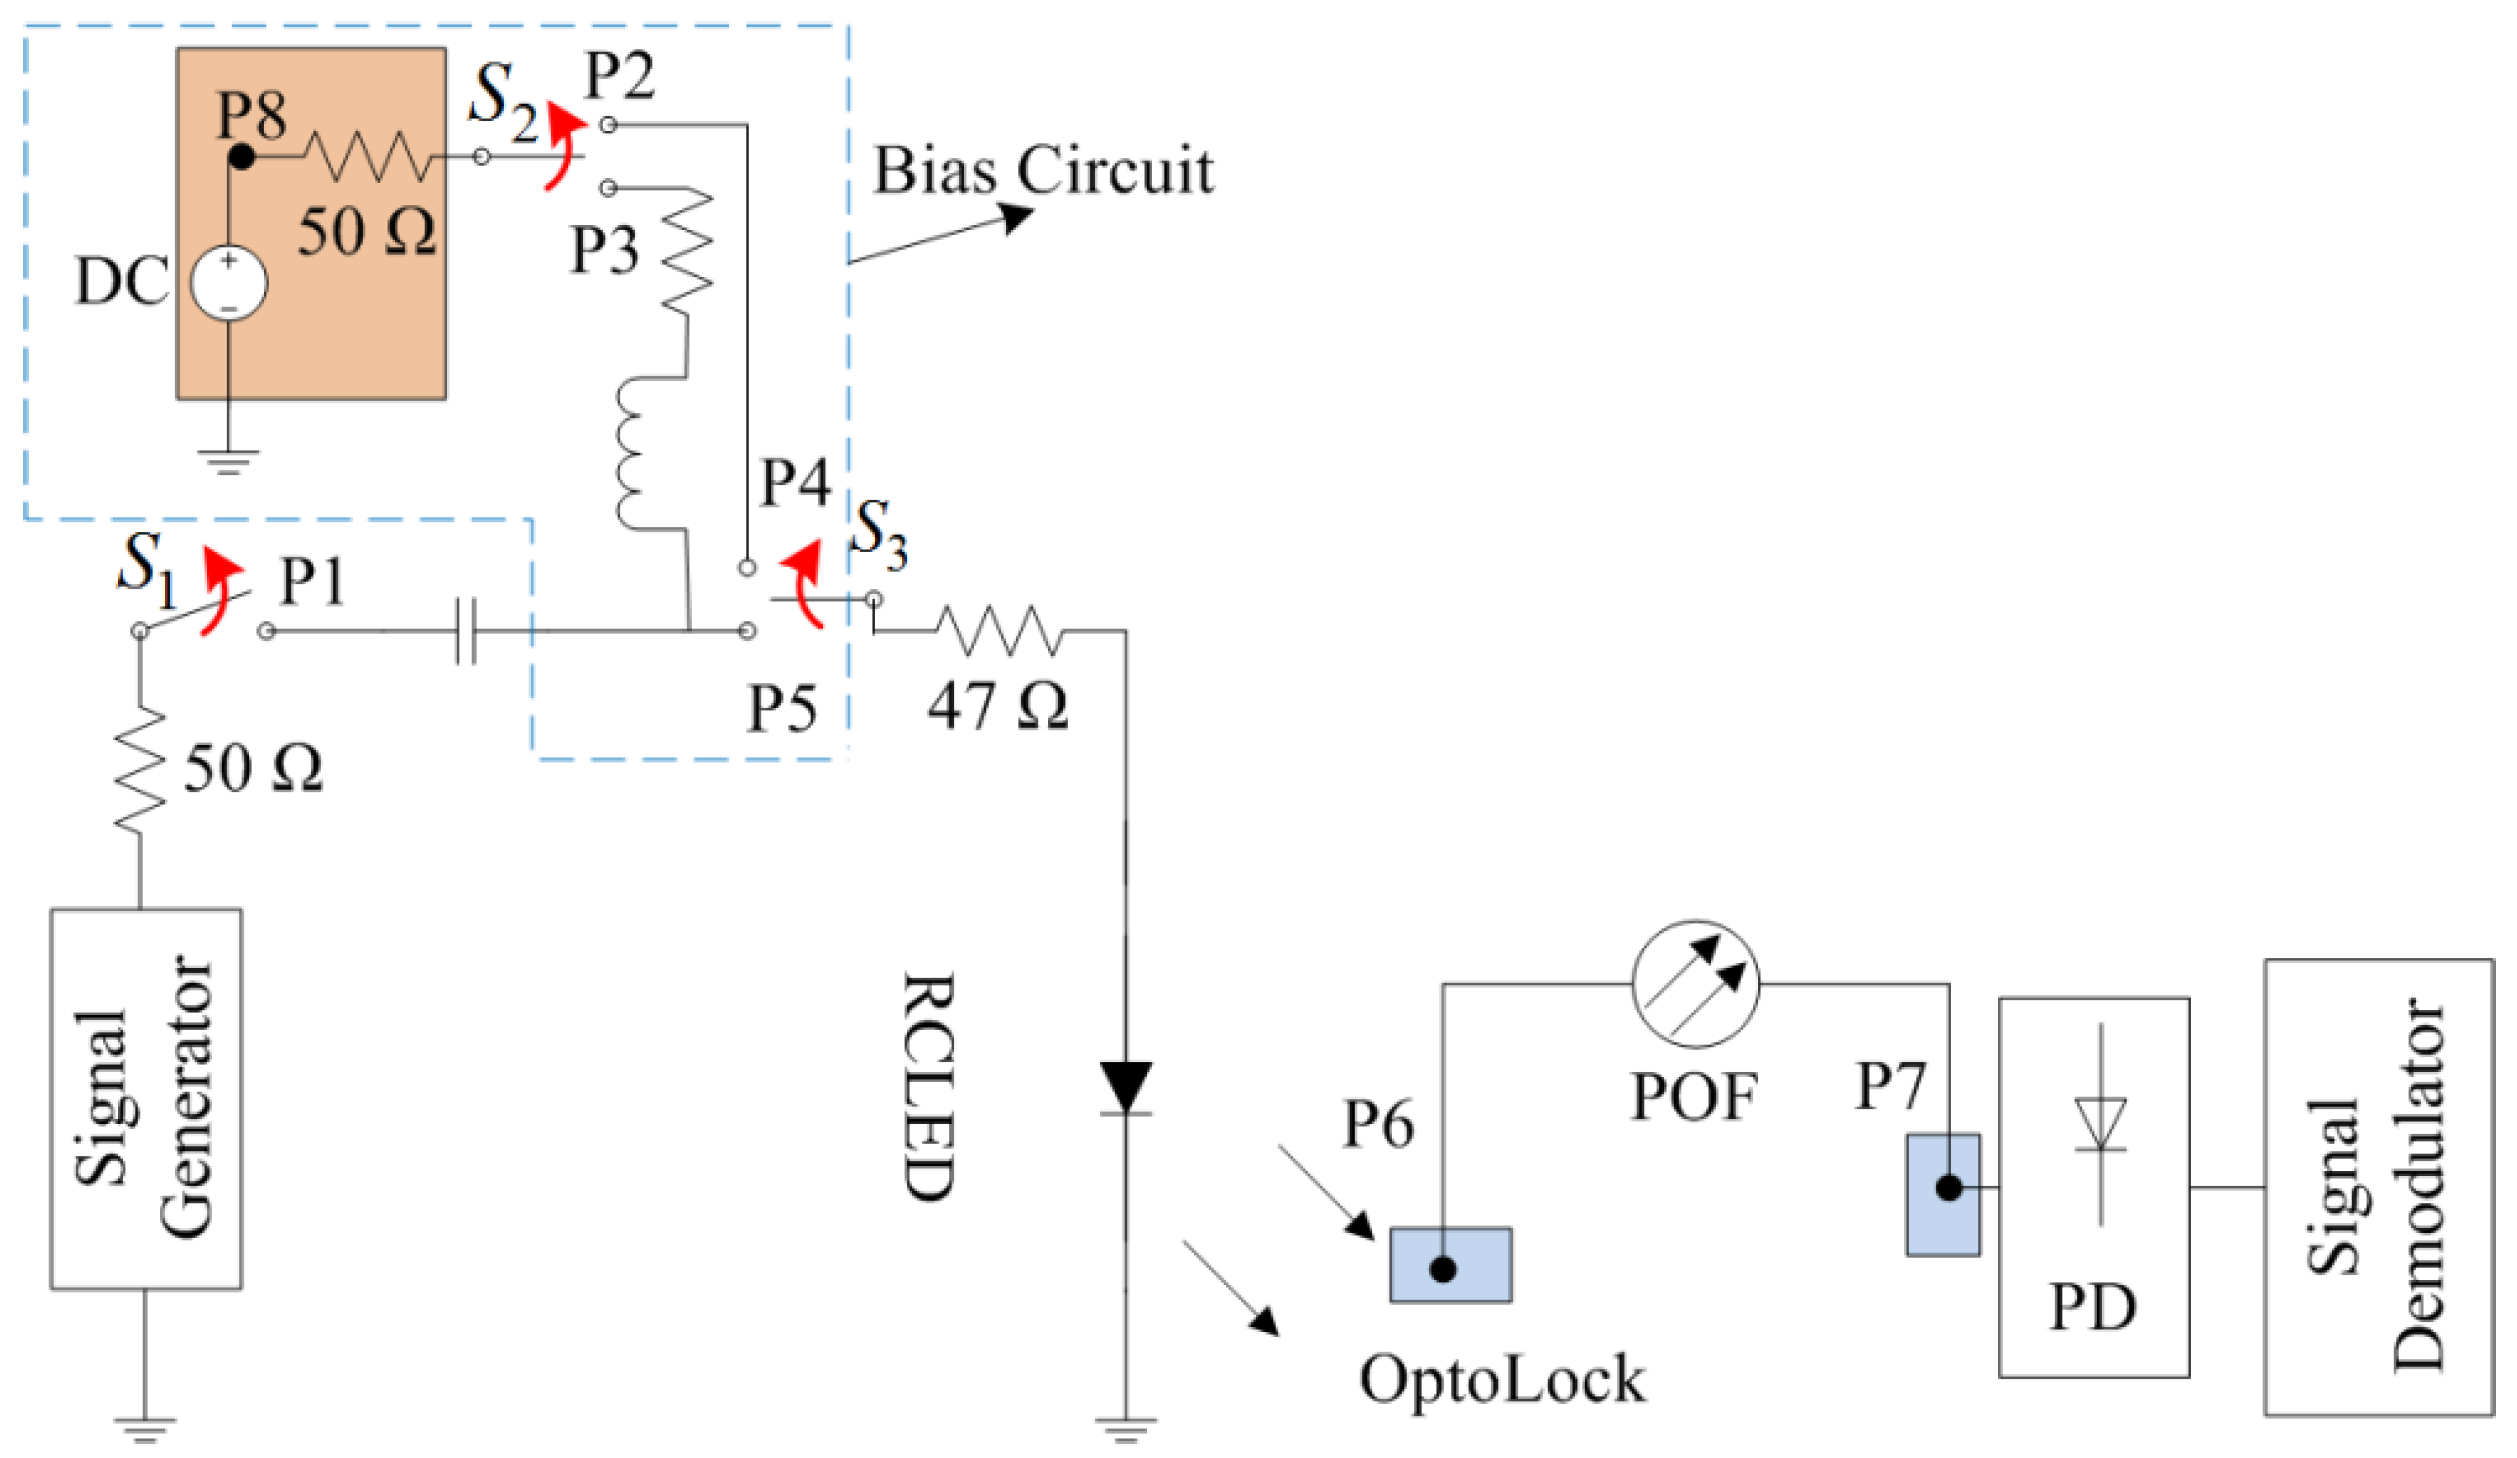
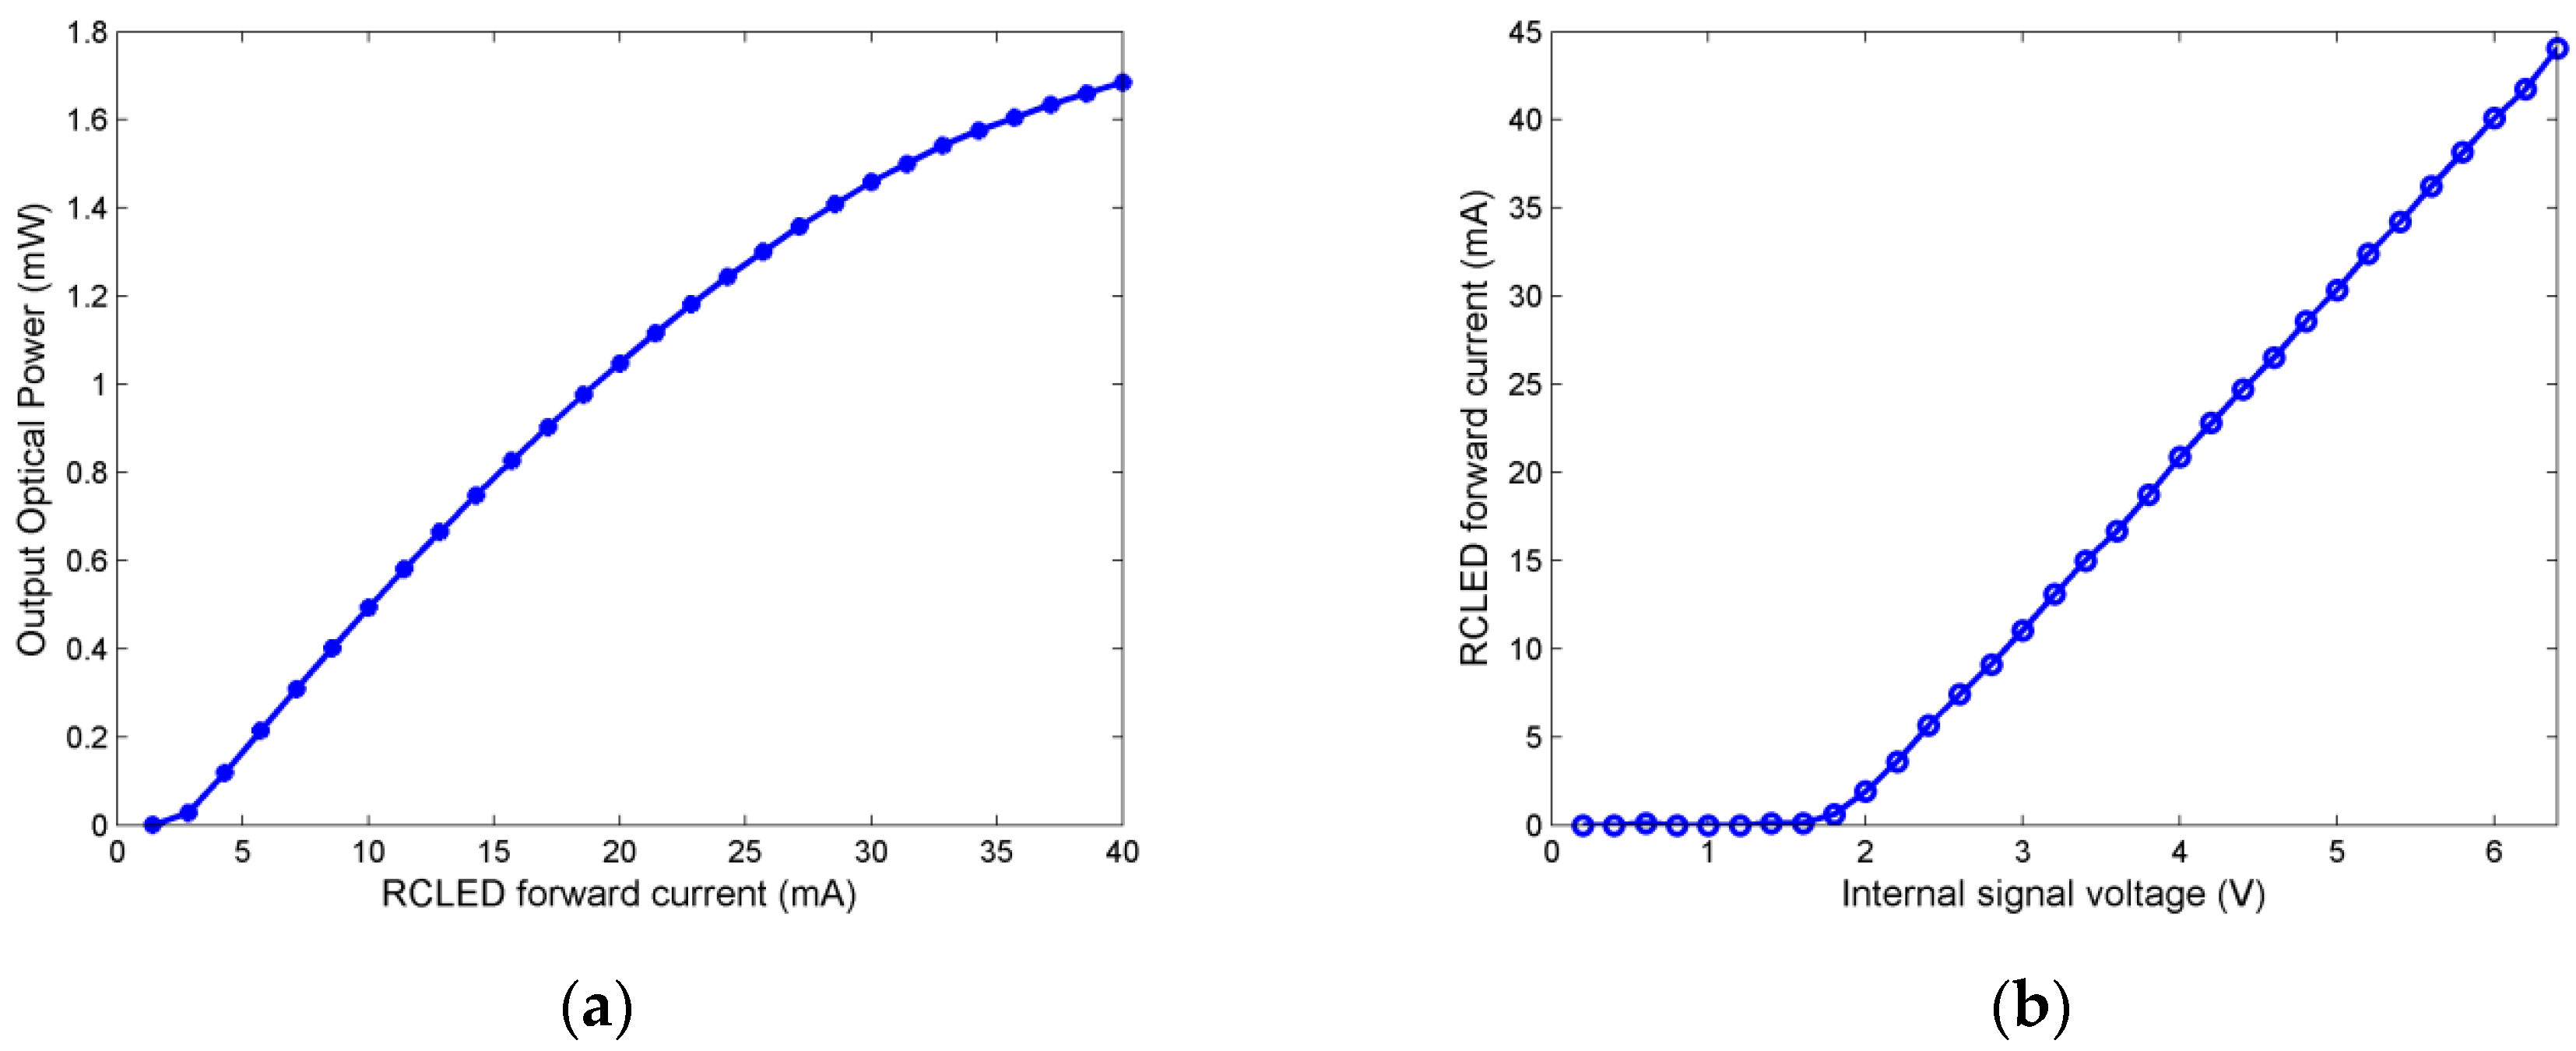
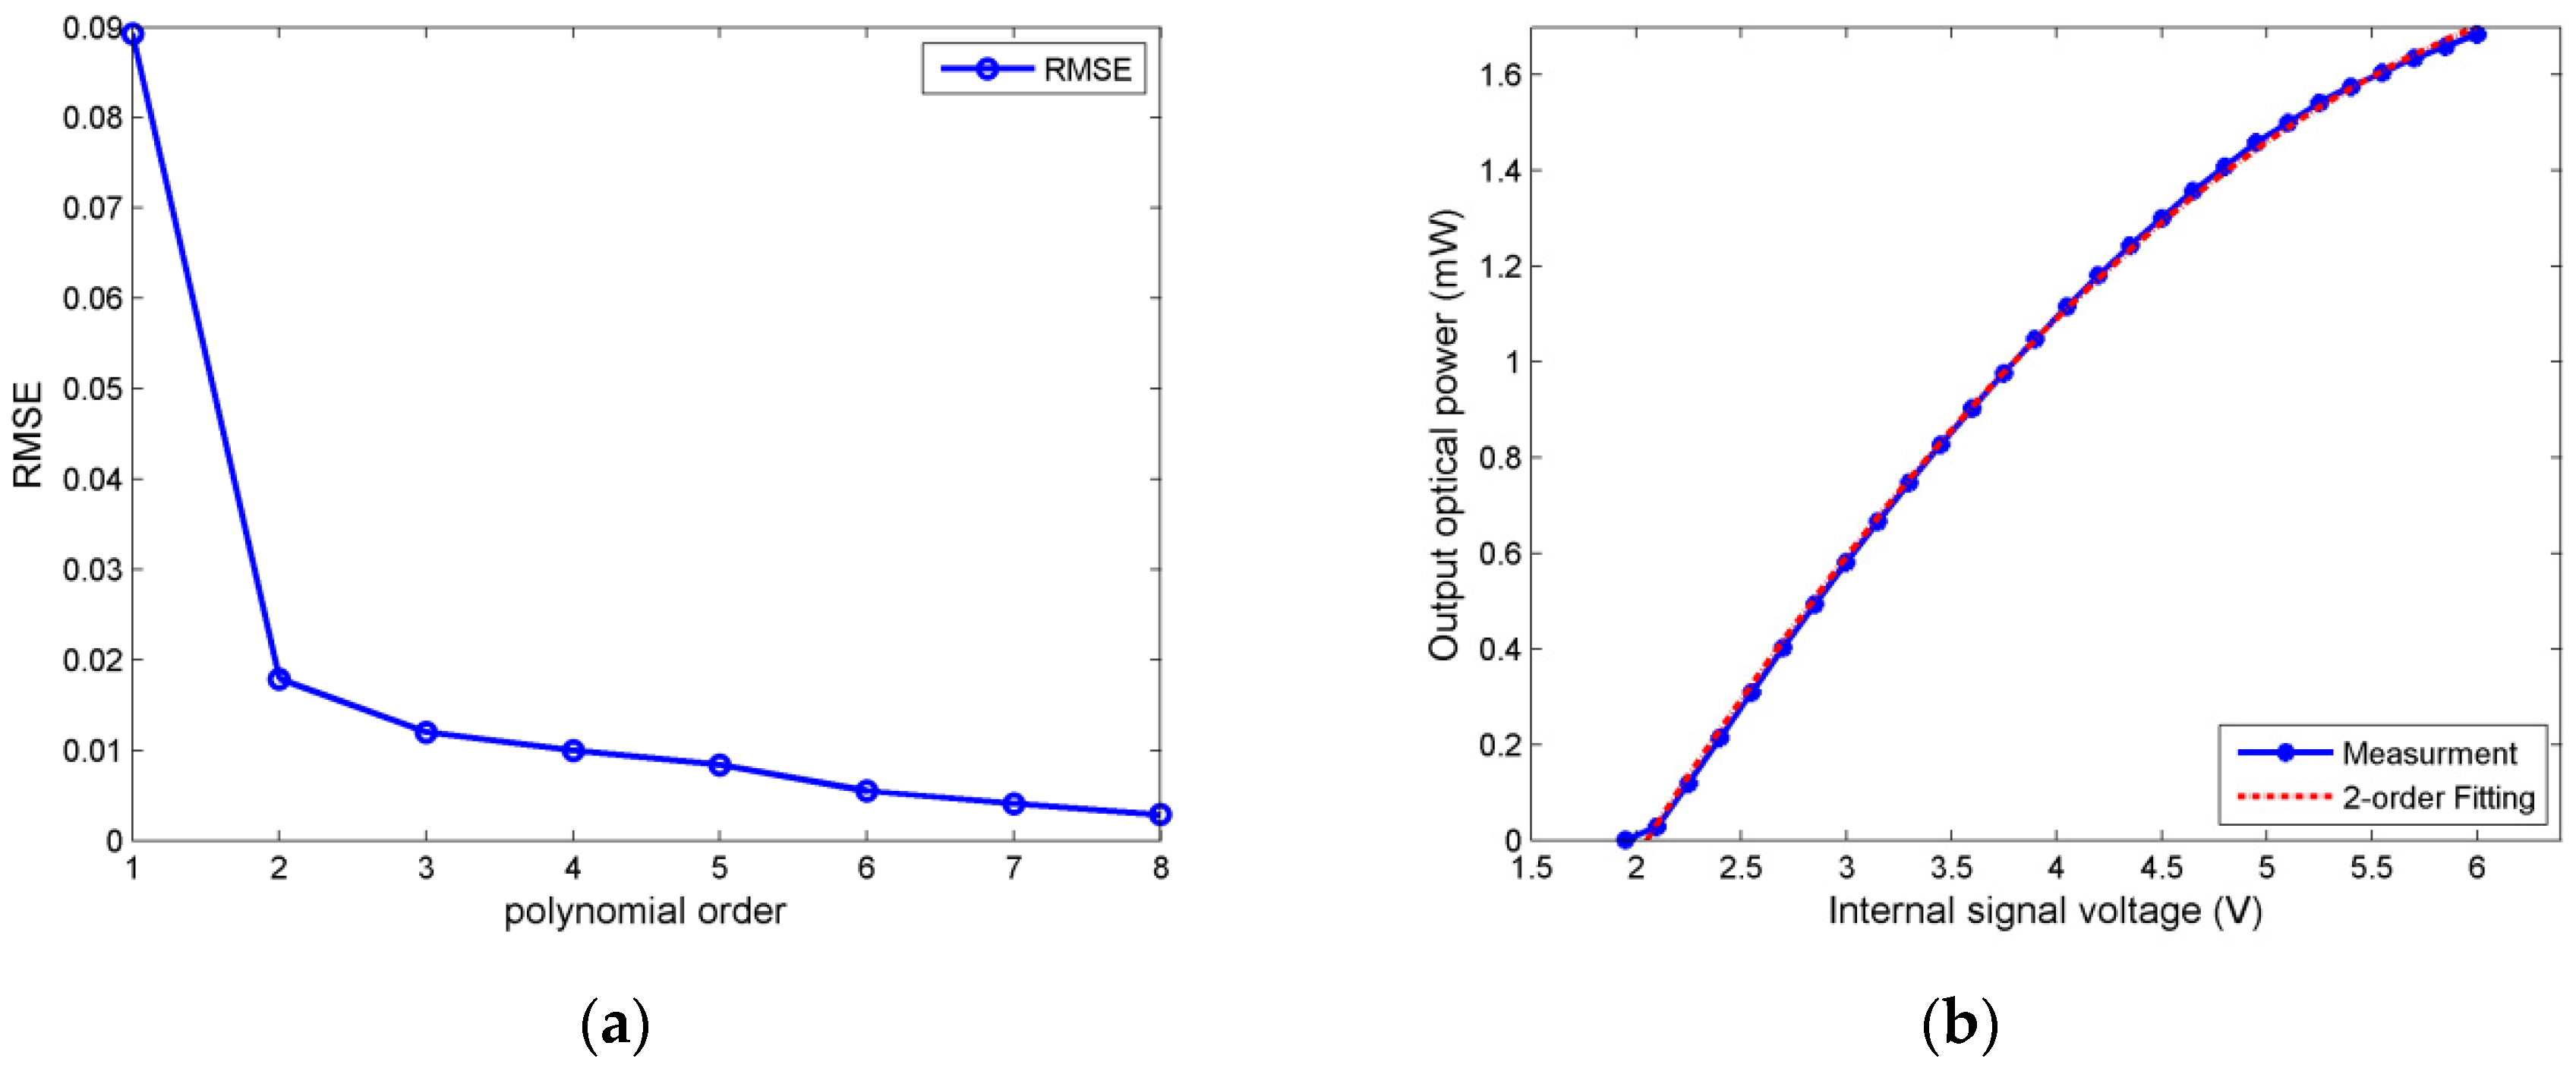
2. RCLED Measurement and Modeling

With the low cost consideration, most of the POF systems employ the intensity-modulation and direct-detection (IM/DD) structure rather than coherent modulation. In the IM/DD scheme, the power intensity of the RCLED is modulated by a real and non-negative DMT signal [15]. Therefore, owing to the bipolar DMT, the RCLED has to be biased before applying the modulating signal. The system diagrams of both the RCLED-based POF transmitter and the receiver are depicted in Figure 1. In the POF transmitter [14], the bias circuit is connected with the RCLED (FC300R-120™, Firecomms, Cork, Ireland), and the switches (S1, S2 and S3) are used to switch between the measurement and communication status. The OptoLock™ (Firecomms, Cork, Ireland) is employed to connect the SI-POF (ESKA™ Premier, Mitsubishi Rayon, Tokyo, Japan) between the RCLED emitter and Si-PIN photodetector (PD, FC1000D-120™, Firecomms, Cork, Ireland). In the POF receiver, the received optical signal is captured by the PD at P7, and the power intensity is converted into an electrical current, which is finally demodulated. In this paper, only the static case of the RCLED is measured and focused on.
In the measurement status, S2 and S3 are toggled towards the nodes P2 and P4, respectively, and S1 is open. The output optical power of RCLED Pout(IF) is measured at P6 by an optical power meter (PM100USB™, THORLABS, Newton, NJ, USA). Figure 2a shows the measured Pout(IF), where IF denotes the RCLED forward current. To get photons emission from RCLED, it generally suffices to provide current to RCLED. When IF is injected, an area forms in which there is a large concentration of holes and electrons in the p-n junction at the same time. However, the current-power characteristic only has linear with a small interval. The RCLED outputs only operate linearly in the range between 5 and 20 mA. Additionally, when IF is above 40 mA, the RCLED is saturated and the nonlinear characteristic is more significant.
The relationship between the measured internal signal voltage Vs at P8 and IF is illustrated in Figure 2b. With the internal 50 Ω source resistor and 47 Ω series resistor, the relationship is nearly linear. As seen in the Figure 2b, the IF dramatically increases when Vs >2 V, and the RCLED has a turn-ON voltage of around 1.8 V. Each diode has a minimum threshold voltage known as the turn-ON voltage, thus the RCLED is not conducting current when the Vs is below the turn-ON voltage. So the transmitting signal below this value is considered as clipped.
A polynomial model has been formulated to describe the nonlinear behaviors of white LED [12]. Similarly, the RCLED transfer function can be also numerically modeled by a Taylor series expansion
P out ( I F ) = n = 0 b n ( I F I DC ) n ,
where IDC denotes the bias current, and bn denotes the coefficient of the nth order polynomial. However, in this paper, to present the direct relationship between the input modulated signal voltage and the RCLED outputs, Pout(Vs) is modeled by a function of Vs rather than IF.
With the measured results in Figure 2, Pout(Vs) can be approximated by a polynomial of Vs based on the least-square fitting method, and the approximated results are shown in Figure 3, where the nonlinear behavior of the RCLED outputs are linear between 2.8 and 4 V. Additionally, the amplitudes of the input signal out of this range will be distorted. The accuracy of the polynomial approximation, in terms of root mean squared error (RMSE), depends on the fitting order. The RMSE is decreased as the fitting order increases. However, as shown in Figure 3a, a second-order fitting achieves a good performance, and provides a sufficient accuracy for the following theoretical analysis. Therefore, considering the computational complexity, the second-order polynomial is selected, and represented as
P out = b 2 V S 2 + b 1 V S + b 0 ,
where we choose b2 = −0.0643, b1 = 0.9482 and b0 = −1.6733 in our measurements.

3. Nonlinear Noise

A DMT symbol with N sub-carriers is mapped onto Xl = Al + jBl ( l = 0 , 1 , , N 1 ) based on the quadrature amplitude modulation (QAM) constellation. Then, the DMT symbol can be illustrated as
x k = 1 2 N n = 0 2 N 1 C n exp ( j 2 π n k 2 N ) ,
C 2 N l = C l * = X l * ,
where x k ( k = 0 , 1 , , 2 N 1 ) denotes the real-value modulated sequence with the inverse fast Fourier transform (IFFT) length being 2N, and (·)* denotes the complex conjugate. Additionally, C0 and CN are set to be zero. After, the digital to analog conversion (DAC), x(t) is obtained from xk, then added by the bias current IDC.
Assuming Xl to be statistically independent and identically distributed, both Al and Bl follow the Gaussian distribution with the central limit theorem when N is large enough. Since xk, is a sum of N independent random variables Xl, thus x(t) also approaches the Gaussian distribution with the mean E { x ( t ) } = I DC and the variance E { x 2 ( t ) } = σ 0 2 , where E { } denotes the statistical expectation. Accordingly, the probability density function P r [ x ( t ) ] of x ( t ) can be obtained as
P r [ x ( t ) ] = 1 2 π σ 0 2 exp ( ( x ( t ) I DC ) 2 2 σ 0 2 ) ,
According to the Bussgang theorem [10], the nonlinear distortion of x(t) can be described by a gain factor k op and an uncorrelated noise component n(t), i.e.,
y ( t ) = D { x ( t ) } = k op x ( t ) + n ( t ) ,
where D { } denotes the nonlinear behaviors of RCLED.
With E { x ( t ) n ( t ) } = 0 , k op can be calculated by
k op = E { x ( t ) y ( t ) } σ 0 2 ,
Since the RCLED nonlinearity includes both the E/O nonlinear transition noise n dis and the turn-ON voltage and SAV threshold clipping noise n clip , after the SI-POF transmission, the overall noise power can be written as
P noise = P awgn + P dis + P clip ,
where P dis and P clip denote the power of n dis and n clip , respectively, P awgn denotes the background noise power in the receiver. Due to the deviation from the ideal linear E/O transition L ( x ) , P dis can be calculated as
P dis = I I + [ g ( x ) L ( x ) ] 2 P r ( x ) d x ,
where g ( x ) denotes the practical E/O response of RCLED, I and I + denote the threshold and maximal value, respectively. Similarly, P clip can be obtained by
P clip = I + + ( x I + ) 2 P r ( x ) d x + I ( x I ) 2 P r ( x ) d x = k 1 σ 0 + I DC + ( x k 1 σ 0 I DC ) 2 P r ( x ) d x + I DC k 2 σ 0 ( x I DC + k 2 σ 0 ) 2 P r ( x ) d x = 2 π σ 0 2 [ 1 k 1 3 exp ( k 1 2 2 ) + 1 k 2 3 exp ( k 2 2 2 ) ] ,
where k 1 = A 1 2 E { x ( t ) } and k 2 = A 2 2 E { x ( t ) } are the clipping ratio in the upper and lower directions, respectively.A1 and A2 are the clipping levels. Therefore, the noise components of n dis and n clip have a significant impact on the system performance, especially in DMT system characterized by a large PAPR.

4. Nonlinearity Mitigation

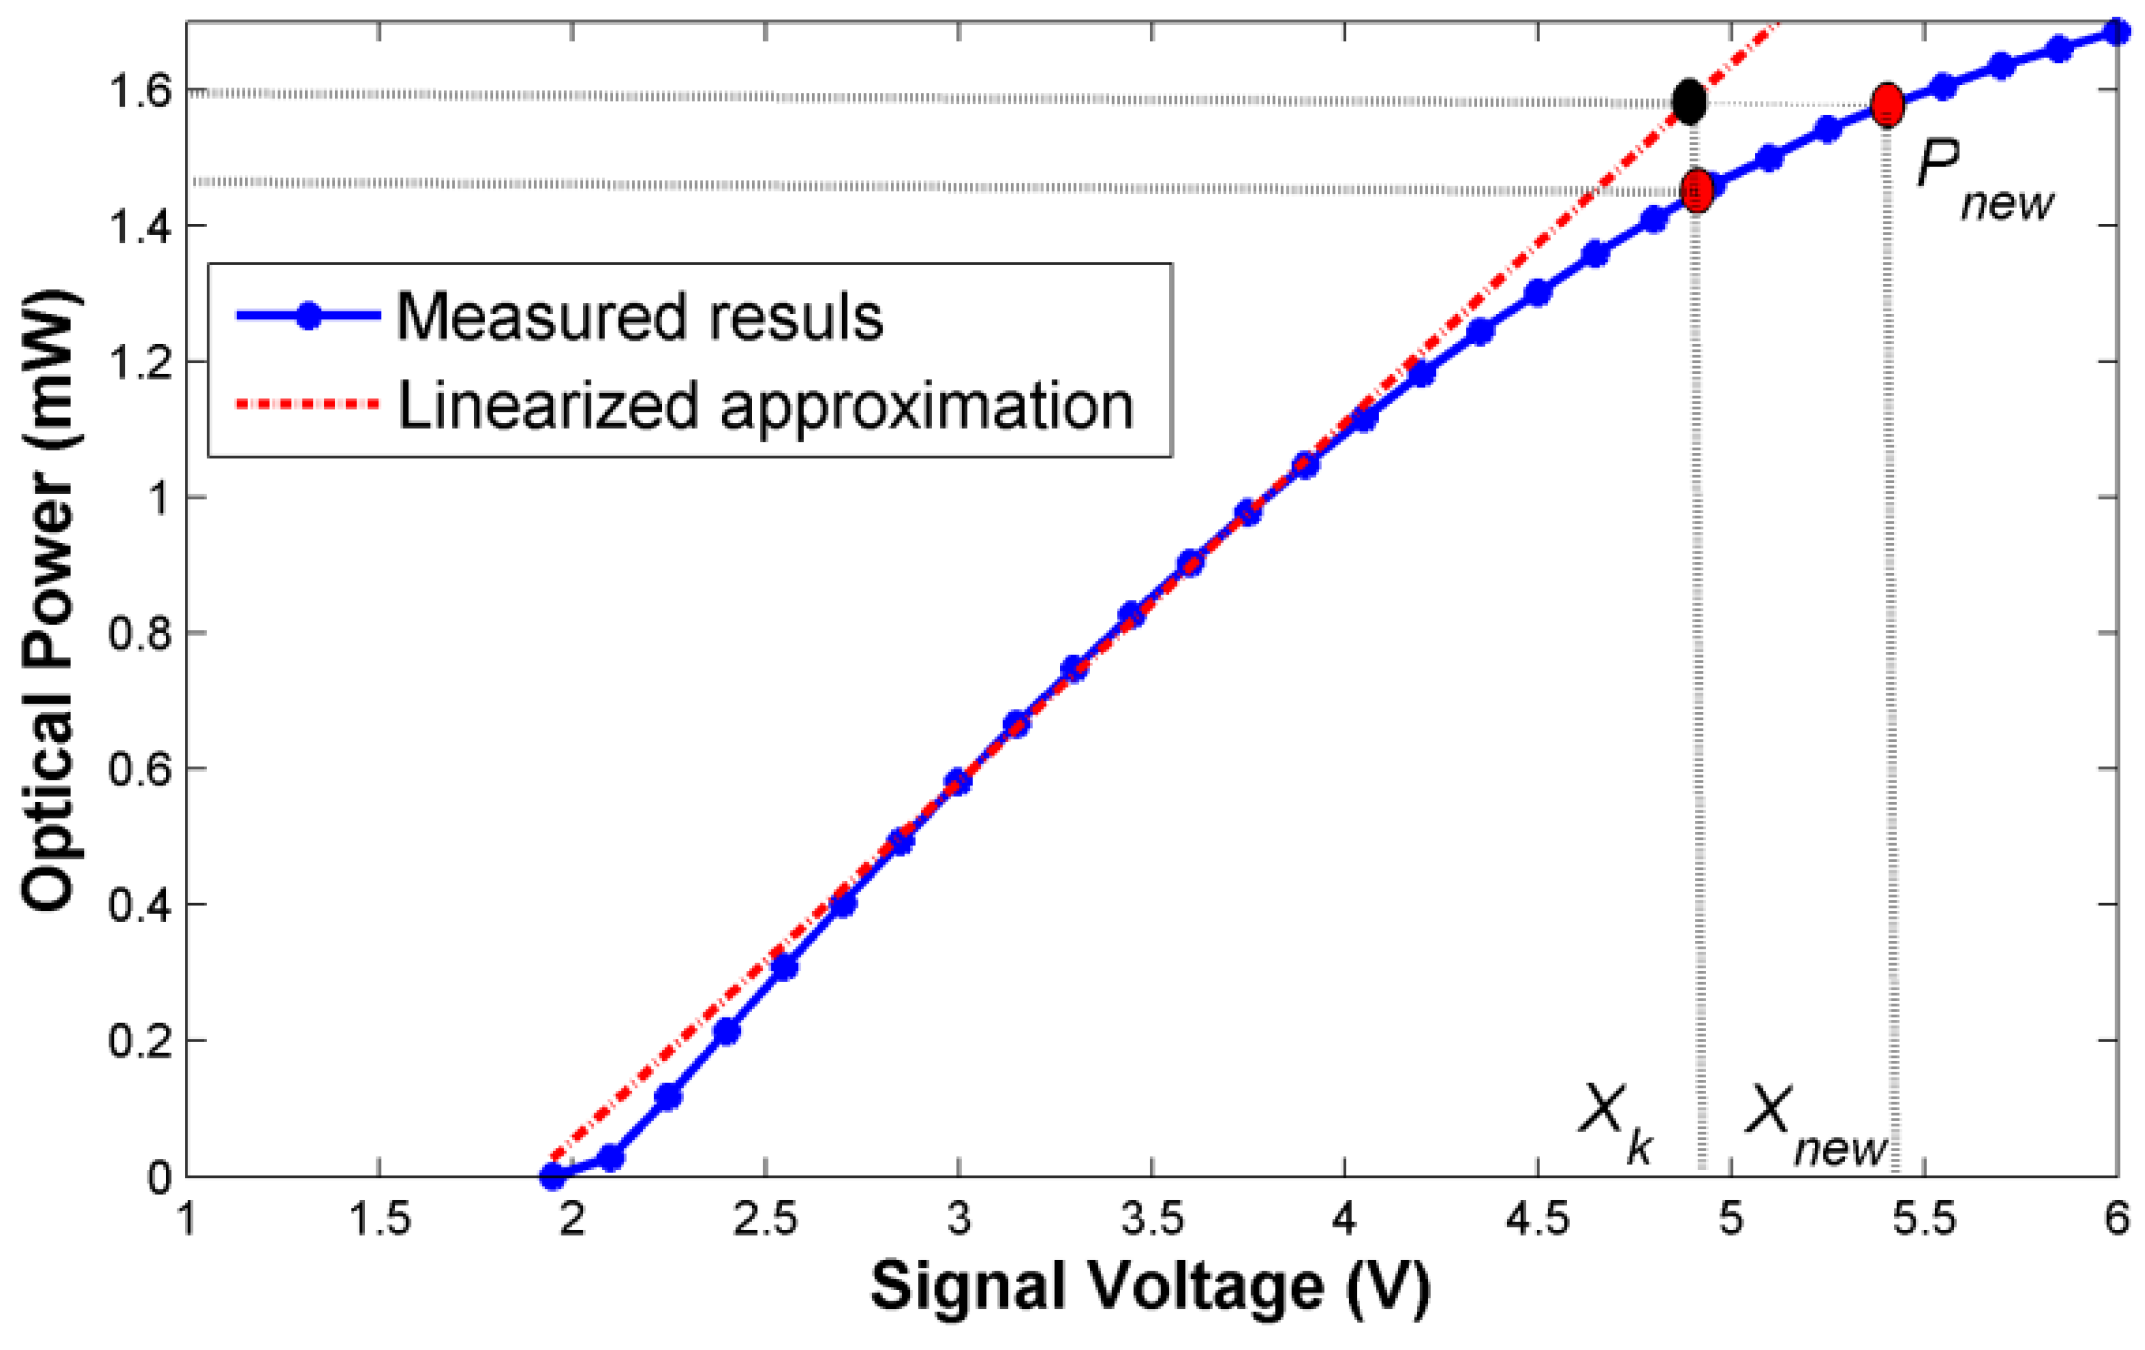
4.1. Operating Point Optimization

From the analysis of Eq. (9) and Eq. (10), the nonlinearity of RCLED is mainly determined by the bias current I DC and the signal variance σ 0 2 . To relieve the nonlinear distortions and maximize the power efficiency of RCLED, the parameters I DC and σ 0 2 must be optimized in the system design. Note, σ 0 2 can be directly measured by averaging the electrical power P Eave of x ( t ) in the practical systems.
To investigate the influence of I D C on the signal distortions, the error vector magnitude (EVM) metric, defined as the RMS value of the difference between a collection of measured symbols and ideal symbols, is used to measure the distortion degree. The EVM is expressed by
EVM = 1 N i n = 1 N i | S n S 0 , n | 2 1 N i n = 1 N i | S 0 , n | 2 ,
where S n denotes the normalized received symbol, S 0 , n denotes the ideal constellation points, and N i denotes the number of symbols in the constellation.
Therefore, an approximate linear region can be roughly obtained through the analysis and comparison of the EVM measurement for different QAM constellations. The modulating signal can be operated in this linear region by optimizing I DC , but the clipping distortion still occurs with the large peak-to-peak values of the inputs. Hence, the peak-to-peak range of x ( t ) , in terms of P Eave , must also be considered in the practical transmitter. To investigate the influence of P Eave on the RCLED nonlinearity, the bit error rate (BER) is adopted to measure the communications quality and to obtain an available power range of P Eave . Additionally, it should be noted that the available input power ranges also depend on I DC . Therefore, the optimal parameters including I DC and P Eave are the tradeoffs between the communication quality and the power efficiency, and the details are discussed and verified in Section 5.

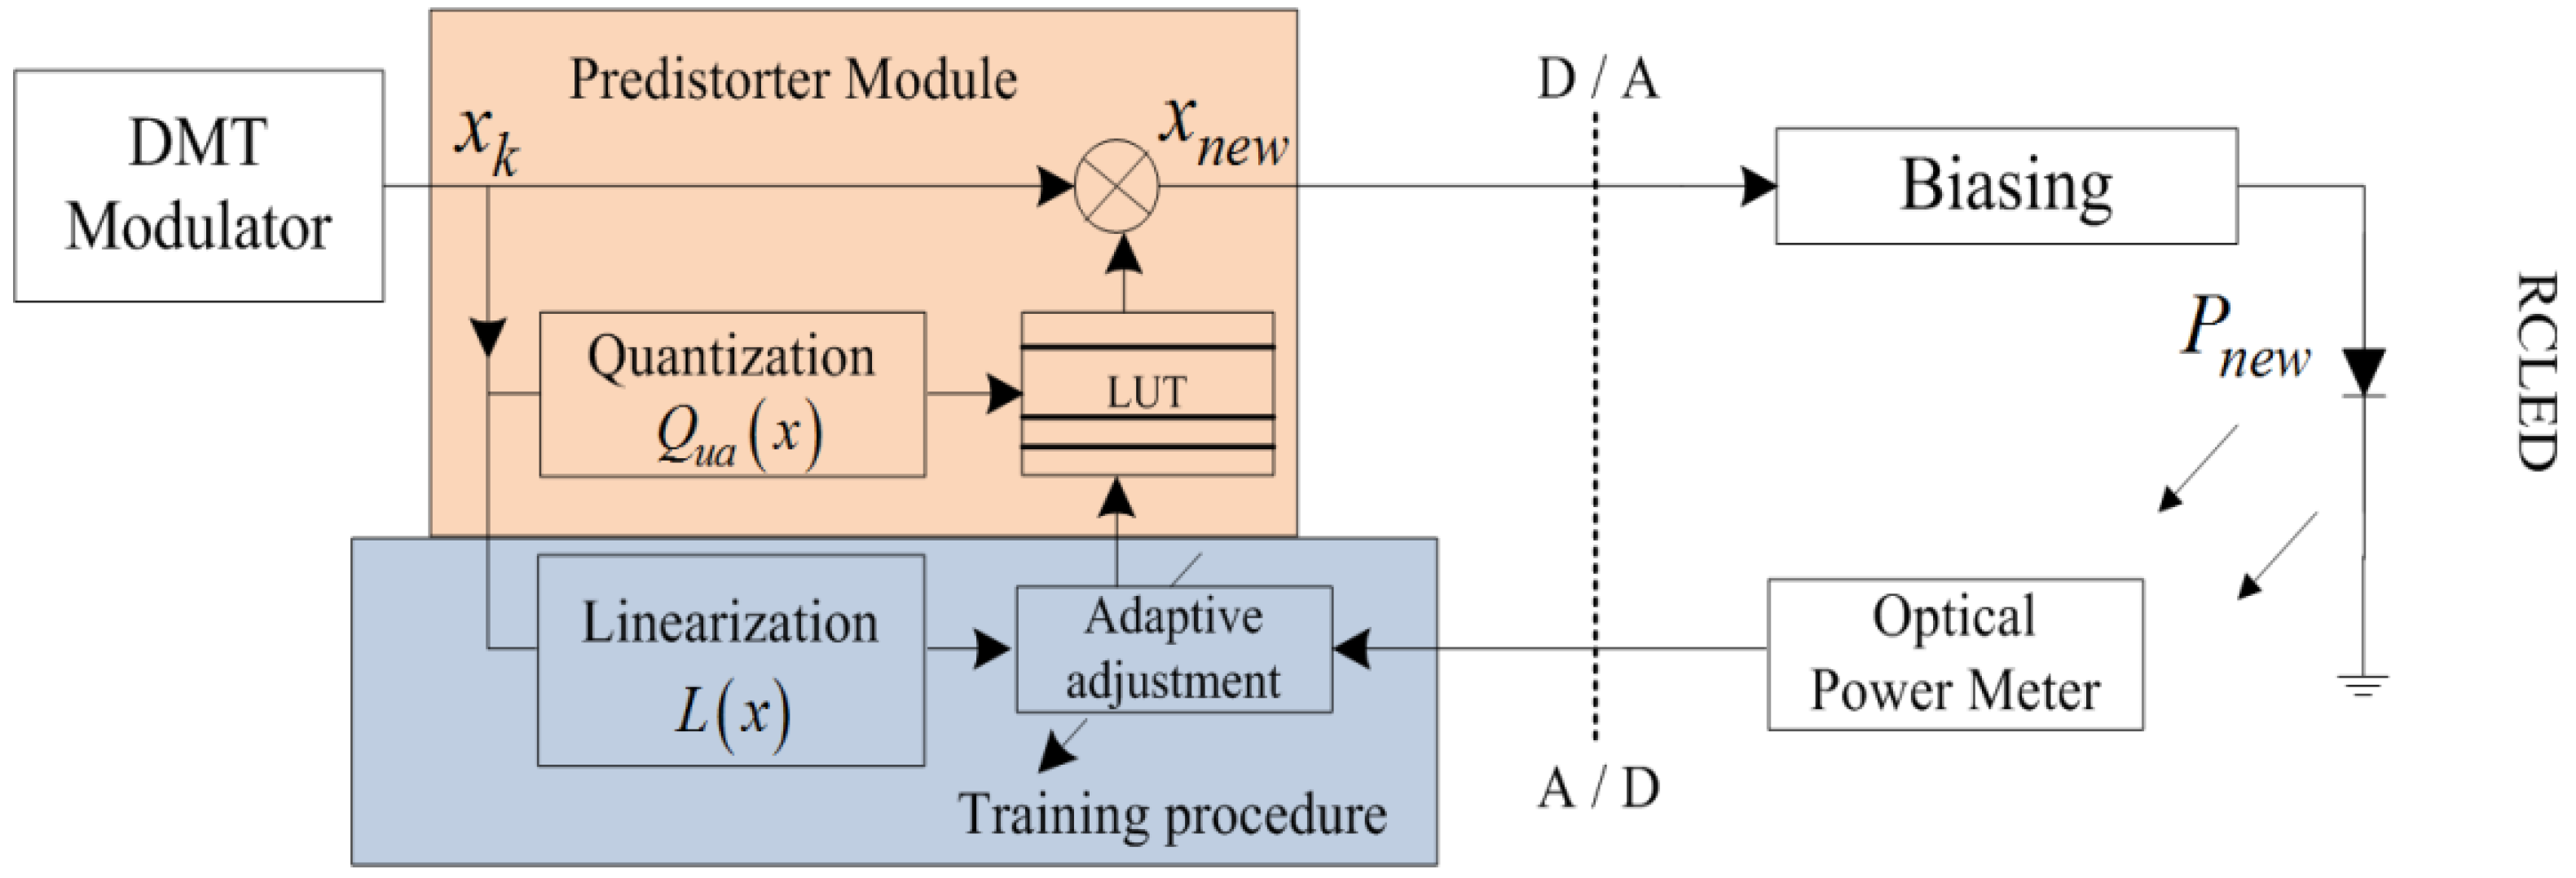
4.2. Nonlinear Compensation

Owing to the mode attenuation of SI-POF, high optical power outputs are required at the transmitter in the case of the detection sensitivity demanding at the receiver. When the high optical power is obtained by operating the RCLED at the large working point, the nonlinear distortion will be introduced [17,18,19]. To mitigate the RCLED nonlinearity in the practical POF transmitter, an improved digital pre-distorter is proposed in the signal generator, considering both the computational complexity and the bandwidth efficiency.
The basic idea of the digital pre-distorter is shown in Figure 4. The pre-distorter adjusts the modulating signal x k to be a desired one x new , which drives the RCLED to produce the correct output P new , thus the cascade response of the pre-distorter and RCLED chain can be linear [14]. Note that if P new is larger than the saturation level of RCLED, the corresponding x new cannot fully compensate the nonlinearity. Therefore, the RCLED must be back off from SAV to the corresponding peak, to the average level of the signal.
In the communication status, as shown in Figure 1, S2 and S3 are toggled towards the nodes P3 and P5, respectively, and S1 is connected to P1. The desired linear curve L ( x ) , shown in Figure 4, can be expressed as
L ( x ) = k l V S b l ,
where kl = 0.5278 and bl = 1.0017.
The pre-distorter based on an adaptive digital LUT is shown in Figure 5. The nonlinear signal x k is adjusted to a linear one x new = η L x k , where η L denotes the gain coefficient. η L can be sought by a quantization function Q ua ( ) , which indicates the corresponding index of the gain vector η = [ η 1 , η 2 , , η M L ] T , where M L denotes the LUT size. With the input x new , the linear output power can be captured by an optical power meter and detected as P new = g ( x new ) .
To obtain η , a training procedure must be implemented first. However, the maximum amplitude of the linear input x k depends on the turn-ON voltage and SAV of the RCLED. Thus, considering the commercially available RCLED used in this paper, the operating region of the pre-distorter must be set between 2.2 and 5.236 V, so that the values out of this range are clipped. Therefore, in the training procedure, a pilot signal X pilot with a sawtooth shape, as shown in the Figure 6, is sent through the pre-distorter firstly.
We propose an adaptive iterative algorithm with three main sections. First, X pilot is quantized equally into M L parts, and each sub-portion is split equally into N x slots. Second, the differences between the ideal linear and the actual output of RCLED are obtained. Third, the gain value η is obtained based on the LMS criterion. Algorithmically, the details are given in Algorithm 1.
Algorithm 1: An adaptive iterative algorithm to obtain the gain values η .
Input: Initial gain vector η = [ η 1 , η 2 , , η M L ] T and W = [ w 1 , w 2 , , w M L ] T , quantized pilot signal X pilot = [ X 1 , X 2 , , X M L ] T , slot number N x , step factor μ L , stop criteria Ψ , the maximum pilot number P Num , and the adaptive adjustment factor κ and λ .
Initialization: η = 1 , W = 0 , P Cnt = 1 .
Step1. Divide X i into equally N x slots, the i th sub-portion pilot can be expressed as X i = [ x i , 1 , x i , 2 , , x i , N x ] T ( i = 1 , 2 , , M L ).
Step2. for j = 1 to M L do
      w ^ = η j ;
     for i = 1 to N x do
      x ^ n e w = w ^ x j , i ;
      P ^ new = g ( x ^ new ) ;
      P linear = L ( x j , i ) ;
      ε ^ = P linear P ^ new ;
      w ^ = w ^ + μ L x j , i ε ^ ;
    end for
      ε ( j ) = ε ^ ;
      w j = w ^ ;
   end for
Step3. η = W .
Step4. if | ε | 2 M L > Ψ , then
     P Cnt = P Cnt + 1 ;
     if P Cnt > P Num , then
     N x = κ N x ;
     μ L = λ μ L ;
    go to Step1.
     end if
     go to Step2.
   end if
Step5. if P Cnt < P Num and | ε | 2 M L < Ψ then
    break.
   else P Cnt = P Cnt + 1 , go to Step2.
   end if
Output: The gain value vector η , the overheads of pilot signal P Cnt , the RMSE | ε | 2 M L .
In essence, Steps 1 to 5 iteratively find the gain vector η . Additionally, in Step 4, the N x and μ L are also adaptively adjusted by κ and λ to fulfill the minimum symbol overheads requirements. According to the accuracy demands of LUT prediction and the training expenses, the favorable Ψ and P Num are empirically selected to guarantee algorithm convergence. Moreover, the system computational complexity O ( N x M L ) are directly related to the slot number N x and the LUT size M L . Therefore, the accuracy of LUT pre-distorter must be balanced with the computational complexity.
Different from the conventional methods, where the gain value is updated only once in each iteration, the proposed algorithm takes at least N x times updates in one iterative cycle and fewer pilot signals are consumed. Additionally, both the bit redundant and overheads are reduced. Moreover, the N x and μ L can be adaptively adjusted in the training procedure by the factor κ and λ , respectively.

5. Results and Discussions

The block diagram of the transmission system is shown in Figure 1 based on the off-line processing. A 10-bit DAC and 8-bit analog-to-digital conversion (ADC) are used in the signal generator and the signal demodulator, respectively. The measured 3 dB bandwidth of RCLED is around 135 MHz when the system works at I DC = 20 mA. The PD gives a current output proportional to the detected optical power at a responsivity of 0.3 A/W. The background noise power spectral density (PSD) is measured at around -110 dB/Hz. Since only the static case is modeled in this paper, the frequencies below the RCLED’s 3 dB bandwidth have a close and similar power transfer function as the DC region. Accordingly, the signal bandwidth must be less than the RCLED’s 3dB bandwidth. Therefore, the parameters of the following DMT modulation are designed based on Table 1. In addition, a bit-loading allocation for the DMT signal described in Figure 7 is also adopted in our transmissions. For fair comparison, all DMT schemes own the fixed clipping ratio [16] of 12 dB.

5.1. Nonlinear Effect

To evaluate the RCLED nonlinear effect, the DMT transmission with a total bit rate of 750 Mbps over a 50 m SI-POF link is conducted under the following two conditions: (a) P E a v e = 6 dBm and I D C = 20 mA; (b) P E a v e = 8 dBm and I D C = 22 mA. The Chow bit loading algorithm [20] is adopted with the objective BER at P e = 1 × 10 3 , which is favorable for the reception with forward error correction (FEC). After POF transmission, the received symbols are demodulated in the demodulator. Figure 8 compares the measured subcarrier BERs with both the absence and the presence of the nonlinear effect. It can be observed that the excess noise, which appeared in Figure 8b, increases the noise standard by a factor of 6, approximately. In addition, the nonlinearity affects the signals significantly at low frequencies more than at high frequencies, mainly because the high frequency parts are more attenuated by the low-pass characteristics of the RCLED and therefore suffer less from the nonlinearity [21], which indicates that the low frequency signals are more sensitive to the nonlinear distortion.

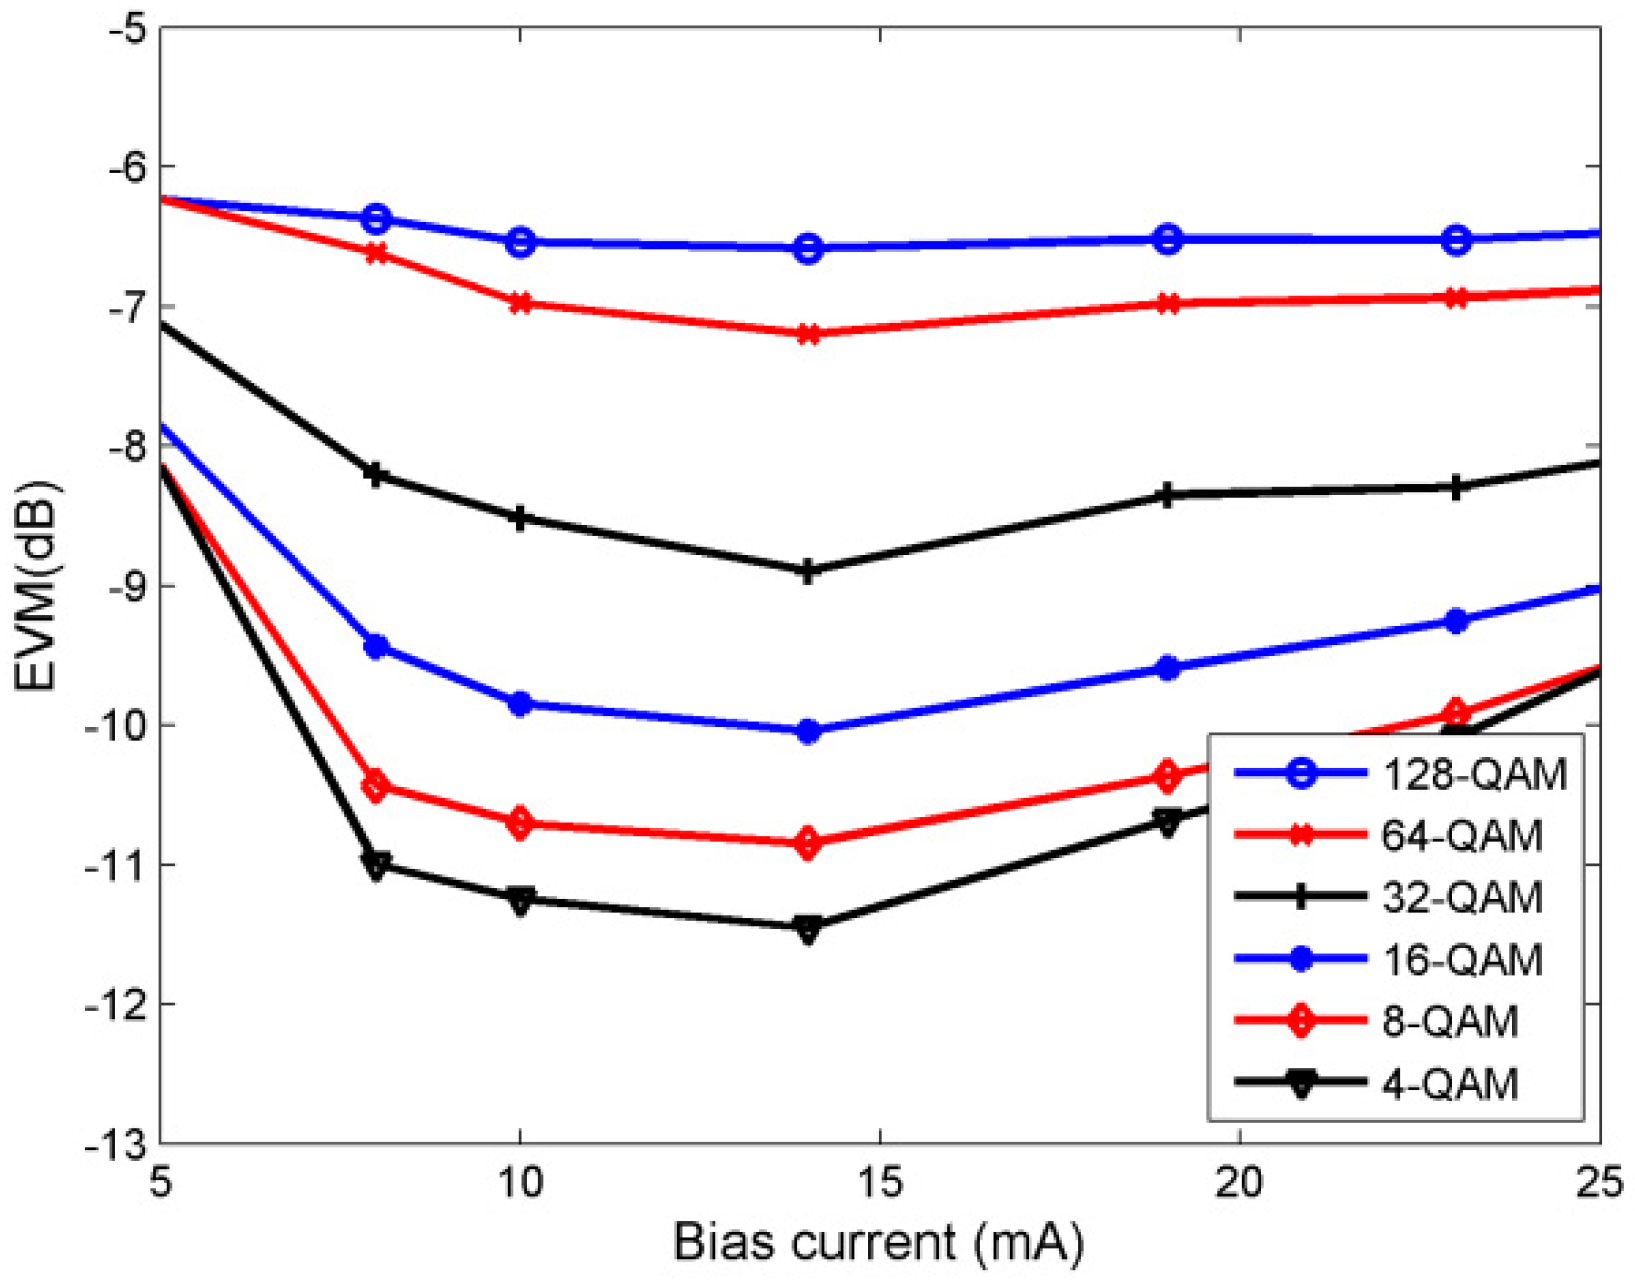
5.2. Effect of DC Bias

In this study, the average electrical power is kept at a constant of P Eave = 8 dBm, and I DC is swept from 5 to 25 mA [14]. The EVM performance for different QAM modulation orders are depicted in Figure 9. For 4-QAM to 32-QAM modulation, it can be found that the favorable range is from 10 to 20 mA, and the system achieves the lowest EVM value nearby 13 mA. In addition, the EVM is increased when I DC is beyond 20 mA, and n dis is expected to dominate noise when operating at high working points. Whereas for 64-QAM and 128-QAM signals, the EVM performances are little improved, which indicates that high order modulations are more sensitive to the nonlinear distortion. Therefore, the selection of modulation orders must be considered for the system design to avoid the performance degradation.

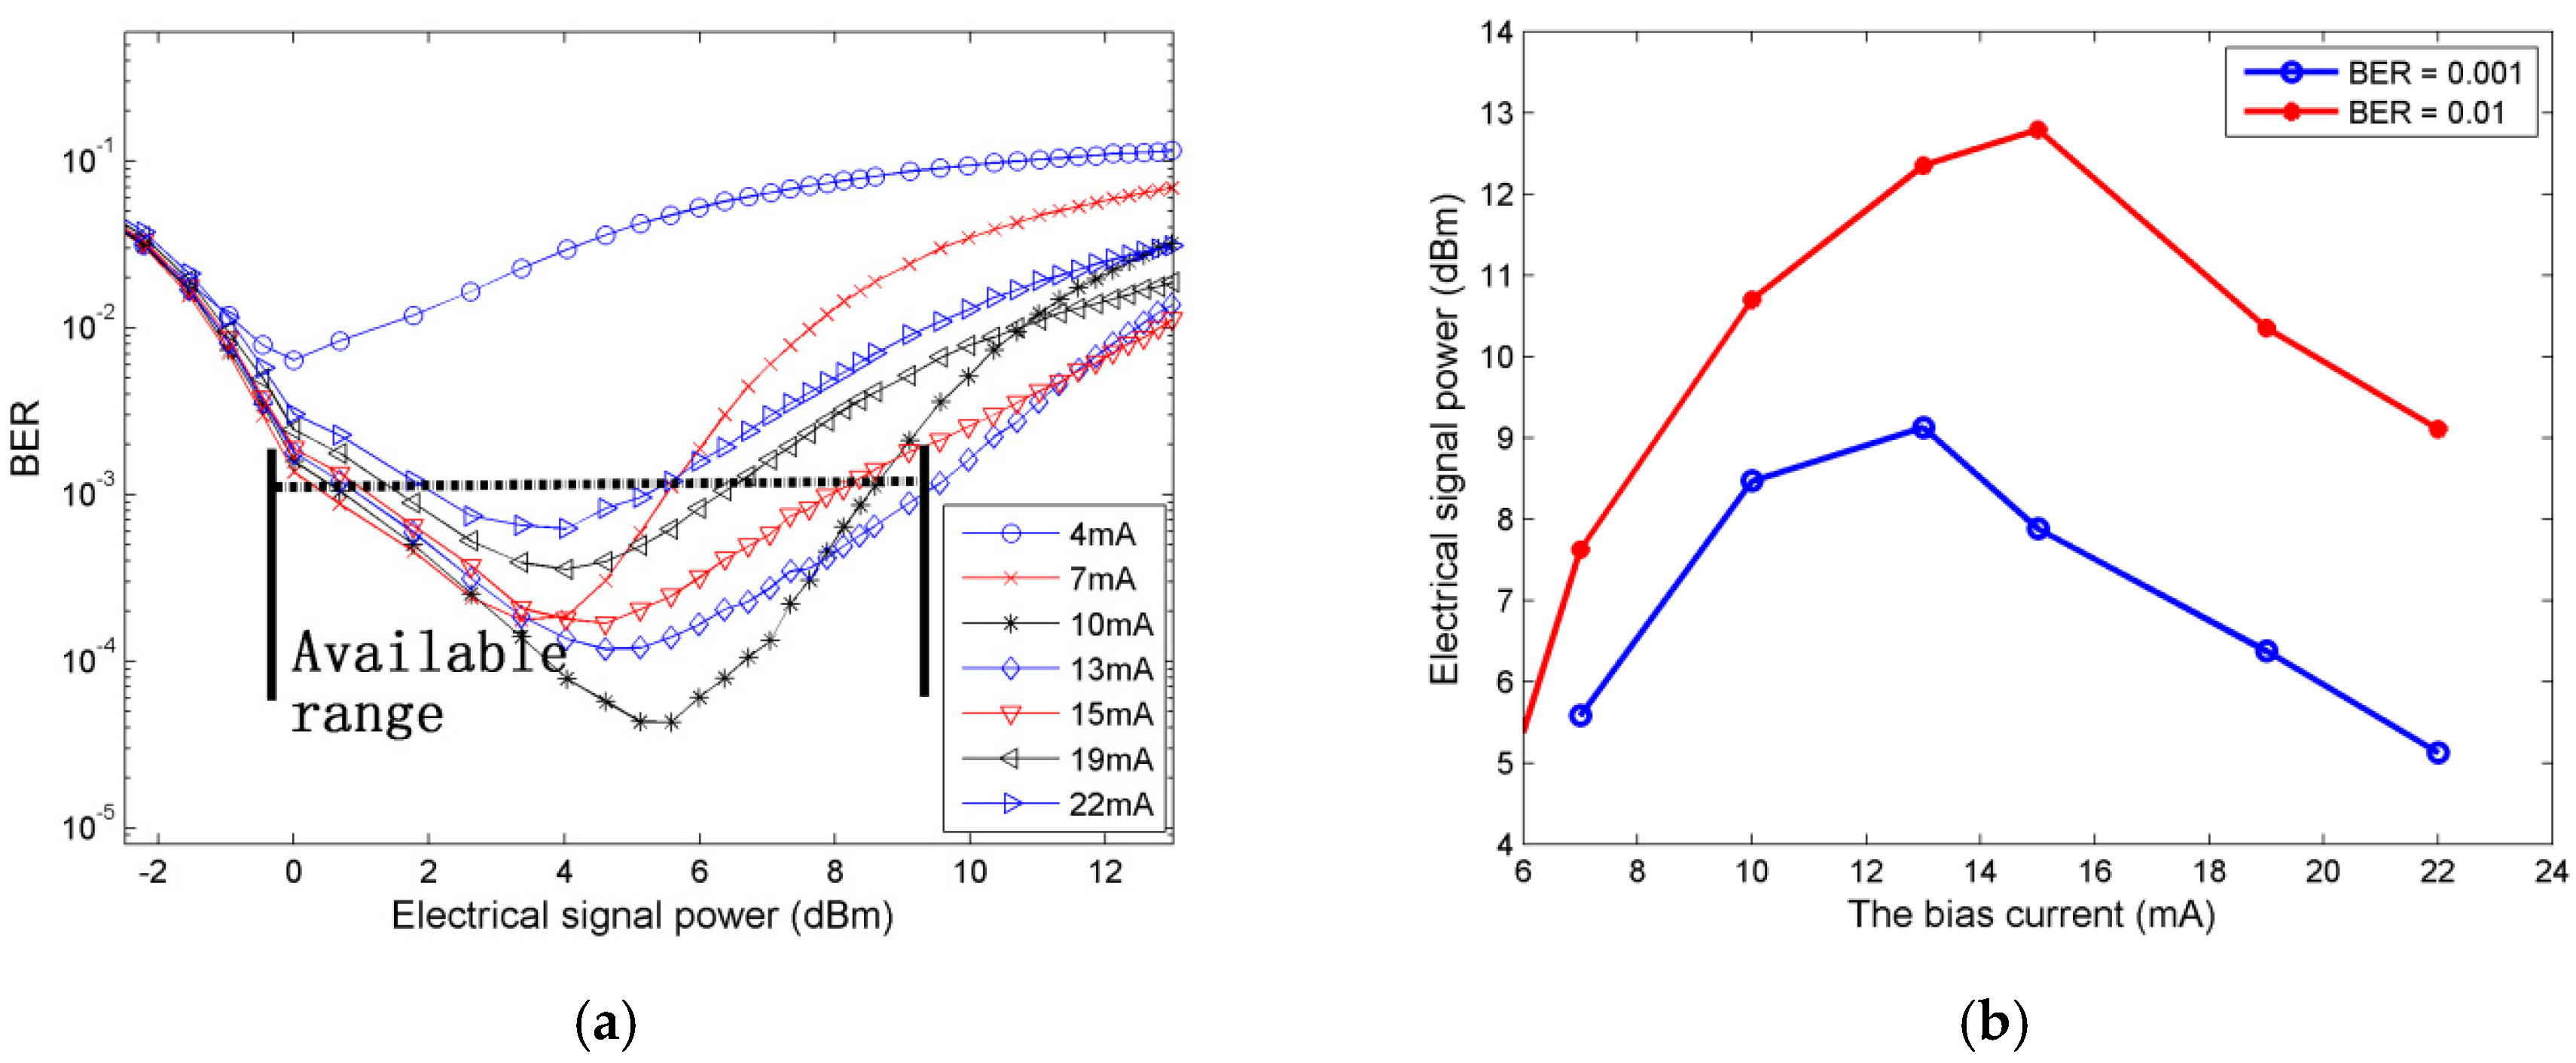
5.3. The Effect of Input Power Range

In this study, several delivery tests employing the Chow algorithm with a transmission rate of 750 Mbps are conducted [14]. Figure 10a demonstrates the BER performance for P Eave at different working I DC . P Eave is varied from −2.2 to 12.9 dBm and the I DC is utilized from 4 to 22 mA. As compared in the Figure 10a, besides the 4 mA working point, most of the curves have an available power range which achieves an acceptable BER below 1 × 10⁻³. Moreover, the scope of optimum range, depending on the working points, is different. e.g., the available power range for 15 mA biasing is from 1.72 to 8.13 dBm, whereas it is from 2.1 to 5.7 dBm for 22 mA biasing. When P Eave approach the optimum points from –2.2 dBm, the BER performance is enhanced because of the signal-to-noise ratio (SNR) improvement in the absence of signal clipping. Conversely, the BER performance is degraded gradually when P Eave increase beyond the optimum points, which indicates that the excess amplitudes are clipped by SAV and distorted by nonlinear E/O transition. Therefore, joint optimization of P Eave and I DC to utilize the favorable dynamic range of RCLED can relieve the nonlinear distortions and improve the demodulation performance.
Figure 10b depicts the influence of the I DC and P Eave at the BER level of 1 × 10⁻² and 1 × 10⁻³, respectively. When the system operates at smaller I DC , P Eave changes monotonically along with the I DC until the peak point, which indicates that the amplitudes of the transmitting signal can drive the RCLED in the linear region. However, as I DC increase beyond the optimum points, the available linear interval of RCLED becomes narrower. Therefore, P Eave have to decrease along with I DC variation so as to guarantee the same BER performance.

5.4. Nonlinearity Compensation

At the high operating point, to maintain the transmission performance at an acceptable BER below 1 × 10⁻³, the proposed digital pre-distorter with the improved iteration algorithm is adopted for the RCLED nonlinearity mitigation. In addition, the high operating point I DC = 22 mA is adopted. To obtain the optimal parameters of the LUT pre-distorter, the training procedure must be implemented first. The amplitude of X pilot , designed as shown in Figure 6, is set from 2.2 to 5.236 V. In addition, the duration of the single sawtooth pulse is set as 1.024 μs. For simplicity, P Num = 100 , Ψ = 0.002 , κ = 1 and λ = 1 are adopted in Algorithm 1. The tradeoffs among the pilot symbol overheads, the convergence time and the RMSE must be evaluated by exploring the favorable N x , M L and μ L .
Different from the traditional iteration in [14] (e.g., N x =   1 ), the sub-portion pilot in our proposed algorithm is equally split into N x slots. Figure 11a shows the RMSE performance comparisons with different split slots. In addition, M L = 512 and μ L = 0.2 are adopted in this training procedure. As the Figure 11a shown, the pilot symbol overheads obviously decrease with the increasing N x , indicating that fewer pilot symbols used in the training can guarantee the algorithm convergence and improve the training work efficiency. In addition, the pilot overhead of the conventional pre-distorter is cost by 79, whereas that of the improved pre-distorter (eg. N x =   4 ) is 21; the pilot’s consumption is reduced to at least a third. Selecting the appropriate μ L and M L can enhance the algorithm performance. Figure 11b,c demonstrate the RMSE and convergence time for different μ L and M L on the condition of N x =   4 , respectively. It can be seen that the RMSE is seriously degraded as μ L > 0.28 , smaller step size is favorable for the algorithm reliability, but it conflicts with the convergence time, as illustrated in Figure 11c. Although the RMSE can be decreased by employing a larger LUT size, the computational complexity O ( N x M L ) increases, and costs more hardware resources. Therefore, based on the above analysis, the appropriate N x = 4, M LUT = 256 and μ L = 0.22 are selected in the iteration procedure to achieve the trade-off among the convergence time, the pilot symbol overheads and the system reliability. In this case, the training procedure will reach the stable convergence within 3 seconds approximately.
The corresponding final training results in terms of the LUT gain values are illustrated in Figure 11d, in addition, the gains of the conventional LUT in [14] are also presented here. Clearly seen from Figure 11d, the gain values of the proposed LUT have the inverse characteristics of RCLED. Due to the fixed non-optimal parameters adopted in [14], the training outputs contain some noise components, which will affect the accuracy of the LUT prediction. Compared with the conventional LUT, the outputs of the improved LUT, based on an adaptive iterative algorithm, take on a steady and smooth curve. In addition, fewer pilot symbols are consumed in the training procedure, indicating the excellent performance achieved. It is worth noting that these final training results will be used in the following transmissions.
Fixing the DMT modulation parameters, the signal power is set to be P Eave = 8 dBm. In addition, the Chow algorithm is also adopted. After 50 m SI-POF transmission, the received signals are then demodulated. Figure 12 plots one of the received constellations (32-QAM) without and with the nonlinearity compensation. Moreover, that of the conventional approach [14] is also illustrated and compared here. It can be seen that the latter constellation in Figure 12b,c which are beneficial for symbol discrimination, are clear and easy to distinguish. However, the constellation in Figure 12c suffers less distortion and is obviously tighter than the former one in Figure 12b, showing the performance enhancement is obtained in resistance to the RCLED nonlinearity. Furthermore, the corresponding BER are calculated as 0.00293, 0.00096 and 0.00013. Compared with the previous two, more than up to 12 and 8 dB BER performance improvements are achieved by the proposed LUT pre-distorter. It is a fact that the proposed digital LUT pre-distorter can obviously increase the system’s robustness to the nonlinearity and significantly improve the transmission performance.
It should be pointed out that the BER degradation in the conventional approach is because of the output instability in the LUT prediction accuracy, thus the system linearity would be affected and the corresponding BER may be degraded. Based on the previous study on pilot overheads, computational complexities, parameter optimization and the BERs, the performance comparisons between the conventional and the improved pre-distorter are finally summarized in Table 2. As compared in the Table 2, the pilot overheads and the convergence time of the proposed approach have been greatly reduced to a certain extent, which are more appreciated in the practical POF transmissions. Therefore, the proposed method saves hardware resources and its overall performance outperforms that of the conventional one.
With the proposed LUT pre-distorter, the RCLED is allowed to work at the high operating point since the peaks can be amended up to the saturation level, and the RCLED efficiency is also improved, indicating a potential solution to the issue of RCLED nonlinearity mitigation in a high-speed POF communication system.

6. Conclusions

In this paper, the impact of RCLED nonlinearity on the performance of DMT transmission over SI-POF has been discussed, and the nonlinearity mitigation has been investigated. The improved digital LUT pre-distorter is proposed to compensate the nonlinear distortion. To a certain extent, signals at low frequencies are more affected by the nonlinearity than the ones at high frequencies. In addition, joint optimization for the system parameters can relieve the nonlinearity and improve the transmission performance. The better anti-nonlinearity characteristic, which shows the improvement of both RCLED operating point and efficiency, is achieved by the proposed pre-distorter. The results present the fact that the proposed simpler and cheaper scheme can be established for a given distortion level, and it is practical and effective for the future POF system. The further optimization of the proposed pre-distorter and the experimental verifications will be investigated in future works.

Acknowledgments

The authors acknowledge the support for this work from the National Natural Science Foundation of China (61271204) and Research and Innovation Project for College Graduates of Jiangsu Province (CXZZ13_0101). We gratefully thank Lenan Wu, Peng Chen, Linning Peng and Xianbo Wang for the insightful discussion and generous help.

Author Contributions

Pu Miao, Lenan Wu and Peng Chen conceived and designed the experiments; Pu Miao performed the experiments; Pu Miao and Peng Chen analyzed the data; Xianbo Wang contributed analysis tools; Pu Miao wrote the paper.

Conflicts of Interest

The authors declare no conflict of interest.

References

  1. Nespola, A.; Abrate, S.; Gaudino, R.; Zerna, C.; Offenbeck, B.; Weber, N. High-speed communications over polymer optical fibers for in-building cabling and home networking. IEEE Photonics J. 2010, 2, 347–358. [Google Scholar] [CrossRef]
  2. Visani, D.; Okonkwo, C.; Loquai, S.; Yang, H.; Shi, Y.; van den Boom, H.; Ditewig, T.; Tartarini, G.; Schmauss, B.; Lee, J.; et al. Beyond 1 Gbit/s transmission over 1 mm diameter plastic optical fiber employing DMT for in-home communication systems. J. Lightwave Technol. 2011, 29, 622–628. [Google Scholar] [CrossRef]
  3. Beltrán, M.; Shi, Y.; Okonkwo, C.; Llorente, R.; Tangdiongga, E.; Koonen, T. In-home networks integrating high-capacity DMT data and DVB-T over large-core GI-POF. Opt. Express 2012, 20, 29769–29775. [Google Scholar] [CrossRef] [PubMed]
  4. Peng, L.; Haese, S.; Hélard, M. Optimized Discrete Multitone Communication Over Polymer Optical Fiber. J. Opt. Commun. Netw. 2013, 5, 1313–1327. [Google Scholar] [CrossRef]
  5. Miao, P.; Wu, L.; Peng, L. A novel modulation scheme for short range polymer optical fiber communications. J. Opt. 2013, 15, 105407. [Google Scholar] [CrossRef]
  6. Randel, S.; Breyer, F.; Lee, S.C.; Walewski, J.W. Advanced modulation schemes for short-range optical communications. IEEE J. Sel. Top. Quant. Electron. 2010, 16, 1280–1289. [Google Scholar] [CrossRef]
  7. Armstrong, J. OFDM for optical communications. J. Lightwave Technol. 2009, 27, 189–204. [Google Scholar] [CrossRef]
  8. Lee, S.C.; Breyer, F.; Randel, S.; Gaudino, R.; Bosco, G.; Bluschke, A.; Koonen, A.M. Discrete multitone modulation for maximizing transmission rate in step-index plastic optical fibers. J. Lightwave Technol. 2009, 27, 1503–1513. [Google Scholar] [CrossRef]
  9. Peng, L.; Hélard, M.; Haese, S. On Bit-loading for Discrete Multi-tone Transmission over Short Range POF Systems. J. Lightwave Technol. 2013, 31, 4155–4165. [Google Scholar] [CrossRef]
  10. Tsonev, D.; Sinanovic, S.; Haas, H. Complete modeling of nonlinear distortion in ofdm-based optical wireless communication. J. Lightwave Technol. 2013, 31, 3064–3076. [Google Scholar] [CrossRef]
  11. Mesleh, R.; Elgala, H.; Haas, H. On the performance of different OFDM based optical wireless communication systems. J. Opt. Commun. Netw. 2011, 3, 620–628. [Google Scholar] [CrossRef]
  12. Inan, B.; Lee, S.C.; Randel, S.; Neokosmidis, I.; Koonen, A.M.; Walewski, J.W. Impact of LED nonlinearity on discrete multitone modulation. J. Opt. Commun. Netw. 2009, 1, 439–451. [Google Scholar] [CrossRef]
  13. Neokosmidis, I.; Kamalakis, T.; Walewski, J.W.; Inan, B.; Sphicopoulos, T. Impact of nonlinear LED transfer function on discrete multitone modulation: Analytical approach. J. Lightwave Technol. 2009, 27, 4970–4978. [Google Scholar] [CrossRef]
  14. Miao, P.; Wu, L.; Peng, L. RCLED nonlinearity mitigation for polymer optical fiber communications. In Proceedings of the 13th International Conference on Optical Communications and Networks (ICOCN), Suzhou, China, 9–10 November 2014; pp. 1–4.
  15. Mesleh, R.; Elgala, H.; Haas, H. LED nonlinearity mitigation techniques in optical wireless OFDM communication systems. J. Opt. Commun. Netw. 2012, 4, 865–875. [Google Scholar] [CrossRef]
  16. Dimitrov, S.; Sinanovic, S.; Haas, H. Clipping noise in OFDM-based optical wireless communication systems. IEEE Trans. Commun. 2012, 60, 1072–1081. [Google Scholar] [CrossRef]
  17. Muhonen, K.J.; Kavehrad, M.; Krishnamoorthy, R. Look-up table techniques for adaptive digital predistortion: A development and comparison. IEEE Trans. Veh. Technol. 2000, 49, 1995–2002. [Google Scholar] [CrossRef]
  18. Wang, J.; Li, S.; Yang, J.; Wu, B.; Li, Q. Extended state observer-based sliding mode control for PWM-based DC–DC buck power converter systems with mismatched disturbances. IET Control Theory Appl. 2015, 9, 579–586. [Google Scholar] [CrossRef]
  19. Jardin, P.; Baudoin, G. Filter lookup table method for power amplifier linearization. IEEE Trans. Veh. Technol. 2007, 56, 1076–1087. [Google Scholar] [CrossRef]
  20. Chow, P.S.; Cioffi, J.M.; Bingham, J. A practical discrete multitone transceiver loading algorithm for data transmission over spectrally shaped channels. IEEE Trans. Commun. 1995, 43, 773–775. [Google Scholar] [CrossRef]
  21. Schueppert, M.; Kruglov, R.; Loquai, S.; Bunge, C.-A. Nonlinearities Originated in a Red RC-LED and Their Impact on Spectrally Efficient Modulation. IEEE Photonics Technol. Lett. 2015, 27, 2007–2010. [Google Scholar] [CrossRef]
Figure 1. Polymer optical fiber (POF) system with resonant cavity light emitting diode (RCLED).
Applsci 06 00260 g001
Figure 2. The measured results (a) the measured transformation of the RCLED; (b) the measured internal signal voltage and RCLED forward current.
Applsci 06 00260 g002
Figure 3. Measured results and polynomial fitting: (a) root mean squared error (RMSE) comparison; (b) 2-order fitting curves.
Applsci 06 00260 g003
Figure 4. The principle of the pre-distorter.
Applsci 06 00260 g004
Figure 5. Block diagram of the digital look-up-table (LUT) pre-distorter in the discrete multi-tone (DMT) transmitter.
Applsci 06 00260 g005
Figure 6. Sawtooth pilot signals.
Applsci 06 00260 g006
Figure 7. DMT modem with bit-loading scheme.
Applsci 06 00260 g007
Figure 8. Received bit error rate (BER) in each sub-carrier (a) bias 20 mA, 6 dBm; (b) bias 22mA, 8dBm.
Applsci 06 00260 g008
Figure 9. Error vector magnitude (EVM) performance for different bias currents.
Applsci 06 00260 g009
Figure 10. (a) BER performance at different average DMT powers (b) the electrical signal power for different bias currents.
Applsci 06 00260 g010
Figure 11. Algorithm training (a) for different split slots (b) for different step factors (c) for different LUT sizes (d) corresponding LUT gain value.
Applsci 06 00260 g011
Figure 12. Received constellations of DMT signals operated at 22 mA point (a) without pre-distorter (b) with the conventional approach (c) with the proposed pre-distorter.
Applsci 06 00260 g012
Table 1. The modulation parameters.
DMT ParametersValues
Sampling frequency(GHz)1
Fast fourier transform (FFT) length2048
Subcarrier spacing (MHz)0.488
Subcarrier number N256
Cyclic prefix (CP) ratio (μs)0.032
DMT symbol duration (μs)2.08
Signal bandwidth (MHz)125
Table 2. Performance comparison.
Pre-distorterPilot OverheadsConvergence Time (s)BER Reduction (dB)Parameters AdaptiveAccuracy
The conventional79124NoMiddle
The proposed21312YesHigh

