Article

Groundwater Mixing Process Identification in Deep Mines Based on Hydrogeochemical Property Analysis

1
School of Resources and Geosciences, China University of Mining and Technology, Xuzhou 221116, China
2
Scientific Research Foundation of Key Laboratory of Coal-Based CO2 Capture and Geological Storage, China University of Mining and Technology, Xuzhou 221008, China
3
Department of Electrical, Electronic & Computer Engineering, University of Pretoria, Pretoria 0002, South Africa
*
Author to whom correspondence should be addressed.
Appl. Sci. 2017, 7(1), 42; https://doi.org/10.3390/app7010042
Submission received: 16 September 2016 / Revised: 21 December 2016 / Accepted: 26 December 2016 / Published: 31 December 2016
(This article belongs to the Section Chemical and Molecular Sciences)

Abstract

:
Karst collapse columns, as a potential water passageway for mine water inrush, are always considered a critical problem for the development of deep mining techniques. This study aims to identify the mixing process of groundwater deriving two different limestone karst-fissure aquifer systems. Based on analysis of mining groundwater hydrogeochemical properties, hydraulic connection between the karst-fissure objective aquifer systems was revealed. In this paper, piper diagram was used to calculate the mixing ratios at different sampling points in the aquifer systems, and PHREEQC Interactive model (Version 2.5, USGS, Reston, VA, USA, 2001) was applied to modify the mixing ratios and model the water–rock interactions during the mixing processes. The analysis results show that the highest mixing ratio is 0.905 in the C12 borehole that is located nearest to the #2 karst collapse column, and the mixing ratio decreases with the increase of the distance from the #2 karst collapse column. It demonstrated that groundwater of the two aquifers mixed through the passage of #2 karst collapse column. As a result, the proposed Piper-PHREEQC based method can provide accurate identification of karst collapse columns’ water conductivity, and can be applied to practical applications.

1. Introduction

With shallow coal resources having been exhausted, deep mining has become an unavoidable trend [1]. As mining activities are conducted deeper and deeper, the hydrogeological conditions of the mine area become increasingly complex, which eventually leads to hazardous events (such as water inrush). Water inrush results in a large amount of groundwater bursting into a work-plane, destroying the mining area and killing miners [2,3,4,5]. Karst collapse columns are typical geological structures in coal fields in Northern China, which can induce water hydraulic connection between adjacent aquifers and threaten to mining activities. Usually, karst develops on the top of Ordovician limestone and underlies the coal bearing strata, and karst will further form into huge karst caves. When the overlying strata lose support, they will collapse and form karst collapse columns under the pressure of gravity [6,7].
Seismic exploration is a traditional method for evaluating the risk of karst collapse columns. Moreover, karst collapse columns can be identified by means of hydrogeological modeling. In [6], a three-dimensional (3-D) groundwater flow system was established to reveal different vertical hydraulic connection paths or channels. Meanwhile, the omens of water inrush caused by karst collapse columns arouse researchers’ attention [8]. In [9], the discontinuous deformation analysis (DDA) method was proposed, based on the 3-D seismic technique, to calculate the deformation field and analyze the subsidence mechanism of karst collapse columns. A damage-based hydro-mechanical model was established in [10] to reveal the seepage property and water inrush mechanism of karst collapse columns. This model was then evolved into a fluid-solid coupling model solved by COMSOL Multiphysics (Version 3.5a, COMSOL AB, Stockholm, Sweden, 2008) [7]. However, there is yet to be an effective and accurate method to locate karst collapse columns and determine water conductivity.
Hydrogeochemical methodologies have been widely used to solve hydrogeological problems in mining [11,12,13,14], such as assessing the environmental effects of acid mine drainage (AMD) [2,15,16,17,18,19,20], tracing the pollution sources in mining areas [21,22,23], and studying the leachate of mine tailings [24,25,26,27]. In order to investigate the evolution of the compositions in mining groundwater and the groundwater quality under the influence of ADM, the PHREEQC hydrogeochemical model and the expanded Durov diagram were performed in [28]. In [29], water–rock interaction and hydrogeochemical evolution within a carbonate aquifer system was determined through data evaluation methods.
However, although existing techniques and models have been proposed to identify karst collapse columns and determine their water conductivity, the accuracy is still an issue. To this end, a new hydrogeochemical method is proposed in this work by properly integrating the piper diagram and PHREEQC model. For the first time, this new hydrogeochemical method is applied to the Liuqiao Second Mine of the Hengyuan Colliery in Huaibei, North China to identify the groundwater mixing process through karst collapse columns, to determine the specific location of water conducted karst collapse columns, and to attempt to recognize specific karst collapse columns at risk of water inrush.

2. Study Area

2.1. Geological Background

The strata, from the earliest to most recent order, are Ordovician (O), Carboniferous (C), Permian (P), Tertiary (T), and Quaternary (Q) (see the generalized stratigraphy in Figure 1). The structure of the study area—which is monoclinal, inclining from north-northeast (NNE) to northwest (NW)—is complex because it is located in the west limb of the Tulou anticline belonging to a secondary fold of the south endpoint of Dawuji synclinorium. The secondary folds are well developed, enabling partly stratum sloping towards north-east (NE) or north-west (NW).

2.2. Hydrogeological Setting

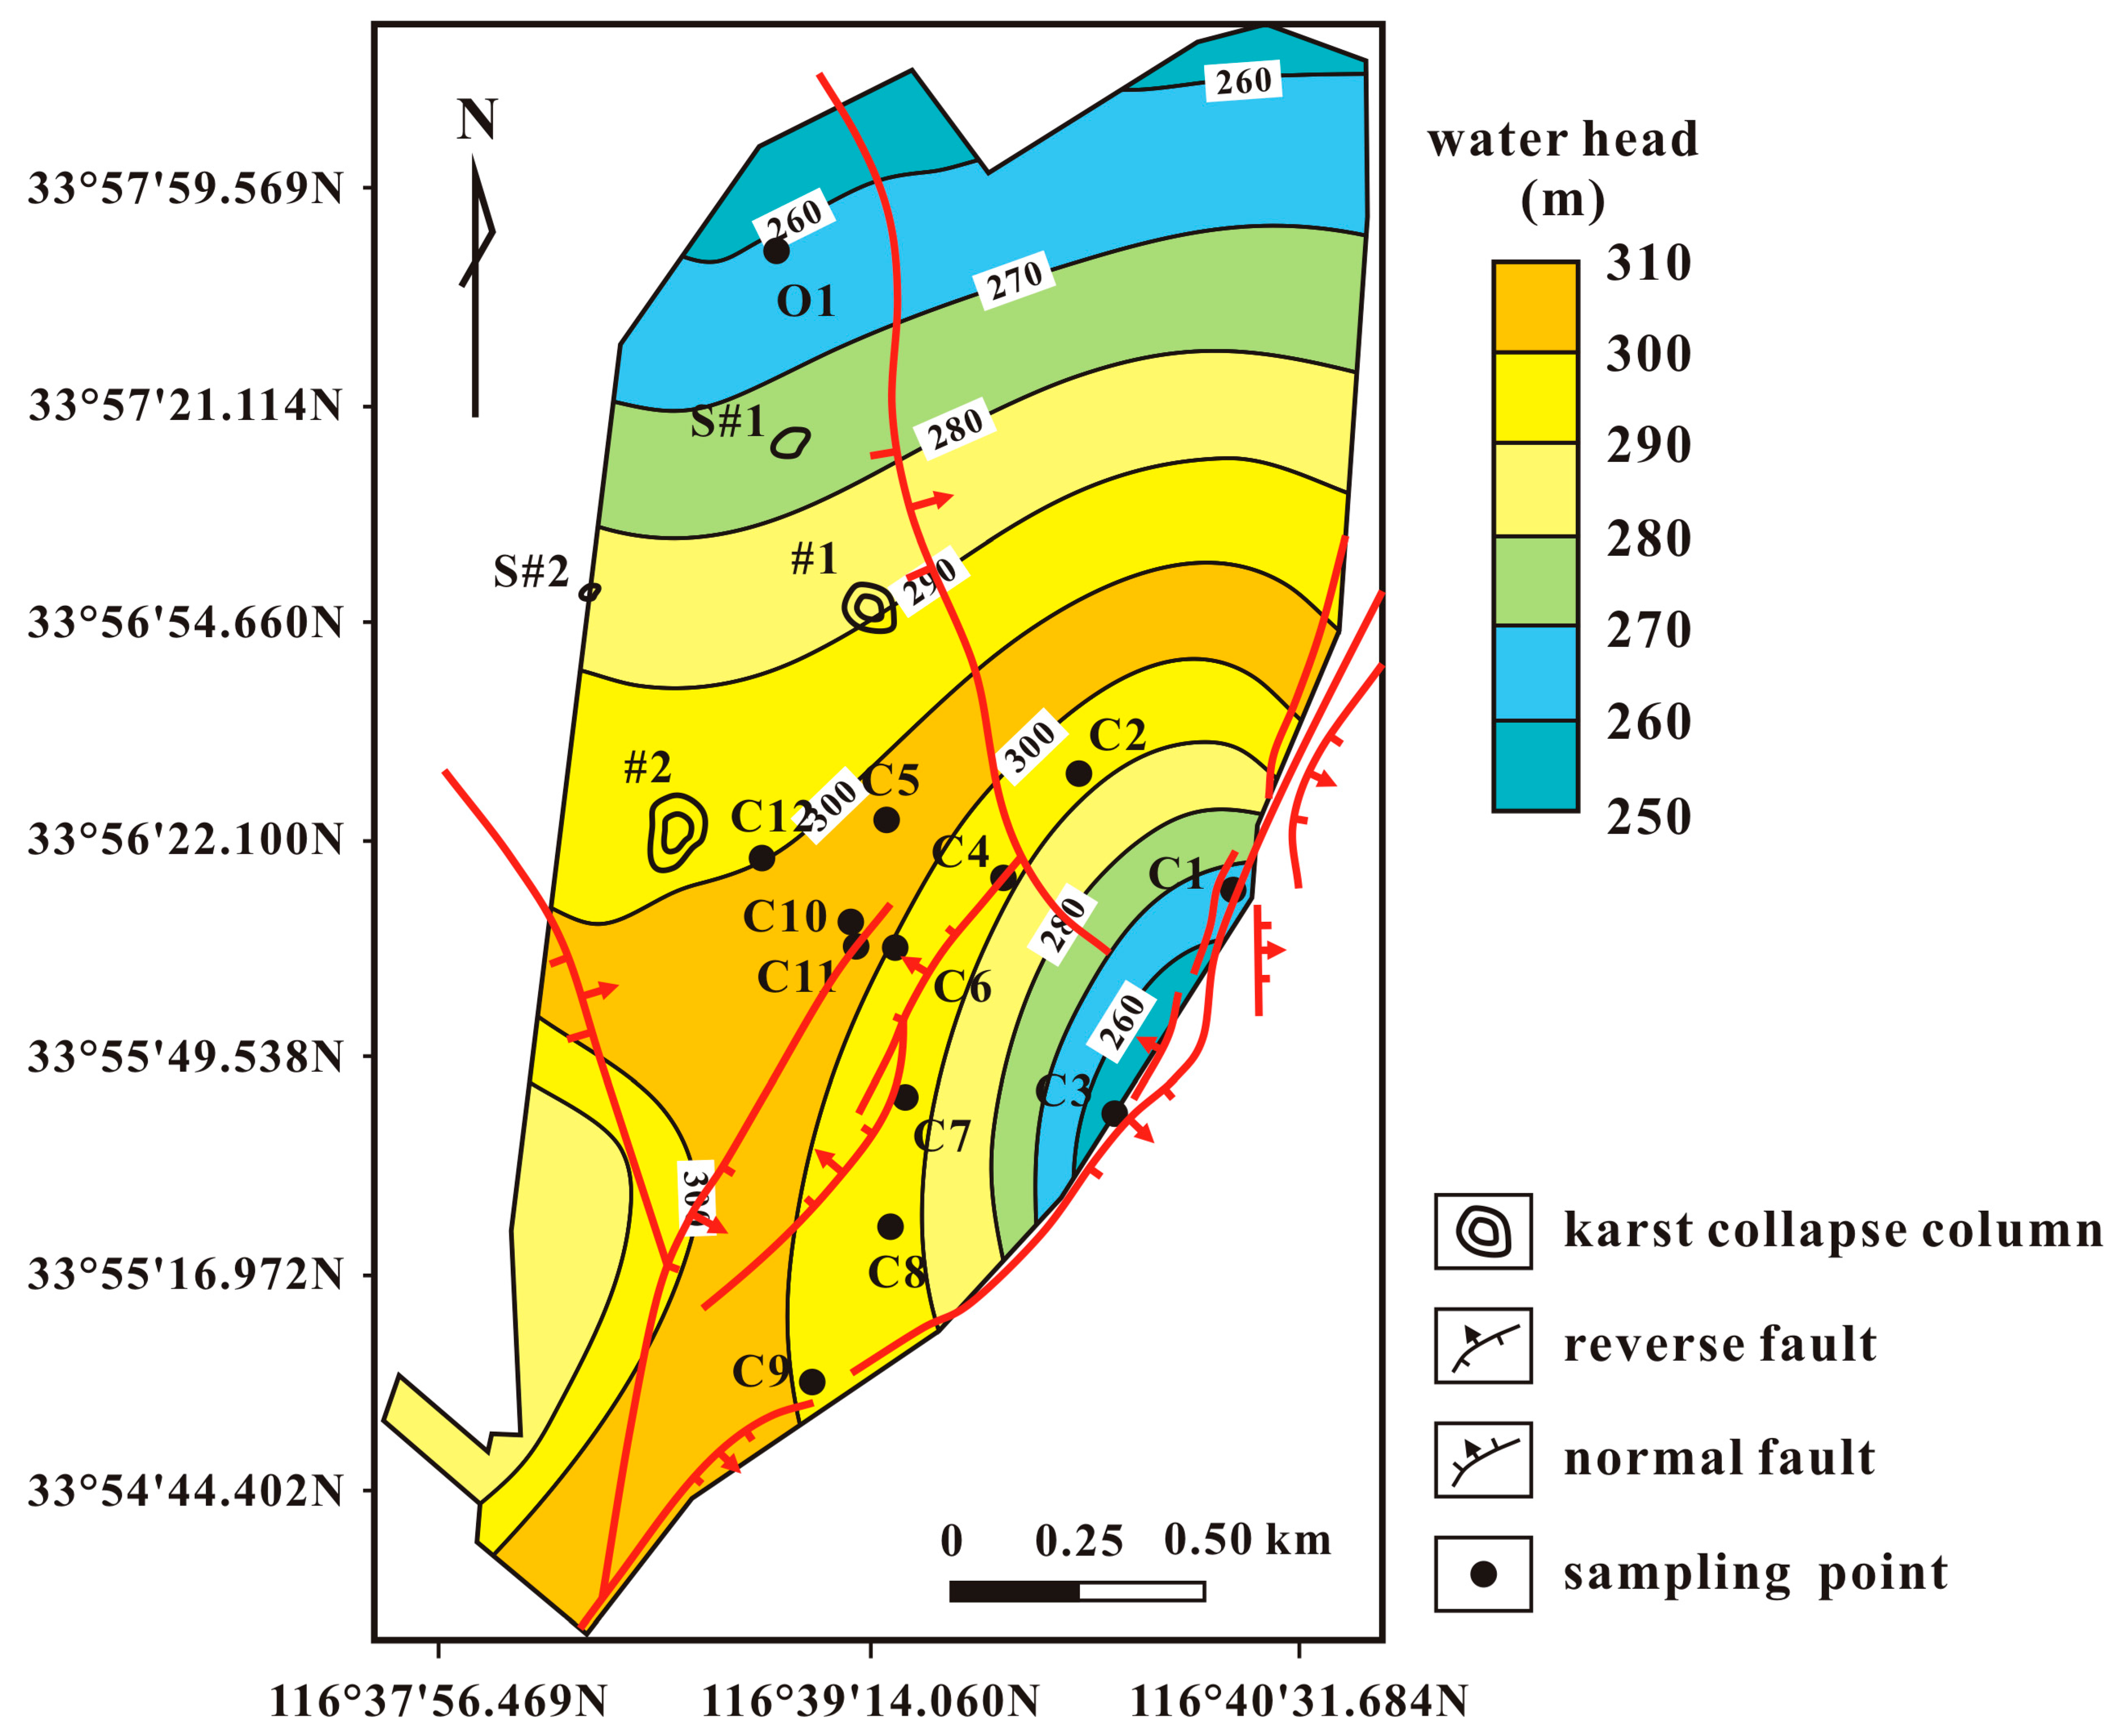
There are four kinds of aquifer systems in the study area, including Cenozoic unconsolidated porous aquifers with the average thickness of 11–22 m, hydraulic conductivity of 0.48–4.60 m/day, and specific capacity of 0.04–0.94 L/(s·m); Permian sandstone fractured aquifers with the average thickness of 3–50 m, hydraulic conductivity of 0.038–22.1 m/day, and specific capacity of 0.002–0.125 L/(s·m); Carboniferous limestone fractured aquifers in Taiyuan Formations with an average thickness of about 53.87 m, hydraulic conductivity of 0.15–36.4 m/day, and specific capacity of 0.0034–11.4 L/(s·m); and Ordovician limestone karst fractured aquifers with an average thickness of about 120 m, hydraulic conductivity of 1.77 m/day, and specific capacity of 0.633 L/(s·m). Between the aquifers, there are many aquifuge layers, with the lithology of mudstone or siltstone. Four collapse columns are found in the study area. This study focuses on the groundwater hydraulic connection between Carboniferous limestone fractured aquifers in Taiyuan Formations and lower Ordovician limestone karst fractured aquifers through the collapse columns. Due to the needs of coal mining, drainage, and decreasing pressure required in Carboniferous Taiyuan limestone karst-fissure aquifer, which leads to different flow directions in Carboniferous Taiyuan limestone karst-fissure aquifer systems in the study area, as shown in Figure 2.

2.3. Hydrogeochemical Setting

Twelve groundwater samples (including C1, C2, C3, C4, C5, C6, C7, C8, C9, C10, C11, C12 in Figure 2) from Carboniferous Taiyuan limestone karst-fissure aquifer boreholes and one groundwater sample (O1) from Ordovician limestone karst-fissure aquifer were collected and detected to analyze the hydrogeochemical feature of groundwater in the study area. As the location of borehole C1 keeps away from the collapse columns by an impermeable reverse fault at the boundary of the study area, the hydrogeochemical data of Sample C1 groundwater can be set as the initial groundwater hydrogeochemical feature in Carboniferous Taiyuan limestone karst-fissure aquifer systems. As the water level in Ordovician limestone karst-fissure aquifer is higher than that in Taiyuan limestone karst-fissure aquifer, Sample O1 can represent original groundwater hydrogeochemical feature in Ordovician limestone karst-fissure aquifer systems. The specific distributions of sampling points are shown in Figure 3.

3. Methodologies

3.1. Calculation of the Mixing Ratio of the Mixing Groundwater

Piper diagram is used to identify the chemical type of all the groundwater samples and to calculate the groundwater mixing ratios in different boreholes [30]. The principle of this graphical method is to classify groundwater chemical types by plotting the milligram equivalent percentage (mEq%) of all the conventional groundwater chemical ions [31,32,33], including calcium (Ca2+), magnesium (Mg2+), sodium (Na+), potassium (K+), bicarbonate (HCO3), sulphate (SO42−), and chloride (Cl), in two triangle fields (the anions and the cations), and then projecting the two ternary plots onto a diamond [34]. The diamond is a matrix transformation of a graph of the anions ((sulfate + chloride)/total anions) and cations ((sodium + potassium)/total cations) [35].
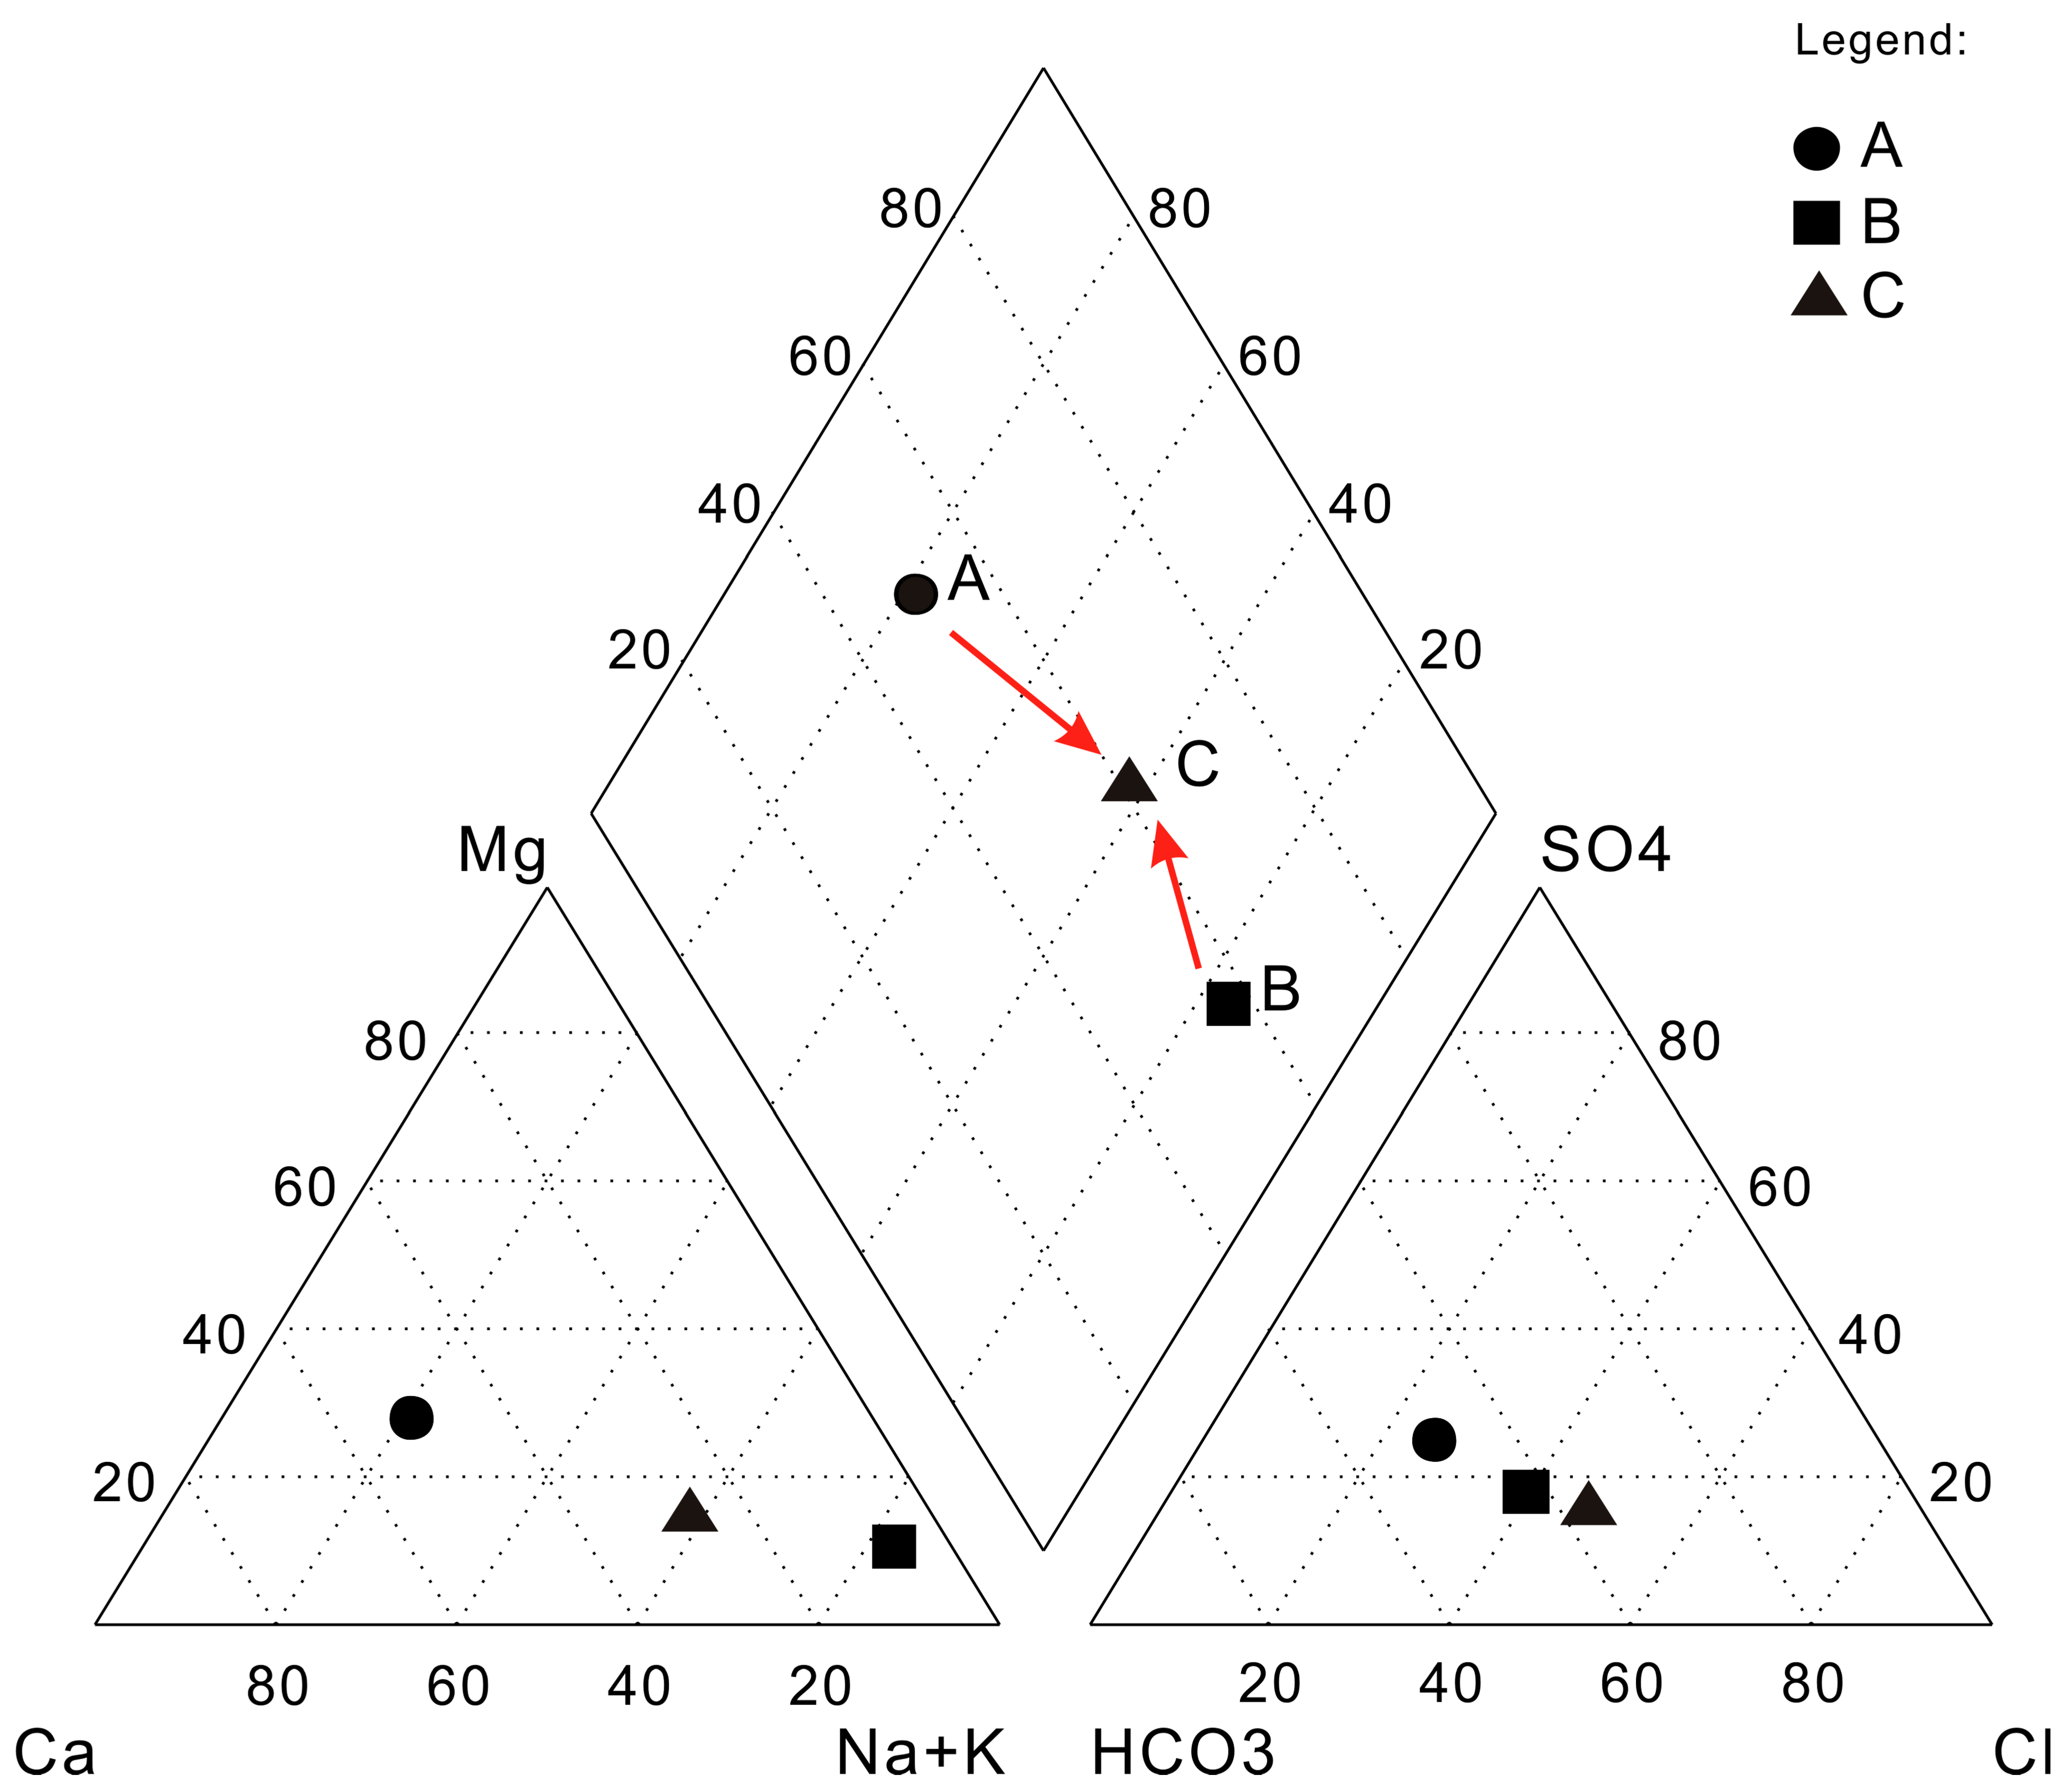
When all the groundwater samples are plotted in the diamond field of the piper diagram, the hydraulic connection can be simply identified and the mixing ratio can also be preliminarily calculated. The hypothesis of the graphical calculation is that the dilution, concentration, and transformation of chemical substances will not occur after mixing. At the same time, the preconditions are that the mixture plots should be located between two parent solution plots, and the concentration of the mixture should be greater than the least concentration of the parent solutions and less than the greatest concentration as shown in Figure 4.
The quantitative relationship between the mixture and its parent solutions is shown as [30]:
D a / D b = ( V b C b ) / ( V a C a )
where D a is the distance between mixture plot C and parent solution plot A, while D b is the distance between mixture plot C and parent solution plot B. V a and V b are the volume of parent solution plot A and parent solution plot B; C a and C b are the concentration of parent solution plot A and parent solution plot B.
The linear dependence of the volumes is described as:
V c = V a + V b
where V c is the volume of the mixture.
The mixing ratio can be calculated by:
{ R a = ( D b C b ) / ( D a C a + D b C b ) R b = ( D a C a ) / ( D a C a + D b C b )
where R a and R b are the mixing ratio of parent solution A and parent solution B.
The result of the mixing ratio can be used as the initial value for the simulation by PHREEQC.

3.2. Simulation of the Evolution of Mixing Groundwater

If the groundwater derived from different aquifers mixes together, a chemical reaction should occuer between groundwater with different ion concentrations and water–rock interaction between mixing groundwater and aquifer rocks. Therefore, geochemical program of PHREEQC Interactive was applied to revise the mixing ratio of different groundwater sources based on the results of piper diagram analysis, and to simulate the hydrogeochemical evolution of mixing groundwater. The calculation procedure is described as follows.
First, establish potential reaction phases in the PHREEQC model. Through previous geological investigation and groundwater evolution in the study area, the potential reaction phases existing in Carboniferous Taiyuan limestone karst-fissure aquifer systems can be determined, including anhydrite, calcite, dolomite, gypsum, halite, sulfur, and CO2 (g). The possible reactions, which result in the change of the conventional groundwater chemical ions concentration in groundwater, are listed in Table 1.
The hydrogeochemical model used in PHREEQC follows the principle of mass balance. In the model, Cl was considered as a conservative ion, by adjusting the initial mixing ratio (getting from piper diagram calculation) to keep the simulation value of Cl concentration equaled to the practical value. This will allow the concentration of other ions to change slightly. According hydrogeological conditions of this study area, partial pressure of carbon dioxide (logPCO2) was set to −1.25 atm. The average value of the geothermal gradient in the study area is 2.4 Celsius per 100 m. According to the average depth of the sampling points, the groundwater temperature of the Carboniferous Taiyuan limestone karst-fissure aquifer system is 36.29 °C, whereas the groundwater temperature of the Ordovician limestone karst-fissure aquifer system is 39.03 °C.

4. Results and Discussion

Specific chemical properties of each groundwater sample are shown in Table 2. All the component concentrations of each groundwater sample in Carboniferous Taiyuan limestone karst-fissure aquifer are quite different (K+ + Na+ of 202.68–1030.31 mg/L, Ca2+ of 58.9–144.53 mg/L, Mg2+ of 24.62–83.50 mg/L, HCO3 of 268.24–573.03 mg/L, SO42− of 206.16–1903.19 mg/L, Cl of 97.97–268.16 mg/L, alkalinity of 4.396–9.391 mg/L, pH of 7.8–8.4, total dissolved solid (TDS) of 1206–3693 mg/L, hardness of 14.58–39.48 °H), which means that the groundwater in the Carboniferous Taiyuan limestone karst-fissure aquifers have encountered external disturbance. Meanwhile, the component concentrations of the groundwater sample in Ordovician limestone karst-fissure aquifer (K+ + Na+ of 193.3 mg/L, Ca2+ of 10.63 mg/L, Mg2+ of 27.01 mg/L, HCO3 of 314.81 mg/L, SO42− of 83.19 mg/L, Cl of 82.37 mg/L, alkalinity of 353.81 mg/L, pH of 9.4, TDS of 1180 mg/L, hardness of 137.8 °H) are different from that in Carboniferous Taiyuan limestone karst-fissure aquifers. The chemical properties of groundwater samples indicate the hydraulic connection occurred between the two aquifer systems through one or more karst collapse columns in the study area.
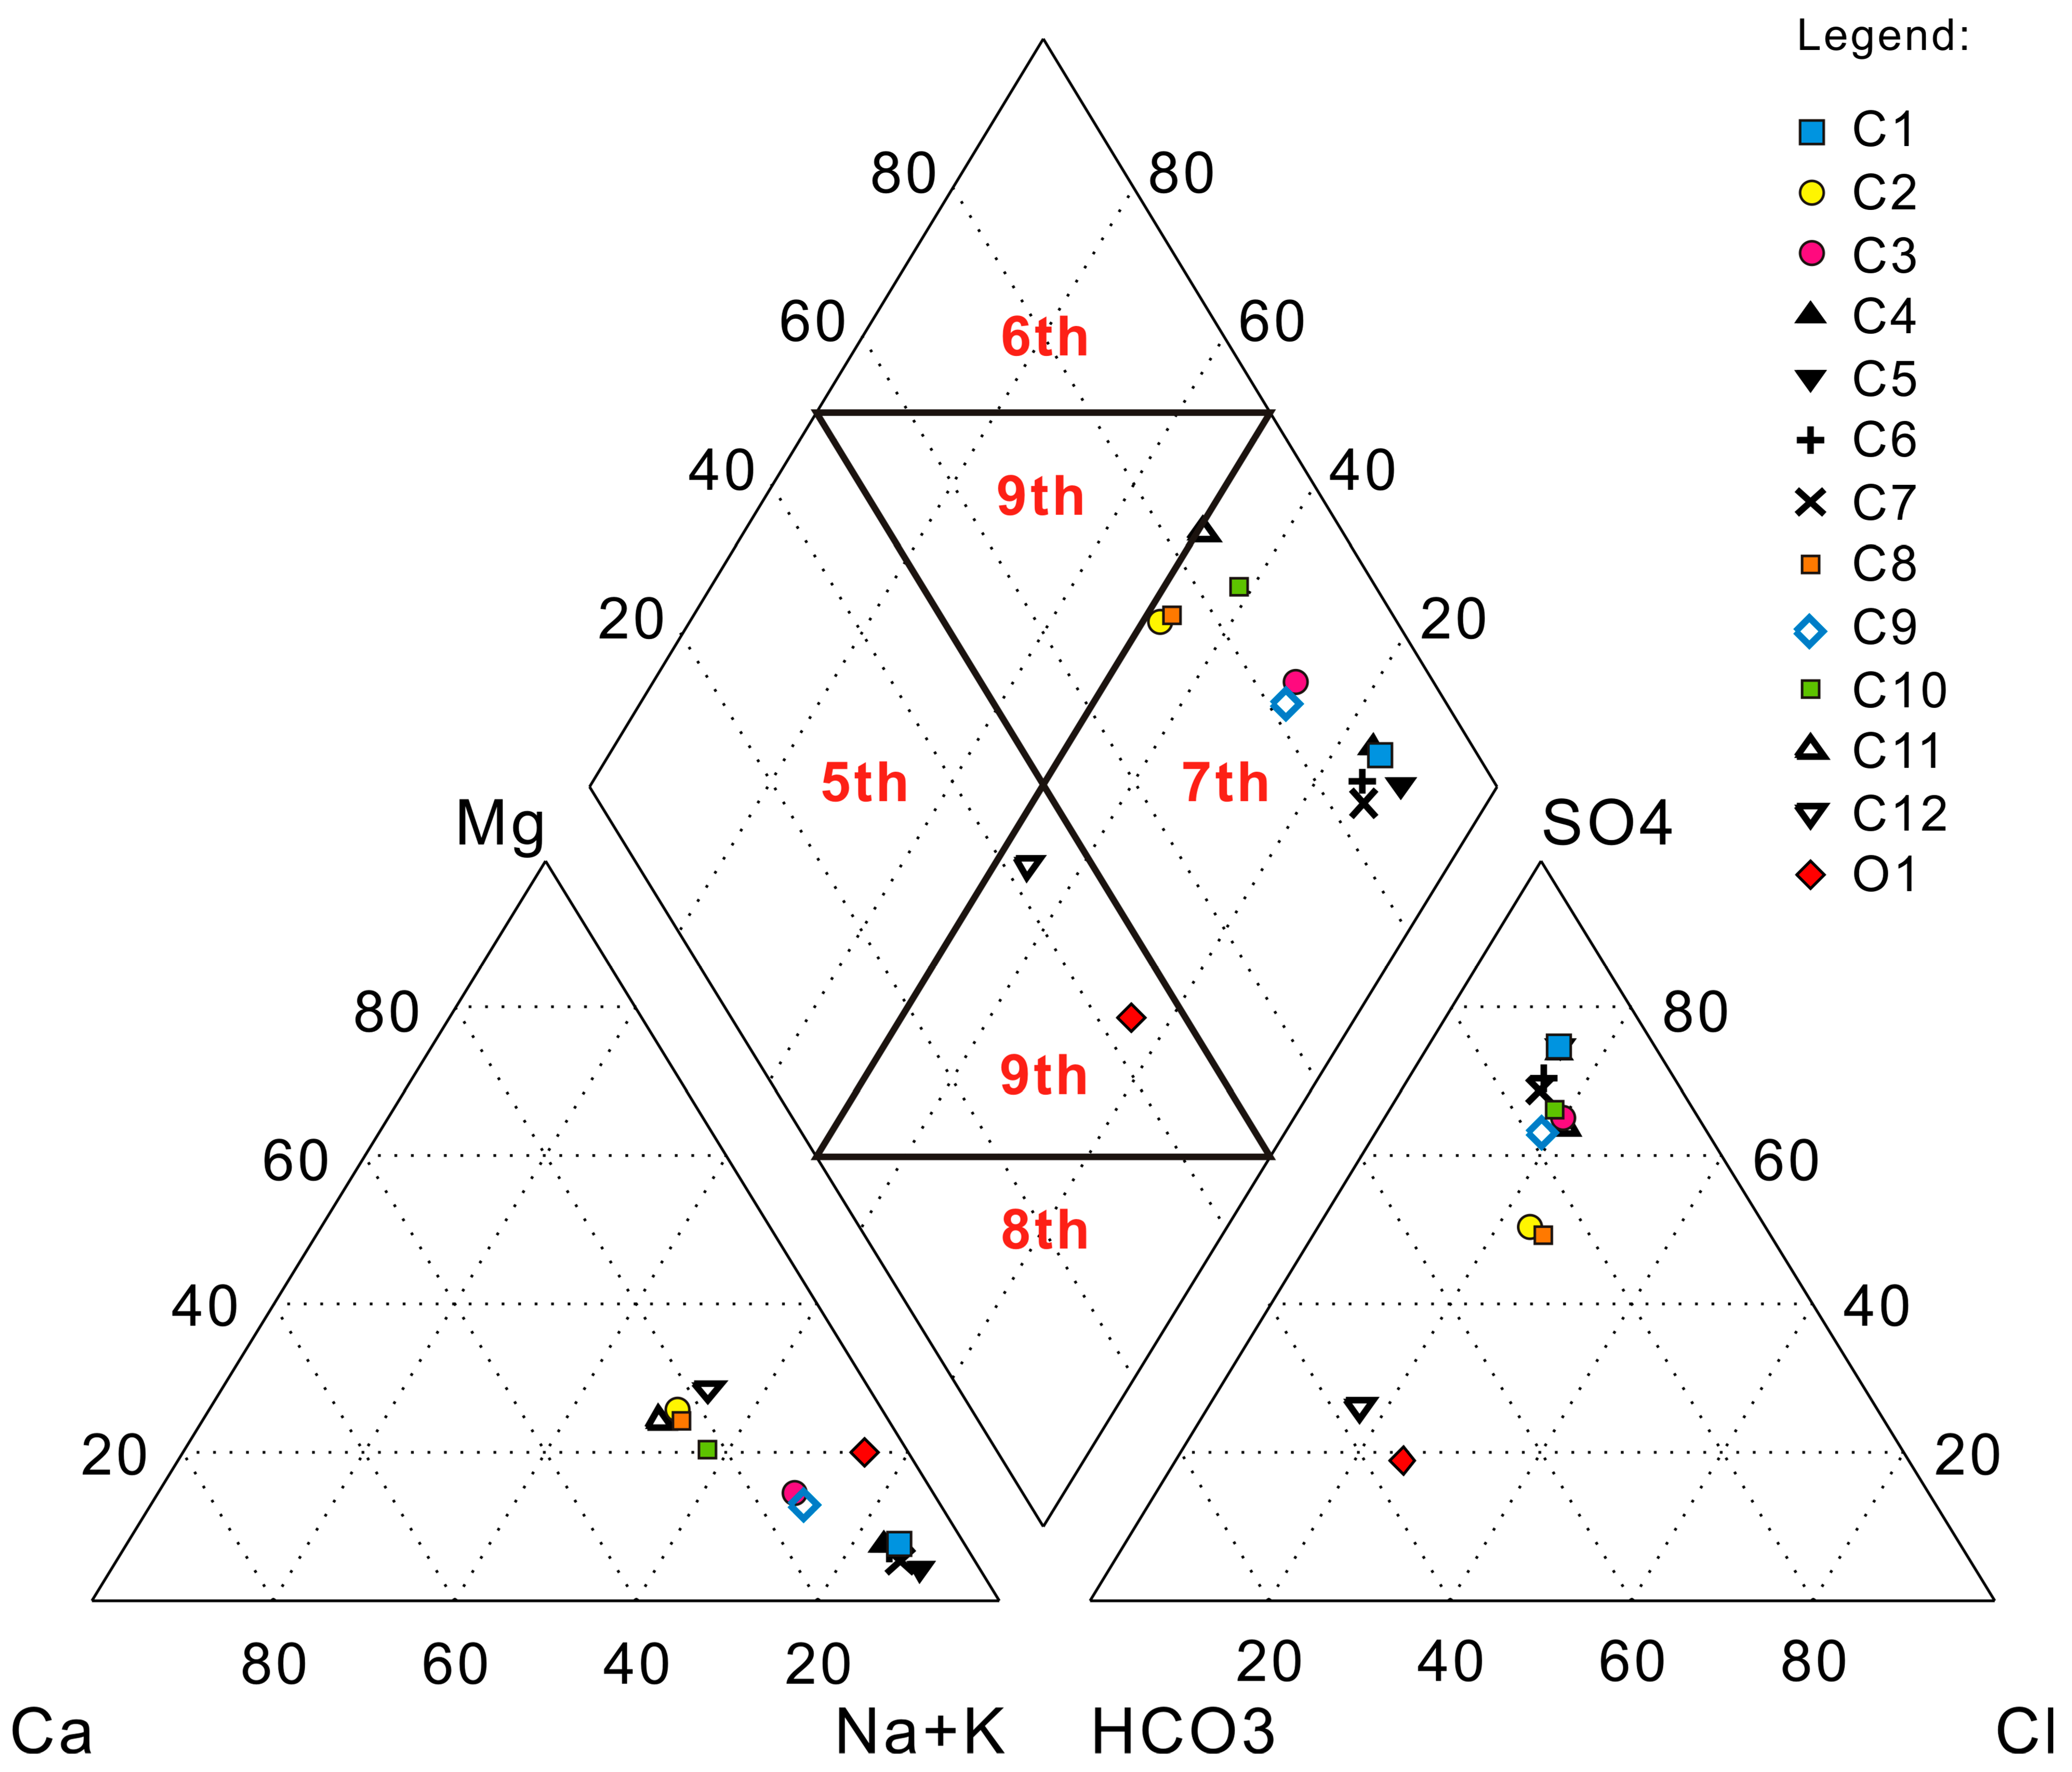
According to the concentrations of cations and anions, the piper diagram of all groundwater samples was plotted in Figure 5 and the hydrochemical types [36,37] of all groundwater samples were analyzed in Table 3. In the piper diagram, most groundwater samples (except of C12 and O1) were located in the seventh district of the diamond field, and the hydrochemical type of groundwater [38,39] is SO4-K + Na. This kind of groundwater is typically connate water which is highly mineralized, the primarily conventional groundwater chemical ions [40] are SO42− and K+ + Na+ with a content percentage of greater than 50%, and the TDS value is usually high. Groundwater samples of C12 and O1 were located in the ninth district of the diamond field, and the hydrochemical type of groundwater is HCO3-K + Na. This kind of groundwater is typically geothermal water in the deep stratum, and there were no primary cations and anions with a percentage content greater than 50%.
Sample C1, representing original groundwater in a Carboniferous Taiyuan limestone karst-fissure aquifer, was located in the far right of the seventh district, while Sample O1, representing groundwater in the Ordovician limestone karst-fissure aquifer, was located in the ninth district. As shown in Figure 4, the locations of the other groundwater samples in Carboniferous Taiyuan limestone karst-fissure aquifers gradually transformed from the seventh district to the ninth district, especially for Sample C12, which was only located in the ninth district next to the Sample O1. Therefore, it is confirmed that the groundwater in the Taiyuan aquifer has been mixed with the groundwater from the Ordovician aquifer, and the passage lies on the point of Sample C12. It also observed that the hydrochemical types of all mixed groundwater samples transform to SO4·HCO3-K + Na·Mg, SO4-K + Na·Ca, HCO3·SO4-K + Na, SO4·Cl·HCO3-K + Na·Mg, and HCO3·SO4-K + Na·Mg from SO4-K + Na.
The mixing ratios of all mixed groundwater samples are calculated according to the distances of each mixed groundwater sample to Sample O1 and Sample C1 in the diamond field in Figure 4 using Equations (1)–(3). The groundwater mixing ratios calculated from piper diagram were treated as initial values in the PHREEQC model to modify the value of simulation concentration of Cl. The mixing ratios calculated by the piper diagram and modified by the PHREEQC model were shown in Table 4.
The difference between the mixing rations calculated by these two methods can be explained in that the piper diagram only calculated the different groundwater mixing from concentrations, but did not consider the chemical reaction between different groundwaters; while PHREEQC model calculated the mixing ration based on the result of piper diagram, and moreover, considered the chemical reactions between different groundwaters and water–rock interactions. Therefore, mixing ratio values calculated by PHREEQC are more accurate. The results demonstrate that the mixing ratio of groundwater sample C12 is the highest, up to 0.905, which means the groundwater sample C12 mixed the most with groundwater in the Ordovician limestone karst-fissure aquifer system.
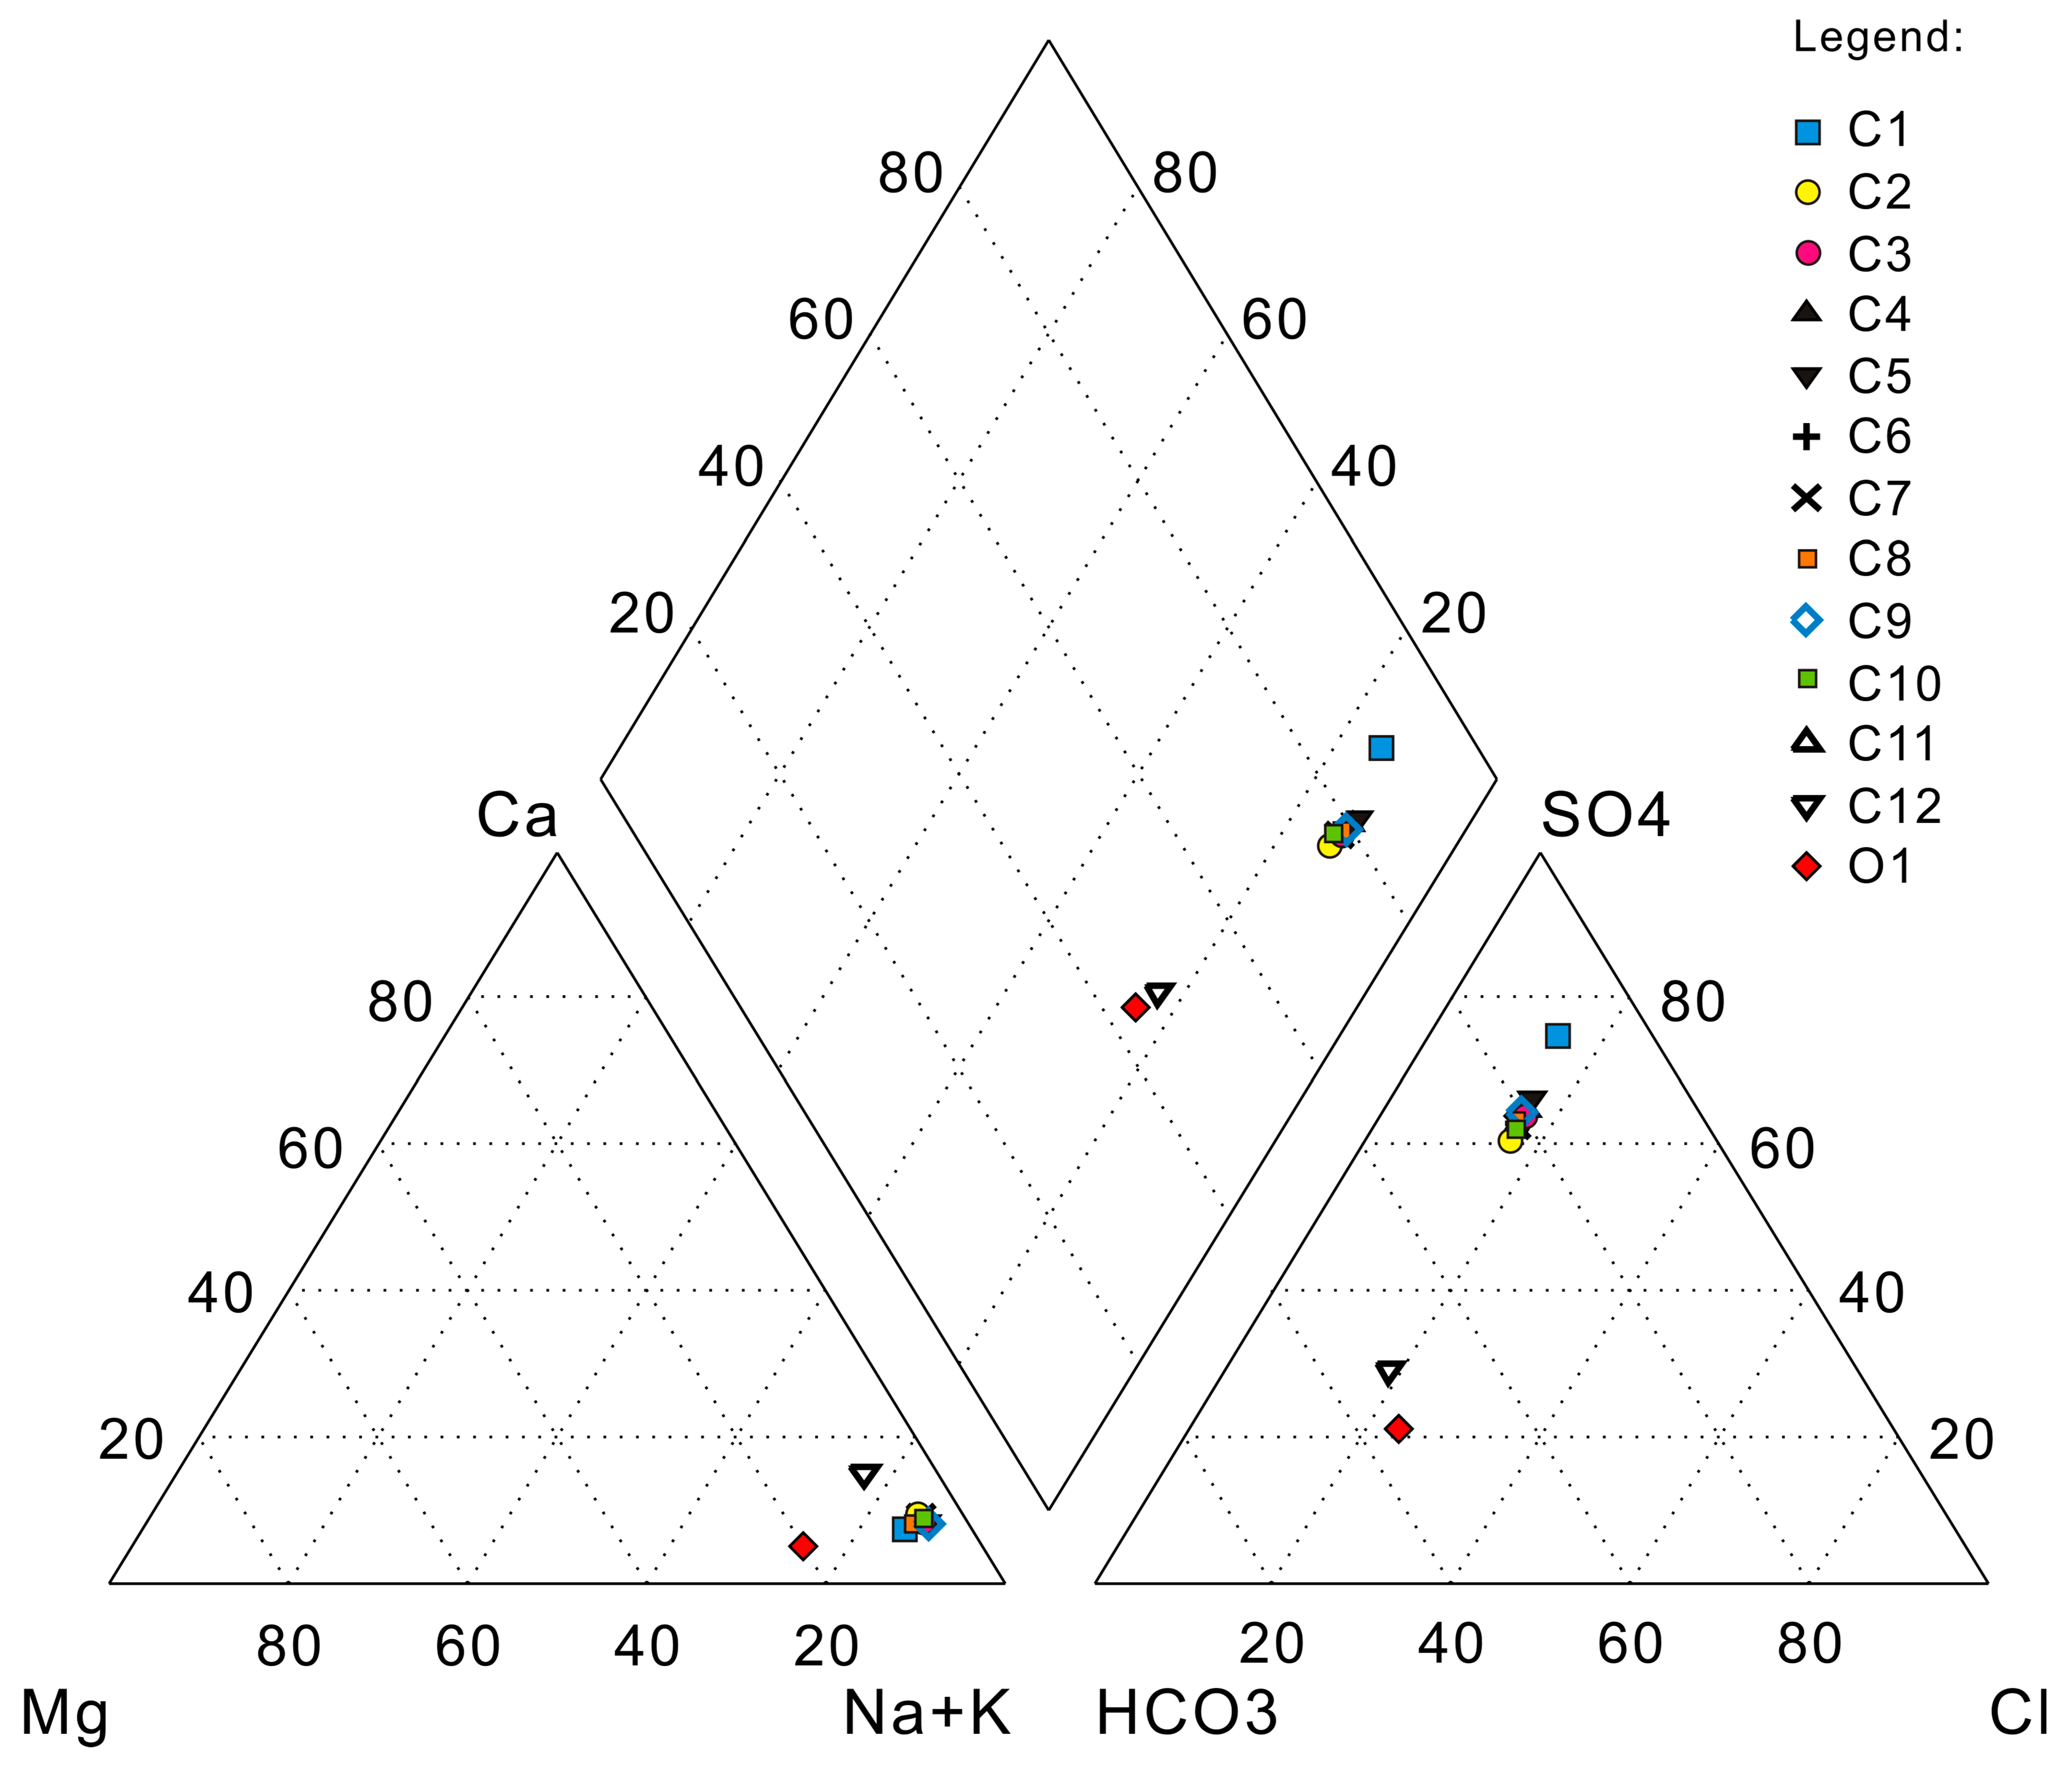
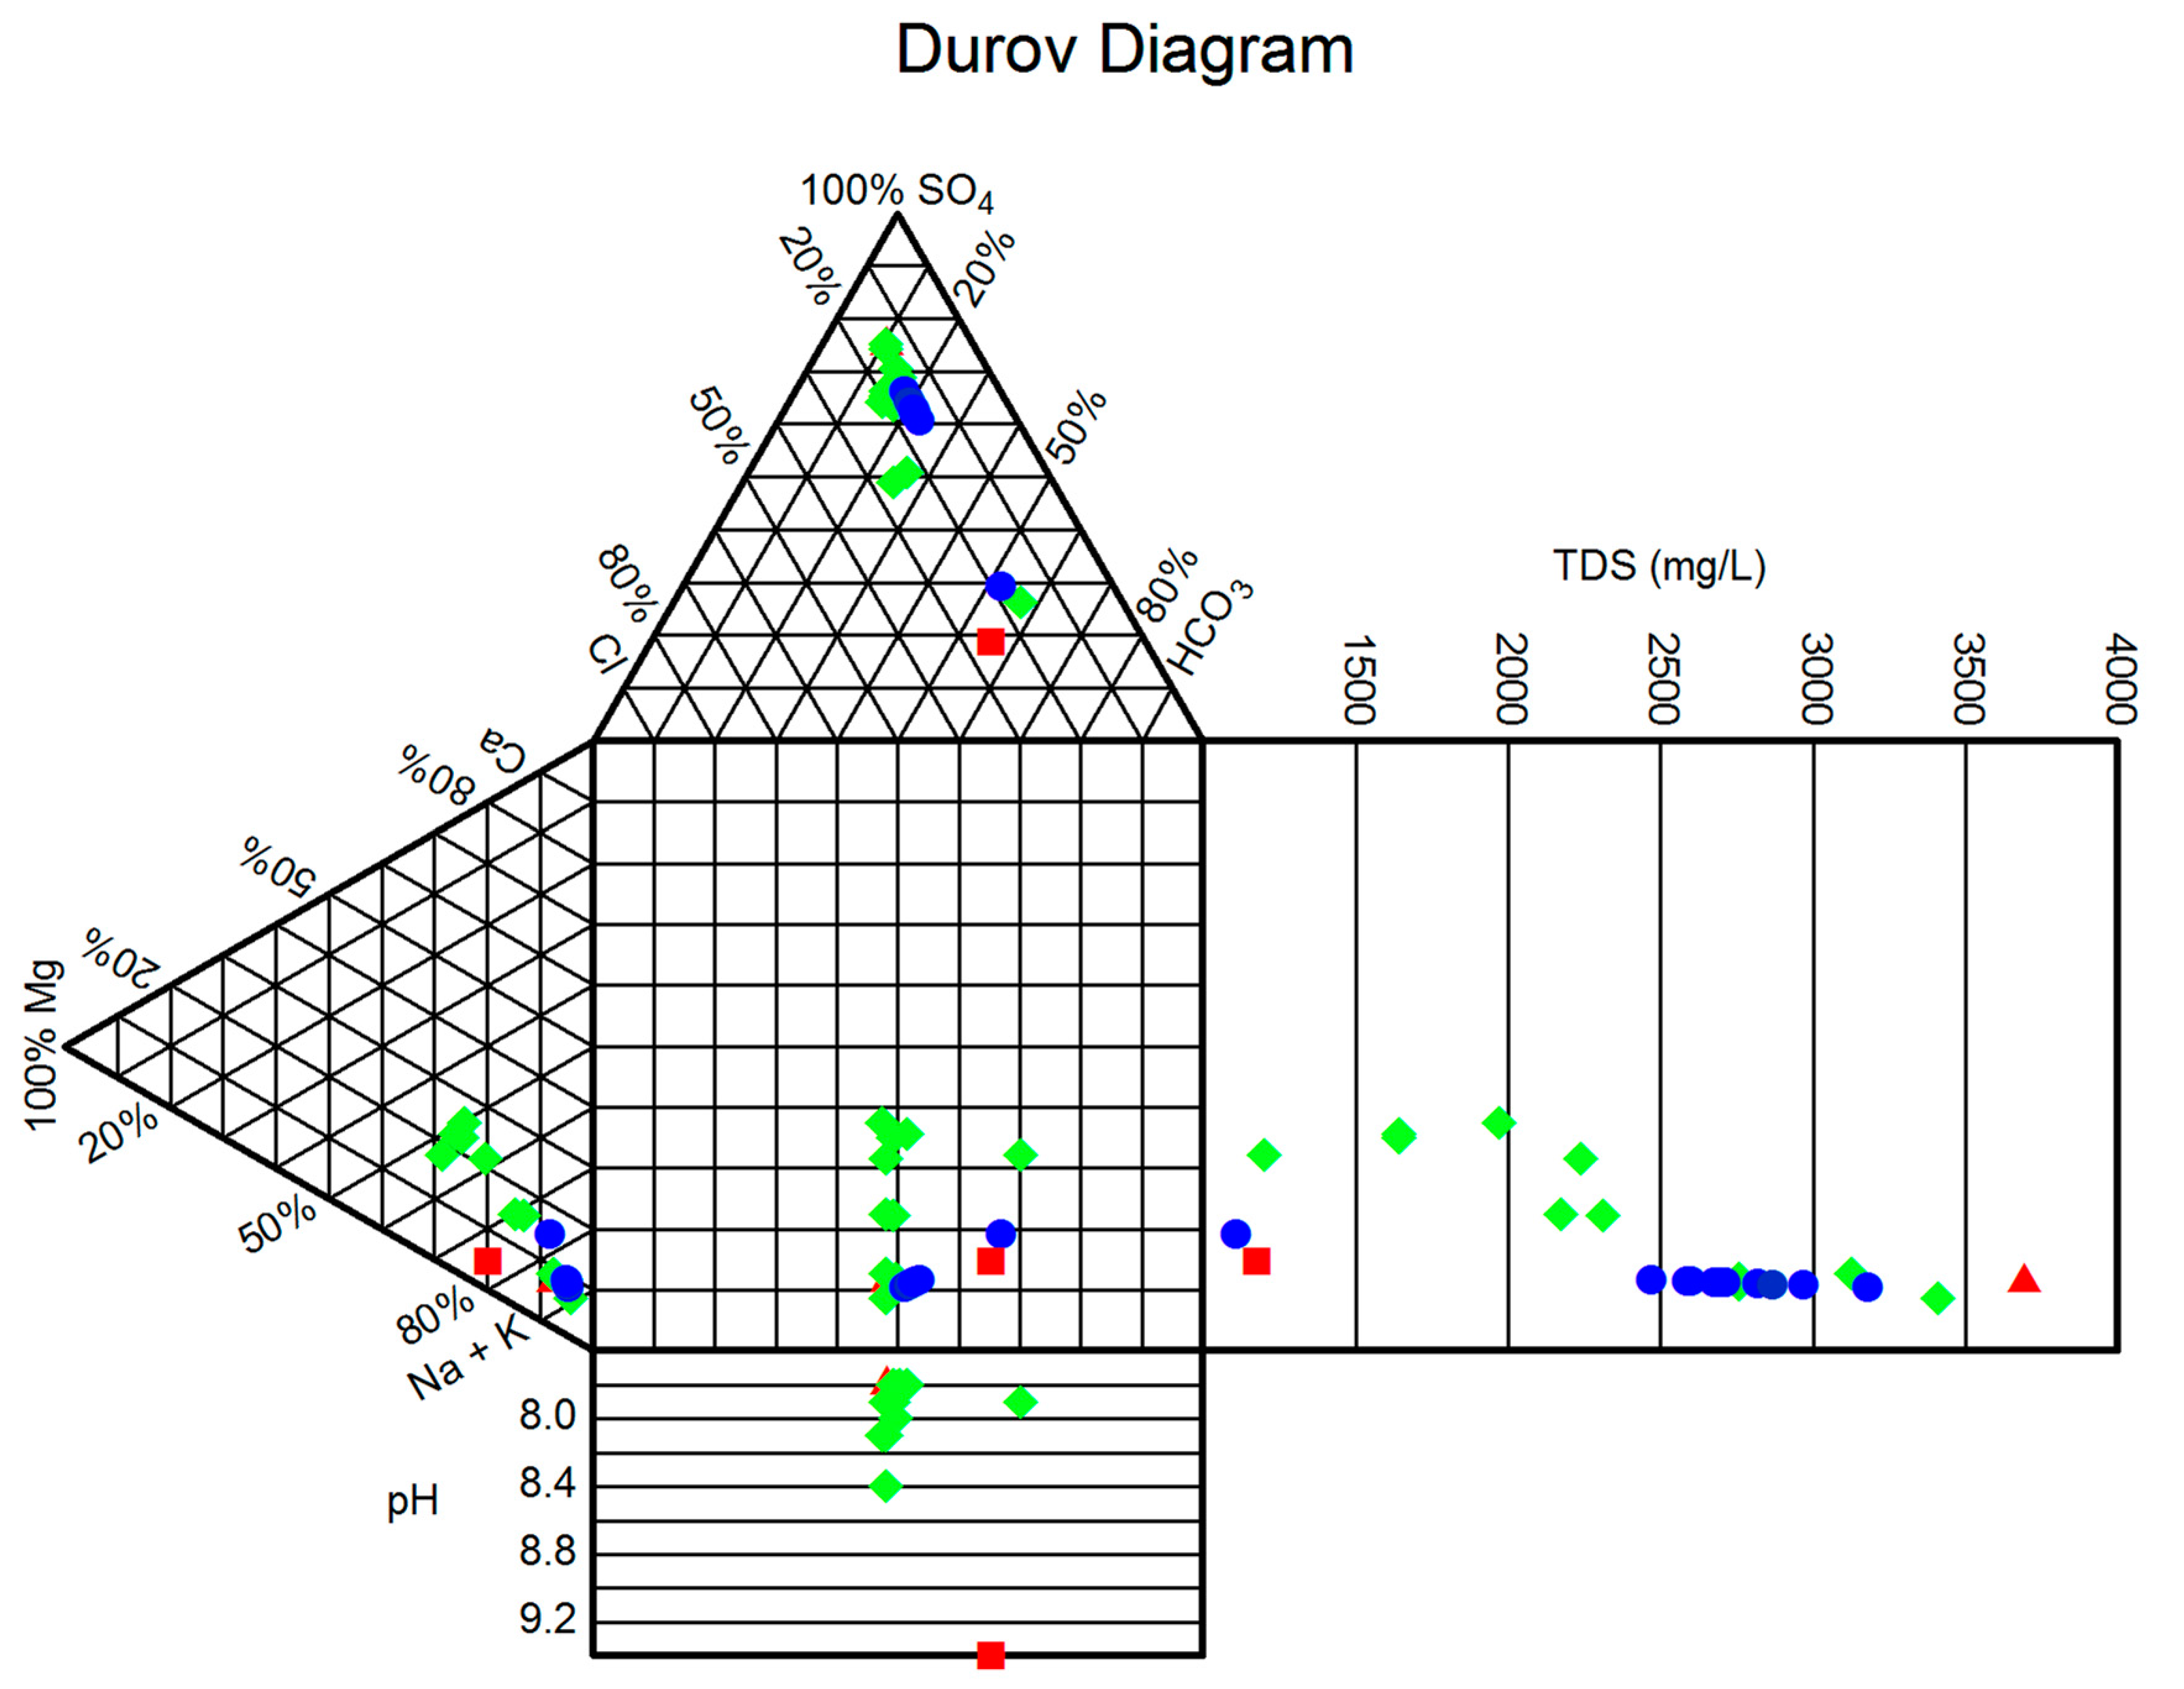
The initial hydrochemical types of these groundwater samples changed after the evolution using the PHREEQC model. Hydrochemical type evolution at all the sampling points are plotted again in the piper diagram, as shown in Figure 6, and the changes of ions, pH, and TDS before and after evolution were compared in Figure 7.
Before evolution, some groundwater samples of Carboniferous Taiyuan limestone karst-fissure groundwater (e.g., C2, C8, C11, C12) contain considerable Ca2+ or Mg2+. The hydrochemical types varied from point to point, resulting from the hydraulic connection between the two aquifer systems. After evolution, most chemical types of groundwater samples (except C12) in the Carboniferous Taiyuan limestone karst-fissure aquifer system transformed to SO4-K + Na type, the initial chemical type of groundwater in this aquifer. Simultaneously, the value of TDS increased and the pH decreased. However, the chemical type of the groundwater C12 has evolved to HCO3·SO4-K + Na type from HCO3·SO4-K + Na·Mg type, the same as the chemical type of groundwater in the Ordovician limestone karst-fissure aquifer system. This phenomenon illustrates that if one or more disturbances occur on the hydrogeological environment of a certain aquifer, the groundwater will recover to the initial chemical characteristics after water–rock reaction equilibrium. The reason why the chemical type of the groundwater in the C12 borehole could not recover to the original groundwater in the Carboniferous Taiyuan limestone karst-fissure aquifer may be that the borehole C12 is located nearest to the karst collapse column of #2 in the study area. This provides reasonable evidence that water conductivity exists in the #2 karst collapse column.
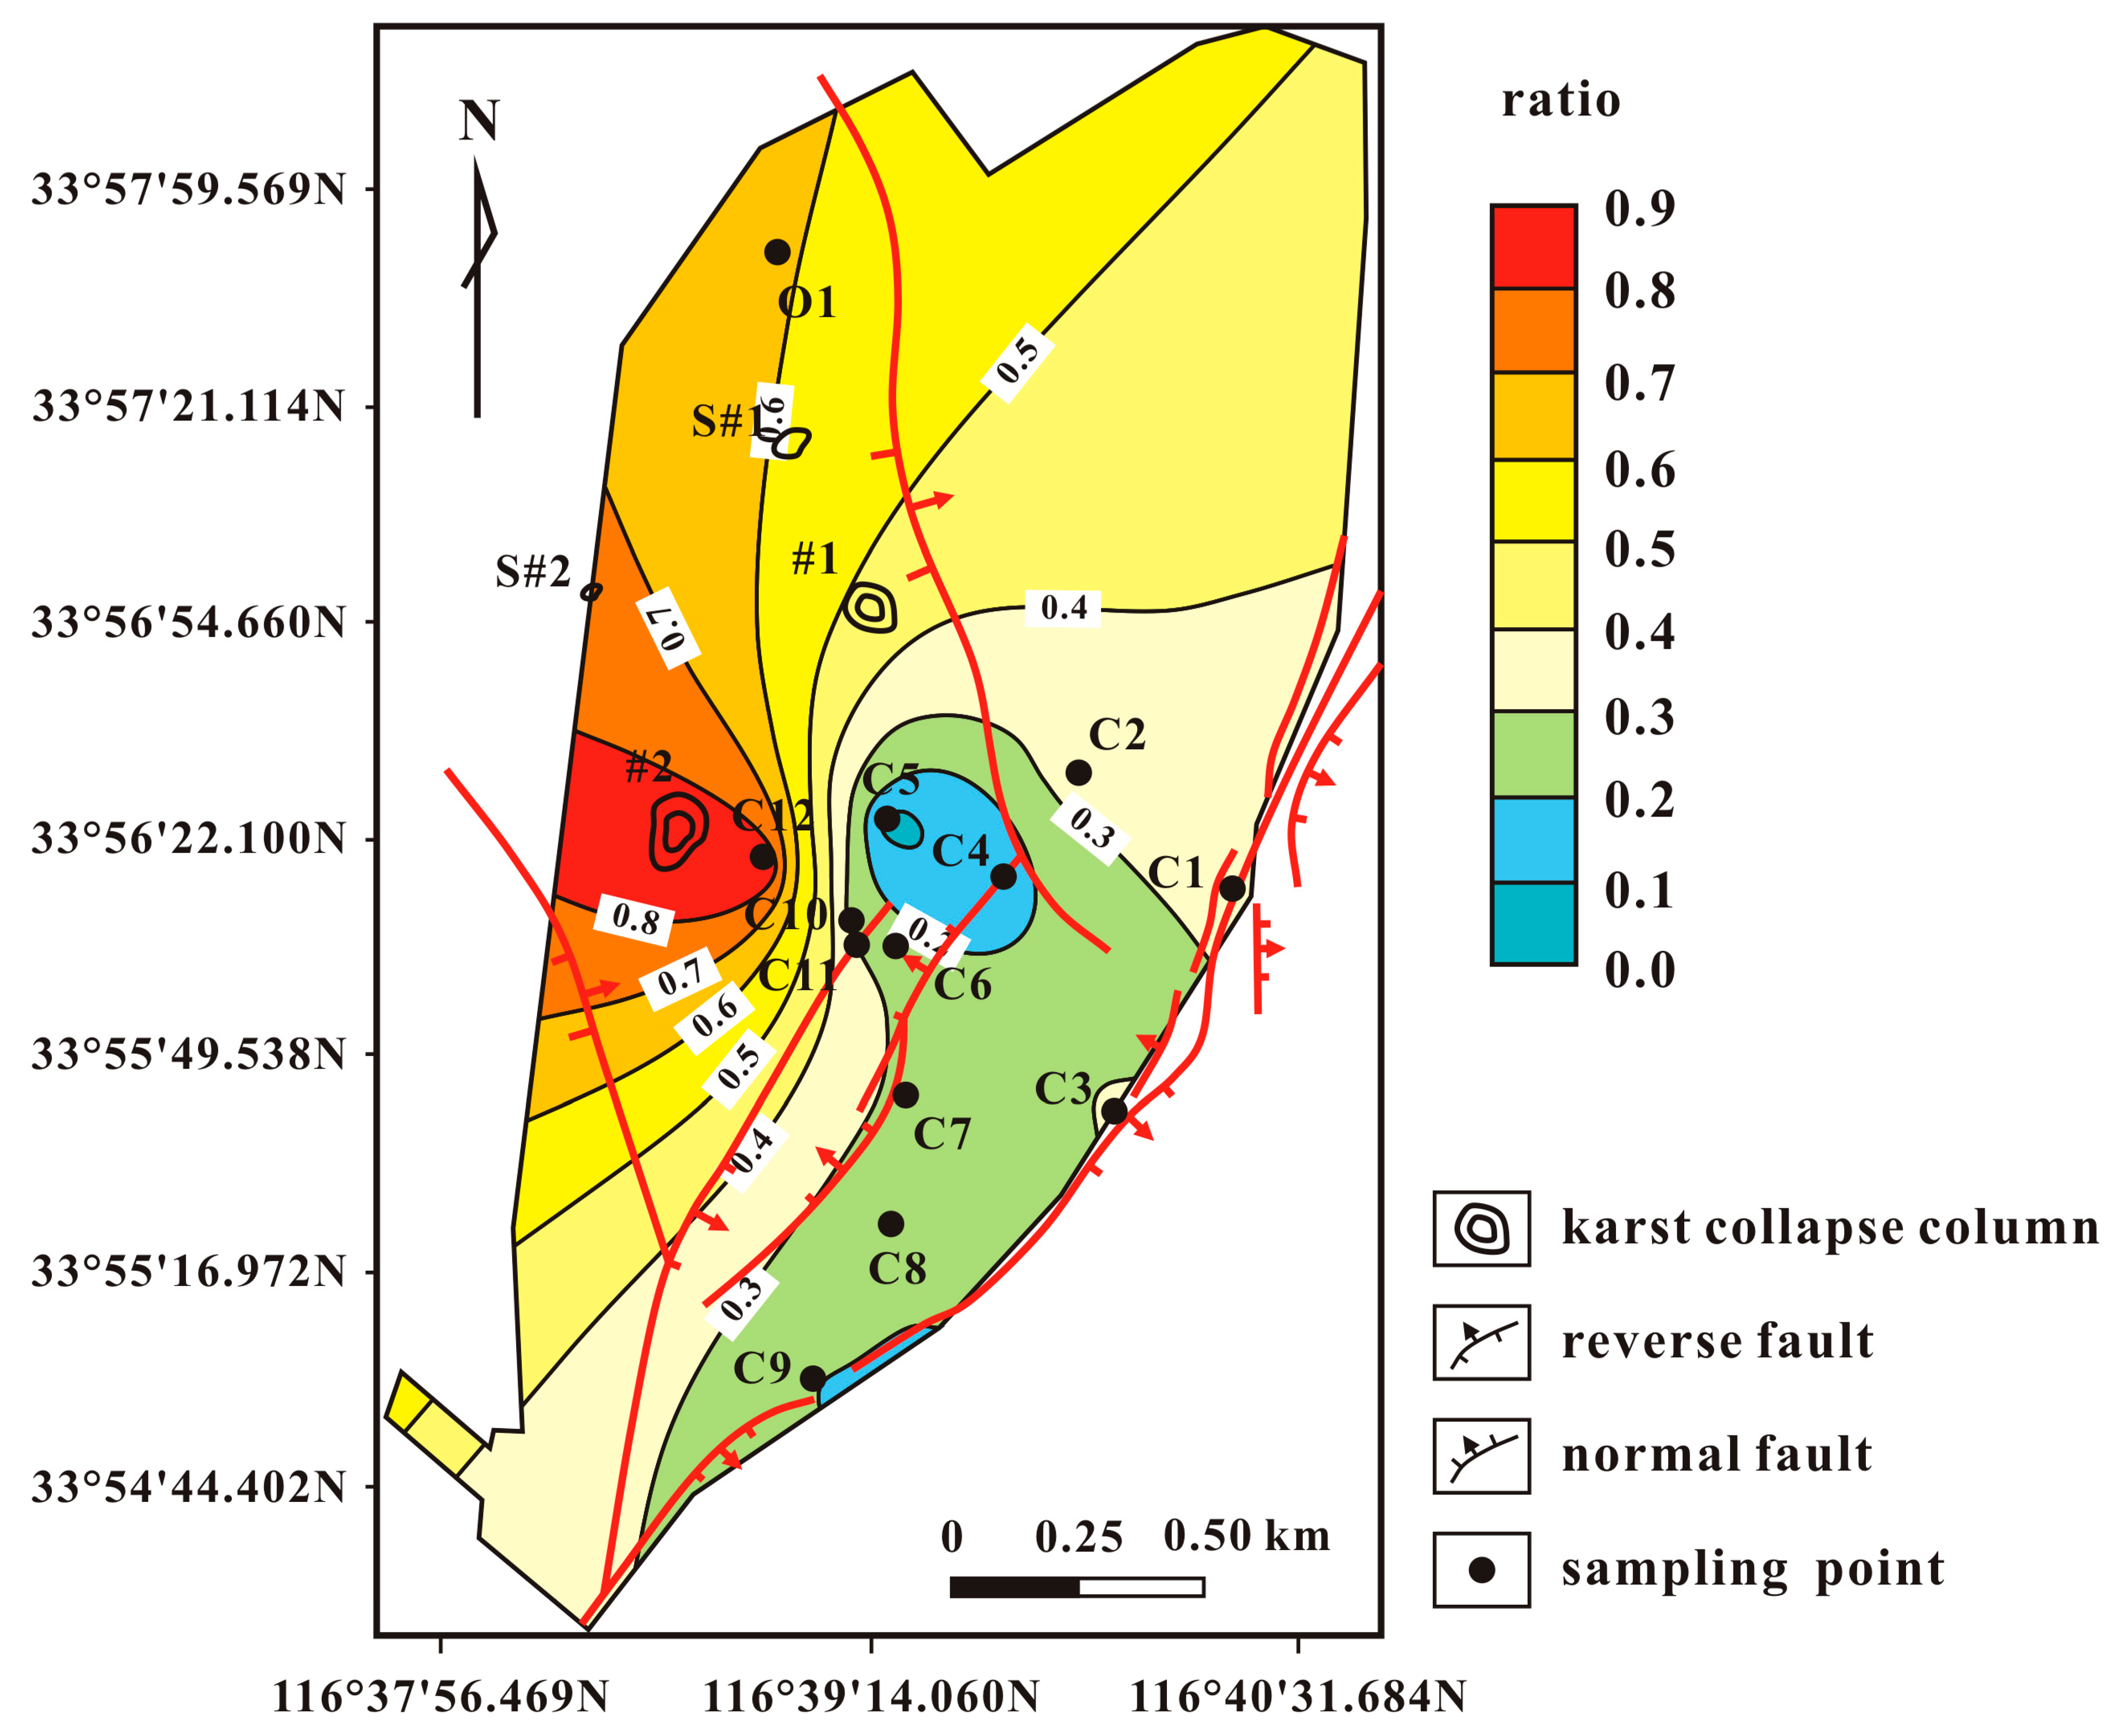
A mixing ratio contour map is produced in Figure 8. The groundwater mixing ratio in Figure 8 generally showed that near the #2 karst collapse column, the mixing ratio of groundwater deriving from Ordovician aquifer to groundwater deriving from Carboniferous Taiyuan aquifer was large, and far away from the collapse column the mixing ratio was small. A singular point of smallest ratio may exist because the mixing ratio was also affected by the groundwater direction. As shown in Figure 2, the groundwater in the Carboniferous Taiyuan limestone karst-fissure aquifer flows in three directions, dividing the field groundwater flows into opposite directions. Hence, the mixing ratio in the stagnating flow area is the smallest. In general, the mixing ratio is mainly affected by the distance of the sampling location to the #2 karst collapse column.

5. Conclusions

According to groundwater hydrochemistry characteristics and the sampling locations in the study, sample C1 was selected as the original groundwater in the Carboniferous Taiyuan limestone karst-fissure aquifer system. The different hydrochemistry characteristics of sampling groundwater in the Carboniferous Taiyuan limestone karst-fissure aquifer system indicates the existence of an external disturbance.
The piper diagram showed the groundwater in the Carboniferous Taiyuan limestone karst-fissure aquifer system changed to SO4-K + Na·Ca type, SO4·HCO3-K + Na·Mg type, HCO3·SO4-K + Na type, SO4·Cl·HCO3-K + Na·Mg type, and HCO3·SO4-K + Na·Mg type at different sampling points, and the groundwater sample C12 was similar to the groundwater sample O1 in Ordovician limestone aquifer. It further reveals the hydraulic connection between the Carboniferous Taiyuan limestone karst-fissure aquifers and the Ordovician limestone aquifer.
The mixing ratios of sampling groundwater from the two aquifers were calculated by piper diagram and modified by PHREEQC model. The results showed the highest mixing ratio is 0.905 in the C12 borehole that is located nearest to the #2 karst collapse column. In addition, the mixing ratio gradually decreases as the distance increases far away from the #2 karst collapse column. After evolution of mixing groundwater with aquifer rock, the groundwater chemical types at most sampling points can recover to the chemical type of the groundwater in the Carboniferous Taiyuan limestone karst-fissure aquifer except the C12 borehole. These observations firmly demonstrate that the groundwater in the Ordovician limestone aquifer flowed into the Taiyuan limestone karst-fissure aquifer through the passage of #2 karst collapse column. As a result, the proposed piper diagram- PHREEQC model based method can provide accurate identification of karst collapse columns, and can be applied to practical applications.

Acknowledgments

This work was supported in part by Scientific Research Foundation of Key Laboratory of Coal-Based CO2 Capture and Geological Storage, Jiangsu Province (China University of Mining and Technology) (No. 2015A05 ), Jiangsu Province Postdoctoral Research Funding Scheme (No. 1501155B), the Priority Academic Program Development of Jiangsu Higher Education Institutions and the National Natural Science Foundation of China (51374203). The authors would like to thank Zhixiong Li from University of New South Wales, Australia for his constructive comments on this paper. We also express our thanks to the reviewers for their time and effort on reviewing this paper.

Author Contributions

Bo Liu conceived and designed the research program; Jinpeng Xu provided research materials; Bo Liu and Jinpeng Xu analyzed the data; Bo Liu wrote the paper; Reza Malekian supported software and made much contribution during major revision.

Conflicts of Interest

The authors declare no conflict of interest.

References

  1. Liang, Y. Experimental Simulation for the Flow Character and Quantity of Quicksand Based on Granular Flow Theory. Master’s Thesis, China University of Mining and Technology, Xuzhou, China, 2012. [Google Scholar]
  2. Li, G.Y.; Zhou, W.F. Impact of karst water on coal mining in North China. Environ. Geol. 2006, 49, 449–457. [Google Scholar] [CrossRef]
  3. Wu, Q.; Wang, M.; Wu, X. Investigations of groundwater bursting into coal mine seam floors from fault zones. Int. J. Rock Mech. Min. 2004, 41, 557–571. [Google Scholar] [CrossRef]
  4. Zhang, J.C.; Peng, S.P. Water inrush and environmental impact of shallow seam mining. Environ. Geol. 2005, 48, 1068–1076. [Google Scholar] [CrossRef]
  5. Zhang, J.C.; Shen, B.H. Coal mining under aquifers in China: A case study. Int. J. Rock Mech. Min. 2004, 41, 629–639. [Google Scholar] [CrossRef]
  6. Wu, Q.; Wang, M. Characterization of water bursting and discharge into underground mines with multilayered groundwater flow systems in the North China coal basin. Hydrogeol. J. 2006, 14, 882–893. [Google Scholar] [CrossRef]
  7. Zhu, W.C.; Wei, C.H. Numerical simulation on mining-induced water inrushes related to geologic structures using a damage-based hydromechanical model. Environ. Earth Sci. 2011, 62, 43–54. [Google Scholar] [CrossRef]
  8. Bi, Y.J.; Wu, Y.L.; Li, N. Brief analysis of prevent measure of the karst collapse column’s water inrush. In Proceedings of the International Conference on Mine Hazards Prevention and Control, Qingdao, China, 17 October 2007; pp. 628–632.
  9. Zuo, J.P.; Peng, S.P.; Li, Y.J.; Chen, Z.H.; Xie, H.P. Investigation of karst collapse based on 3-D seismic technique and DDA method at Xieqiao coal mine, China. Int. J. Coal Geol. 2009, 78, 276–287. [Google Scholar] [CrossRef]
  10. Yao, B.H.; Wei, J.P.; Wang, D.K.; Ma, D.; Chen, Z.Q. Numerical study on seepage property of karst collapse columns under particle migration. Cmes-Comp. Model. Eng. 2013, 91, 81–100. [Google Scholar]
  11. Chidambaram, S.; Anandhan, P.; Prasanna, M.V.; Srinivasamoorthy, K.; Vasanthavigar, M. Major ion chemistry and identification of hydrogeochemical processes controlling groundwater in and around Neyveli Lignite Mines, Tamil Nadu, South India. Arab. J. Geosci. 2013, 6, 3451–3467. [Google Scholar] [CrossRef]
  12. Gomo, M.; Masemola, E. Groundwater hydrogeochemical characteristics in rehabilitated coalmine spoils. J. Afr. Earth Sci. 2016, 116, 114–126. [Google Scholar] [CrossRef]
  13. Guo, H.M.; Wang, Y.X. Hydrogeochemical processes in shallow quaternary aquifers from the northern part of the Datong Basin, China. Appl. Geochem. 2004, 19, 19–27. [Google Scholar] [CrossRef]
  14. Venkatramanan, S.; Chung, S.Y.; Rajesh, R. Comprehensive studies of hydrogeochemical processes and quality status of groundwater with tools of cluster, grouping analysis, and fuzzy set method using GIS platform: A case study of Dalcheon in Ulsan City, Korea. Environ. Sci. Pollut. R. 2015, 22, 11209–11223. [Google Scholar] [CrossRef] [PubMed]
  15. Ardejani, F.D.; Karami, G.H.; Assadi, A.B.; Dehghan, R.A. Hydrogeochemical investigations of the Shour River and groundwater affected by acid mine drainage in Sarcheshmeh porphyry copper mine. In Proceedings of the 10th International-Mine-Water-Association Congress on Mine Water and the Environment, Karlovy Vary, Czech Republic, 2–5 June 2008; pp. 235–238.
  16. Carro, B.; Borrego, J.; Lopez-Gonzalez, N.; Grande, J.A.; Gomez, T.; de la Torre, M.L.; Valente, T. Impact of acid mine drainage on the hydrogeochemical characteristics of the Tinto-Odiel Estuary (SW Spain). J. Iber Geol. 2011, 37, 87–96. [Google Scholar]
  17. Ceron, J.C.; Grande, J.A.; de la Torre, M.L.; Borrego, J.; Santisteban, M.; Valente, T. Hydrochemical characterization of an acid mine drainage-affected reservoir: The Sancho Reservoir, Huelva, southwest Spain. Hydrolog. Sci. J. 2014, 59, 1213–1224. [Google Scholar] [CrossRef]
  18. Ceron, J.C.; Grande, J.A.; de la Torre, M.L.; Santisteban, M.; Valente, T. Impact of AMD processes on the water dams of the iberian Pyrite Belt: Overall hydrochemical characterization (Huelva, SW Spain). Water Air Soil Poll. 2013, 224, 1–11. [Google Scholar] [CrossRef]
  19. Equeenuddin, S.M.; Tripathy, S.; Sahoo, P.K.; Panigrahi, M.K. Hydrogeochemical characteristics of acid mine drainage and water pollution at Makum Coalfield, India. J. Geochem Explor. 2010, 105, 75–82. [Google Scholar] [CrossRef]
  20. Grande, J.A.; Carro, B.; Borrego, J.; de la Torre, M.L.; Valente, T.; Santisteban, M. Hydrogeochemical variables regionalization—Applying cluster analysis for a seasonal evolution model from an estuarine system affected by AMD. Mar. Pollut. Bull. 2013, 69, 150–156. [Google Scholar] [CrossRef] [PubMed]
  21. Bhattacharya, P.; Sracek, O.; Eldvall, B.; Asklund, R.; Barmen, G.; Jacks, G.; Koku, J.; Gustafsson, J.E.; Singh, N.; Balfors, B.B. Hydrogeochemical study on the contamination of water resources in a part of Tarkwa mining area, Western Ghana. J. Afr. Earth Sci. 2012, 66–67, 72–84. [Google Scholar] [CrossRef]
  22. Cidu, R. Mobility of aqueous contaminants at abandoned mining sites: Insights from case studies in Sardinia with implications for remediation. Environ. Earth Sci. 2011, 64, 503–512. [Google Scholar] [CrossRef]
  23. Steefel, C.I. New directions in hydrogeochemical transport modeling: Incorporating multiple kinetic and equilibrium reaction pathways. In Proceedings of the XIII th International Conference on Computational Methods in Water Resources, University of Calgary, Calgary, AB, Canada, 25–29 June 2000; pp. 331–338.
  24. Eary, L.E.; Runnells, D.D.; Esposito, K.J. Geochemical controls on ground water composition at the cripple creek mining district, cripple creek, Colorado. Appl. Geochem. 2003, 18, 1–24. [Google Scholar] [CrossRef]
  25. Kruse, N.A.; Younger, P.L. Development of thermodynamically-based models for simulation of hydrogeochemical processes coupled to channel flow processes in abandoned underground mines. Appl. Geochem. 2009, 24, 1301–1311. [Google Scholar] [CrossRef]
  26. Rusdinar, Y.; Edraki, M.; Baumgartl, T.; Mulligan, D.; Miller, S. Long term performance of hydrogeochemical riverine mine tailings deposition at Freeport Indonesia. Mine Water Environ. 2013, 32, 56–70. [Google Scholar] [CrossRef]
  27. Yann, R.A.; Julio, M.A. Hydrogeochemical trends of the Valenciana tailings, Mexico. In Proceedings of the 14th International Symposium on Water–Rock Interaction (WRI), Avignon, France, 9–14 June 2013; pp. 717–720.
  28. Gomo, M.; Vermeulen, D. Hydrogeochemical characteristics of a flooded underground coal mine groundwater system. J. Afr. Earth Sci. 2014, 92, 68–75. [Google Scholar] [CrossRef]
  29. Han, Y.; Wang, G.C.; Cravotta, C.A.; Hu, W.Y.; Bian, Y.Y.; Zhang, Z.W.; Liu, Y.Y. Hydrogeochemical evolution of Ordovician limestone groundwater in Yanzhou, North China. Hydrol. Process. 2013, 27, 2247–2257. [Google Scholar] [CrossRef]
  30. Karmegam, U.; Chidambaram, S.; Prasanna, M.V.; Sasidhar, P.; Manikandan, S.; Johnsonbabu, G.; Dheivanayaki, V.; Paramaguru, P.; Manivannan, R.; Srinivasamoorthy, K.; et al. A study on the mixing proportion in groundwater samples by using piper diagram and PHREEQC model. Chin. J. Geochem. 2011, 30, 490–495. [Google Scholar] [CrossRef]
  31. Henriques, V.; Malekian, R. Mine safety system using wireless sensor network. IEEE Access 2016, 4, 3511–3521. [Google Scholar] [CrossRef]
  32. Su, B.; Malekian, R.; Yu, J.; Feng, X.; Liu, Z. Electrical anisotropic response of water conducted fractured zone in the mining goaf. IEEE Access 2016, 4, 6216–6224. [Google Scholar] [CrossRef]
  33. Gong, T.; Huang, H.; Chen, P.; Malekian, R.; Chen, T. Secure two-party distance computation protocol based on privacy homomorphism and scalar product in wireless sensor networks. Tsinghua Sci. Technol. 2016, 21, 385–396. [Google Scholar]
  34. Piper, A.M. A graphic procedure in the geochemical interpretation of water—analysis. Trans. Am. Geophys. Union 1944, 25, 914–928. [Google Scholar] [CrossRef]
  35. Rao, N.S. MHPT. BAS: A computer program for modified Hill–Piper diagram for classification of ground water. Comput. Geosci. 1998, 24, 991–1008. [Google Scholar] [CrossRef]
  36. Zhang, X.; Shao, J.; An, W.; Yang, T.; Malekian, R. An improved time-frequency representation based on nonlinear mode decomposition and adaptive optimal kernel. Elektron. Ir Elektrotech. 2016, 22, 52–57. [Google Scholar]
  37. Jin, X.; Shao, J.; Zhang, X.; An, W.; Malekian, R. Modeling of nonlinear system based on deep learning framework. Nonlinear Dyn. 2016, 84, 1327–1340. [Google Scholar] [CrossRef]
  38. Cloete, N.A.; Malekian, R.; Nair, L. Design of smart sensors for real-time water quality monitoring. IEEE Access 2016, 4, 3975–3990. [Google Scholar] [CrossRef]
  39. Li, X.; Wang, S.; Malekian, R.; Hao, S.; Li, Z. Numerical simulation of rock breakage modes under confining pressures in the rock cutting process: An experimental investigation. IEEE Access 2016, 4, 5710–5720. [Google Scholar] [CrossRef]
  40. Wang, J.; Cai, M.; Malekian, R.; Zhang, Y.; Li, Z. Experimental evaluation of lubrication characteristics of a new type oil-film bearing oil using multi-sensor system. Appl. Sci. 2017, 7, 28. [Google Scholar] [CrossRef]
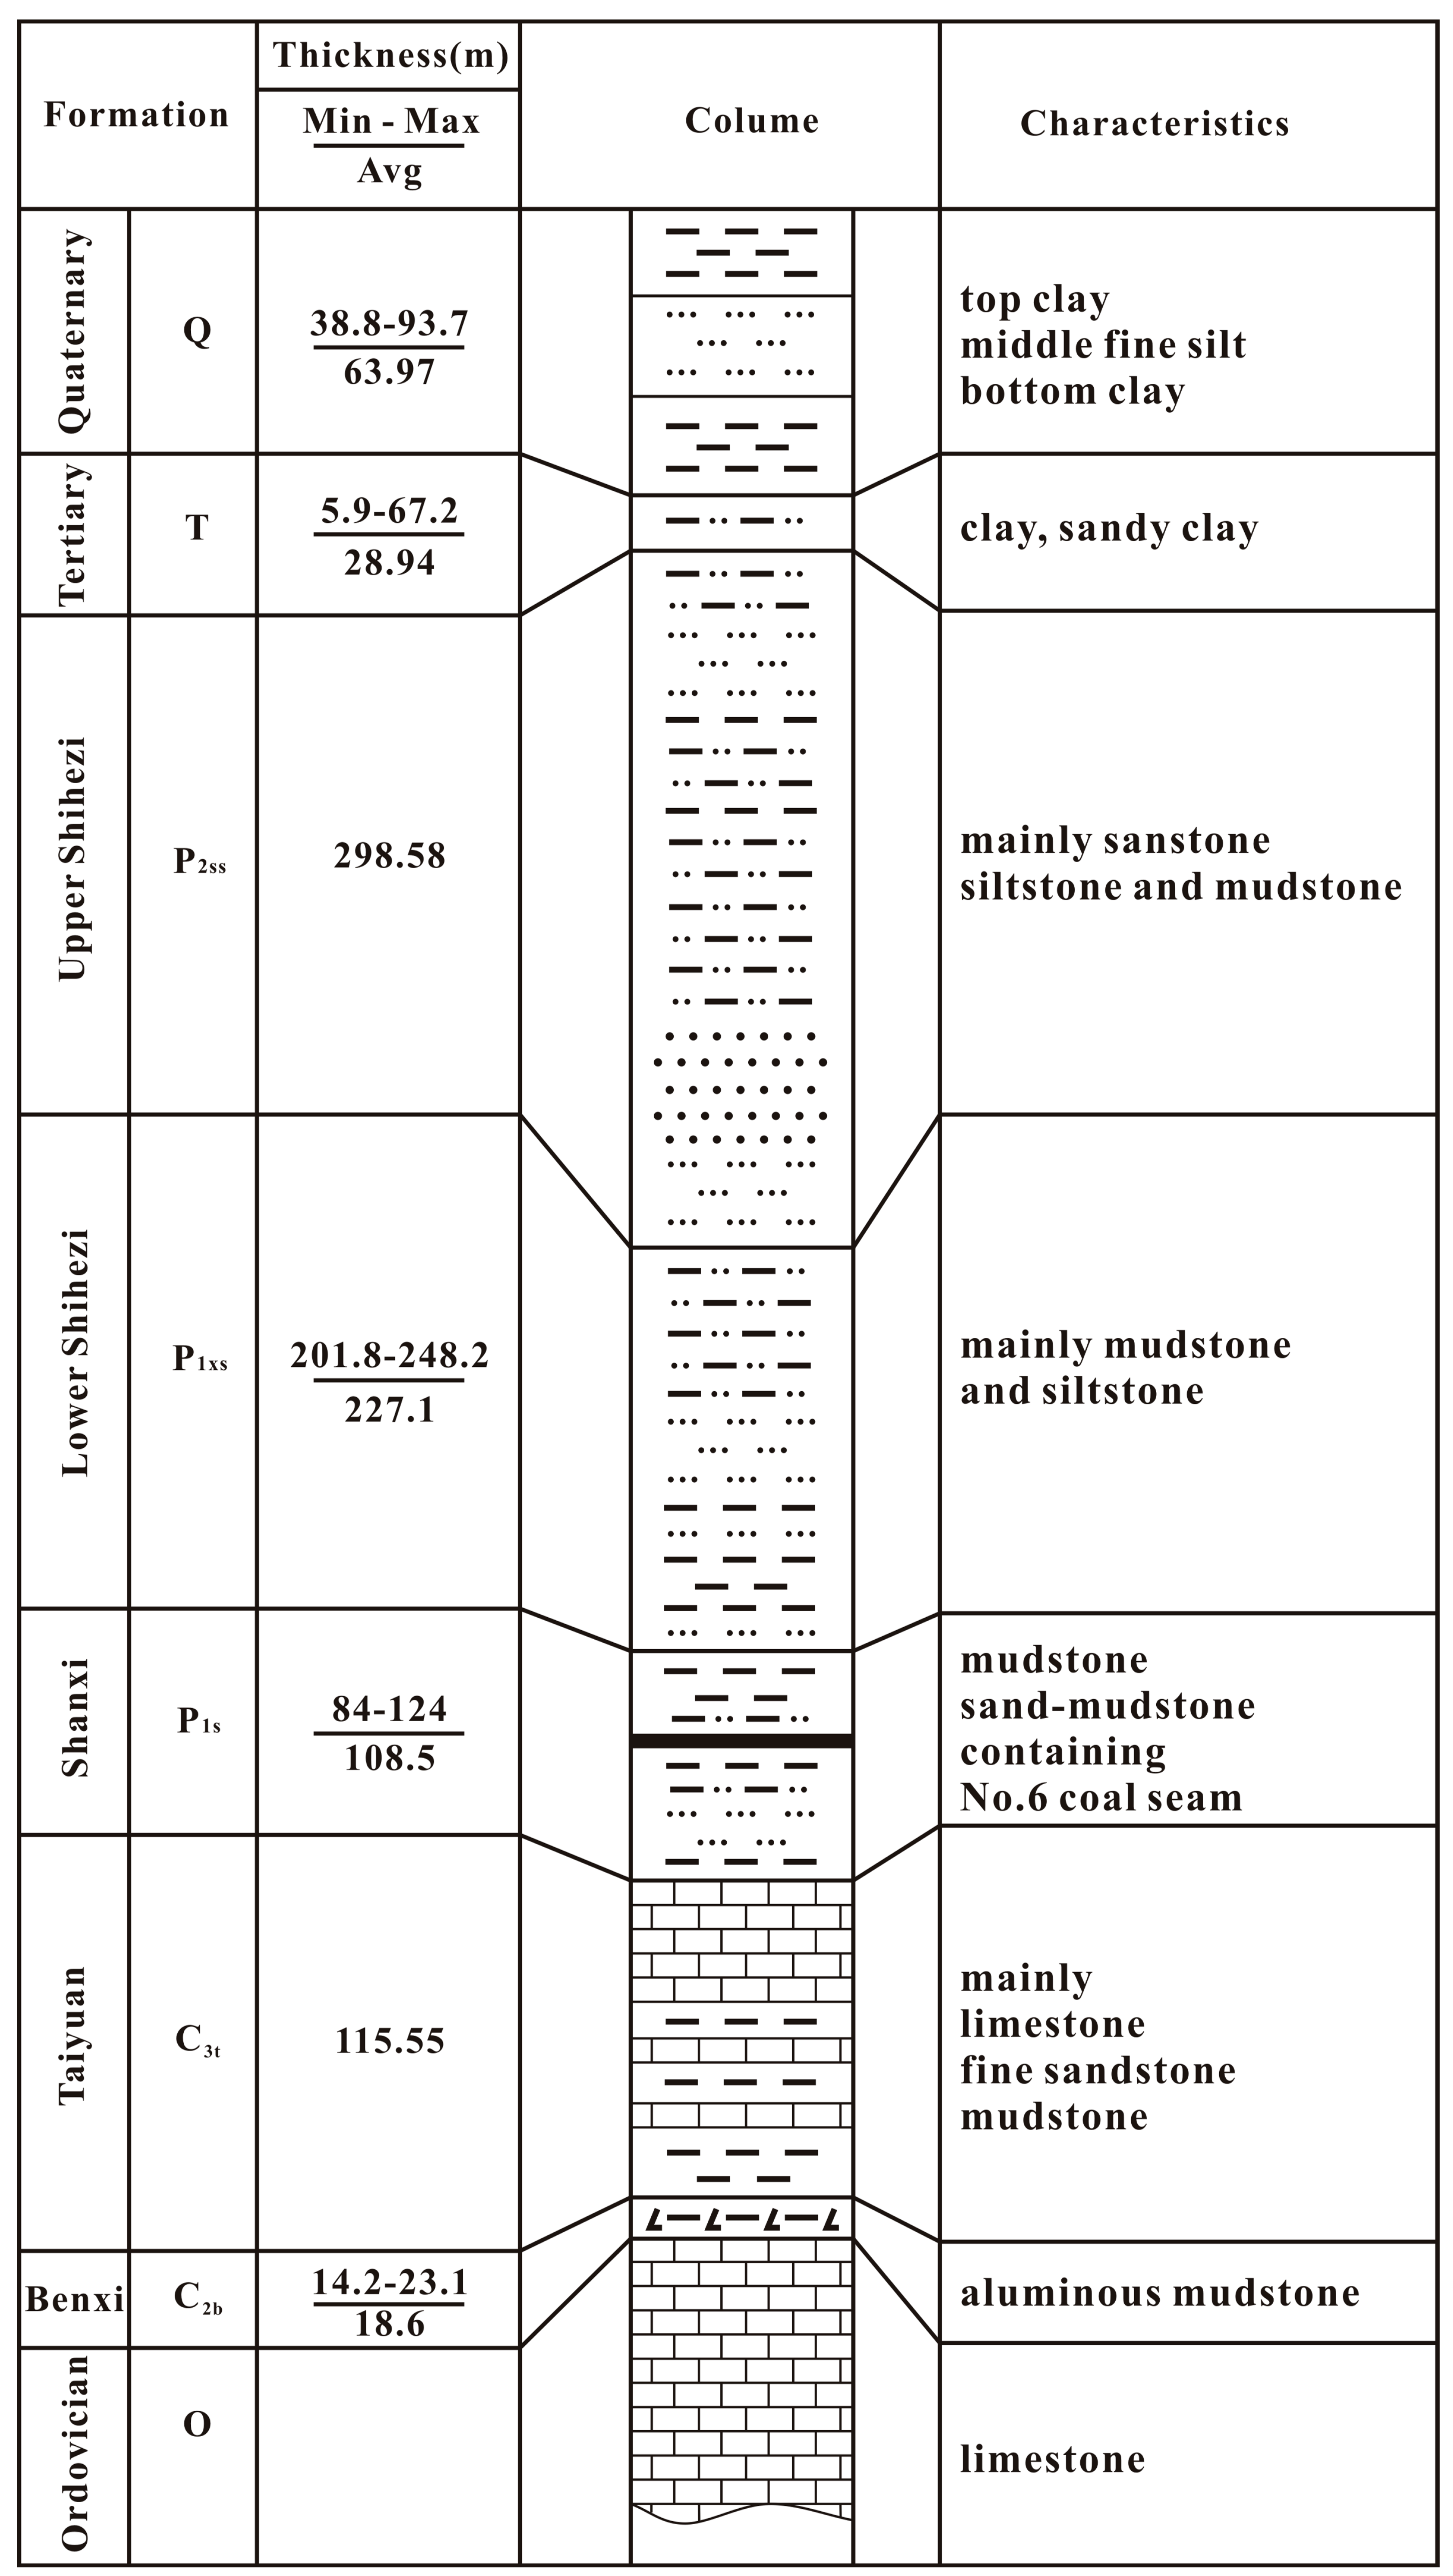
Figure 1. Generalized stratigraphy of the study area.
Applsci 07 00042 g001
Figure 2. Groundwater flow field of Carboniferous Taiyuan limestone karst-fissure aquifer systems in the study area. There are three main flow directions: northeast, southeast, and southwest, in this groundwater flow field.
Applsci 07 00042 g002
Figure 3. Locations of sampling points and karst collapse columns in the study area. S #1 and S #2 are potential karst collapse columns, while #1 and #2 are certain karst collapse columns.
Applsci 07 00042 g003
Figure 4. Graphical method by piper diagram, where A and B are parent solutions and C is the mixture.
Applsci 07 00042 g004
Figure 5. Piper diagram of all groundwater samples.
Applsci 07 00042 g005
Figure 6. Piper diagram of hydrochemical types evolution in Carboniferous Taiyuan limestone karst-fissure aquifer systems.
Applsci 07 00042 g006
Figure 7. Durov diagram of the hydrochemical type evolution in Carboniferous Taiyuan limestone karst-fissure aquifer systems. The red point shows the background value. The green points show the initial values of all samples. The blue points show the simulated values of all samples.
Applsci 07 00042 g007
Figure 8. Contour map of groundwater mixing ratio in the study area.
Applsci 07 00042 g008
Table 1. Chemical reaction considering in PHREEQC model.
Reaction TermDissolution Reaction Equation
CO2 (g)CO2 + H2O ⇌ H+ + HCO3
GypsumCaSO4·2H2O ⇌ Ca2+ + SO42− + 2H2O
AnhydriteCaSO4 ⇌ Ca2+ + SO42−
HaliteNaCl ⇌ Na+ + Cl
CalciteCaCO3 ⇌ Ca2+ + CO32−
DolomiteCaMg(CO3)2 ⇌ Ca2+ + Mg2+ + 2CO32−
Cation Exchange2NaX + Ca2+ ⇌ 2Na+ + CaX2
Table 2. Chemical properties of each groundwater sample.
SampleCation (mg/L)Anion (mg/L)Alkalinity (mg/L)pHTDS (mg/L)Hardness (°H)
K+ + Na+Ca2+Mg2+HCO3SO42−Cl
C11030.3180.1848.06346.341903.19268.165.6767.8369322.30
C2284.99108.9675.67384.11585.56197.466.2697.8164732.69
C3493.1792.5654.06281.79944.62206.114.6188.4217825.42
C4872.3080.3641.28302.291586.33234.805.7808.1312915.42
C51003.7463.6324.62313.821759.74250.865.1408.1341214.58
C6805.1270.7833.34357.391368.65215.516.3218.0276117.59
C7784.1664.8525.51381.001300.39213.066.2447.8276115.24
C8291.92109.7272.53367.70566.64223.736.0307.8164632.08
C9551.33105.7352.66362.091022.58227.215.9347.9231726.94
C10430.88137.0578.97295.331018.3214.274.8407.9224237.39
C11330.19144.5383.50268.24877.53207.074.3968.1197439.48
C12202.6858.9057.07573.03206.1697.979.3917.9120621.40
O1193.310.6327.01314.8183.1982.37353.819.41180137.8
Table 3. Groundwater chemical ions milligram equivalent (mEq/kg) values and the hydrochemical types of all groundwater samples based on water quality analysis data.
SampleCation (mEq/kg)Anion (mEq/kg)Hydrochemical Types
K+ + Na+Ca2+Mg2+HCO3SO42−Cl
C144.804.003.955.6839.607.56SO4-K + Na
C212.405.446.236.3012.205.57SO4·HCO3-K + Na·Mg
C321.504.624.454.6219.705.81SO4-K + Na
C437.904.013.404.9533.006.62SO4-K + Na
C543.703.182.035.1436.607.08SO4-K + Na
C635.003.532.745.8628.506.08HCO3·SO4-K + Na
C734.103.242.106.2427.106.01SO4-K + Na
C812.705.485.976.0311.806.31SO4·Cl·HCO3-K + Na·Mg
C924.005.284.335.9321.306.41SO4-K + Na
C1018.706.846.504.8421.206.04SO4-K + Na
C1114.407.216.874.4018.305.84SO4-K + Na·Ca
C128.822.944.709.394.292.76HCO3·SO4-K + Na·Mg
O18.410.532.225.161.732.32HCO3-K + Na
Table 4. Mixing ratios calculated by piper diagram and modified by PHREEQC model.
SamplePiper DiagramPHREEQC Model
R a (O) R b (C) R a (O) R b (C)
C10.0001.0000.0001.000
C20.7500.2500.3610.639
C30.5820.4180.3130.687
C40.0650.9350.1560.844
C50.3310.6690.0690.931
C60.2660.7340.2620.738
C70.4330.5670.2760.724
C80.7410.2590.2170.783
C90.5860.4140.1980.802
C100.7020.2980.2690.731
C110.7310.2690.3080.692
C120.9000.1000.9050.095
O11.0000.0001.0000.000