Synthesis and Thermoelectric Properties of TiO2/Cu2SnSe3 Composites

School of Materials Science and Engineering, University of Jinan, Jinan 250022, China
*
Author to whom correspondence should be addressed.
Appl. Sci. 2017, 7(10), 1043; https://doi.org/10.3390/app7101043
Submission received: 1 September 2017
/
Accepted: 10 October 2017
/
Published: 12 October 2017
(This article belongs to the Special Issue Recent Progress in the Development of Thermoelectric Materials)
Abstract
:Thermoelectric (TE) materials are a kind of energy material which can directly convert waste heat into electricity based on TE effects. Ternary Cu2SnSe3 material with diamond-like structure has become one of the potential TE materials due to its low thermal conductivity and adjustable electrical conductivity. In this study, the Cu2SnSe3 powder was prepared by vacuum melting-quenching-annealing-grinding process. The nano-TiO2 particles were introduced into the Cu2SnSe3 matrix by ball milling. Spark plasma sintering (SPS) was employed to fabricate the TiO2/Cu2SnSe3 composites. The X-ray diffraction (XRD), field emission scanning electron microscopy (FE-SEM), and transmission electron microscopy (TEM) were used to study the phase and microstructure of TiO2/Cu2SnSe3 composites. Electrical resistivity, Seebeck coefficient, and thermal conductivity measurement were applied to analyze the thermoelectric properties. For the 1.4%TiO2/Cu2SnSe3 composite, the electrical conductivity was improved whereas the Seebeck coefficient was lower than that of pure Cu2SnSe3. For other TiO2/Cu2SnSe3 samples, the Seebeck coefficient was improved while the electrical conductivity was reduced. The thermal conductivity of TiO2/Cu2SnSe3 composites was lower than that of Cu2SnSe3 matrix, which is attributed to the lower carrier conductivity. A maximum ZT of 0.30 at 700 K for the 1.0%TiO2/Cu2SnSe3 composite was obtained, which was 17% higher than that of the pure Cu2SnSe3 at 700 K.
1. Introduction
Humans need to care for our “mother earth” with intelligence, diligence, and heart. In a society experiencing an energy shortage, the pursuit of sustainable development has become the social mainstream. With rapid economic development, industrial scale expands. However, energy and environmental problems gradually appear at the same time. In the process of industrial production, most energy is released in the form of heat. Thermoelectric (TE) materials can directly convert waste heat into electricity based on the Seebeck effect [1,2]. While TE materials show a great prospect environmentally and economically, the lower efficiency of TE materials limits their wide application. The efficiency of TE materials is determined by the dimensionless figure of merit ZT, which is defined as ZT = α2σT/κ, where α is Seebeck coefficient, σ is electrical conductivity, κ is the thermal conductivity, and T is absolute temperature. A good TE material should have high α and σ as well as low κ value. The intrinsic properties of TE materials determine the coupling effect between the conductivity and Seebeck coefficient. Generally, the higher power factor (PF = α2σ) corresponds to higher power output. PF is proportional to the effect mass (m*) and mobility of the carriers (μ). Thermal property is determined by the total thermal conductivity (κ), which is composed of lattice part (κL) and carrier part (κe). Electronic thermal conductivity (κe) is proportional to the conductivity. Reducing the κL of a TE material is an effective way to reduce the total thermal conductivity.
Cu2SnSe3 with a diamond structure has gained great attention recently due to its low thermal conductivity originating from the complex crystal structure and high specific heat. In addition, Cu2SnSe3 has good electrical conductivity and adjustable electrical properties [3]. To further improve the thermoelectric properties of Cu2SnSe3, a great deal of research has been carried out to optimize the material from multiple perspectives. Li et al. obtained a maximum ZT of 0.45 for Cu2SnSe3 material at 773 K by one-step high-pressure combustion synthesis (HPCS) [4]. Liu et al. prepared the Cu2SnSe3 material using combustion synthesis and obtained a maximum ZT of 0.51 at 773 K, which is the best result for Cu2SnSe3 compared to other methods [5]. Wang et al. optimized the synthesis parameters to form uniform particles of wurtzite, cubic, linear heterostructures, and tetrapods by colloidal synthesis. The facile synthesis strategy opens pathways for extension to other compositions of multielement copper chalcogenides where the cubic and hexagonal phases can be formed [6]. Ge et al. and Ahmadi et al. synthesized Cu2SnSe3 nanocrystals and controlled the nanostructure successfully by solvothermal method [7,8]. In addition to optimizing the preparation process, doping of materials is also an important way to enhance the performance of TE materials. Cho et al. synthesized a Ga-doped Cu2Ga1−xGexSe3 sample and approached its theoretical minimum value of lattice thermal conductivity, resulting in a ZT value of 0.5 at 750 K [9]. Fan et al. reported a lower lattice thermal conductivity of the Cu2Ga0.075Sn0.925Se3 sample and obtained a maximum ZT of 0.43 at 700 K [10]. In addition, Skoug et al. confirmed that substituting Se with S is also an effective method to improve the TE performance of Cu-based ternary selenides [11]. The combustion synthesis method can prepare high-performance thermoelectric materials, but it is difficult to precisely control. Moreover, many studies report that only Sn location is the best candidate for substituting in the Cu2Sn(Ge)Se(S)3 structure, which limits the improvement of TE performance [3,8,10]. Based on those limits mentioned above, the composite was designed on the Cu-based ternary selenides matrix. Some studies confirmed that introducing a nanophase into the Cu-based semiconductor can improve the ZT. Zhang et al. introduced graphite nanosheets into CuGaTe2 and obtained the highest ZT of 0.93 for the CuGaTe2 composite at 873 K, which is 21% higher than that of CuGaTe2 matrix [12]. Li et al. reported that the incorporation of a suitable quantity of nanophase PbTe particles into SnSe matrix could efficiently enhance the TE performance of SnSe material [13]. TiO2 has a band gap of 3.0 eV and has good thermal and chemical stability as well as large elastic modulus, which makes it a good candidate as a second phase. TiO2 has been introduced into a filled-skutterudite matrix in previous studies [14,15,16]. However, introducing nano-TiO2 into Cu2SnSe3 has never been reported. In this study, the technological parameter was optimized to synthesize pure Cu2SnSe3 material. The nano-TiO2 was incorporated into the Cu2SnSe3 matrix by ball milling method, and the TiO2/Cu2SnSe3 thermoelectric composites were prepared by spark plasma sintering (SPS). The thermoelectric properties of TiO2/Cu2SnSe3 composites were investigated in detail.
2. Experimental Procedures
2.1. Materials Synthesis
In order to ensure a desirable Cu2SnSe3 compound, elementary powders of Cu (powder, 99.99%), Sn (powder, 99.99%), and Se (shot, 99.99%, Sinopharm Chemical Reagent Co., Ltd., Shanghai, China) were weighted accurately to the atomic ratio of Cu2SnSe3. Then, the powders were mixed in an agate mortar with ethyl alcohol and dried in vacuum drier at 350 K. Next, the powder mixture was loaded into a graphite crucible, which was sealed in a quartz ampoule under vacuum. After the above steps were completed, the quartz ampoule was put in a vertical furnace heated slowly to 1273 K and held for 12 h, followed by cooling with different rates (samples 1–3). Then, some thus-obtained samples were annealed at 923 K for three days (sample 4). Finally, the ingots (sample 1–4) were ground into fine powder in an agate mortar.
Commercial nano-TiO2 powder (average particle size: 7 nm, 99.8%, Shanghai Chemical Industry Park Co., Shanghai, China) was incorporated into the Cu2SnSe3 powder by ball milling in an argon atmosphere at volume fractions of 0.5, 1.0, 1.4, and 1.8 vol %, respectively. The TiO2/Cu2SnSe3 composite powder was obtained in a planetary mill at 300 rpm for 180 min. The weight ratio of balls to powders was about 10:1. The TiO2/Cu2SnSe3 composite powders were densified by spark plasma sintering (SPS 2040) in graphite die (10 mm in diameter) at around 740 K for about 8 min under uniaxial pressure of 50 MPa in vacuum.
2.2. Phase, Structural Characterizations, and Transport Property
The densities of all the TiO2/Cu2SnSe3 composite samples were measured by Archimedes method. The constituent phases can be detected by X-ray diffractometry (Cu Kα, D8-Advance, Bruker Corporation, Karlsruhe, Germany). The microstructure was characterized by field emission scanning electron microscopy (FESEM, QUANTA 250 FEG, ThermoFisher Scientific, Hillsboro, OR, USA) on polished and fractured samples. Transmission electron microscope (TEM) observations were performed on a JEM-2010 instrument (JEOL, Tokyo, Japan) with the voltage of 200 KV. The electrical conductivity and Seebeck coefficient were measured simultaneously using commercial equipment (ZEM-3, ULVAC-RIKO, Tokyo, Japan). The Hall coefficient (RH) was measured using the van der Pauw’s method in vacuum with the magnetic field of 2 T. The carrier concentration (pH) and mobility (μH) were estimated from the relations of pH = 1/(eRH) and μH = σRH based on the assumption of single band model, where e is the electronic charge. The thermal conductivity can be calculated by using the follow equation:
where Cp, d, and λ are specific heat, density, and thermal diffusivity, respectively. The thermal diffusivity was measured by a laser flash technique (LFA427, Netzsch, Wunsiedel, Germany) in a flowing Ar atmosphere. Specific heat was measured from room temperature to 700 K in argon using a differential scanning calorimeter (DSC1-1600HT, STA 409, Netzsch, Wunsiedel, Germany). All the measurements were performed in a temperature range of 300–700 K. All the measurements of thermoelectric properties were carried out three times to ensure the accuracy of ZT value.
κ = Cp × d × λ
3. Results and Discussion
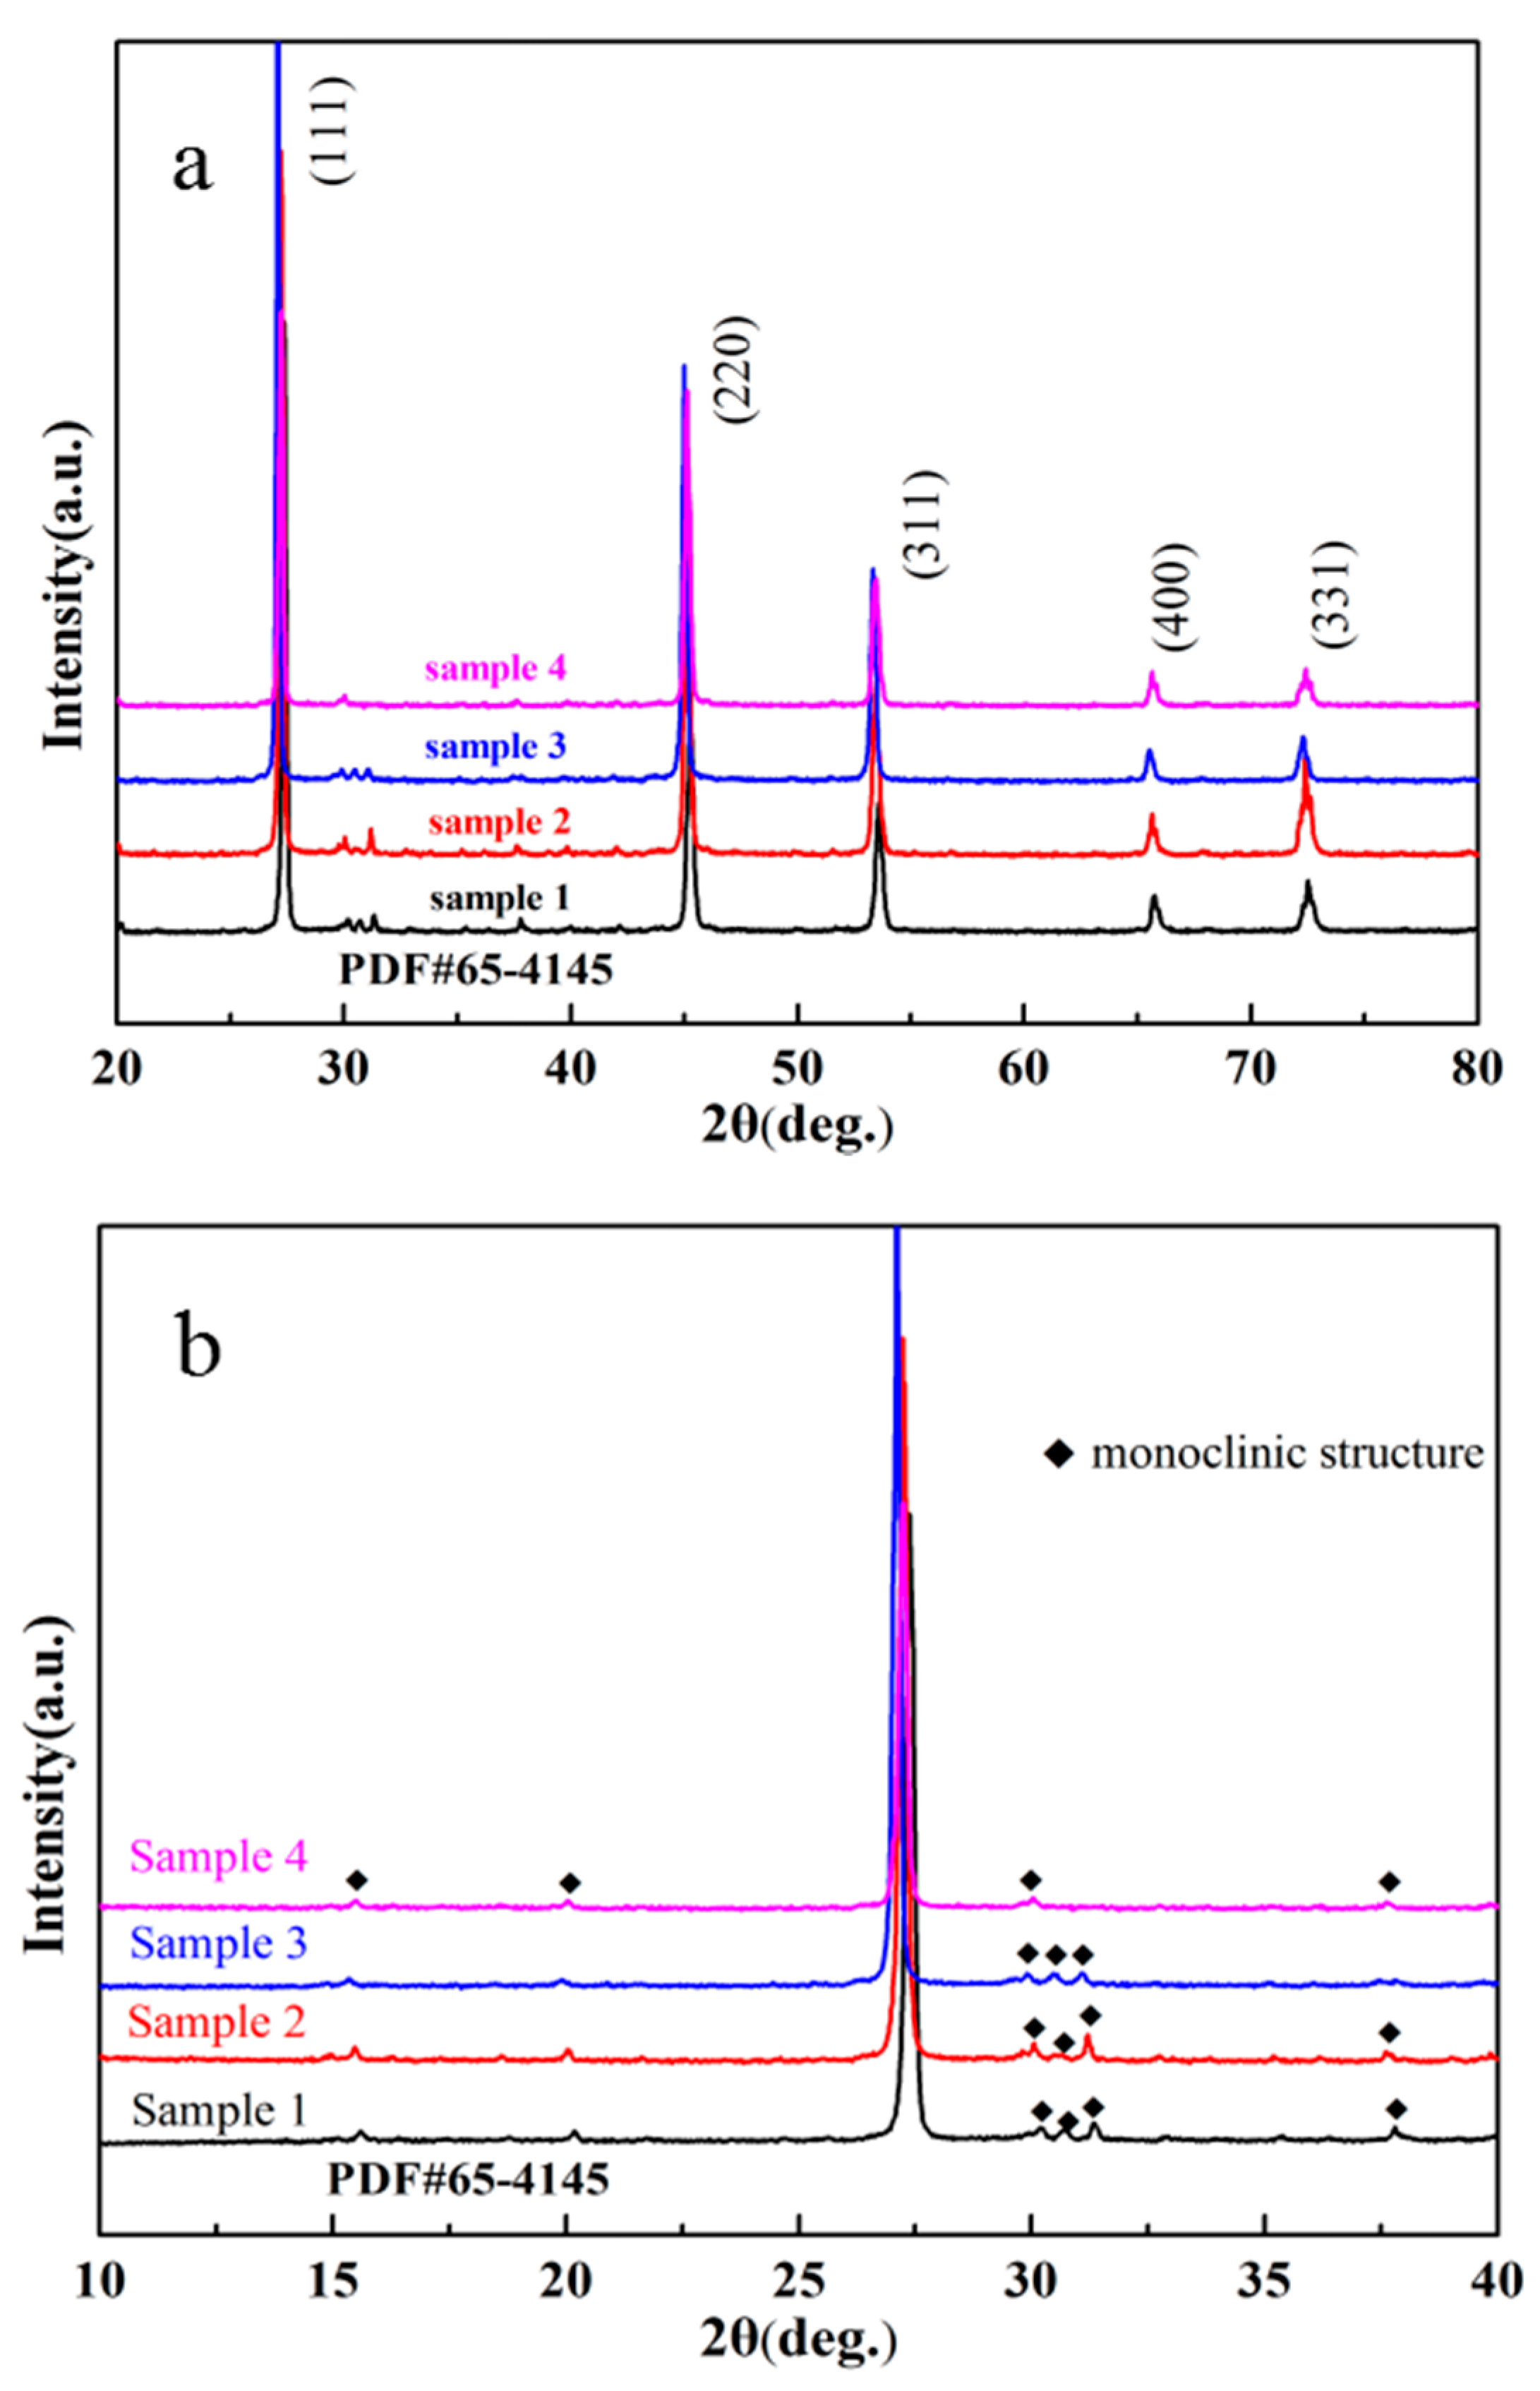
Figure 1a shows the XRD patterns of the resultant Cu2SnSe3 samples after melting and annealing with different cooling rates. Samples 1 and 2 were cooled from 1273 K to room temperature in 24 h and 48 h, respectively. Sample 3 was directly quenched in salt water. Sample 4 was annealed at 923 K for 24 h after quenching in salt water. The XRD patterns indicate that Cu2SnSe3 can be synthesized by melting at 1273 K for 12 h and annealing. The Cu2SnSe3 matrix is a disordered zincblende structure with a lattice parameter of 5.684 Å. Figure 1b shows the XRD patterns of different samples from 10° to 40°. There was no significant difference between sample 1 and sample 2, while the sample 4 had fewer peaks, which may be indexed to the monoclinic structure [3]. The structure transformation in Cu2SnSe3 from monoclinic to cubic can be attributed to the different cooling rates. Skoug reported that slow cooling could result in a monoclinic structure while water quenching led to a disordered cubic zincblende-like structure [17]. Delgado et al. reported that an order–disorder transformation in Cu2SnSe3 can occur at 723 K and the modified phase was found to be sphalerite [18]. In order to comprehensively and thoroughly study these phases, Marcano et al. found that the phase in low diffraction position was likely to be SnSe2 on the basis of differential thermal analysis (DTA) [19]. Therefore, the structure of Cu2SnSe3 can be described as an adamantane compound which is derivative of the sphalerite structure. In this study, the Cu2SnSe3 material prepared by the melting, quenching, and annealing process was selected as the matrix phase (sample 4) to carry out the following experiment.
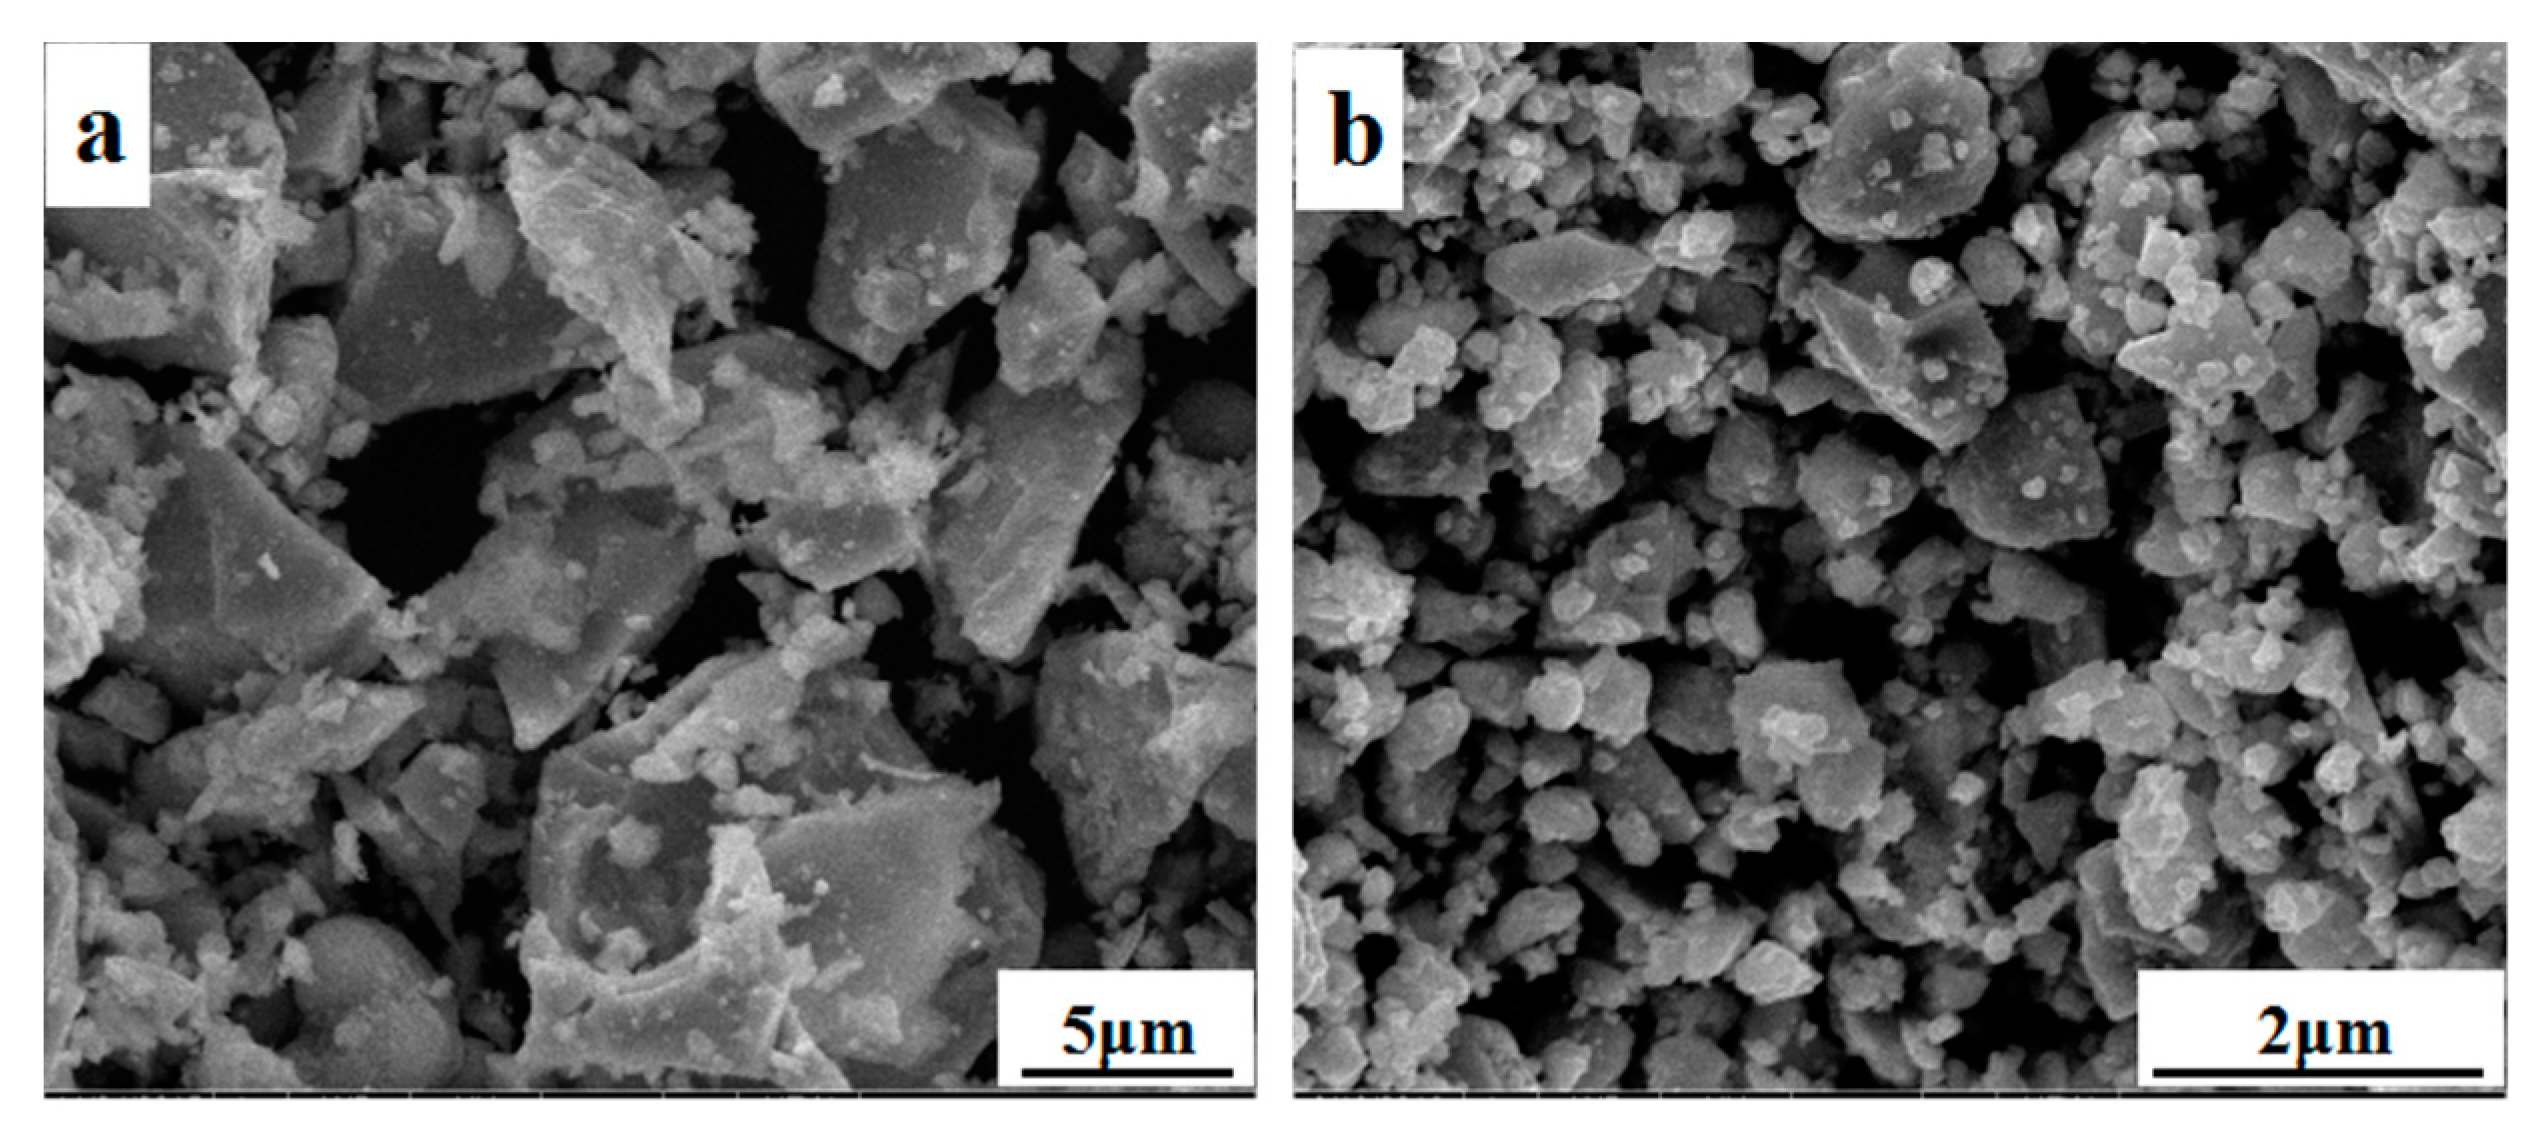
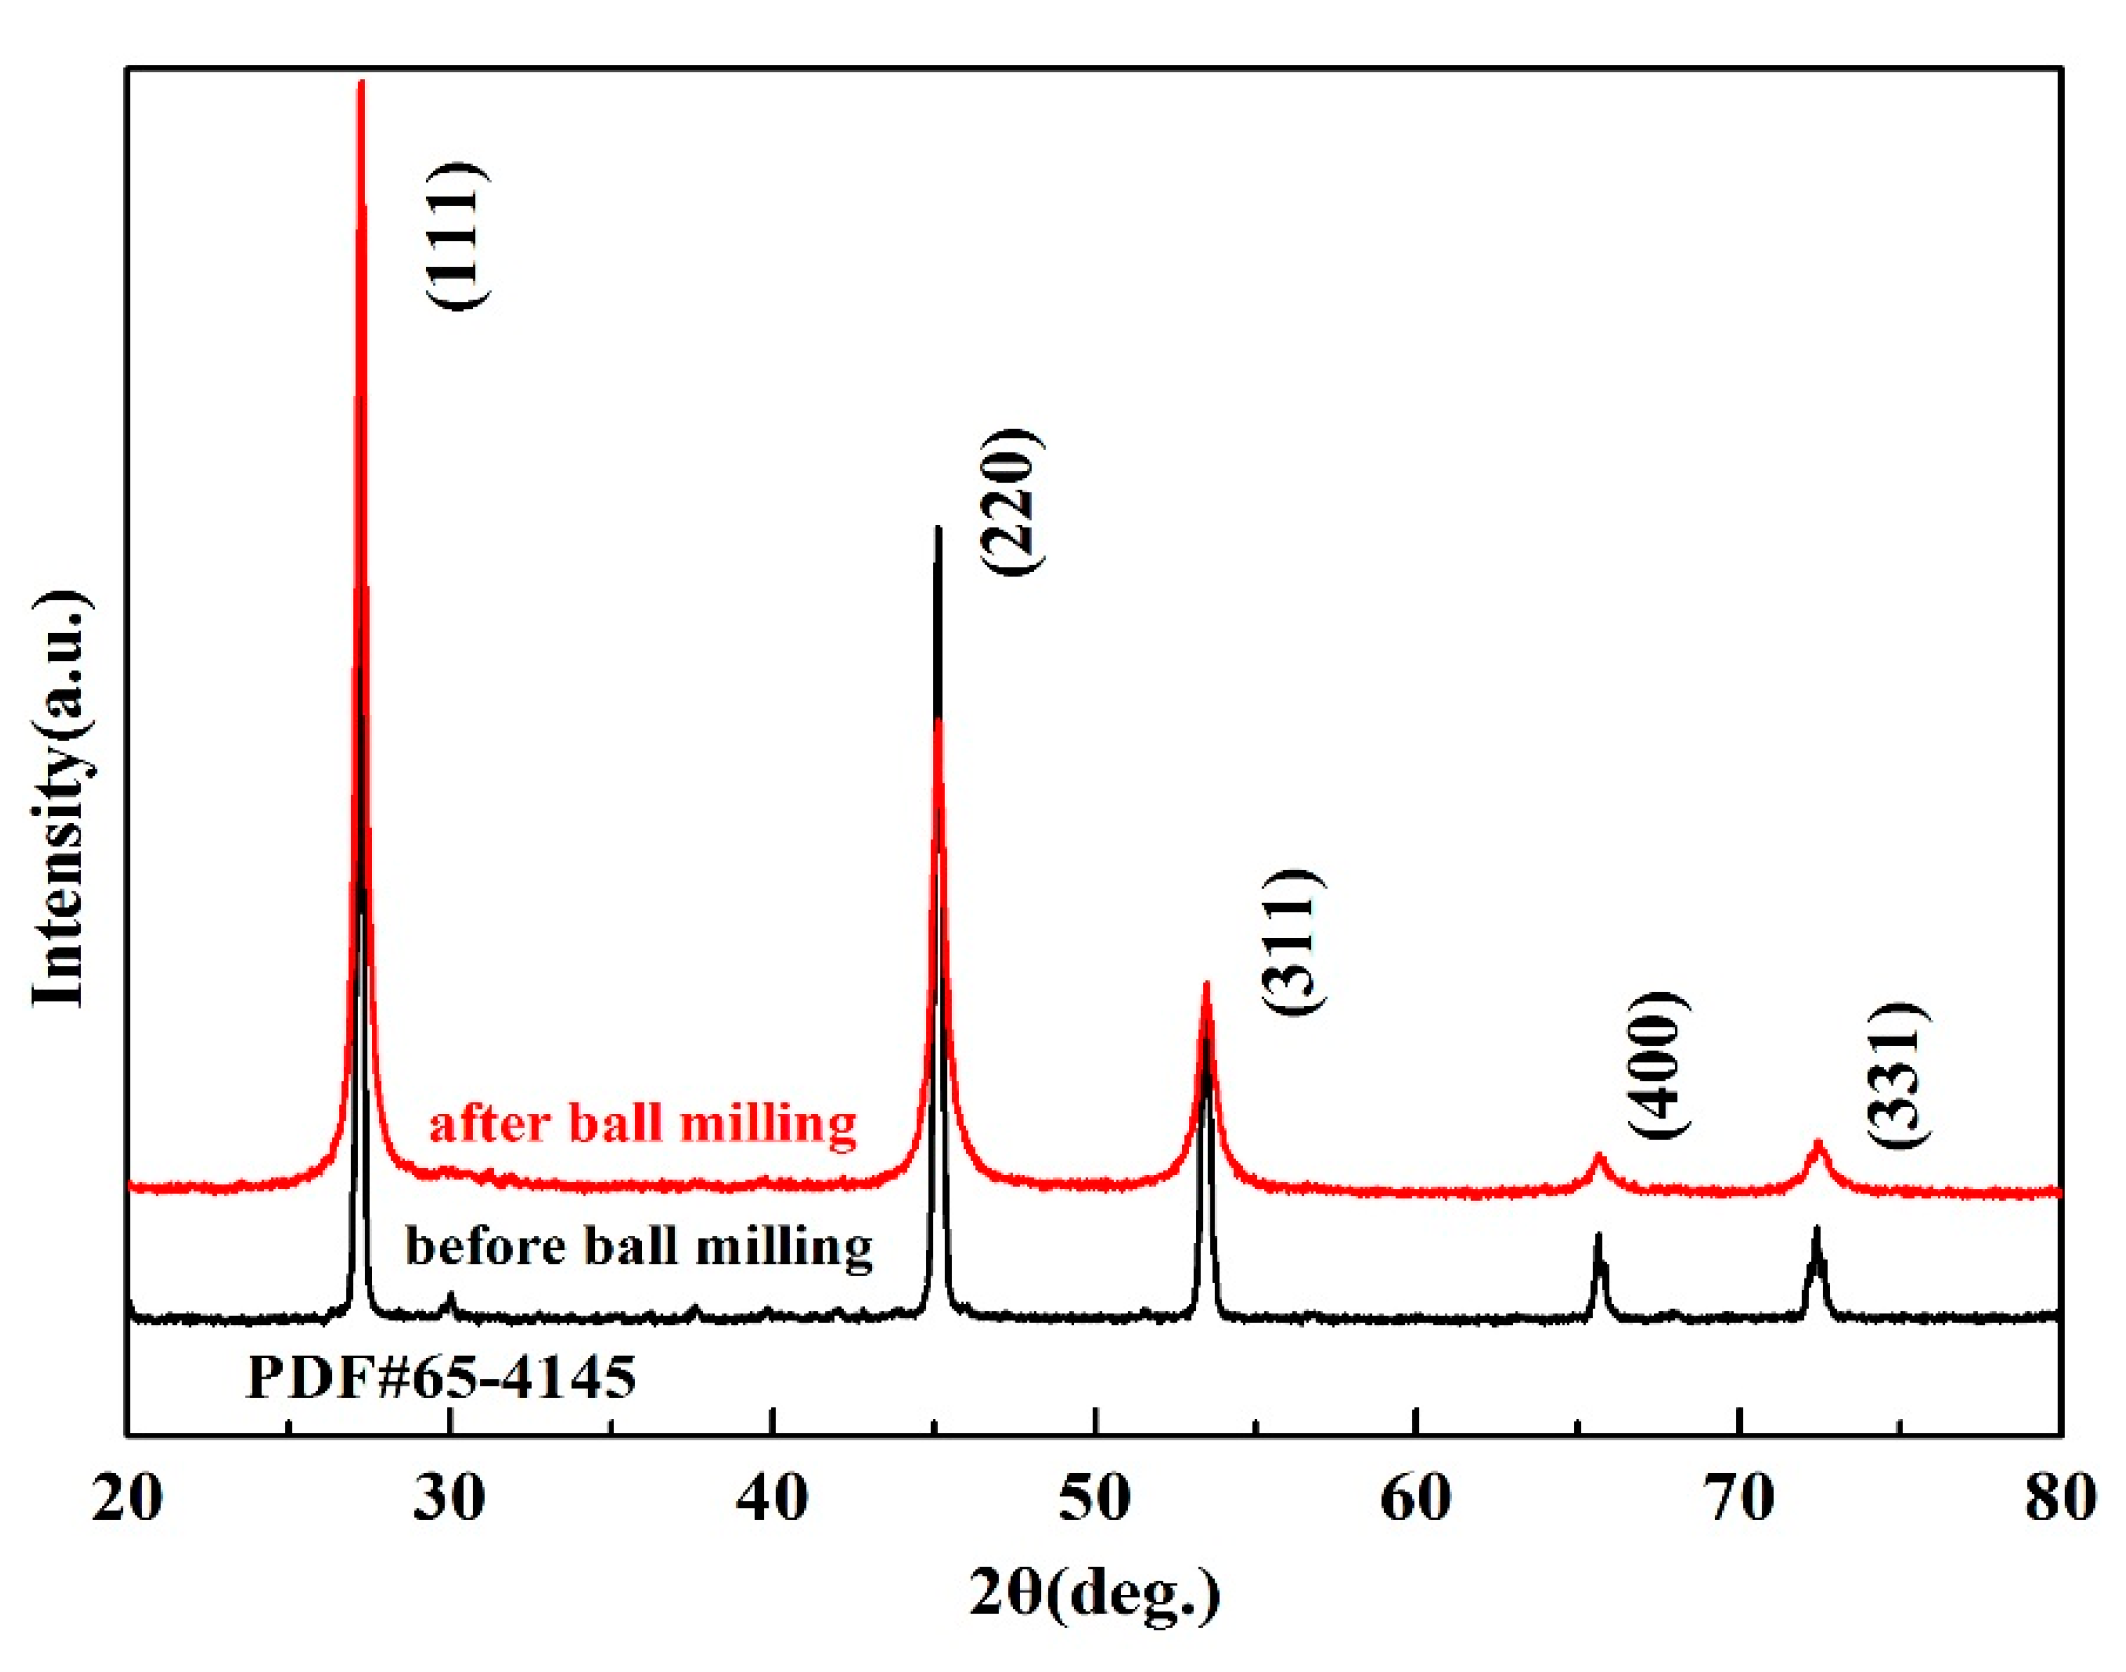
The Cu2SnSe3 bulk ingot was artificially ground into powder, as shown in Figure 2a. It can be seen that the size distribution of Cu2SnSe3 particles is not uniform. In order to obtain smaller uniform particles, the powder was subjected to mechanical ball milling, and the SEM image of Cu2SnSe3 powder after ball milling is shown in Figure 2b. The XRD of Cu2SnSe3 matrix was analyzed before and after ball milling, as shown in Figure 3. There was no phase change reaction in the process of ball milling of Cu2SnSe3 matrix.
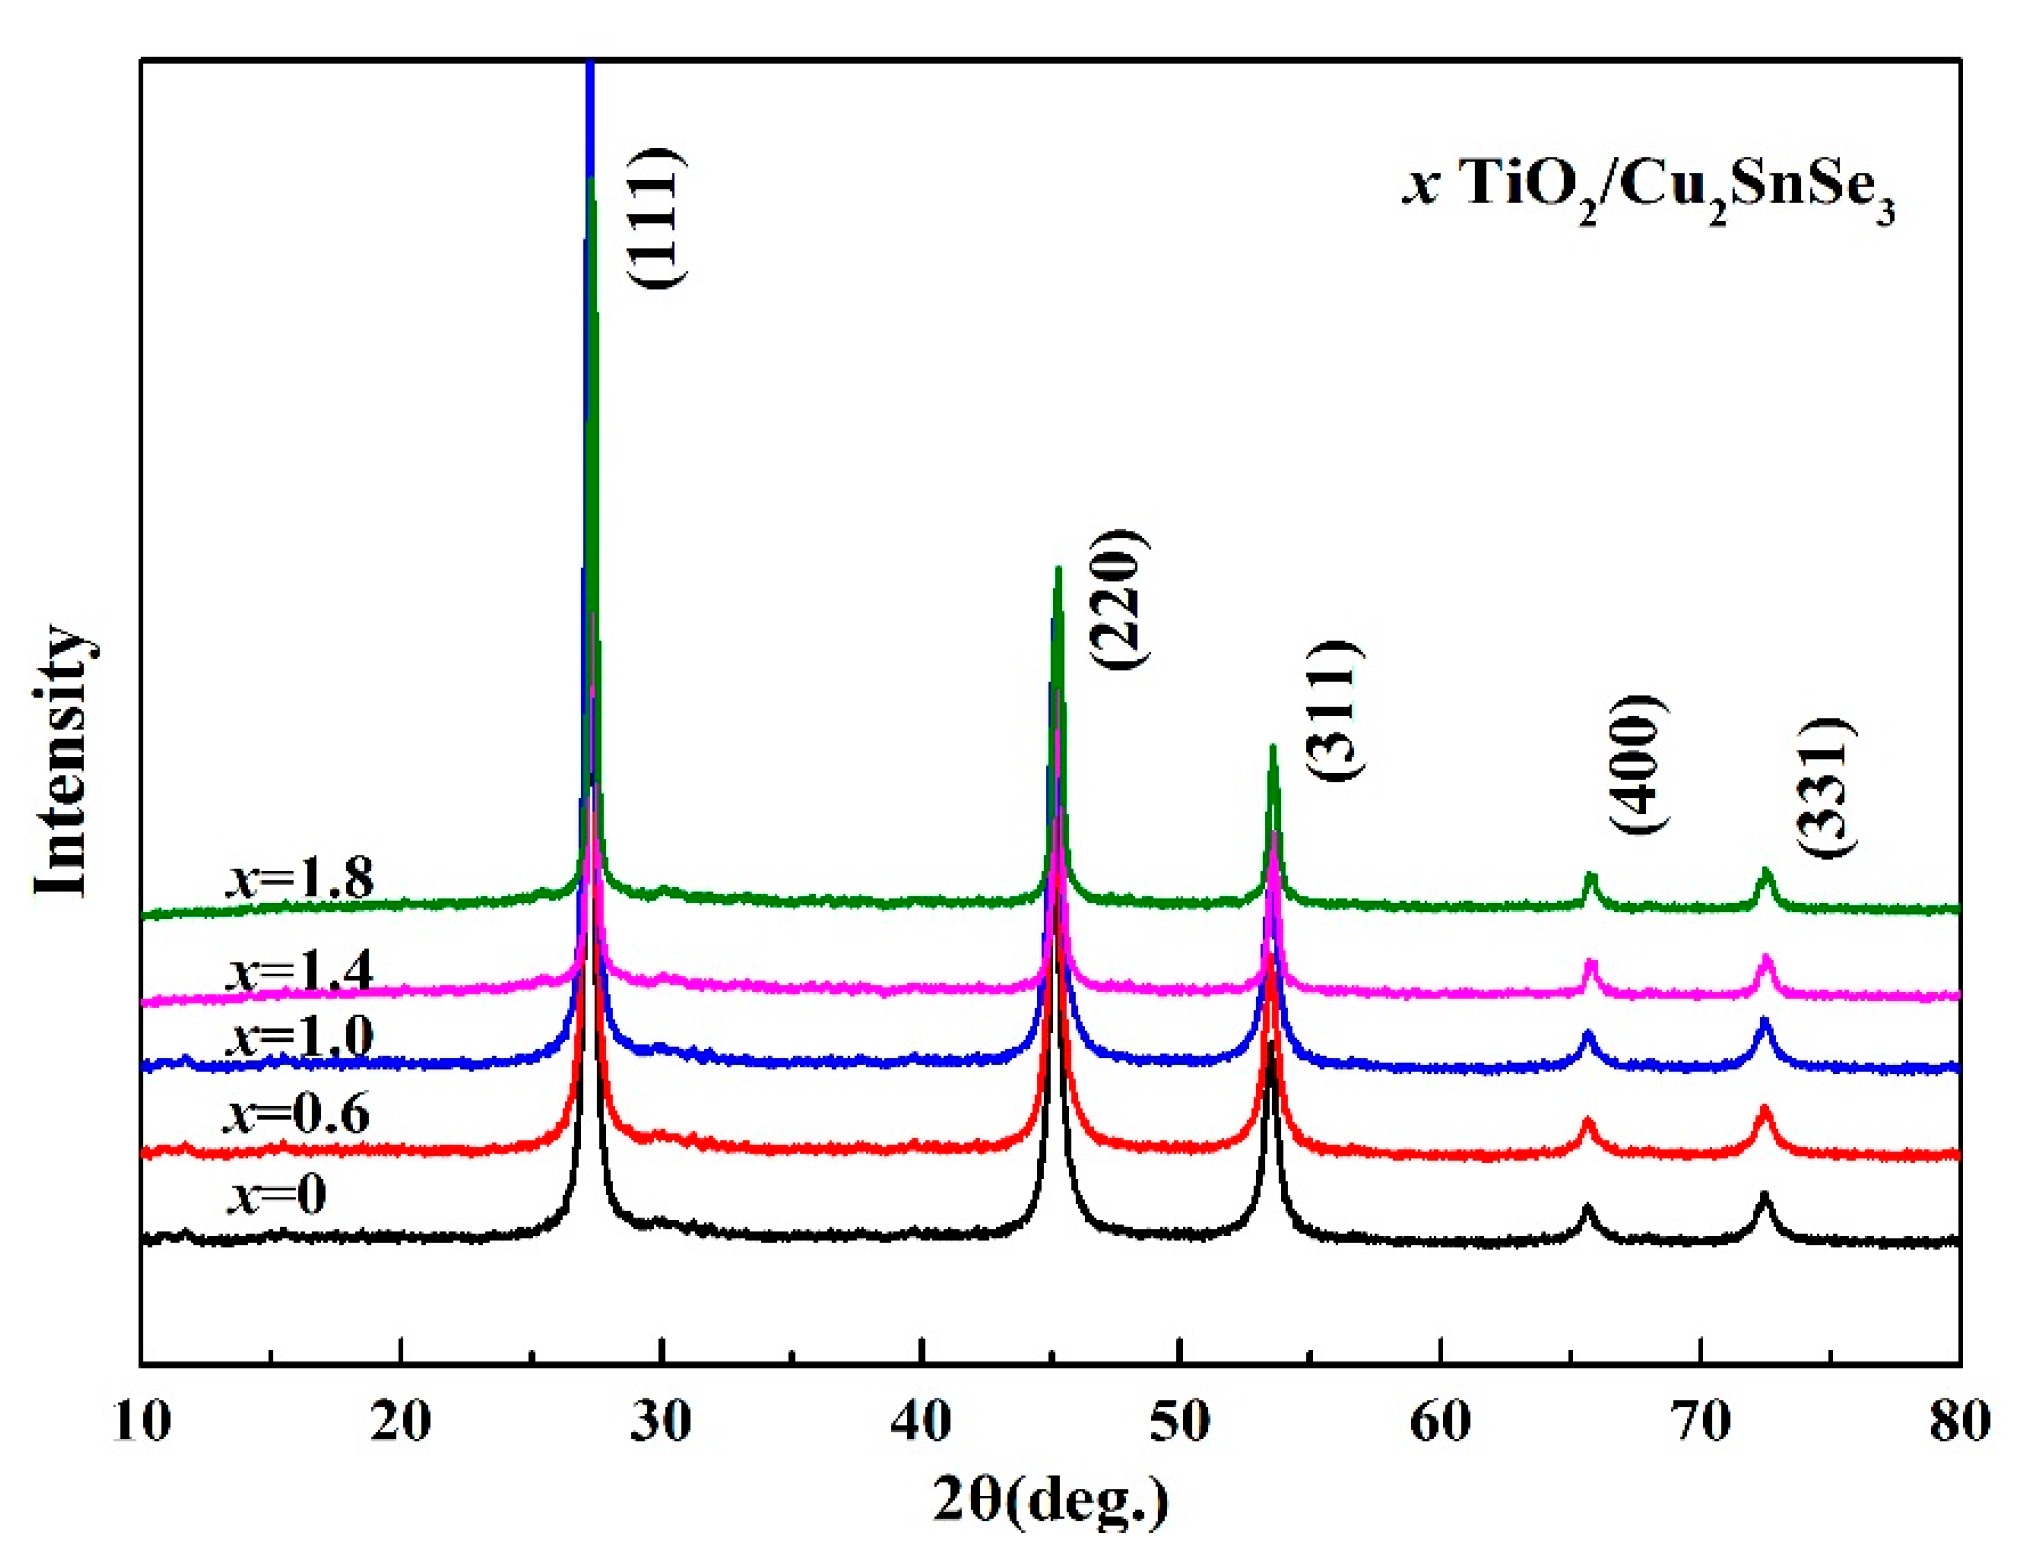
Figure 4 shows the XRD patterns of x vol %TiO2/Cu2SnSe3 (x = 0, 0.6, 1.0, 1.4, 1.8) composites after ball-milling. The XRD patterns of composites samples are similar to that of Cu2SnSe3 matrix samples. The diffraction peaks of all the samples correspond to the Cu2SnSe3 phase (PDF#65-4145). The peak of TiO2 phase is hardly found in the XRD patterns, which may be attributed to its low content. In addition, no diffraction peaks corresponding to other phase was found, which indicates that there was no reaction between the introduced nano-TiO2 particles and the Cu2SnSe3 matrix in the process of ball-milling. Figure 5a shows the TEM image of the starting powders of TiO2 nanoparticles. It is shown that the size of spherical TiO2 particles is 10–20 nm. Figure 5b–f shows the SEM images of the fracture surface of TiO2/Cu2SnSe3 composite samples. It can be observed in Figure 5b that the grain size of Cu2SnSe3 matrix is about 3 μm. Rapid sintering process with SPS technology can effectively inhibit the growth of grains, which would result in more grain boundaries and scatter more phonons. It also can be found in Figure 5c,d, and f that the nano-TiO2 particles are mainly distributed on the grain boundary. With the content of nano-TiO2 increasing from 0.6 vol % to 1.8 vol %, the grain size of Cu2SnSe3 decreases from 2.2 μm to 0.9 μm. The nano-TiO2 particles in the sintering process effectively inhibited the growth of grains, and the inhibitory effect is more obvious with the increase of nanoparticles [20,21,22]. In contrast, it can be found in Figure 5e that most TiO2 particles in the 1.4%TiO2/Cu2SnSe3 composites were distributed in the internal grain. This is possibly related to the surfactivity of powder, SPS process, and so on. This issue will be investigated in future work. In addition, when the amount of nano-TiO2 reached 1.8 vol %, the TiO2/Cu2SnSe3 composite kept more holes at the grain boundary. The microstructure of TiO2/Cu2SnSe3 composites could influence the electrical and thermal transport properties of the materials. The relative density of TiO2/Cu2SnSe3 composites is shown in Table 1. It can be seen that the addition of nano-TiO2 reduced the relative density of TiO2/Cu2SnSe3 composites.
Figure 6 shows the temperature dependence of electrical conductivity (σ) for the TiO2/Cu2SnSe3 composites in the range of 300–700 K. The electrical conductivity of all samples decreased with increasing temperature in all of the investigated temperatures, which indicates that all samples demonstrated degenerate semiconductor behavior. The composites samples showed lower σ than the Cu2SnSe3 matrix except for the 1.4%TiO2/Cu2SnSe3 sample, which suggests that the addition of nano-TiO2 into the Cu2SnSe3 matrix can reduce the electrical conductivity. Nano-TiO2 particles affect the carrier transport, leading to a reduction in the conductivity of the material. On the other hand, the nano-TiO2 particles which were distributed at the grain boundary effectively suppressed the grain growth, resulting in a large number of grain boundaries during the sintering process. These grain boundaries have great effects on the transport of the carriers, which reduce the conductivity of the material. However, the conductivity of the 1.4%TiO2/Cu2SnSe3 sample was effectively improved. As shown in Figure 5e, the nano-TiO2 particles in the 1.4%TiO2/Cu2SnSe3 composites were mainly distributed in the internal grain. Therefore the effect of suppressing the grain growth was not as obvious as that of other composites. Meanwhile, the carrier concentration of 1.4%TiO2/Cu2SnSe3 composite at room temperature is listed in Table 2. The increase in the conductivity of the 1.4%TiO2/Cu2SnSe3 composite is attributed to the high carrier mobility. These nanoparticles distributed in the grain provide a special channel and contribute to the transport for the carrier. The electrical conductivity of 1.4%TiO2/Cu2SnSe3 sample was 2.91 × 10³ Ω−1/cm at room temperature. Compared with the electrical conductivity of doped-Cu2SnSe3 sample in the previous studies [8,9,10,11], the electrical conductivity of TiO2/Cu2SnSe3 sample was higher, which is possibly due to high carrier concentration (about 1021 cm−3), as shown in Table 2.
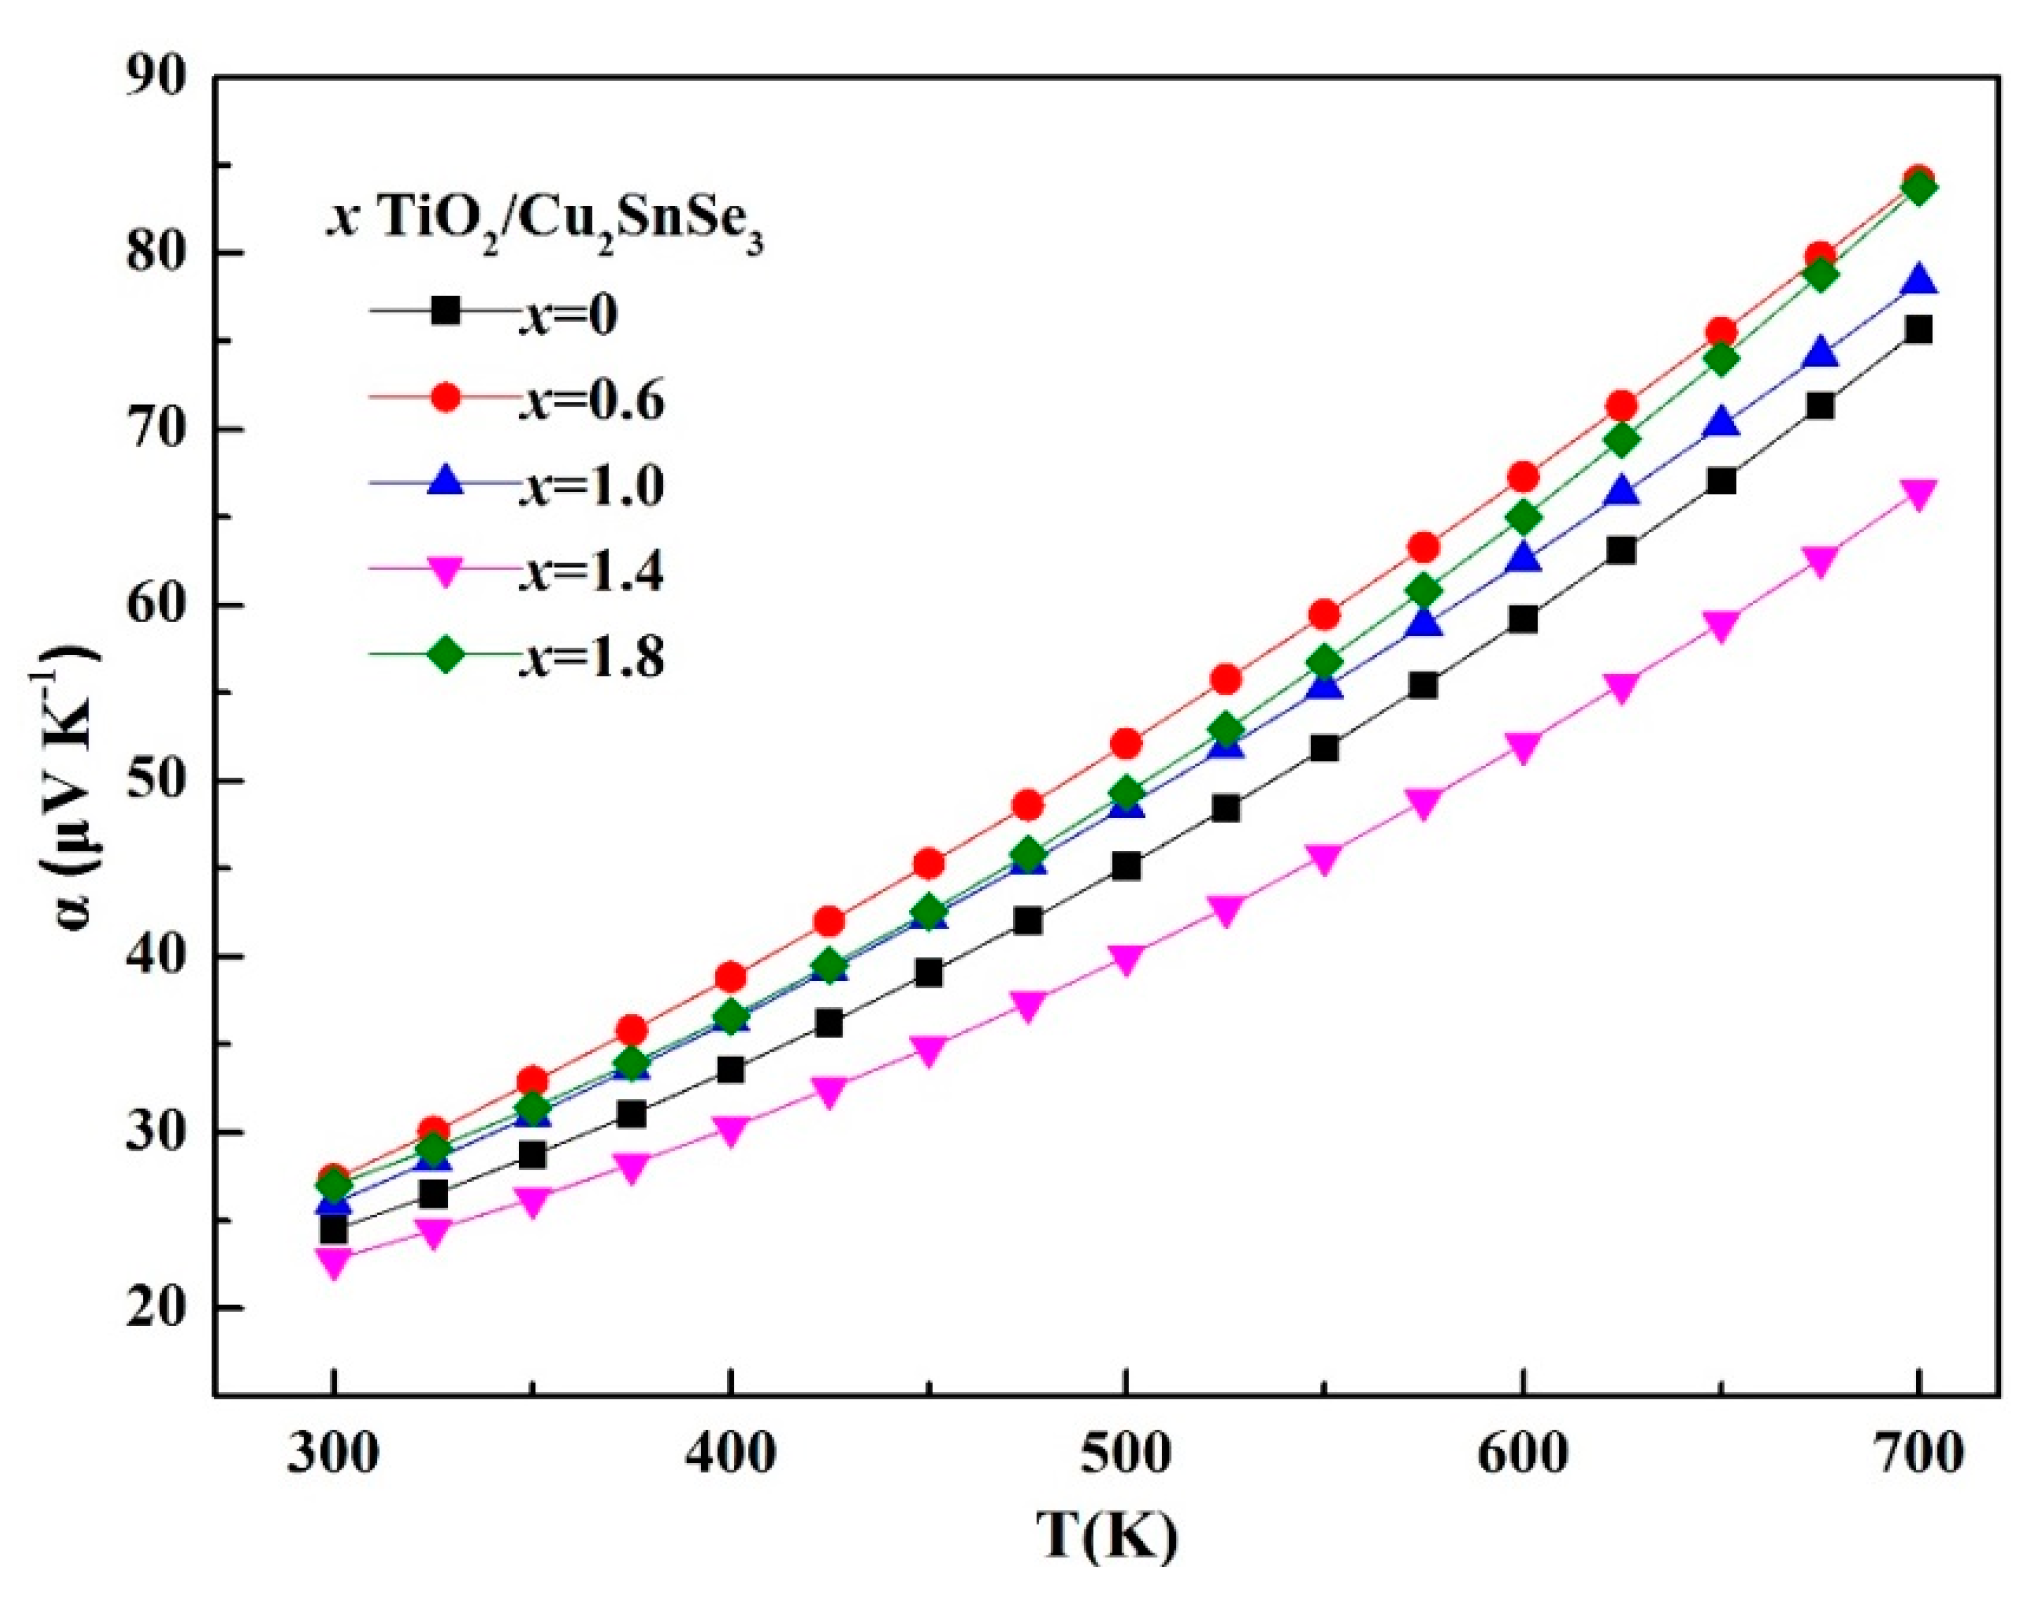
Figure 7 shows the temperature dependence of Seebeck coefficient (α) of the TiO2/Cu2SnSe3 composite samples. All samples kept positive values of α in the whole temperature range, indicating that they are p-type semiconductors. The Seebeck coefficient of all samples increased with increasing temperature. The Seebeck coefficient of TiO2/Cu2SnSe3 composites was higher than that of the matrix material, except for the 1.4%TiO2/Cu2SnSe3 sample. The introduction of nano-TiO2 brings a large number of phase interfaces, which can filter out the low-energy carriers so as to increase the density of states of the material. As a result, the Seebeck coefficient of composites was improved. As for the 1.4%TiO2/Cu2SnSe3 sample, the lower Seebeck coefficient should be related with the different distribution of nano-TiO2 particles in the TiO2/Cu2SnSe3 composite. Combined with the above analysis of the microstructure and conductivity, there is an effective channel in the composite which allows a large number of low-energy carriers to pass through, so the composite maintains a lower Seebeck coefficient. The detailed reason will be further investigated. Figure 8 shows the temperature dependence of the power factor (PF) of the TiO2/Cu2SnSe3 composites. The PF of 1.4%TiO2/Cu2SnSe3 reached 5.27 × 10⁻⁴ Wm−1 K−2 at 700 K, which is 20% higher than that of Cu2SnSe3 matrix material (4.59 × 10⁻⁴ Wm−1 K−2). For the other TiO2/Cu2SnSe3 composites, since the increase in the Seebeck coefficient is not sufficient to compensate for the decrease in conductivity, the PF of the composite samples is maintained at a lower level than that of the Cu2SnSe3 matrix.
Figure 9 shows the temperature dependence of thermal conductivity (κ) of the TiO2/Cu2SnSe3 composite. Compared with the κ of Cu2SnSe3 matrix, it can be seen in Figure 9a that the TiO2/Cu2SnSe3 composites maintained the lower κ, except for the 1.4%TiO2/Cu2SnSe3 sample. The 1.4%TiO2/Cu2SnSe3 composite kept higher κ than that of the Cu2SnSe3 matrix. The lattice thermal conductivity (κL) of the TiO2/Cu2SnSe3 composite can be calculated from the total thermal conductivity (κ) minus the carrier thermal conductivity κe (κe = LσT), as shown in Figure 9b. It can be observed that the κL of 1.4%TiO2/Cu2SnSe3 sample was significantly reduced before 450 K. The higher κ of 1.4%TiO2/Cu2SnSe3 in the temperature of 450–700 K is mainly due to the high κe, which is closely related with the distribution of nano-TiO2 phase in the internal grain. The expected decrease of κL due to the addition of nano-TiO2 is not evident in other TiO2/Cu2SnSe3 composites, which is possibly attributed to the distribution of nano-TiO2 in the grain boundaries. However, the κL of 1.4%TiO2/Cu2SnSe3 sample is 1.43 W/mK at room temperature, which is now the lowest value of lattice conductivity for Cu2SnSe3 sample and obviously lower than the previous studies. Fan et al. reported a lattice thermal conductivity of about 2.25 W/mK at room temperature for Ga-doped Cu2SnSe3 sample fabricated by hot pressing sintering [10]. Compared with the Ga- or In-doped Cu2SnSe3 sample, the lower κL of TiO2/Cu2SnSe3 sample in this study should be related with the distribution of TiO2.
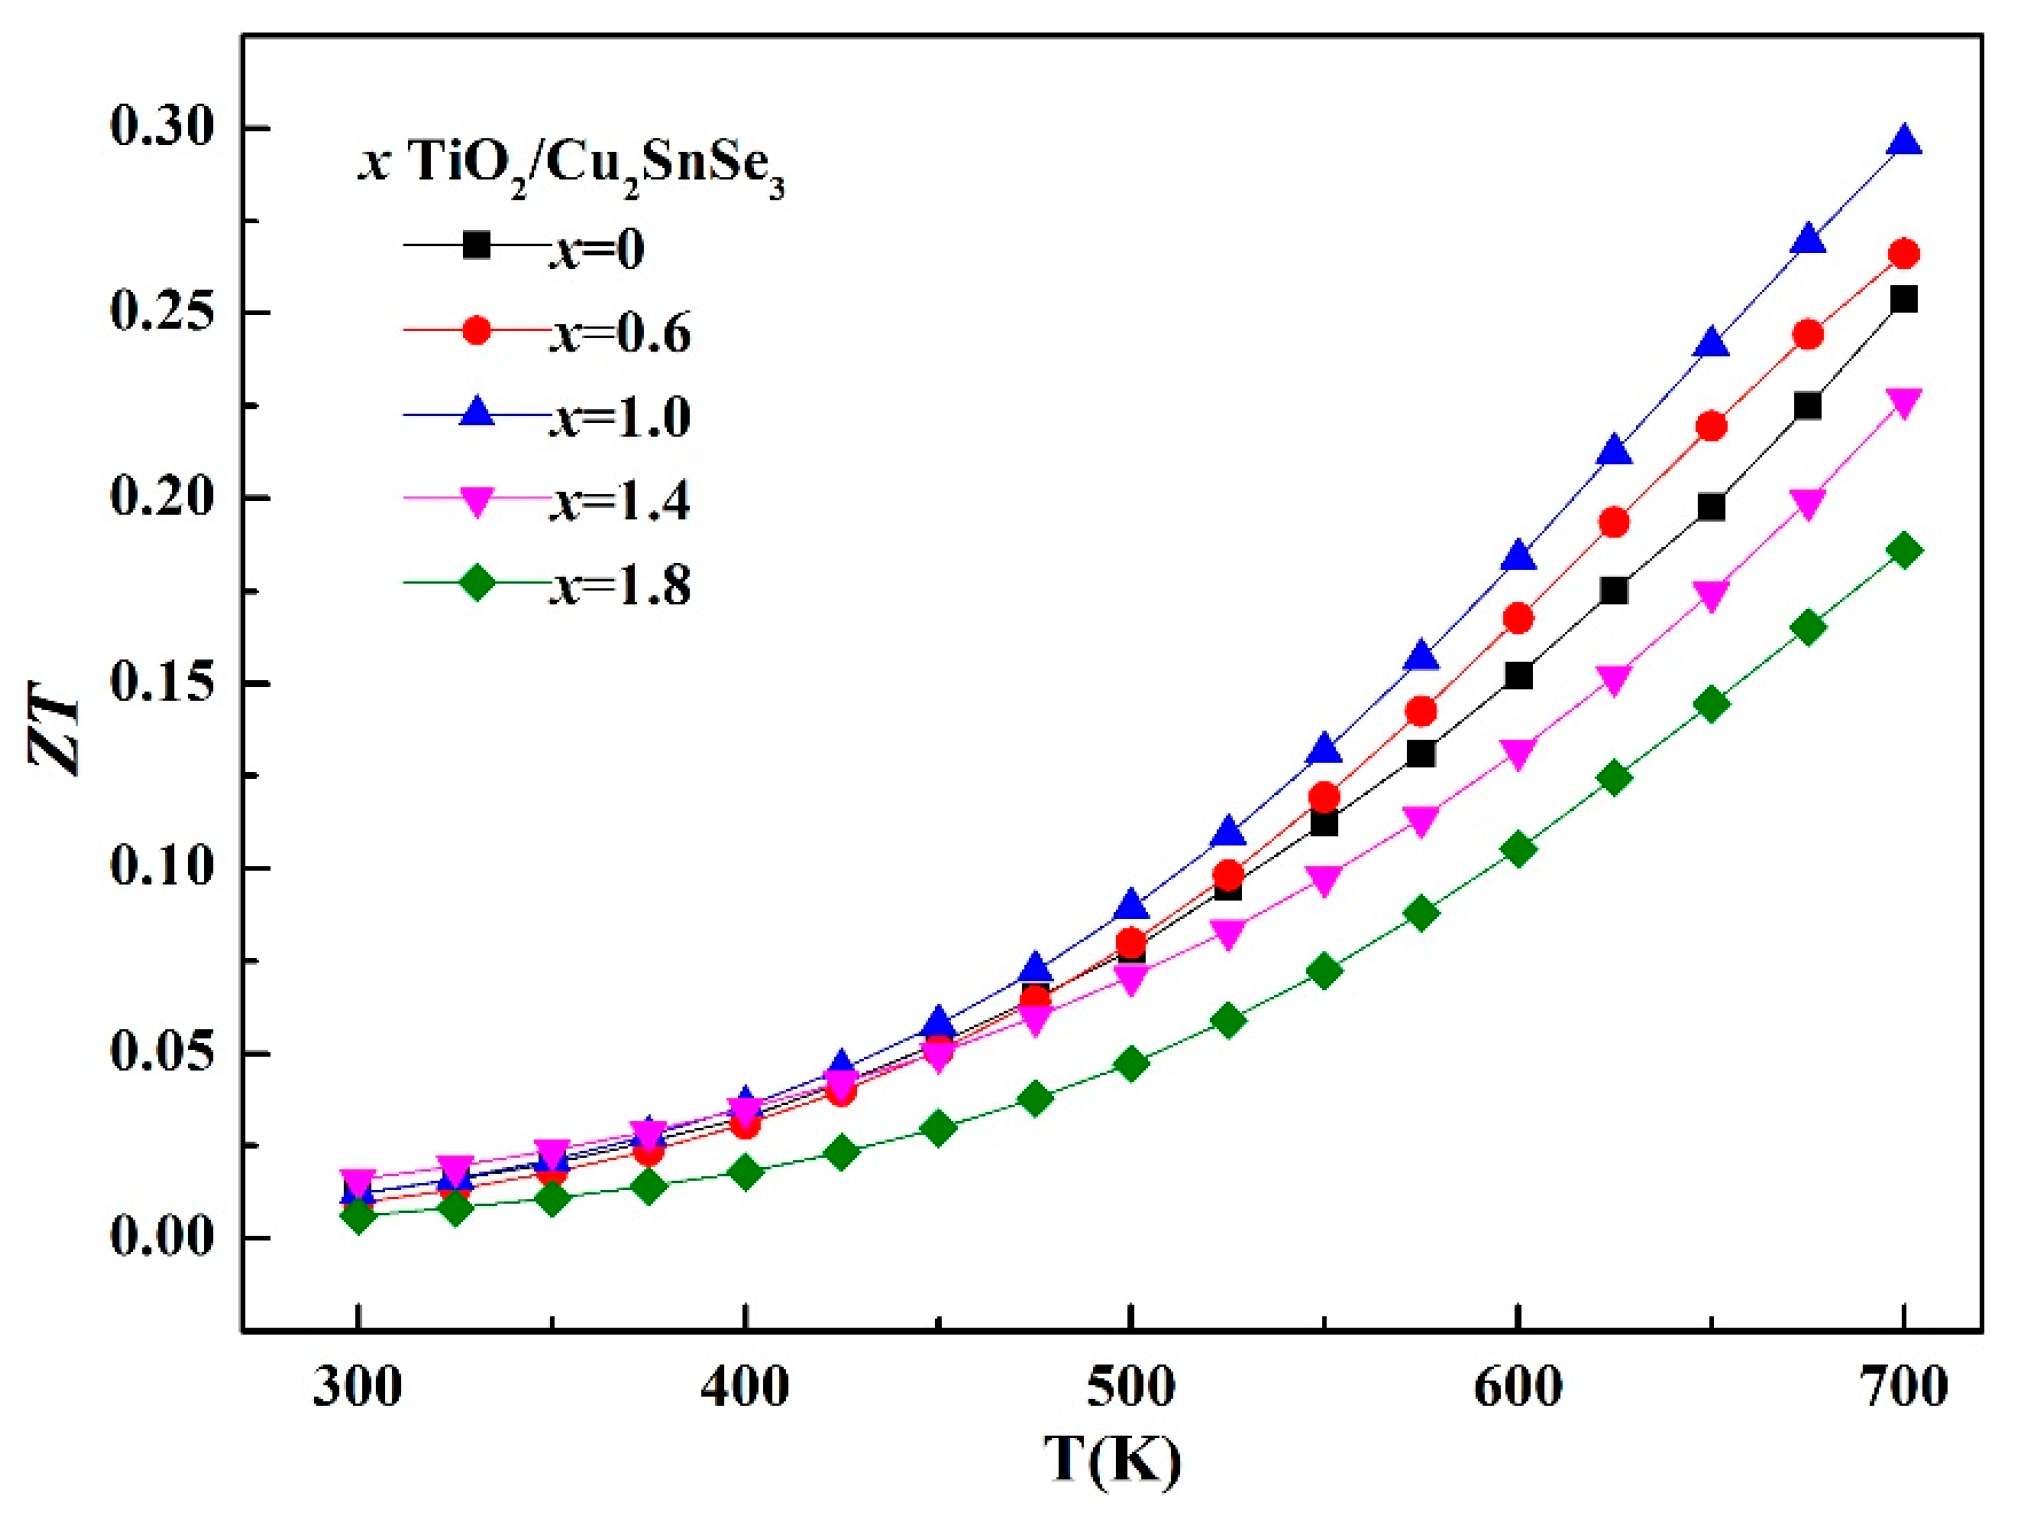
Figure 10 shows the temperature dependence of the dimensionless figure of merit ZT of TiO2/Cu2SnSe3 composites. It can be seen that the ZT value of 1.4%TiO2/Cu2SnSe3 composite was not improved due to its higher κ. The maximum ZT value for 1.0%TiO2/Cu2SnSe3 composite is 0.30 at 700 K, which is 17% higher than that of Cu2SnSe3 matrix.
4. Conclusions
In this study, TiO2/Cu2SnSe3 composites were prepared by melting, ball milling, and spark plasma sintering. The distribution of nano-TiO2 in the Cu2SnSe3 matrix plays an important role in the thermoelectric transport properties. For the 1.4%TiO2/Cu2SnSe3 composite, the nano-TiO2 particles were mainly distributed in the internal grain, and the higher carrier mobility gave it a higher conductivity. The higher carrier thermal conductivity allowed the 1.4%TiO2/Cu2SnSe3 to have a higher total thermal conductivity. For the other TiO2/Cu2SnSe3 composites, the nano-TiO2 particles were mainly distributed on the grain boundary of the Cu2SnSe3 matrix, and the growth of the grains was effectively inhibited. Due to the lower carrier thermal conductivity, the other TiO2/Cu2SnSe3 composites had a lower total thermal conductivity. The maximum ZT value for 1.0%TiO2/Cu2SnSe3 composite was 0.30 at 700 K, which is 17% higher than that of Cu2SnSe3 matrix.
Acknowledgments
The authors would like to thank the help for the measurement of TE properties in Tongji University. Financial supports from the National Natural Science Foundations of China (No. 51772132 and No. 51471076) are gratefully acknowledged.
Author Contributions
All authors participated in the research, data analysis and edition of the manuscript. Degang Zhao designed the experiments and analyzed the data. Jiai Ning performed the experiments and wrote the paper. Di Wu carried out the experimental measurement.
Conflicts of Interest
The authors declare no conflicts of interest.
References
- Shi, X.; Chen, L.D.; Uher, C. Recent advances in high-performance bulk thermoelectric materials. Int. Mater. Rev. 2016, 6, 1–37. [Google Scholar] [CrossRef]
- Fitriani, R.O.; Long, B.D.; Barma, M.C.; Riaz, M.; Sabri, M.F.; Said, S.M.; Saidur, R. A review on nanostructures of high temperature thermoelectric materials for waste heat recovery. Renew. Sustain. Energy Rev. 2016, 64, 635–659. [Google Scholar] [CrossRef]
- Wubet, W.; Kuo, D.H. Structural and electrical properties of Si- and Ti-doped Cu2SnSe3 bulks. J. Solid State Chem. 2015, 227, 239–246. [Google Scholar] [CrossRef]
- Li, Y.; Liu, G.; Li, J. High thermoelectric performance of In-doped Cu2SnSe3 prepared by fast combustion synthesis. New J. Chem. 2016, 40, 5394–5400. [Google Scholar] [CrossRef]
- Liu, G.; Chen, K.; Li, J. Combustion synthesis of Cu2SnSe3 thermoelectric materials. J. Eur. Ceram. Soc. 2016, 36, 1407–1415. [Google Scholar] [CrossRef]
- Wang, J.; Liu, P.; Seaton, C.C. Complete colloidal synthesis of Cu2SnSe3 nanocrystals with crystal phase and shape control. J. Am. Chem. Soc. 2014, 136, 7954–7960. [Google Scholar] [CrossRef] [PubMed]
- Ge, Z.H.; Salvador, J.R.; Nolas, G.S. Selective Synthesis of Cu2SnSe3 and Cu2SnSe4 nanocrystals. Inorg. Chem. 2014, 53, 4445–4449. [Google Scholar] [CrossRef] [PubMed]
- Ahmadi, M.; Pramana, S.S.; Batabyal, S.K. Synthesis of Cu2SnSe3 nanocrystals for solution processable photovoltaic cells. Inorg. Chem. 2013, 52, 1722–1728. [Google Scholar] [CrossRef] [PubMed]
- Cho, J.Y.; Shi, X.; Salvador, J.R. Thermoelectric properties and investigations of low thermal conductivity in Ga-doped Cu2GeSe3. Phys. Rev. B 2011, 84, 085207. [Google Scholar] [CrossRef]
- Fan, J.; Liu, H.; Shi, X. Investigation of thermoelectric properties of Cu2GaxSn1−xSe3 diamond-like compounds by hot pressing and spark plasma sintering. Acta Mater. 2013, 61, 4297–4304. [Google Scholar] [CrossRef]
- Skoug, E.J.; Cain, J.D.; Morelli, D.T. Improved thermoelectric performance in Cu-based ternary chalcogenides using S for Se substitution. J. Electron. Mater. 2012, 41, 1232–1236. [Google Scholar] [CrossRef]
- Zhang, J.; Qin, X.; Li, D. Enhanced thermoelectric performance of CuGaTe2 based composites incorporated with graphite nanosheets. Appl. Phys. Lett. 2016, 108, 073902. [Google Scholar] [CrossRef]
- Li, D.; Li, J.C.; Qin, X.Y. Enhanced thermoelectric performance in SnSe based composites with PbTe nanoinclusions. Energy 2016, 116, 861–866. [Google Scholar] [CrossRef]
- He, Z.; Stiewe, C.; Platzek, D. Effect of ceramic dispersion on thermoelectric properties of nano ZrO2/CoSb3 composites. J. Appl. Phys. 2007, 101, 043707. [Google Scholar] [CrossRef]
- Zhao, X.Y.; Shi, X.; Chen, L.D. Synthesis of YbyCo4Sb12/Yb2O3 composites and their thermoelectric properties. Appl. Phys. Lett. 2006, 89, 2121. [Google Scholar] [CrossRef]
- Chubilleau, C.; Lenoir, B.; Candolfi, C. Thermoelectric properties of In0.2Co4Sb12 skutterudites with embedded PbTe or ZnO nanoparticles. J. Alloys Compd. 2014, 589, 513–523. [Google Scholar] [CrossRef]
- Skoug, E.J.; Cain, J.D.; Morelli, D.T. Thermoelectric properties of the Cu2SnSe3-Cu2GeSe3 solid solution. J. Alloy. Compd. 2010, 506, 18–21. [Google Scholar] [CrossRef]
- Delgado, G.E.; Mora, A.J.; Marcano, G. Crystal structure refinement of the semiconducting compound Cu2SnSe3 from X-ray powder diffraction data. Mater. Res. Bull. 2003, 38, 1949–1955. [Google Scholar] [CrossRef]
- Marcano, G.D.; Chalbaud, L.M.; Rincón, C. Crystal growth and structure of the semiconductor Cu2SnSe3. Mater. Lett. 2002, 53, 151–154. [Google Scholar] [CrossRef]
- Huang, X.Y.; Xu, Z.; Chen, L.D. The thermoelectric performance of ZrNiSn/ZrO2, composites. Solid State Commun. 2004, 130, 181–185. [Google Scholar] [CrossRef]
- Zhu, Y.; Shen, H.; Chen, H. Effects of nano-TiO2 dispersion on thermoelectric properties of Co4Sb11.7Te0.3 composites. Rare Met. 2012, 31, 43–47. [Google Scholar] [CrossRef]
- Zhao, L.D.; Zhang, B.P.; Li, J.F. Preparation and properties of nano-SiC dispersed Bi2Te3 thermoelectric materials. Rare Met. Mater. Eng. 2007, 36, 408–412. [Google Scholar]
Figure 1.
The X-ray diffraction (XRD) patterns of Cu2SnSe3 powders with different cooling rates: (a) from 20° to 80°; (b) amplified XRD patterns from 10° to 40°. Samples 1–3 correspond to Cu2SnSe3 samples with different cooling rates and sample 4 corresponds to the annealed Cu2SnSe3 sample.
Figure 1.
The X-ray diffraction (XRD) patterns of Cu2SnSe3 powders with different cooling rates: (a) from 20° to 80°; (b) amplified XRD patterns from 10° to 40°. Samples 1–3 correspond to Cu2SnSe3 samples with different cooling rates and sample 4 corresponds to the annealed Cu2SnSe3 sample.

Figure 2.
SEM images of Cu2SnSe3 powder: (a) before ball milling; (b) after ball milling.

Figure 3.
The XRD patterns of Cu2SnSe3 powder before and after ball milling.

Figure 4.
The XRD patterns of the x vol % TiO2/Cu2SnSe3 composites.

Figure 5.
(a) TEM image of the initial TiO2 nanoparticles. (b–f) SEM images of the x vol % TiO2/Cu2SnSe3 composites: (b) x = 0; (c) x = 0.6; (d) x = 1.0; (e) x = 1.4; (f) x = 1.8.
Figure 5.
(a) TEM image of the initial TiO2 nanoparticles. (b–f) SEM images of the x vol % TiO2/Cu2SnSe3 composites: (b) x = 0; (c) x = 0.6; (d) x = 1.0; (e) x = 1.4; (f) x = 1.8.
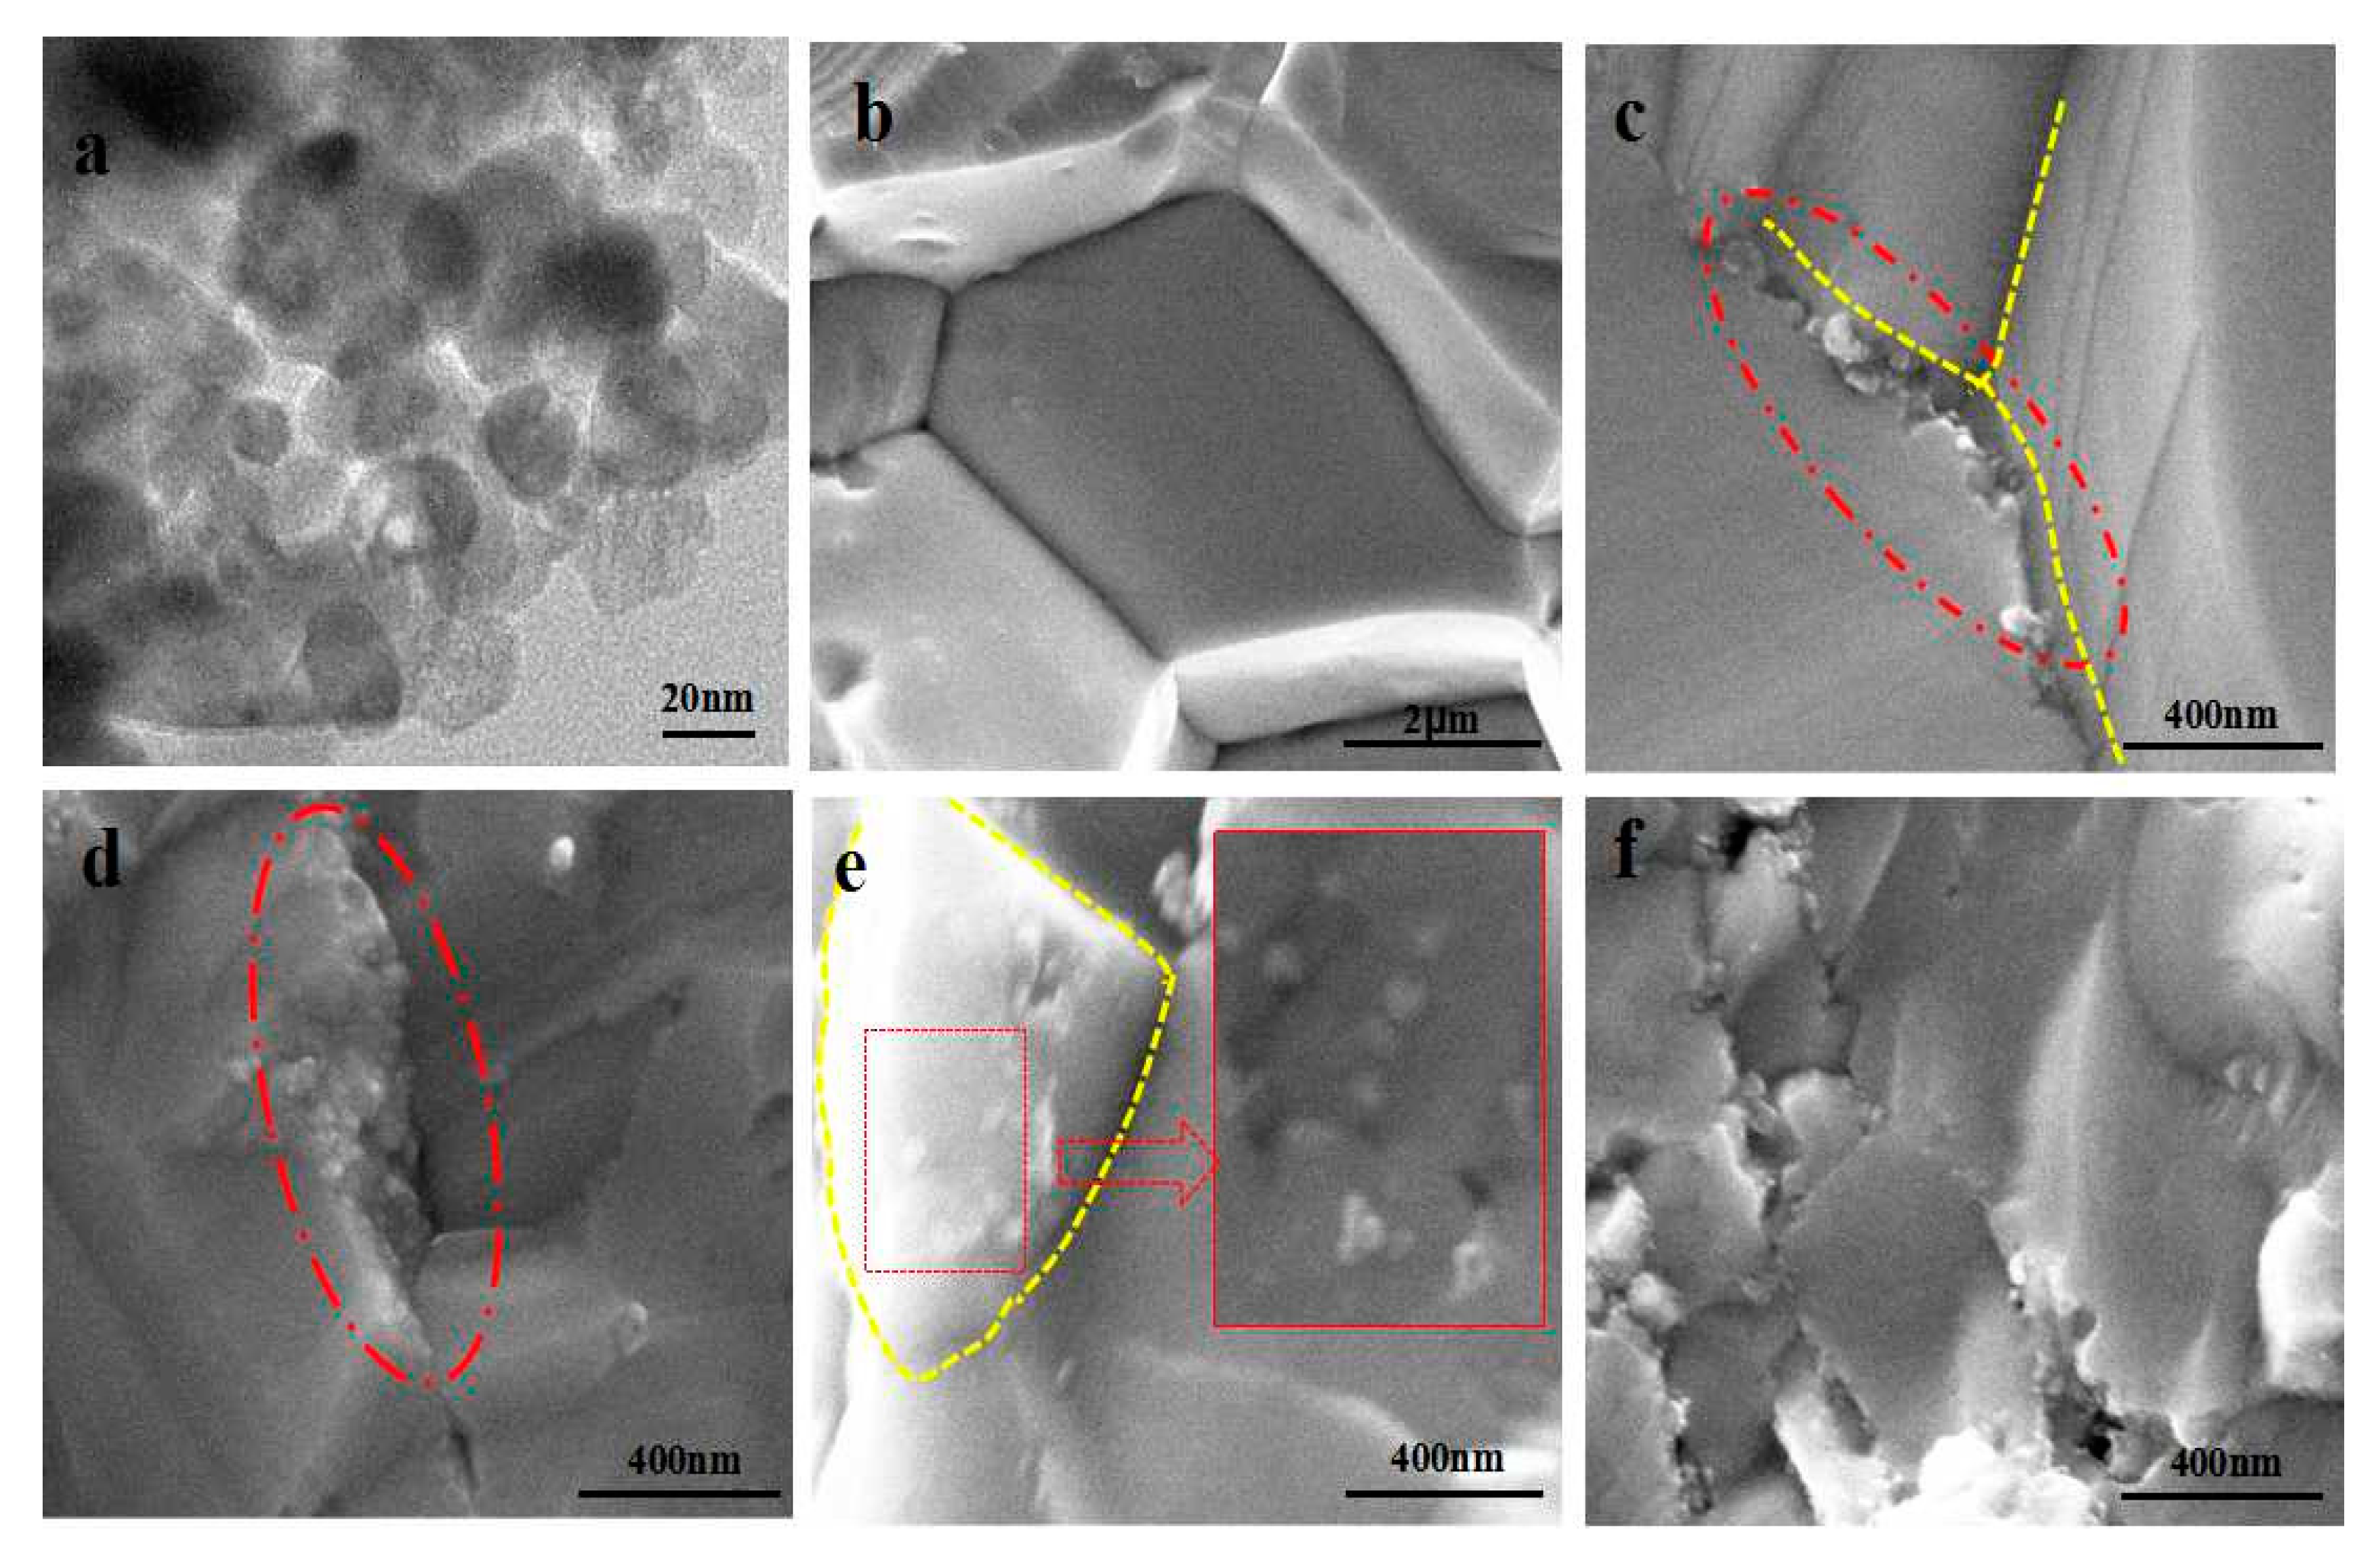
Figure 6.
Temperature dependence of electrical conductivity for the TiO2/Cu2SnSe3 composites.
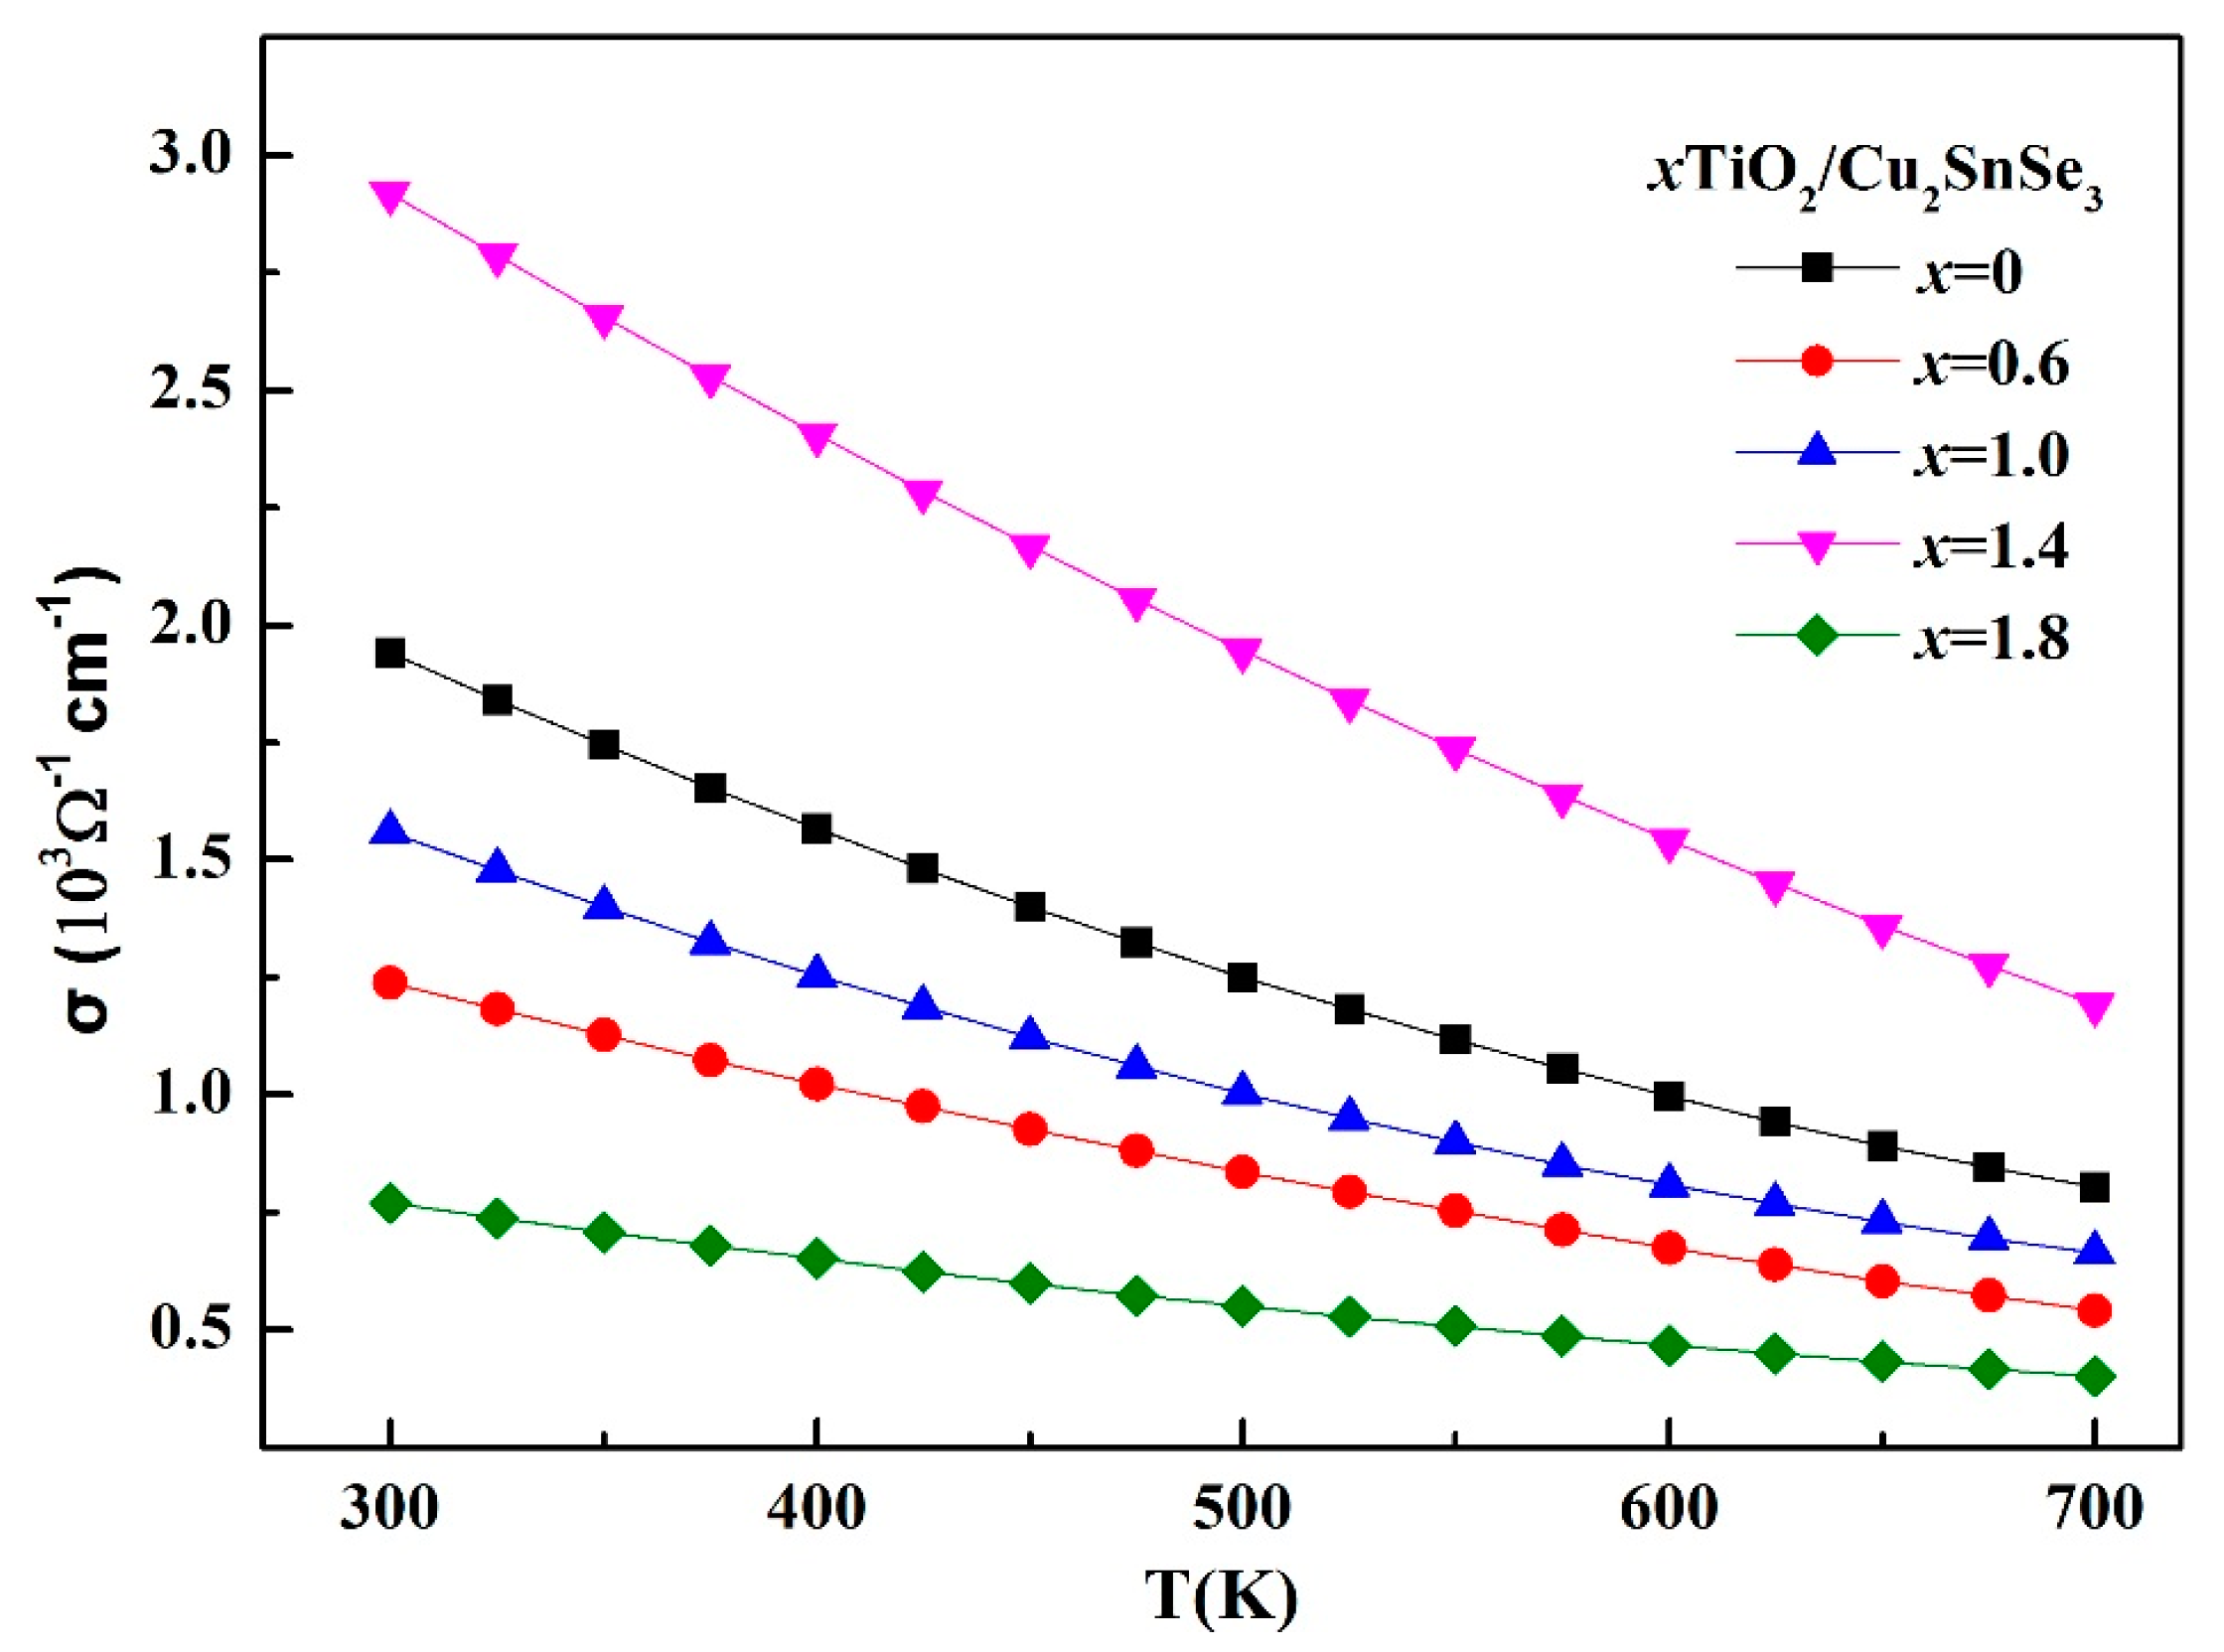
Figure 7.
Temperature dependence of Seebeck coefficient for the TiO2/Cu2SnSe3 composites.

Figure 8.
Temperature dependence of power factor (PF) for the TiO2/Cu2SnSe3 composites.
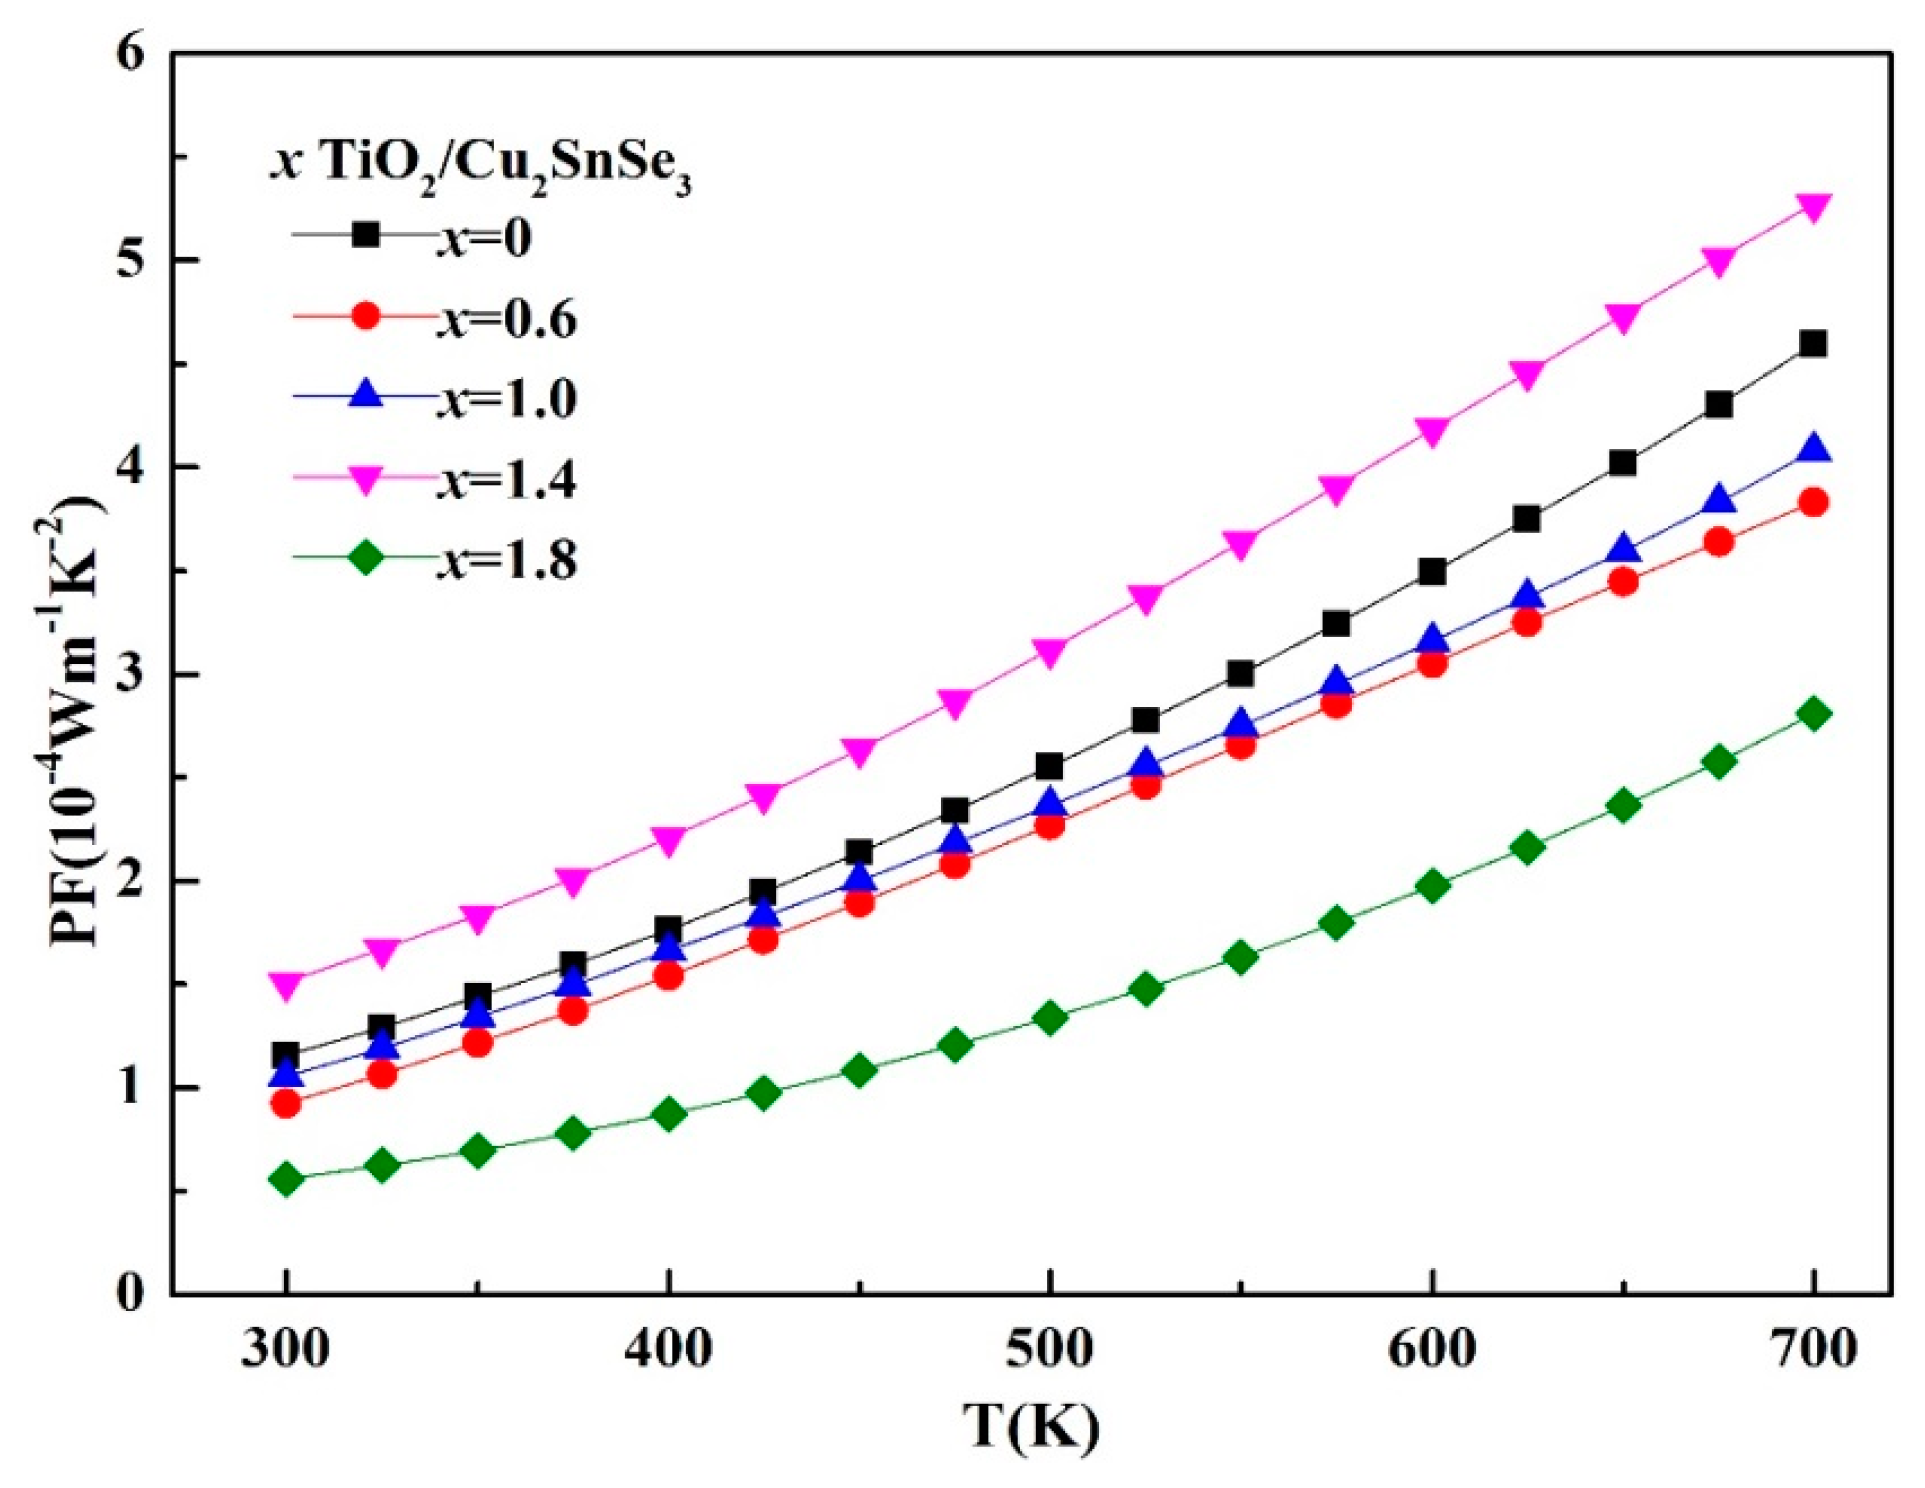
Figure 9.
(a) Temperature dependence of total thermal conductivity and (b) lattice thermal conductivity for the TiO2/Cu2SnSe3 composites.
Figure 9.
(a) Temperature dependence of total thermal conductivity and (b) lattice thermal conductivity for the TiO2/Cu2SnSe3 composites.
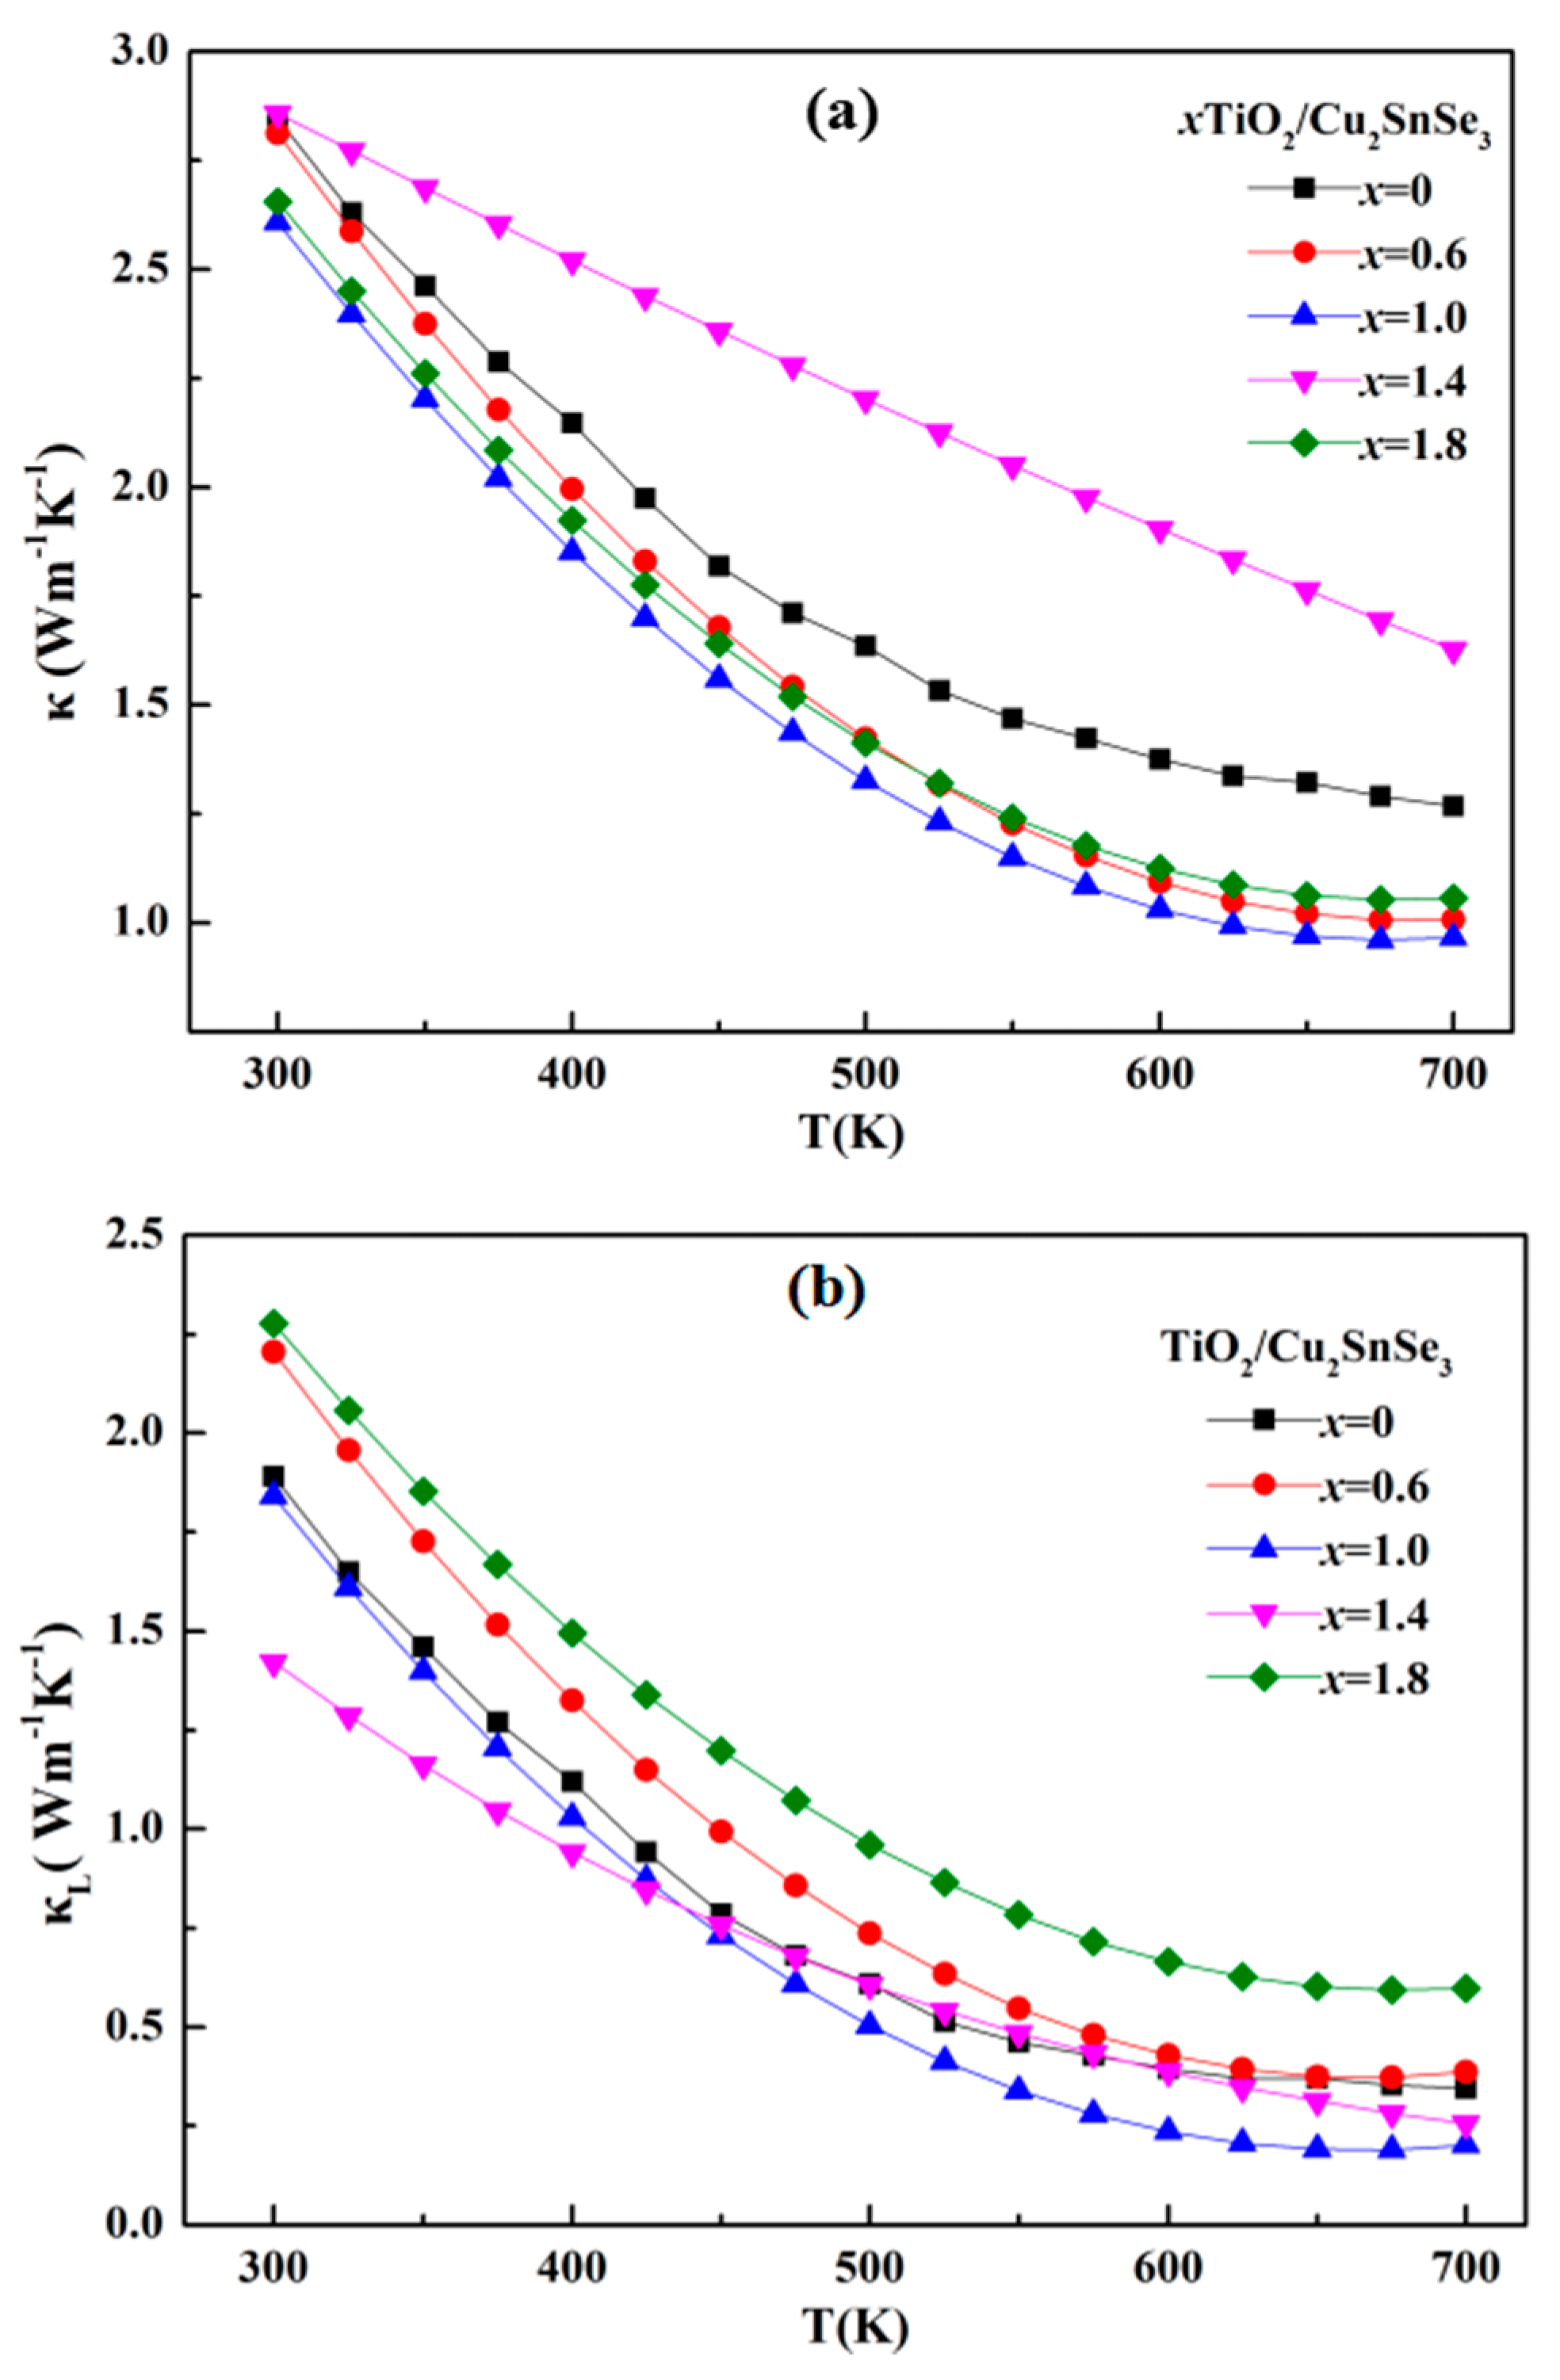
Figure 10.
Temperature dependence of ZT for TiO2/Cu2SnSe3 composites.


Table 1.
Density of the x vol % TiO2/Cu2SnSe3 composites with different nano-TiO2 content.
| xTiO2/Cu2SnSe3 | x = 0 | x = 0.6 | x = 1.0 | x = 1.4 | x = 1.8 |
|---|---|---|---|---|---|
| Density (g/cm3) | 6.042 | 6.017 | 5.833 | 5.686 | 5.343 |
| Relative density | 98% | 97.8% | 97.2% | 96.5% | 95.6% |
Table 2.
The physical parameters of the x vol % TiO2/Cu2SnSe3 composite at room temperature.
| xTiO2/Cu2SnSe3 | RH (10−3 cm3/C) | p (cm−3) | μ (cm2/Vs) | σ (103 Ω−1/cm) |
|---|---|---|---|---|
| x = 0 | 3.368 | 1.86 × 10²¹ | 6.58 | 1.96 |
| x = 0.6 | 3.621 | 1.71 × 10²¹ | 4.61 | 1.25 |
| x = 1.0 | 3.262 | 1.92 × 10²¹ | 5.38 | 1.64 |
| x = 1.4 | 3.570 | 1.75 × 10²¹ | 10.4 | 2.91 |
| x = 1.8 | 3.31 | 1.89 × 10²¹ | 2.54 | 0.77 |
© 2017 by the authors. Licensee MDPI, Basel, Switzerland. This article is an open access article distributed under the terms and conditions of the Creative Commons Attribution (CC BY) license (http://creativecommons.org/licenses/by/4.0/).
Share and Cite
MDPI and ACS Style
Ning, J.; Wu, D.; Zhao, D. Synthesis and Thermoelectric Properties of TiO2/Cu2SnSe3 Composites. Appl. Sci. 2017, 7, 1043. https://doi.org/10.3390/app7101043
AMA Style
Ning J, Wu D, Zhao D. Synthesis and Thermoelectric Properties of TiO2/Cu2SnSe3 Composites. Applied Sciences. 2017; 7(10):1043. https://doi.org/10.3390/app7101043
Chicago/Turabian StyleNing, Jiai, Di Wu, and Degang Zhao. 2017. "Synthesis and Thermoelectric Properties of TiO2/Cu2SnSe3 Composites" Applied Sciences 7, no. 10: 1043. https://doi.org/10.3390/app7101043
Note that from the first issue of 2016, this journal uses article numbers instead of page numbers. See further details here.