Article

Thermal Stability and Tuning of Thermoelectric Properties of Ag1−xSb1+xTe2+x (0 ≤ x ≤ 0.4) Alloys

1
Institut für Experimentelle Physik, TU Bergakademie Freiberg, Leipziger Str. 23, 09599 Freiberg, Germany
2
Thermoelectric Research Laboratory, Faculty of Materials Science and Ceramics, AGH University of Science and Technology, A. Mickiewicza Av. 30, 30-059 Krakow, Poland
3
Max-Planck-Institut für Chemische Physik fester Stoffe, Nöthnitzer Str. 40, 01187 Dresden, Germany
*
Authors to whom correspondence should be addressed.
Appl. Sci. 2018, 8(1), 52; https://doi.org/10.3390/app8010052
Submission received: 14 November 2017 / Revised: 16 December 2017 / Accepted: 25 December 2017 / Published: 4 January 2018
(This article belongs to the Special Issue Recent Progress in the Development of Thermoelectric Materials)

Abstract

:
Introduction of nonstoichiometry to AgSbTe2-based materials is considered to be an effective way to tune thermoelectric properties similarly to extrinsic doping. To prove this postulate, a systematic physicochemical study of the Ag1−xSb1+xTe2+x alloys (0 ≤ x ≤ 0.4) was performed. In order to investigate the influence of the cooling rate after synthesis on phase composition and thermoelectric performance, slowly cooled and quenched Ag1−xSb1+xTe2+x alloys (x = 0; 0.1; 0.17; 0.19; 0.3; 0.4) were prepared. Single-phase material composed of the β phase (NaCl structure type) was obtained for the quenched x = 0.19 sample only. The other alloys must be regarded as multi-phase materials. The cooling rate affects the formation of the phases in the Ag-Sb-Te system and influences mainly electronic properties, carrier mobility and carrier concentration. The extremely low lattice thermal conductivity is an effect of the mosaic nanostructure. The maximal value of the figure of merit ZTmax = 1.2 is observed at 610 K for the slowly cooled multi-phase sample Ag0.9Sb1.1Te2.1. Thermoelectric properties are repeatedly reproducible up to 490 K.

1. Introduction

Chalcogenides that crystallize in the NaCl structure type (Fm 3 ¯ m), e.g., PbTe, PbSe or SnTe, belong to the best thermoelectric (TE) materials [1]. Numerous studies, concerning the TE performance of AgSbTe2-alloys with various dopants, reported very large values of TE figure of merit ZT > 1.3 [2,3,4,5,6]. That is mainly due to the extremely low thermal conductivity of the material in the range of 0.5–0.7 W·m−1·K−1 [7,8,9]. However, their potential application in TE devices is limited due to thermodynamic instability in the working temperature range (300 – 600 K) [3,10,11,12].
The origin of specific transport properties of Ag-Sb-Te-based materials is thought to be connected with their local crystal structure. AgSbTe2 crystallizes in the NaCl structure type, where Ag and Sb atoms randomly occupy the same Wyckoff position 4a and Te atoms are at 4b sites [13,14]. However, the existence of highly complex local atomic ordering was suggested due to notable discrepancies in the atomic properties of Ag and Sb, e.g., atomic radii, electronic structure or oxidation state [13,14]. On the basis of either Rietveld refinements [15,16] or ab initio theoretical calculations [17,18], different possible superstructures were proposed with cubic (space group Fd 3 ¯ m), rhombohedral (R 3 ¯ m) or tetragonal (P4/mmm or I41/amd) symmetry.
Thermodynamic properties of Ag-Sb-Te alloys were investigated by several groups. Pseudobinary phase diagrams of the Sb2Te3-Ag2Te system were elaborated separately in [10,19] (Figure 1). The composition of each alloy within the diagram is described by the chemical formula Ag1−xSb1+xTe2+x (−1 ≤ x ≤ 1). A phase with the nominal composition of AgSbTe2 does not exist. To emphasize the fact that the AgSbTe2 formula relates only to a nominal composition, Ag1.0Sb1.0Te2.0 notation was used in the whole text below. In fact, the only thermodynamically stable ternary phase in this system is the β phase (Ag1−xSb1+xTe2+x, 0.08 < x < 0.41 [10]), which crystallizes in the NaCl structure type. However, earlier reports differ about the temperature and compositional region of the β phase [10,19]. Further investigations of the Ag-Sb-Te ternary system confirmed that the β phase is only stable in a limited temperature range (633 K < T < 847 K) and it decomposes into α (solid solution of Ag in Sb2Te3) and ε (solid solution of Sb in β-Ag2Te) phases below 633 K [11,12,20]. The decomposition process was additionally confirmed by temperature-dependent X-ray diffraction analysis [21] and electrochemical measurements [22]. The influence of thermal treatment on TE properties of the Ag1.0Sb1.0Te2.0 alloy is easily recognizable. In a previous work, we have noticed significant changes in Seebeck coefficient and electrical conductivity during measurements that were attributed to chemical and microstructural changes of the investigated materials [12].
In the earliest report of electrical properties of Ag1−xSb1+xTe2+x alloys [23], samples with a gradual change of phase and chemical composition were obtained. It was shown that alloys with 0 < x < 0.2 possess the most prominent power factor PF = 5 × 10⁻⁴ W∙m−2∙K−2 at room temperature (RT). Single-phase alloy with the nominal composition Ag0.875Sb1.125Te2 (not included in the pseudobinary Sb2Te3-Ag2Te system) was characterized by PF = 2 × 10⁻⁵ W∙m−2∙K−2 at RT [24]. High TE performance of Ag1−xSb1+xTe2+x alloys (ZT = 1.2–1.4 at 600 K) with x >0.25 was reported in [25,26]. There is also a strong conviction in the literature that a small change in Ag/Sb ratio effectively enhances electrical properties, due to the formation of vacancies at the Ag/Sb site, without altering thermal conductivity [25,27,28].
One can notice that systematic studies about the physicochemical properties of Ag1−xSb1+xTe2+x alloys (0 < x < 0.4) are still missing. Therefore, we decided to answer two questions: (i) what is the real stability range of the β phase within the pseudobinary Sb2Te3–Ag2Te system, (ii) whether tuning of thermodynamic stability and TE performance is indeed possible by deviating composition from the stoichiometric Ag1.0Sb1.0Te2. This study also includes a thorough analysis of the micro- and nanostructure of nonstoichiometric Ag1−xSb1+xTe2+x alloys. Additionally, we investigated the influence of thermal treatment on thermodynamic stability and TE performance of alloys. We synthesized two series of samples: (1) slowly cooled and (2) quenched sets. Although our experiments and following conclusions concern the Sb2Te3-Ag2Te pseudobinary system only, some of them can be applicable to the Ag-Sb-Te ternary system as well.

2. Experimental

2.1. Preparation

Two series of Ag1−xSb1+xTe2+x alloys (x = 0; 0.1; 0.17; 0.19; 0.3; 0.4) were synthesized. Nominal compositions x are presented in Figure 1. All manipulations were performed in an argon-filled glovebox. Small granules and pieces of elements Ag (99.9%, Alfa Aesar, Thermo Fisher (Kandel) GmbH, Karlsruhe, Germany), Sb (99.9999%, Alfa Aesar, Thermo Fisher (Kandel) GmbH, Karlsruhe, Germany) and Te (99.999%, Chempur, Karlsruhe, Germany) were weighted and placed in glassy-carbon crucibles with lids. To reduce evaporation and oxidation of materials, at least 50% of the crucible volume was filled and crucibles were placed in welded tantalum tubes (Ar atmosphere), sealed in quartz ampoules. Thermal treatment was carried out at 1023 K for 4 h. Then, the ampoules were slowly cooled down to room temperature in the furnace, with a starting rate 2.4 K∙min−1 (1st series). Obtained ingots were crushed and half of each specimen was sealed again in quartz ampoules, under a vacuum of approximately 10−2 Pa. After annealing at 1023 K for 1 h, ampoules were quenched in iced water (2nd series). In order to refine the lattice parameter of equilibrated β phase, each sample was additionally annealed at 723 K for 1.5 months (quartz ampoules, vacuum of 10−2 Pa) followed by quenching.

2.2. Powder X-ray Diffraction, Thermal Analysis and Chemical Analysis

Structural characterization was carried out by powder X-ray diffraction (PXRD, Huber G670 Guinier camera, Cu Kα1 radiation, λ = 1.54056 Å, Δ = 0.005°, HUBER Diffraktionstechnik GmbH & Co., KG, Rimsting, Germany). Data were collected at room temperature using LaB6 (NIST, 660a) as an internal standard. An experimental position of each reflection was corrected by comparison with standard, and lattice parameters of the β phase were calculated from least-squares refinement using WinCSD software [29]. Absence of C, N, O impurities was verified by elemental analysis (TCH600, C200, Leco, St. Joseph, MI, USA) and inductively coupled plasma optical emission spectroscopy (ICP-OES 5100, Agilent Technologies, Santa Clara, CA, USA). Thermogravimetry and differential thermal analysis experiments (TG-DTA: STA 449F3, Al2O3 crucibles; DTA: STA 409C/CD, SiO2 ampoules, Netzsch GmbH & Co., Selb, Germany ; heating rate: 5/10 K·min−1) were performed to identify phase transitions and to detect Ag2Te impurities.

2.3. Metallography and Scanning Electron Microscopy

Samples for metallographic investigation were embedded in a conductive resin, polished with SiC abrasive paper with different grit (i.e., 1200, 2400, and 4000) and then with a diamond polishing belt (particle size 0.25 μm), applying dry hexane as a lubricant under ambient conditions. Microstructure analysis of polished samples was carried out by using optical microscopy (Axioplan 2, bright field or polarized light, Carl Zeiss AG, Oberkochen, Germany) and scanning electron microscopy (SEM, Philips/FEI XL30, LaB6 cathode, FEI Technologies Inc., Hillsboro, OR, USA) with integrated energy dispersive X-ray spectrometer (EDXS,Quantax 400, XFlash 6|30 silicon drift detector, Bruker Corporation, Billerica, MI, USA).

2.4. High-Resolution Transmission Electron Microscopy

The atomic structure of single-phase Ag0.81Sb1.19Te2.19 alloy was analyzed by means of high-resolution transmission electron microscopy (HRTEM) using FEI Tecnai F30-G2 microscope (field-emission gun at an acceleration voltage of 300 kV; point resolution and information limit were amounted to 1.9 Å and 1.2 Å, respectively, FEI Technologies Inc., Hillsboro, OR, USA) and selected area electron diffraction (SAED). The microscope was equipped with a slow-scan CCD camera (MultiScan, 2 k × 2 k pixels; Gatan Inc., Pleasanton, CA, USA) and EDXS spectrometer. The powdered sample was dispersed in methanol and several drops of the solution were loaded on carbon coated copper grid (Quantifoil S7/2, 100-mesh hexagonal, 2 nm carbon film, Quantifoil Micro Tools, Jena, Germany). The grid was transferred to the microscope after complete dryness. Analysis of the TEM images was performed using Digital Micrograph software (Version 2, Gatan Inc., Pleasanton, CA, USA). It includes fast Fourier transform (FFT)/inverse fast Fourier transform (IFFT), filtering and brightness/contrast corrections.

2.5. Spark Plasma Sintering and Thermoelectric Properties

High-temperature TE properties were determined in the temperature range of 298–610 K. Samples for TE measurements were manually ground in an agate mortar and compacted using the spark plasma sintering apparatus placed in an argon-filled glove-box (515ET Sinter Lab, Fuji Electronic Industrial Co., Ltd., Tsurugashima Saitama, Japan, 753 K, 5 min, 40 MPa, graphite dies [30]). Obtained cylindrical pellets (ϕ = 10 mm) were used for studies of thermal properties. Thermal diffusivity αd was measured by laser flash analysis (LFA 457 MicroFlash, HgCdTe detector, Netzsch GmbH & Co., Selb, Germany) under helium flow. Densities ρ of the samples (higher than 95% of theoretical density) were determined using an immersion technique with ethanol as a medium. Specific heat capacity cp was evaluated from Dulong-Petit law and the thermal conductivity λ was calculated as
λ = αdρcp
Samples, after LFA measurements, were cut into bars (~8 × 2 × 2 mm) for electronic-transport measurements and low temperature tests. The Seebeck coefficient α and electrical conductivity σ were determined simultaneously using differential method and the DC four-point probe method, respectively (ZEM-3, Ulvac-Riko, Munich, Germany). The Hall effect in single- or near-single-phase samples (x = 0.17 and 0.19) was measured with a six-point AC method in a physical property measurement system (PPMS, 2–350 K, Quantum Design Inc., San Diego, CA, USA), with magnetic fields up to 9 T. Carrier concentration p and mobility μ were calculated as
p = (eRH)−1,
μ = σ(pe)−1,
where RH is the Hall coefficient (cm−3) and e is the electron charge equals 1.602 × 10⁻¹⁹ C. Thermoelectric figure of merit ZT was calculated as
ZT = α2σλ−1∙T
where T is absolute temperature (K). According to manufacturer’s data, we estimated measurement errors s(λ), s(σ), s(α), and s(ZT) equal 5%, 10%, 10% and 20% respectively.

3. Results & Discussion

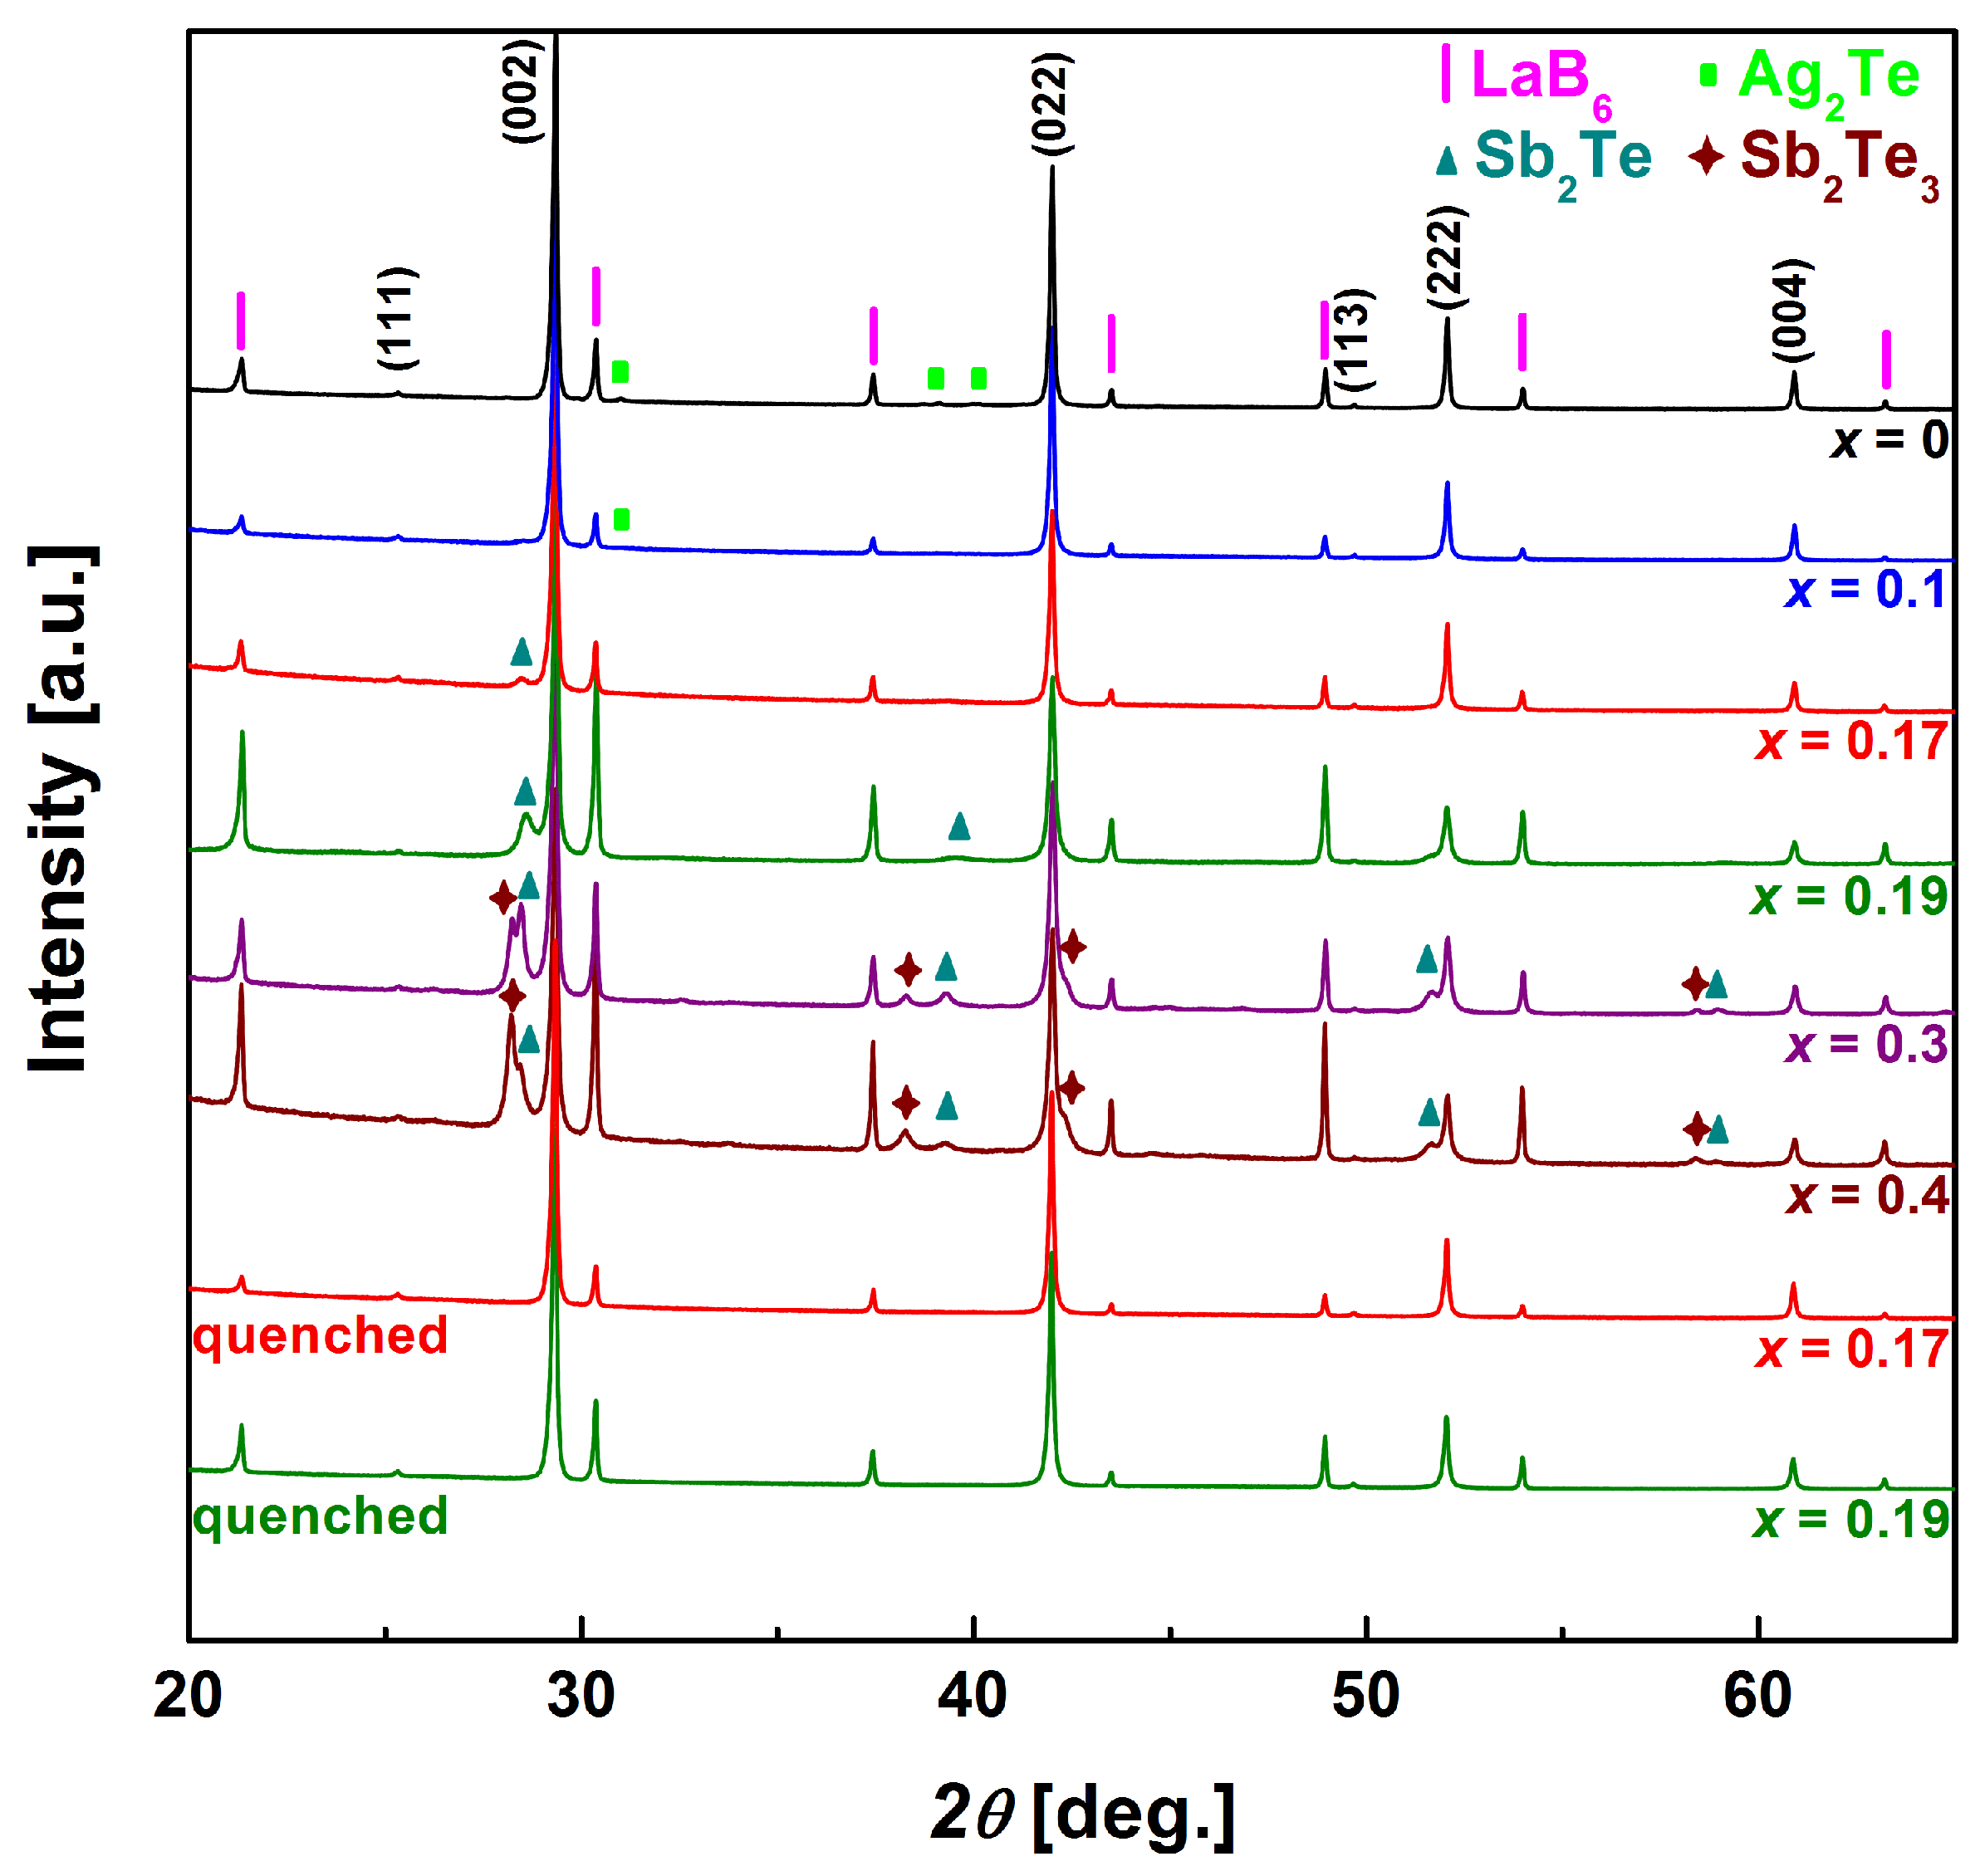
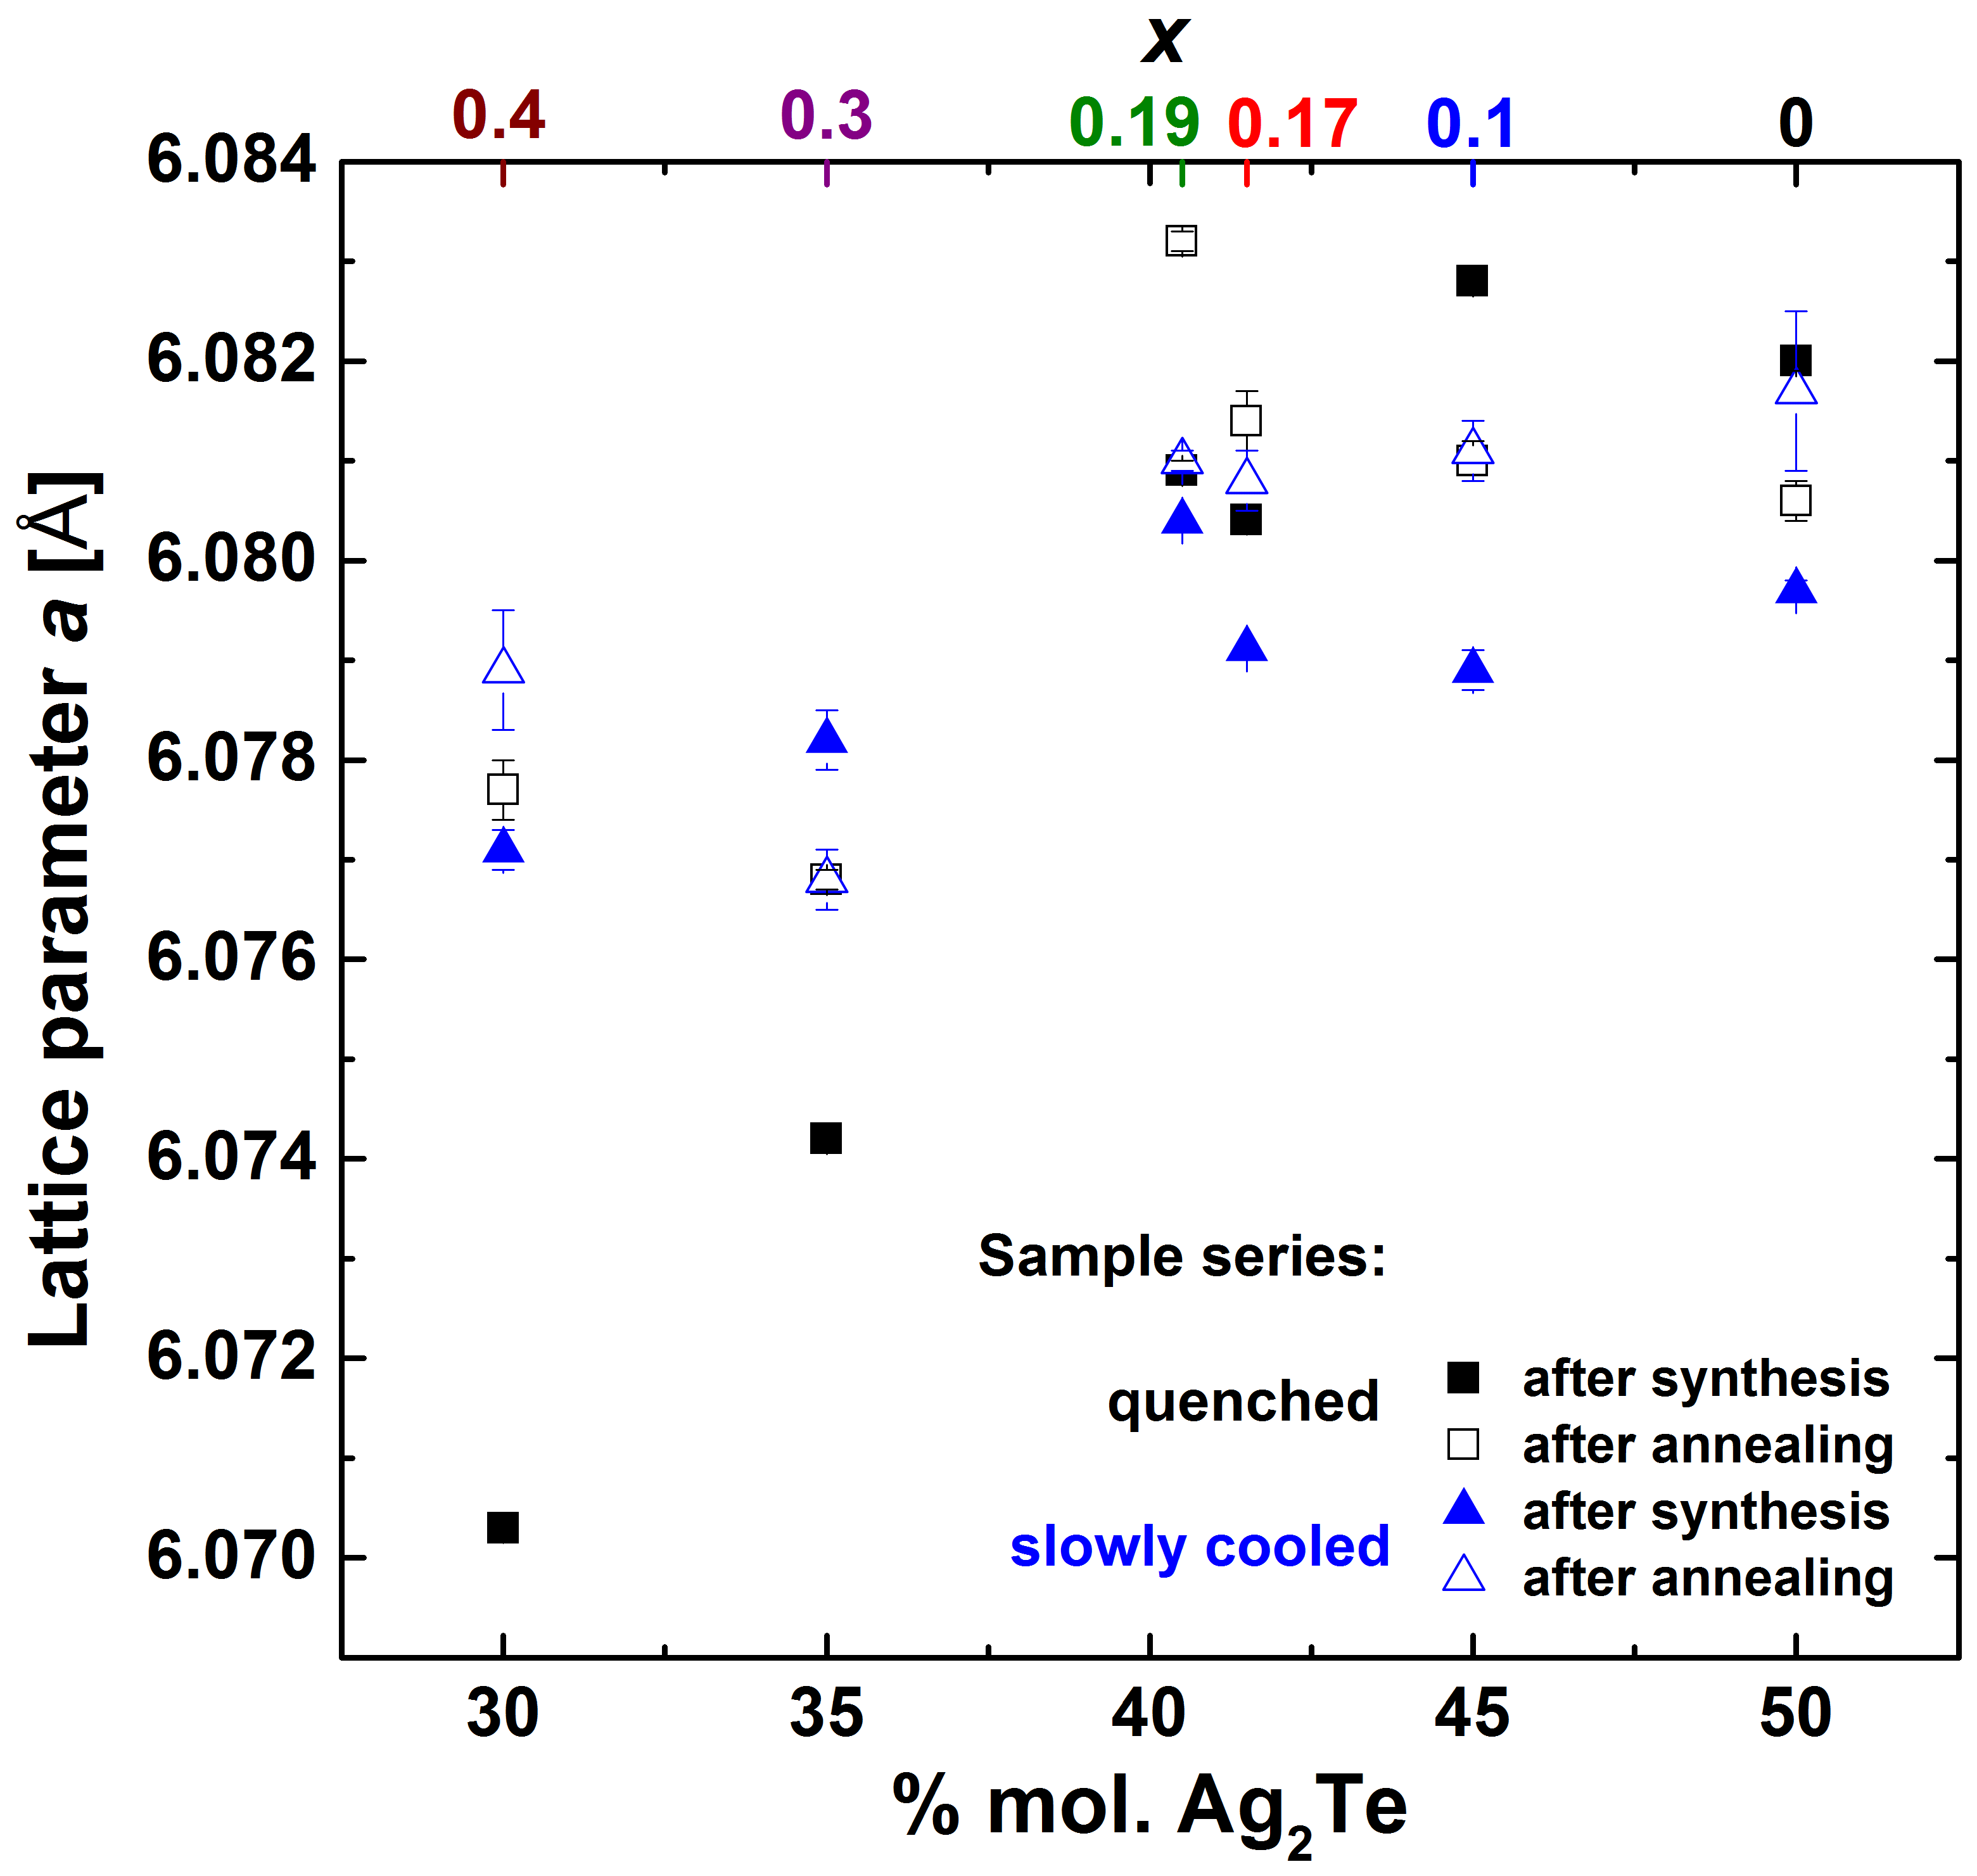
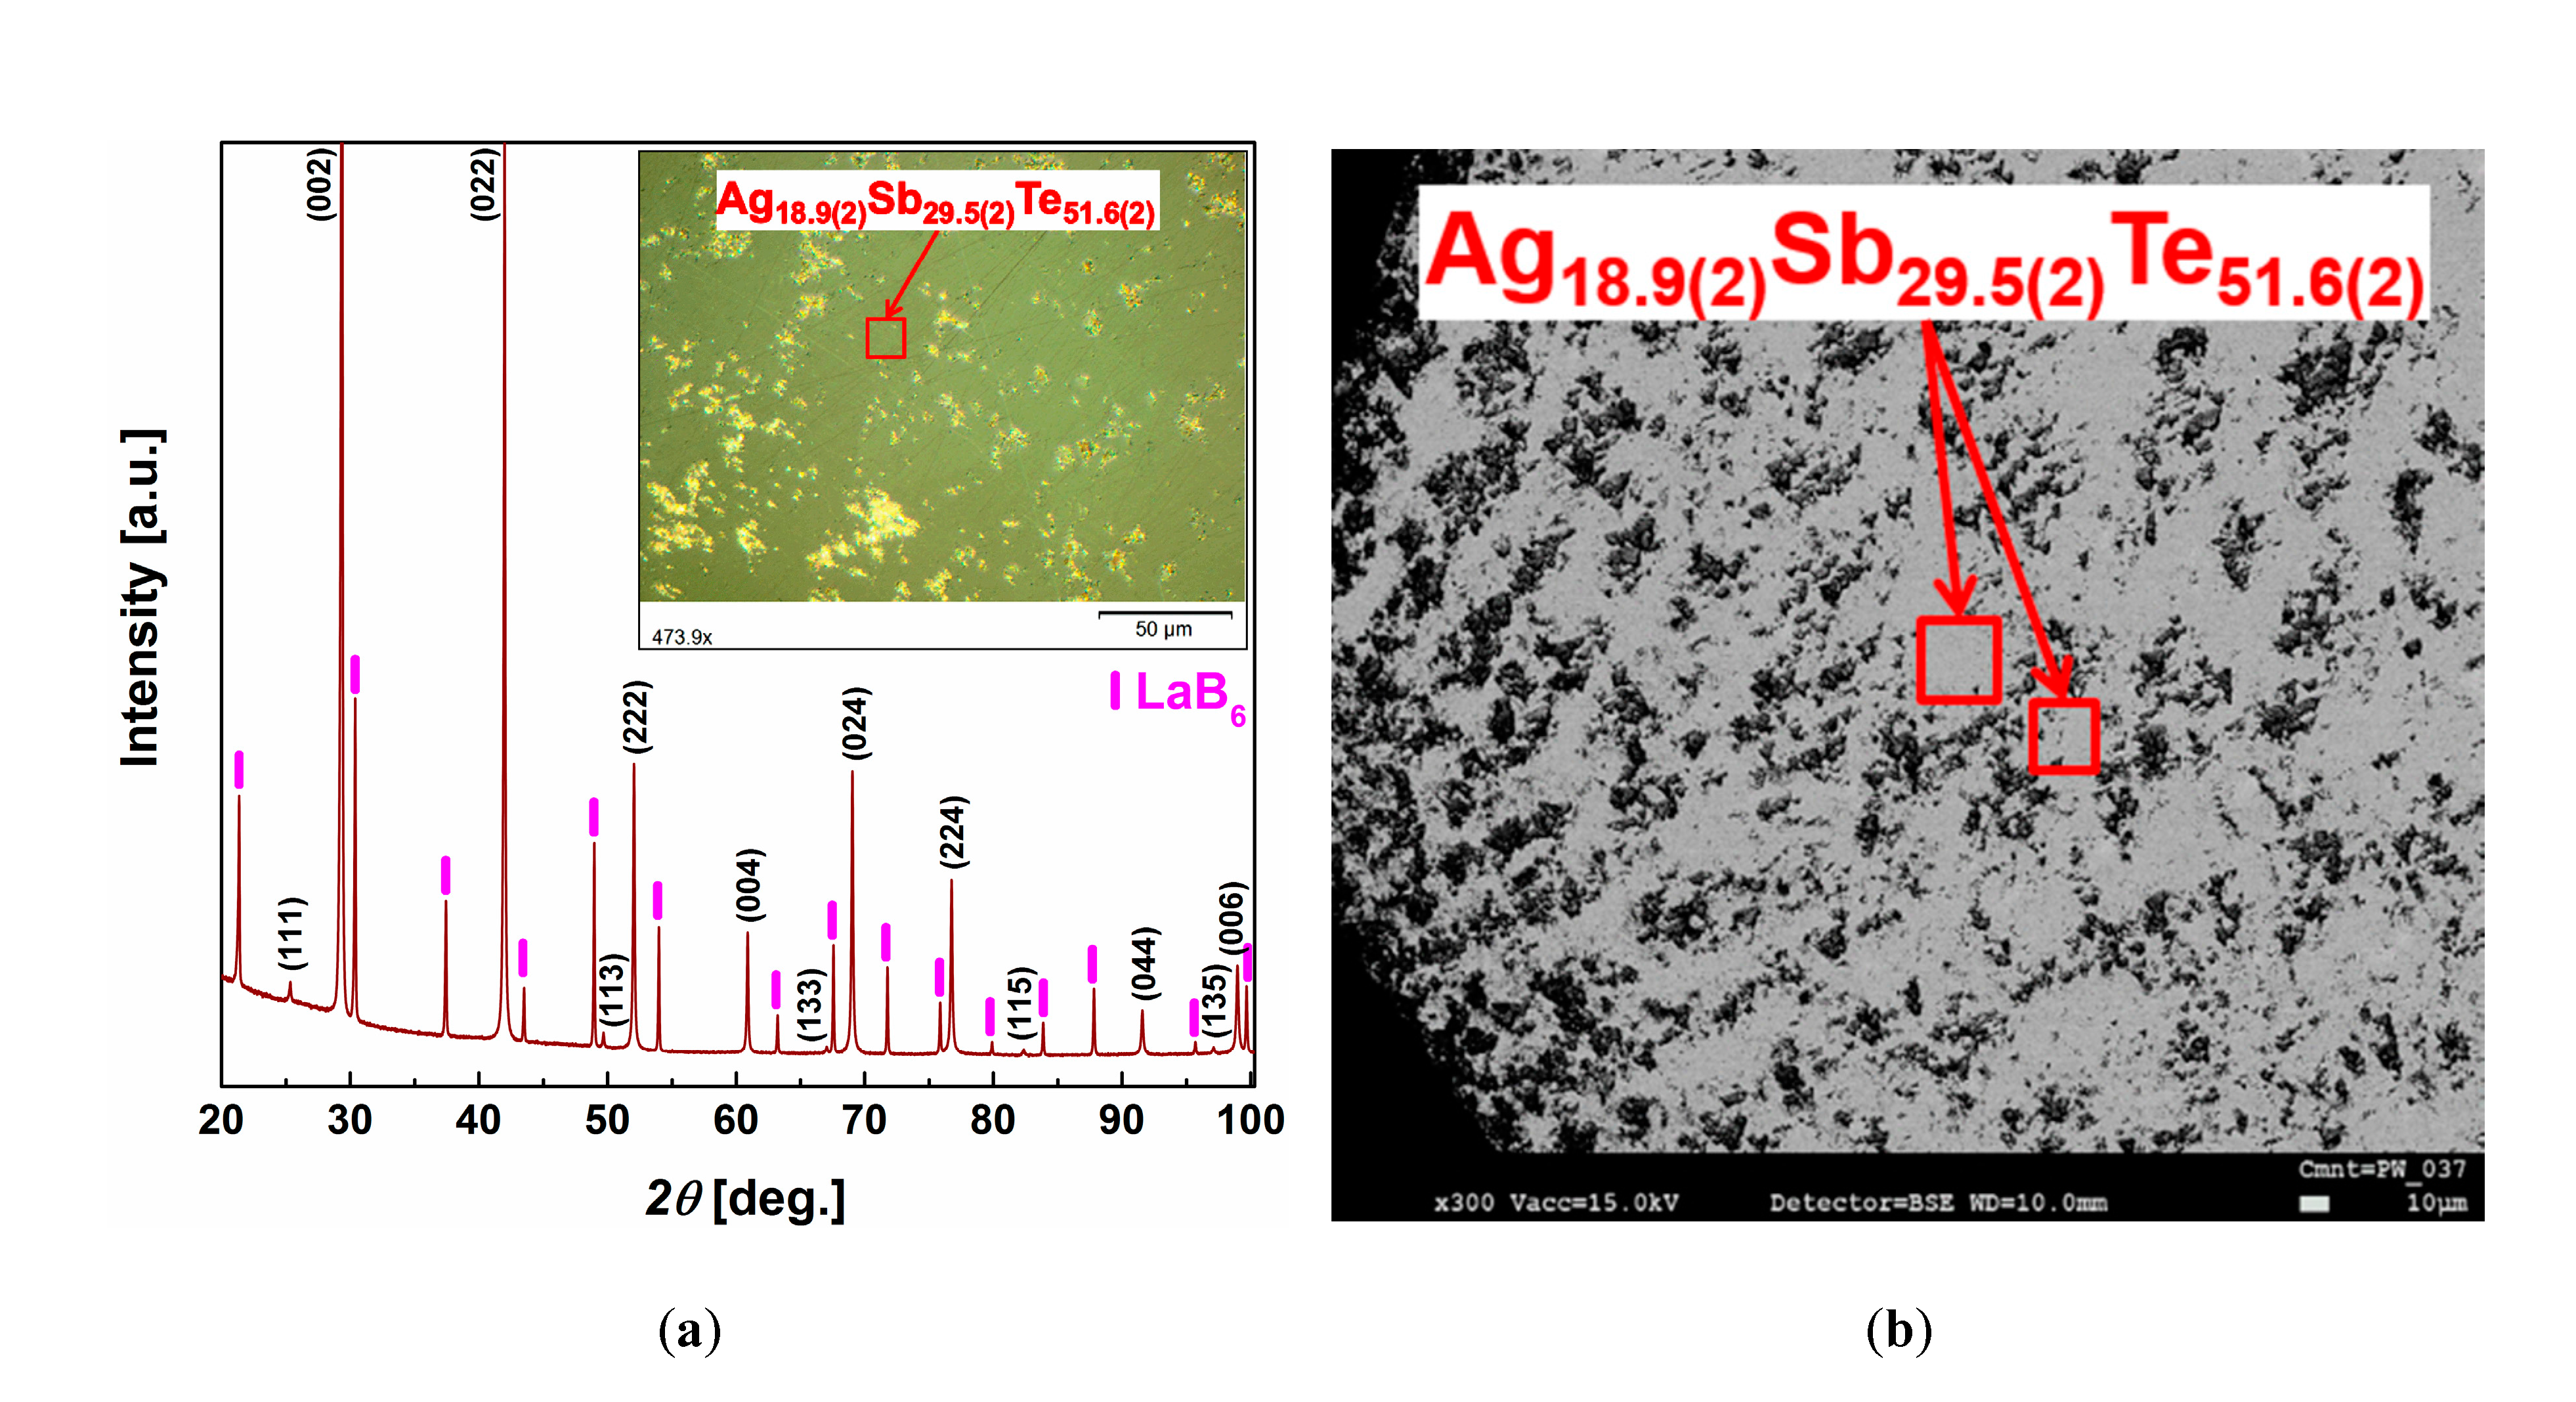
3.1. Structural and Thermal Properties

Phase composition of Ag1−xSb1+xTe2+x alloys was verified using PXRD experiments coupled with DTA thermal analysis. PXRD patterns of as-cast samples are presented in Figure 2. Main reflections were assigned to the β phase with NaCl-type crystal structure. The presence of small amounts of secondary phases is revealed. The slow cooling process does not allow obtaining single-phase materials in the whole analyzed compositional region, in agreement with the phase diagram [10] (Figure 1). The existence of Ag2Te and Sb2Te3 precipitations after slow cooling, especially in samples from the compositional region of the β phase, is the result of the eutectoid decomposition of the latter in the reaction βα + ε at 633 K [10]. However, the rate of this process is so small that even slow cooling can impede it. PXRD analysis of samples after quenching reveals that this procedure effectively minimizes the quantity of secondary phases and in the case of alloys with x = 0.19 and 0.17 (compositions from homogeneity region of the β phase) enables us to prepare single-phase materials (Figure 2).
The strongest reflection from Ag2Te (2θ = 31.06°) can be overlooked and alloys with nominal compositions of x = 0.1 and x = 0 can be considered as single-phase materials. Therefore, DTA analysis was performed to verify our PXRD data (Figure S1). Each expected thermal effect corresponding to the β phase was detected, together with a small endothermic peak at 418 K associated with the polymorphic phase transition of Ag2Te (Figure S1a, Table S1). A tiny endothermic effect was found at 693 K, which was ascribed to the incongruent melting of Ag5Te3 [31]. However, no reflections of that phase are visible in PXRD pattern (Figure 2). The concentration of this phase seems to be below the detection limit of PXRD analysis. The results prove that rate of the decomposition of the β phase is low and impurities are present in the form of the mixture of Ag-Te phases, in agreement with our previous investigations [12]. Thermal analysis of the slowly cooled x = 0.19 sample shows only peaks associated with decomposition and incongruent melting of the β phase (Figure S1b).
Lattice parameters of the β phase for Ag1−xSb1+xTe2+x alloys are presented in Figure 3.
Assuming no interstitials and anti-site defects (Ag/Sb at 4a sites and Te at 4b sites only), increase of x (0 < x < 1) in the formula Ag1−xSb1+xTe2+x enhances the concentration of vacancies at 4a site and reduces the lattice parameter of the β phase. For the non-annealed samples, the lattice parameter increases with Ag-content for the lower silver concentrations and remains almost constant for more than 45 mol.% of Ag2Te. After annealing, the lattice parameter practically does not change with concentration (Figure 3). This behavior suggests a wider homogeneity range of the β phase at elevated temperatures. Particular temperature treatment (cooling rate, annealing) of Ag-Sb-Te samples results in the formation and certain ordering of vacancies at 4a crystallographic sites. Kinetic hindering of the formation and decomposition reaction of the β phase at 633 K inhibits the complete equilibration of the samples, even after long term annealing. Small discrepancies in values, between respective samples after annealing (from different series), are visible and show the importance of the thermal history of Ag-Sb-Te alloys. The above discussion is focused on the Sb2Te3-Ag2Te cross-section. However, the real homogeneity region of the β phase in the ternary Ag-Sb-Te system can be more complex and situated out of the Sb2Te3-Ag2Te cross-section, what was partially shown in [11].

3.2. Microstructures

The microstructures of Ag1−xSb1+xTe2+x alloys can be divided into three groups (Figure 4). Slowly cooled samples with the highest concentration of Sb, x = 0.4 and x = 0.3 (Figure 4b and Figure S3), show an evident Widmanstätten-like microstructure [23,25,32]. The specific pattern is caused by crystallization of elongated grains of Sb2Te3 and Sb2Te in matrix of the β phase (Figure 4b, Figures S2a and S3). Shorter time of solidification inhibits straightforward crystallization of Sb-Te phases. Thus, the Widmanstätten-like pattern is not formed after quenching (Figure 4a and Figure S3a,c). Chemical compositions of the β phase after different cooling processes are comparable (Table 1).
A second group of alloys, x = 0.19 and x = 0.17, is characterized by a near-single or single-phase microstructure (Figure 4c,d and Figure S2b,c). A small amount of Sb-Te precipitations result in barely visible Widmanstätten-like pattern in alloys after slow cooling (Figure 4d, Figures S2b and S4b). An increase of cooling rate inhibits the precipitation of the secondary phases (x = 0.19, Figures S2c and S4a). Quenched x = 0.17 sample contains vestigial inclusions of Ag2Te, undetectable by PXRD (Figure 4c and Figure S4c).
A third type of microstructure: lamellar, pearlite-like precipitations of Ag2Te in the β phase matrix was observed in slowly cooled alloys with the highest content of Ag (x = 0; 0.1; Figure 4f and Figure S4f). The cooling rate strongly affects the morphology of those grains, which are much thinner after quenching (on the level of 1 μm, Figure 4e and Figure S4e). The chemical composition of the matrix in the analyzed alloys is almost the same, suggesting this to be the limiting composition of β-phase-region. Additional annealing during the SPS procedure and LFA measurement does not influence the chemical composition of the matrices; they remain practically unchanged (Table 1). However, a slight increase of the impurity concentration and modification of the microstructure is visible as the result of the slow decomposition of the β phase. Detailed discussion of the chemical compositions is given in supplementary information (Section 3).

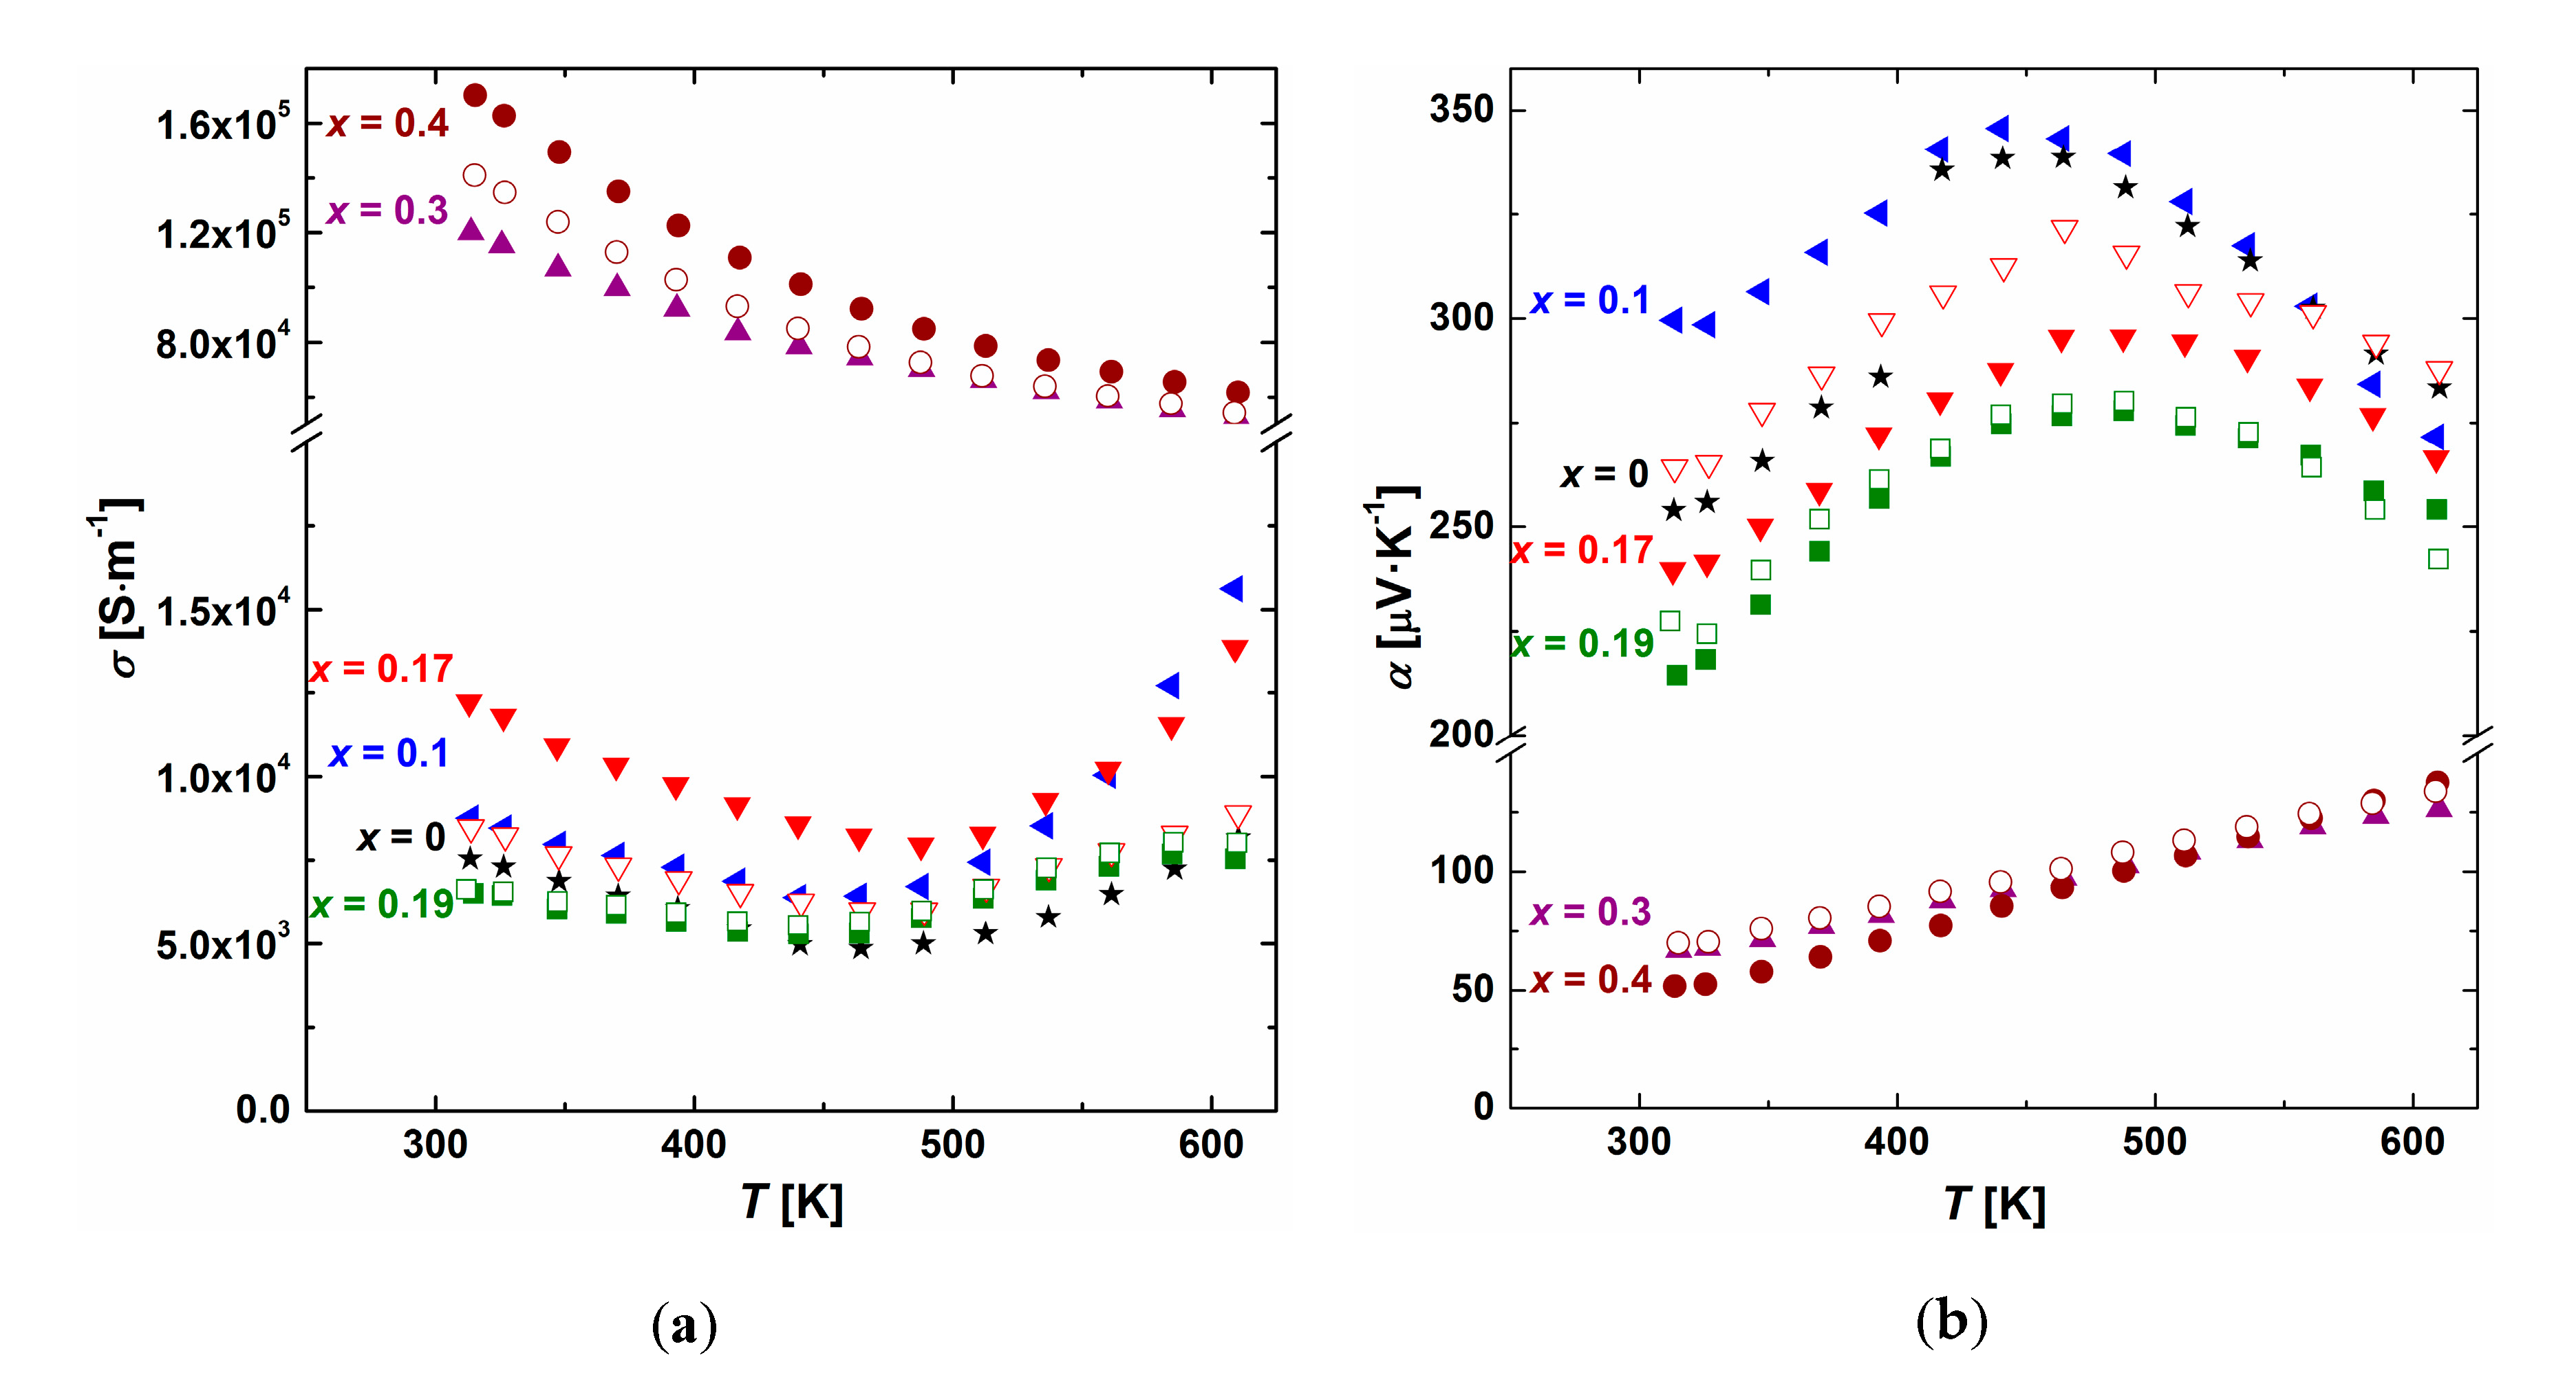
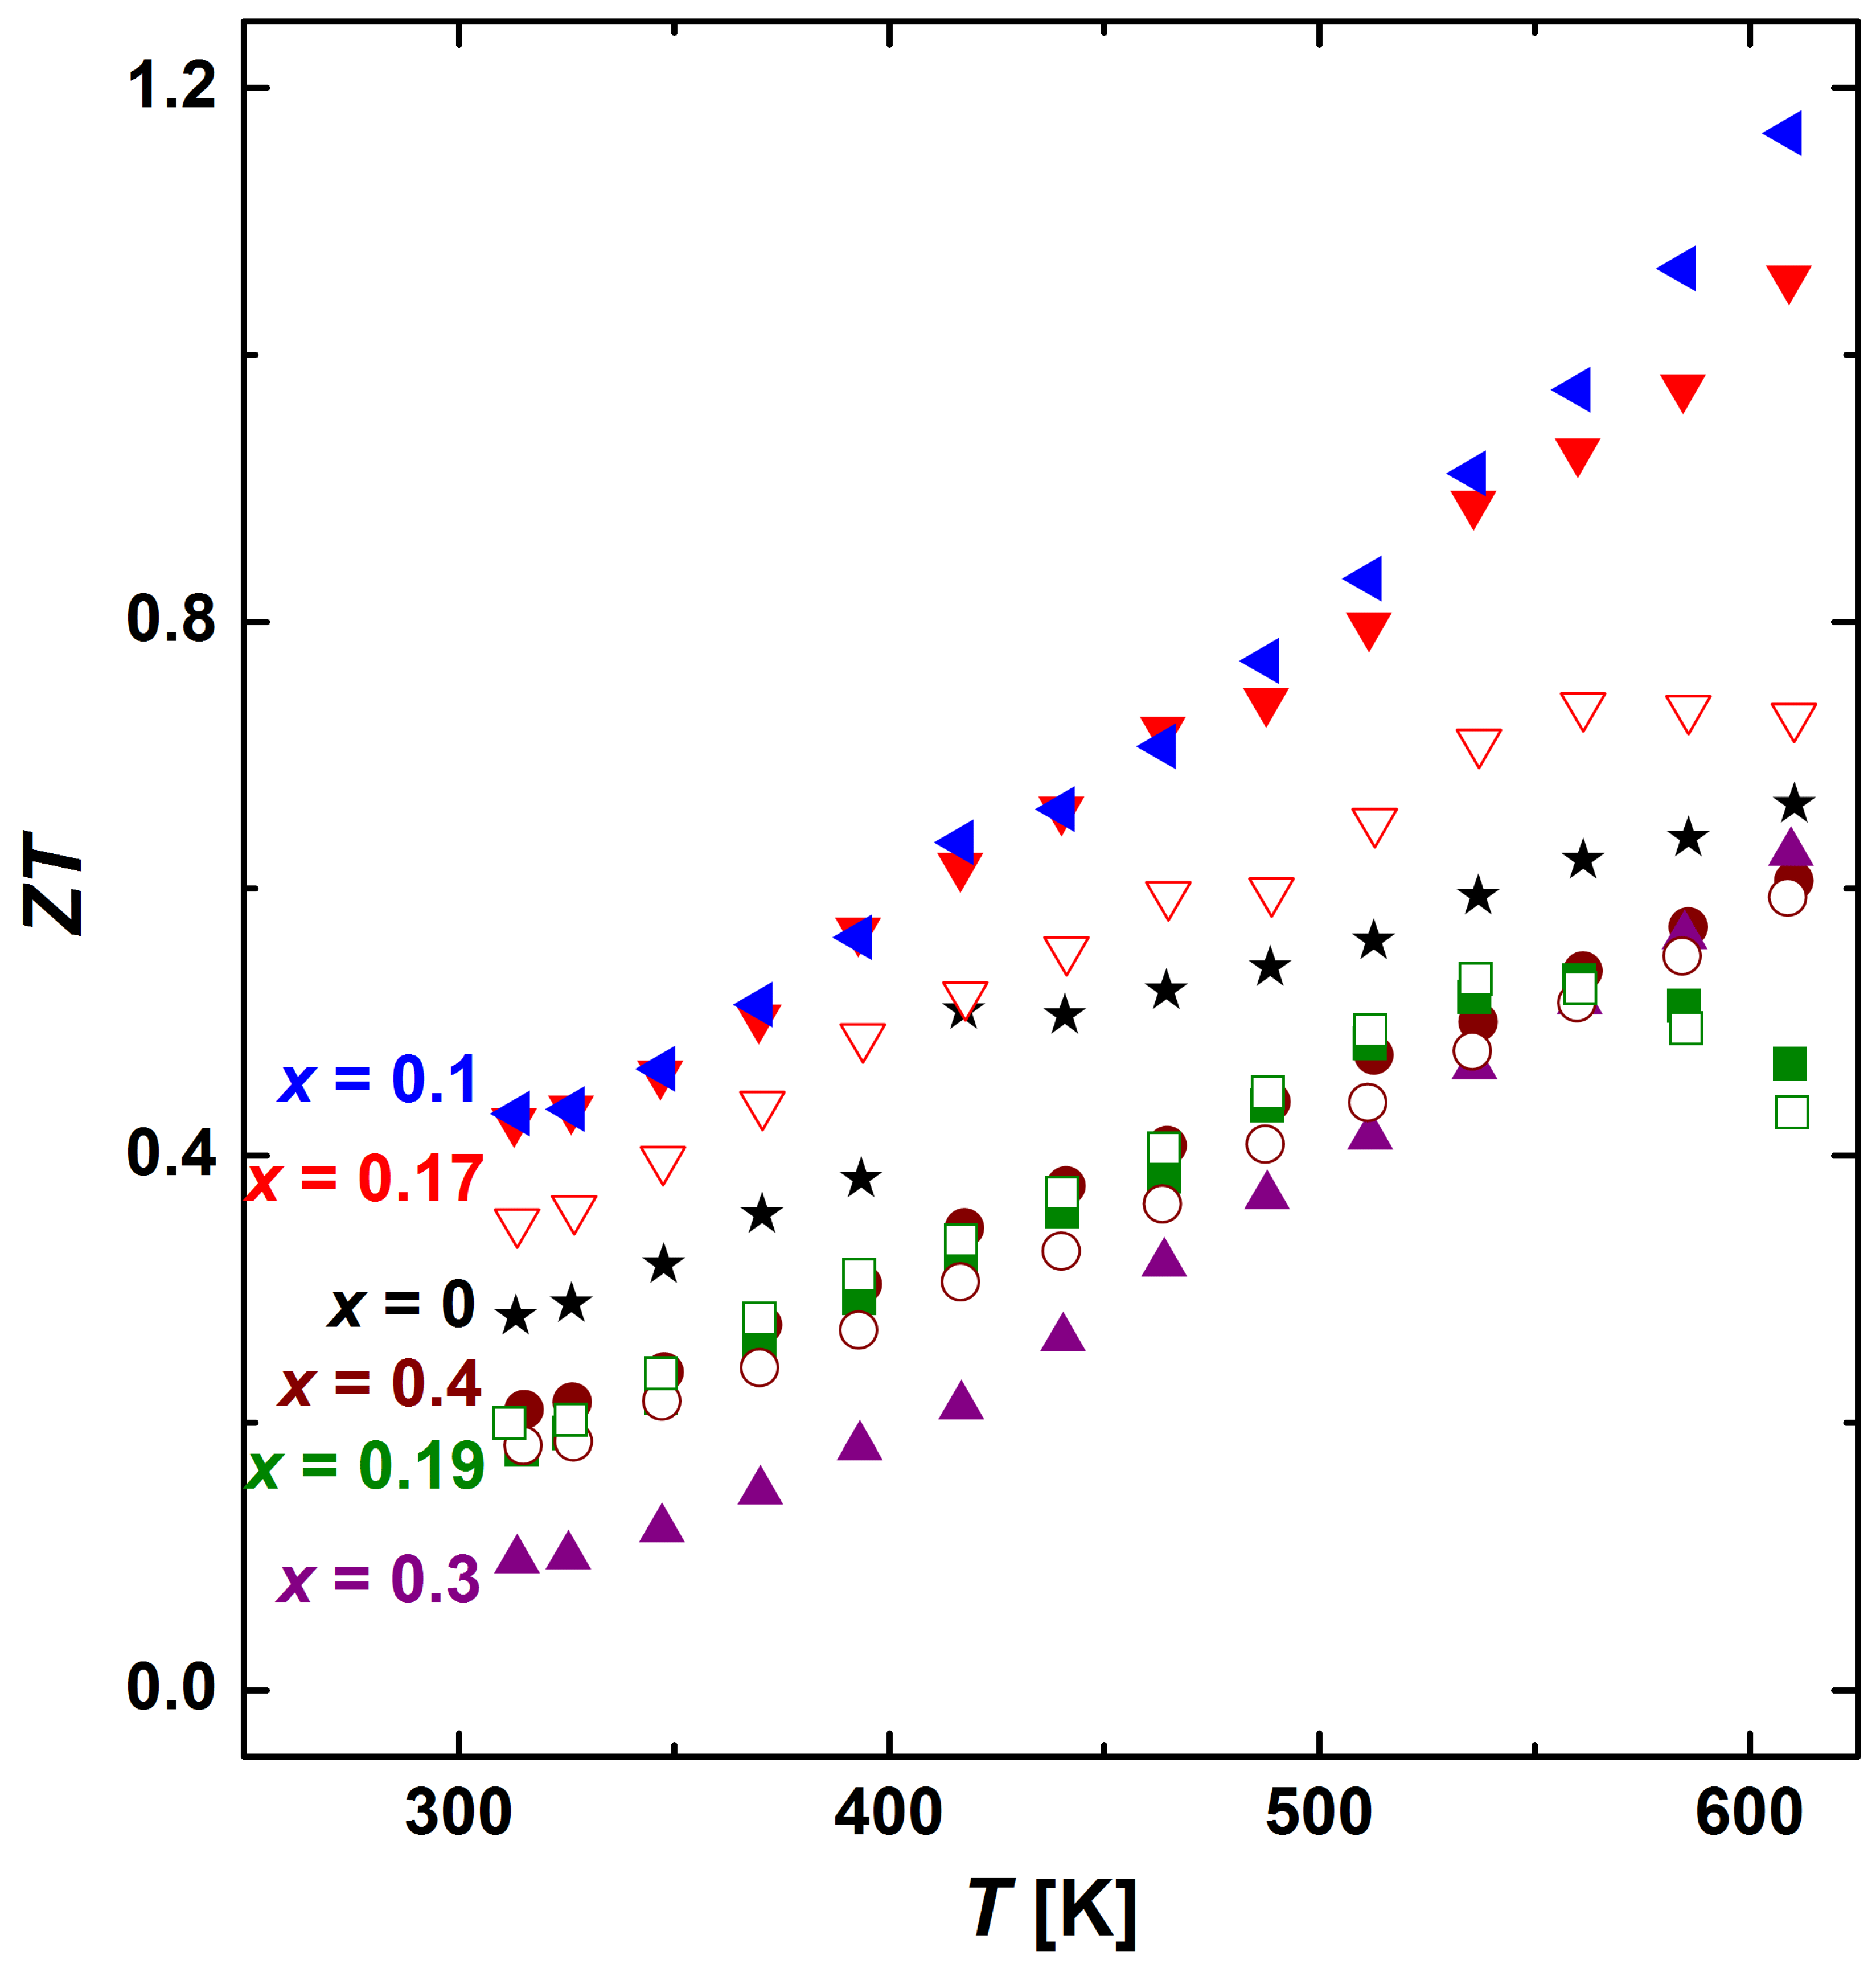
3.3. Thermoelectric Properties

The electrical properties were measured in several heating-cooling cycles from RT to 610 K. During subsequent measurement cycles, the decomposition process occurs and both phase composition and microstructure differ from the starting ones. This effect is discussed later. Here, we present results of the first heating cycle only. Each sample show metallic σ(T) dependence up to 500 K (Figure 5a). The highest values of electrical conductivity were observed for Sb-rich alloys with a notable concentration of Sb-Te impurities (x = 0.3, 0.4), independent of the cooling rate. The conductivity is higher than 105 S·m−1 at RT and resembles values typical for the Sb2Te3 phase (1.5 − 2 × 10⁵ S·m−1 in the range of 300–610 K, [33]). This phase seems to contribute most to the conduction of electrical current in those samples. Samples with lower Sb content (x = 0 – 0.19) display similar σ(T) values, between 0.5 × 10⁴ − 1.3 × 10⁴ S·m−1 after slow cooling and 0.4 × 10⁴ − 0.9 × 10⁴ S·m−1 after quenching. The observed decrease of electrical conductivity after quenching (for x = 0–0.4) can be a consequence of pronounced carrier scattering, related to notable changes in the microstructure (Figure 4) and impurity concentration. It is also consistent with the decrease of charge carrier mobility (Figure 6a). It seems that mostly mobility influences σ values at T < 350 K. For x = 0.17, carrier concentrations of slowly cooled and quenched samples coincide with each other. It is worth highlighting the increase of carrier concentration with x (Figure 6b). Following the assumption that vacancies at 4a site are present in Ag-Sb-Te alloys and have an influence on hole concentration [25,27,28], the observed change in carrier concentration is expected. Low and high temperature data of σ perfectly coincide with each other, which proves the good homogeneity of the samples (inset in Figure 6a). At T < 200 K, σ is significantly increasing for x = 0.17, simultaneously with μ, and reaching the peak below 100 K (Figure 6a).
The temperature dependence of the Seebeck coefficient reflects that of electrical conductivity, and all alloys show p-type conductivity (Figure 5b). The lowest values were observed in alloys with x = 0.4 and 0.3 due to the precipitation Sb-Te phases. The other samples show higher Seebeck coefficients in the range of 200–375 μV∙K−1.
Thermal conductivity as a function of temperature is presented in Figure 7a. The electronic contribution to thermal conductivity λe was calculated from the Wiedemann-Franz law λe = L·σ·T (where L = 2.44 × 10⁻⁸ W·Ω·K−2 is the Lorenz number). The lattice part, containing also ambipolar contribution, was then determined by subtracting the electronic part from the total thermal conductivity. The highest values of thermal conductivity, 0.9–1.3 W·m−1·K−1, were observed for materials with a notable concentration of Sb-Te impurities (x = 0.4 and 0.3), mainly due to their significant electronic contribution to heat conduction. However, the λe calculated from the Wiedemann-Franz law seems to be overestimated for these samples, resulting in very low lattice contribution (Figure 7b). The other alloys exhibit twice lower λ(T) values, in the range of 0.4–0.7 W·m−1·K−1, similar to literature reports [7,26]. Lattice part is the main contribution to total thermal conductivity, independent of synthesis procedure (Figure 7b). Due to the included ambipolar part, values are slightly overestimated. Differences in thermal conductivity between samples after slow cooling and quenching, 5–10%, are on the level of measurement precision.
One can notice extrema in the temperature dependence of Seebeck coefficient (maxima), electrical and thermal conductivity (minima), around 500 K that suggest an increase of the concentration of minority carriers—electrons, and an increase of their contribution to the electrical conductivity above 500 K. Such ambipolar conduction is observed in narrow-band-gap semiconductors [34]. Changes in the slope of α(T) and σ(T) dependences at 420 K in Ag-rich alloys (x = 0, 0.1) are caused by polymorphic transition of Ag2Te impurities [12,35].
The quality of synthesized materials was evaluated on the basis of the dimensionless thermoelectric figure of merit ZT (Figure 8). ZT grows monotonously with the temperature. Slowly cooled materials exhibit better TE performance compared to quenched samples. Slow cooling rate leads to crystallization of highly non-equilibrated alloys with a large number of defects and impurity phases, which effectively reduces lattice thermal conductivity. Samples x = 0.1 and x = 0.17 showed the highest values of ZTmax, 1.2 and 1.1 at 610 K, respectively.

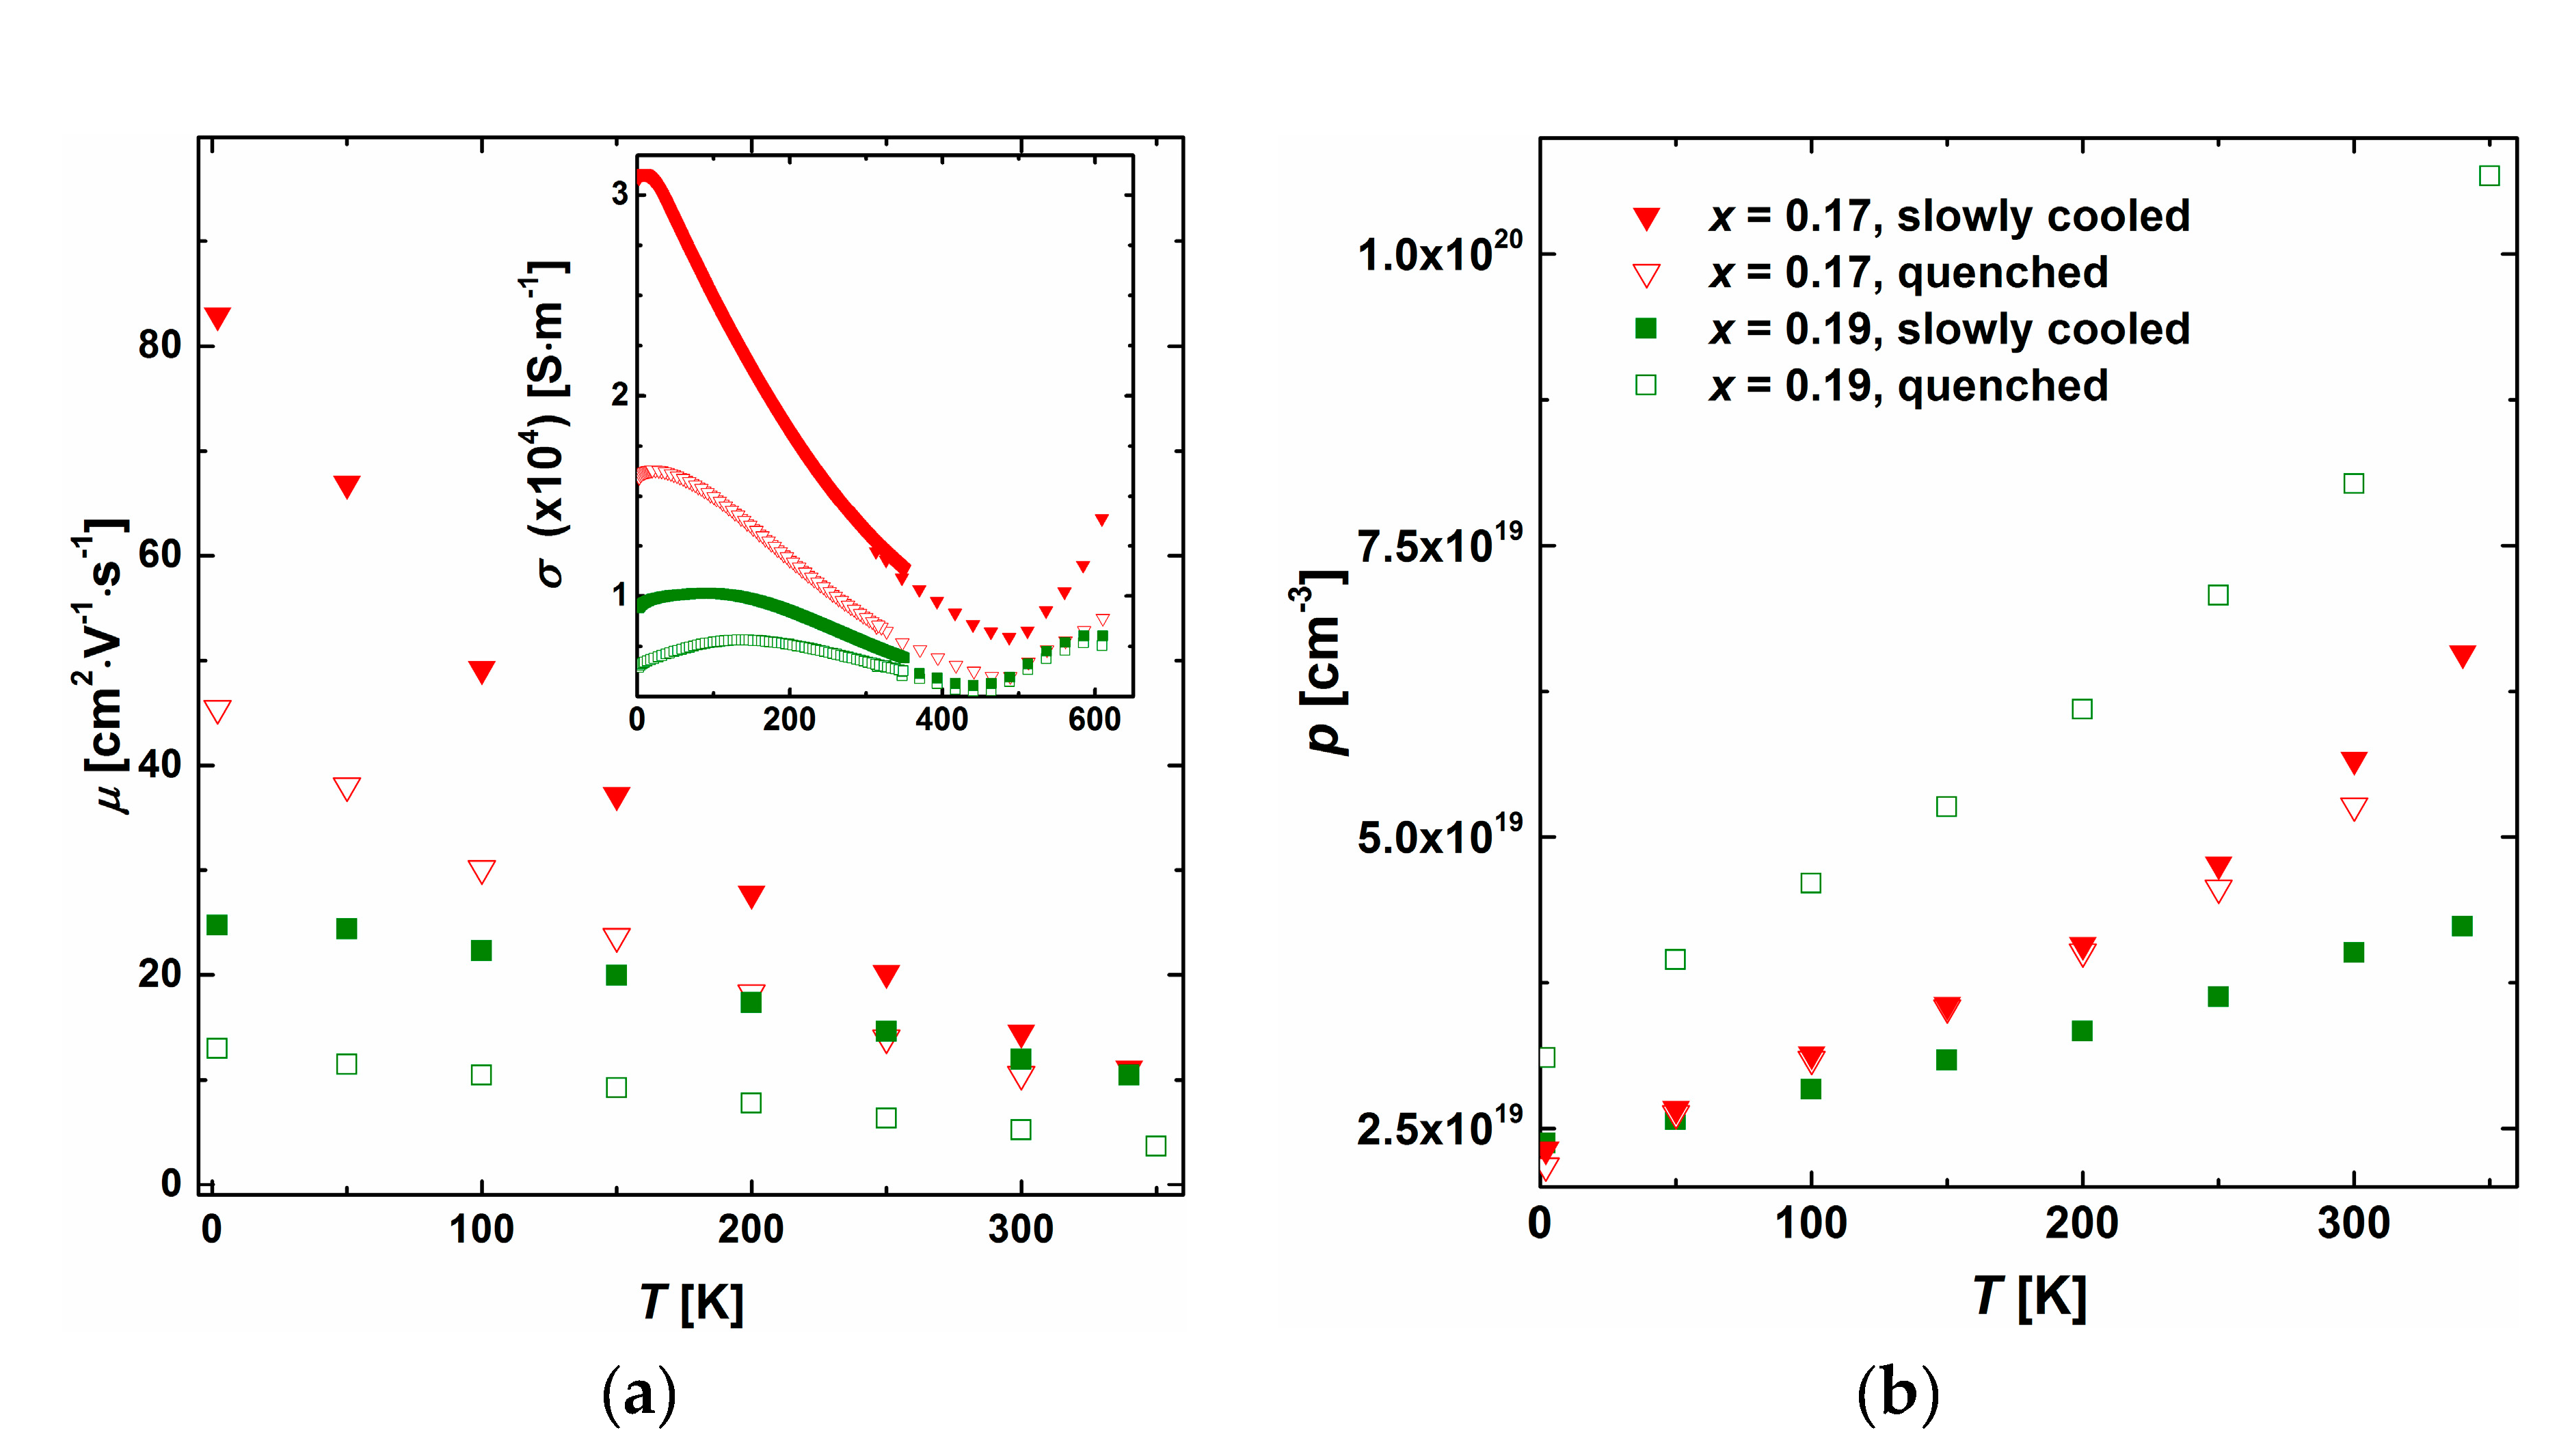
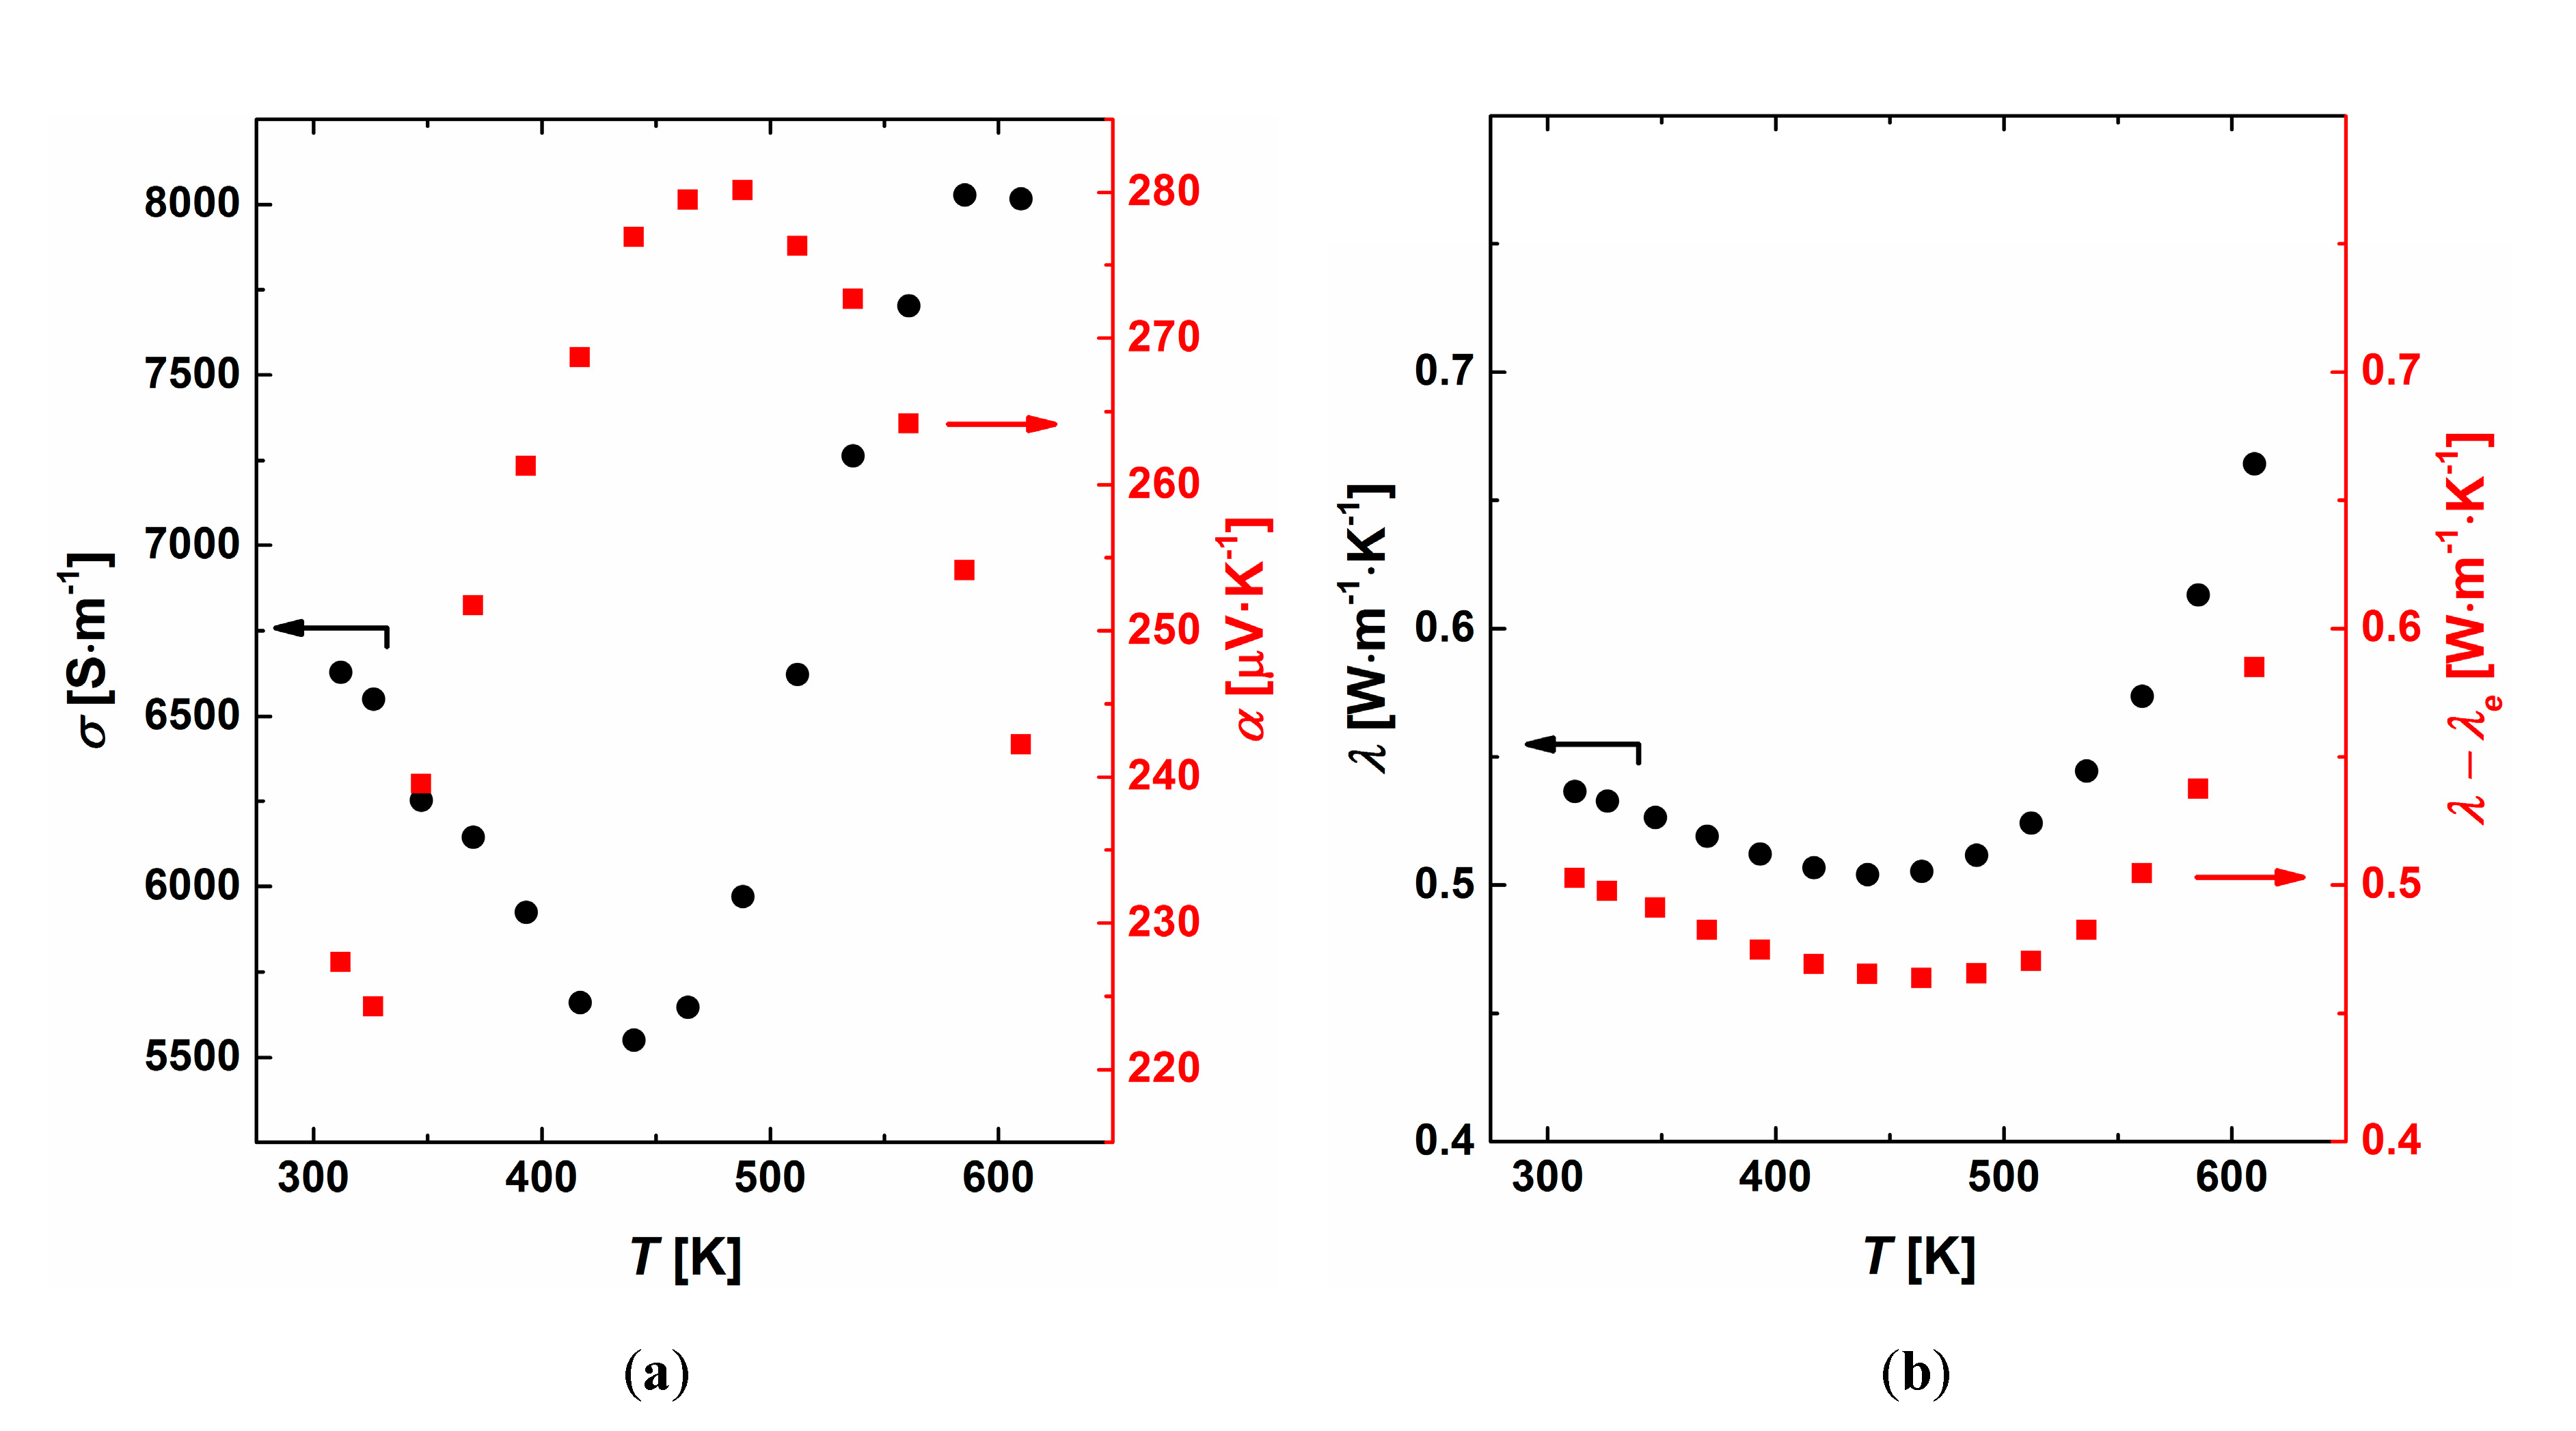
3.4. Intrinsic Properties of the β Phase (Ag0.81Sb2.19Te2.19)

As it was shown in previous paragraphs, the majority of Ag1−xSb1+xTe2+x alloys are multi-phase. Thus, measured physical properties reflect the intrinsic properties of the β phase, defect arrangement and the impurity phases. That is why it is not reasonable to present the dependence of TE properties versus lattice parameter or chemical composition. Intrinsic properties of the β phase were described for the quenched alloy with x = 0.19 only. No secondary phases were detected in this sample, within the precision of PXRD (Figure 9a) or SEM analysis (Figure 9b).
Electrical conductivity, Seebeck coefficient and total thermal conductivity in the temperature range of 300–610 K equal 5.5 × 10³ − 8 × 10³ S·m, 220–280 μV∙K−1 and 0.55–0.65 W·m−1·K−1, respectively (Figure 10a,b). The dependences σ(T). α(T) and λ(T) show extrema, suggesting ambipolar conduction to be an intrinsic property of the β phase. Charge carrier concentration is increasing from 3 × 10¹⁹ to 1 × 10²⁰ at low temperatures (3–350 K, Figure 6b). Lattice contribution (together with ambipolar part) to thermal conductivity is higher than 90% of total λ, showing that phonon propagation processes limit the conduction of heat in the β phase (Figure 10b). The highest ZTmax value equals 0.4 at 550 K (Figure 8).

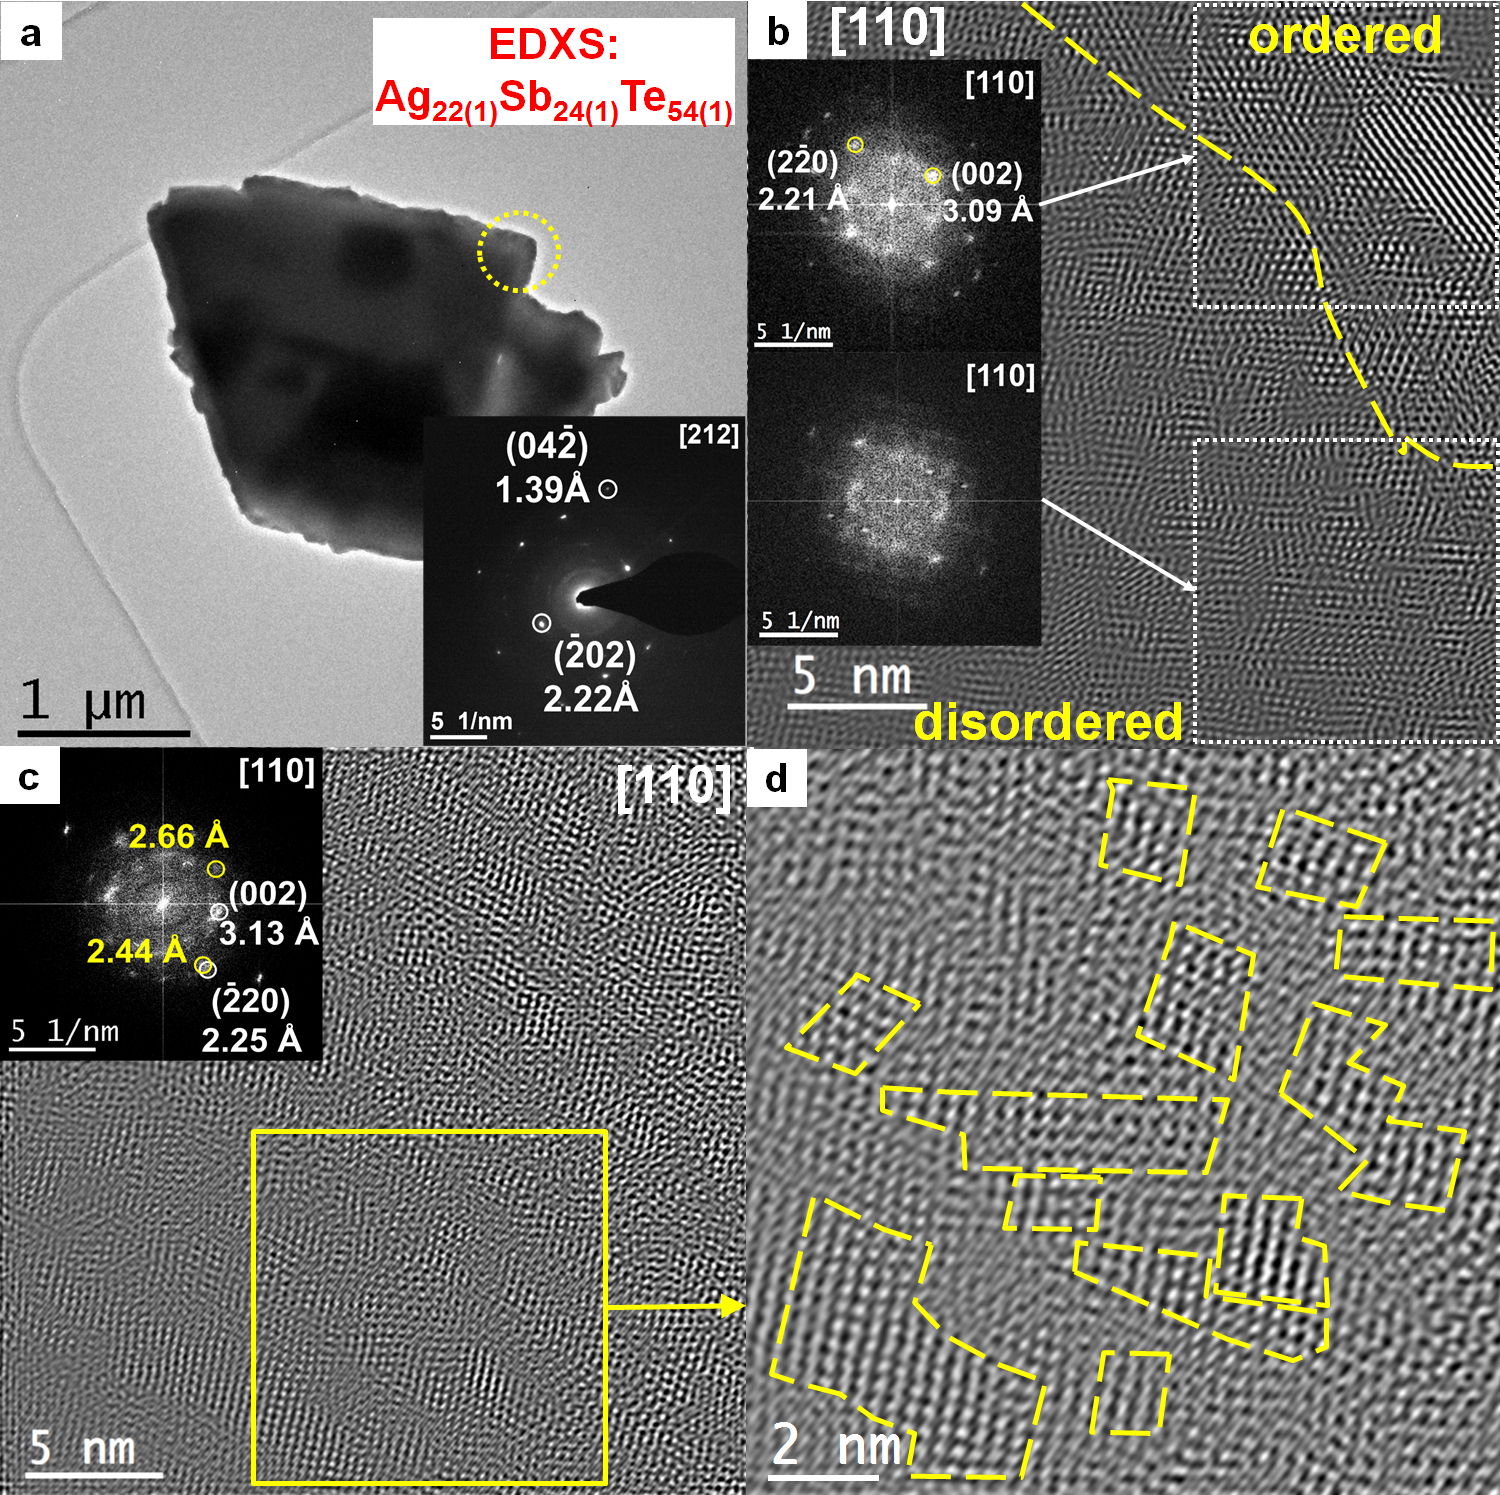
3.5. Nanostructure of the β Phase (Ag0.81Sb1.19Te2.19)

Nanostructure usually affects electronic transport properties of TE materials [34]. In the case of Ag-Sb-Te-based alloys, the presence of point and linear defects, together with different nanodomains, are believed to effectively suppress thermal conductivity to theoretically minimal values [9,15,25].
In this study, we performed a thorough analysis of a quenched Ag0.81Sb1.19Te2.19 alloy (x = 0.19), by means of transmission electron microscopy (TEM) and selected area electron diffraction (SAED). As mentioned in the previous paragraph, the influence of a possible impurity phase on the nanostructure of this sample is minimal if any. We present, in detail, two representative particles: particle I (Figure 11a–d and Figure S6) and particle II (Figure 12a–d) with ~0.5 μm and ~2 μm size, respectively. SAED pattern ([110] zone axis) for the whole particle I consists of sharp reflections that belong to the NaCl structure type only (inset in Figure 11a). Interplanar distances for (220) and (002) planes are in good agreement with values refined from PXRD data for Ag0.81Sb1.19Te2.19 (2.15 Å and 3.04 Å respectively). Under higher magnification (~ 40 × 40 nm field of view), well-ordered structure is visible with sharp reflections in the fast Fourier transform (FFT) pattern and correct interplanar distances (Figure S6). The well-ordered atomic arrangement within (110) plane is presented in detail in the high-resolution (HRTEM) image (Figure 11b) and is compared to the NaCl type structure model. The lattice parameter is in agreement (within the experimental error) with PXRD data. Interestingly, the chemical composition of particle I is Ag23(1)Sb28(1)Te49(1), according to EDXS analysis, and reveals a small excess of Ag, compared to the nominal composition Ag19Sb29Te52. The FFT pattern from some regions of particle I contains additional reflections indicating doubling of the unit cell along [111] direction (Inset in Figure 11c). The doubling effect is clearly visible in Bragg-filtered IFFT image composed only from additional reflections along [111] direction (Figure 11d). Irregular nanodomains with well-ordered atomic arrangement (marked with dashed lines in Figure 11d) are surrounded by distorted regions. It is similar to the previously predicted and observed segregation of Ag/Sb atoms to alternating (111) planes [9,18]. However, such forbidden reflections can also be visible due to multiple scattering processes during TEM observations.
Particle II shows a gradual increase in the level of atomic disorder. Sharp reflections of NaCl type structure are becoming diffuse, while increasing magnification from the entire particle II to smaller regions (Figure 12a–c). Two scenarios were observed: (i) intermediate state with co-existence of large well-ordered and disordered regions (Figure 12b). FFT patterns ([110] zone axis), from both regions, comprise diffuse NaCl type reflections (insets in Figure 12b). (ii) Mosaic pattern with alternating ordered and disordered nanodomains (~2–5 nm) (Figure 12c,d). Additional reflections are distinguishable for the disordered region (yellow circles in FFT in Figure 12c), caused by similar orientation of nanograins with disturbed crystal lattices. Interplanar distances are larger than the theoretical values for the cubic structure, particularly in the disordered domains (inset FFT in Figure 12c). An average chemical composition of particle II is Ag22(1)Sb24(1)Te54(1), according to EDXS. Excess of Ag and deficiency of Sb was observed, in respect to the nominal composition Ag19Sb29Te52.
It seems that the synthesis conditions prevent equilibration of the β phase and obtained materials consist of grains with deviated composition. The co-existence of the well-ordered and the disordered nanodomains together with the variation in the chemical composition have a strong influence on the formation of the particular nanostructure that is very favorable for phonon scattering and minimization of lattice thermal conductivity [9,36].

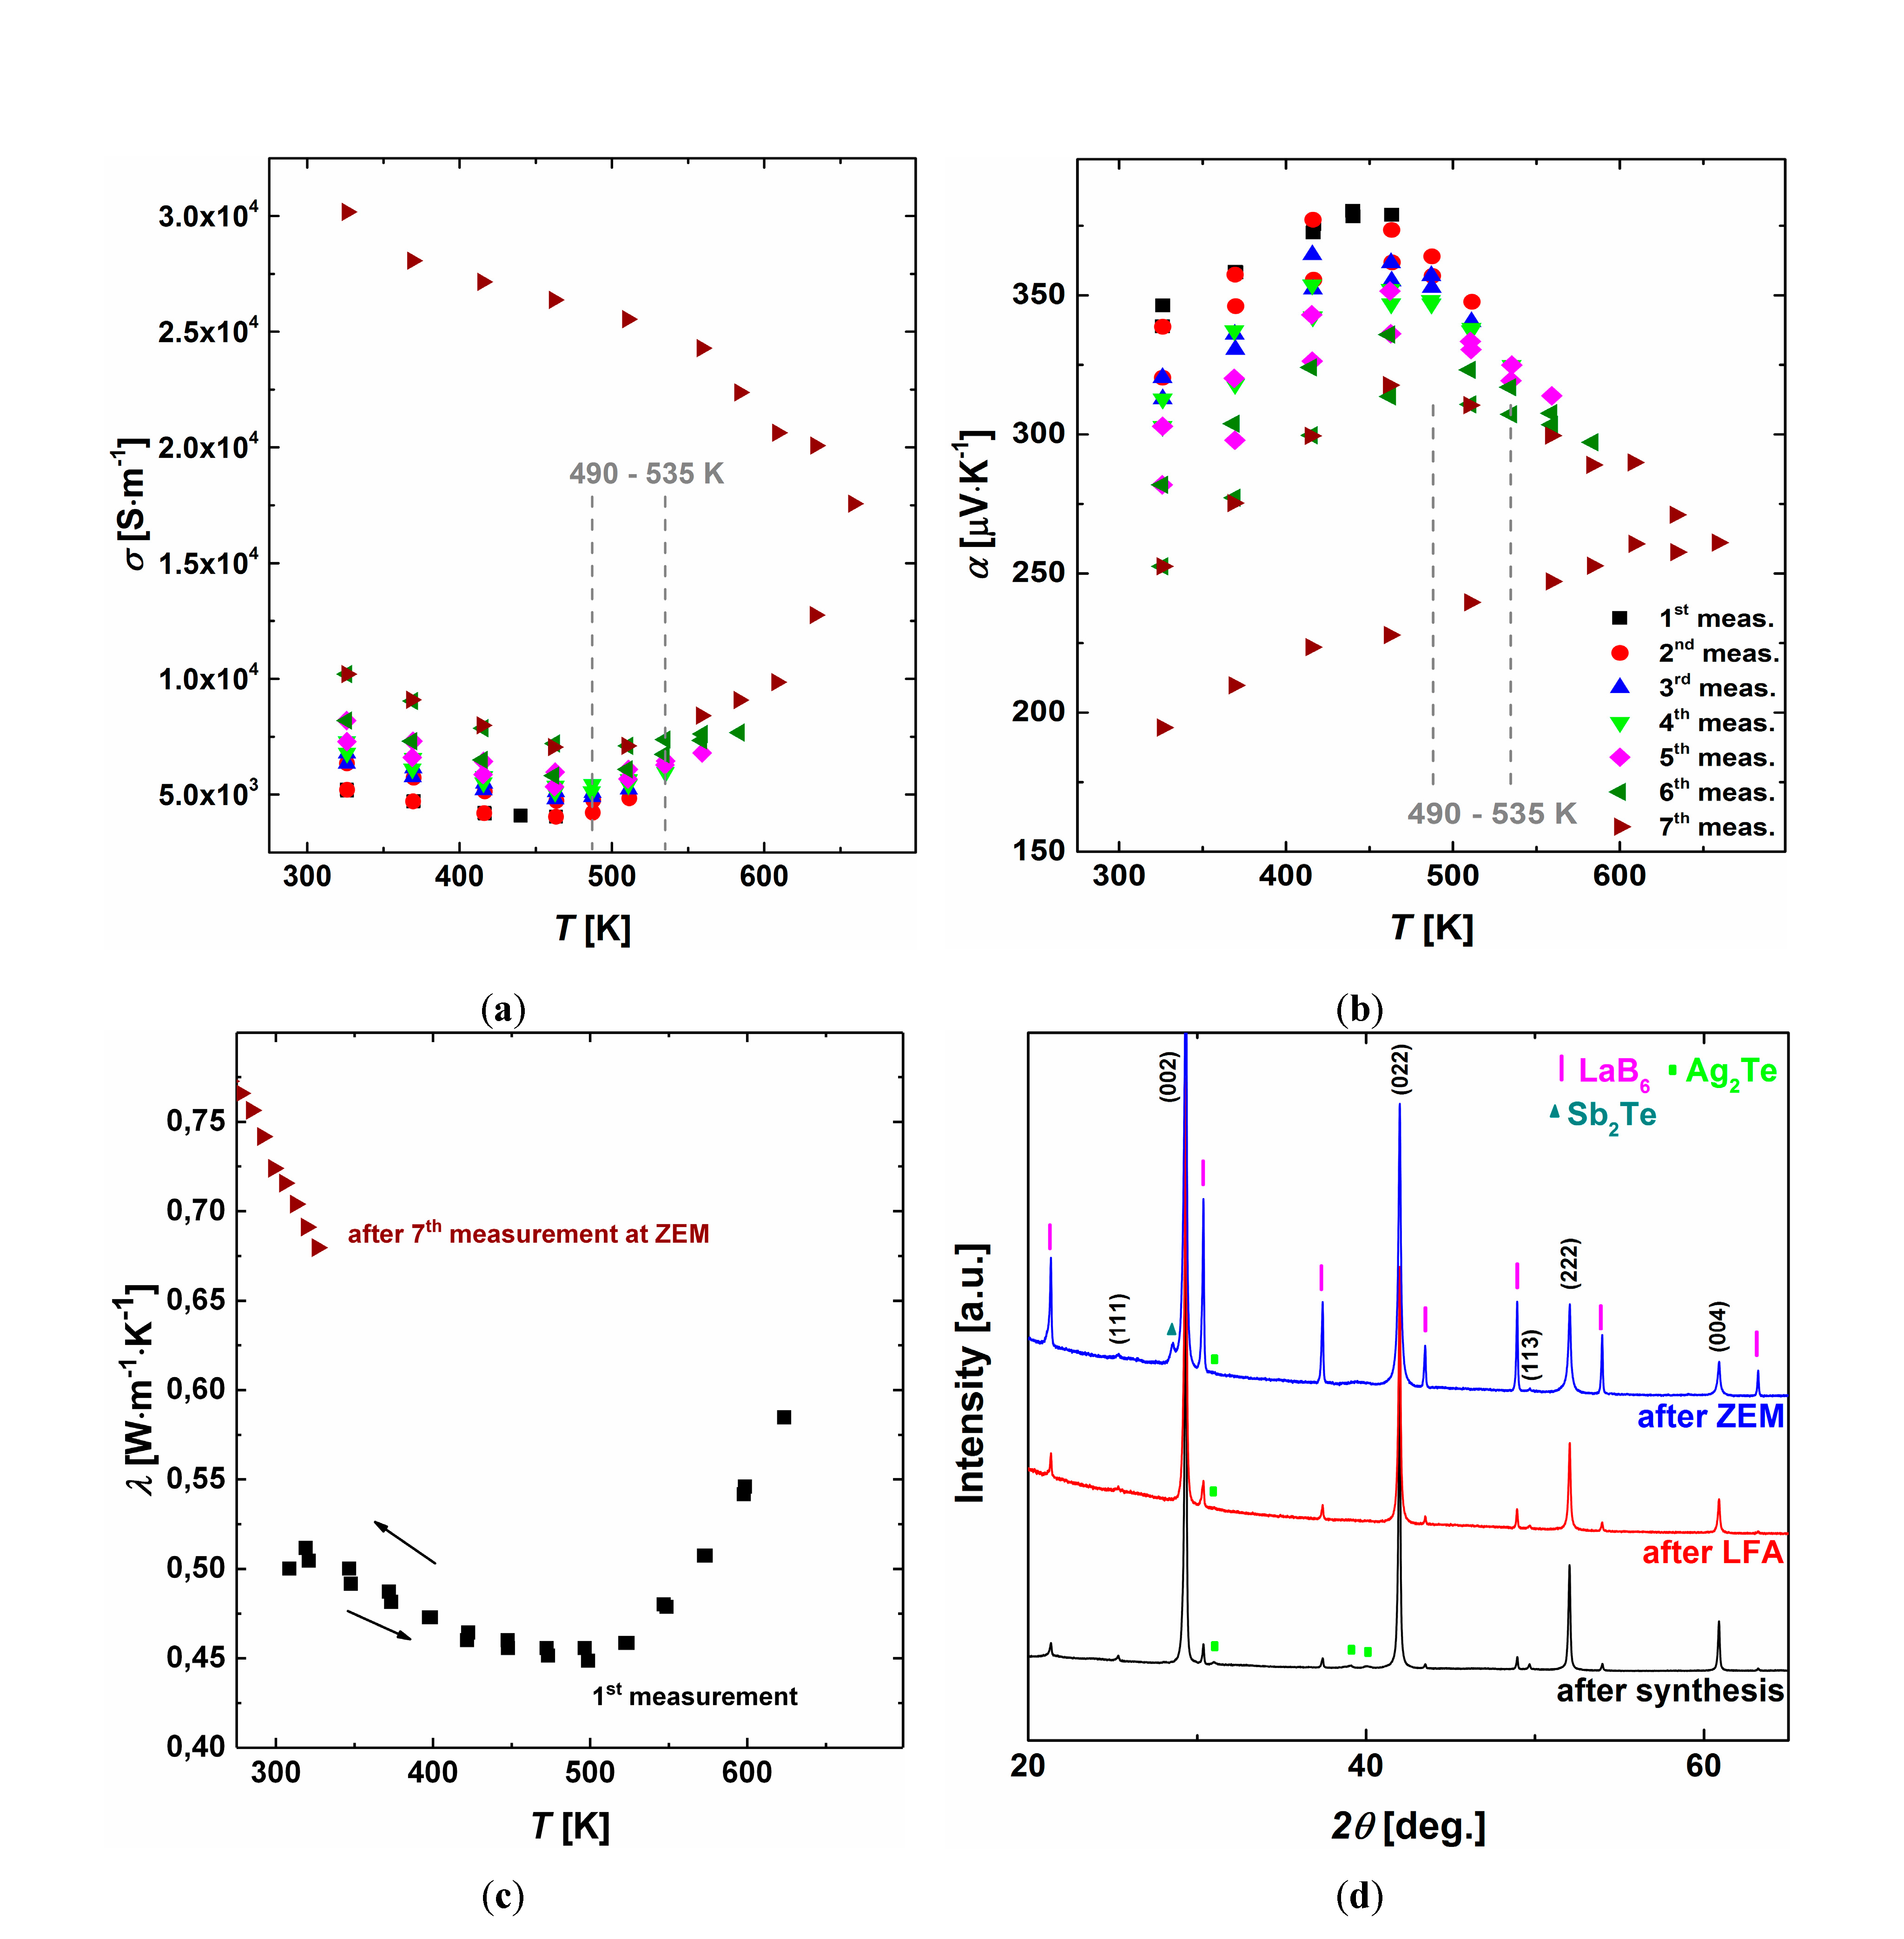
3.6. Thermodynamic Stability

The eutectoid decomposition of the β phase below 633 K significantly affects TE properties of Ag1−xSb1+xTe2+x alloys [12]. One representative quenched alloy, x = 0.1, was chosen to show the degradation during the physical measurements below the formation/decomposition temperature of the β phase (Figure 13). Electrical conductivity values are reproducible up to 490 K (black squares in figure caption) and then monotonously increasing during the following measurements (heating-cooling part), from 5 × 10³ to 30 × 103 S·m−1 at 310 K (Figure 13a). The gradual decrease of the Seebeck coefficient is visible, from 346 to 195 μV∙K−1 at 310 K (Figure 13b). It is a result of the formation of Sb-Te impurities (Figure 13d), which strongly influence the TE properties of Ag-Sb-Te alloys (compare Figure 5, Figure 6, Figure 7 and Figure 8). A slight increase in thermal conductivity was observed below 530 K even after one measurement cycle (Figure 13c). After the 7th measurement at the ZEM apparatus, λ increases by 35%, reaching 0.67 W·m−1·K−1 at RT. The discrepancies between subsequent measurements become notable in the range of 490–535 K. It leads to the conclusion that the decomposition rate of the β phase increases significantly at about 100–140 K below the decomposition temperature. Interestingly, ZT parameter at RT after seven measurements remains unchanged, due to significant increase of σ. All studied Ag1−xSb1+xTe2+x alloys (x = 0; 0.1; 0.17, 0.19, 0.3, 0.4) reveal presented behavior. Considering TE properties only, the experiment leads to the conclusion that Ag-Sb-Te-based materials could be utilized in TE devices working up to 490 K.

4. Conclusions

Two series of Ag1−xSb1+xTe2+x samples (x = 0; 0.1; 0.17; 0.19; 0.3; 0.4) were synthesized utilizing slow cooling and quenching. All obtained materials reveal p-type conductivity with a metal-like temperature dependence of the electrical conductivity up to 500 K. Their TE properties strongly depend on the concentration of secondary phases and features of the microstructure. A higher cooling rate suppressed crystallization of secondary phases and enabled to obtain single-phase material only with x = 0.19. Due to the decrease in solidification time, the quenching procedure disrupts the formation of microstructures improving TE properties. Therefore, we regard Ag1−xSb1+xTe2+x alloys as: (i) the multi-phase materials and (ii) the materials with TE properties resulting from the combination of intrinsic properties of the β phase (e.g., x = 0.19) and minority phases. High level of disorder in nanoscale in the β phase was observed in TEM, including mosaic patterns and disorientation of grains. It plays an important role in the reduction of lattice thermal conductivity. Slowly cooled alloys with x = 0.1 and x = 0.17 exhibit the highest TE performance, showing ZT values of 1.2 and 1.1 at 610 K, respectively. It is clear that high ZT values in Ag1−xSb1+xTe2+x alloys can also be obtained without extrinsic doping as reported previously [2,3,4,5,6]. All samples reveal lack of long-term stability, which causes degradation of the β phase and the TE performance, in agreement with the phase diagram of the Ag-Sb-Te system. However, TE properties are reproducible up to 490 K due to kinetic hindering of the eutectoid decomposition of the β phase. Ag1−xSb1+xTe2+x alloys show more favorable TE properties than alloys with a nominal composition Ag1.0Sb1.0Te2.0. To utilize them, the suppression of the eutectoid decomposition is needed, probably by chemical substitution.

Supplementary Materials

The following are available online at https://www.mdpi.com/2076-3417/8/1/52/s1, Figure S1: (a) TG-DTA analysis of slowly cooled Ag1.0Sb1.0Te2.0 and (b) DTA analysis of slowly-cooled Ag0.81Sb1.19Te2.19 samples; Table S1: Thermal effects observed in DTA curves with corresponding reactions; Figure S2: Optical micrographs of Ag0.6Sb1.4Te2.4 and Ag0.81Sb1.19Te2.19 samples; Figures S3 and S4: Backscattered-electron (BSE) images of the Ag1−xSb1+xTe2+x samples; Figure S5: Real element concentration of: (a) Ag, (b) Sb, (c) Te as a function of nominal concentration in the Ag1−xSb1+xTe2+x samples; Figure S6: HRTEM image of particle I of Ag19Sb29Te52 sample (x = 0.19).

Acknowledgments

The authors thank members of competence group Structure (MPI CPfS) for PXRD analysis, Markus Schmidt (MPI CPfS) for TG-DSC measurements, Gudrun Auffermann (MPI CPfS) for chemical analysis and Matej Bobnar for low-temperature thermoelectric measurements. This work was partially supported by the funds of National Science Center Poland granted on the basis of the decision No. DEC-2013/09/B/ST8/02043.

Author Contributions

Krzysztof T. Wojciechowski and Yuri Grin initiated the idea of the research. Paweł Wyżga and Igor Veremchuk performed synthesis, measurements of transport properties and evaluation of data. Ulrich Burkhardt analyzed the microstructure. Paul Simon performed the TEM studies. Paweł Wyżga prepared manuscript.

Conflicts of Interest

The authors declare no conflict of interest.

References

  1. Tritt, T.M. Thermoelectric phenomena, materials, and applications. Annu. Rev. Mater. Res. 2011, 41, 433–448. [Google Scholar] [CrossRef]
  2. Roychowdhury, S.; Panigrahi, R.; Perumal, S.; Biswas, K. Ultrahigh thermoelectric figure of merit and enhanced mechanical stability of p-type AgSb1−xZnxTe2. ACS Energy Lett. 2017, 2, 349–356. [Google Scholar] [CrossRef]
  3. Schmidt, M.; Wojciechowski, K.T. Reinvestigation of the influence of Se impurity on the structural and thermoelectric properties of AgSbTe2. AIP Conf. Proc. 2012, 1449, 175–178. [Google Scholar] [CrossRef]
  4. Du, B.; Li, H.; Xu, J.; Tang, X.; Uher, C. Enhanced figure-of-merit in Se-doped p-type AgSbTe2 thermoelectric compound. Chem. Mater. 2010, 22, 5521–5527. [Google Scholar] [CrossRef]
  5. Wu, H.J.; Lan, T.W.; Chen, S.W.; Chen, Y.Y.; Day, T.; Snyder, G.J. State of the art Ag50−xSbxSe50−yTey alloys: Their high ZT values, microstructures and related phase equilibria. Acta Mater. 2015, 93, 38–45. [Google Scholar] [CrossRef]
  6. Mohanraman, R.; Sankar, R.; Boopathi, K.M.; Chou, F.C.; Chu, C.W.; Lee, C.H.; Chen, Y.-Y. Influence of In doping on the thermoelectric properties of an AgSbTe2 compound with enhanced figure of merit. J. Mater. Chem. A 2014, 2, 2839–2844. [Google Scholar] [CrossRef]
  7. Morelli, D.T.; Jovovic, V.; Heremans, J.P. Intrinsically minimal thermal conductivity in cubic I-V-VI2 semiconductors. Phys. Rev. Lett. 2008, 101, 035901. [Google Scholar] [CrossRef] [PubMed]
  8. Du, B.; Chen, K.; Yan, H.; Reece, M.J. Efficacy of lone-pair electrons to engender ultralow thermal conductivity. Scr. Mater. 2016, 111, 49–53. [Google Scholar] [CrossRef]
  9. Ma, J.; Delaire, O.; May, A.F.; Carlton, C.E.; Mcguire, M.A.; VanBebber, L.H.; Abernathy, D.L.; Ehlers, G.; Hong, T.; Huq, A.; et al. Glass-like phonon scattering from a spontaneous nanostructure in AgSbTe2. Nat. Nanotechnol. 2013, 8, 445–451. [Google Scholar] [CrossRef] [PubMed]
  10. Petzow, G.; Effenberg, G. Ternary Alloys: A Comprehensive Compendium of Evaluated Constitutional Data and Phase Diagrams; Wileys-VCH Verlag: Weinheim, Germany, 1998; pp. 552–554. ISBN 3-527-26967-3. [Google Scholar]
  11. Wu, H.J.; Chen, S.W. Phase equilibria of Ag-Sb-Te thermoelec tric materials. Acta Mater. 2011, 59, 6463–6472. [Google Scholar] [CrossRef]
  12. Wyzga, P.M.; Wojciechowski, K.T. Analysis of the influence of thermal treatment on the stability of Ag1-xSb1+xTe2+x and Se-doped AgSbTe2. J. Electron. Mater. 2016, 45, 1548–1554. [Google Scholar] [CrossRef]
  13. Wernick, J.H.; Benson, K.E. New semiconducting ternary compounds. J. Phys. Chem. Solids 1957, 3, 157–159. [Google Scholar] [CrossRef]
  14. Geller, S.; Wernick, J.H. Ternary semiconducting compounds with sodium chloride-like structure: AgSbSe2, AgSbTe2, AgBiS2, AgBiSe2. Acta Crystallogr. 1959, 12, 46–54. [Google Scholar] [CrossRef]
  15. Quarez, E.; Hsu, K.F.; Pcionek, R.; Frangis, N.; Polychroniadis, E.K.; Kanatzidis, M.G. Nanostructuring, compositional fluctuations, and atomic ordering in the thermoelectric materials AgPbmSbTe2+m. The myth of solid solutions. J. Am. Chem. Soc. 2005, 127, 9177–9190. [Google Scholar] [CrossRef] [PubMed]
  16. Wojciechowski, K.; Toboła, J.; Schmidt, M.; Zybała, R. Structural and thermoelectric properties of AgSbSe2 and AgSbTe2. In Proceedings of the 5th European Conference on Thermoelectrics (ECT2007), Odessa, Ukraine, 10–12 September 2007. [Google Scholar]
  17. Rezaei, N.; Hashemifar, S.J.; Akbarzadeh, H. Thermoelectric properties of AgSbTe2 from first-principles calculations. J. Appl. Phys. 2014, 116, 103705. [Google Scholar] [CrossRef]
  18. Hoang, K.; Mahanti, S.D.; Salvador, J.R.; Kanatzidis, M.G. Atomic ordering and gap formation in Ag-Sb-based ternary chalcogenides. Phys. Rev. Lett. 2007, 99, 156403. [Google Scholar] [CrossRef] [PubMed]
  19. Marin-Ayral, R.M.; Legendre, B.; Brun, G.; Liautard, B.; Tedenac, J.C. The ternary system silver-antimony-tellurium. Study of the subternary Sb2Te3-Ag2Te-Te. Thermochim. Acta 1988, 131, 37–45. [Google Scholar] [CrossRef]
  20. Wojciechowski, K.T.; Schmidt, M. Structural and thermoelectric properties of AgSbTe2-AgSbSe2 pseudobinary system. Phys. Rev. B 2009, 79, 184202. [Google Scholar] [CrossRef]
  21. Du, B.; Yan, Y.; Tang, X. Variable-temperature in situ X-ray diffraction study of the thermodynamic evolution of AgSbTe2 thermoelectric compound. J. Electron. Mater. 2015, 44, 2118–2123. [Google Scholar] [CrossRef]
  22. Aspiala, M.; Taskinen, P. Thermodynamic study of the Ag-Sb-Te system with an advanced EMF method. J. Chem. Thermodyn. 2016, 93, 261–266. [Google Scholar] [CrossRef]
  23. Armstrong, R.W.; Faust, J.W., Jr.; Tiller, W.A. A structural study of the compound AgSbTe2. J. Appl. Phys. 1960, 31, 1954–1959. [Google Scholar] [CrossRef]
  24. Matsushita, H.; Hagiwara, E.; Katsui, A. Phase diagram and thermoelectric properties of Ag3−xSb1+xTe4 system. J. Mater. Sci. 2004, 39, 6299–6301. [Google Scholar] [CrossRef]
  25. Zhang, S.N.; Zhu, T.J.; Yang, S.H.; Yu, C.; Zhao, X.B. Phase compositions, nanoscale microstructures and thermoelectric properties in Ag2−ySbyTe1+y alloys with precipitated Sb2Te3 plates. Acta Mater. 2010, 58, 4160–4169. [Google Scholar] [CrossRef]
  26. Nielsen, M.D.; Jaworski, C.M.; Heremans, J.P. Off-stoichiometric silver antimony telluride: An experimental study of transport properties with intrinsic and extrinsic doping. AIP Adv. 2015, 5, 053602. [Google Scholar] [CrossRef]
  27. Jovovic, V.; Heremans, J.P. Measurements of the energy band gap and valence band structure of AgSbTe2. Phys. Rev. B 2008, 77, 245204. [Google Scholar] [CrossRef]
  28. Jung, H.; Park, H.; Choa, Y.; Myung, N.V. Composition-dependent electrical properties of ternary AgxSb1−xTey thin films synthesized by cationic exchange reaction. Electron. Mater. Lett. 2012, 8, 219–224. [Google Scholar] [CrossRef]
  29. Akselrud, L.; Grin, Y. WinCSD: Software package for crystallographic calculations (Version 4). J. Appl. Crystallogr. 2014, 47, 803–805. [Google Scholar] [CrossRef]
  30. Max-Planck-Institut für Chemische Physik fester Stoffe. Scientific Report 2006–2008; Max-Planck-Institut für Chemische Physik Fester Stoffe: Dresden, Germany, 2009. [Google Scholar]
  31. Karakaya, I.; Thompson, W.T. The Ag-Te (silver-tellurium) system. J. Phase Equilib. 1991, 12, 56–63. [Google Scholar] [CrossRef]
  32. Cojocaru-Miredin, O.; Abdellaoui, L.; Nagli, M.; Zhang, S.; Yu, Y.; Scheu, C.; Raabe, D.; Wuttig, M.; Amouyal, Y. Role of nanostructuring and microstructuring in silver antimony telluride compounds for thermoelectric applications. ACS Appl. Matter. Interfaces 2017, 9, 14779–14790. [Google Scholar] [CrossRef] [PubMed]
  33. Roy, B.; Chakraborty, B.R.; Bhattacharya, R.; Dutta, A.K. Electrical and magnetic properties of antimony telluride. Solid State Commun. 1978, 25, 617–620. [Google Scholar] [CrossRef]
  34. Goldsmid, H.J. Introduction to Thermoelectricity, 1st ed.; Springer: Berlin/Heidelberg, Germany, 2010; p. 203. ISBN 978-3-642-00715-6. [Google Scholar]
  35. Ragimov, S.S.; Aliev, S.A. α → β phase transition of Ag2Te in the AgSbTe2 alloy of the Ag-Sb-Te system. Inorg. Mater. 2007, 43, 1184–1186. [Google Scholar] [CrossRef]
  36. Biswas, K.; He, J.; Blum, I.D.; Wu, C.I.; Hogan, T.P.; Seidman, D.N.; Dravid, V.P.; Kanatzidis, M.G. High-performance bulk thermoelectrics with all-scale hierarchical architectures. Nature 2012, 489, 414–418. [Google Scholar] [CrossRef] [PubMed]
Figure 1. Part of the phase diagram of the Sb2Te3–Ag2Te pseudobinary system based on data of [10]. Dashed lines indicate the nominal compositions x of synthesized samples Ag1−xSb1+xTe2+x; α—solid solution of Ag in Sb2Te3, β—Ag1−xSb1+xTe2+x (0.08 < x < 0.41), ε—solid solution of Sb in Ag2Te.
Applsci 08 00052 g001
Figure 2. Powder XRD patterns of slowly cooled Ag1−xSb1+xTe2+x samples. For comparison, patterns of samples with x = 0.17 and 0.19 after quenching are shown in the bottom; LaB6 was used as an internal standard.
Applsci 08 00052 g002
Figure 3. Lattice parameters of the β phase as a function of nominal composition.
Applsci 08 00052 g003
Figure 4. Optical polarized light (bd) and bright field (a,e,f) micrographs of: (a,b) x = 0.4, (c,d) x = 0.17 and (e,f) x = 0.1 alloys; quenched samples—(a,c,e) and slowly cooled samples—(b,d,f). Chemical compositions of phases are given according to EDXS analysis.
Applsci 08 00052 g004
Figure 5. Temperature dependence of (a) electrical conductivity and (b) Seebeck coefficient of slowly cooled Ag1−xSb1+xTe2+x samples (filled symbols). For comparison, data of three quenched samples are presented with open symbols (x = 0.4—circles, x = 0.19—squares, x = 0.17—triangles).
Applsci 08 00052 g005
Figure 6. Temperature dependence of (a) charge carrier mobility and (b) charge carrier concentration for x = 0.17 (triangles), 0.19 (squares); inset in (a) presents temperature dependence of electrical conductivity in the range of 2–610 K; filled symbols—slowly cooled samples, open symbols—quenched samples.
Applsci 08 00052 g006
Figure 7. Temperature dependence of (a) total thermal conductivity and (b) its lattice contribution for slowly cooled Ag1−xSb1+xTe2+x samples (filled symbols); for comparison, data of three quenched samples are presented with open symbols (x = 0.4—circles, x = 0.19—squares, x = 0.17—triangles).
Applsci 08 00052 g007
Figure 8. Temperature dependence of the figure of merit ZT for slowly cooled Ag1−xSb1+xTe2+x samples (filled symbols); for comparison, data of three quenched samples are presented with open symbols (x = 0.4—circles, x = 0.19—squares, x = 0.17—triangles).
Applsci 08 00052 g008
Figure 9. PXRD and microstructure characterization of the quenched sample with x = 0.19: (a) Powder XRD pattern; LaB6 was used as an internal standard; inset: optical polarized light micrograph; (b) Backscattered-electron (BSE) image with chemical composition according to EDXS analysis.
Applsci 08 00052 g009
Figure 10. Thermoelectric properties of the quenched x = 0.19 sample as a function of temperature: (a) Electrical conductivity and Seebeck coefficient; (b) Total thermal conductivity and its lattice contribution.
Applsci 08 00052 g010
Figure 11. TEM analysis for particle I of quenched Ag19Sb29Te52 sample (x = 0.19): (a) Particle I together with chemical composition according to EDXS analysis. Inset: an SAED pattern from the whole particle I. Doubling of each reflection is the result of rotated second crystal below; (b) HRTEM image of a selected area within particle I (yellow dotted circle in Figure 11a) compared with unit cell cross section along [110] plane and lattice parameter refined from PXRD (inset); (c) FFT filtered HR image of another region of particle I. The FFT pattern contains additional reflections, with an interplanar distance of 7 Å, which indicate doubling of the unit cell along [111] direction (inset); (d) Bragg-filtered IFFT image composed only from additional reflections along [111] direction. Stripe pattern corresponds to crystallographic planes normal to [111] direction with period equals 7 Å.
Applsci 08 00052 g011
Figure 12. TEM analysis of particle II of quenched Ag19Sb29Te52 sample (x = 0.19): (a) Particle II together with chemical composition according to EDXS analysis. Inset: an SAED pattern from the whole particle I; (b) FFT filtered HR image of region 1 within particle II. It consists of disordered (mosaic) and ordered parts. Insets: FFT patterns ([110] zone axis), from both analyzed areas; (c) FFT filtered HR image of region 2 within particle II shows mosaic pattern only. Inset: FFT pattern from the whole region in Figure 12c; (d) Magnified HR image of area marked with the yellow square in Figure 12c. Well-ordered nanograins (marked with dashed lines) are surrounded by disordered domains.
Applsci 08 00052 g012
Figure 13. Thermoelectric and PXRD characterization of the quenched Ag0.9Sb1.1Te2.1 sample after sequential measurements: (a) Electrical conductivity; (b) Seebeck coefficient; (c) Thermal conductivity; (d) PXRD patterns.
Applsci 08 00052 g013
Table 1. Chemical composition of the β phase in Ag1−xSb1+xTe2+x alloys, according to EDXS analysis.
xNominal Composition (at. %)Composition of the β Phase according to EDXS (at. %)
After QuenchingAfter Slow CoolingAfter LFA
0.4Ag13.6Sb31.8Te54.6Ag15.6(2)Sb32.0(2)Te52.4(2)Ag17.9(3)Sb29.3(2)Te52.8(3)Ag16.6(8)Sb30.8(5)Te52.6(3)
0.3Ag16.3Sb30.2Te53.5Ag14.9(5)Sb31(1)Te54.1(9)Ag15.1(8)Sb31.4(5)Te53.5(3)Ag17.5(2)Sb29.7(1)Te52.8(2)
0.19Ag19.0Sb29.0Te52.0Ag18.9(2)Sb29.5(2)Te51.6(2)Ag18.8(3)Sb29.5(2)Te51.7(1)Ag18.2(6)Sb30.0(8)Te51.8(8)
0.17Ag20.0Sb28.0Te52.0Ag19.7(3)Sb28.9(3)Te51.4(3)Ag18.5(7)Sb29.3(3)Te52.2(4)Ag20.1(6)Sb28.2(4)Te51.8(2)
0.1Ag22.0Sb26.8Te51.2Ag20.0(1)Sb28.4(1)Te51.6(1)Ag20.8(2)Sb28.3(2)Te50.9(1)Ag18.3(4)Sb27.9(4)Te53.8(4)
0Ag25.0Sb25.0Te50.0Ag21.0(3)Sb28.0(3)Te51.0(2)Ag20.6(1)Sb28.2(3)Te51.2(2)Ag21.1(1)Sb27.8(3)Te51.1(3)

