Shear Wave Elastography Combining with Conventional Grey Scale Ultrasound Improves the Diagnostic Accuracy in Differentiating Benign and Malignant Thyroid Nodules

 , ,
, ,
Abstract
:1. Introduction
2. Materials and Methods
2.1. Subject Recruitment
2.2. Ultrasound Examination of Thyroid Gland
2.3. Data Analysis
3. Results
3.1. Histology Results
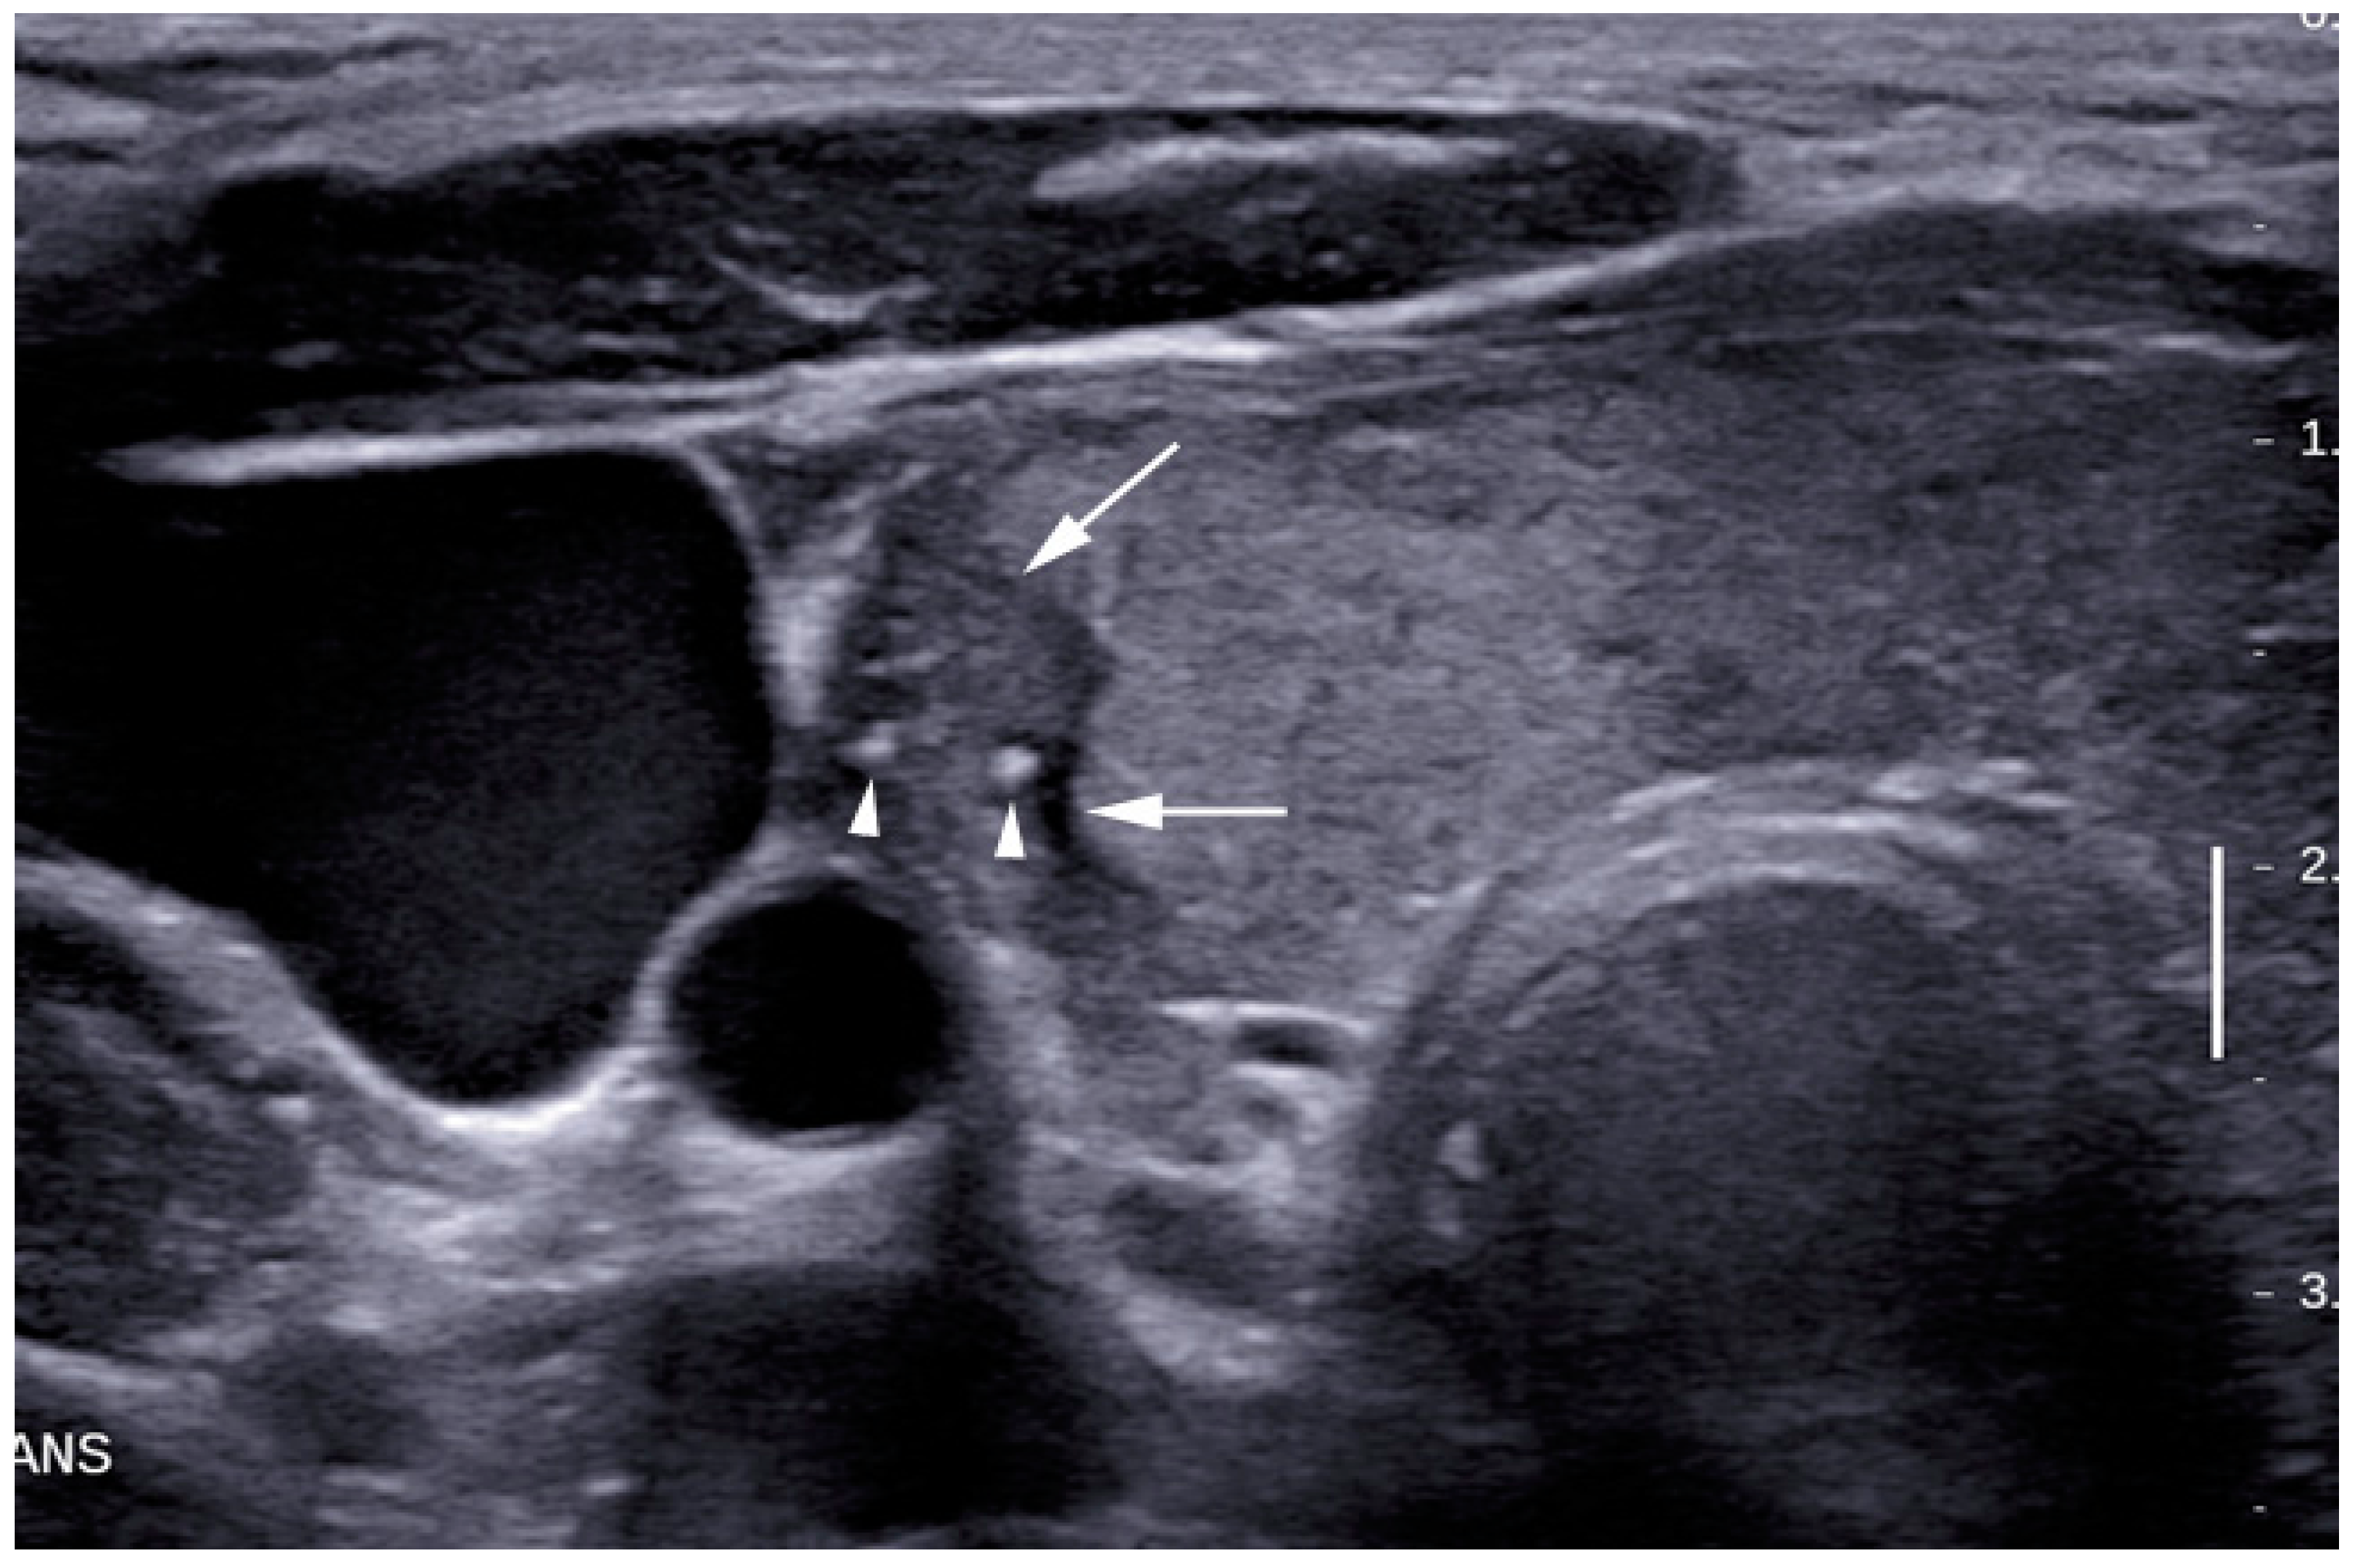
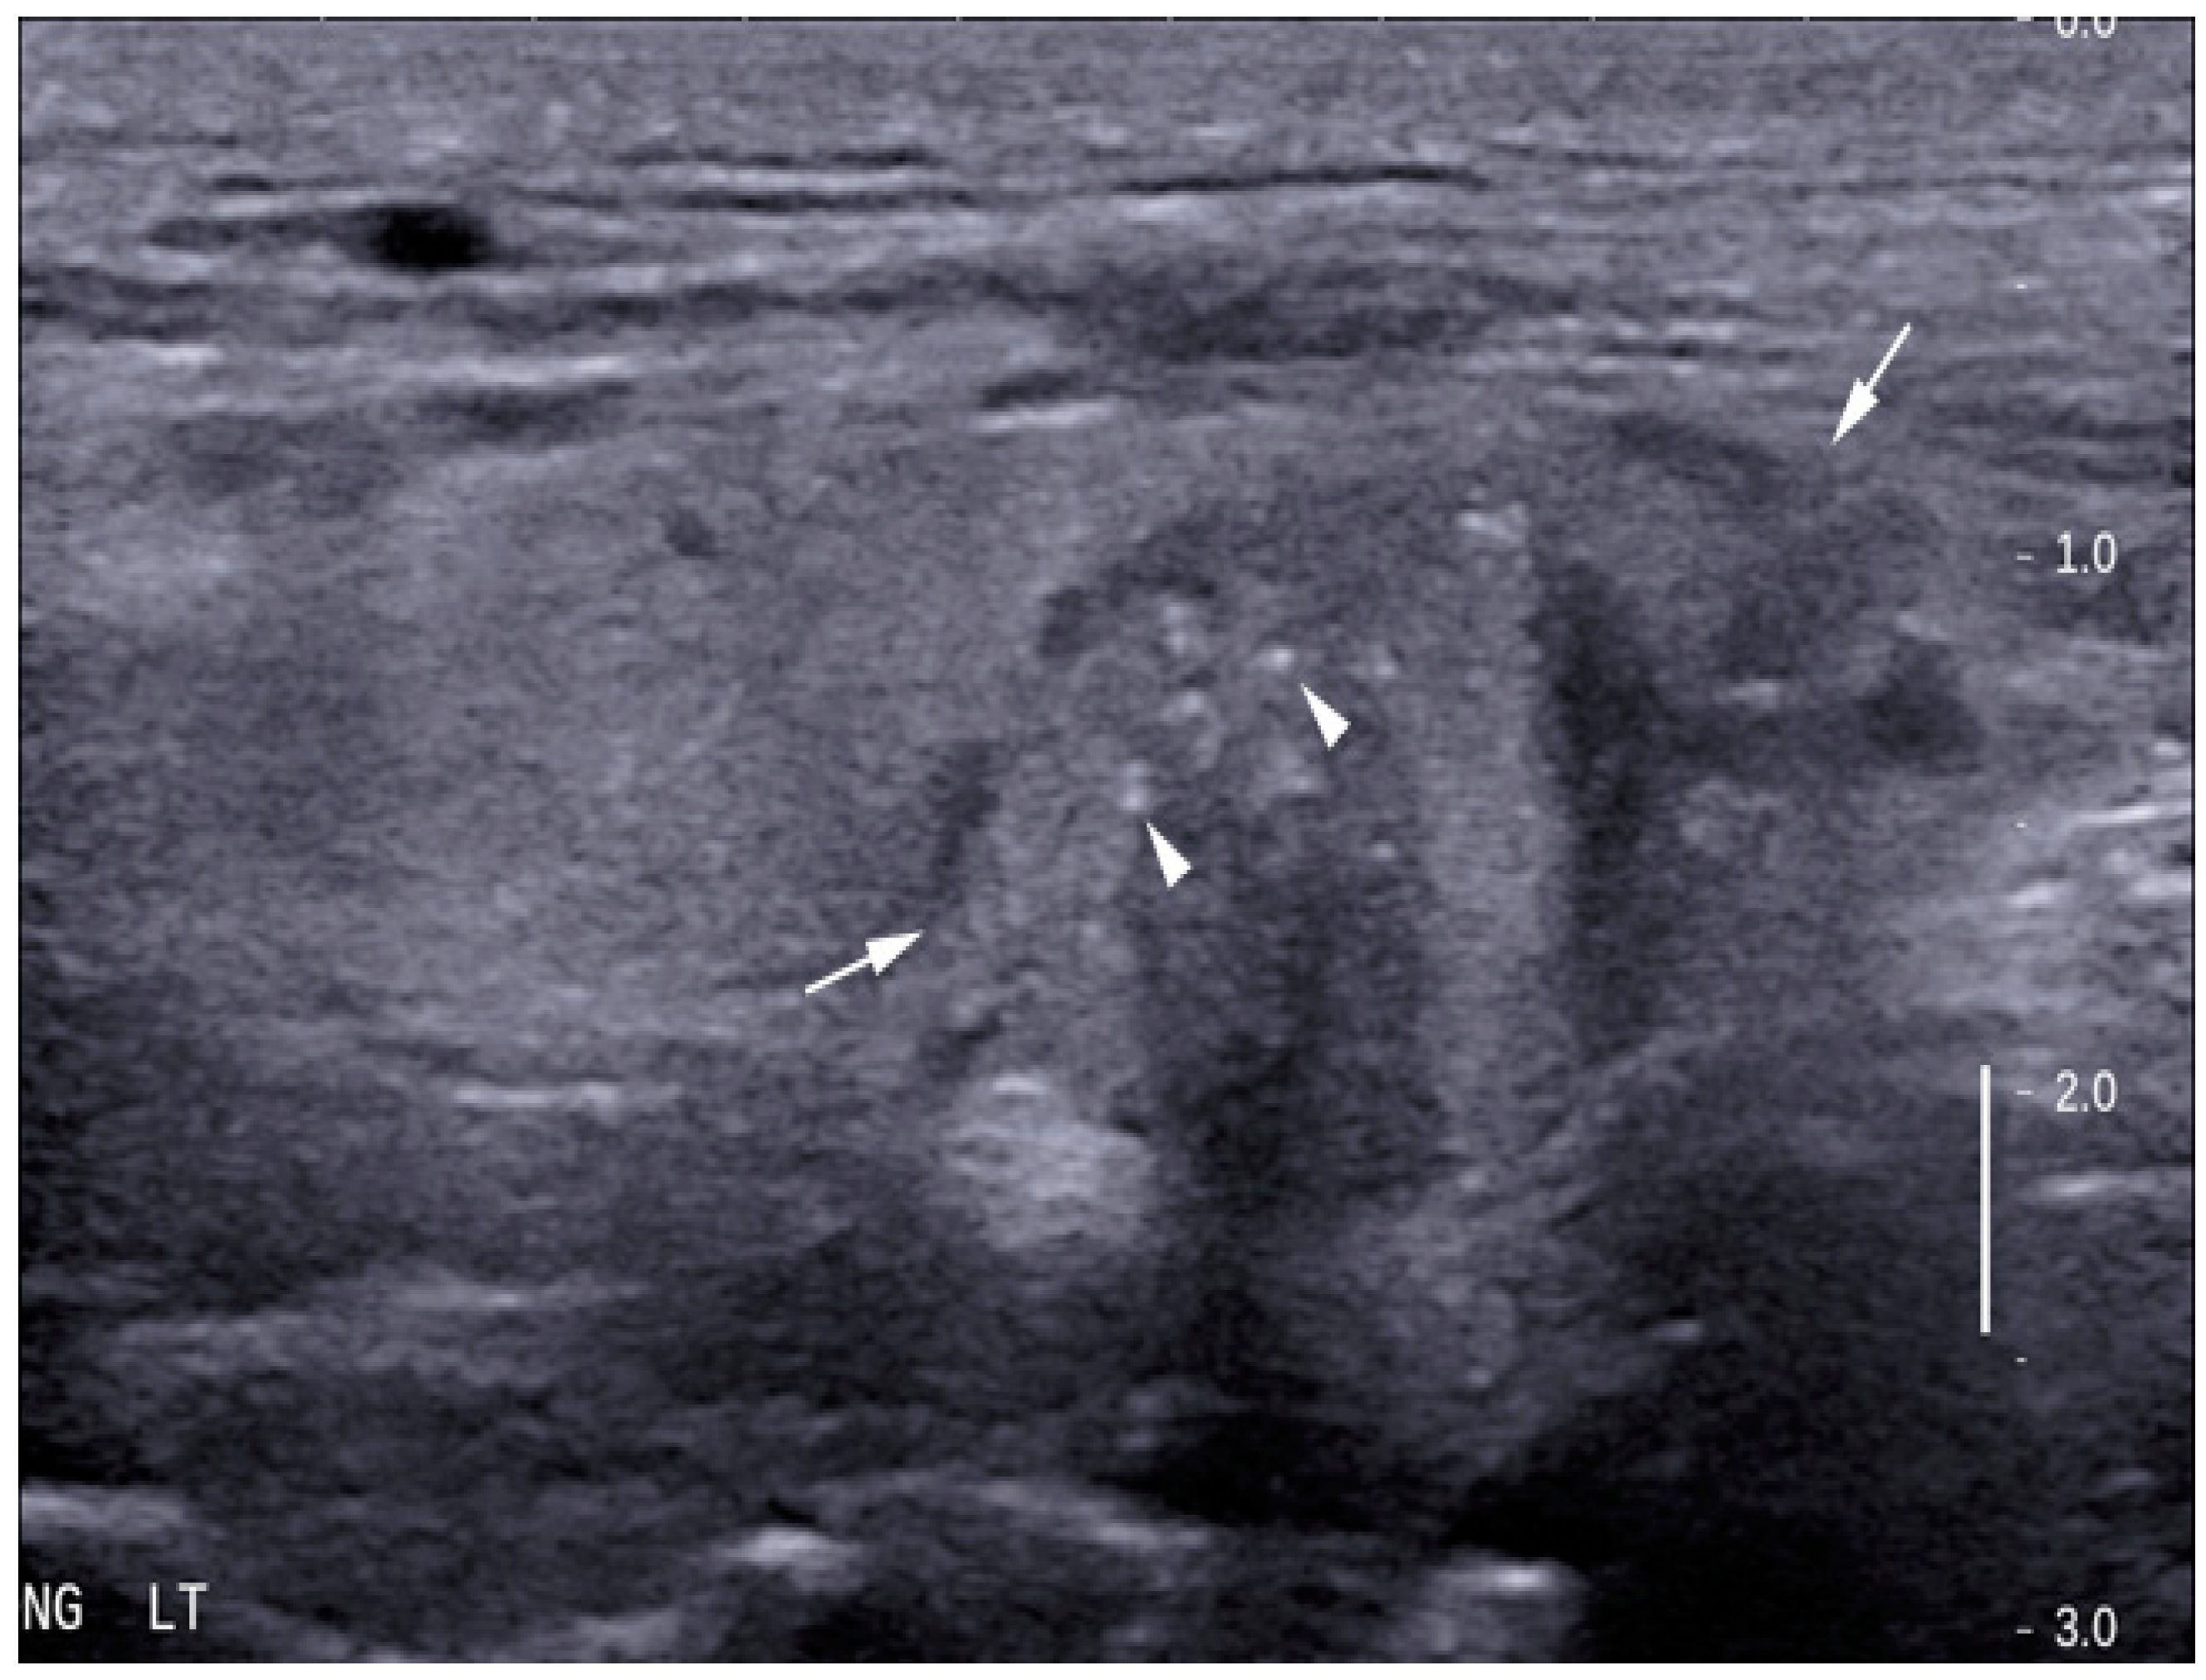
3.2. Grey Scale Ultrasound
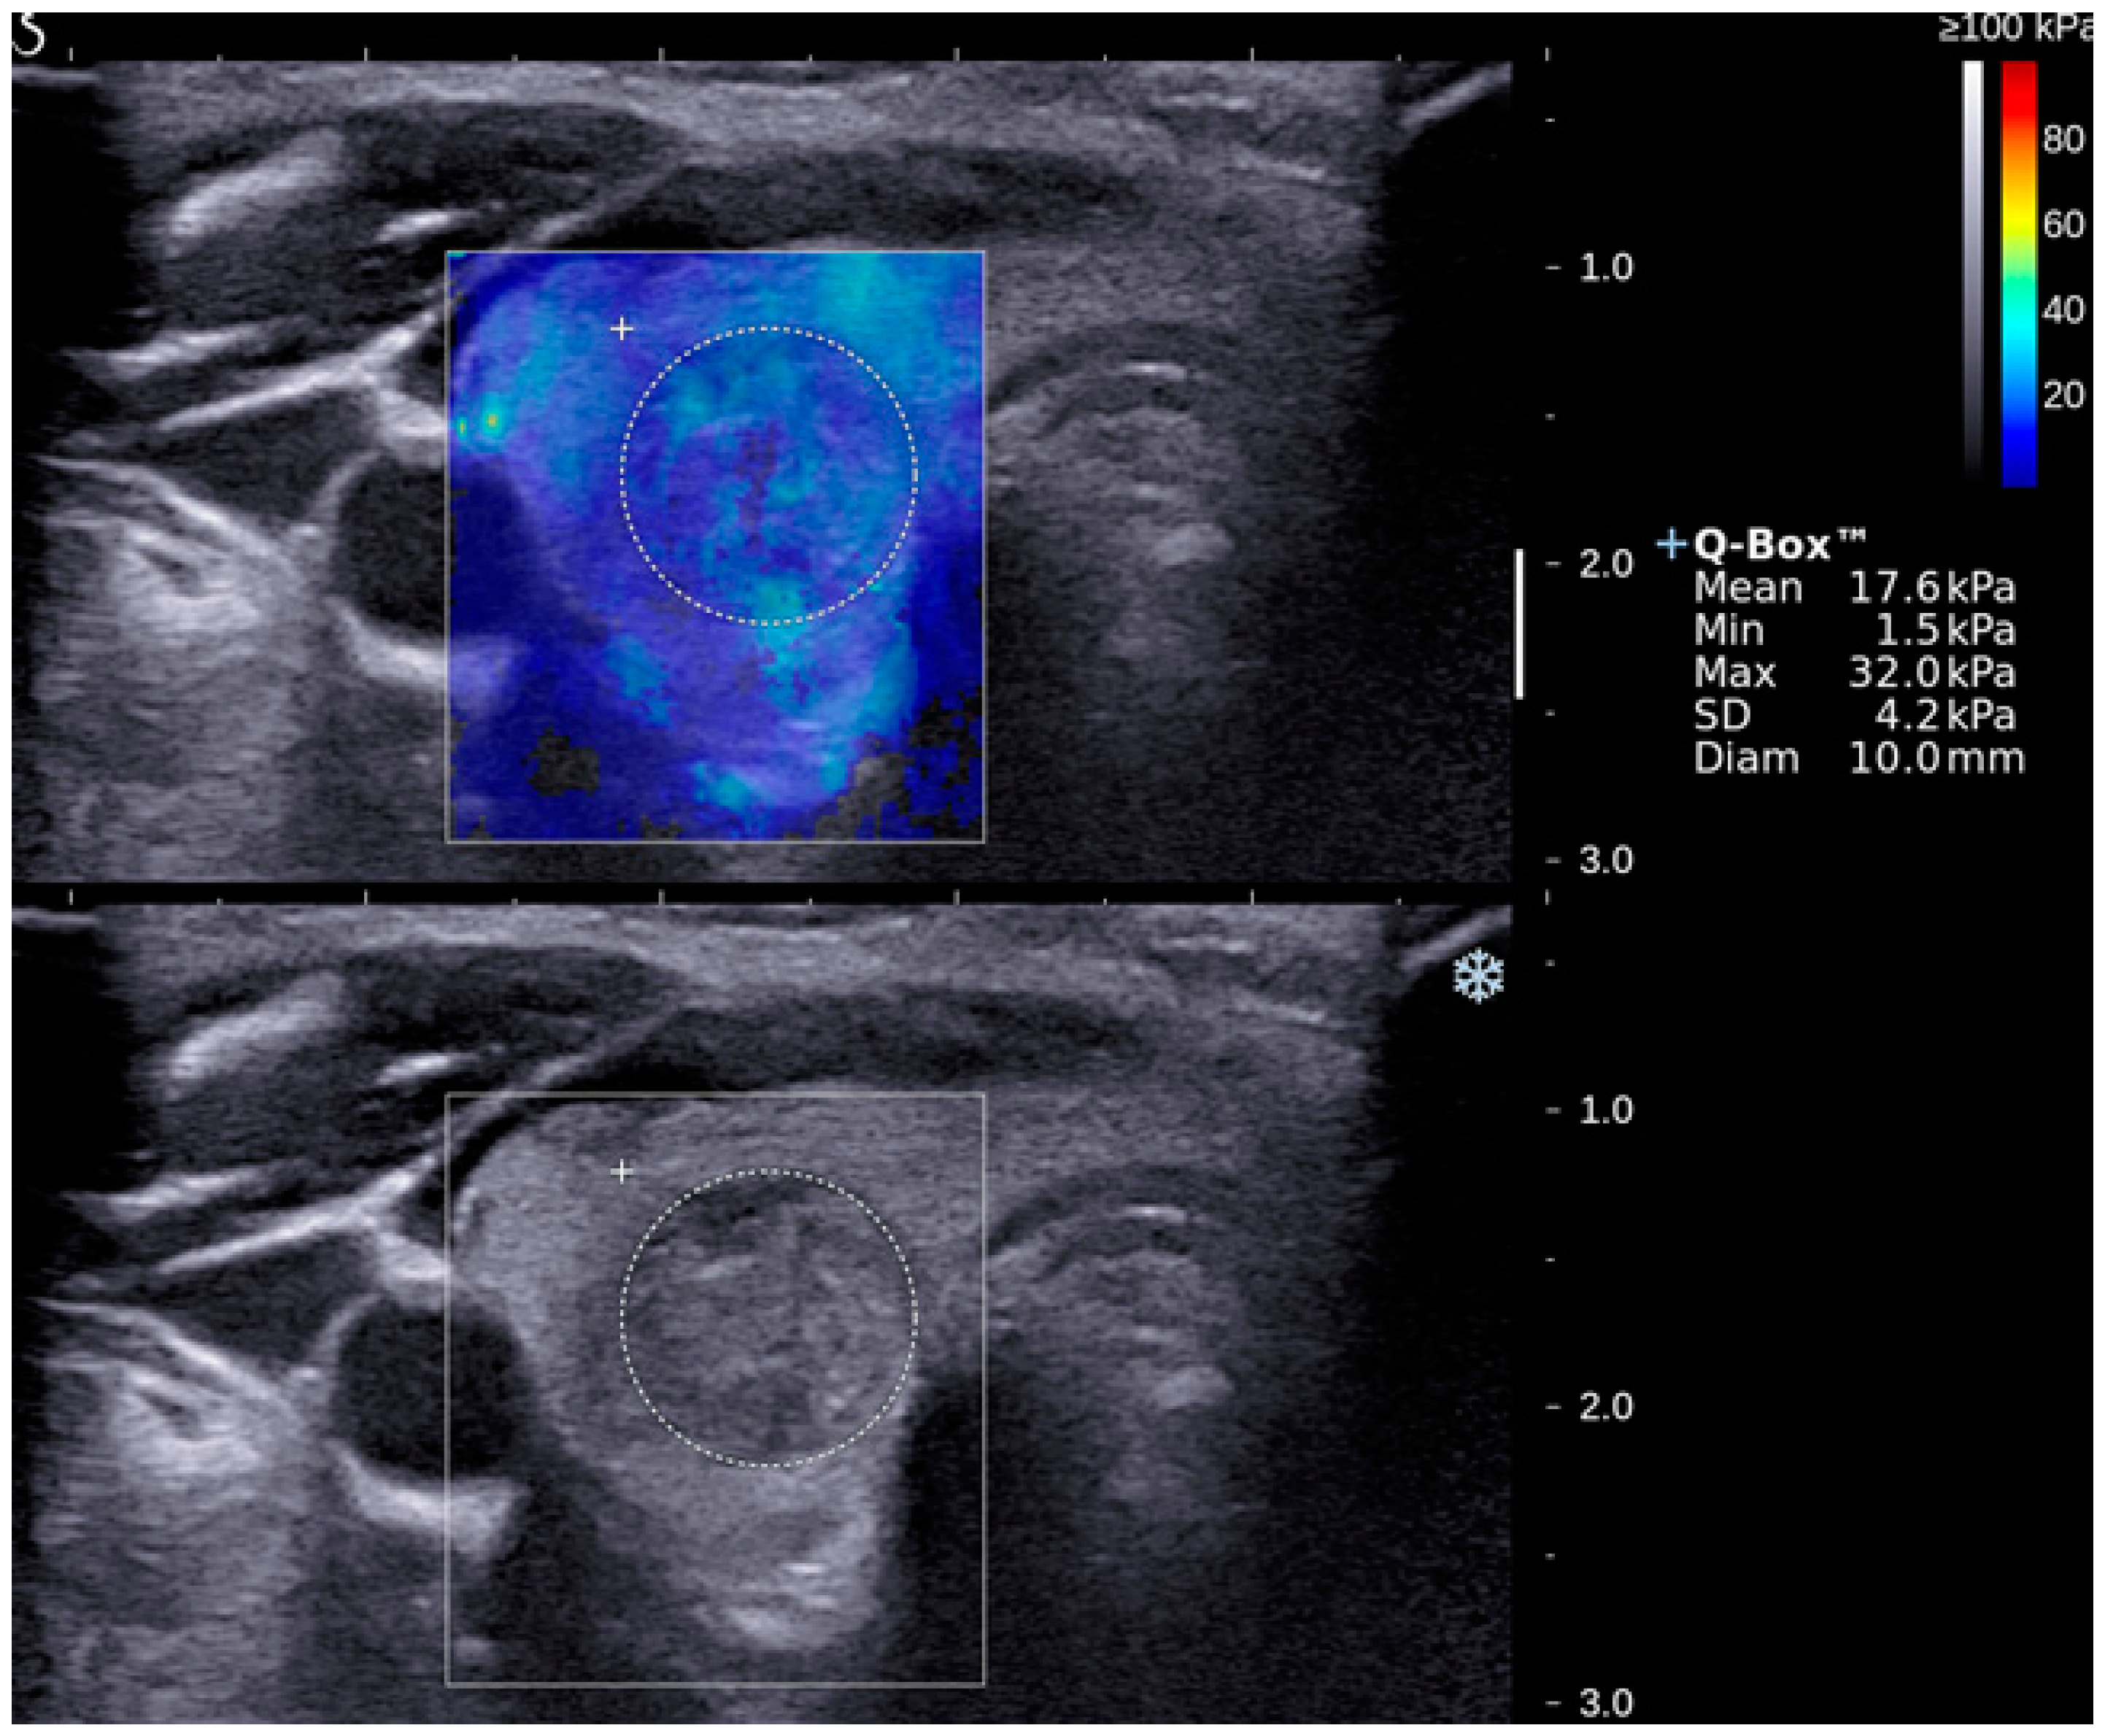
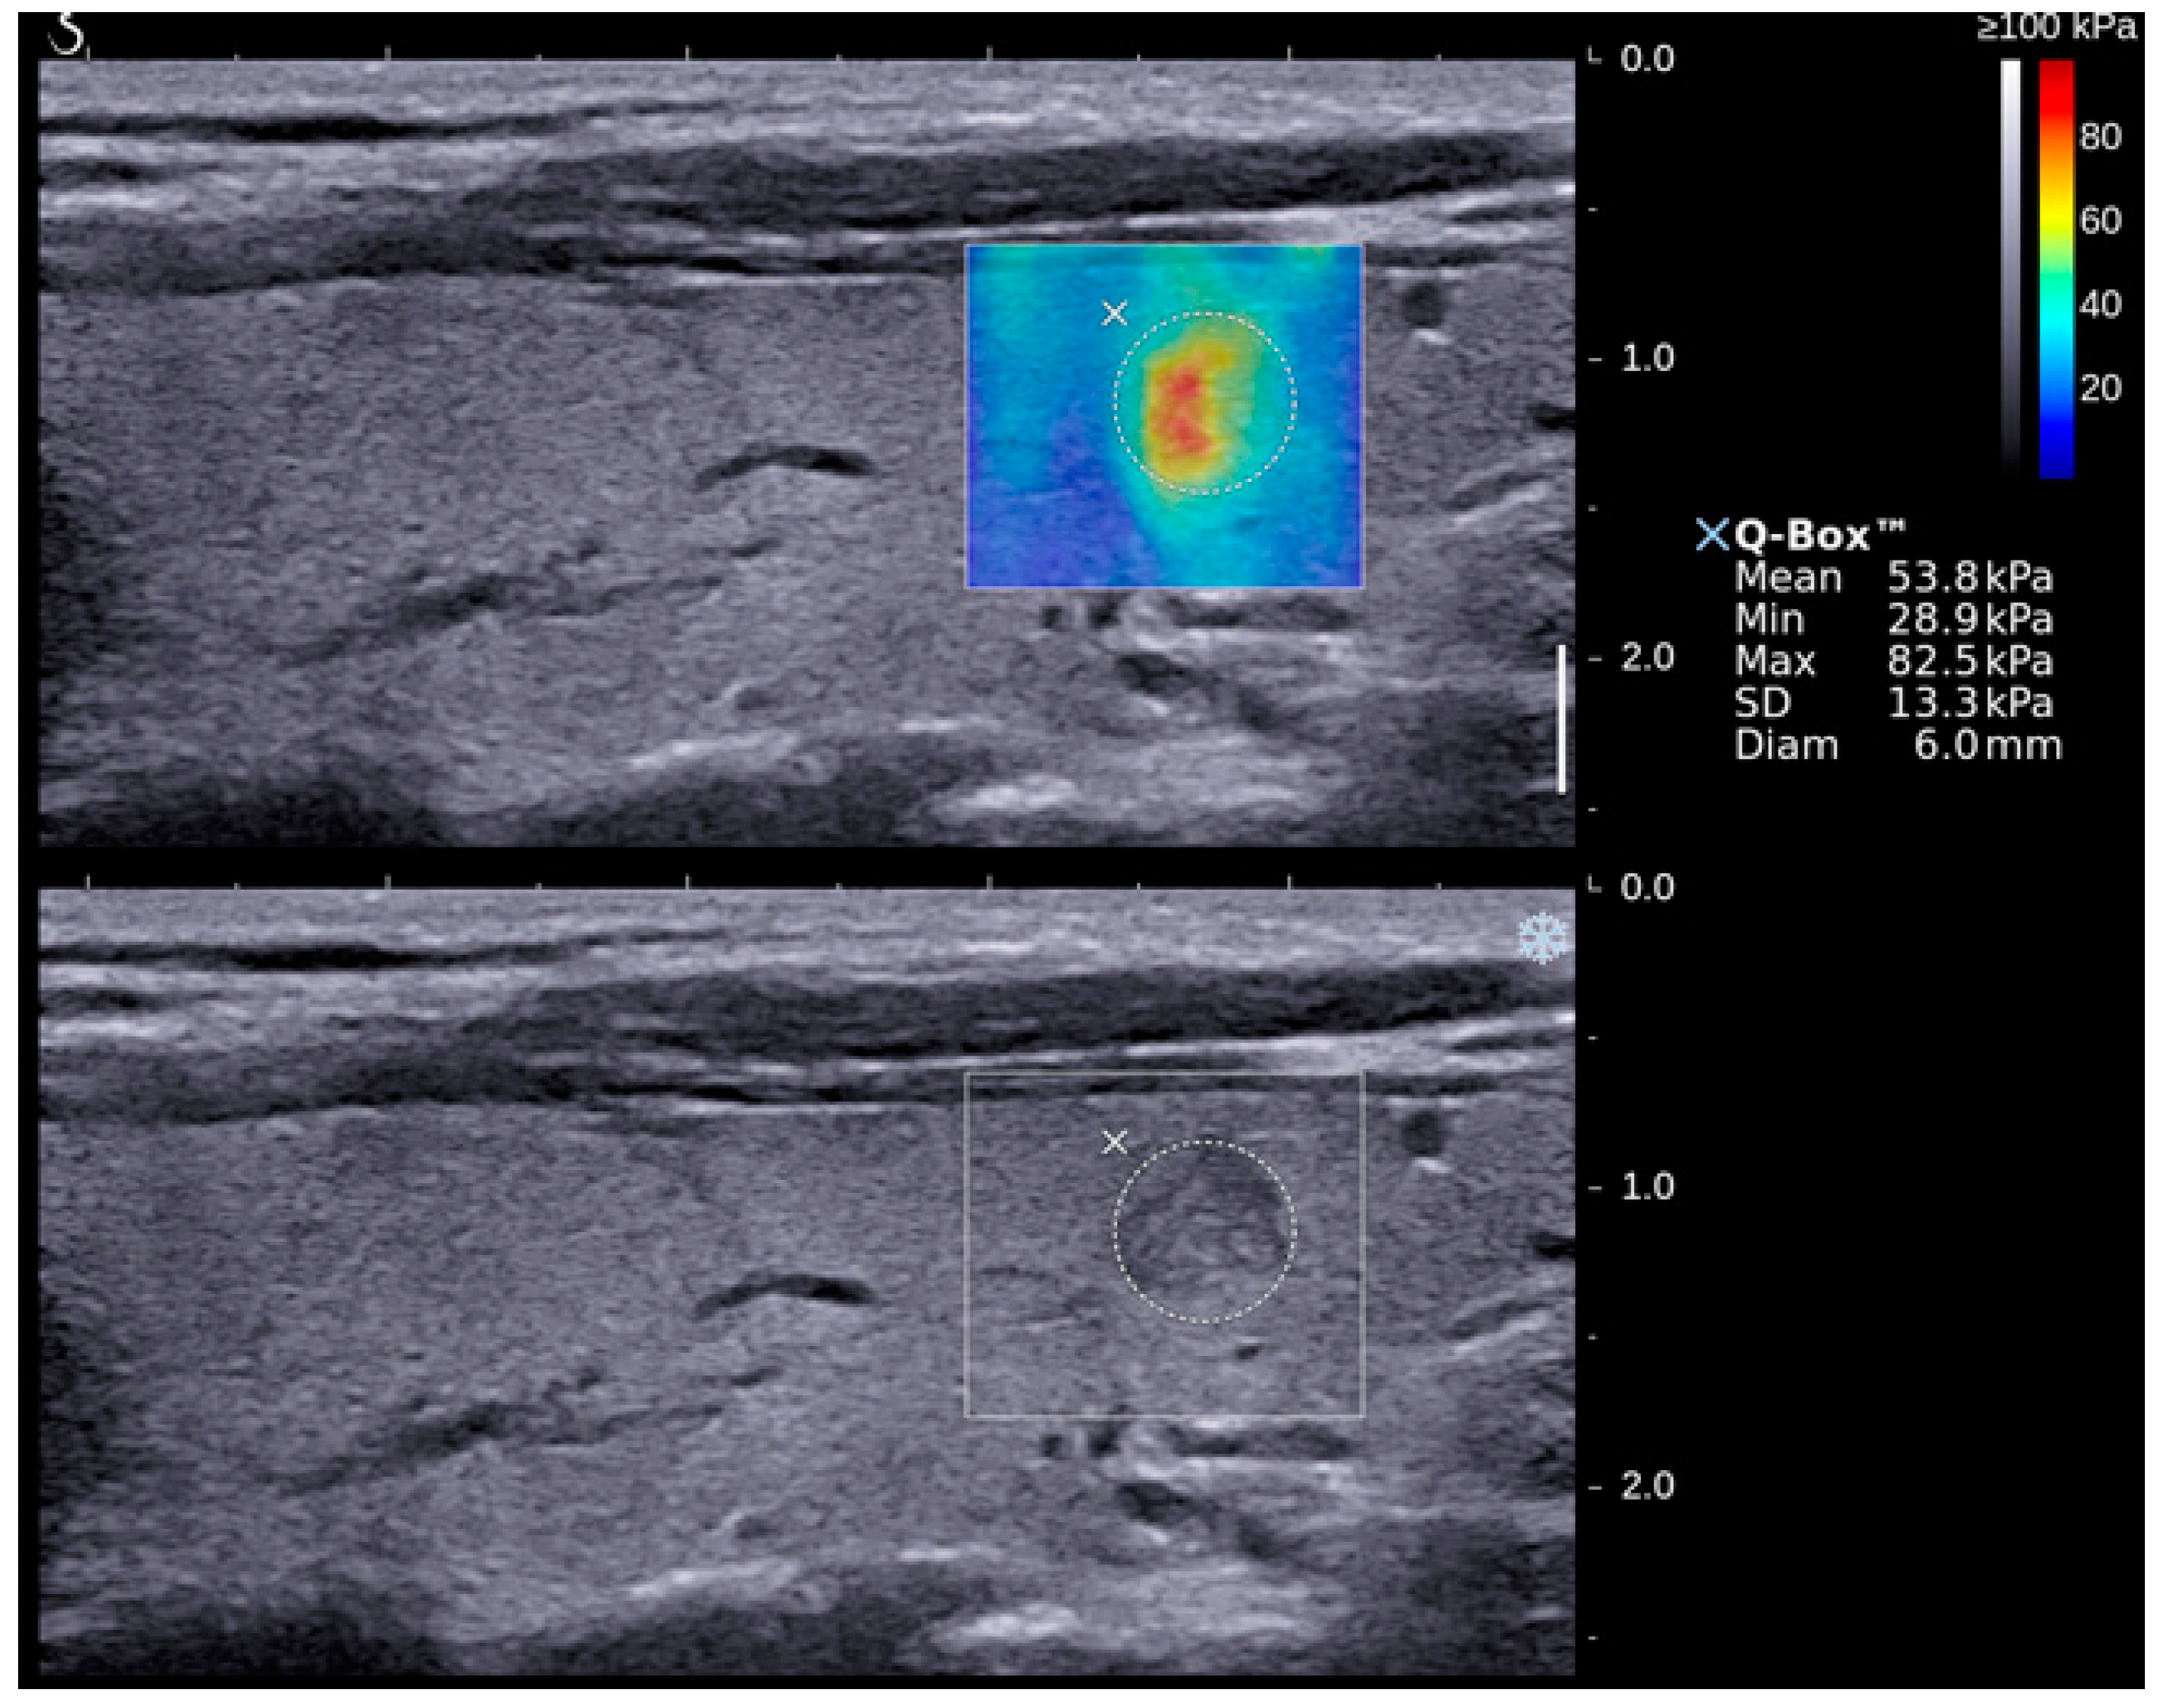
3.3. Shear Wave Elastography
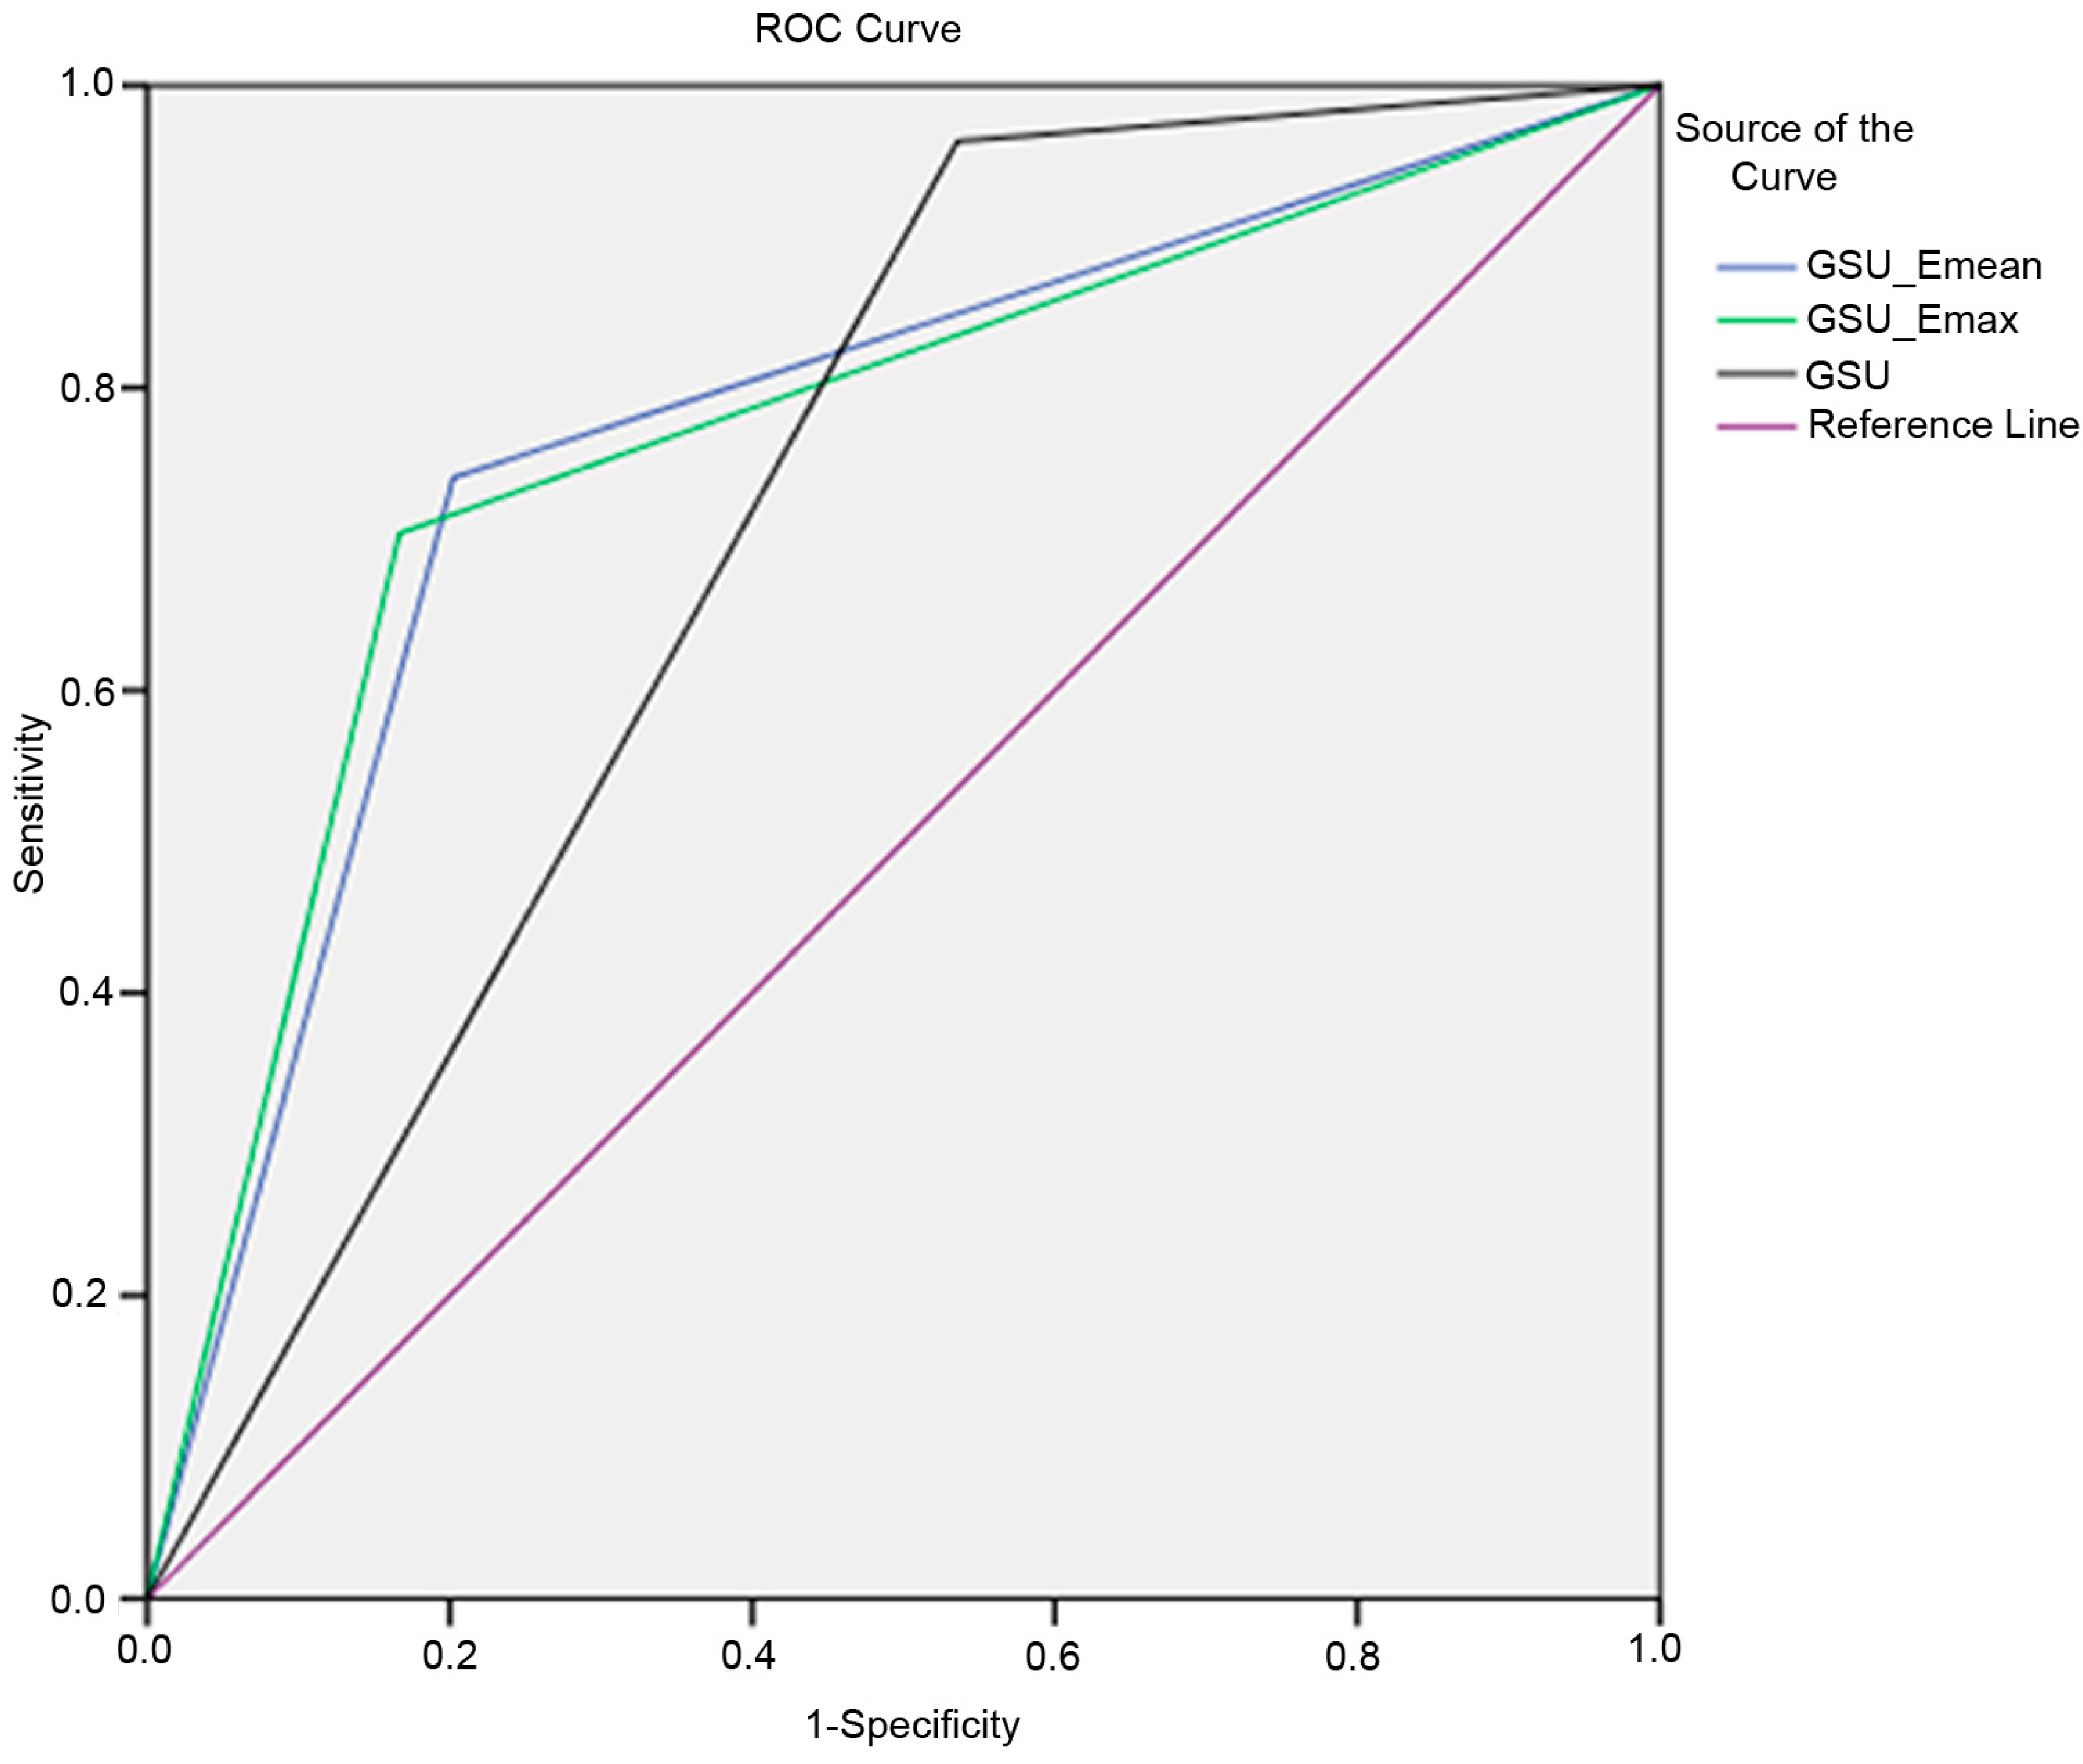
3.4. Combination of Grey Scale Ultrasound and Shear Wave Elastography
4. Discussion
5. Conclusions
Acknowledgments
Author Contributions
Conflicts of Interest
References
- Kim, S.-Y.; Kim, E.-K.; Moon, H.J.; Yoon, J.H.; Kwak, J.Y. Application of texture analysis in the differential diagnosis of benign and malignant thyroid nodules: Comparison with gray-scale ultrasound and elastography. Am. J. Roentgenol. 2015, 205, W343–W351. [Google Scholar] [CrossRef] [PubMed]
- Kwak, J.Y.; Kim, E.-K. Ultrasound elastography for thyroid nodules: Recent advances. Ultrasonography 2014, 33, 75–82. [Google Scholar] [CrossRef] [PubMed]
- Chan, B.K.; Desser, T.S.; McDougall, I.R.; Weigel, R.J.; Jeffrey, R.B. Common and uncommon sonographic features of papillary thyroid carcinoma. J. Ultrasound Med. 2003, 22, 1083–1090. [Google Scholar] [CrossRef] [PubMed]
- Cooper, D.S.; Doherty, G.M.; Haugen, B.R.; Kloos, R.T.; Lee, S.L.; Mandel, S.J.; Mazzaferri, E.L.; McIver, B.; Pacini, F.; Schlumberger, M. Revised american thyroid association management guidelines for patients with thyroid nodules and differentiated thyroid cancer: The american thyroid association (ata) guidelines taskforce on thyroid nodules and differentiated thyroid cancer. Thyroid 2009, 19, 1167–1214. [Google Scholar] [CrossRef] [PubMed]
- Moon, W.-J.; Baek, J.H.; Jung, S.L.; Kim, D.W.; Kim, E.K.; Kim, J.Y.; Kwak, J.Y.; Lee, J.H.; Lee, J.H.; Lee, Y.H. Ultrasonography and the ultrasound-based management of thyroid nodules: Consensus statement and recommendations. Korean J. Radiol. 2011, 12, 1–14. [Google Scholar] [CrossRef] [PubMed]
- Cappelli, C.; Castellano, M.; Pirola, I.; Cumetti, D.; Agosti, B.; Gandossi, E.; Rosei, E.A. The predictive value of ultrasound findings in the management of thyroid nodules. QJM 2007, 100, 29–35. [Google Scholar] [CrossRef] [PubMed]
- Frates, M.C.; Benson, C.B.; Charboneau, J.W.; Cibas, E.S.; Clark, O.H.; Coleman, B.G.; Cronan, J.J.; Doubilet, P.M.; Evans, D.B.; Goellner, J.R. Management of thyroid nodules detected at us: Society of radiologists in ultrasound consensus conference statement 1. Radiology 2005, 237, 794–800. [Google Scholar] [CrossRef] [PubMed]
- Cappelli, C.; Castellano, M.; Pirola, I.; Gandossi, E.; De Martino, E.; Cumetti, D.; Agosti, B.; Rosei, E.A. Thyroid nodule shape suggests malignancy. Eur. J. Endocrinol. 2006, 155, 27–31. [Google Scholar] [CrossRef] [PubMed]
- Razavi, S.A.; Hadduck, T.A.; Sadigh, G.; Dwamena, B.A. Comparative effectiveness of elastographic and b-mode ultrasound criteria for diagnostic discrimination of thyroid nodules: A meta-analysis. Am. J. Roentgenol. 2013, 200, 1317–1326. [Google Scholar] [CrossRef] [PubMed]
- Sun, J.; Cai, J.; Wang, X. Real-time ultrasound elastography for differentiation of benign and malignant thyroid nodules. J. Ultrasound Med. 2014, 33, 495–502. [Google Scholar] [CrossRef] [PubMed]
- Haugen, B.R. 2015 american thyroid association management guidelines for adult patients with thyroid nodules and differentiated thyroid cancer: What is new and what has changed? Thyroid 2016, 26, 1–133. [Google Scholar] [CrossRef] [PubMed]
- Hong, Y.; Liu, X.; Li, Z.; Zhang, X.; Chen, M.; Luo, Z. Realeallines for adult patients with thyroid nodules and differentiated thyroidalignant thyroid nodules. J. Ultrasound Med. 2009, 28, 861–867. [Google Scholar] [CrossRef] [PubMed]
- Liu, B.-X.; Xie, X.-Y.; Liang, J.-Y.; Zheng, Y.-L.; Huang, G.-L.; Zhou, L.-Y.; Wang, Z.; Xu, M.; Lu, M.-D. Shear wave elastography versus real-time elastography on evaluation thyroid nodules: A preliminary study. Eur. J. Radiol. 2014, 83, 1135–1143. [Google Scholar] [CrossRef] [PubMed]
- Khoo, M.L.; Asa, S.L.; Witterick, I.J.; Freeman, J.L. Thyroid calcification and its association with thyroid carcinoma. Head Neck 2002, 24, 651–655. [Google Scholar] [CrossRef] [PubMed]
- Sebag, F.; Vaillant-Lombard, J.; Berbis, J.; Griset, V.; Henry, J.; Petit, P.; Oliver, C. Shear wave elastography: A new ultrasound imaging mode for the differential diagnosis of benign and malignant thyroid nodules. J. Clin. Endocrinol. Metab. 2010, 95, 5281–5288. [Google Scholar] [CrossRef] [PubMed]
- Cantisani, V.; Grazhdani, H.; Drakonaki, E.; D’Andrea, V.; Di Segni, M.; Kaleshi, E.; Calliada, F.; Catalano, C.; Redler, A.; Brunese, L. Strain us elastography for the characterization of thyroid nodules: Advantages and limitation. Int. J. Endocrinol. 2015, 2015, 908575. [Google Scholar] [CrossRef] [PubMed]
- Rosario, P.W.; Silva, A.L.D.; Borges, M.A.R.; Calsolari, M.R. Is doppler ultrasound of additional value to gray-scale ultrasound in differentiating malignant and benign thyroid nodules? Arch. Endocrinol. Metab. 2015, 59, 79–83. [Google Scholar] [CrossRef] [PubMed]
- Anil, G.; Hegde, A.; Chong, F. Thyroid nodules: Risk stratification for malignancy with ultrasound and guided biopsy. Cancer Imaging 2011, 11, 209–223. [Google Scholar] [PubMed]
- Khadra, H.; Bakeer, M.; Hauch, A.; Hu, T.; Kandil, E. Is vascular flow a predictor of malignant thyroid nodules? A meta-analysis. Gland Surg. 2016, 5, 576–582. [Google Scholar] [CrossRef] [PubMed]
- Moon, H.J.; Kwak, J.Y.; Kim, M.J.; Son, E.J.; Kim, E.-K. Can vascularity at power doppler us help predict thyroid malignancy? Radiology 2010, 255, 260–269. [Google Scholar] [CrossRef] [PubMed]
- Dudea, S.M.; Botar-Jid, C. Ultrasound elastography in thyroid disease. Med. Ultrason. 2015, 17, 74. [Google Scholar] [CrossRef] [PubMed]
- Kim, E.-K.; Park, C.S.; Chung, W.Y.; Oh, K.K.; Kim, D.I.; Lee, J.T.; Yoo, H.S. New sonographic criteria for recommending fine-needle aspiration biopsy of nonpalpable solid nodules of the thyroid. Am. J. Roentgenol. 2002, 178, 687–691. [Google Scholar] [CrossRef] [PubMed]
- Papini, E.; Guglielmi, R.; Bianchini, A.; Crescenzi, A.; Taccogna, S.; Nardi, F.; Panunzi, C.; Rinaldi, R.; Toscano, V.; Pacella, C.M. Risk of malignancy in nonpalpable thyroid nodules: Predictive value of ultrasound and color-doppler features. J. Clin. Endocrinol. Metab. 2002, 87, 1941–1946. [Google Scholar] [CrossRef] [PubMed]
- Benson, J.; Fan, L. Tissue Strain Analytics—A Complete Ultrasound Solution for Elastography; Siemens Healthcare White Paper; Global Siemens Headquaters: Munchen, Germany, 2012. [Google Scholar]
- Shiina, T. Jsum ultrasound elastography practice guidelines: Basics and terminology. J. Med. Ultrason. 2013, 40, 309–323. [Google Scholar] [CrossRef] [PubMed]
- Couade, M.; Pernot, M.; Prada, C.; Messas, E.; Emmerich, J.; Bruneval, P.; Criton, A.; Fink, M.; Tanter, M. Quantitative assessment of arterial wall biomechanical properties using shear wave imaging. Ultrasound Med. Biol. 2010, 36, 1662–1676. [Google Scholar] [CrossRef] [PubMed]
- Dighe, M.K. Elastography of thyroid masses. Ultrasound Clin. 2014, 9, 13–24. [Google Scholar] [CrossRef] [PubMed]
- Koperek, O.; Scheuba, C.; Puri, C.; Birner, P.; Haslinger, C.; Rettig, W.; Niederle, B.; Kaserer, K.; Chesa, P.G. Molecular characterization of the desmoplastic tumor stroma in medullary thyroid carcinoma. Int. J. Oncol. 2007, 31, 59–68. [Google Scholar] [CrossRef] [PubMed]
- Popli, M.B.; Rastogi, A.; Bhalla, P.; Solanki, Y. Utility of gray-scale ultrasound to differentiate benign from malignant thyroid nodules. Indian J. Radiol. Imaging 2012, 22, 63. [Google Scholar] [CrossRef] [PubMed]
- Wong, K.; Ahuja, A.T. Ultrasound of thyroid cancer. Cancer Imaging 2005, 5, 157. [Google Scholar] [CrossRef] [PubMed]
- Yoon, J.H.; Kwak, J.Y.; Moon, H.J.; Kim, M.J.; Kim, E.-K. The diagnostic accuracy of ultrasound-guided fine-needle aspiration biopsy and the sonographic differences between benign and malignant thyroid nodules 3 cm or larger. Thyroid 2011, 21, 993–1000. [Google Scholar] [CrossRef] [PubMed]
- Eilers, S.G.; LaPolice, P.; Mukunyadzi, P.; Kapur, U.; Wendel Spiczka, A.; Shah, A.; Saleh, H.; Adeniran, A.; Nunez, A.; Balachandran, I. Thyroid fineinedifferences between benign and malignant thyroid nodules 3 cm or larger. Cancer Cytopathol. 2014, 122, 745–750. [Google Scholar] [CrossRef] [PubMed]
- Duan, S.-B.; Yu, J.; Li, X.; Han, Z.-Y.; Zhai, H.-Y.; Liang, P. Diagnostic value of two-dimensional shear wave elastography in papillary thyroid microcarcinoma. Onco Targets Ther. 2016, 9, 1311. [Google Scholar] [PubMed]
- Park, A.Y.; Son, E.J.; Han, K.; Youk, J.H.; Kim, J.-A.; Park, C.S. Shear wave elastography of thyroid nodules for the prediction of malignancy in a large scale study. Eur. J. Radiol. 2015, 84, 407–412. [Google Scholar] [CrossRef] [PubMed]
- Bhatia, K.S.; Tong, C.S.; Cho, C.C.; Yuen, E.H.; Lee, Y.Y.; Ahuja, A.T. Shear wave elastography of thyroid nodules in routine clinical practice: Preliminary observations and utility for detecting malignancy. Eur. Radiol. 2012, 22, 2397–2406. [Google Scholar] [CrossRef] [PubMed]
- Veyrieres, J.-B.; Albarel, F.; Lombard, J.V.; Berbis, J.; Sebag, F.; Oliver, C.; Petit, P. A threshold value in shear wave elastography to rule out malignant thyroid nodules: A reality? Eur. J. Radiol. 2012, 81, 3965–3972. [Google Scholar] [CrossRef] [PubMed]
- Szczepanek-Parulska, E.; Woliński, K.; Stangierski, A.; Gurgul, E.; Biczysko, M.; Majewski, P.; Rewaj-Łosyk, M.; Ruchała, M. Comparison of diagnostic value of conventional ultrasonography and shear wave elastography in the prediction of thyroid lesions malignancy. PLoS ONE 2013, 8, e81532. [Google Scholar] [CrossRef] [PubMed]
- Dobruch-Sobczak, K.; Zalewska, E.B.; Gumińska, A.; Słapa, R.Z.; Mlosek, K.; Wareluk, P.; Jakubowski, W.; Dedecjus, M. Diagnostic performance of shear wave elastography parameters alone and in combination with conventional b-mode ultrasound parameters for the characterization of thyroid nodules: A prospective, dual-center study. Ultrasound Med. Biol. 2016, 42, 2803–2811. [Google Scholar] [CrossRef] [PubMed]
- Liu, B.; Liang, J.; Zheng, Y.; Xie, X.; Huang, G.; Zhou, L.; Wang, W.; Lu, M. Two-dimensional shear wave elastography as promising diagnostic tool for predicting malignant thyroid nodules: A prospective single-centre experience. Eur. Radiol. 2015, 25, 624–634. [Google Scholar] [CrossRef] [PubMed]
- Dong, M.-J.; Liu, Z.-F.; Zhao, K.; Ruan, L.-X.; Wang, G.-L.; Yang, S.-Y.; Sun, F.; Luo, X.-G. Value of 18f-fdg-pet/pet-ct in differentiated thyroid carcinoma with radioiodine-negative whole-body scan: A meta-analysis. Nucl. Med. Commun. 2009, 30, 639–650. [Google Scholar] [CrossRef] [PubMed]
- Ahuja, A.; Chow, L.; Chick, W.; King, W.; Metreweli, C. Metastatic cervical nodes in papillary carcinoma of the thyroid: Ultrasound and histological correlation. Clin. Radiol. 1995, 50, 229–231. [Google Scholar] [CrossRef]
- Lee, D.Y.; Kwon, T.-K.; Sung, M.-W.; Kim, K.H.; Hah, J.H. Prediction of extrathyroidal extension using ultrasonography and computed tomography. Int. J. Endocrinol. 2014, 2014, 351058. [Google Scholar] [CrossRef] [PubMed]
- Nascimento, C.; Borget, I.; Al Ghuzlan, A.; Deandreis, D.; Hartl, D.; Lumbroso, J.; Berdelou, A.; Lepoutre-Lussey, C.; Mirghani, H.; Baudin, E. Postoperative fluorine-18-fluorodeoxyglucose positron emission tomography/computed tomography: An important imaging modality in patients with aggressive histology of differentiated thyroid cancer. Thyroid 2015, 25, 437–444. [Google Scholar] [CrossRef] [PubMed]


| Grey Scale Ultrasound Features | Number of Nodules (Percentage) | p-Value (95% Confidence Interval) | |
|---|---|---|---|
| Benign (n = 84) | Malignant (n = 27) | ||
| Microcalcification | |||
| Yes | 6 (7.1%) | 21 (77.8%) | <0.05 |
| No | 78 (92.9%) | 6 (22.2%) | (0.12–0.49) |
| Tall/width ratio >1 | |||
| Yes | 11 (13.1%) | 16 (59.3%) | <0.05 |
| No | 73 (86.9%) | 11 (40.7%) | (0.29–0.74) |
| Hypoechogenicity | - | - | - |
| Yes | 28 (33.3%) | 25 (92.6%) | <0.05 |
| No | 56 (66.7%) | 2 (7.4%) | (0.42–0.71) |
| Irregular margins | |||
| Yes | 14 (16.7%) | 15 (55.6%) | <0.05 |
| No | 70 (83.3%) | 12 (44.4%) | (0.38–0.83) |
| Absent Halo sign | |||
| Yes | 74 (88.1%) | 26 (96.3%) | >0.05 |
| No | 10 (11.9%) | 1 (3.7%) | (0.65–1.01) |
| Internal solid echotexture | |||
| Yes | 61 (72.6%) | 27 (100%) | >0.05 |
| No | 23 (27.4%) | 0 (0%) | (0.6–0.8) |
| Ultrasound Techniques | Sensitivity (%) | Specificity (%) | PPV (%) | NPV (%) | Accuracy (%) | AUC |
|---|---|---|---|---|---|---|
| GSU | 96.3 | 46.4 | 36.6 | 97.5 | 58.5 | 0.714 |
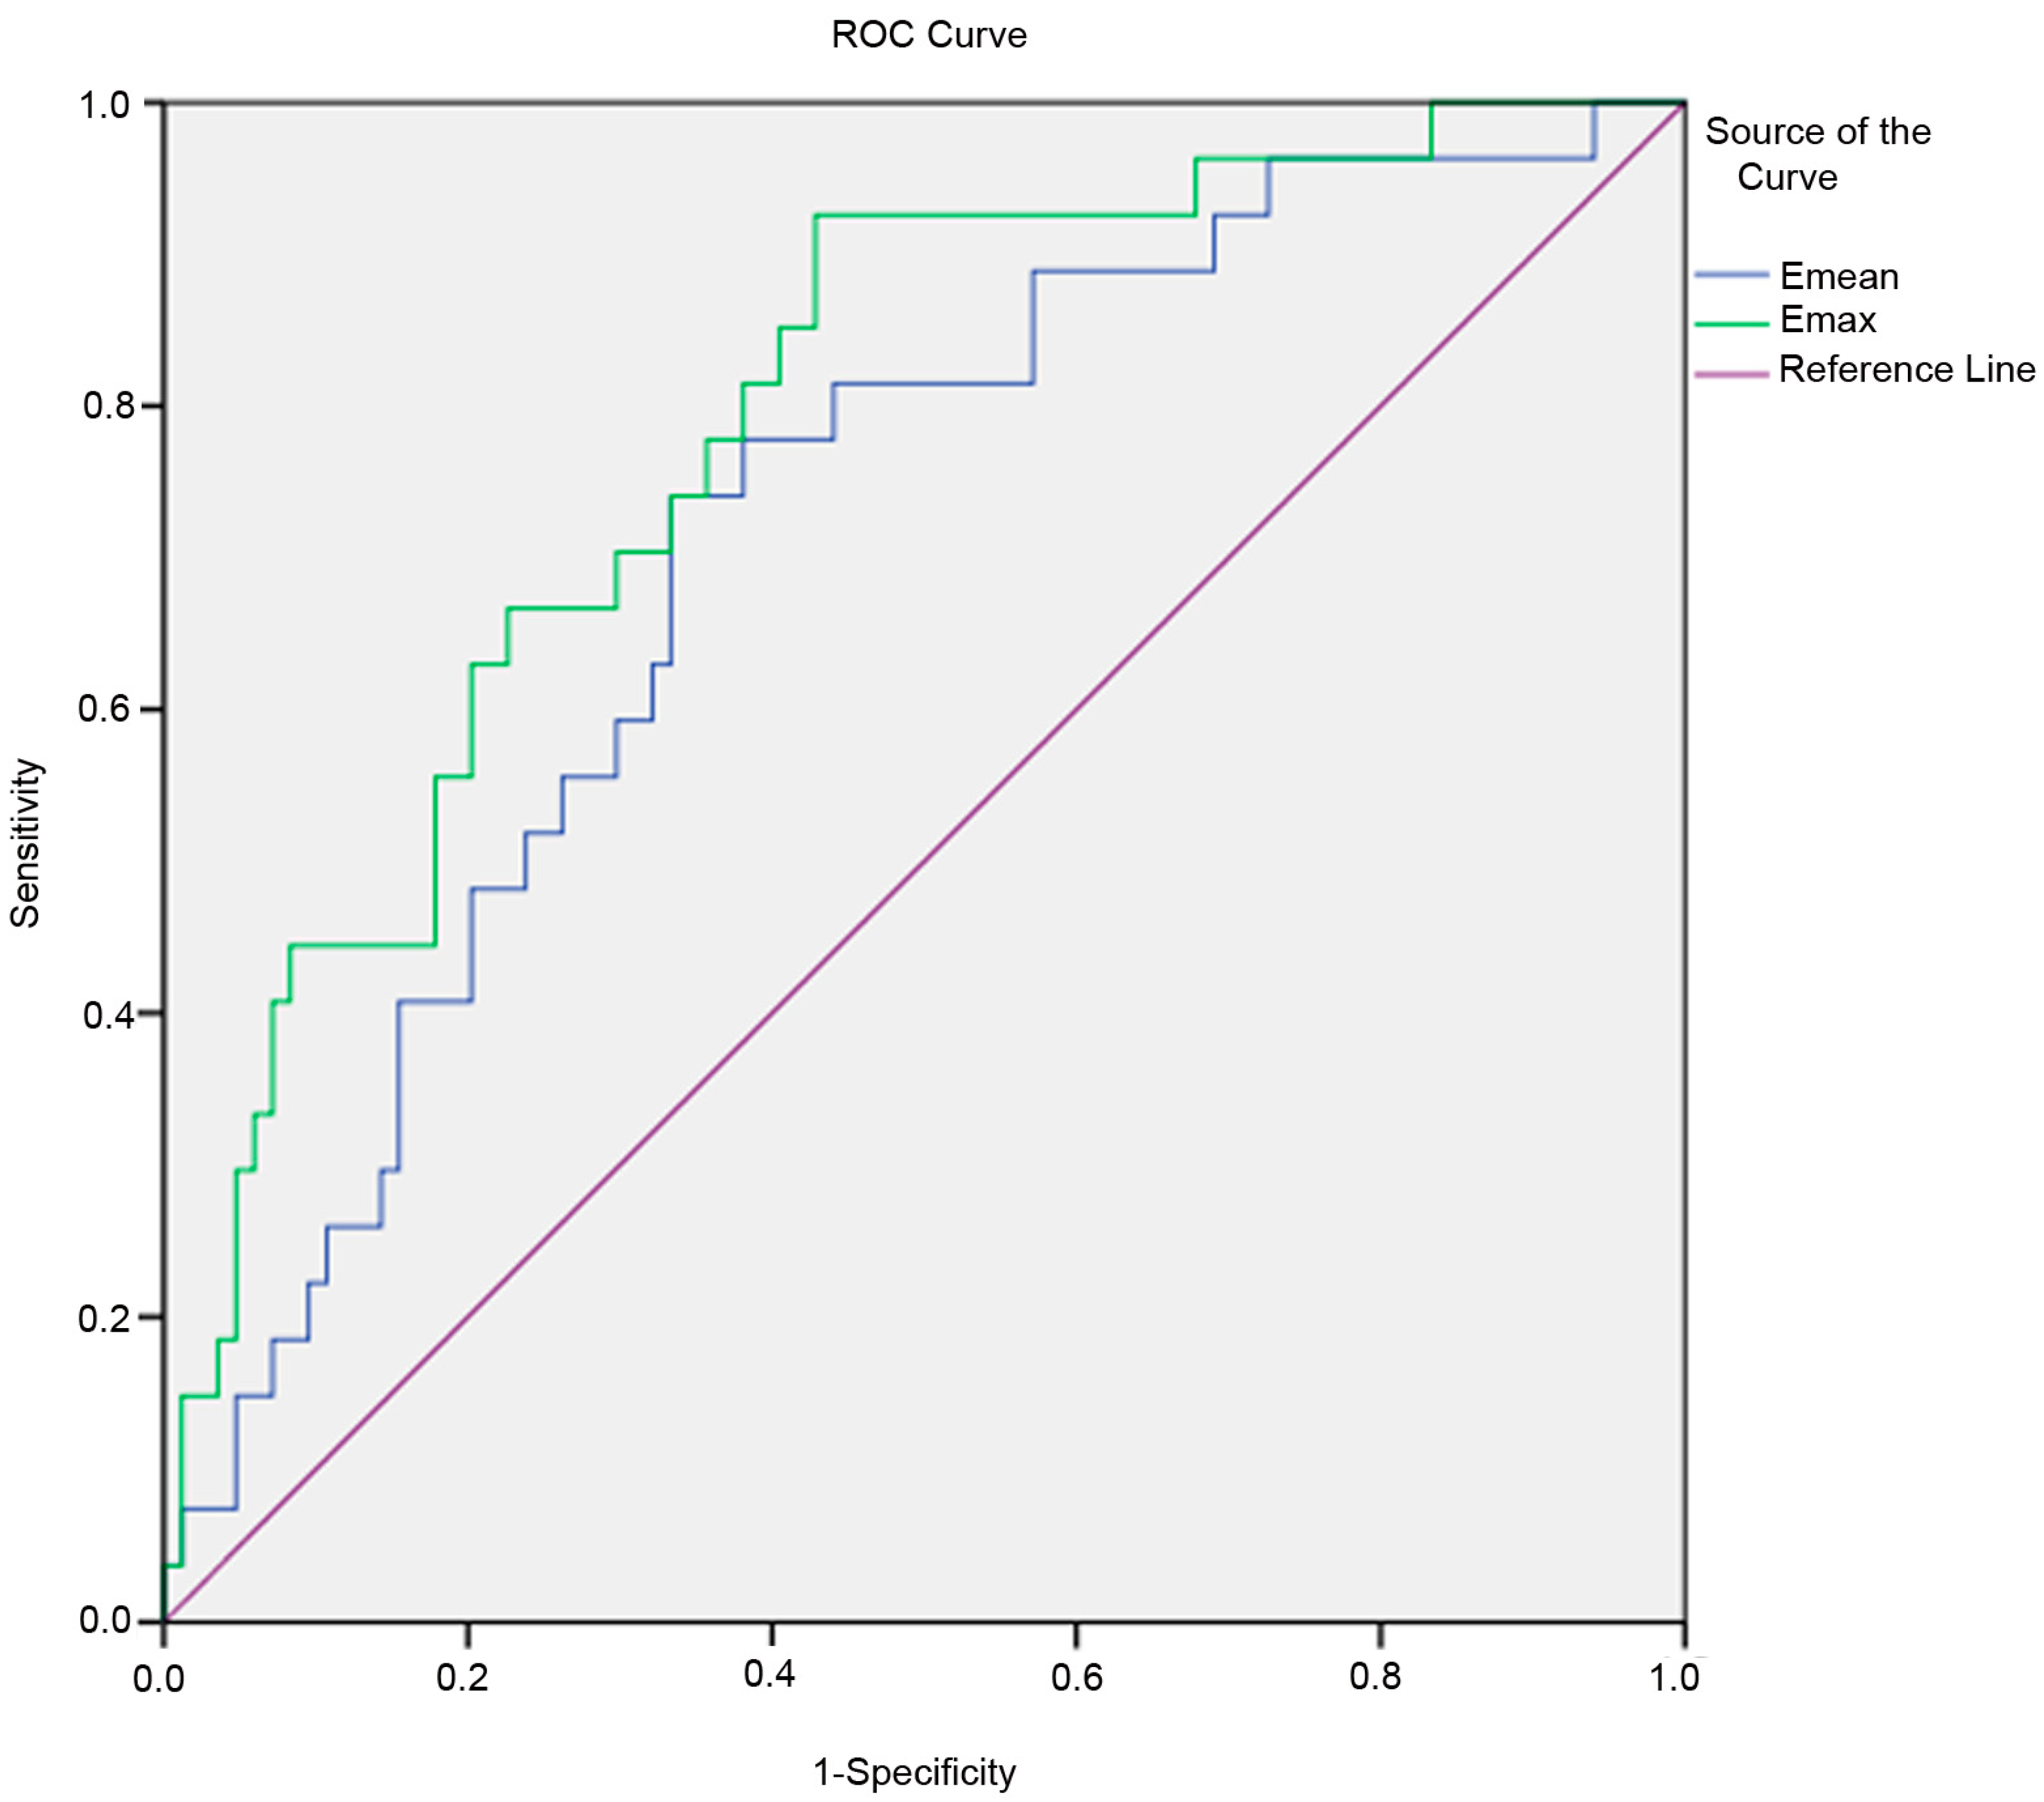
| Emax (67.3 kPa) | 70.4 | 70.2 | 43.2 | 88.1 | 70.3 | 0.785 |
| Emean (23.1 kPa) | 74.1 | 66.7 | 41.7 | 88.9 | 68.5 | 0.710 |
| GSU + Emax (67.3 kPa) | 70.4 | 83.3 | 57.6 | 89.7 | 80.2 | 0.769 |
| GSU + Emean (23.1 kPa) | 74.1 | 79.8 | 54.1 | 90.5 | 78.4 | 0.775 |
| SWE Indices | Median ± 1 Standard Error | p-Value (95% Confidence Interval) | |
|---|---|---|---|
| Benign | Malignant | ||
| Emax | 50.3 ± 3.1 | 85.2 ± 8.1 | <0.05 (50.9–63.5; 73.0–106.1) |
| Emean | 20.2 ± 1.0 | 26.6 ± 2.5 | <0.05 (19.5–23.5; 23.5–33.9) |
| Emin | 3.9 ± 0.6 | 3.8 ± 1.2 | >0.05 (4.2–6.4; 3.7–8.8) |
| Studies Involved and SWE Index Used | Diagnostic Accuracy (%) | Difference in Diagnostic Accuracy (%) | |
|---|---|---|---|
| GSU Alone | GSU + SWE | ||
| Present study | |||
| Emaximum (67.3 kPa) | 58.5 | 80.2 | 21.7 |
| Emean (23.1 kPa) | 58.5 | 78.3 | 19.8 |
| Veyrieres et al. [36] | |||
| Emaximum (65 kPa) | 81 | 77.9 | −3.1 |
| Park et al. [34] | |||
| Eminimum (85.2 kPa) | 86.3 | 87.2 | 0.9 |
| Liu et al. [39] | |||
| Eminimum (39.3 kPa) | 60.3 | 60.3 | 0 |
© 2017 by the authors. Licensee MDPI, Basel, Switzerland. This article is an open access article distributed under the terms and conditions of the Creative Commons Attribution (CC BY) license (http://creativecommons.org/licenses/by/4.0/).
Share and Cite
Baig, F.N.; Liu, S.Y.W.; Lam, H.-C.; Yip, S.-P.; Law, H.K.W.; Ying, M. Shear Wave Elastography Combining with Conventional Grey Scale Ultrasound Improves the Diagnostic Accuracy in Differentiating Benign and Malignant Thyroid Nodules. Appl. Sci. 2017, 7, 1103. https://doi.org/10.3390/app7111103
Baig FN, Liu SYW, Lam H-C, Yip S-P, Law HKW, Ying M. Shear Wave Elastography Combining with Conventional Grey Scale Ultrasound Improves the Diagnostic Accuracy in Differentiating Benign and Malignant Thyroid Nodules. Applied Sciences. 2017; 7(11):1103. https://doi.org/10.3390/app7111103
Chicago/Turabian StyleBaig, Faisal N., Shirley Y. W. Liu, Hoi-Chun Lam, Shea-Ping Yip, Helen K. W. Law, and Michael Ying. 2017. "Shear Wave Elastography Combining with Conventional Grey Scale Ultrasound Improves the Diagnostic Accuracy in Differentiating Benign and Malignant Thyroid Nodules" Applied Sciences 7, no. 11: 1103. https://doi.org/10.3390/app7111103