Article

Roller-Integrated Acoustic Wave Detection Technique for Rockfill Materials

Department of Hydraulic engineering, Tsinghua University, Beijing 100084, China
*
Author to whom correspondence should be addressed.
Appl. Sci. 2017, 7(11), 1118; https://doi.org/10.3390/app7111118
Submission received: 3 September 2017 / Accepted: 26 October 2017 / Published: 30 October 2017
(This article belongs to the Section Acoustics and Vibrations)

Abstract

:
This paper proposes a roller-integrated acoustic wave detection technique for rockfill materials. This technique can be divided into two parts: theoretical analysis and technical implementation. Based on Lamb’s problem and an infinite baffle piston radiation acoustic field model, a relationship model between the sound compaction value (SCV) and the dry density of the natural gravel materials (NGM) was established, namely, A-model. During the modeling process, an innovative differential pulse excitation method (DPEM) was used to find the numerical solution of the vertical displacement of the soil surface under harmonic loads. In this research, a continuous compaction control acoustic wave detection system (CAWDS) was developed and utilized along with real-time kinematic global positioning systems (RTK-GPS). The SCV was adopted as a characterization index for the compaction quality of rockfill materials. A case study on a reservoir project in Luoyang, China indicated that the SCV is highly linearly correlated with the number of compaction times, dry density, and compactness of the NGM. This new technique demonstrated several advantages, such as higher accuracy, discreetness, convenience, and suitability for detecting the compactness of the NGM. This technique is an effective tool for compaction quality control of rockfill materials and has a great potential for further applications.

1. Introduction

Effective control of compaction quality is critical to ensure the safety of rockfill dams [1]. Many researchers have attempted to develop compaction detection techniques and methods for soil. Based on whether or not the detection equipment is in contact with the material, these detection techniques and methods can be classified into contact and non-contact techniques and methods. Contact techniques and methods include the water-filling method, the falling weight deflectometer (FWD), the lightweight deflectometer (LWD), the dynamic cone penetrometer (DCP), the California bearing ratio (CBR), the nuclear density gauge, the resistivity test method, and so on. Non-contact techniques and methods include the roller-integrated compaction monitoring (RICM) techniques, intelligent compaction (IC) techniques, the ground penetrating radar (GPR) techniques, the Rayleigh wave techniques, the near-infrared and microwave resonance sensing technique, and so on.
Contact techniques and methods are utilized to detect the compactness of rockfill materials by measuring the density and moisture content of the materials. Krebs et al. [2] studied compaction control of highway materials using the sand cone method, which is time-consuming. In order to improve this disadvantage of the sand cone method, Rahman et al. [3] and Meehan et al. [4] further investigated compaction control of pavement layer materials and coarse-grained soil using the LWD, FWD, DCP, and soil stiffness gauge (SSG). Melbouci [5] and Zabilska-Adamska et al. [6] studied compaction control of recycled aggregate and cohesive soil and fly ash using the CBR test. Resende et al. [7] utilized the DCP to research quality control of mining tailing dams. Kongkitku et al. [8] developed the LWD for estimating the surface stiffness of lateritic soil. Subsequently, Umashankar et al. [9] utilized the LWD to study compaction control of pavement layers. To further simplify the operating process and improving efficiency, Swinford et al. [10] and White et al. [11] investigated soil compaction using the nuclear density gauge. Although contact techniques and methods have the advantages of high accuracy and wide application range, they also have obvious disadvantages of point sampling and destructive measurements, low efficiency, and higher requirements for operators.
In order to avoid the disadvantages of contact techniques and methods, lots of researchers have developed non-contact techniques and methods. Thurner et al. [12] and Forssblad [13] stated that the vibration acceleration amplitude and harmonic amplitude were correlated with the soil density and the underlying stiffness. Anderegg et al. [14] extracted the stiffness of the soil based on the vibration acceleration and phase difference. With in-depth research, a relative measurement index value (RICMMV) based on RICM was proposed to determine the compactness of the soil [15,16,17,18,19,20]. RICMMV is defined in various ways, including compaction meter value (CMV) used by Geodynamic [15], K b used by Ammann [16], machine drive power (MDP) used by Caterpillar [17,18,19], and OMEGA used by Bomag [20]. Furthermore, Rinehart et al. [21,22] pointed out that total harmonic distortion (THD) was a highly sensitive index for evaluating the compaction status of soil, and White et al. [18] introduced E v i b as a vibration modulus. Related studies have demonstrated that these indexes are closely correlated to the stiffness or modulus of compacted materials, and the non-contact techniques and methods based on RICMMV can be used to detect the compactness and evaluate the compaction quality of soil. By combining AFC techniques, some researchers have developed IC for road compaction control, and IC is currently widely used in Europe, Japan, and the United States [23,24,25]. Moreover, wave techniques have been used to the detect compactness of subgrade [26,27]. However, the law and mechanism theory of wave propagation in various soils have been not yet been well studied. The wave techniques have larger detection errors and higher requirements for operators. For pavement, the GPR techniques can detect the moisture content and compactness of subgrade; however, the influence of the surface jet moisture on the GPR signal during the compaction is unknown [28]. Austin et al. [29] utilized the near-infrared and microwave resonance sensing technique to monitor a continuous roller compaction process; however, this technique has a complex application and data processing procedure. Based on practical applications, non-contact techniques and methods have the advantages of being nondestructive, fast, and efficient measurements, while the disadvantages are low accuracy, the inconvenience and complexity of interpreting the compaction situation, significant discreteness, more error in the results, and being easily influenced by material factors.
In non-contact techniques and methods, CMV was often used to characterize the compactness of granular soils and evaluate the compaction quality [15,29]. Adam [20], Sandström [30], and Vennapusa et al. [31] indicated that CMV measurements must be interpreted in conjunction with the RMV measurements; this situation has caused inconvenience in the use of CMV [31]. Moreover, the research of White and Thompson [15] showed that CMV had greater discreteness and measurement errors; the discreteness of the CMV values increased with the increase of the particle sizes of the materials, and the measurement errors caused by discreteness made CMV unable to meet practical needs [15]. Based on the above problems, CMV was not suitable for rockfill materials with large particle sizes (>200 mm). Liu et al. [29] utilized RICM techniques to make a compaction quality assessment of earth–rock dam materials, the grain size of the material was less than 120 mm, the discreteness of CV values increased with the increase of particle size, and Liu’s method-based CV and regression model was not suitable for NGM (0.1~400 mm). The aim of this study was to propose a new compaction detection technique to solve problems with the current detection techniques.

2. Methodologies

The new compaction detection technique includes two aspects: theoretical analysis and technical implementation. In terms of the theoretical model, the interaction between the soil and the vibration wheel is considered as Lamb’s problem, namely, the propagation problem of vibrations over the surface of semi-infinite isotropic elastic solid, and the acoustic field generated by this interaction is regarded as the infinite baffle piston radiation acoustic field. The new technique is based on the vocal mechanism as follows: when the vibration wheel interacts with the soil, the soil is subjected to the vertical contact force and the horizontal friction. The combined action of the two forces makes the corresponding particles of the soil vibrate vertically and horizontally in a compound manner and simultaneously makes a sound. Meanwhile, the fluctuation caused by the vibration of the particles causes the density and pressure of the air medium at the interface between the soil and the gas to change, that is, the state of the air medium at the solid–air interface produces change. Thus, acoustic waves are generated at the interface and radiated in a certain form through the air medium. Considering the interaction form between the vibration wheel and the soil and its boundary condition, the acoustic wave radiation field formed at the solid–gas interface can be regarded as the piston-type radiation field on the infinite plate. Namely, when the vibration wave located in the solid medium surface propagates, a specific area located in the solid medium surface can be treated as the circular piston radiator on the infinite baffle; the piston vibrates in the vertical direction at speed u , and radiates acoustic waves to the semi-infinite space in front of the baffle.
In terms of technical implementation, the detection principle is as follows: this acoustic wave detection technique includes detection and signal analysis. The detection equipment is installed on the vibratory roller and mainly contains the acoustic field microphone, the signal acquisition analyzer, the display, and the GPS receiver. When the filling layer is compacted by the roller, the time domain signal of the acoustic wave field formed near the contact surface of the vibratory wheel and the soil is received by the acoustic field microphone mounted on the outer frame of the vibration wheel, and then collected by the analyzer to form digital signals. The GPS receiver mounted on the roller simultaneously provides the spatial signal associated with the roller location. The signal acquisition analyzer performs the filtering and the spectrum analysis to the effective acoustic signal to obtain the second harmonic amplitude (SHA). According to the correlation between the SHA and the compactness or density of the rockfill material, a continuous compaction index is established after calibration. Combined with the spatial location information, a spatiotemporal compactness distribution map of the rolling region is presented on a roller-integrated display. In addition, combined with the compactness feedback module, it is easy to realize intelligent compaction by adjusting the mechanical parameters.

2.1. Theoretical Analysis

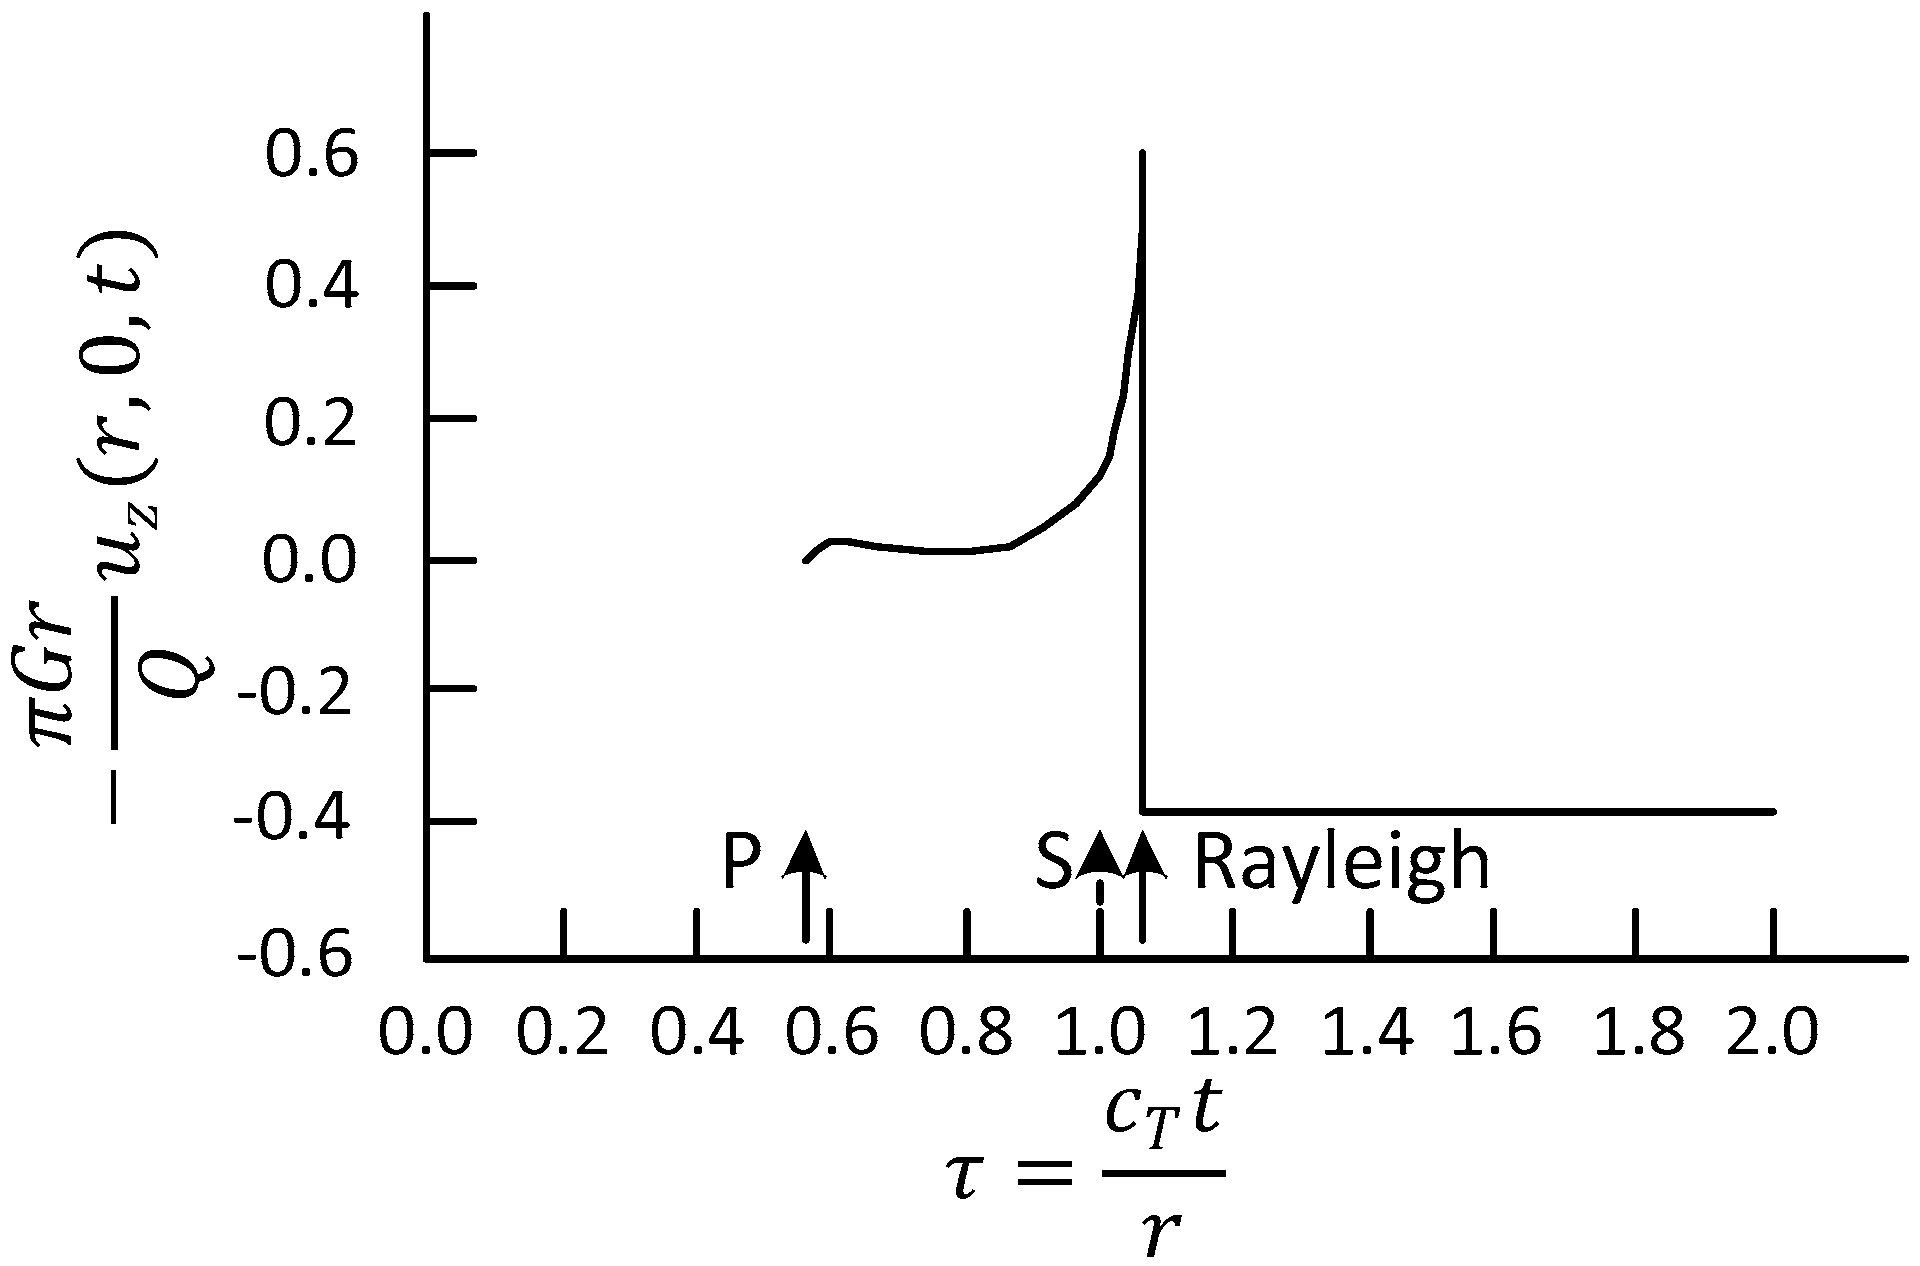
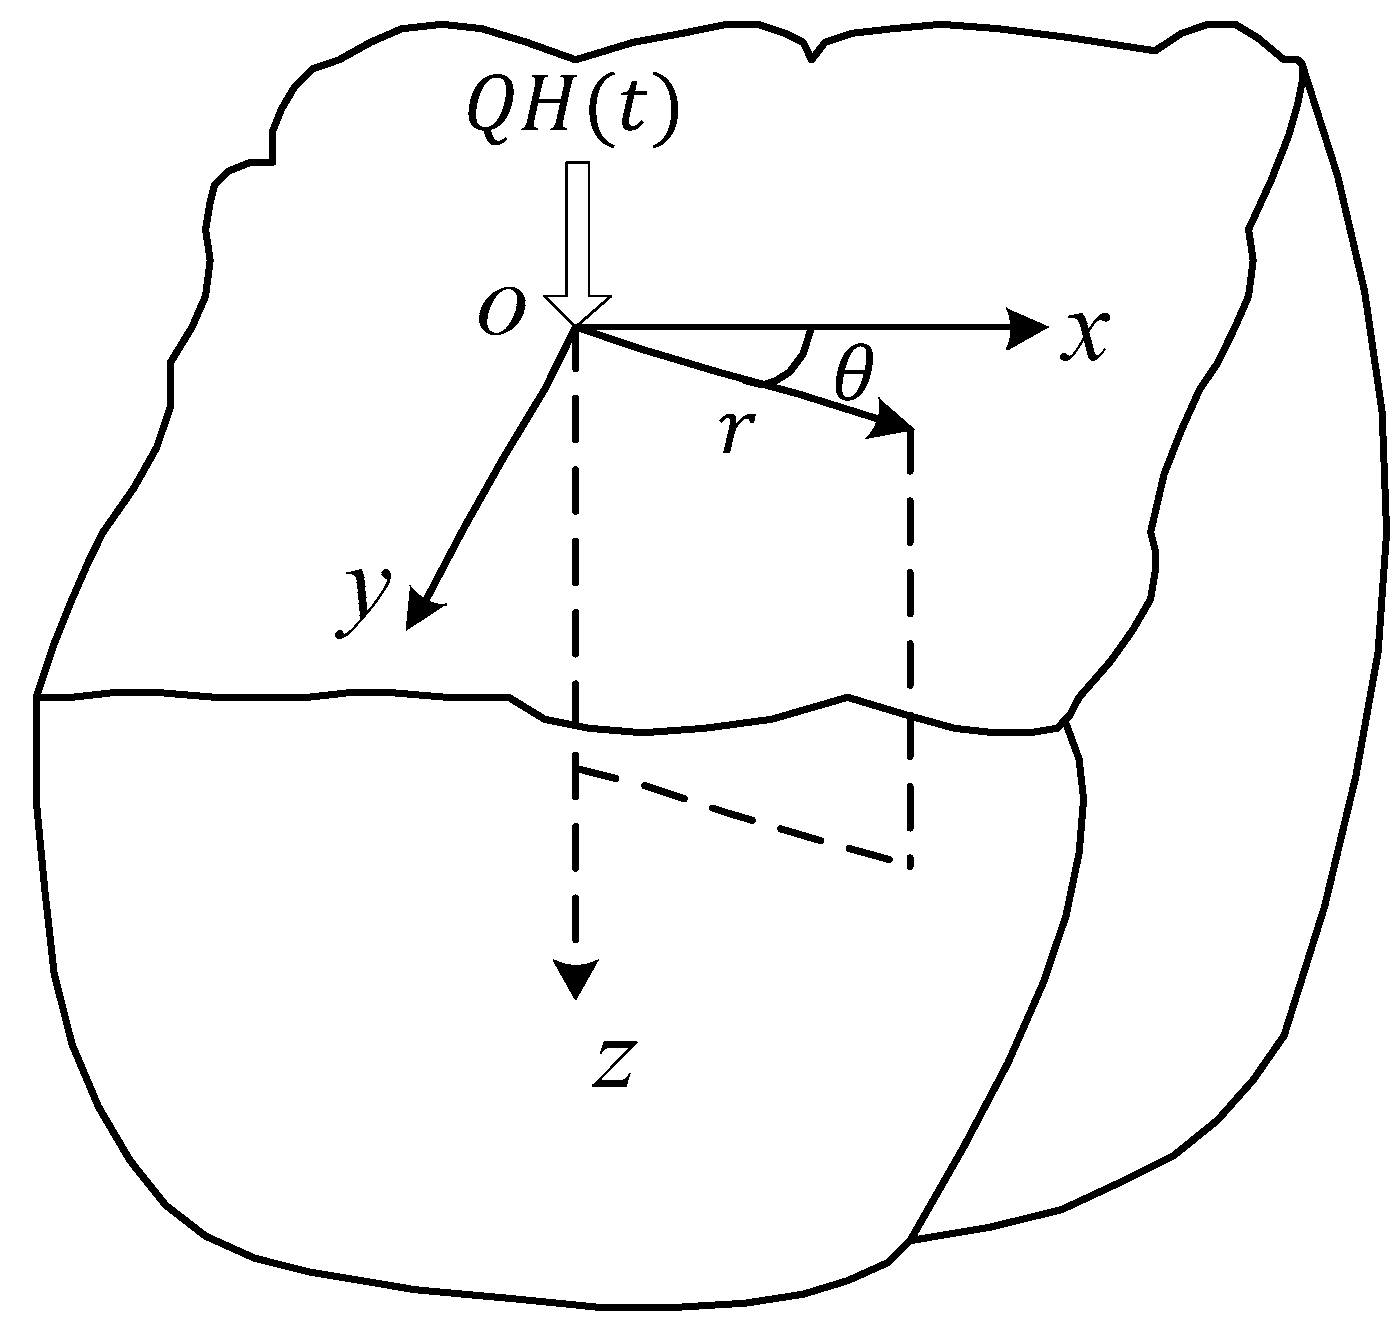
2.1.1. Lamb’s Problem

The elastic fluctuation problem caused by dynamic line load or point load on the surface or interior of a semi-space is a type of problem with great significance in the fluctuation field of elastic solids. The original research can trace back to the classics of Lamb [32]. In the early 1930s, Cagniard developed a general method for solving Lamb problems, using this displacement field of the Fourier transform, with the inverse transformation obtained by using Laplace transform. After that, De Hoop [33] made further improvements. Reissner [34] has analyzed the flexible circular plate problem under a uniformly distributed load on an elastic semi-space, and the problem can be solved by the Rahm solution integration of point load problems. In 1953, Quinlan [35] and Sung [36] published two papers to expand Reissner’s solution by considering the influence of the pressure distribution on the circular contact area on the surface of the semi-space. For the dynamic response of saturated soil, Biot [37] first established the phenomenological theory of two-phased medium fluctuation problems. The establishment of the theory made it possible to study the vibration characteristics of the foundation on the saturated soil foundation in the real sense. Since Biot established the wave equation of saturated porous media in 1956, Paul [38] and Philippacopoulos et al. [39] carried out a thorough study of Lamb’s problem when there were horizontal and vertical forces on the surface of saturated soil. Paul ignored the viscous fluid in saturated soil, utilized the Hankel transform and Cagniard method, adopted the Helmholz decomposition proposed by Deresiewicz, and was the first to study Lamb’s problem in saturated semi-space. Wang et al. [40], hypothesizing that viscosity was included in the dynamic permeability coefficient, adopted the integral transformation method to solve simultaneous coupled equations, avoided the introduction of potential functions, and gave the integral form solution of saturated elastic semi-space under low-frequency harmonic concentrated force. Cai [41] studied the steady response of axisymmetric soil under vertical load, and developed the amplitude curve of surface displacement. On the basis of these fundamental solutions, the dynamic interaction between saturated soil and various types of foundations has also been extensively studied [42,43,44]. Lamb’s problem has been extensively studied internationally, and significant progress has been made. The analysis methods of such problems are constantly improving, and the solution to the problem is more refined.
In this paper, the interaction between the soil and the vibratory wheel was considered as Lamb’s problem of saturated soil. In order to solve this problem, based on the vertical displacement solutions in the case of normal concentrated load on the surface of the space, an innovative differential pulse excitation method (DPEM) was proposed to solve the vertical displacement in the semi-space under simple harmonic loading. The isotropic and homogeneous semi-space is shown in Figure 1, and its surface is the X–Y plane.
The coordinate axis z points to the interior of the semi-space. There is a normal concentrated load of Q H ( t ) at the origin o . Since the load is symmetrical to the z axis, the problem of wave motion in the infinite elastic semi-space is axial symmetry. Based on a cylindrical coordinate system ( r , θ , z ), u z by the displacement potential φ and χ ( ψ = 0 ) of the cylindrical coordinate system symmetric situation are expressed as follows:
u z = φ z     1 r r ( r χ r ) .
Based on the study of Lamb [32] and other researchers [35,38,39,40], the vertical displacement of the surface is as follows:
u z ( r , 0 , t ) = { 0   ( τ < c T / c L ) Q π 2 G r G 1 ( τ )   ( c T / c L < τ < 1 ) Q π 2 G r [ G 1 ( τ ) + G 2 ( τ ) ]   ( τ > 1 ) .
After further investigation, Pekeris [45] obtained the analytic results of the integral by means of partial fraction decomposition of the integrand function of G 1 ( τ ) ,   G 2 ( τ ) . Figure 2 shows the alternative relation of the surface vertical displacement u z ( r , 0 , t ) with the change of τ .
Since a normal concentrated load Q H ( t ) acts on the origin o (Figure 1), and the load is symmetrical to the z-axis, Q at this time is a constant force. For the vibratory roller, the exciting force Q 0 is introduced by the centrifugal force when the eccentric oscillator is rotated at a high speed. It is related only to the static eccentricity M e and the angular frequency ω of the vibrator. In the vibration system with damping, a periodic force must be exerted from an external source to maintain the vibration. Generally, the harmonic excitation is the main force, and the vibration wheel of the roller works under the simple harmonic excitation. Assuming that the vibration system is subjected to a simple harmonic load of Q ( t ) = Q 0 cos ω t , the vertical displacement u z of the soil on the semi-space surface under the action of the simple harmonic load needs to be solved. In this study, an innovative differential pulse excitation method was proposed, and the differential pulse excitation was used to simulate the harmonic load excitation to solve the vertical displacement. The specific method is as follows:
(1)
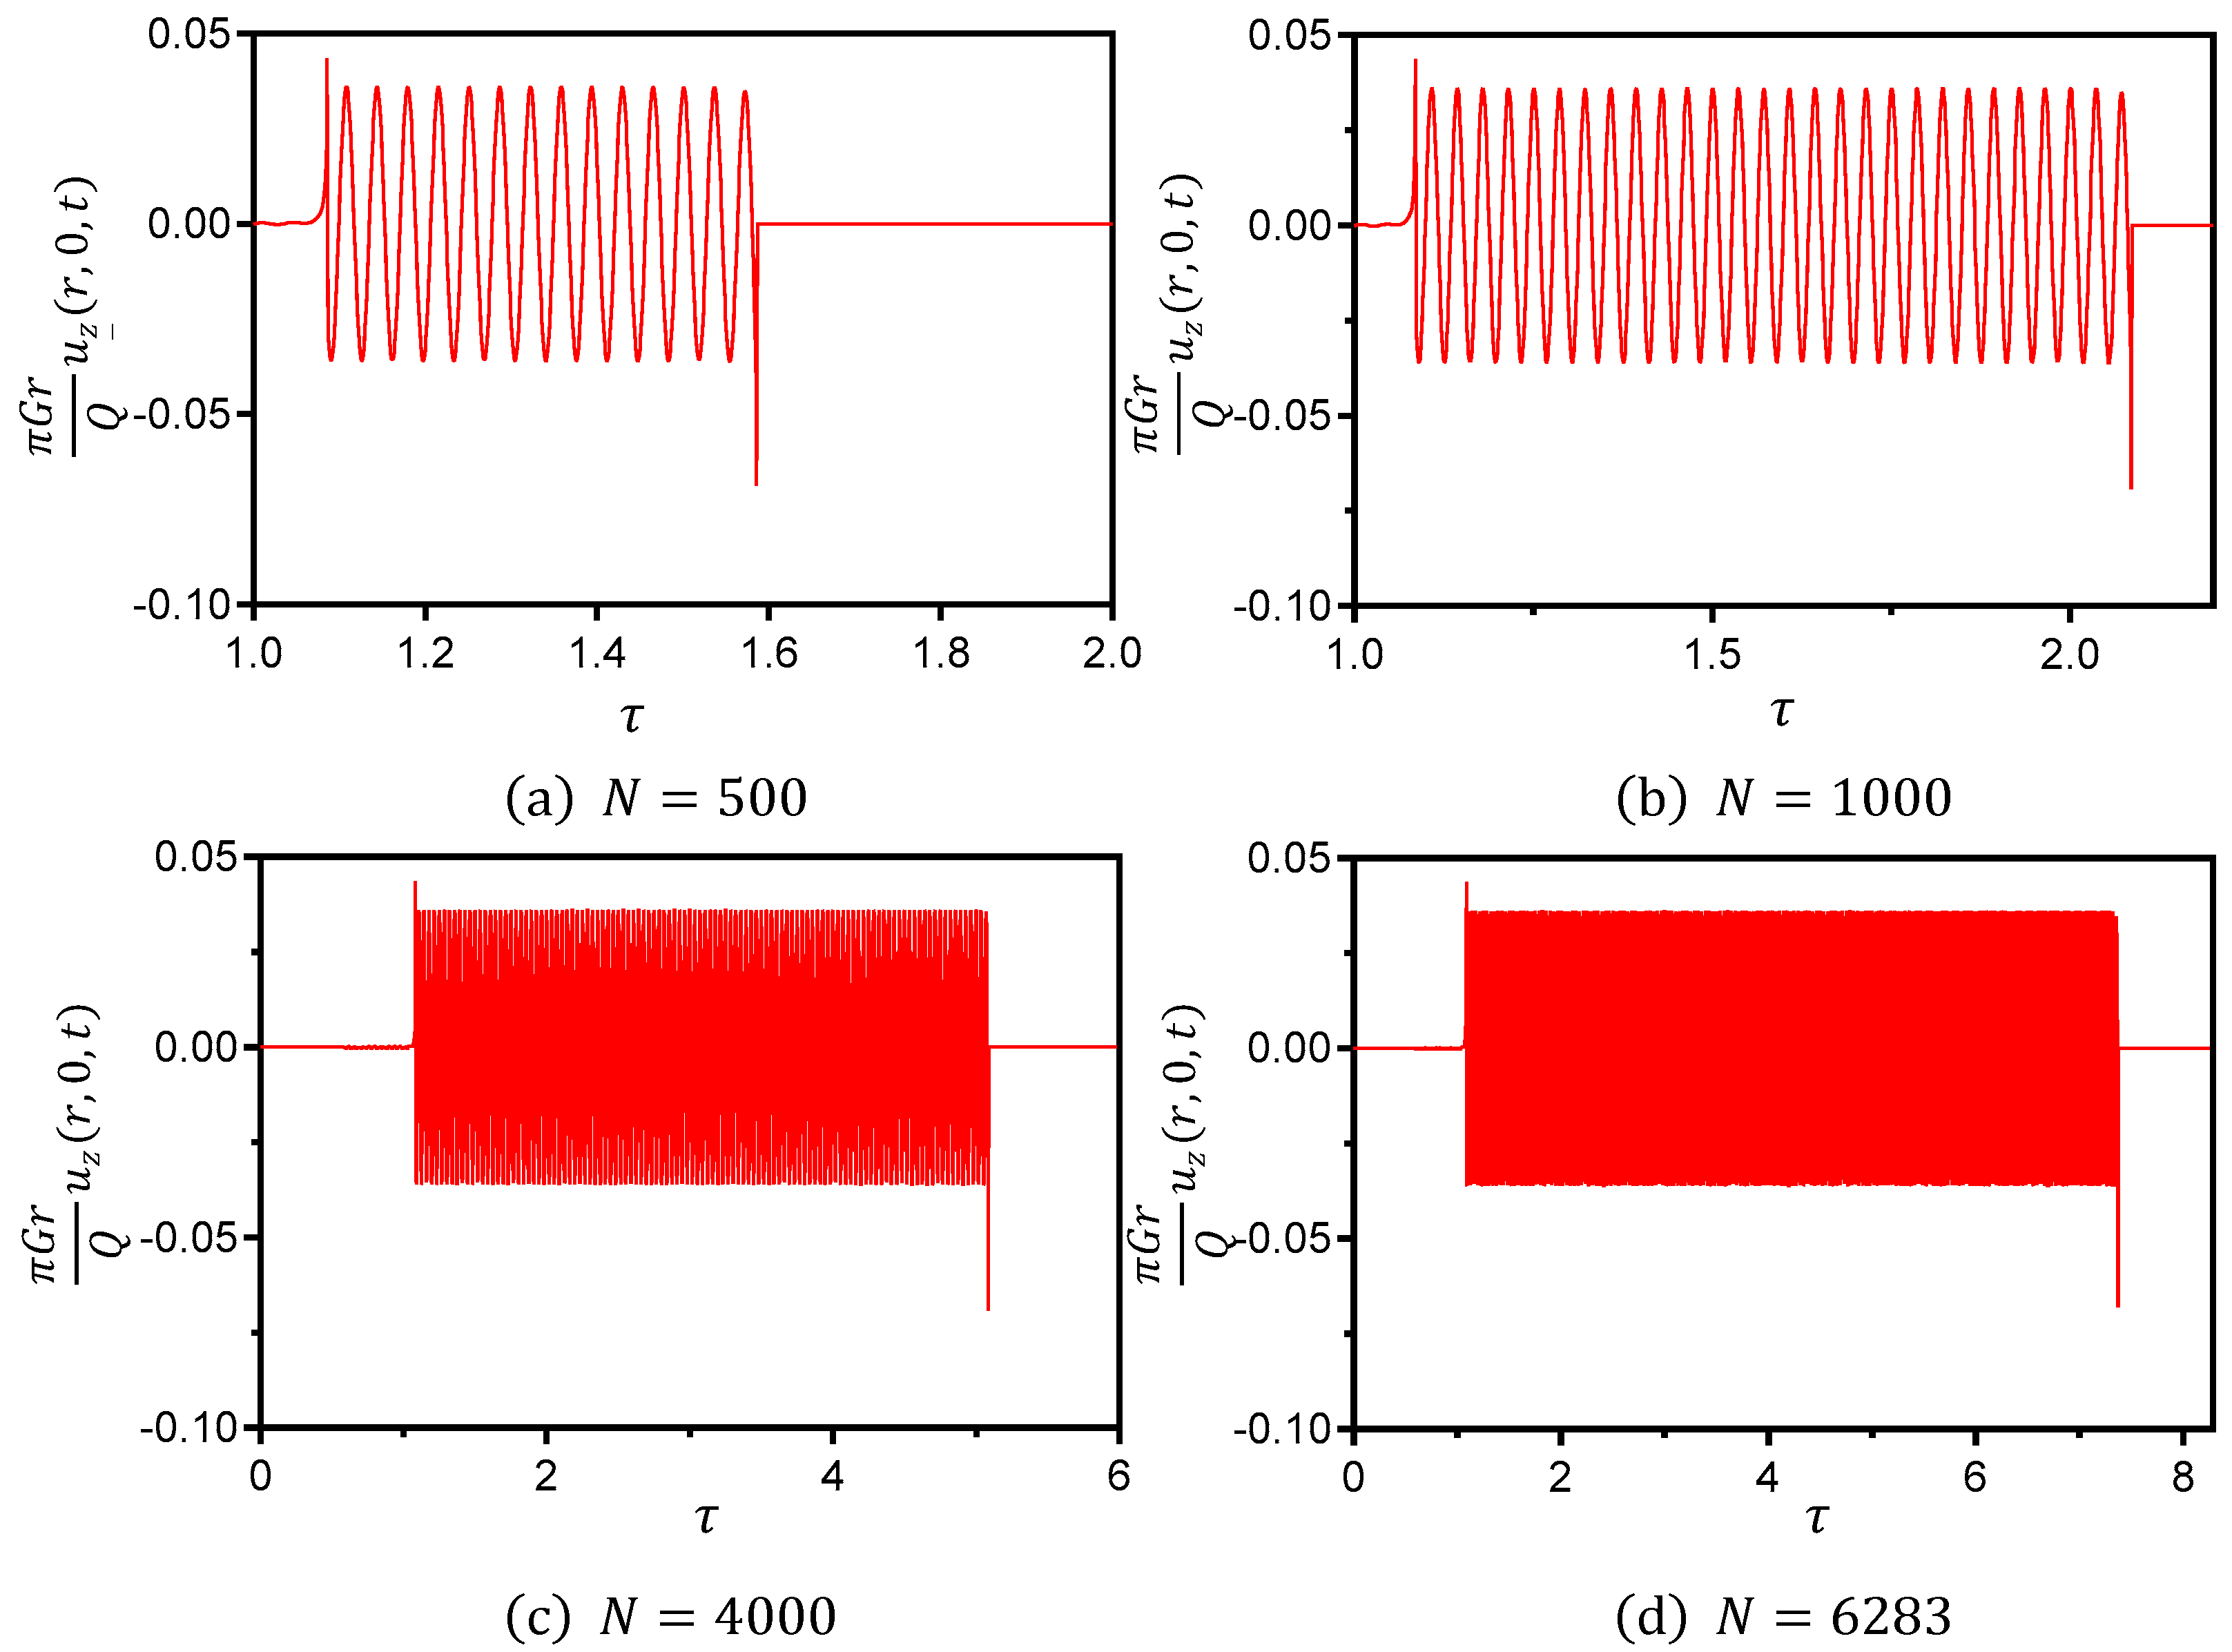
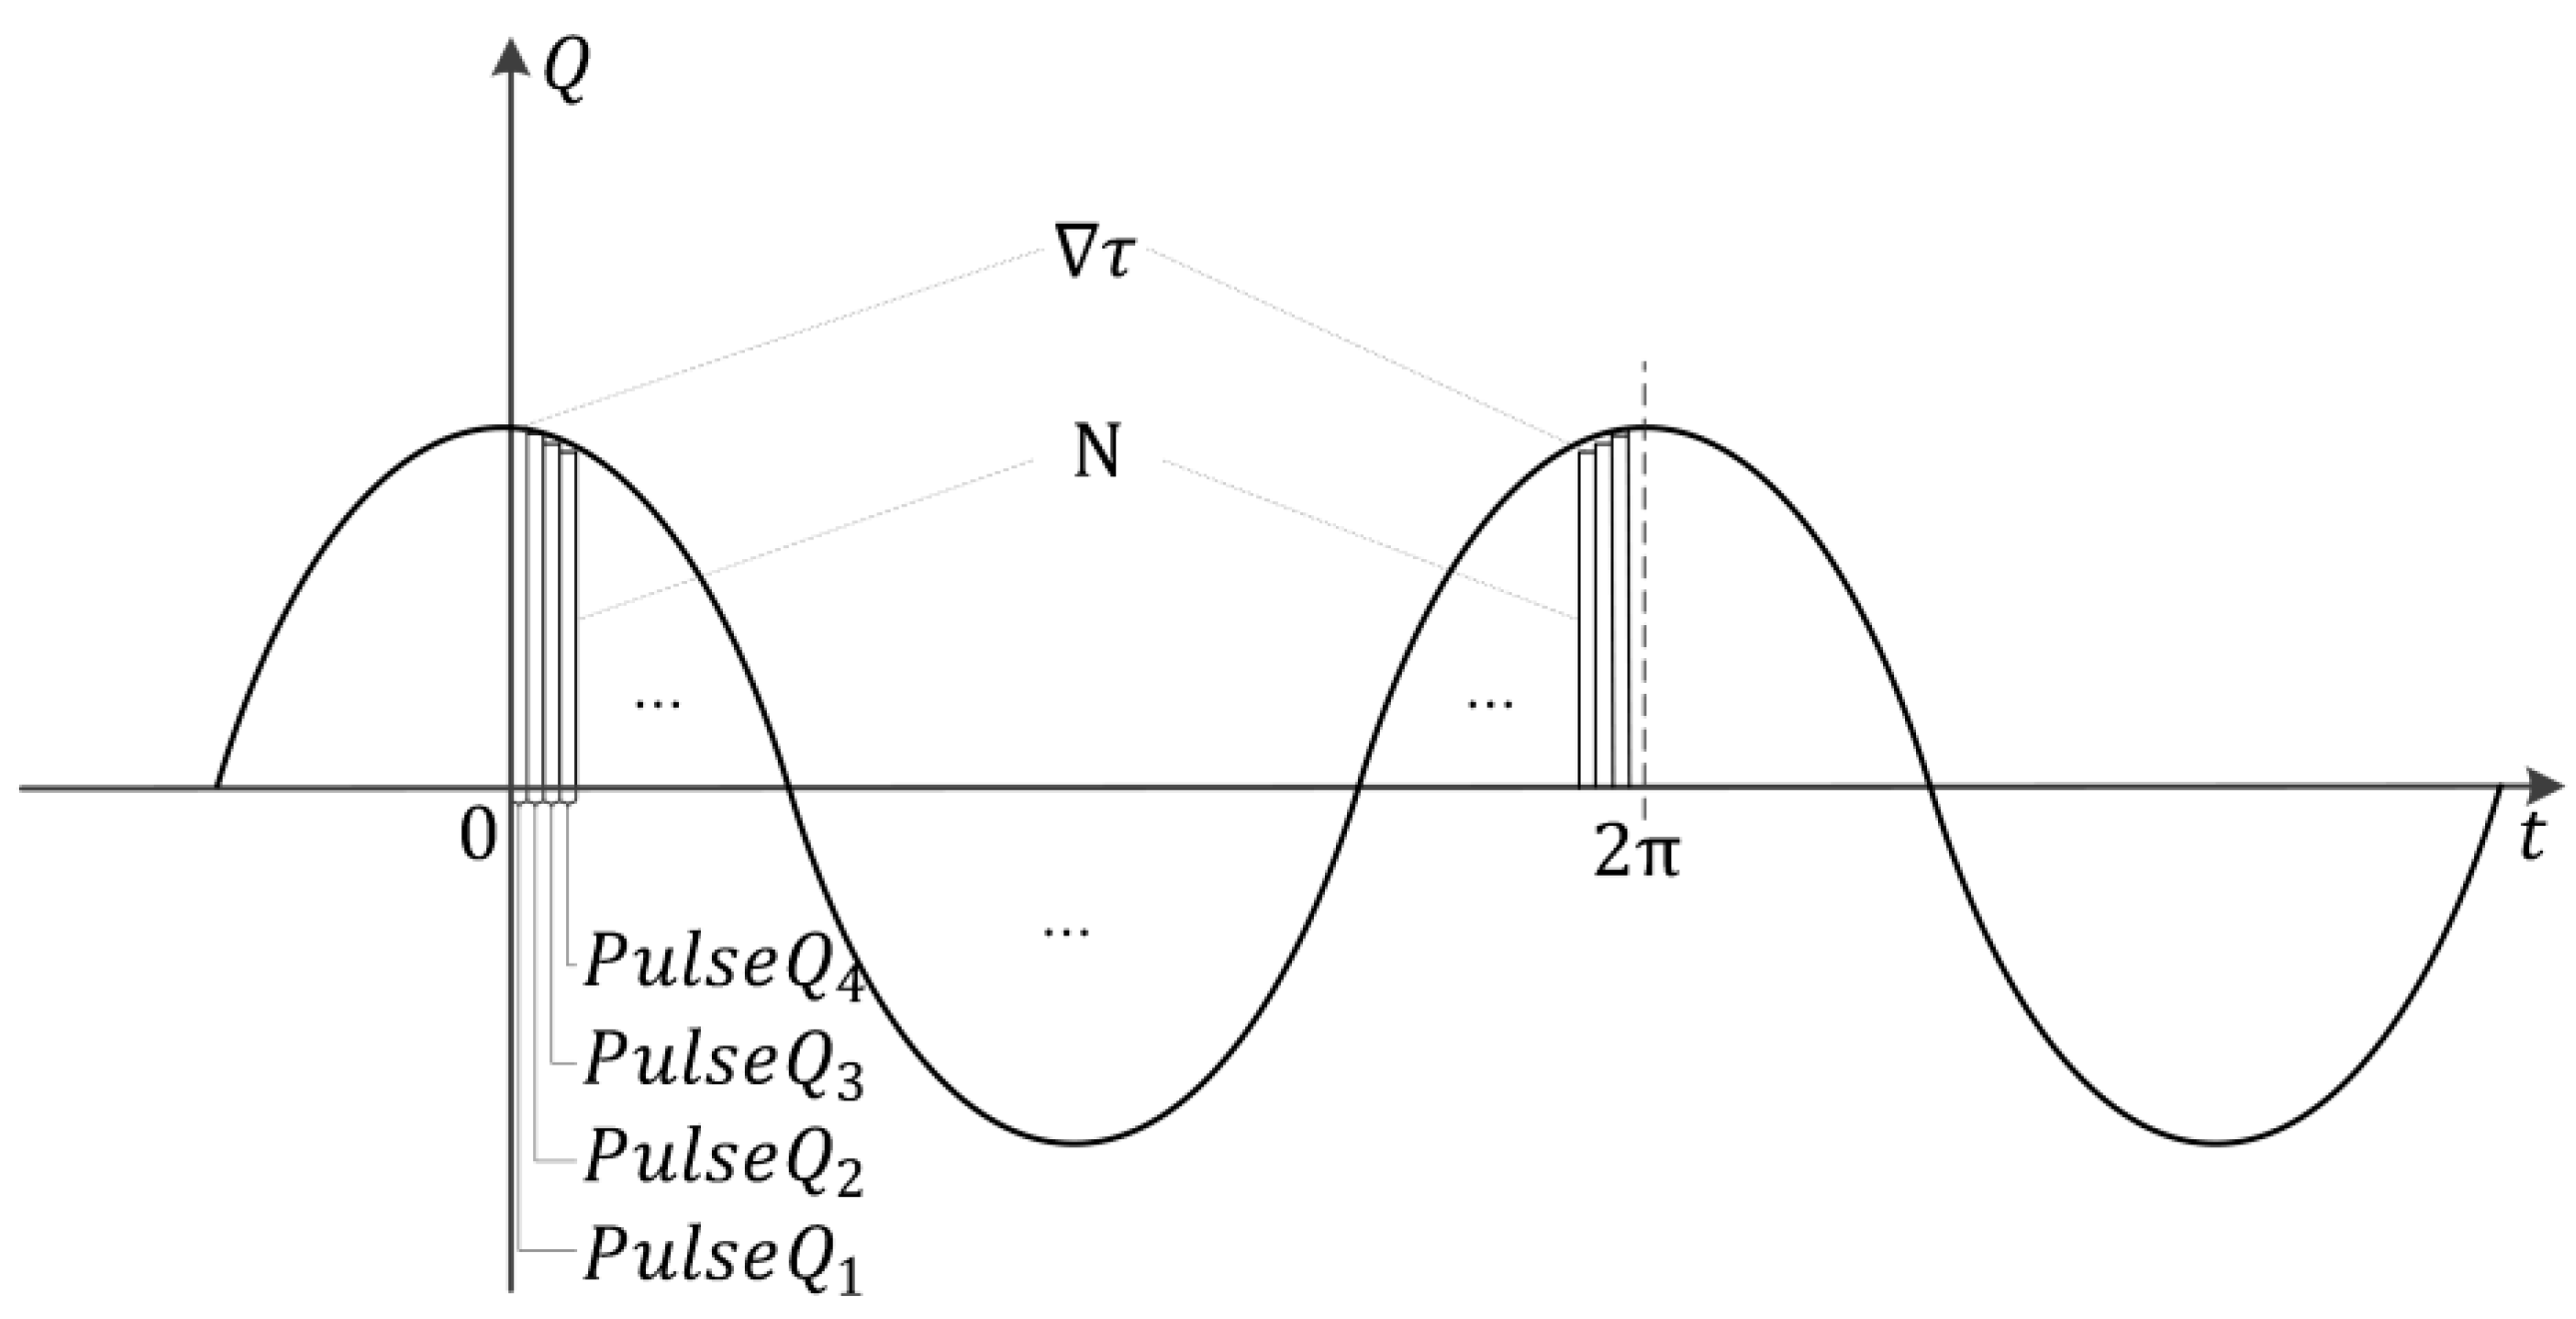
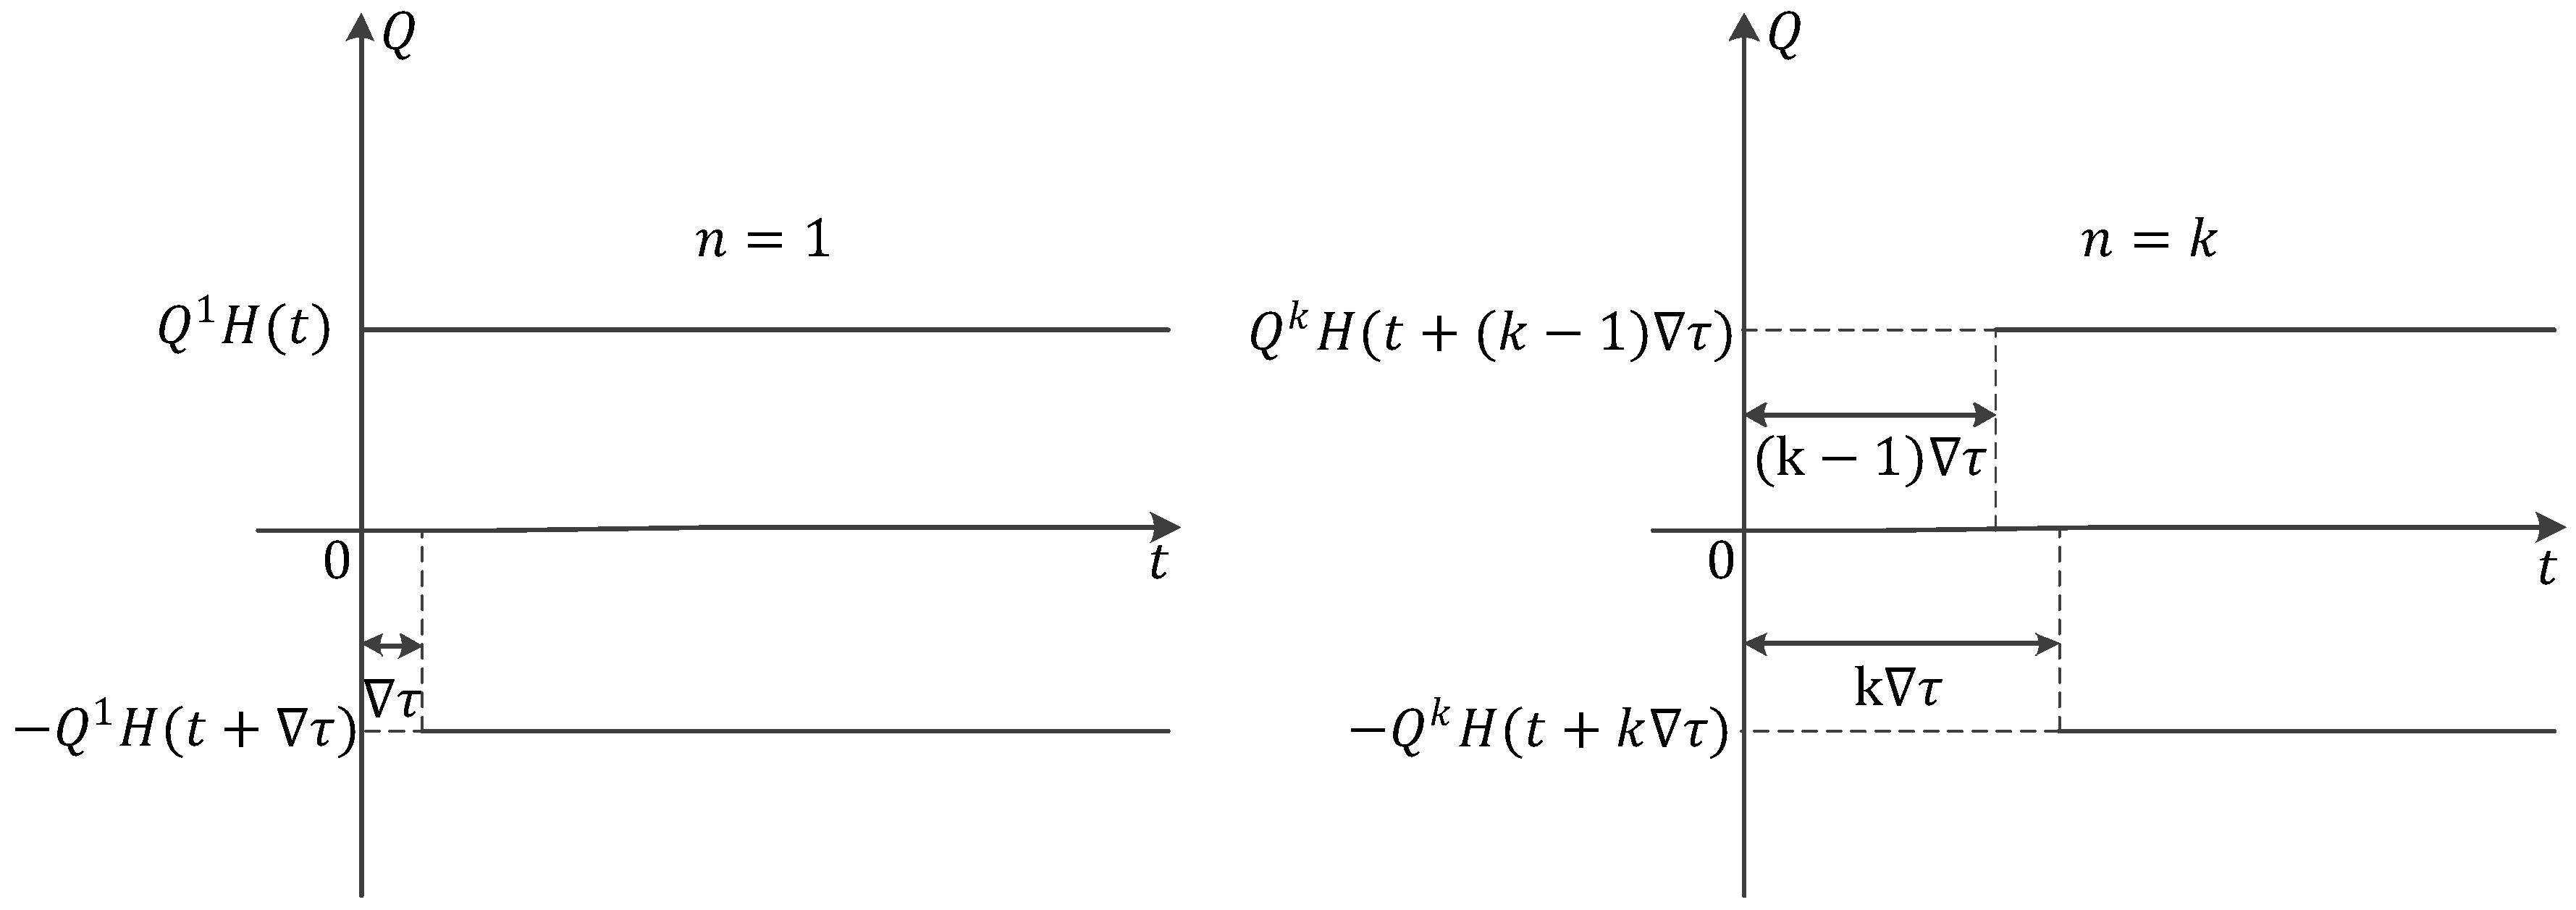
Firstly, the periodic harmonic load excitation is discretized into N parts, then the Nth excitation pulse is Q n   ( n [ 1 , N ] ), as shown in Figure 3.
(2)
Then, assuming Q n = Q n ( ( n 1 ) τ ) H ( t + ( n 1 ) τ ) Q n ( t + ( n 1 ) τ ) H ( t + n τ ) , τ is the delay time and Q n ( ( n 1 ) τ ) = Q 0 cos ( ω ( n 1 ) τ ) , as shown in Figure 4.
(3)
Impulse excitation Q 1 , Q 2 , Q 3 , Q 4 ,   ,   Q k , , Q N are applied to the origin o , respectively, and the vertical displacement u k ( k [ 1 , N ] ) at the distance r from the origin o is obtained when the different pulse loads act on the semi-space surface. When [ 0 , t ] , ( t [ 0 ,   2 π ] ) , the true vertical displacement u z of the soil under the simple harmonic load Q ( t ) = Q 0 cos ω t at any time in a cycle can be obtained by integrating the vertical displacement response of the pulse excitation. The displacement u z is as follows:
u z = 0 t u k d t ,
where k [ 1 , t / τ ] and t / τ is an integer.
To ensure the accuracy of the waveform and displacement as shown in Figure 4, let τ = 0.001 s , then N = 2 π / τ 6283 . By utilizing the above method to solve the vertical displacement under a simple harmonic load, the required vertical displacement can be obtained by combining the research result of Pekeris and relevant data. Figure 5 shows the change of the vertical displacement when t = 500 τ , 1000 τ , 4000 τ , 6283 τ , respectively.
By solving the problem, the real vertical displacement u z of the soil on the surface of the semi-space at any time in a cycle under the harmonic load Q ( t ) = Q 0 cos ω t can be obtained as follows:
u z ( r , 0 , t ) = Q 0 A 0 π G r c o s ω 0 t ,
where A 0 = 0.03605 and ω 0 = 2 π / T 0 ,   T 0 = 0.036   s .
To solve the real-time vertical displacement of multiple cycles, the displacement function of Equation (4) just needs to be shifted.

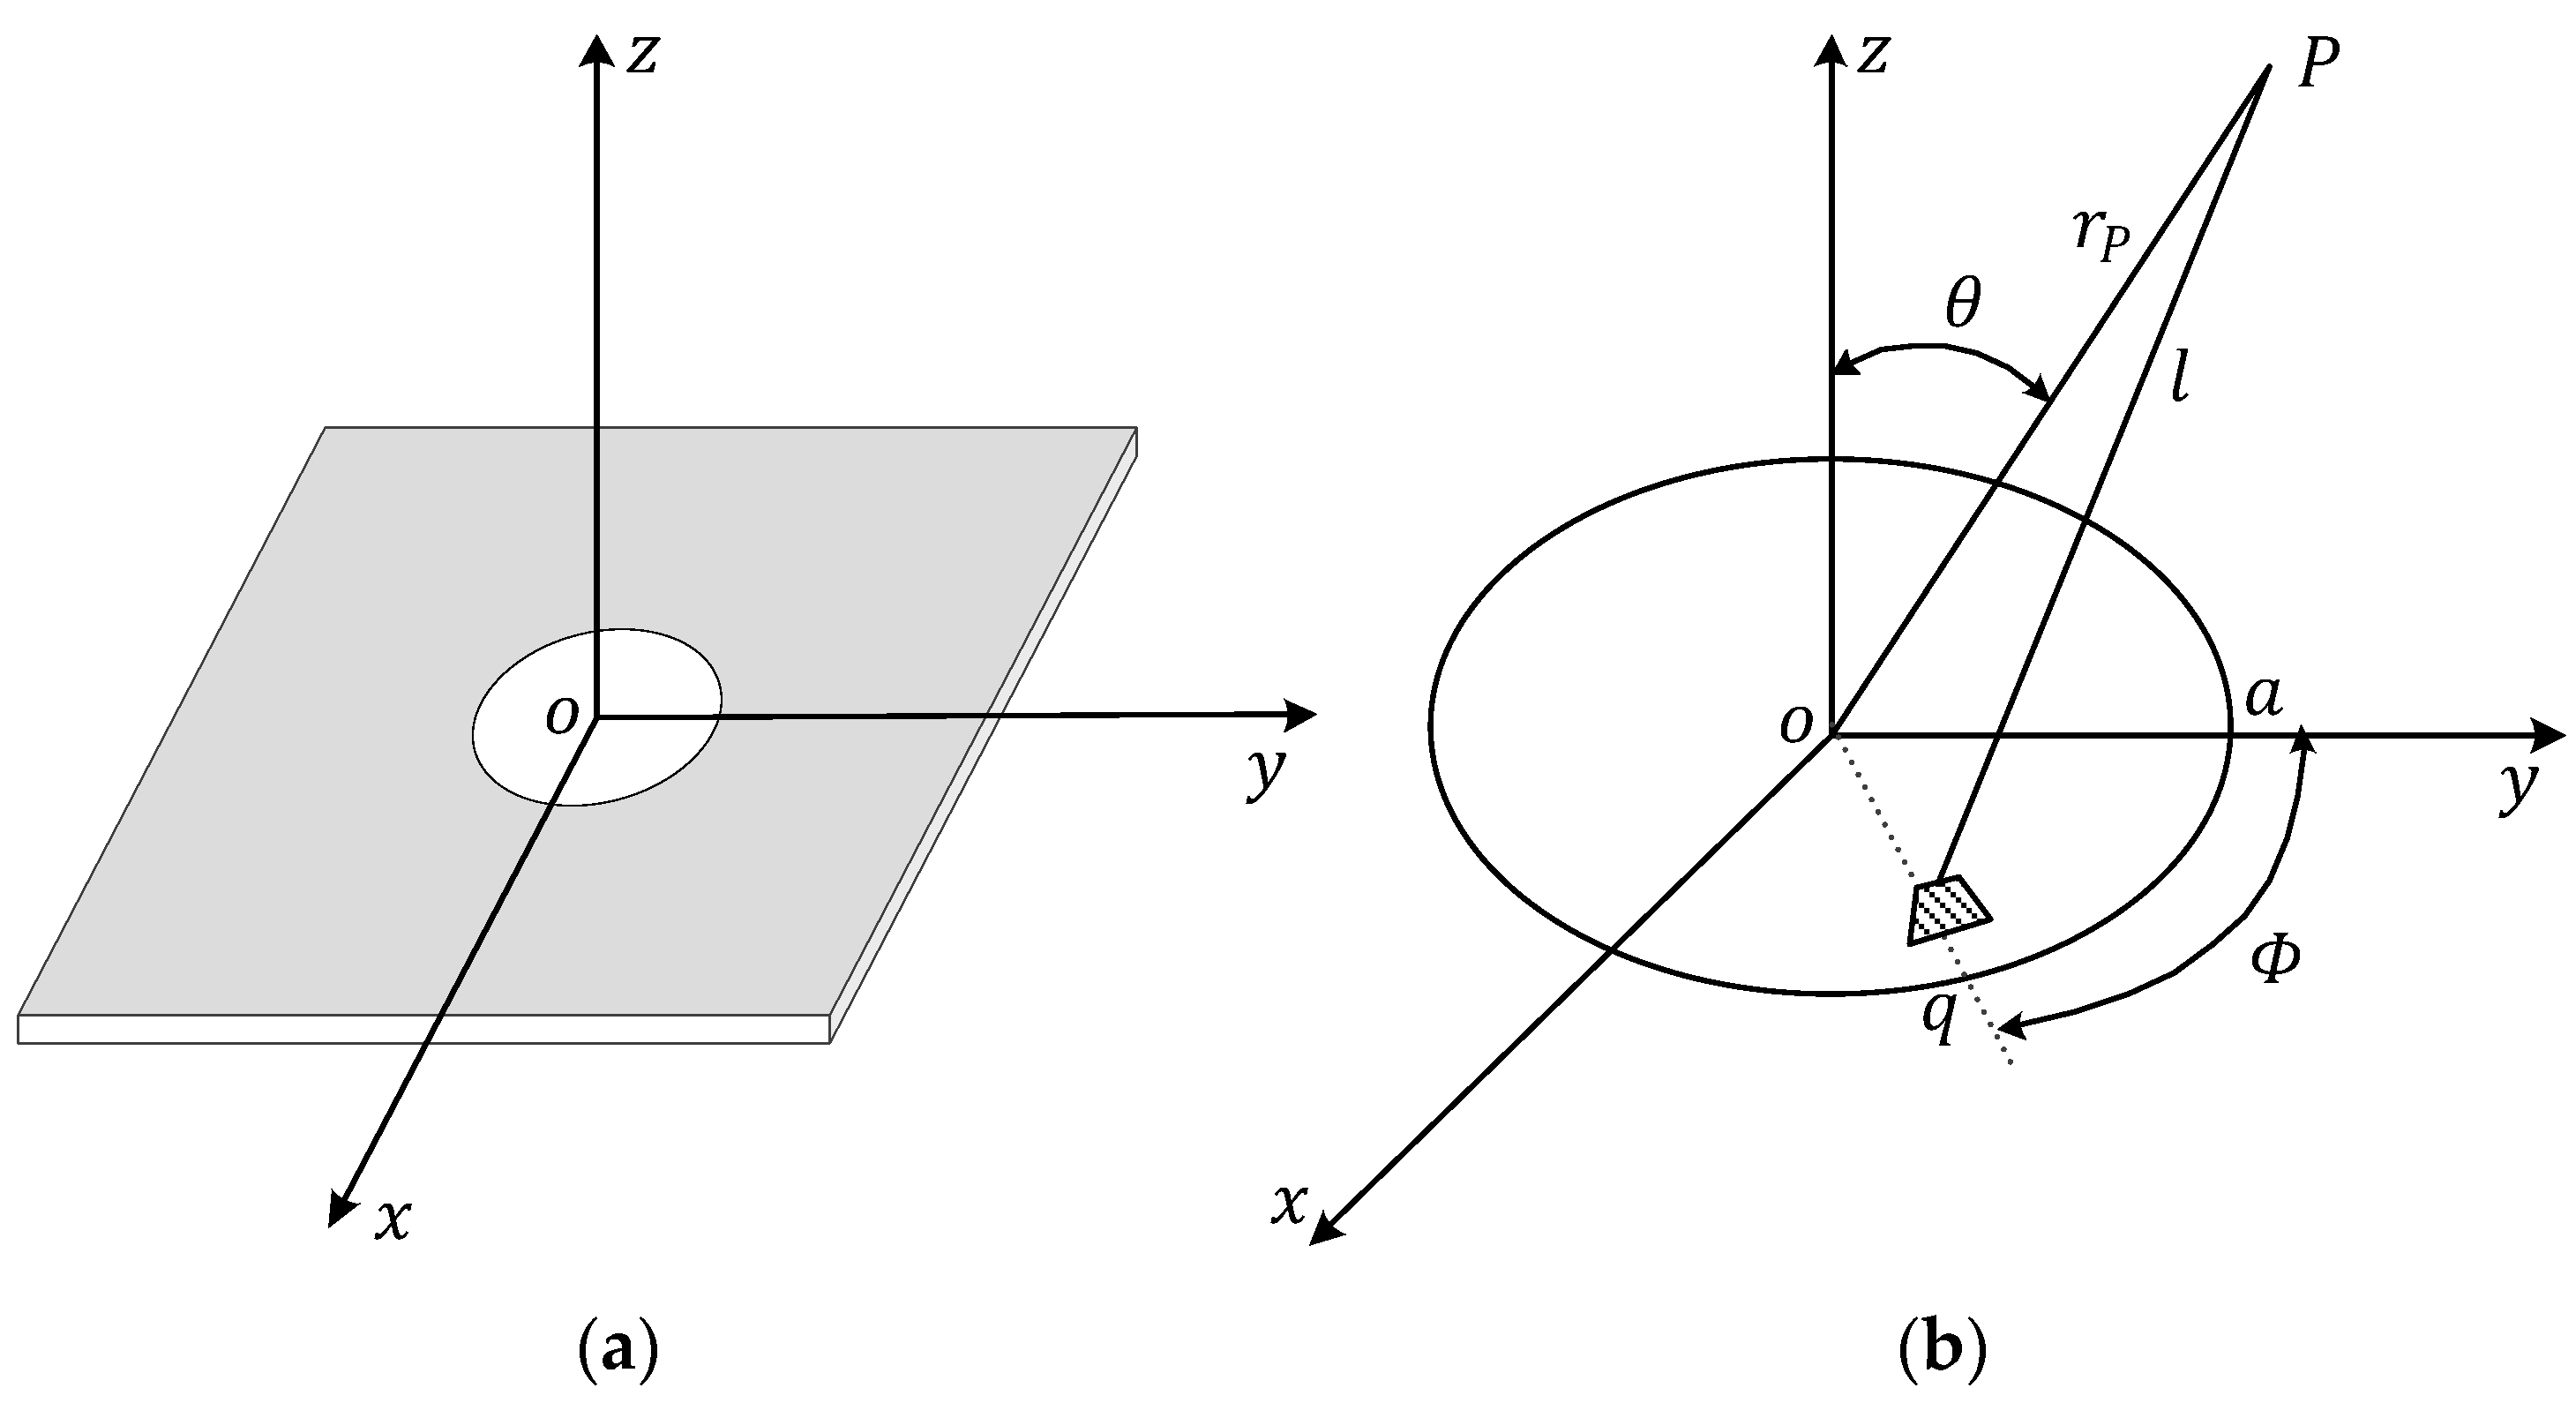
2.1.2. Infinite Baffle Piston Radiation Acoustic Field

Figure 6a shows a circular piston radiator on an infinite baffle. When the piston vibrates at the speed u = u A e i ω t of in the z direction, the radiator radiates the acoustic wave to the semi-infinite space in front of the baffle. In Figure 6b, a surface element with an area of d S and a distance of q from the center of the piston is selected. Since far field acoustic wave radiation is studied here, this surface element can be considered as a point source, and the entire piston radiator is made up of many point sources. Based on teaching materials and the literature, the far field radiation sound pressure is described as follows:
p = i a ρ 0 c u A J 1 ( k a s i n θ ) 2 r P s i n θ e i ( ω t k r P ) .
For an N order first class Bessel function, if n is a positive integer or zero, Γ ( n + m + 1 ) = ( n + m ) ! . In addition, considering the relation between the zero-order and the first-order Bessel functions, assign n = 0 ,   n = 1 , the following formula is obtained:
J 1 ( x ) = x 2 x 3 2 3 · 2 ! + x 5 2 5 · 2 ! 3 ! x 7 2 7 · 3 ! 4 ! + + ( 1 ) k x 2 k + 1 2 2 k + 1 k ! ( k + 1 ) ! + .
Considering the characteristics of the acoustic far field, there following relations are obtained: r P a , r P a 2 / l . According to the small quantity property of the Bessel function, when x 0 , substituting J 1 ( x ) into Equation (5), the following formula is obtained:
p ( r P , t ) = i k a 2 ρ 0 c u A [ 1 2 1 16 ( k a s i n θ ) 2 ] 2 r P e i ( ω t k r P ) i k a 2 ρ 0 c u A 4 r P e i ( ω t k r P )

2.1.3. Analytical Solution

In acoustics, the sound pressure and particle velocity often need to be computed. For the ease of calculation, plural forms are often used to express these physical quantities. The speed of the piston in the z direction can be written as u = u A c o s ω t , and the displacement of the piston in the z direction is as follows:
u ¯ z 0 = 0 t u d t = u A s i n ω t .
When τ = 1.088 , Rayleigh will arrive, and τ = c T t 0 / r = 1.088 , therefore t 0 = 1.088 r / c T . Since c T = G / ρ , at time   t 0 , the boundary condition between the soil and the air medium can be described by Equation (8):
u ¯ z 0 | t = t 0 = u z ( r , 0 , t 0 ) .
Substituting Equation (4) and Equation (7) into Equation (8), since k = ω / c , where k is the wave number, ω is the angular frequency, and c is wave velocity, Equation (9) is obtained:
k = 1 c arcsin ( Q 0 π G r u A c o s ( 1.088 ω 0 r ρ G ) ) .
Substituting Equation (9) into Equation (6), the sound pressure expression is obtained:
p ( r P , t ) = i a 2 ρ 0 u A 4 r P arcsin ( Q 0 π G r u A c o s ( 1.088 ω 0 r ρ G ) ) e i ( ω t k r P ) ,
where u A = p 0 / ρ 0 c 0 , p 0 is the standard atmospheric pressure at ambient temperature, c 0 is the propagation velocity of the acoustic wave in the air medium at ambient temperature, ρ is the mass density of the soil, and μ is the shear modulus of the soil.
After Equation (10) is carried on by FFT, the root mean square (RMS) amplitude can be obtained. In Equation (11), b 0 is a constant:
A = a 2 ρ 0 u A 4 r P b 0 arcsin ( Q 0 π G r u A c o s ( 1.088 ω 0 r ρ G ) ) .
Lade and Nelson [46] developed a nonlinear isotropic model for the elastic behavior of granular materials. In their research, the Young’s modulus is expressed as in Equation (12):
E = M p a [ ( I 1 p a ) 2 + R J 2 p a 2 ] λ .
Based on Lade and Nelson, Liu et al. [47] carried out a constitutive modeling research of dense gravelly soils subjected to cyclic loading. In their paper, modulus G is further expressed as Equation (13):
G = G 0 p a ( 2.97 e ) 2 1 + e [ ( 3 p p a ) 2 + 9 K 0 G 0 J 2 p a 2 ] m / 2 ,
where G is the shear modulus, G 0 and m are material constants, e is the current void ratio, and p a is the atmospheric pressure.
Substituting Equation (13) and e = 1 ρ 0 / ρ into (11), Equation (14) is obtained:
A = a 2 ρ 0 u A b 0 4 r P arcsin ( Q 0 M 0 π r u A 2 ρ 2 ρ ρ 0 ( 1.97 ρ + ρ 0 ) 2 c o s ( 1.088 ω 0 r ρ 1.97 ρ + ρ 0 M 0 ( 2 ρ ρ 0 ) ) ) ,
where M 0 = G 0 p a [ ( 3 p / p a ) 2 + 9 ( K 0 / G 0 ) ( J 2 / p a 2 ) ] m / 2 , ρ is the mass density, and ρ 0 is the dry density.
A diagrammatic sketch of the compacting area in pulse load duration time ( Δ τ ) is shown in Figure 7. The velocity of the roller is v . As mentioned above, the harmonic load is discretized into N parts (Figure 3). The duration of each pulse load is Δ τ . The compaction area during the time interval Δ τ is illustrated as rectangle ABCD in Figure 7. At this point, the area ABCD can be considered to consist of N c rows and M c columns of small piston radiators. Then the radiation field generated by the interaction between the vibration wheel and the soil is composed of N c rows and M c columns of small piston radiators on the infinite baffle. The radius for each piston is a = 0.01   cm , and since the length of the vibration wheel is L = 2.2   m , the number of pistons in each column is N c = L / 2 a = 11 , 000 , and the number of pistons in each row is M c = v Δ τ / 2 a ,   M c Z .
When there is an interaction between the vibration wheel and the soil, the result of the joint action of all piston radiation acoustic fields in the far field P point is as follows:
A all = 2 M c r P 0 r P N / 2 A d r P = a 2 ρ 0 u A M c b 0 2 ( l n r P N / 2 r P 0 ) arcsin ( Q 0 M 0 π r u A 2 ρ 2 ρ ρ 0 ( 1.97 ρ + ρ 0 ) 2 cos ( 1.088 ω 0 r ρ 1.97 ρ + ρ 0 M 0 ( 2 ρ ρ 0 ) ) ) .
Based on Equation (15), the theoretical relation model of SHA and the dry density of the soil were established and it was called the A-model.

2.1.4. Numerical Solution

In this section, a numerical result is presented for A-model, established in this paper. All the parameters and theoretical models are coded using MATLAB language. The numerical solution related to gravel materials was validated by comparing with results computed from the field test based on the new compaction detection technique proposed in this paper and traditional point measurements (water-filling method) in Section 4. Table 1 represents the key parameters required for the numerical analysis. Figure 8 shows the relation curve between the dry density of certain gravel materials and the SCV based on A-model. The result represents an approximately linear relation between the SCV and the dry density of the gravel materials.

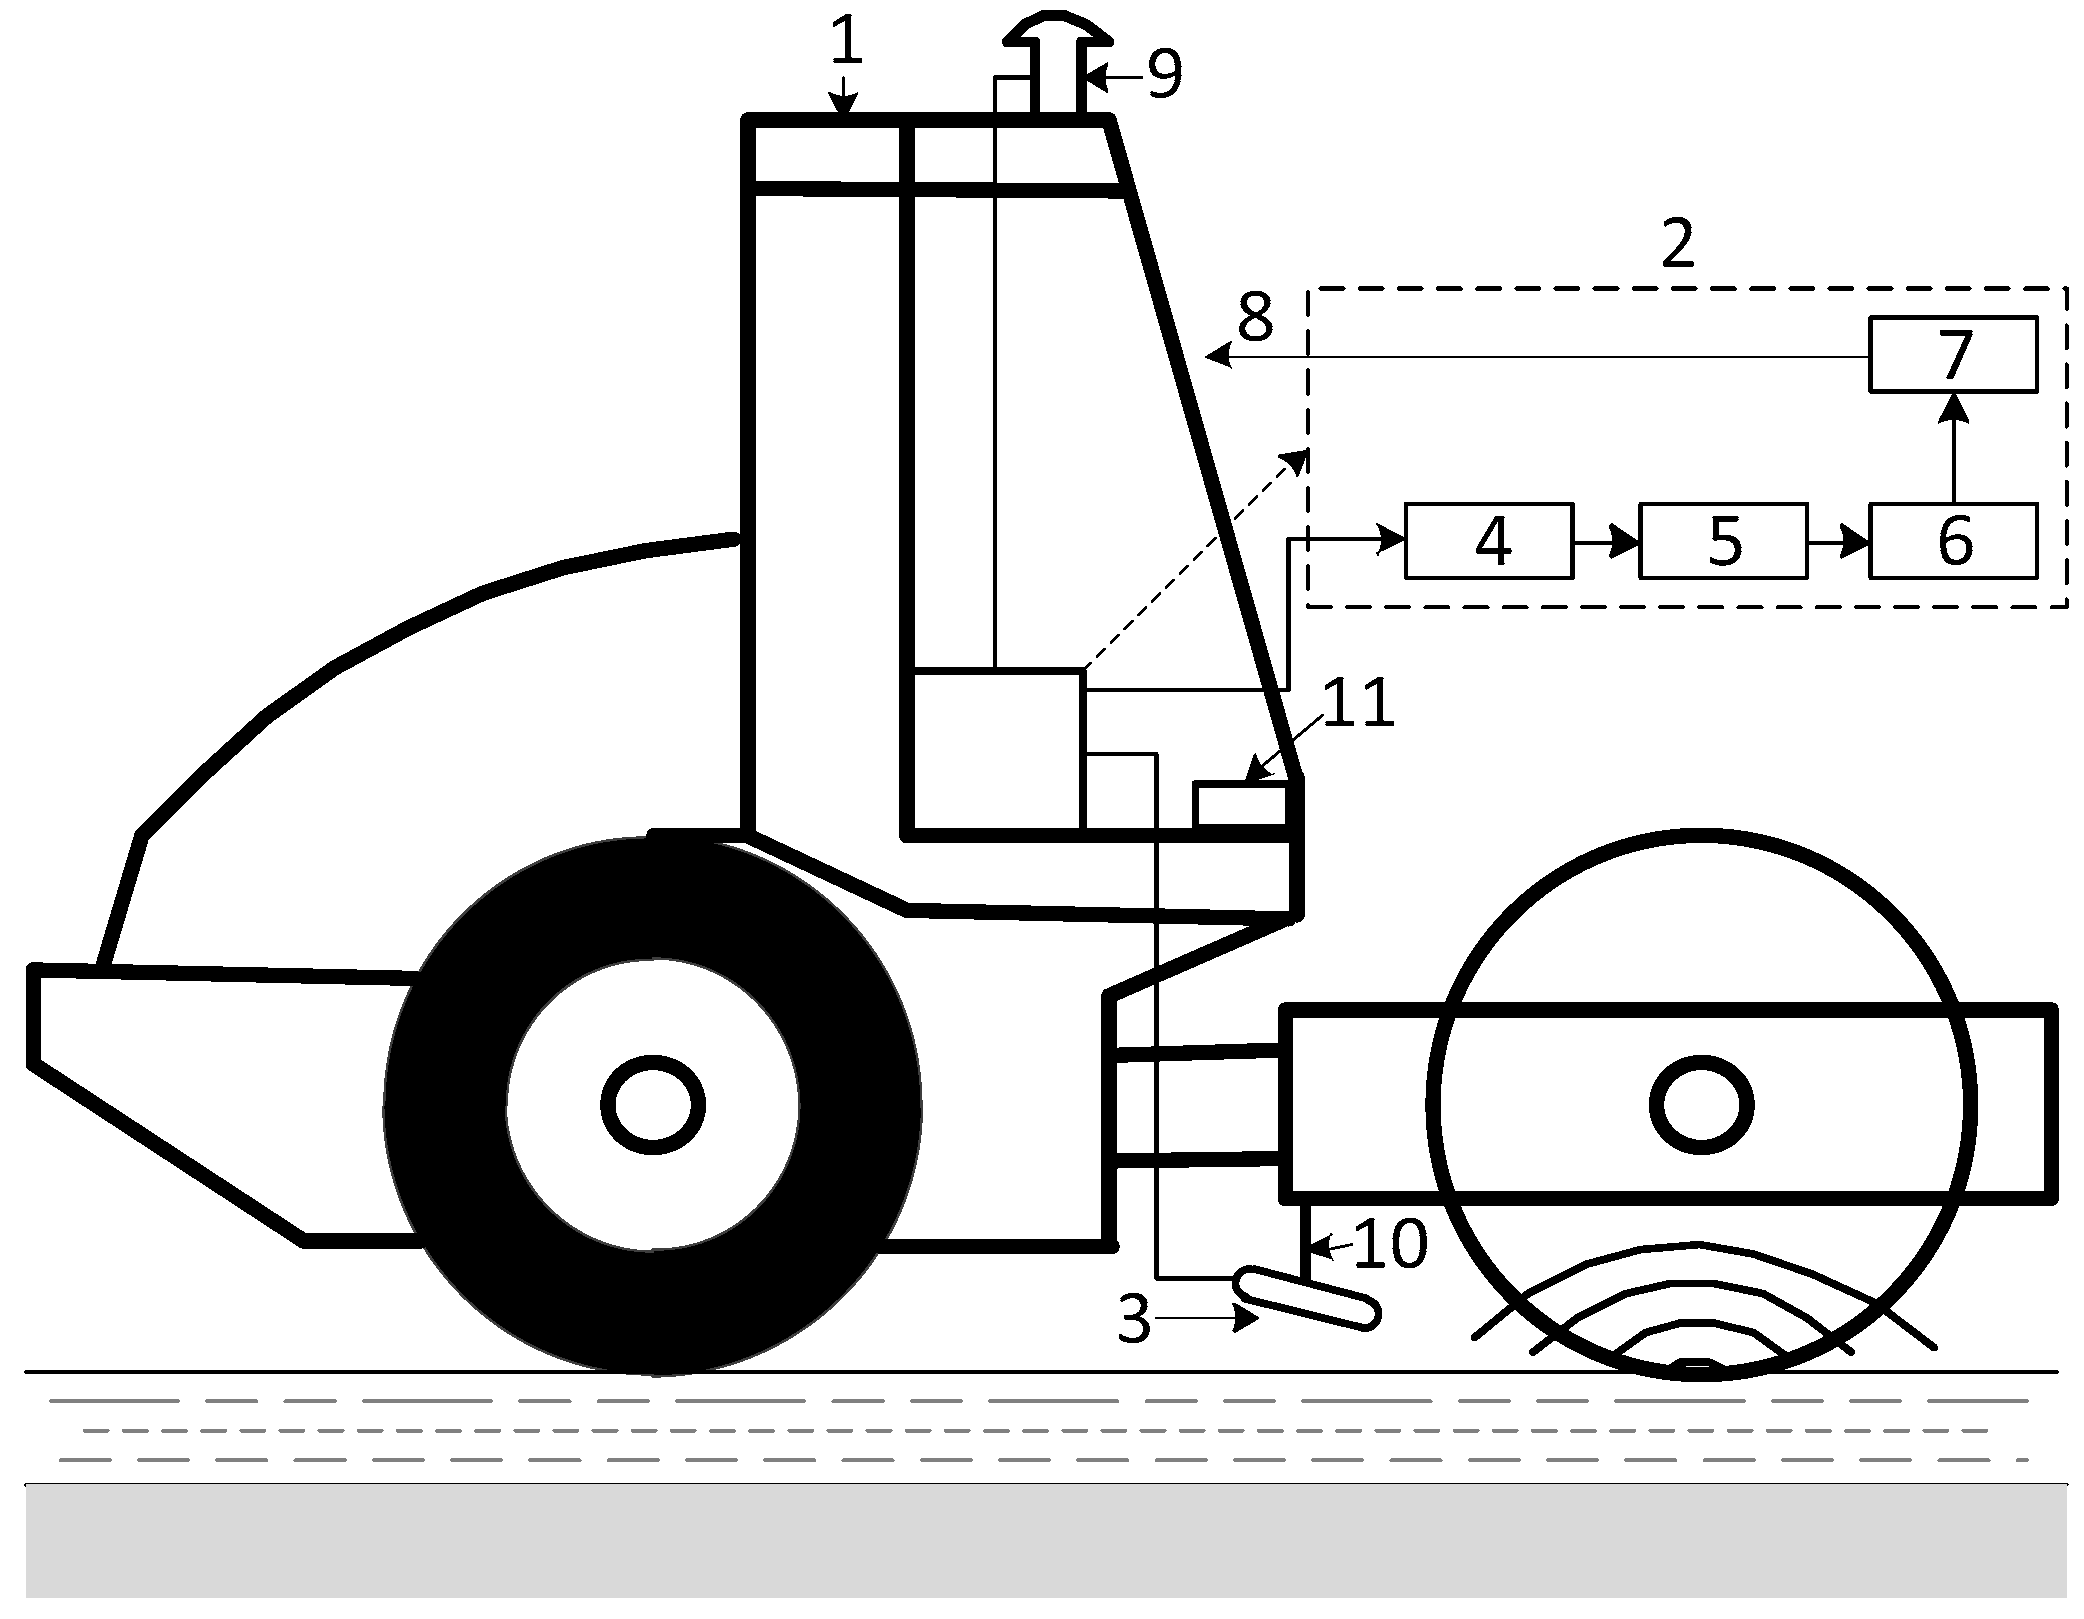
2.2. Technical Implementation

In this study, a roller-integrated acoustic wave detection technique was developed that includes two parts, detection and signal analysis. The schematic diagram of this technique is shown in Figure 9. The detection principle is explained above. This technique has the characteristics of non-contact, high efficiency, high precision, continuousness, and convenience. It is suitable for rockfill materials.
As shown in Figure 9, the detection device (2) includes an acoustic field microphone (3), a microphone mounting device (10), a signal conditioning module (4), a data acquisition module (5), an analysis processing module (6), a display (7), and a GPS receiver (9). Moreover, the system also includes a vibratory roller (1) and an onboard battery (11). The sound field microphone (3) is mainly utilized to receive acoustic field time-domain signals. The signal conditioning module (4) is utilized to convert the signal received by the sound field microphone (3) into a standard signal by means of amplification and filtering. Then the standard signal can be collected by the data acquisition module (5), which simultaneously acquires the spatial signal associated with the roller position provided by the GPS receiver (9). Subsequently, two signals are transmitted to the analysis processing module (6) through wired communication. The analysis processing module (6) is utilized to implement the filtering, spectrum analysis, and logarithmic processing of the acoustic signal, obtain SHA of the effective acoustic signal, calculate the SCV values multiplied by the calibration coefficient in real time, deal with the spatial signals related to the roller position by the differential algorithm, and calculate the current position coordinate of vibration roller 1 (centimeter level). The display (7) is utilized to display the real-time compaction nephogram with the spatial location characteristic and display other relevant information on the spot, such as the driving speed, compaction monitoring information, number of compaction times, and so on. The GPS receiver (9) is utilized to acquire spatial signal information relating to the roller position. The RTK–GPS receiver, satellite, and GPS base station fix the position of the roller. The microphone installation device (10) is utilized to fix the acoustic field microphone (3). Vibration isolation of the contact parts between the acoustic field microphone (3) and the installation device (10), as well as between the installation device (10) and the vibratory roller (1), is implemented by soft rubber. The onboard battery (11) provides power support for the entire continuous compaction control acoustic wave detection system.

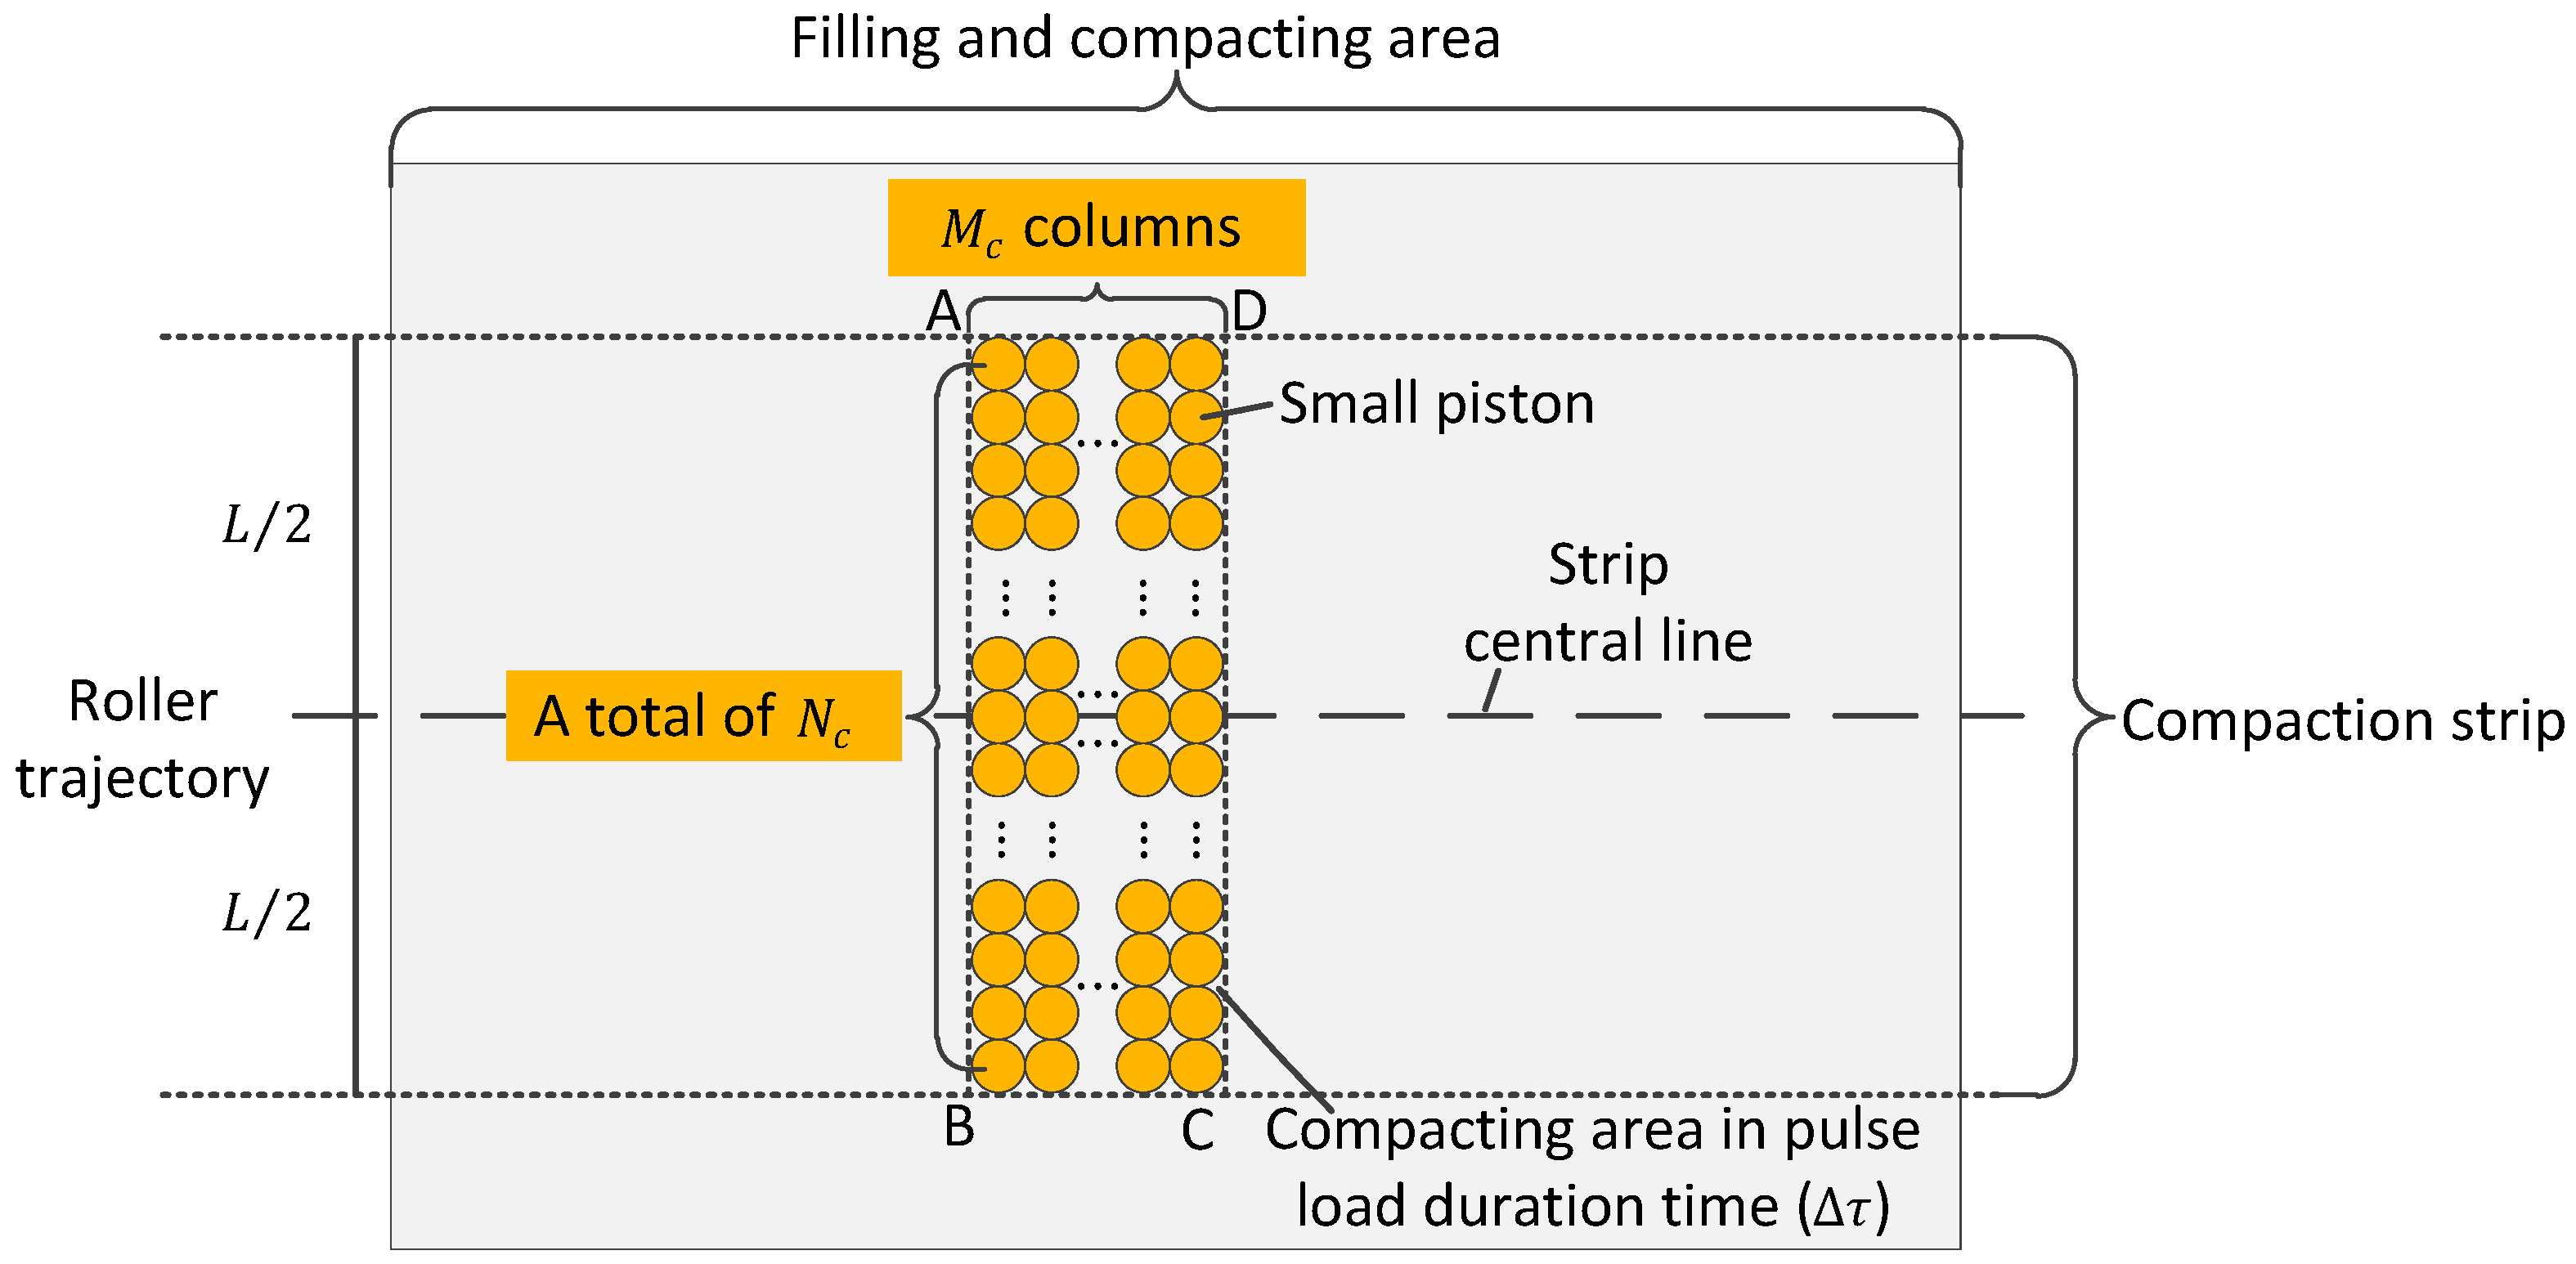
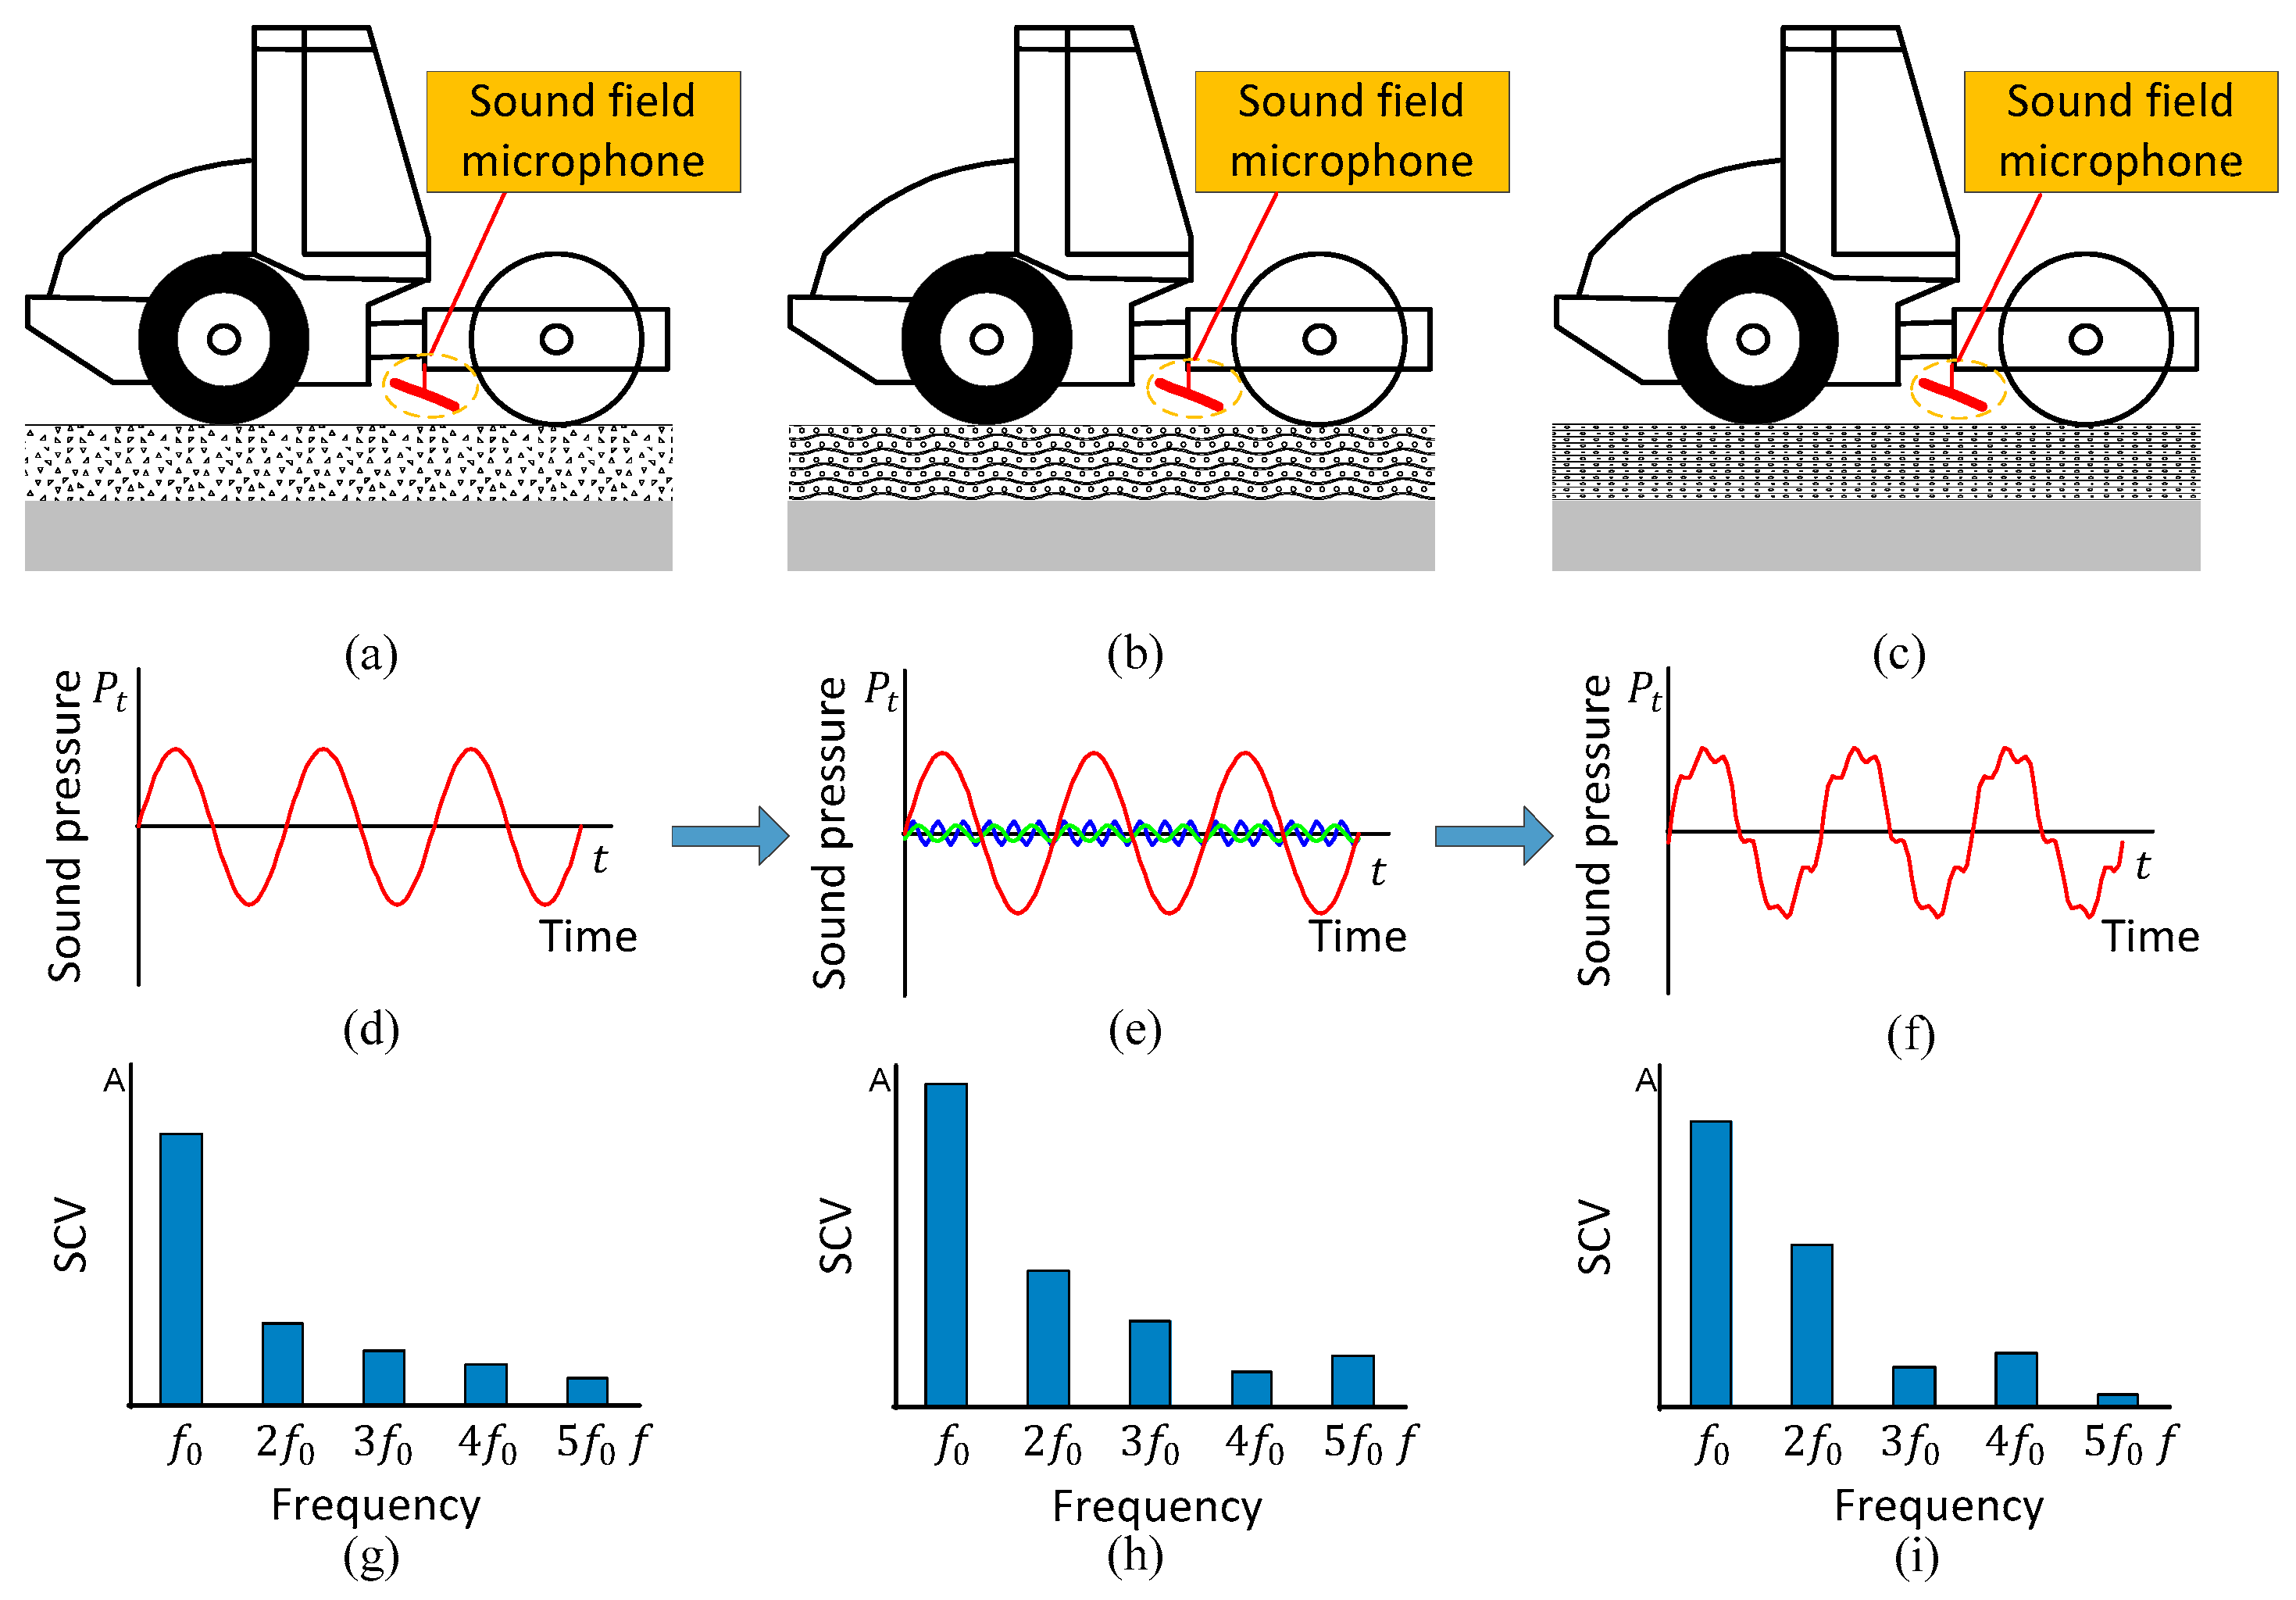
2.3. Sound Compaction Value

During rolling construction, the compacted layer is synthetically affected by the static pressure and vibration force. The comprehensive effect can change the material’s status from static to vibrating, then reduce the friction force and cohesion between soil (or rock) particles. Thus, small soil (or rock) particles fill the voids between larger particles and the material gradually becomes dense. When rolling construction begins, filling materials are relatively loose (Figure 10a), the sound pressure curve is relatively smooth (Figure 10d), the corresponding sound spectrum is predominant at the fundamental frequency ( f 0 ), and the amplitude of the SCV is relatively low (Figure 10g). With an increase in the number of compactions, the compacted material becomes more dense (Figure 10b), and the higher harmonic components gradually increase (Figure 10e). Meanwhile, the SCVs change gradually (Figure 10h). As the number of compaction times increases to a certain degree, the content of higher harmonic components tends to be stable (Figure 10f), and the compacted material becomes denser and tends to be stable (Figure 10c). The SCVs further change and tend to be stable (Figure 10i). This paper defines a real-time SCV as the compaction index for characterizing the compaction status of rockfill materials as follows:
SCV = k × SHA × 100 % ,
where k is the calibration coefficient of the material.

3. Case Study

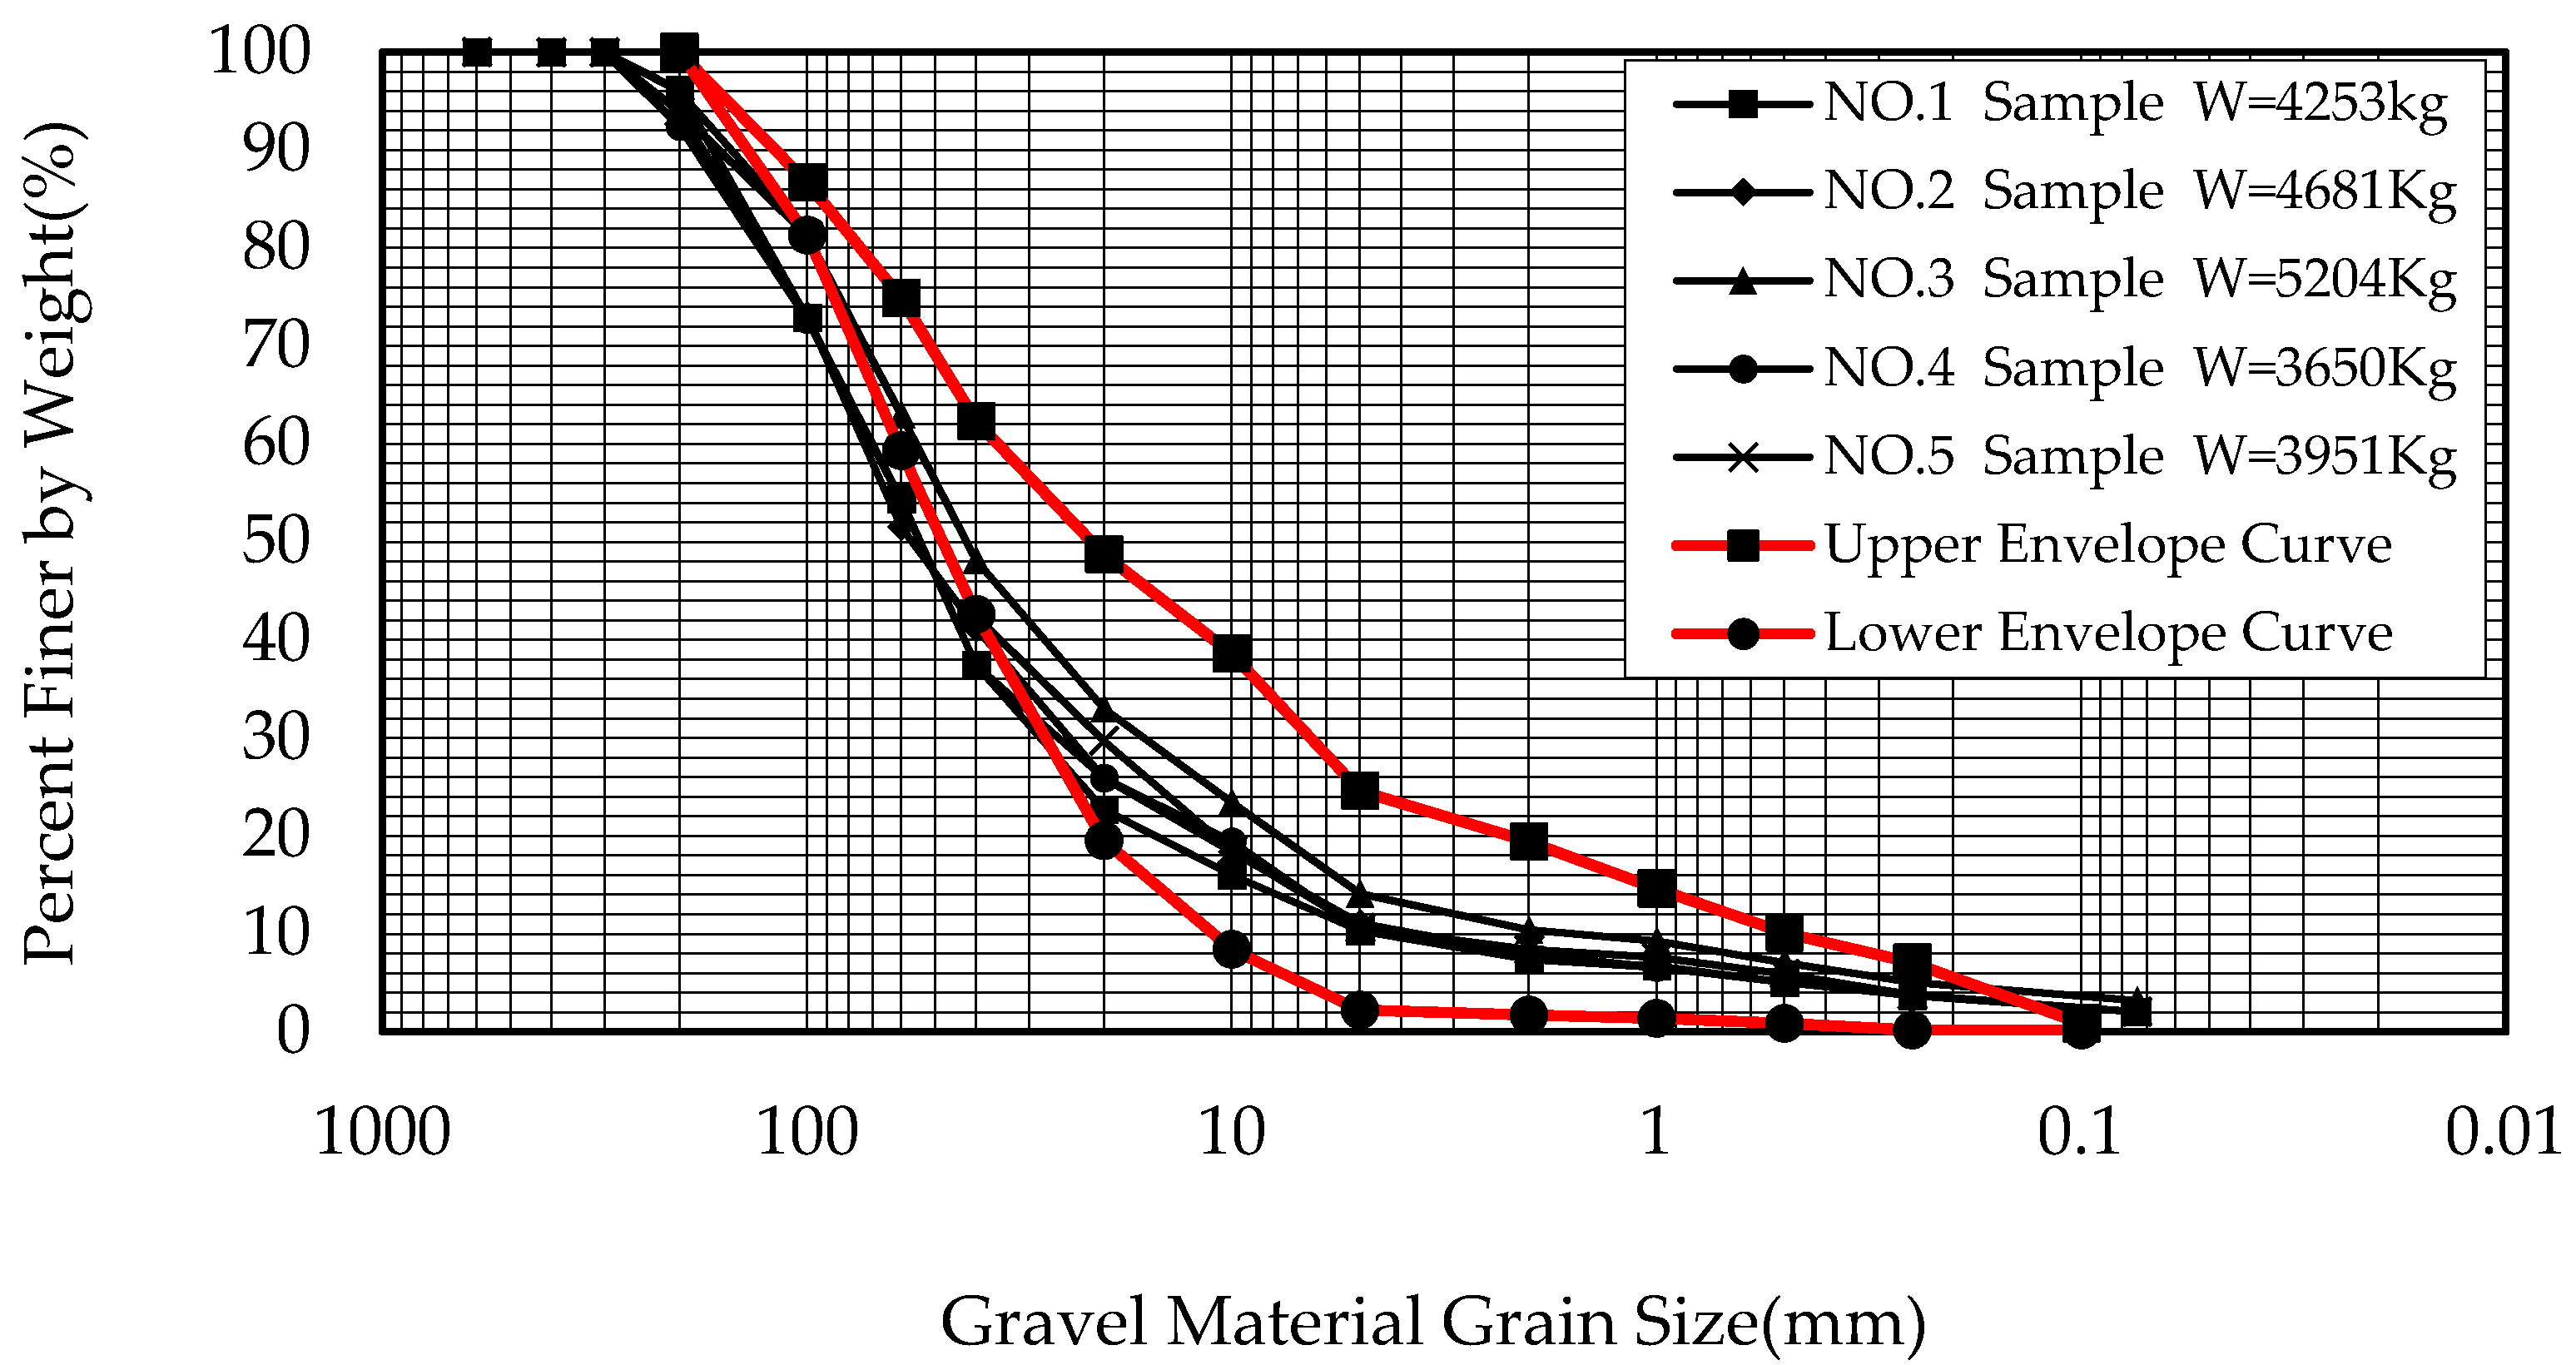
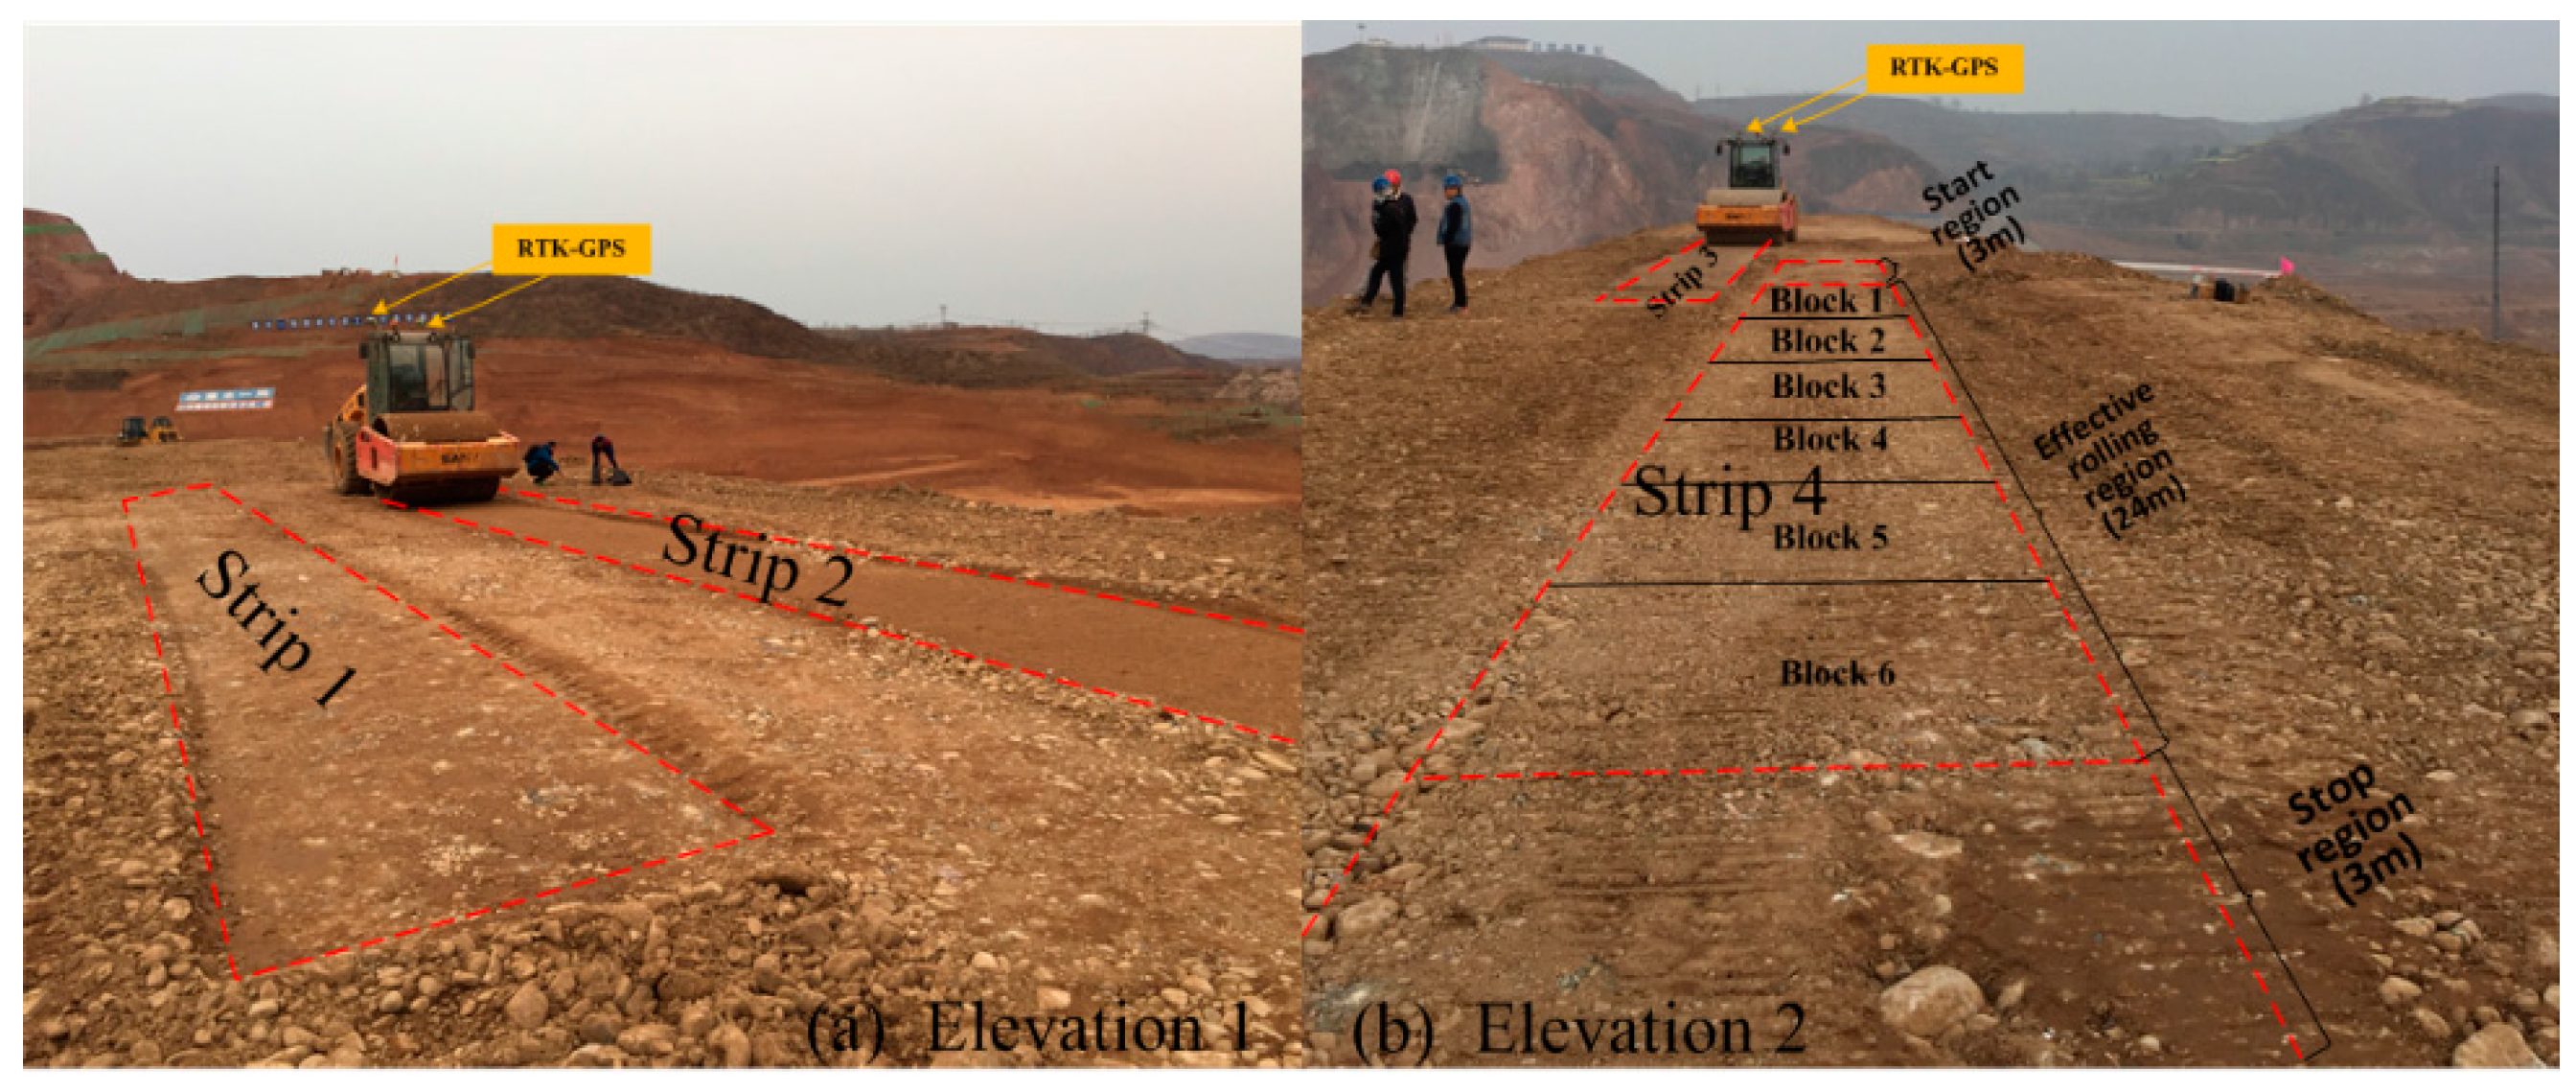
3.1. Testing Site and Materials

A reservoir project is located in Henan Province, China. The main structures include the main dam, an auxiliary dam, a spillway, a water tunnel, and a power station. The main dam is a rockfill dam with a maximum height of 90.3 m. This experimental research focused on the NGM at the upstream cofferdam as a part of the main dam. During the early stage of the reservoir project, IWHR (China Institute of Water Resources and Hydropower Research) carried out a gravel material rolling test. The grading curve of the gravel material taken from VI zone material field is shown in Figure 11. In the five sets of tests, only one group of test materials was graded in the representative grading envelope, and the others were graded beyond the original grading. Taking into account the great change of the gravel material in each material field, the NGM had a maximum particle size of 200 mm based on a conservative estimate. The test results carried out by IWHR indicated that the proportion of particles less than 5 mm was 8–26%, and the proportion of particles more than 200 mm was 1.3–7.1%. The maximum size of the natural gravel material was up to 400 mm, and the content of particles less than 5 mm was controlled within 15%. The designed standard of the dry density of the NGM was greater than 2.144 g/cm3, and compactness needed to be greater than 75% according to the design criteria. Due to a wide range of particle size distribution for NGM and above analysis, we know that CMV is not suitable for this material. Therefore, it is necessary to propose a new technique to detect the compactness of NGM quickly and accurately.

3.2. Testing Program

To analyze the effectiveness of SCV for assessing the compaction quality of rockfill materials, a two-part field experiment was performed. The first part of the experiment studied the correlation between the compaction parameters and SCV. Four testing strips were filled with NGM with consistent moisture content and gradation. Each strip had a length of 30 m and a width of 3 m. Figure 12 shows photos of the field rolling test in the rock-fill zone located in Elevation 1 and Elevation 2 (upstream cofferdam), and the test scheme is shown in Table 2. NGM represents natural gravel materials, and HFHA represents high-frequency/high-amplitude. The second part of the experiment was traditional point measurements (water-filling method) aimed at analyzing the correlation between SCV and the number of compaction times as well as the compactness of the NGM.
To evaluate this technique, the field study was conducted in 30-m test strips (Figure 12) using NGM. A set of field data was obtained, including compaction parameters, SCVs and results of traditional point measurements that were used for correlation analysis and verifying the effectiveness of this technique. The test strips were compacted using a prototype SSR260C-6 vibratory smooth drum roller. The depth of the filling layer was approximately (and not exceeding) 0.8 m. Test sites of two different elevations were used for this field test. Each strip was divided into a start region, an effective rolling region, and a stop region (Figure 12, Strip 4). The length of the start region and the stop region was 3 m, and the length of the effective rolling region was 24 m. Considering the diameter of the test pit in the water-filling method and the accuracy of this technique, the effective rolling region was divided into six blocks (Figure 12). Static compaction was first performed in the four strips and then vibration compaction was performed (Table 2). Static compaction and vibration compaction was performed for two times and 12 times, respectively.

4. Results and Discussions

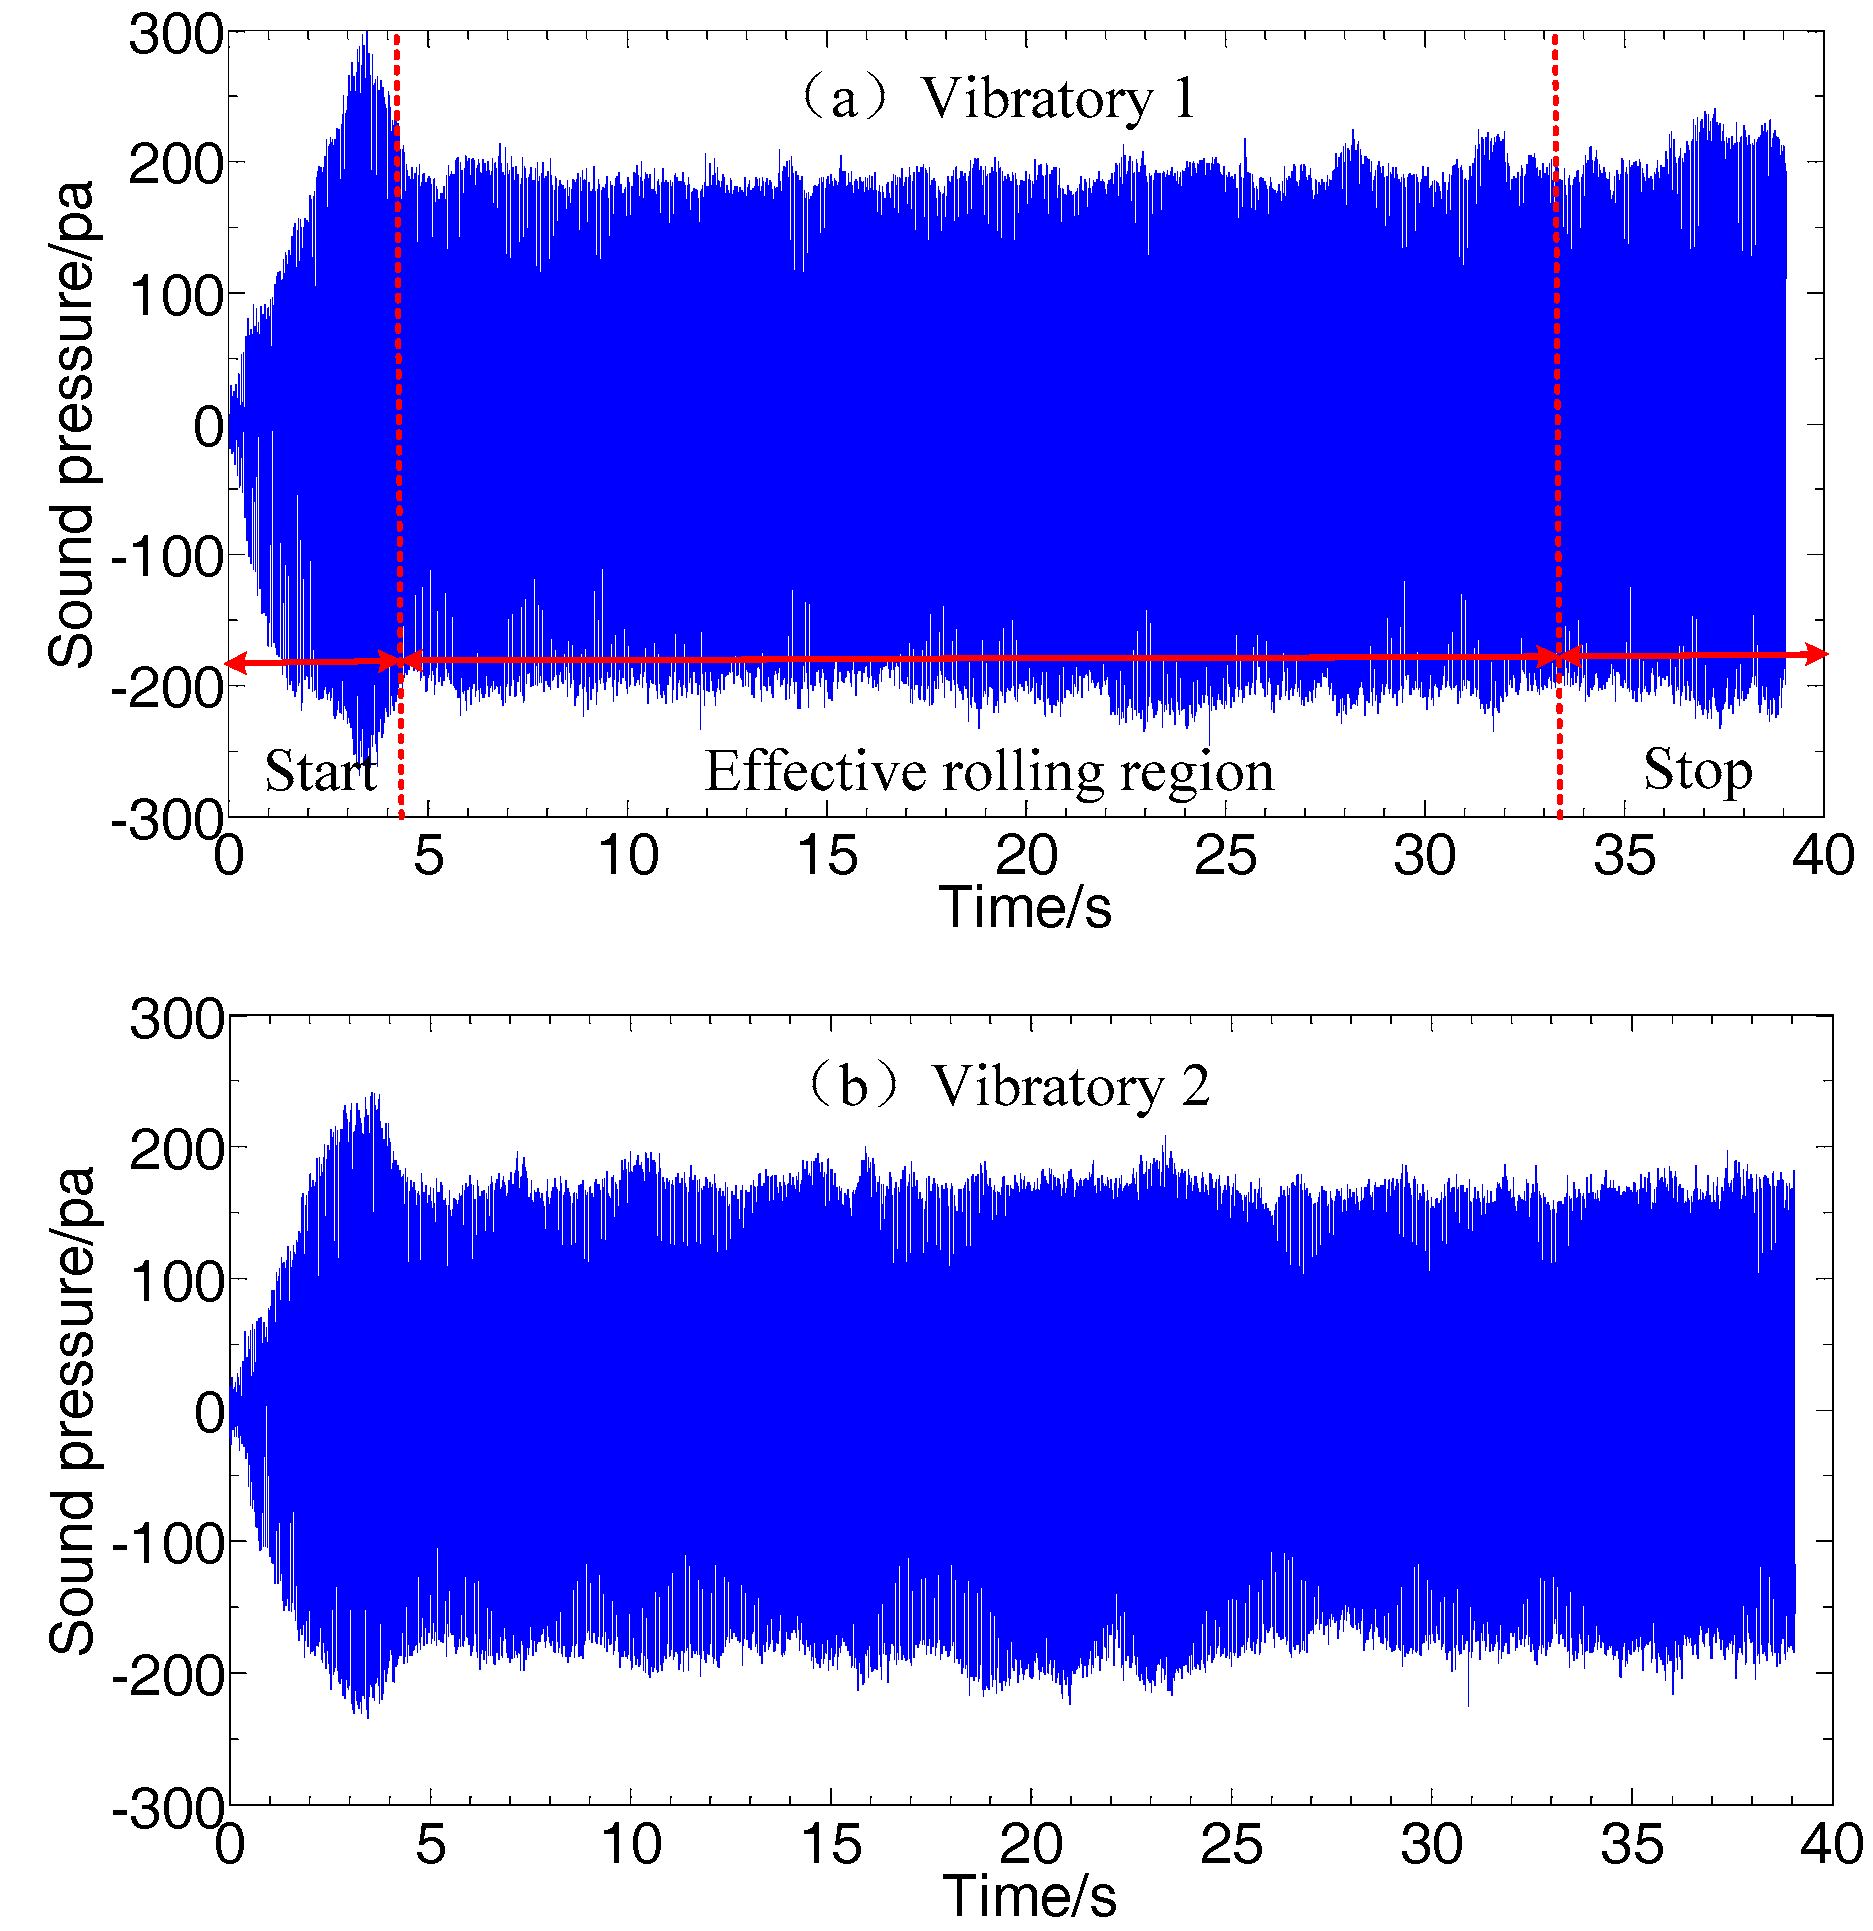
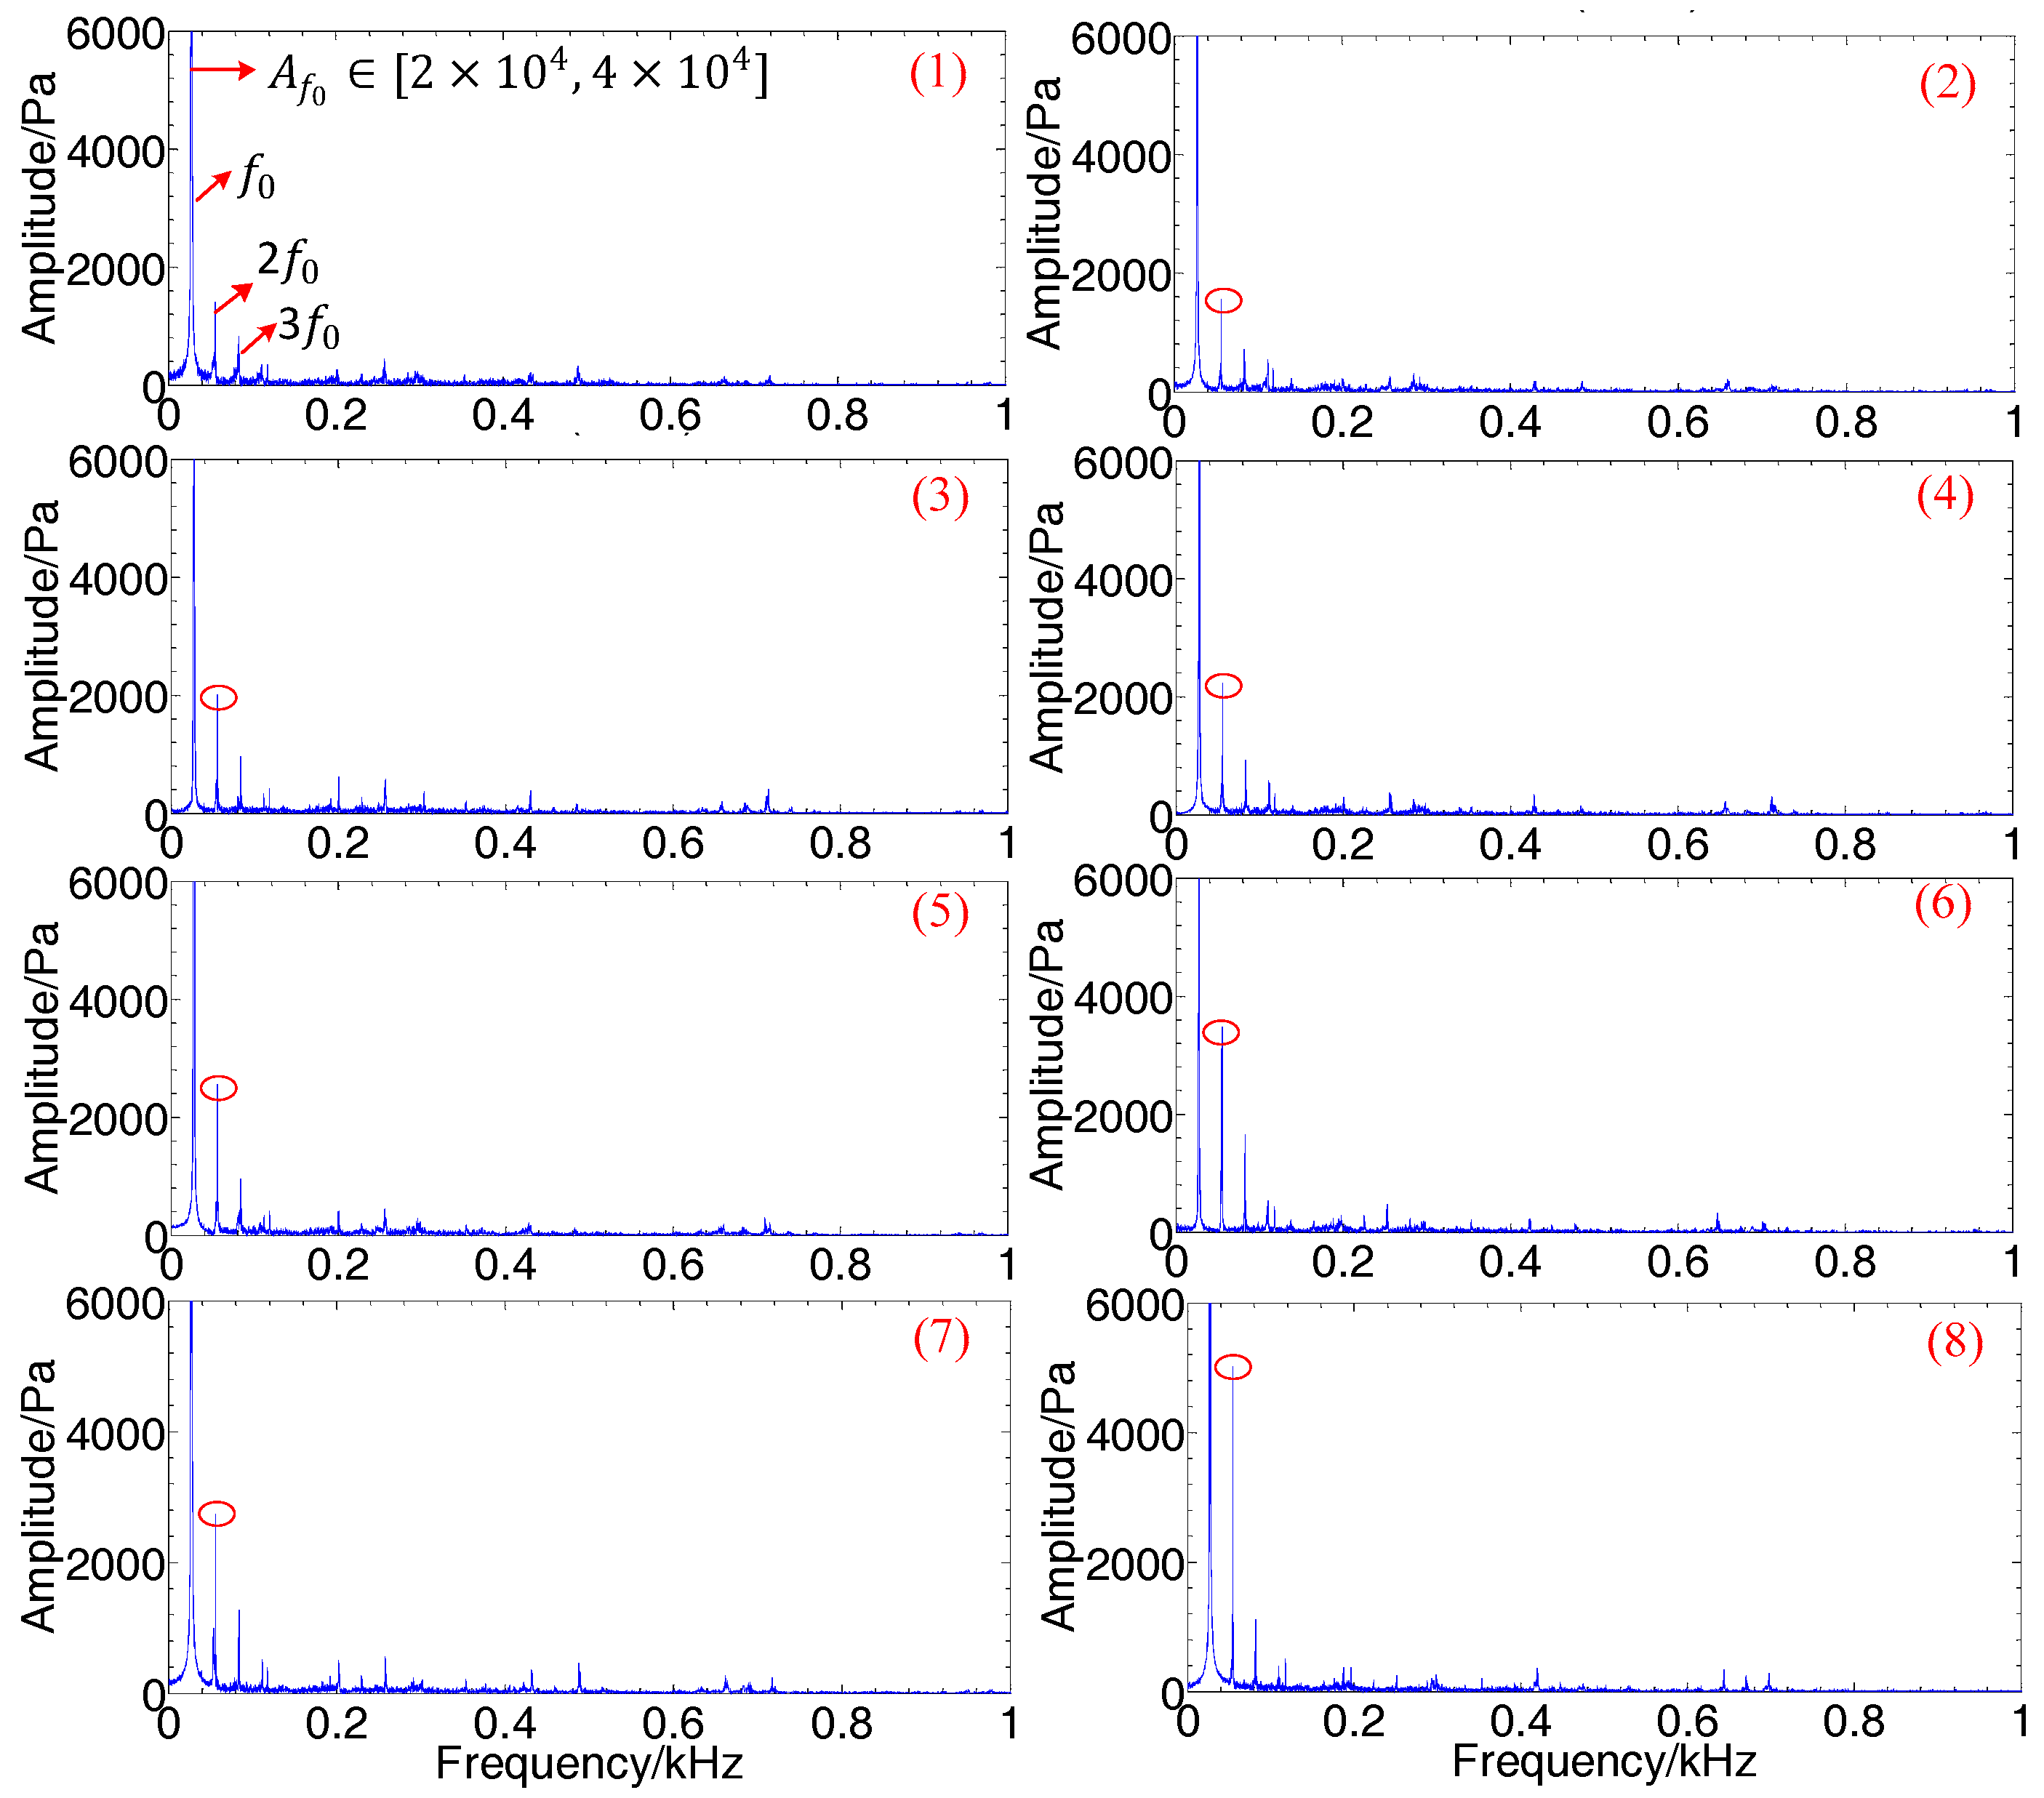
4.1. Spectrum Analysis of Detection Results

Field tests were performed utilizing a detection device that was developed in this study. Data from four test strips were collected and analyzed. Due to the large amount of data and length limitation of this paper, the data analysis process is illustrated with the original acoustic data from Strip 1. Figure 13 represents the original acoustic data collected by the acoustic field microphone from Strip 1 when the number of vibration compaction times is from 1 to 2. It can be seen from Figure 13 that the amplitude of the sound pressure during vibratory compaction, and the magnitude was between −200 pa and 200 pa. The acoustic signal situation when the roller started and stopped the rolling operation is shown in Figure 13a. Results shown in Figure 13 and from other test strips showed that there was zero drift in the original acoustic signal and there was no obvious law for the change of the time domain signal.
In order to perform the spectrum analysis and obtain the SCV, the original acoustic signal for each pass of compaction was processed in the following steps: firstly, the signals of the start and stop rolling regions were removed, and zero drift was eliminated; then the remaining acoustic signals were divided into six blocks, and each block was about 4 m in length (Figure 12, Strip 4); subsequently, the effective acoustic signals of each block was transformed by FFT, respectively, and the corresponding frequency spectrum was obtained; next, the magnitude of the spectrum data was converted by l o g 10 , and the SHA of each acoustic signal block was obtained, respectively; finally, the SCV was determined using Equation (16). To illustrate the problem, the frequency spectrum of signal collected from Block 1 in Strip 1 was analyzed (Figure 14). In Figure 14, (1)–(8) represent the number of compaction times from 1 to 8 and the first three peaks correspond to the fundamental wave amplitude ( f 0 ), the second harmonic amplitude ( 2 f 0 ) and the third harmonic amplitude ( 3 f 0 ). The magnitude of the fundamental wave amplitude ( A f 0 ) was between 2 × 10 4 and 4 × 10 4 . Results shown in Figure 14 and from other strips showed that the magnitude of the SHA basically increased as the number of compaction times increased.

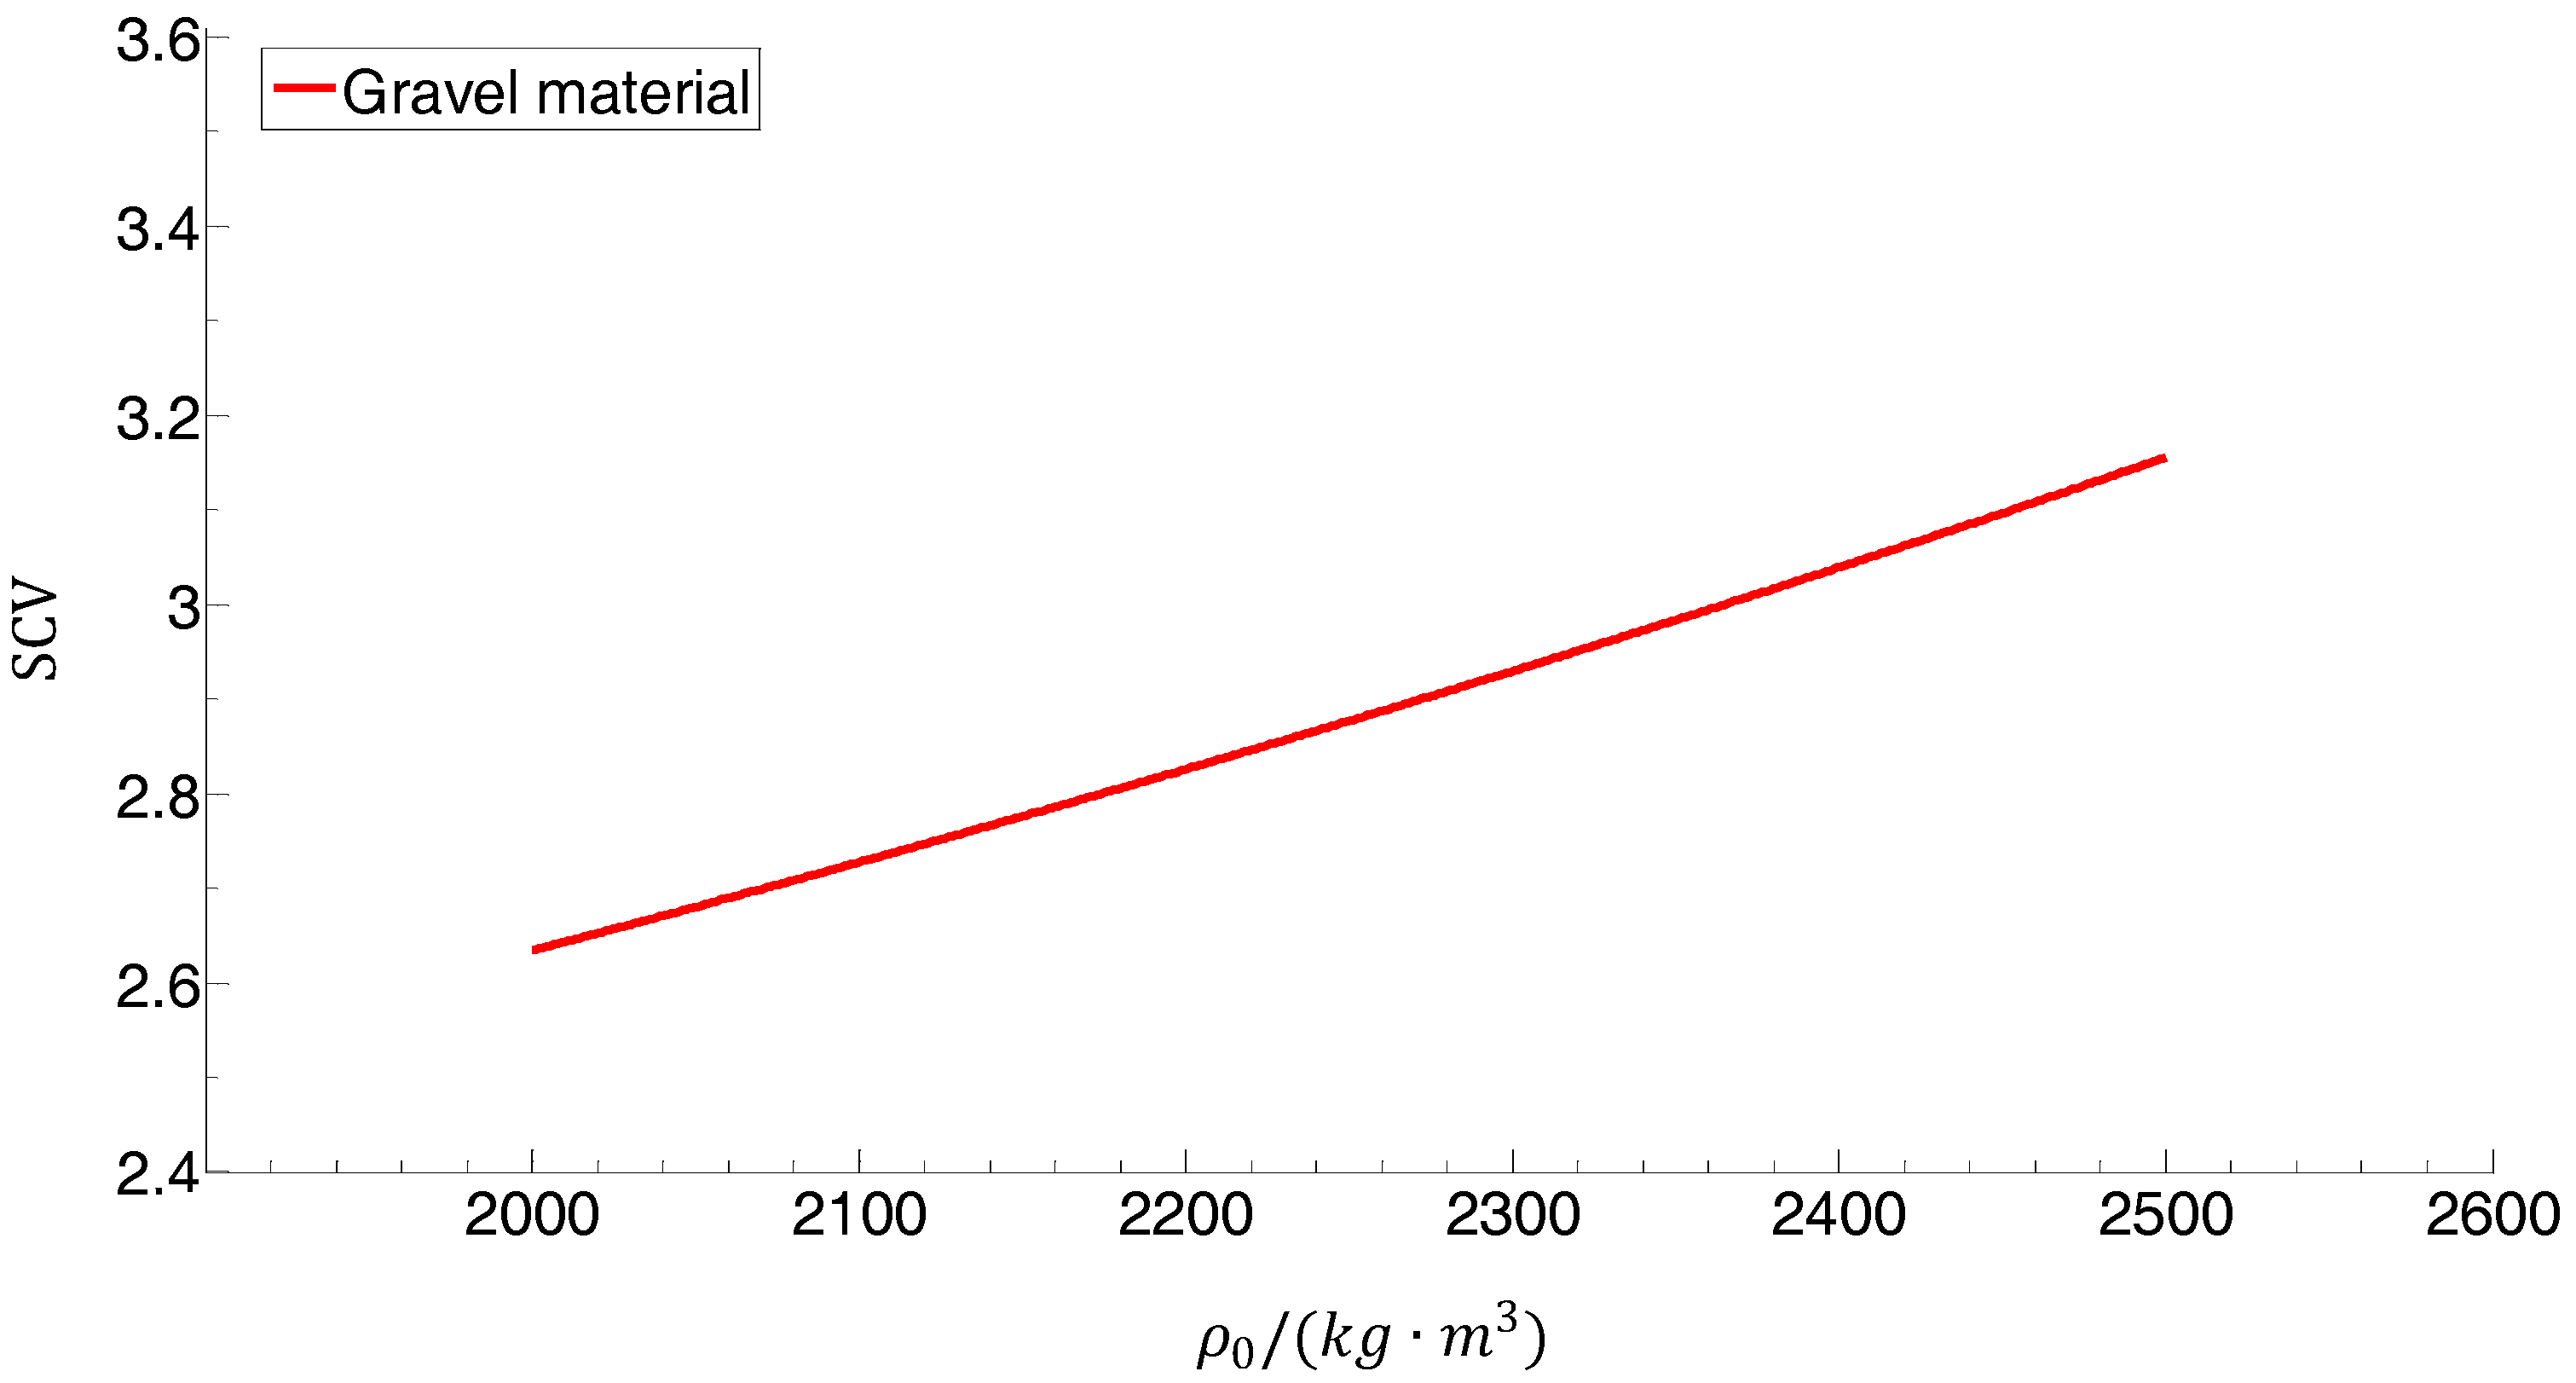
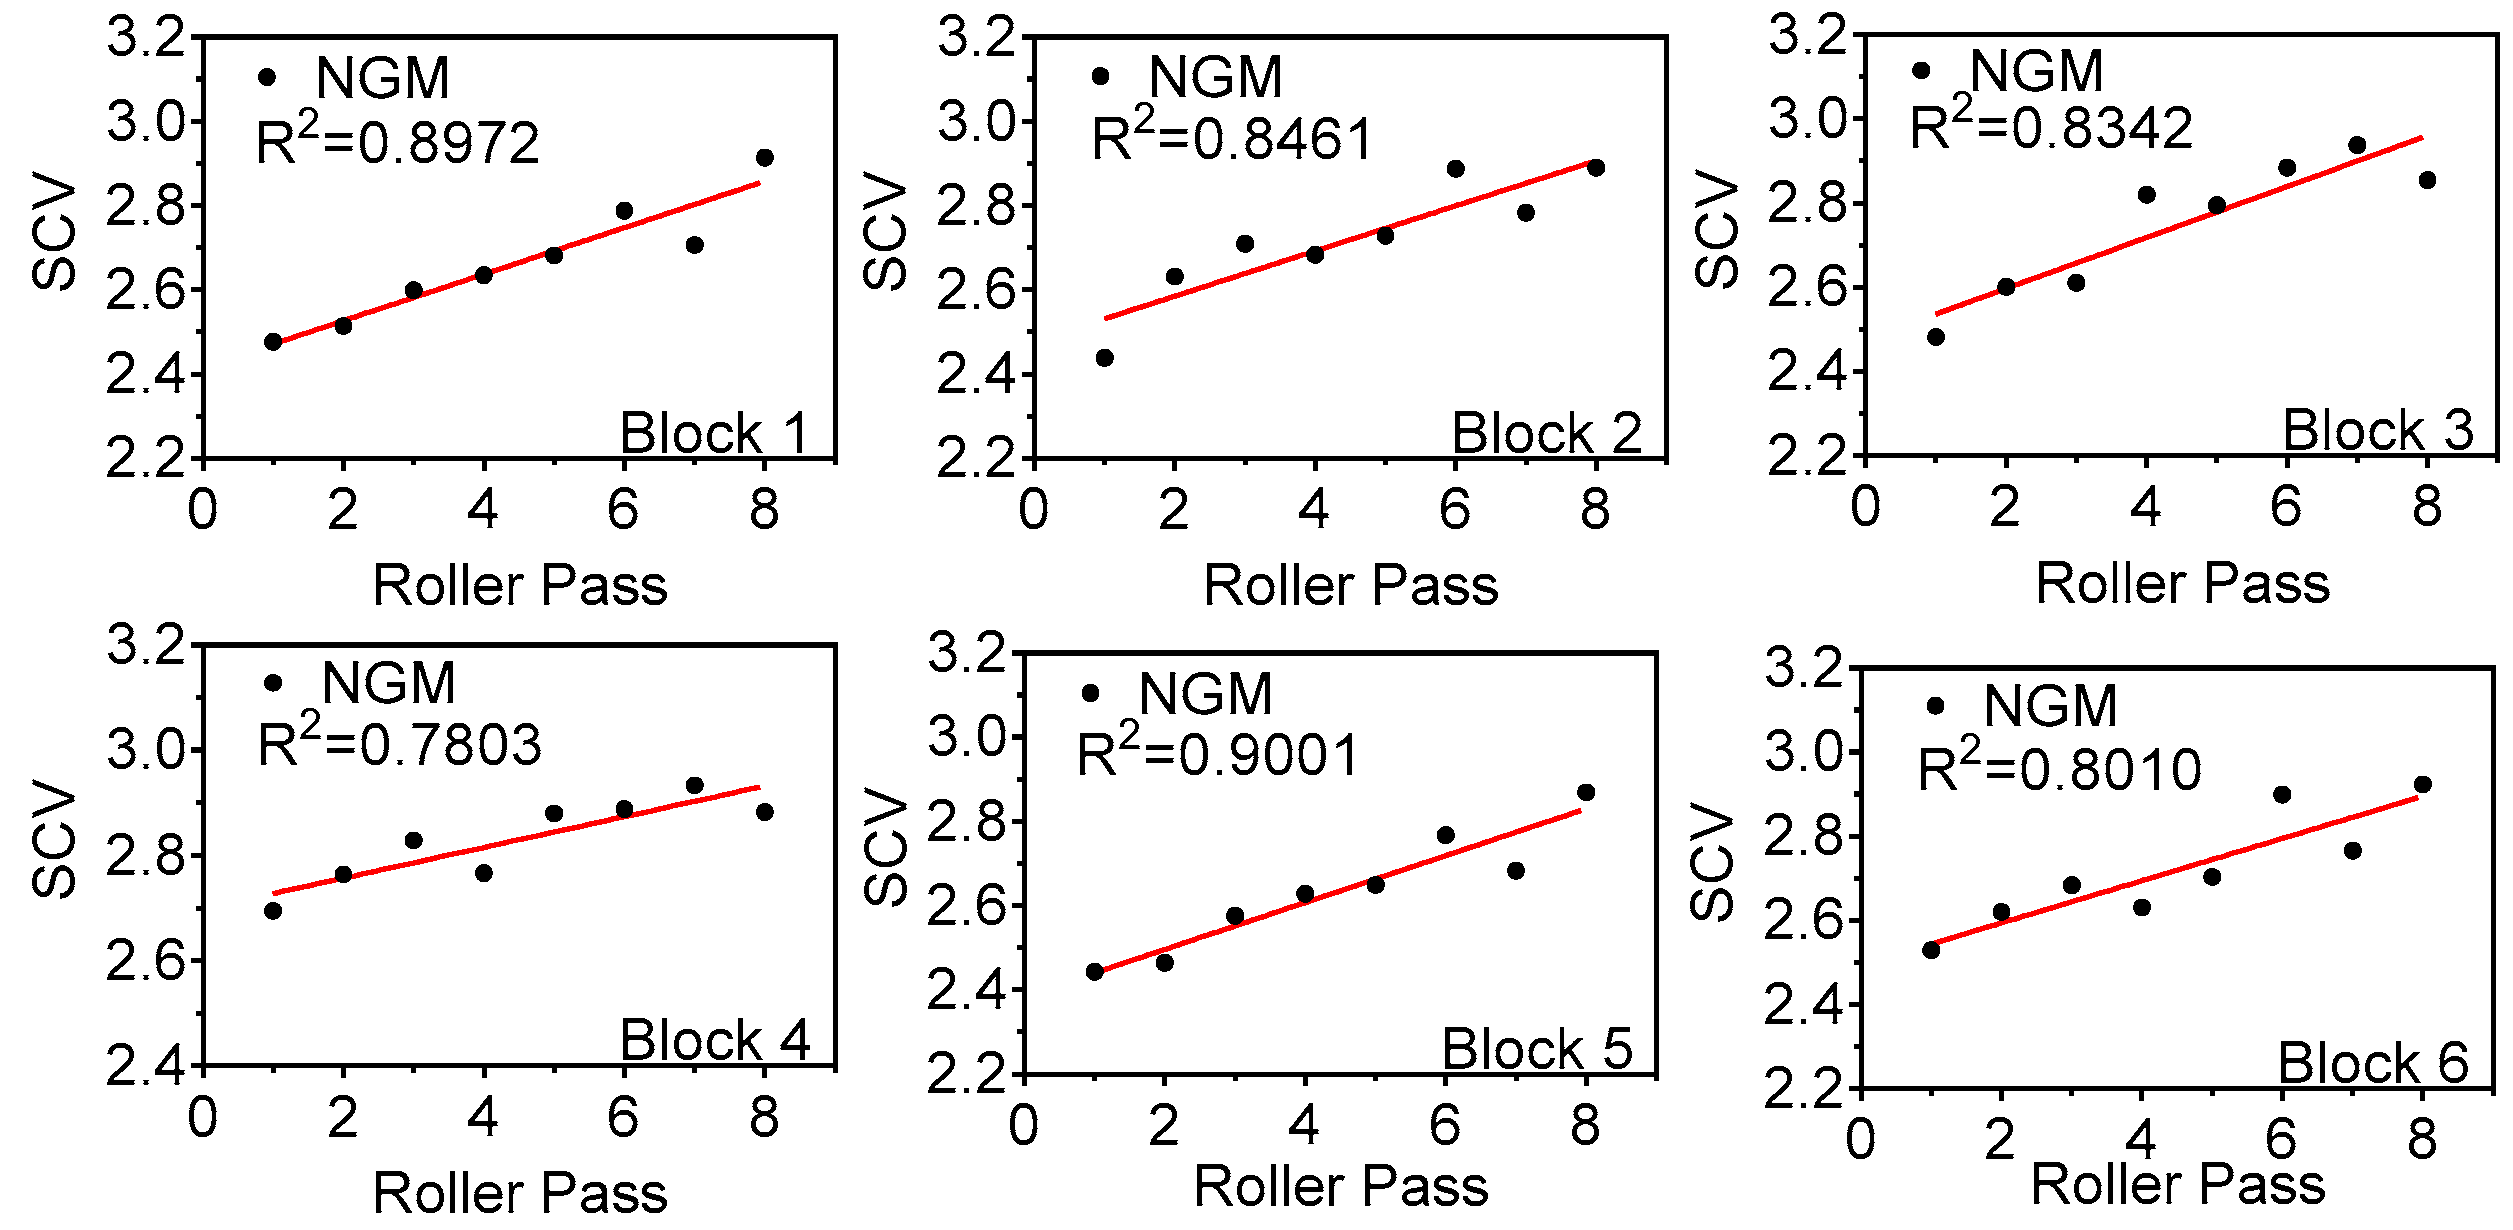
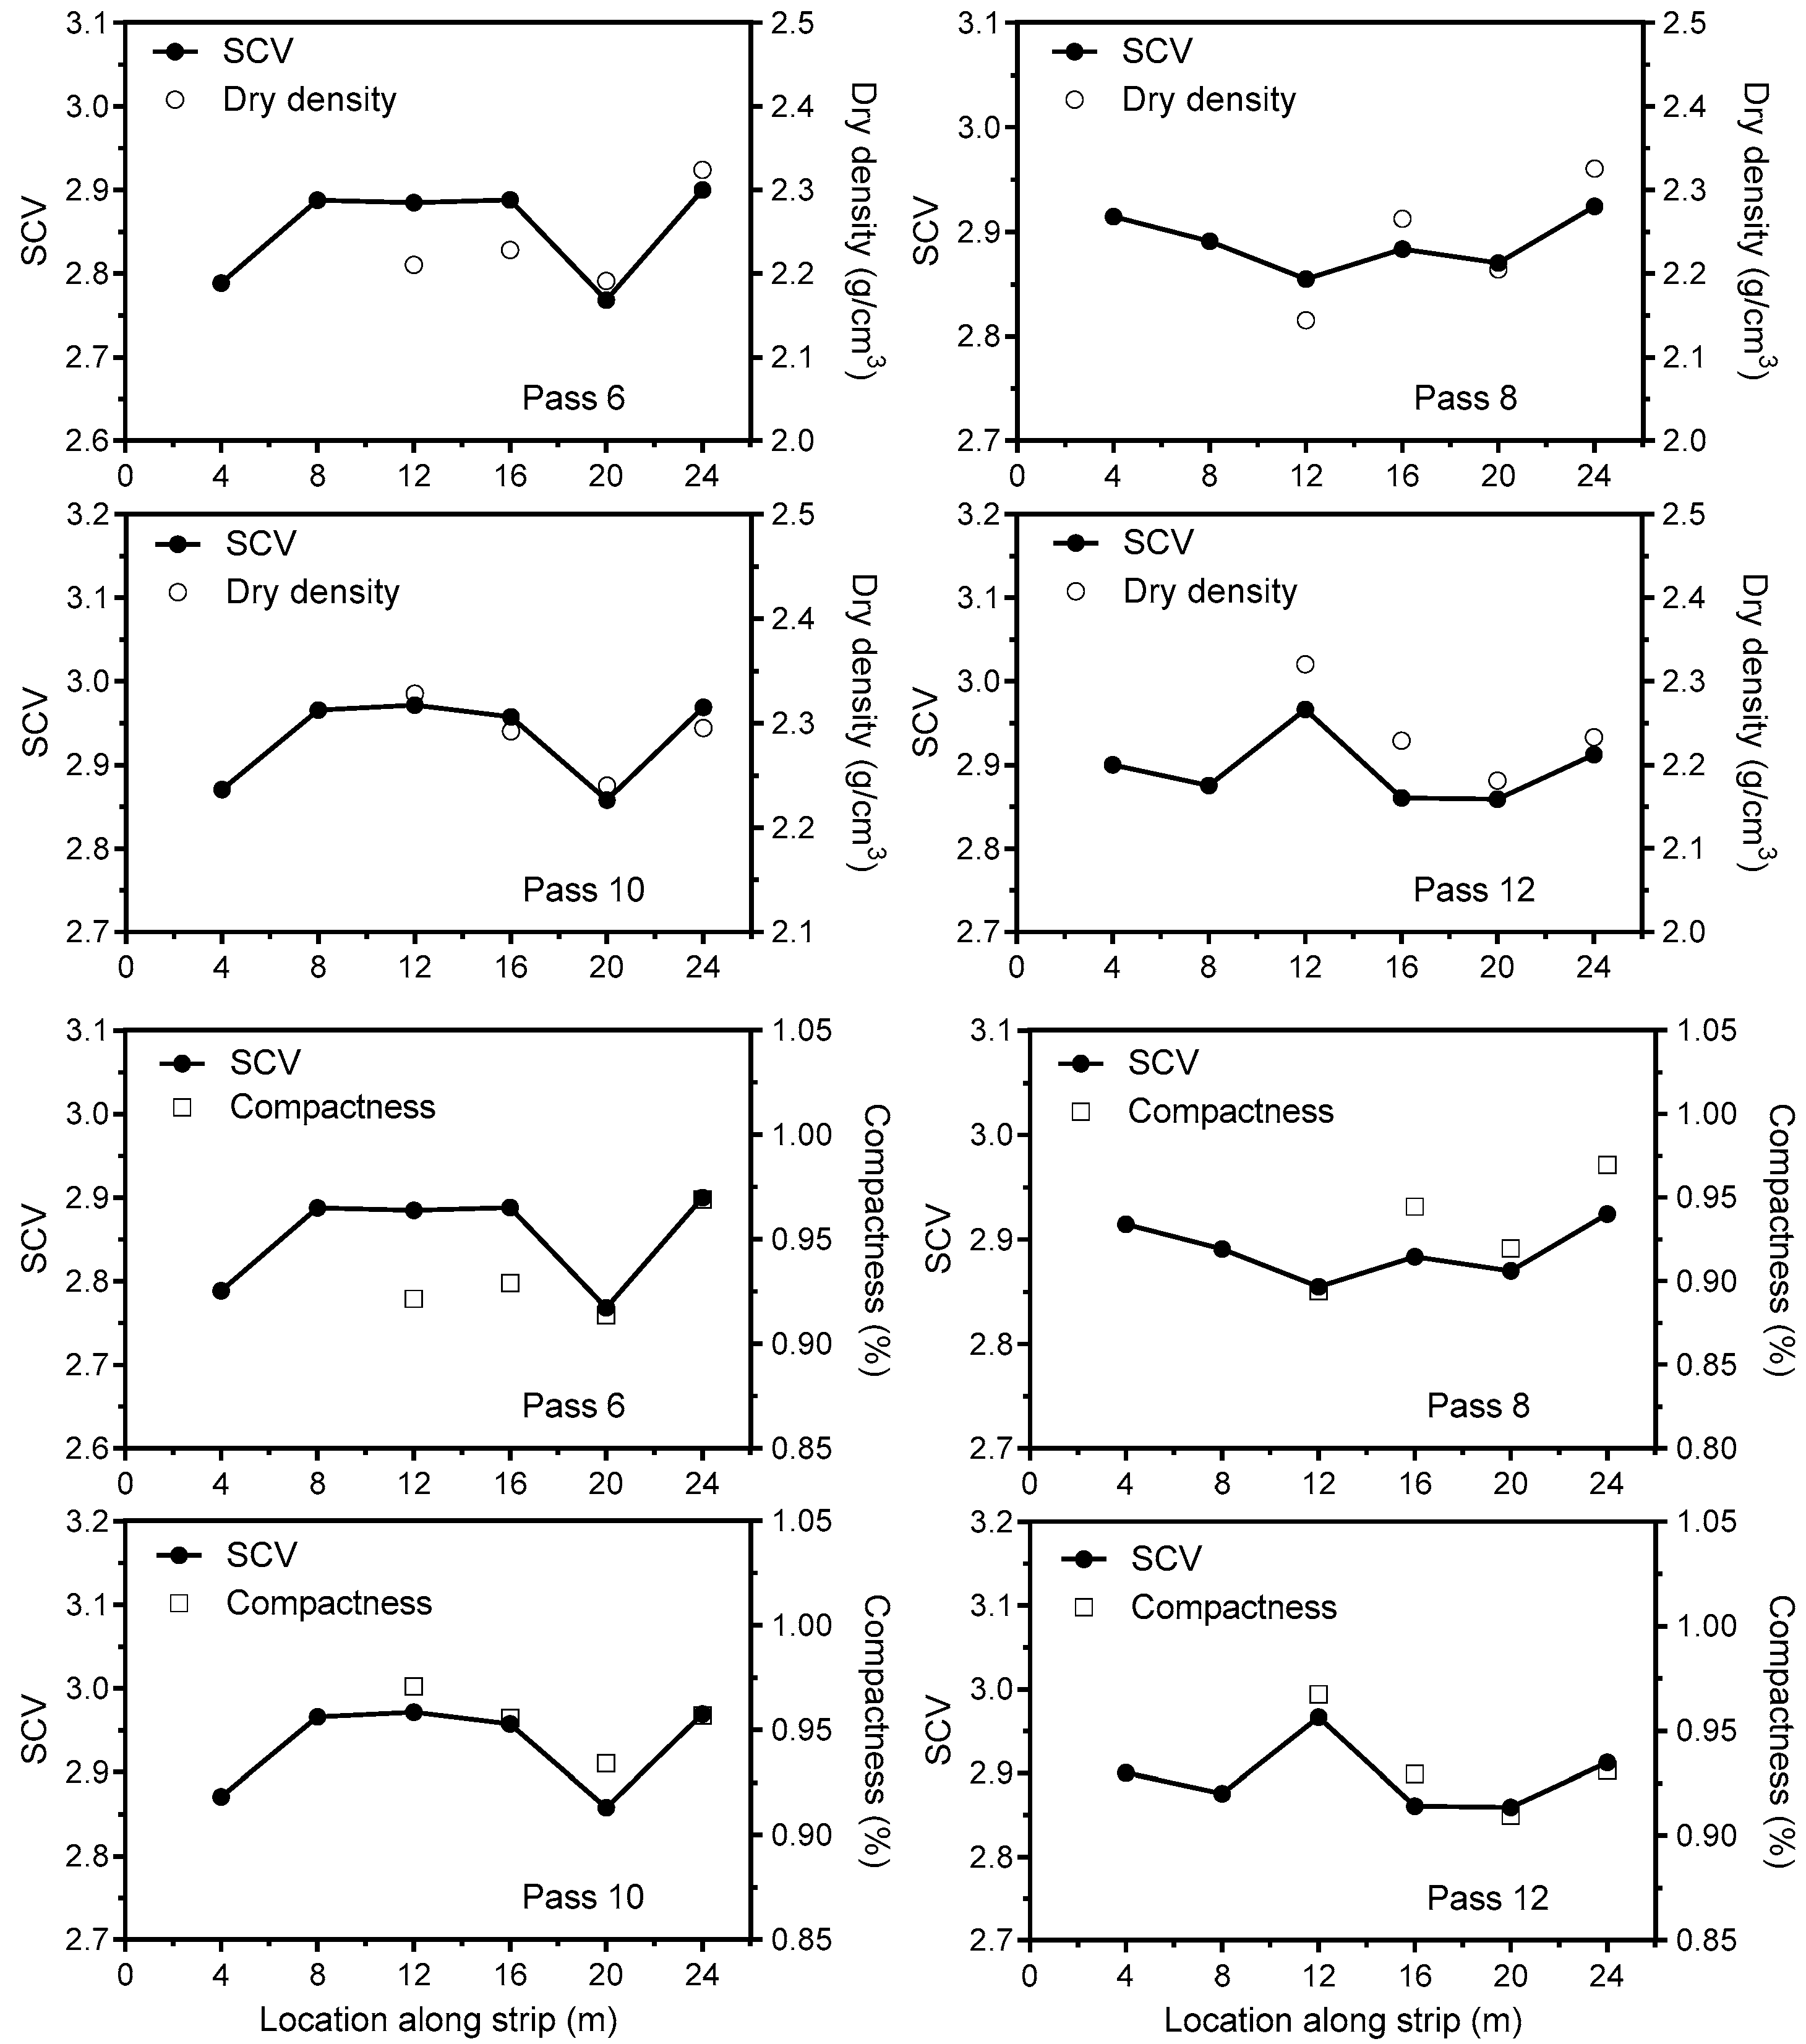
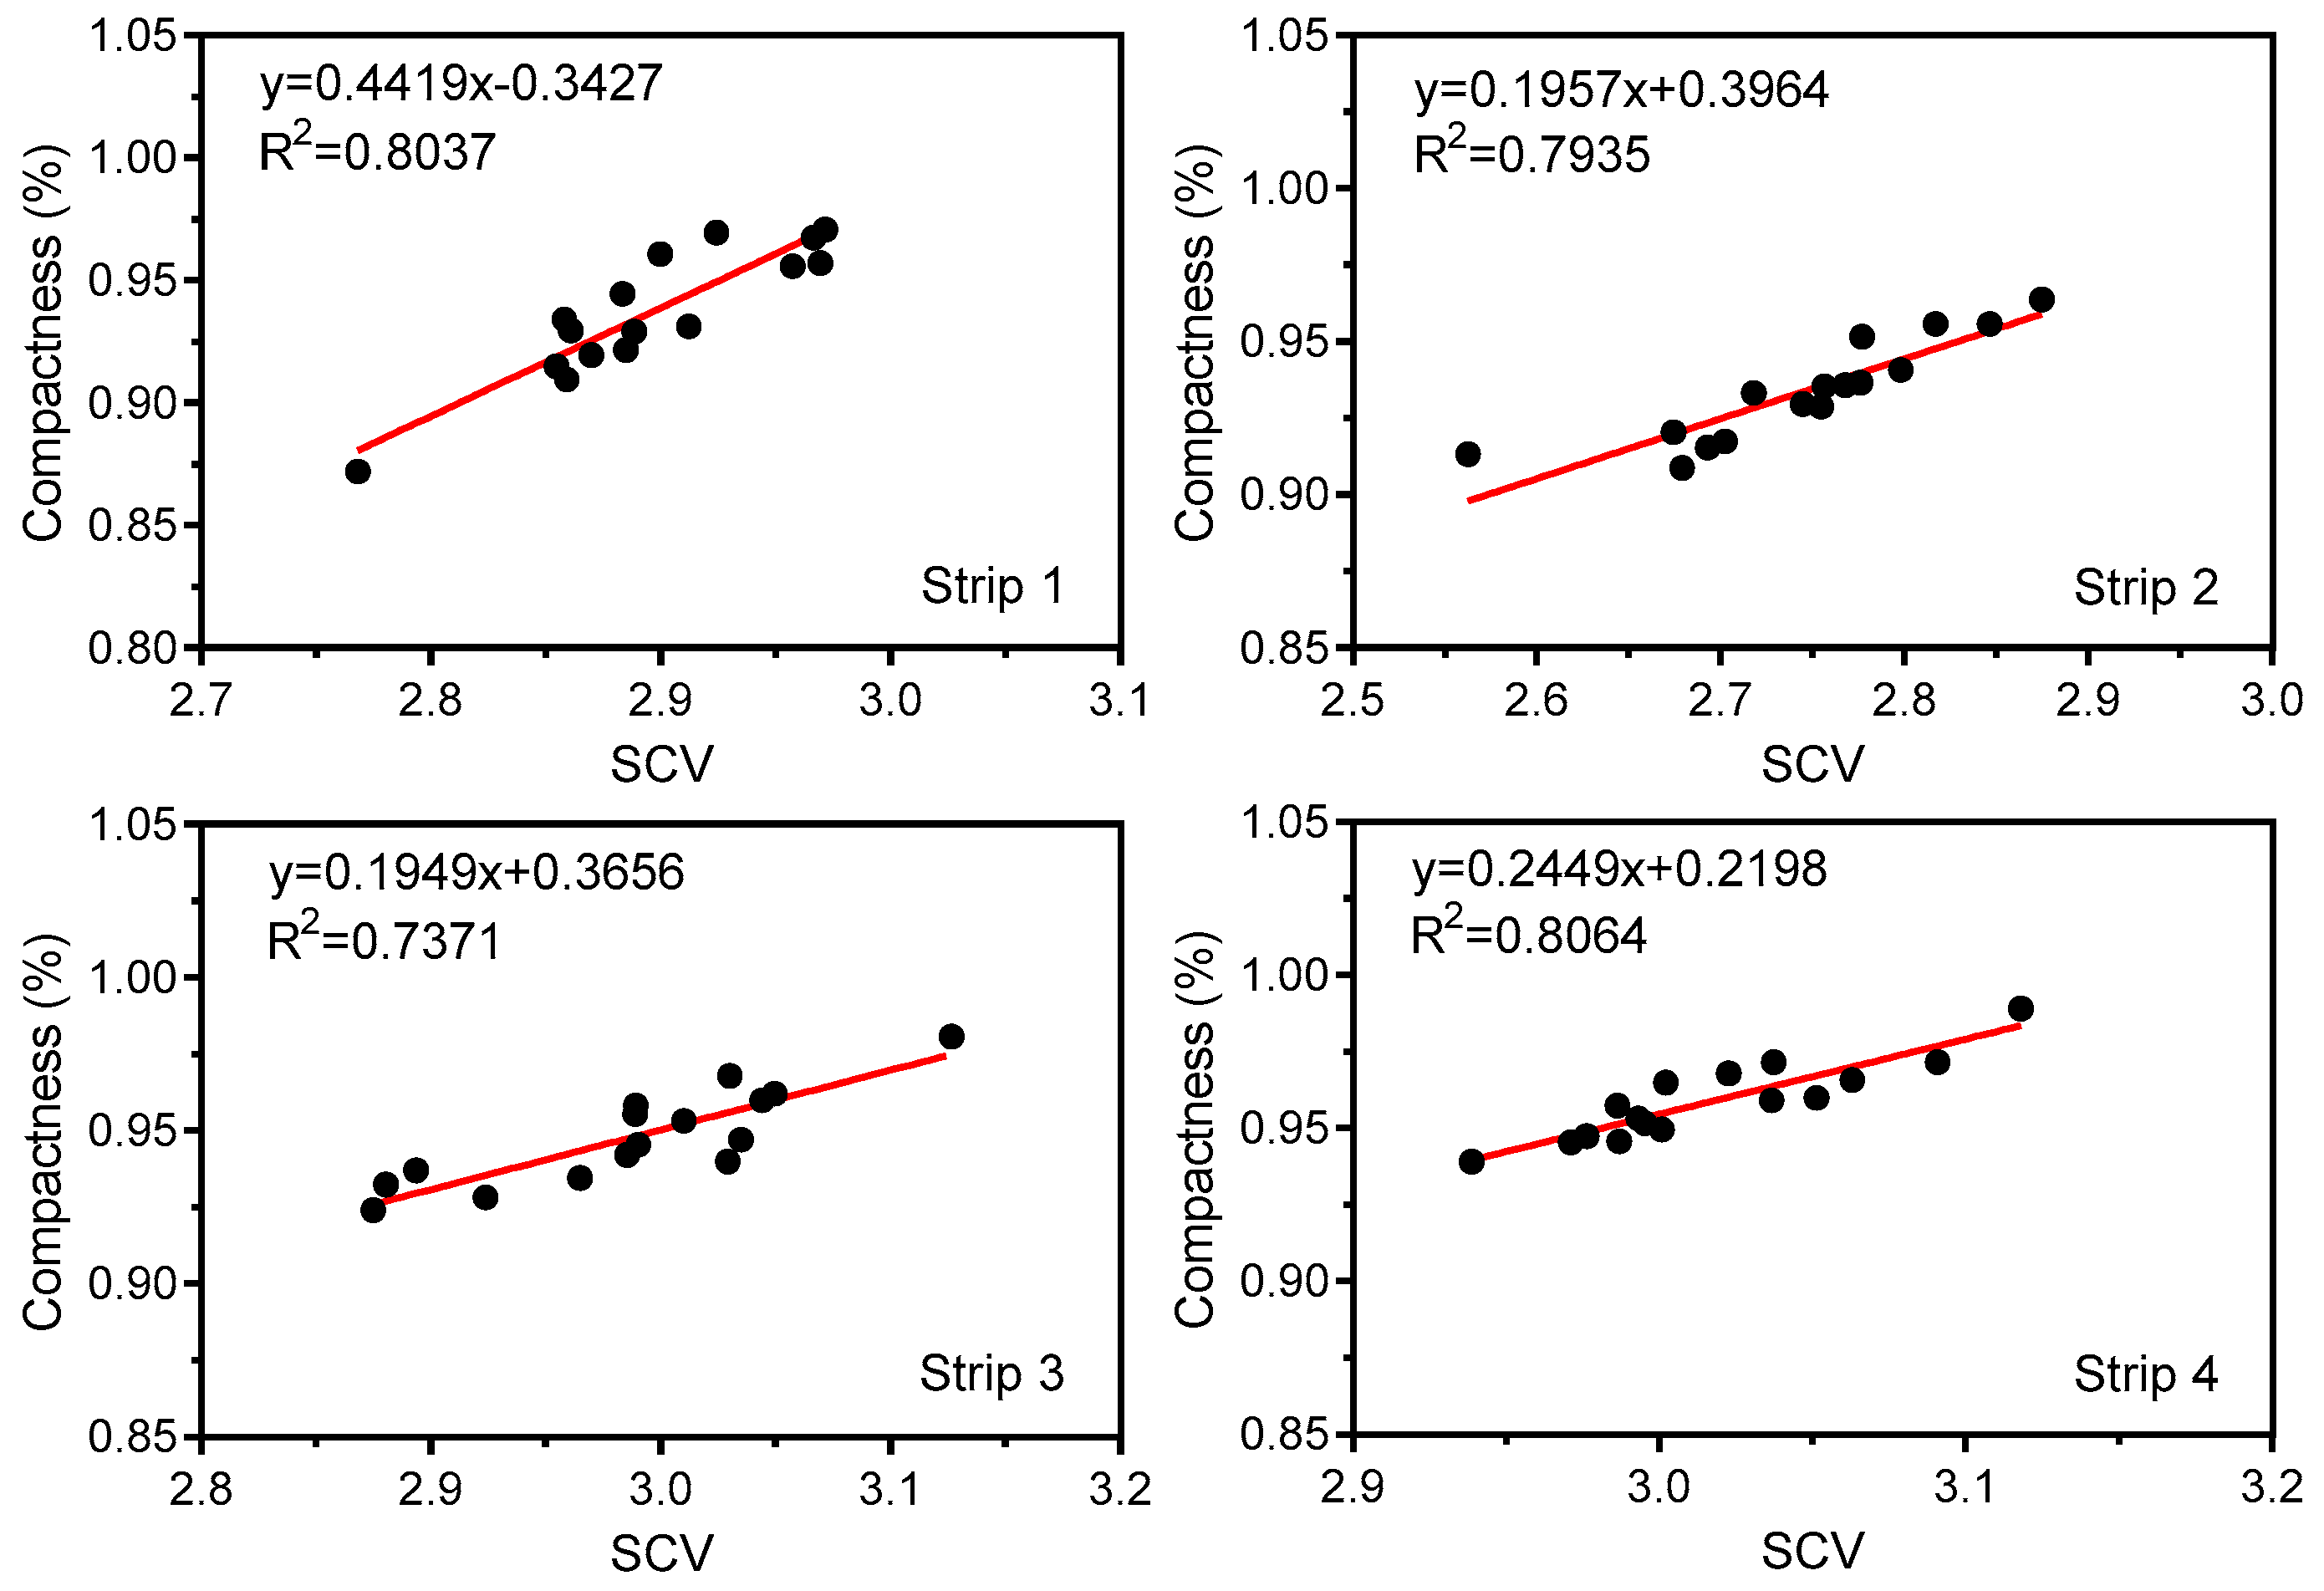
4.2. Correlations between Compaction Parameters and SCV

Based on the analysis described above, SCV was determined. As for the relation between the number of compaction times and SCV, a series of field tests were conducted to the NGM at the main dam. Figure 15 shows the correlation between SCV and the number of compaction times in strip 1. The linear correlation between SCV and the number of compaction times ranging from 1 to 8 was analyzed. For each test strip, SCV at each of the six blocks within the strip was calculated during each the compaction. In this figure, SCV for NGM increased with the increase of the number of compaction times. SCV computed for each block within each strip had a strong linear relation with the number of compaction times, and the determination coefficient ( R 2 ) ranged from 0.7803 to 0.9696, respectively. The specific determined coefficient ( R 2 ) was shown in Table 3.

4.3. Correlations between SCV and Compaction Quality of Rockfill Materials

In the upstream cofferdam construction area, field tests at four strips were conducted to obtain the dry density, compactness, and other property parameters of the rockfill materials ( P 5 content, minimum dry density, and maximum dry density). In total, 16 groups of data were collected for correlation analysis. Figure 16 shows the correlation between the SCV and the dry density as well as between the SCV and the compactness when the number of compaction times is 6, 8, 10, and 12, respectively, in strip 1. The correlation between the SCV and the dry density as well as the correlation between the SCV and the compactness had similar trends, i.e., while the SCV increased, the dry density and the compactness also increased and vice versa. The relation between the SCV and the compactness is shown in Figure 17. It evidently exhibits a strong linear relation with the determination coefficient R 2 ranging from 0.7371 to 0.8064. Since the SCV strongly correlates to the compactness, the SCV is an effective index that reflects the compaction status of rockfill materials, while the compactness is a key index of the compaction quality of the dam foundation and dam body.

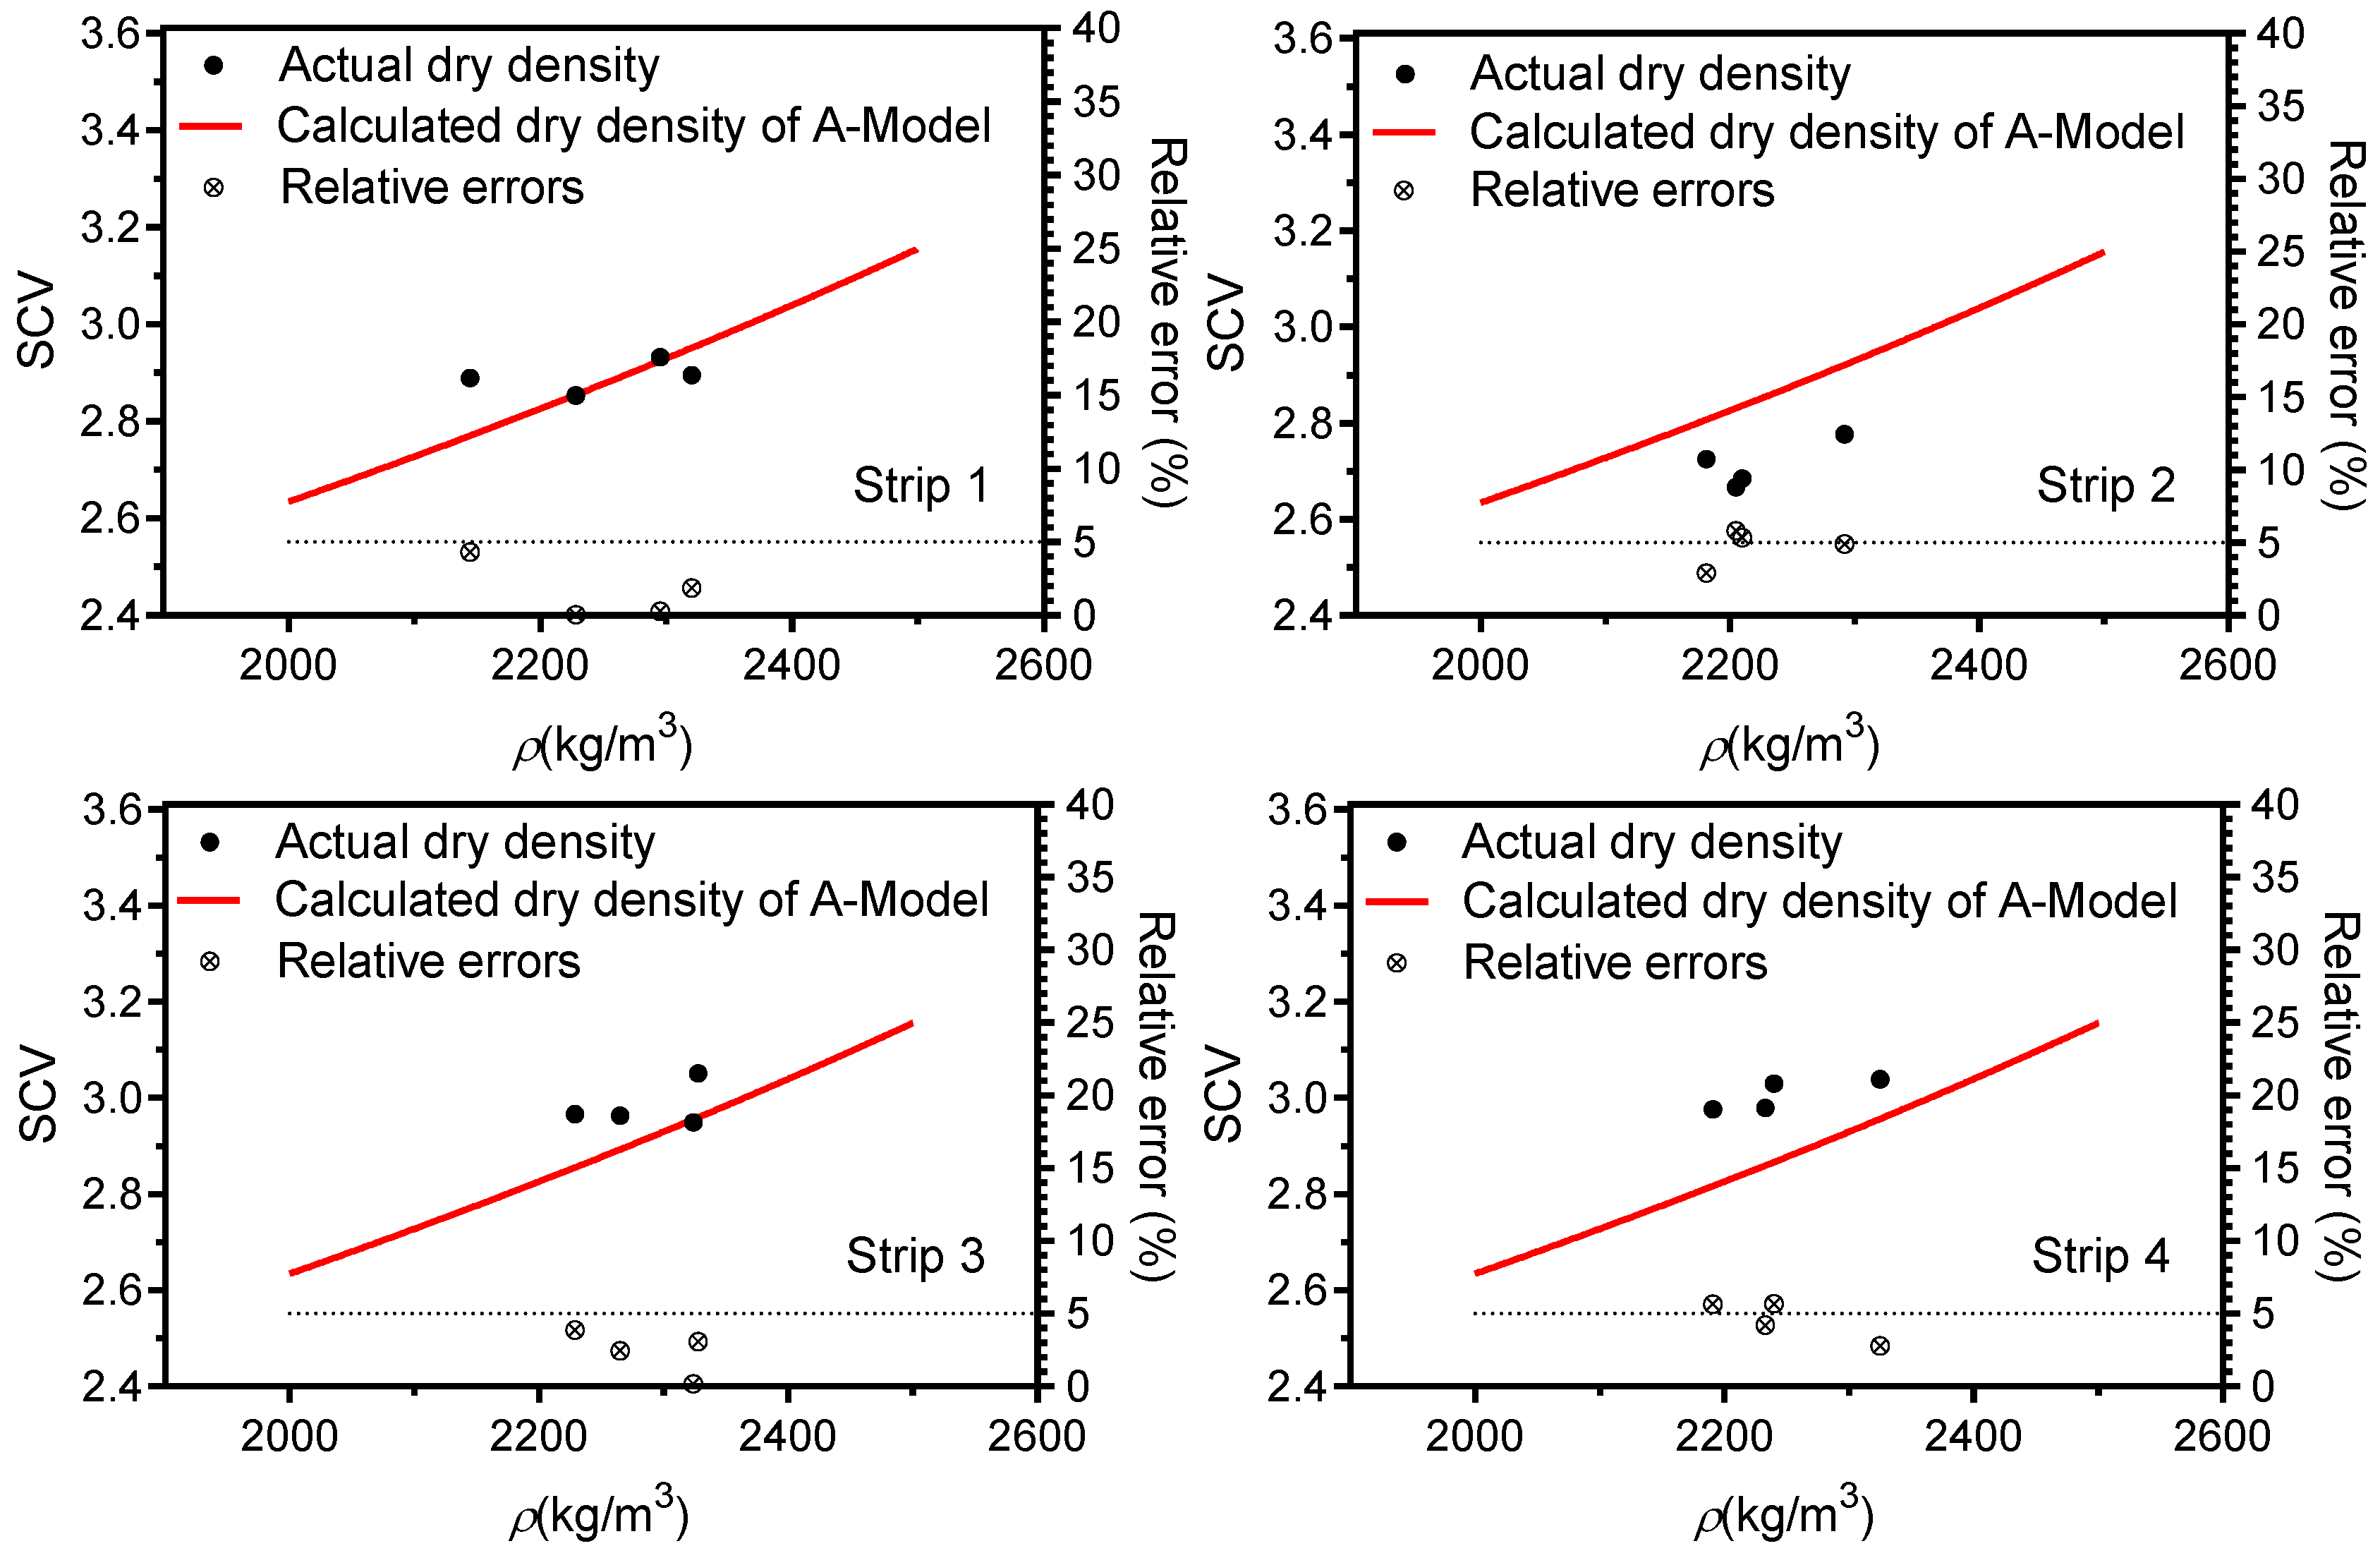
4.4. Relations between the Theoretical Model and In Situ Measurements

Figure 16 and Figure 17 reflect the compaction quality by analyzing the correlations between the SCVs and the measured values from field tests. To some extent these analyses could reflect the effectiveness of the new detection technique proposed in this paper. In order to further verify the effectiveness of this technique, the relations between the actual values from in situ measurements and calculated values from A-model. The measured values from the field tests were calculated on average when the number of compaction times was 6, 8, 10, and 12, respectively, in each strip. Figure 18 shows the comparison of the dry density between the actual values and the calculated values based on A-model. The relative errors between the measured dry density and the calculated values based on A-model are shown in Table 4. The average relative errors of A-model are less than 5%, which means that A-model has high accuracy.
White and Thompson [15] conducted a field study with 30-m test strips using five granular materials to investigate the correlation between CMV and the compaction quality of granular materials in transportation projects. The results of White and Thompson showed that CMV was not suitable for rockfill materials with large particle sizes (>200 mm). Moreover, based on the foregoing analysis, Liu’s method would not be suitable for NGM (0.1 mm~400 mm). Due to the larger particle size distribution of NGM than soil, which is suitable for road construction and earth-rock materials used for dam construction, as well as results from White and Thompson’s study, previously developed detection techniques and methods could not meet the needs of rockfill materials from the reservoir project in Luoyang, China. As a result, a new compaction detection technique is proposed in this paper. The new compaction detection technique can solve the existing problem and drawbacks in the CMV method. The SCV, which is used to detect the compactness of rockfill materials, can automatically be acquired by CAWDS developed in this study, and can directly characterize the compaction status of rockfill materials (Figure 19). Figure 19 shows the variation of the SCV as the number of compaction times in Strip 1. The overall compaction performance covering 100% of the work area can be clearly determined by the nephogram.

5. Conclusions

In this study, a new roller-integrated acoustic wave detection technique was proposed; the SCV was utilized as a compaction index for the evaluation of the compaction quality, and an infinite baffle piston radiation acoustic field model (i.e., A-model) was established to accurately estimate the dry density of the NGM. The new technique was adopted to detect the compactness and evaluate the compaction quality in the entire construction area of the upstream cofferdam of a reservoir project in Luoyang, China. The new technique was beneficial to improve the compaction quality and avoid quality defects.
The following conclusions were drawn.
(1)
The SCV value increased with the increase of the number of compaction times. Furthermore, the SCV increased with the increase of the compactness or dry density and vice versa. Moreover, the SCV had a strong linear correlation with the number of compaction times ( R 2 ranged from 0.7803 to 0.9696) as well as the compactness ( R 2 ranged from 0.7371 to 0.8064). The comparison analysis of the actual and calculated dry density based on A-model showed that the relative errors were between 0.04% and 5.80%, and the average relative errors were less than 5%.
(2)
A-model, namely, a relational model between the SCV and the dry density of the NGM, was established. During the modeling process, an innovative differential pulse excitation method was proposed and used to solve the numerical solution of the vertical displacement of the soil surface under harmonic loads. The A-model has been experimentally verified to have high accuracy and can meet the requirements of practical projects.
(3)
Statistical averaging of in situ measurements in each test strip of the field tests mitigated measurement variations and revealed the high accuracy of the calculated values based on the A-model. This data processing method conforms to the design specifications of rockfill dams and the calculation results based on the A-model are reliable.
(4)
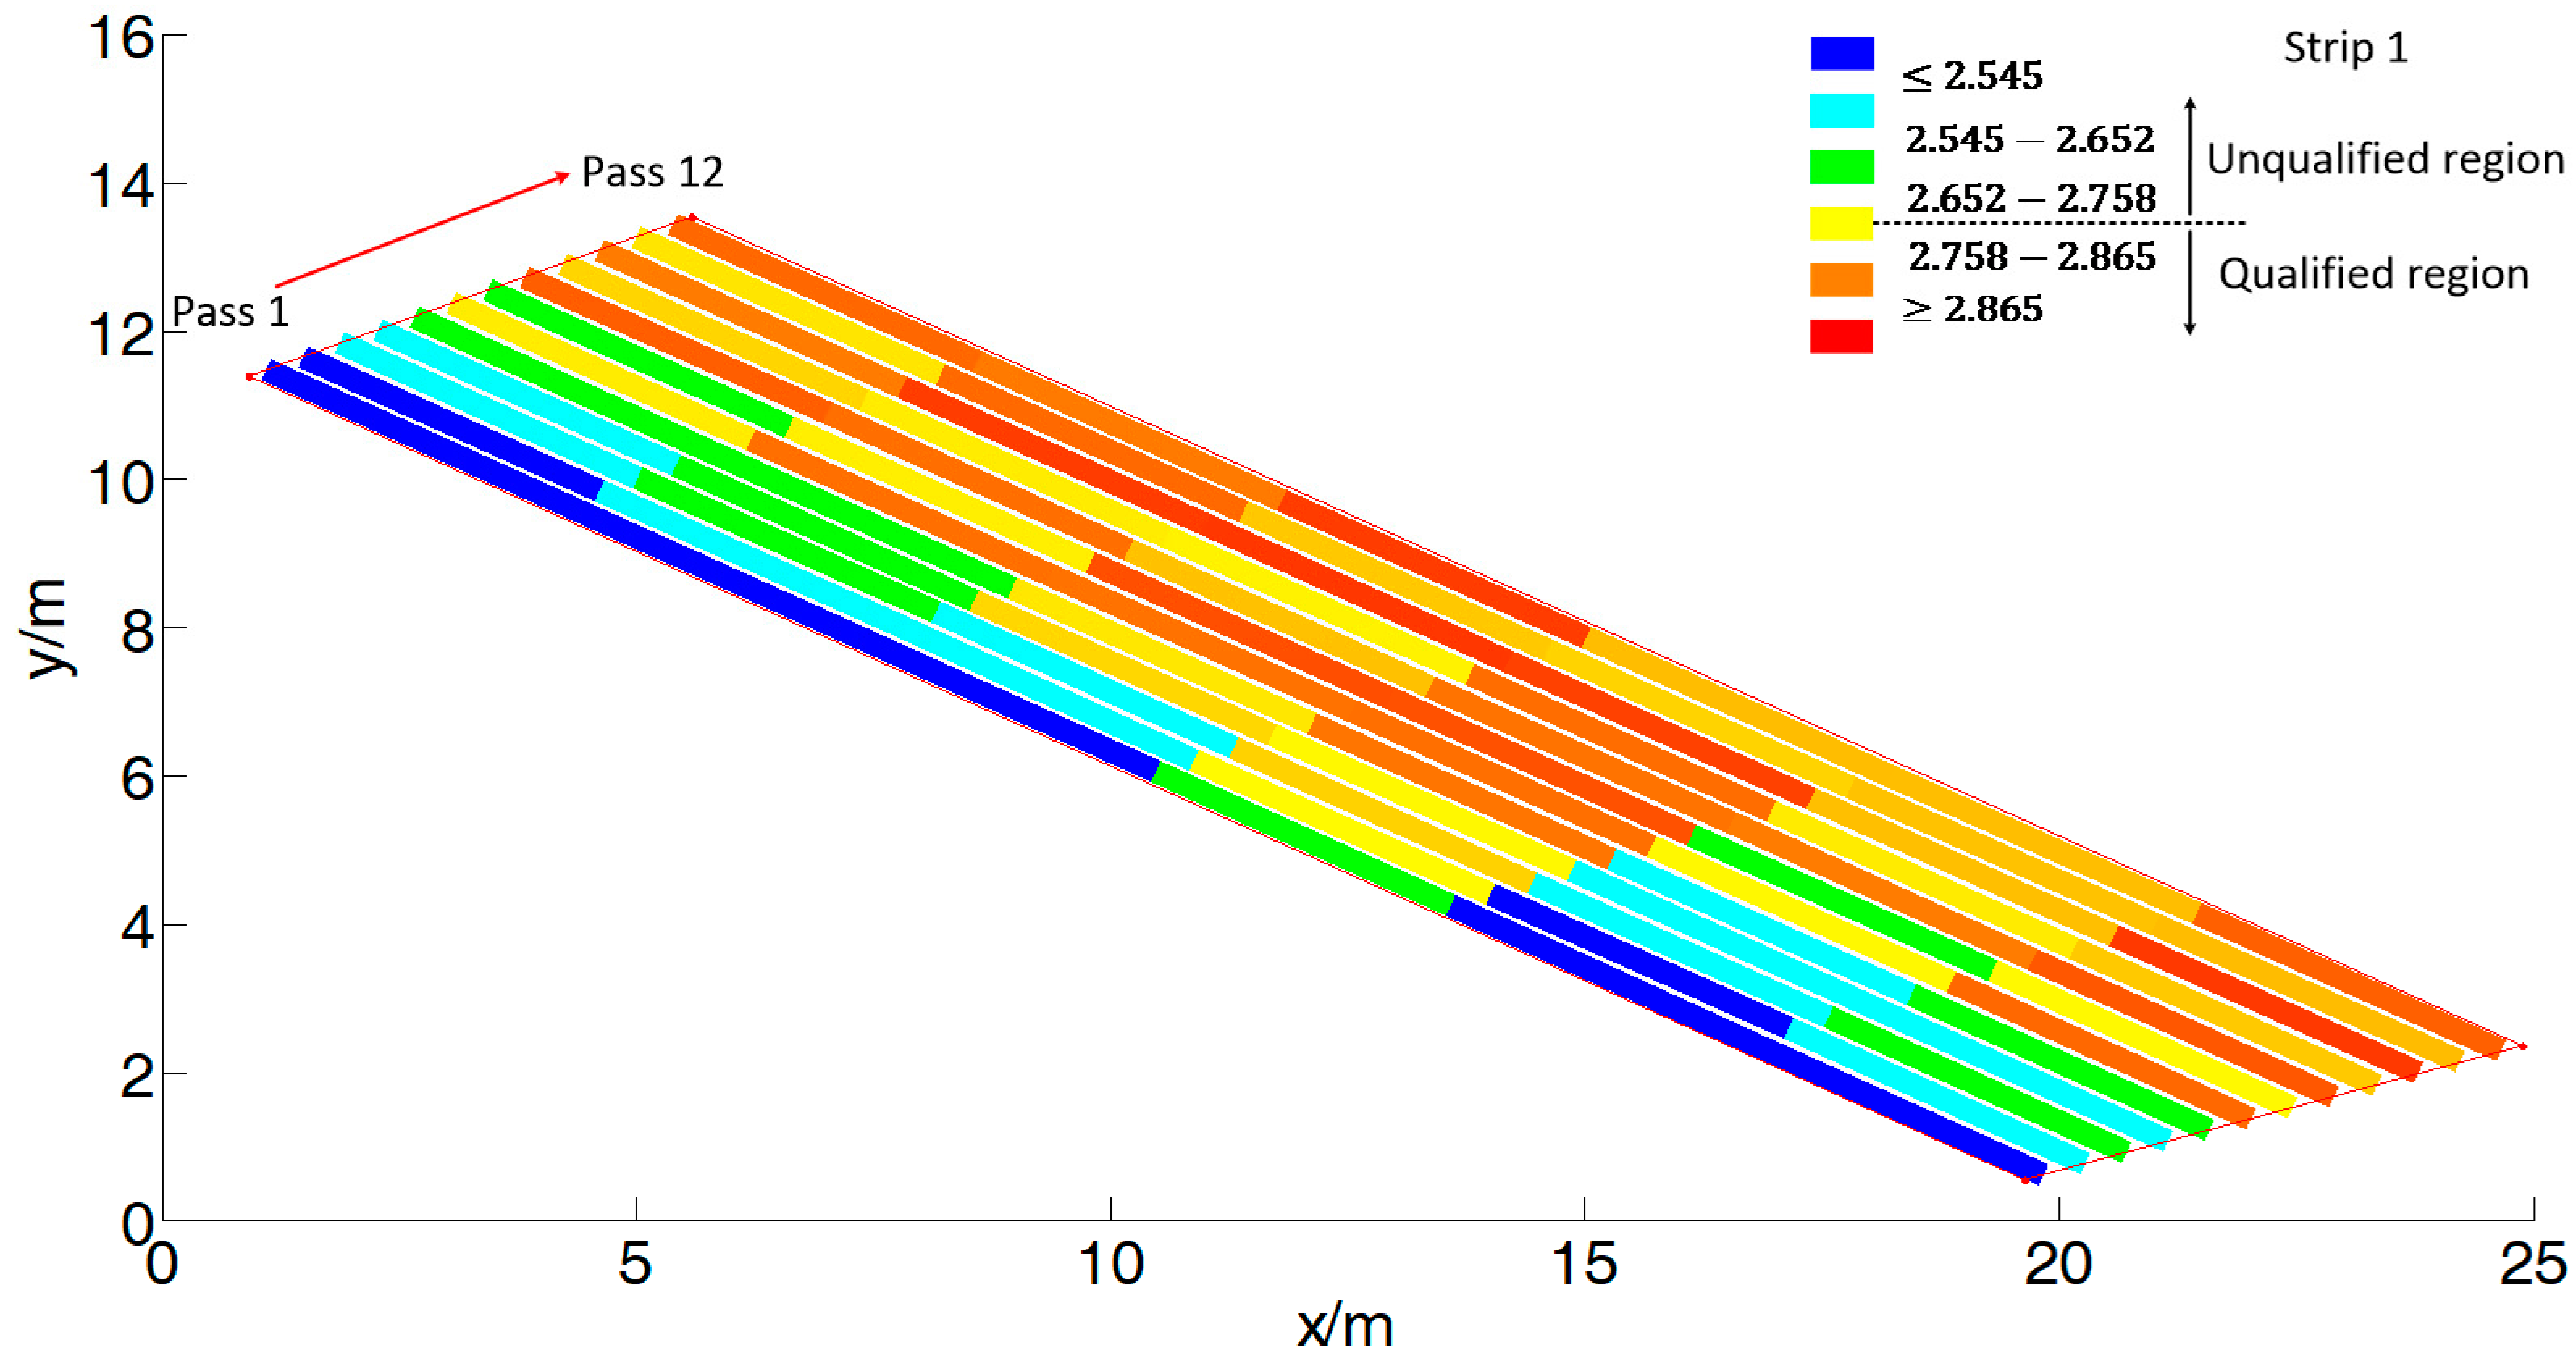
Compared with existing contact techniques and methods and CMV-based RICM techniques, the new technique proposed in this paper demonstrated several advantages, such as higher accuracy, smaller discreetness, convenience, and suitability for detecting the compactness of rockfill materials with particle sizes larger than 200 mm. In addition, based on the CAWDS developed in this study and the RTK-GPS technique, the SCV could automatically be acquired and used to characterize the compaction status of the NGM as a nephogram. Based on the nephogram, the compaction performance in the entire work areas could be clearly determined and support could be provided for quality control in a timely manner. The above results showed that the SCV could serve as a real-time monitoring index characterizing the compaction quality of rockfill dam materials.

Acknowledgments

This work was supported by the National Basic Research Program of China (973 Program, Grant No. 2013CB035902) and the National Natural Science Foundation of China (No. 51339003). The costs to publish in open access have been covered by the funding.

Author Contributions

Qinglong Zhang, Qingbin Li, and Tianyun Liu proposed a roller-integrated acoustic wave detection technique for rockfill materials. Qinglong Zhang, Qingbin Li, and Tianyun Liu conceived and designed the experiments. Qinglong Zhang performed the experiments, analyzed the data, and wrote the initial draft of the manuscript. Qingbin Li and Tianyun Liu reviewed and contributed to the final manuscript.

Conflicts of Interest

The authors declare no conflict of interest.

References

  1. Liu, D.H.; Sun, J.; Zhong, D.H.; Song, L.G. Compaction quality control of earth-rock dam construction using real-time field operation data. J. Constr. Eng. Manag. 2012, 138, 1085–1094. [Google Scholar] [CrossRef]
  2. Krebs, R.D.; Walker, E.D. Highway Materials; McGraw-Hill Book Co.: New York, NY, USA, 1971. [Google Scholar]
  3. Rahman, F.; Hossain, M.; Hunt, M.M.; Romanoschi, S.A. Soil stiffness evaluation for compaction control of cohesionless embankments. Geotech. Test. J. 2008, 31, 442–451. [Google Scholar]
  4. Meehan, C.L.; Tehrani, F.S.; Vahedifard, F. A comparison of density-based and modulus based in situ test measurements for compaction control. Geotech. Test. J. 2012, 35, 387–399. [Google Scholar] [CrossRef]
  5. Melbouci, B. Compaction and shearing behavior study of recycled aggregates. Constr. Build. Mater. 2009, 23, 2723–2730. [Google Scholar] [CrossRef]
  6. Zabilska-Adamska, K.; Sulewska, M.J. Dynamic CBR test to assess the soil compaction. J. Test. Eval. 2014, 43, 1028–1036. [Google Scholar] [CrossRef]
  7. Resende, L.R.M.; Oliveira Filho, W.L.; Nogueira, C.L. Use of the DCP test for compaction control of staged dikes in mining tailings dams. REM Rev. Esc. Minas 2013, 66, 493–498. [Google Scholar] [CrossRef]
  8. Kongkitkul, W.; Saisawang, T.; Thitithavoranan, P.; Kaewluan, P.; Posribink, T. Correlations between the surface stiffness evaluated by light-weight deflectometer and degree of compaction. Tunn. Undergr. Constr. Geo Shanghai 2014, 65–75. [Google Scholar] [CrossRef]
  9. Umashankar, B.; Hariprasad, C.; Kumar, G. Compaction quality control pavement layers using LWD. J. Mater. Civ. Eng. 2016, 28. [Google Scholar] [CrossRef]
  10. Swinford, J.M.; Meyer, J.H. An evaluation of a nuclear density gauge for measuring infield compaction in soils of the South African sugar industry. S. Afr. Sugar Technol. Assoc. 1985, 19, 218–224. [Google Scholar]
  11. White, D.J.; Thompson, M.T.; Morris, M. Power-based compaction monitoring using vibratory padfoot roller. Proc. Geo-Congr. 2016, 1–6. [Google Scholar] [CrossRef]
  12. Thurner, H.; Forsblad, L. Compaction Meter on Vibrating Rollers; Res Bulletin Nr 8022 Monograph; Swedish National Road and Transport Research Institute (VTI): Linköping, Sweden, 1978. [Google Scholar]
  13. Forssblad, L. Compaction meter on vibrating rollers for improved compaction control. Proc. Int. Conf. Compact. 1980, 2, 541–546. [Google Scholar]
  14. Anderegg, R.; Kaufmann, K. Intelligent Compaction with Vibratory Rollers-Feedback Control Systems in Automatic Compaction and Compaction Control; Transportation Research Board: Washington, DC, USA, 2004; pp. 124–134. [Google Scholar]
  15. White, D.J.; Thompson, M.J. Relationships between in situ and roller-integrated compaction measurements for granular soils. J. Geotech. Geoenviron. Eng. 2008, 134, 1763–1770. [Google Scholar] [CrossRef]
  16. Anderegg, R.; von Felten, D.A.; Kaufmann, K. Compaction monitoring using intelligent soil compactors. GeoCongress 2006 2006. [Google Scholar] [CrossRef]
  17. Thompson, M.J.; White, D.J. Estimating compaction of cohesive soils from machine drive power. J. Geotech. Geoenviron. Eng. 2008, 134, 1771–1777. [Google Scholar] [CrossRef]
  18. White, D.J.; Jaselskis, E.J.; Schaefer, V.R.; Cackler, E.T. Real-Time Compaction Monitoring in Cohesive Soils from Machine Response; Transportation Research Record No. 1936; Transportation Research Board: Washington, DC, USA, 2005; pp. 173–180. [Google Scholar]
  19. Komandi, G. An evaluation of the concept of rolling resistance. J. Terrramech. 1999, 36, 159–166. [Google Scholar] [CrossRef]
  20. Adam, D. Continuous compaction control (CCC) with vibratory rollers. In Proceedings of the GeoEnvironment 97: 1st Australia-New Zealand Conference on Environmental Geotechnics, Melbourne, Australia, 26–28 November 1997; pp. 245–250. [Google Scholar]
  21. Mooney, M.; Rinehart, R. Field Monitoring of roller vibration during compaction of subgrade soil. J. Geotech. Geoenviron. 2007, 133, 257–265. [Google Scholar] [CrossRef]
  22. Rinehart, R.; Mooney, M. Instrumentation of a roller compactor to monitor vibration behavior during earthwork compaction. Automat. Constr. 2008, 17, 144–150. [Google Scholar] [CrossRef]
  23. Singh, D.; Zaman, M.; Commuri, S.; Zaman, M. Application of intelligent compaction technology for estimation of effective modulus for a multilayered asphalt pavement. J. Test. Eval. 2015, 43, 1–11. [Google Scholar] [CrossRef]
  24. Xu, Q.; Chang, G.K. Adaptive quality control and acceptance of pavement material density for intelligent road construction. Automat. Constr. 2016, 62, 78–88. [Google Scholar] [CrossRef]
  25. Liu, D.H.; Lin, M.; Li, S. Real-time quality monitoring and control of highway compaction. Automat. Constr. 2016, 62, 114–123. [Google Scholar] [CrossRef]
  26. Karray, M.; Lefebvre, G.; Ethier, Y.; Bigras, A. Assessment of deep compaction of the Peribonka dam foundation using “modal analysis of surface waves” (MASW). Can. Geotech. J. 2010, 47, 312–326. [Google Scholar] [CrossRef]
  27. Donohue, S.; Forristal, D.; Douohue, L.A. Detection of soil compaction using seismic surface waves. Soil Tillage Res. 2013, 128, 54–60. [Google Scholar] [CrossRef] [Green Version]
  28. Shangguan, P.; Al-Qadi, I.; Coenen, A.; Zhao, S. Algorithm development for the application of ground-penetrating radar on asphalt pavement compaction monitoring. Int. J. Pavement Eng. 2016, 17, 189–200. [Google Scholar] [CrossRef]
  29. Liu, D.H.; Li, Z.L.; Lian, Z.H. Compaction quality assessment of earth-rock dam materials using roller-integrated compaction monitoring technology. Automat. Constr. 2014, 44, 234–246. [Google Scholar] [CrossRef]
  30. Sandström, Å. Numerical Simulation of a Vibratory Roller on Cohesionless Soil; Internal Report; Geodynamic: Stockholm, Sweden, 1994; pp. 1–22. [Google Scholar]
  31. Vennapusa, P.K.R.; White, D.J.; Morris, M.D. Geostatistical analysis for spatially referenced roller-integrated compaction measurements. J. Geotech. Geoenviron. 2010, 136, 813–823. [Google Scholar] [CrossRef]
  32. Lamb, H. On the propagation of an elastic solid. Proc. R. Soc. Lond. 1904, 203, 1–42. [Google Scholar]
  33. De Hoop, A.T. A modification of Cagniard’s method for solving seismic pulse problems. Appl. Sci. Res. 1960, 8, 349–356. [Google Scholar] [CrossRef]
  34. Reissner, E. Stationäre, axialsymmetrische, durch eine schüttelnde Masse erregte Schwingungen eines homogenen elastischen Halbraumes. Ing. Arch. 1936, 7, 381–396. [Google Scholar] [CrossRef]
  35. Quinlan, P.M. The elastic theory of soil dynamics. In Symposium on Dynamic Testing of Soils; ASTM STP 156; ASTM International: West Conway Hocken, PA, USA, 1953; pp. 3–34. [Google Scholar] [CrossRef]
  36. Sung, T.Y. Vibration in semi-infinite solids due to periodic surface loadings. In Symposium on Dynamic Testing of Soils; ASTM STP 156; ASTM International: West Conway Hocken, PA, USA, 1953; pp. 35–54. [Google Scholar] [CrossRef]
  37. Biot, M.A. Theory of deformation and acoustic propagation in porous media. J. Appl. Phys. 1962, 33, 1482–1498. [Google Scholar] [CrossRef]
  38. Paul, H.S. On the displacements produced in a porous elastic semi-space by an impulsive line load (non-dissipative case). Pure Appl. Geophys. 1976, 114, 605–614. [Google Scholar] [CrossRef]
  39. Philippacopoulos, A.J. Lamb’s problem for fluid-saturated porous media. Bull. Seismol. Soc. Am. 1988, 78, 908–923. [Google Scholar]
  40. Wang, L.Z.; Chen, Y.M.; Wu, S.M.; Ding, H.J. A solution to saturated elastic semi-space under harmonic force of low frequency. J. Hydraul. Eng. 1996, 2, 84–88. [Google Scholar]
  41. Cai, Y.Q.; Meng, K.; Xu, C.J. Stable response of axisymmetric two-phase water-saturated soil. J. Zhejiang Univ. Sci. 2004, 5, 1022–1027. [Google Scholar] [CrossRef] [PubMed]
  42. Jin, B.; Liu, H. Vertical response of a disk on a saturated poroelastic semi-space. Soil. Dyn. Earthq. Eng. 1999, 18, 437–443. [Google Scholar]
  43. Jin, B.; Liu, H. Horizontal vibrations of a disk on a poroelastic semi-space. Soil Dyn. Earthq. Eng. 2000, 19, 269–275. [Google Scholar] [CrossRef]
  44. Senjuntichai, T.; Sapsathiarm, Y. Forced vertical vibration of circular plate in multilayered poroelastic medium. J. Eng. Mech. 2003, 129, 1330–1341. [Google Scholar] [CrossRef]
  45. Pekeris, C.L. The seismic surface pulse. Proc. Natl. Acad. Sci. USA 1955, 41, 469–480. [Google Scholar] [CrossRef] [PubMed]
  46. Lade, P.V.; Nelson, R. Modeling of the elastic behavior of granular materials. Int. J. Numer. Anal. Methods Geomech. 1987, 11, 521–542. [Google Scholar] [CrossRef]
  47. Liu, H.B.; Zou, D.G.; Liu, J.M. Constitutive modeling of dense gravelly soils subjected to cyclic loading. Int. J. Numer. Anal. Methods Geomech. 2014, 38, 1503–1518. [Google Scholar] [CrossRef]
Figure 1. Isotropic and homogeneous semi-space.
Applsci 07 01118 g001
Figure 2. Relation between the surface vertical displacement u z ( r , 0 , t ) and τ .
Applsci 07 01118 g002
Figure 3. Periodic simple harmonic load excitation discretization.
Applsci 07 01118 g003
Figure 4. Schematic diagram of pule load formed by differential concentrated load.
Applsci 07 01118 g004
Figure 5. Change curve of vertical displacement at different times.
Applsci 07 01118 g005
Figure 6. (a) Circular piston on infinite baffle; (b) radiated acoustic field of circular piston.
Applsci 07 01118 g006
Figure 7. Diagrammatic sketch of compacting area in pulse load duration time ( Δ τ ).
Applsci 07 01118 g007
Figure 8. Relation curve between dry density of gravel materials and SCV based on A-model. SCV: sound compaction value.
Applsci 07 01118 g008
Figure 9. Schematic diagram of acoustic wave detection technique.
Applsci 07 01118 g009
Figure 10. Illustration of changes in sound pressure and SCV with increasing ground stiffness.
Applsci 07 01118 g010
Figure 11. Grading curve of gravel material taken from in situ VI zone material field.
Applsci 07 01118 g011
Figure 12. Photos of field rolling test in the rockfill zone.
Applsci 07 01118 g012
Figure 13. Original acoustic signal data collected from Strip 1 by acoustic field microphone 3.
Applsci 07 01118 g013
Figure 14. Spectrum analysis of domain signal collected from Block 1 in Strip 1.
Applsci 07 01118 g014
Figure 15. Correlation between the SCV and the number of compaction times in Strip 1.
Applsci 07 01118 g015
Figure 16. SCV, dry density, SCV, and compactness at each block along Strip 1.
Applsci 07 01118 g016
Figure 17. Linear correlations between SCV and compactness computed from all test strips.
Applsci 07 01118 g017
Figure 18. Comparison between actual dry density values and calculated values computed by A-model.
Applsci 07 01118 g018
Figure 19. Compaction nephogram of Strip 1 using SCV.
Applsci 07 01118 g019
Table 1. Key parameters required for the numerical analysis.
ParameterValueParameterValueParameterValue
p 0 / Pa 10 5 r / m 10 6 a / cm 0.01
ρ 0 / ( kg · m 3 ) 1.2 π 3.14 ρ / ( g · cm 3 ) 2.2
c 0 / ( m · s 1 ) 340 ρ 0 / ( g · cm 3 ) 2.0 ~ 2.5 ω 0 / ( rad · s 1 ) 174.5
m 0 0.375 r P / cm 22.6 ρ / ( g · cm 3 ) 2.2
Table 2. Test scheme for field rolling experiment.
MaterialStripPasses (Static)Passes (Vibratory)Vibration Frequency ( H z )Velocity ( K m / h )Lift Thickness ( m )Vibration Status
NGM1~4212313About 0.8HFHA
Table 3. Specific determined coefficient ( R 2 ) between the SCV and the number of compaction times for NGM.
Strip1234
Block
10.89720.80850.81470.9096
20.84610.83160.82370.9204
30.83420.87750.96960.8416
40.78030.86280.92320.8052
50.90010.79610.86790.8714
60.80100.86190.79550.8968
Table 4. Relative errors between measured and calculated dry density.
StripMaximum Relative Error (%)Minimum Relative Error (%)Average Relative Error (%)
14.310.041.63
25.802.914.74
33.890.182.39
45.662.794.58

