Article

Automated Defect Recognition as a Critical Element of a Three Dimensional X-ray Computed Tomography Imaging-Based Smart Non-Destructive Testing Technique in Additive Manufacturing of Near Net-Shape Parts

1
Brunel Innovation Centre, Brunel University London, Uxbridge, London UB8 3PH, UK
2
TWI Ltd, Granta Park, Great Abington CB21 6AL, UK
*
Author to whom correspondence should be addressed.
Appl. Sci. 2017, 7(11), 1156; https://doi.org/10.3390/app7111156
Submission received: 4 September 2017 / Revised: 2 November 2017 / Accepted: 3 November 2017 / Published: 10 November 2017
(This article belongs to the Section Materials Science and Engineering)

Abstract

:
In this paper, a state of the art automated defect recognition (ADR) system is presented that was developed specifically for Non-Destructive Testing (NDT) of powder metallurgy (PM) parts using three dimensional X-ray Computed Tomography (CT) imaging, towards enabling online quality assurance and enhanced integrity confidence. PM parts exhibit typical defects such as microscopic cracks, porosity, and voids, internal to components that without an effective detection system, limit the growth of industrial applications. Compared to typical testing methods (e.g., destructive such as metallography that is based on sampling, cutting, and polishing of parts), CT provides full coverage of defect detection. This paper establishes the importance and advantages of an automated NDT system for the PM industry applications with particular emphasis on image processing procedures for defect recognition. Moreover, the article describes how to establish a reference library based on real 3D X-ray CT images of net-shape parts. The paper follows the development of the ADR system from processing 2D image slices of a measured 3D X-ray image to processing the complete 3D X-ray image as a whole. The introduced technique is successfully integrated into an automated in-line quality control system highly sought by major industry sectors in Oil and Gas, Automotive, and Aerospace.

1. Introduction

Net-shape parts of typically intricate and complex shapes obtained by powder metallurgy and additive manufacturing (AM) are employed in several key mass industry sectors, especially automotive, aerospace and medical. Their use is growing rapidly in preference to conventional casting because most PM processes produce parts in the desired precise final shape with little or no further machining requirement. Moreover the use of fine-grained (nano/micro scale), pre-alloyed homogeneous powders allows the manufacturing of parts with precisely set material properties and microstructures for increased strength. In conventional PM, powders are blended and compacted by cold pressing in a die and sintered in a furnace whereby the bonding between the particulates is further consolidated [1,2]. A significant drawback, however, is that following powder compaction, unwanted features like porosity (Figure 1) and cracks (Figure 2) in the microstructure, may remain [3,4] which can survive into the sintering phase, developing into critical flaws and defects. Similar defects can be observed in other additive manufacturing methods such as laser cladding and laser sintering, where the raw material is in the form of particulates, in addition to the ever present risk of delamination (Figure 3) that can occur between the added layers [5,6,7]. If undiscovered, these flaws may result in unwanted mechanical properties of parts that, can introduce a level of unreliability to the product. End-of-line inspection, not often performed, leads to the scrapping of 6–8% of components, yet fails to detect micro-sized defects, which can grow in service to produce major in-service failures and recalls.
In terms of conventional press and sinter PM, the production can be improved significantly by introducing such an inspection system to the process. It is understood that the majority of defects originate in the pressing phase [4]. Optimisation of the pressing tool and the pressing process is, therefore, crucial for the final product quality. In most cases, the optimisation is based on a series of trials where the commonly used method to inspect the green parts is through destructive testing following sintering. These organisations use metallography as the main destructive testing method. As metallography, due to its nature, cannot provide accurate and reliable results in the full volume of the part [8], the tool optimisation requires numerous repetitions. The current tool and process optimisation, therefore, results in high tooling costs and lengthy setting up periods, limiting the growth of this manufacturing technique [9].
An Non-Destructive Testing prototype system has recently been developed which utilises the advantages of computed tomography to enable online (real time) quality assurance of powder metallurgy products [10,11]. The system is capable of detecting bulk porosity, loss of material, delamination, and also captures microscopic cracks (surface breaking or volumetric) at any stage of the manufacturing process, therefore, potentially reducing production costs of material, energy, and time for the manufacturers by identifying faulty parts.
The system uses Computed Tomography technique to capture the data from the parts’ internal structure including any defect like features. From few hundred to couple of thousands of X-ray projection images are taken per part. These images are forwarded to a CT reconstruction tool that in our case uses the Filtered Back Projection technique and is developed by the Fraunhofer-Institut für Integrierte Schaltungen. The 3D reconstructed image is than fed into the automated defect recognition module. As the final step in the process, the ADR system enhances the quality of the 3D CT image in order to highlight the areas of potential defects. Following image processing these highlighted areas are separated from the background and being classified in comparison with pre-set data from the image library. Based on preliminarily stored data the ADR system is capable to make decision whether the part under inspection is “pass”, “fail” or “pass/fail with conditions”.
Although the whole process, from the data acquisition to the final decision making is integrated and can run without the need for any interactions from the operators, our current work is mainly focused on the defect recognition.

1.1. Computed Tomography in Comparison with Destructive Testing Methods

There are few efficient and reliable testing methods available for inspecting PM parts at early production stages (for example at the green state of pressing) due to the relatively weak adhesion between the particles. Until recently, destructive methods were used as the ultimate quality assurance of near net-shape production. Traditionally, sample parts are collected at the end of the manufacturing process and, following a pre-inspection preparation, taken into the laboratory for inspection. The preparation involves traditional metallography processes of sample cutting and polishing [12] that requires a dedicated workshop facility. The sampling is only a small percentage, (1–2%), of the full production run and these samples are of course destroyed during the inspection [8]. Additionally, the information is limited to the particular cross-section of material under inspection, which is a limitation as there may be defects elsewhere in the original part. Consequently, such destructive testing methods are not capable of providing accurate and reliable results for full coverage of parts, i.e., volumetric information from parts in-line with manufacturing.
Compared to destructive testing, computed tomography offers a valid and reliable alternative for in line quality control that is much quicker and simpler to implement. In CT the part is placed between the X-ray source and the detector and rotated through 360 degrees in two to four thousand inspection steps. The photons of the X-ray beam pass through the specimen and are captured by the detector. The number of captured photons, and therefore image quality, largely depends on the density of the material, the thickness of the parts under inspection and the energy of the X-rays. The captured data in the form of a 2D projection image are then forwarded to an image processing and Automated Defect Recognition unit where the contrast of the different features is algorithmically enhanced and the flawed image compared against a database of flawless images. The processing time by this method can be as little as a few seconds to a few minutes, providing the capability for mass production scanning. Additionally with X-rays it is possible to extend the inspection volume to 100% of the part allowing recognition of the full range of defect types.

1.2. Brief Theory of Computed Tomography; from Medical to Industrial

X-ray CT refers to the use of X-rays to digitally dissect a specimen and reveal its interior details [13]. A 2D CT image or a CT slice typically corresponds to a certain small thickness slice of the object being scanned, while a 3D CT image is composed of stacked slices of an entire volume. Therefore, a 2D CT image comprises pixels (picture elements) while a 3D CT image comprises voxels (volume elements). A 2D CT image is obtained by projecting X-rays around the slice plane from a number of orientations and measuring their attenuation. The 2D distribution of X-ray attenuation in the slice plane is then reconstructed using a specialized algorithm. The grey levels in a 2D CT image correspond to the attenuation of X-rays attributed to each pixel in the slice. The 3D distribution describing an entire volume can be created by acquiring a stacked series of 2D slices.
Since its widespread adoption for medical imaging, X-ray CT has been adapted to various industrial applications too [14]; for example measuring dimensional and shape quality sometimes in the same time with checking material quality of parts. These parts are often made through machining, casting, thermo-forming, or other methods where measurement of internal dimensions is not possible [15]. The industrial tasks involve imaging denser materials (metals) for a wide range of sizes and resolutions In medical CT systems, low dose X-ray sources with relatively low-energy (<140 keV), large (mm-scale) beam widths, and high-efficiency detectors are used for safety reasons [6]. In industrial CT systems highly penetrating X-ray energies are required (min. 250 keV) for scanning high density materials (e.g., ferrous alloys), such as used in PM for manufacturing automotive gear parts [16]. Enclosures are designed and built for ensuring the safe operation of the X-ray system [17], tailored to the scale of the manufacturing operation and related component characteristics (size, material, and geometrical complexity). The application of purpose built enclosures allows the following characteristics for industrial CT imaging [13]: (1) high penetration capability for dense materials with higher-energy X-rays; (2) enhanced resolution through the use of narrower X-ray beams and more densely packed X-ray detectors; (3) increased signal-to-noise ratio (SNR) through longer exposure times, without compromising health and safety in a manufacturing environment.
A major innovation in this research project is the development of algorithms for automated defect detection and recognition to identify the defect features of each composite component and categorise the defects according to their types. Using these algorithms, there is a little need for an inspector to interact with the system that will automatically characterise and classify the defects in the composite components to give information required by the end-user. A prerequisite of this automated software is the establishment of a reference database for defect recognition by similarity analysis.
The major difference between the presented ADR system and other CT based state-of-the-art industrial defect recognition techniques, is the use of similarity analysis. Most of the PM manufacturing techniques such as Press-Sinter, Laser Sintering, or Metal Injection Moulding are considered as net or near-net shape production as the finished product does not require further processing. The discussed ADR system is designed to compare the 3D CT images of PM parts with previously created and analysed reference images, so called Golden images. This comparison is only possible because these types of high precision manufacturing techniques are capable of producing such high precision output where the shape and dimensional difference between each part is negligible. Other industrial applications are based on signal analysis like wavelet or principal curvature analysis [18,19]. It is mainly because the difference between each product is greater than the comparison of parts to a reference is not practical.
This paper presents the outline design of such an automated inspection system, including the establishment of the defect image library and the image processing steps required to identify and characterise defects in a PM part. Examples are given for the processing of real CT images of a PM valve ring and a set of gear parts with visible shape deformity differences.

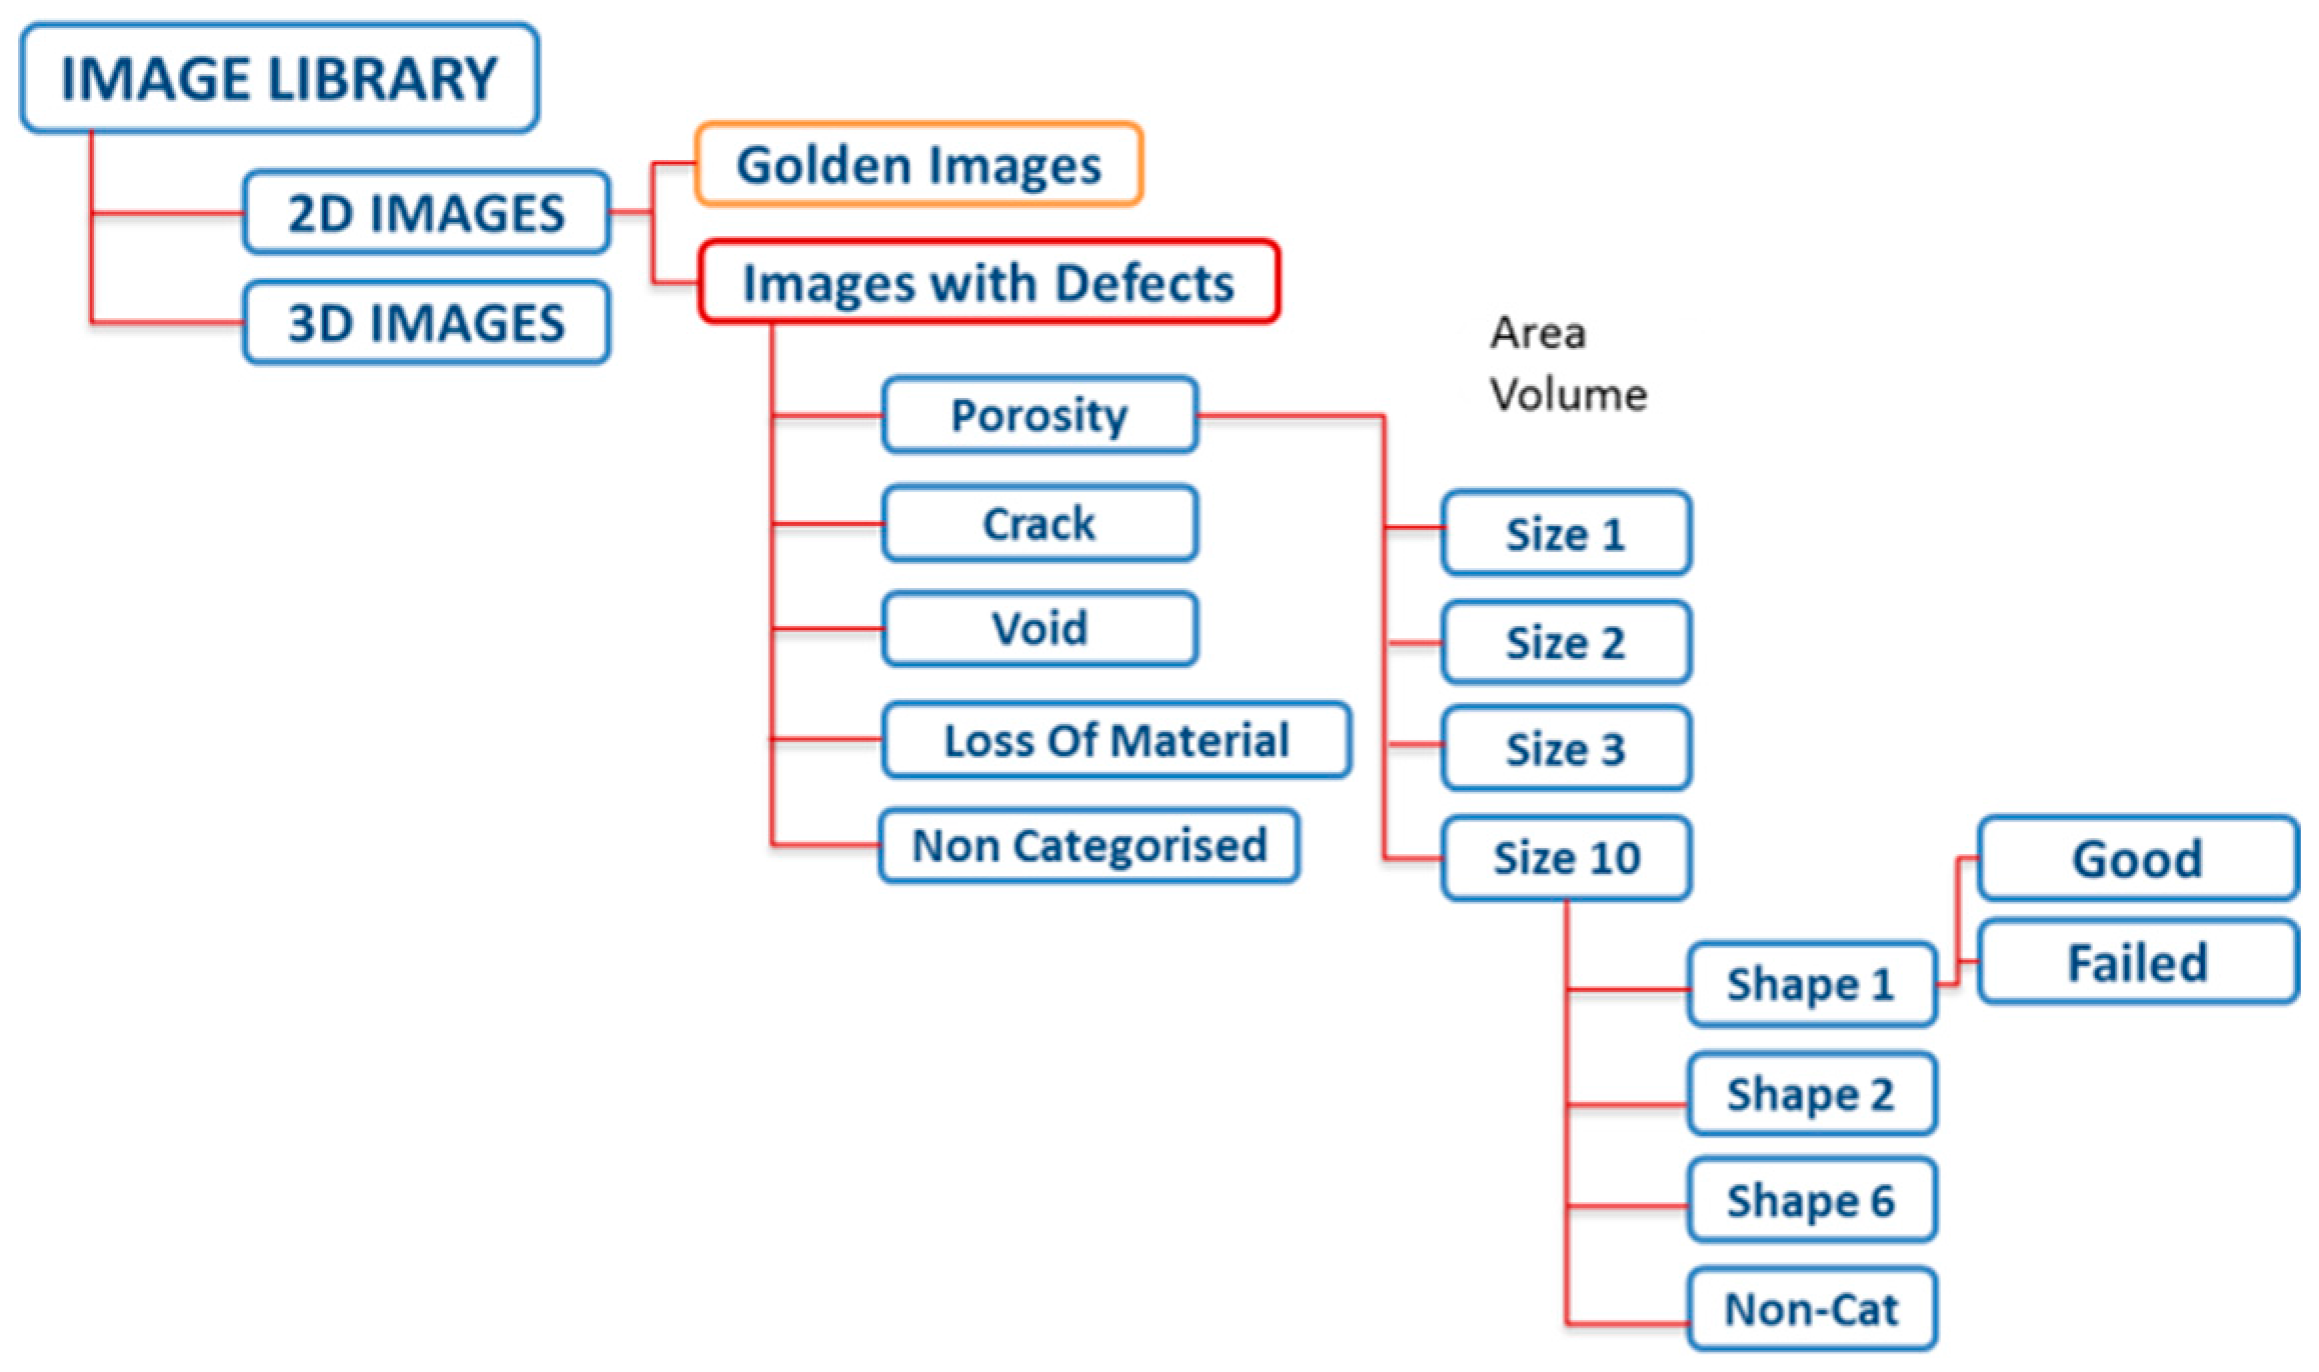
2. Structure of Defect Image Library and CT Simulation with CIVA X-ray Simulation Software

To assist effective defect recognition in Qualinet, a defect image library is created and used as reference for image comparison. For the construction of the image library, X-ray CT images of parts with typical defects are captured, characterised, and categorised according to defect features, e.g., the size and shape. The tree structure of the defect image library is shown in Figure 3. For simplicity and clarity, only the structure of one defect category, the porosity, is illustrated in detail with other categories presenting the same structure. To acquire those reference images at the early stages of the project, simulations have been conducted using an X-ray simulation software called CIVA. Due to its high accuracy in X-ray computation and versatility [20], it can be used as an economic and powerful tool for the establishment of the defect image library.

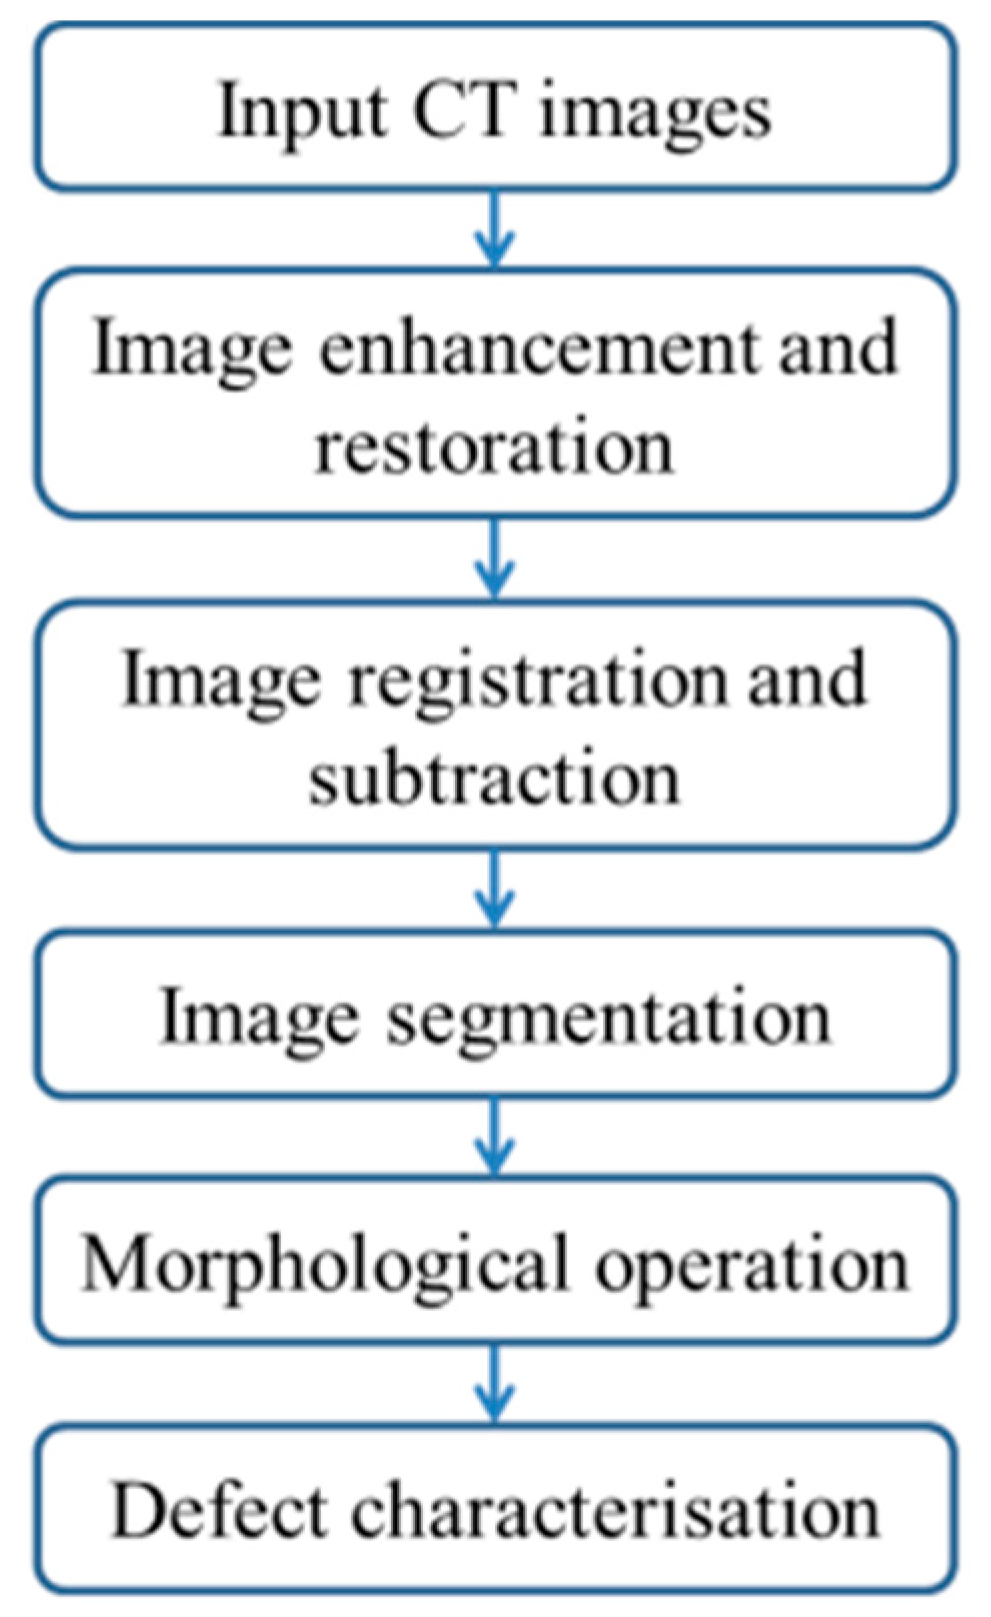
3. Image Processing Procedure

For part characterisation based on CT, the required image processing steps have previously been investigated in image processing and computer vision [21,22,23]. A flow diagram is shown in Figure 4 for the image processing procedure for automatic inspection. There are four key stages: image restoration and enhancement; image registration and subtraction; image segmentation; and morphological operation. Each stage is described in detail below.

3.1. Image Restoration and Enhancement

Image restoration mainly deals with the de-noising issues while image enhancement is used for adjusting the image contrast. For de-noising, several image filters can be applied, e.g., Average filter, Midian filter, and Gaussian filter, dedicated to a presumed noise scenario. In this paper, a Wiener filter is used because it can adapt to the noise scenario in an image and usually outperforms the other filters mentioned in different applications. Image enhancement can be accomplished with histogram equalisation or direct contrast mapping through a linear or nonlinear function, which can stretch the image contrast between the background and foreground pixels and highlight specific detailed. At the moment, image enhancement operation is not applied after image filtering since no significant improvement can be achieved but it may be used in the future.

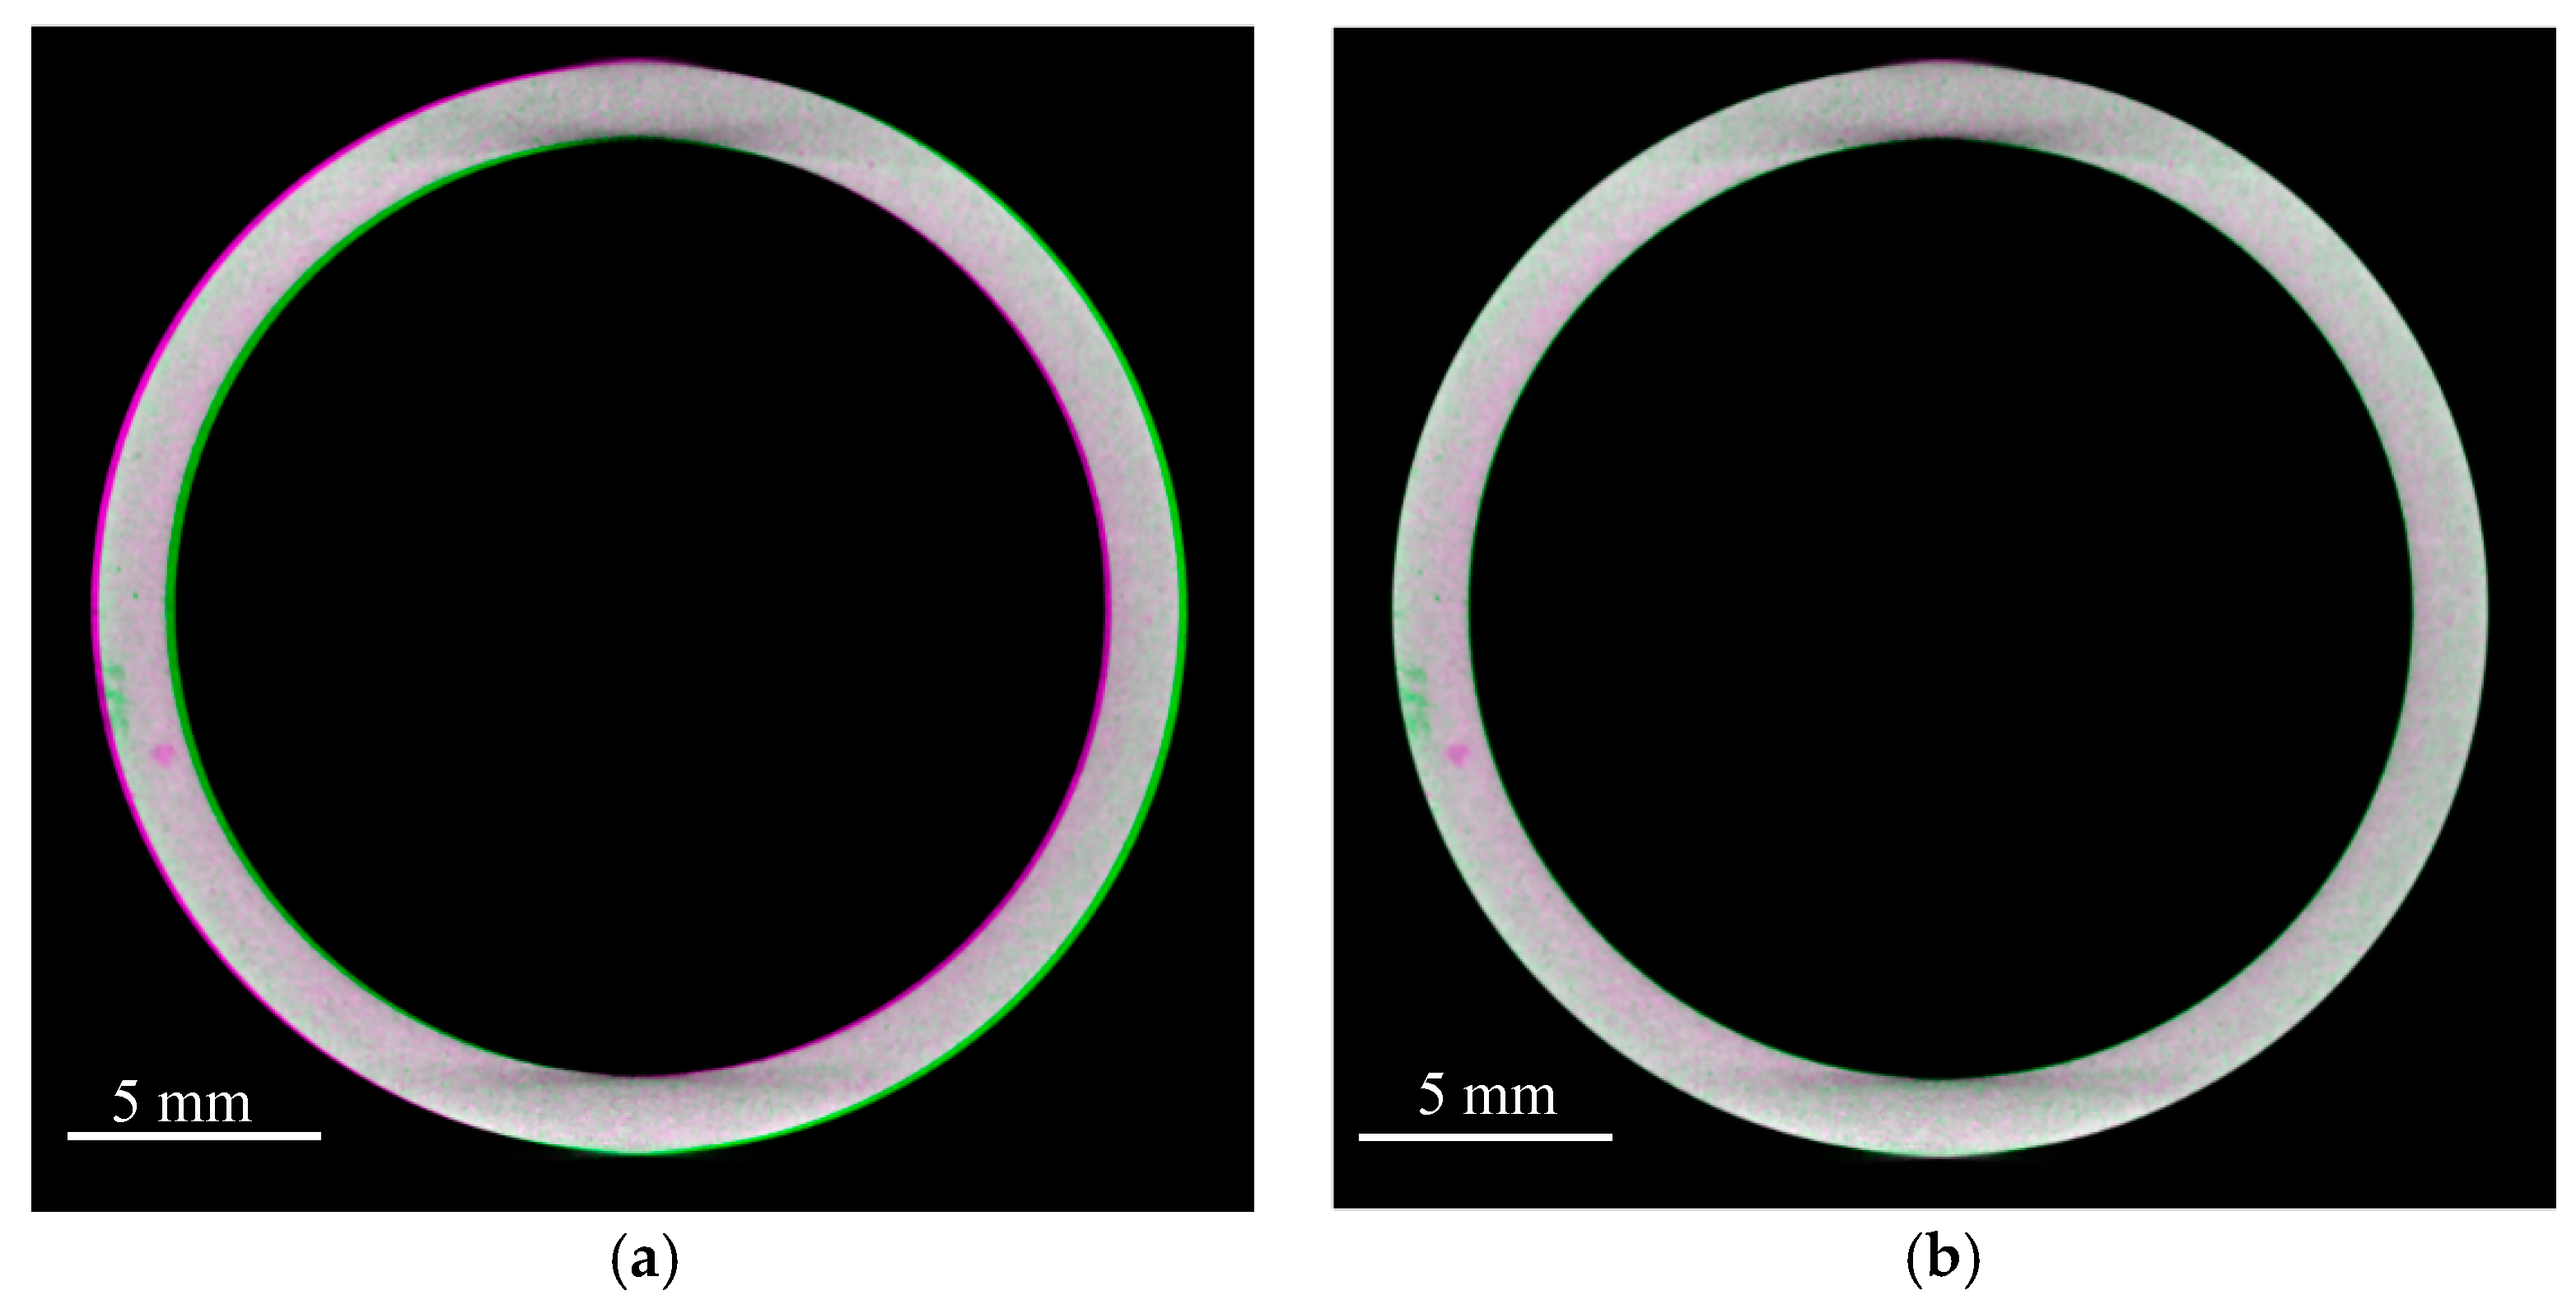
3.2. Image Registration and Subtraction

In a CT image of PM parts, there may be a very small difference in grey levels between defects and the part, even after image enhancement. Some parts are hollow; this means that a different background (surroundings of the part) with a different grey level would appear in the image that could shade out the shape of the part itself and defects. This makes it very difficult to segment the defects from the part and its background. Potentially, some complex part geometries could also make the situation worse. Image subtraction can potentially resolve these issues. The acquired CT image with possible defects, referred to as the target image below, is subtracted from a reference image, e.g., a corresponding defect-free CT image with a similar grey level distribution except for the defected regions, to obtain a difference image with the part image removed and defects standing out. Prior to the subtraction operation, it is indispensable to register the target image with the reference image because the two images may be acquired in different CT scanning conditions, i.e., translation, scale, and rotation may occur and generate significant false artefacts in the processed image. Since CT images are grey scale images with different grey levels for different constituents, the target image can be registered to the reference image automatically based on its grey level distributions [24,25]. First, a transform type is specified and an initial transformation matrix is determined internally, both of which specify the image transformation applied to the target image with bilinear interpolation. Secondly, the transformed target image is compared with the reference image by computing a metric value (i.e., the measures of similarity). Finally, a stop condition (normally a certain metric value) is checked by the optimiser. When the stop condition has been met (or a specified maximum number of iterations has been reached) the process will stop; otherwise it will continue after optimising the transformation matrix.

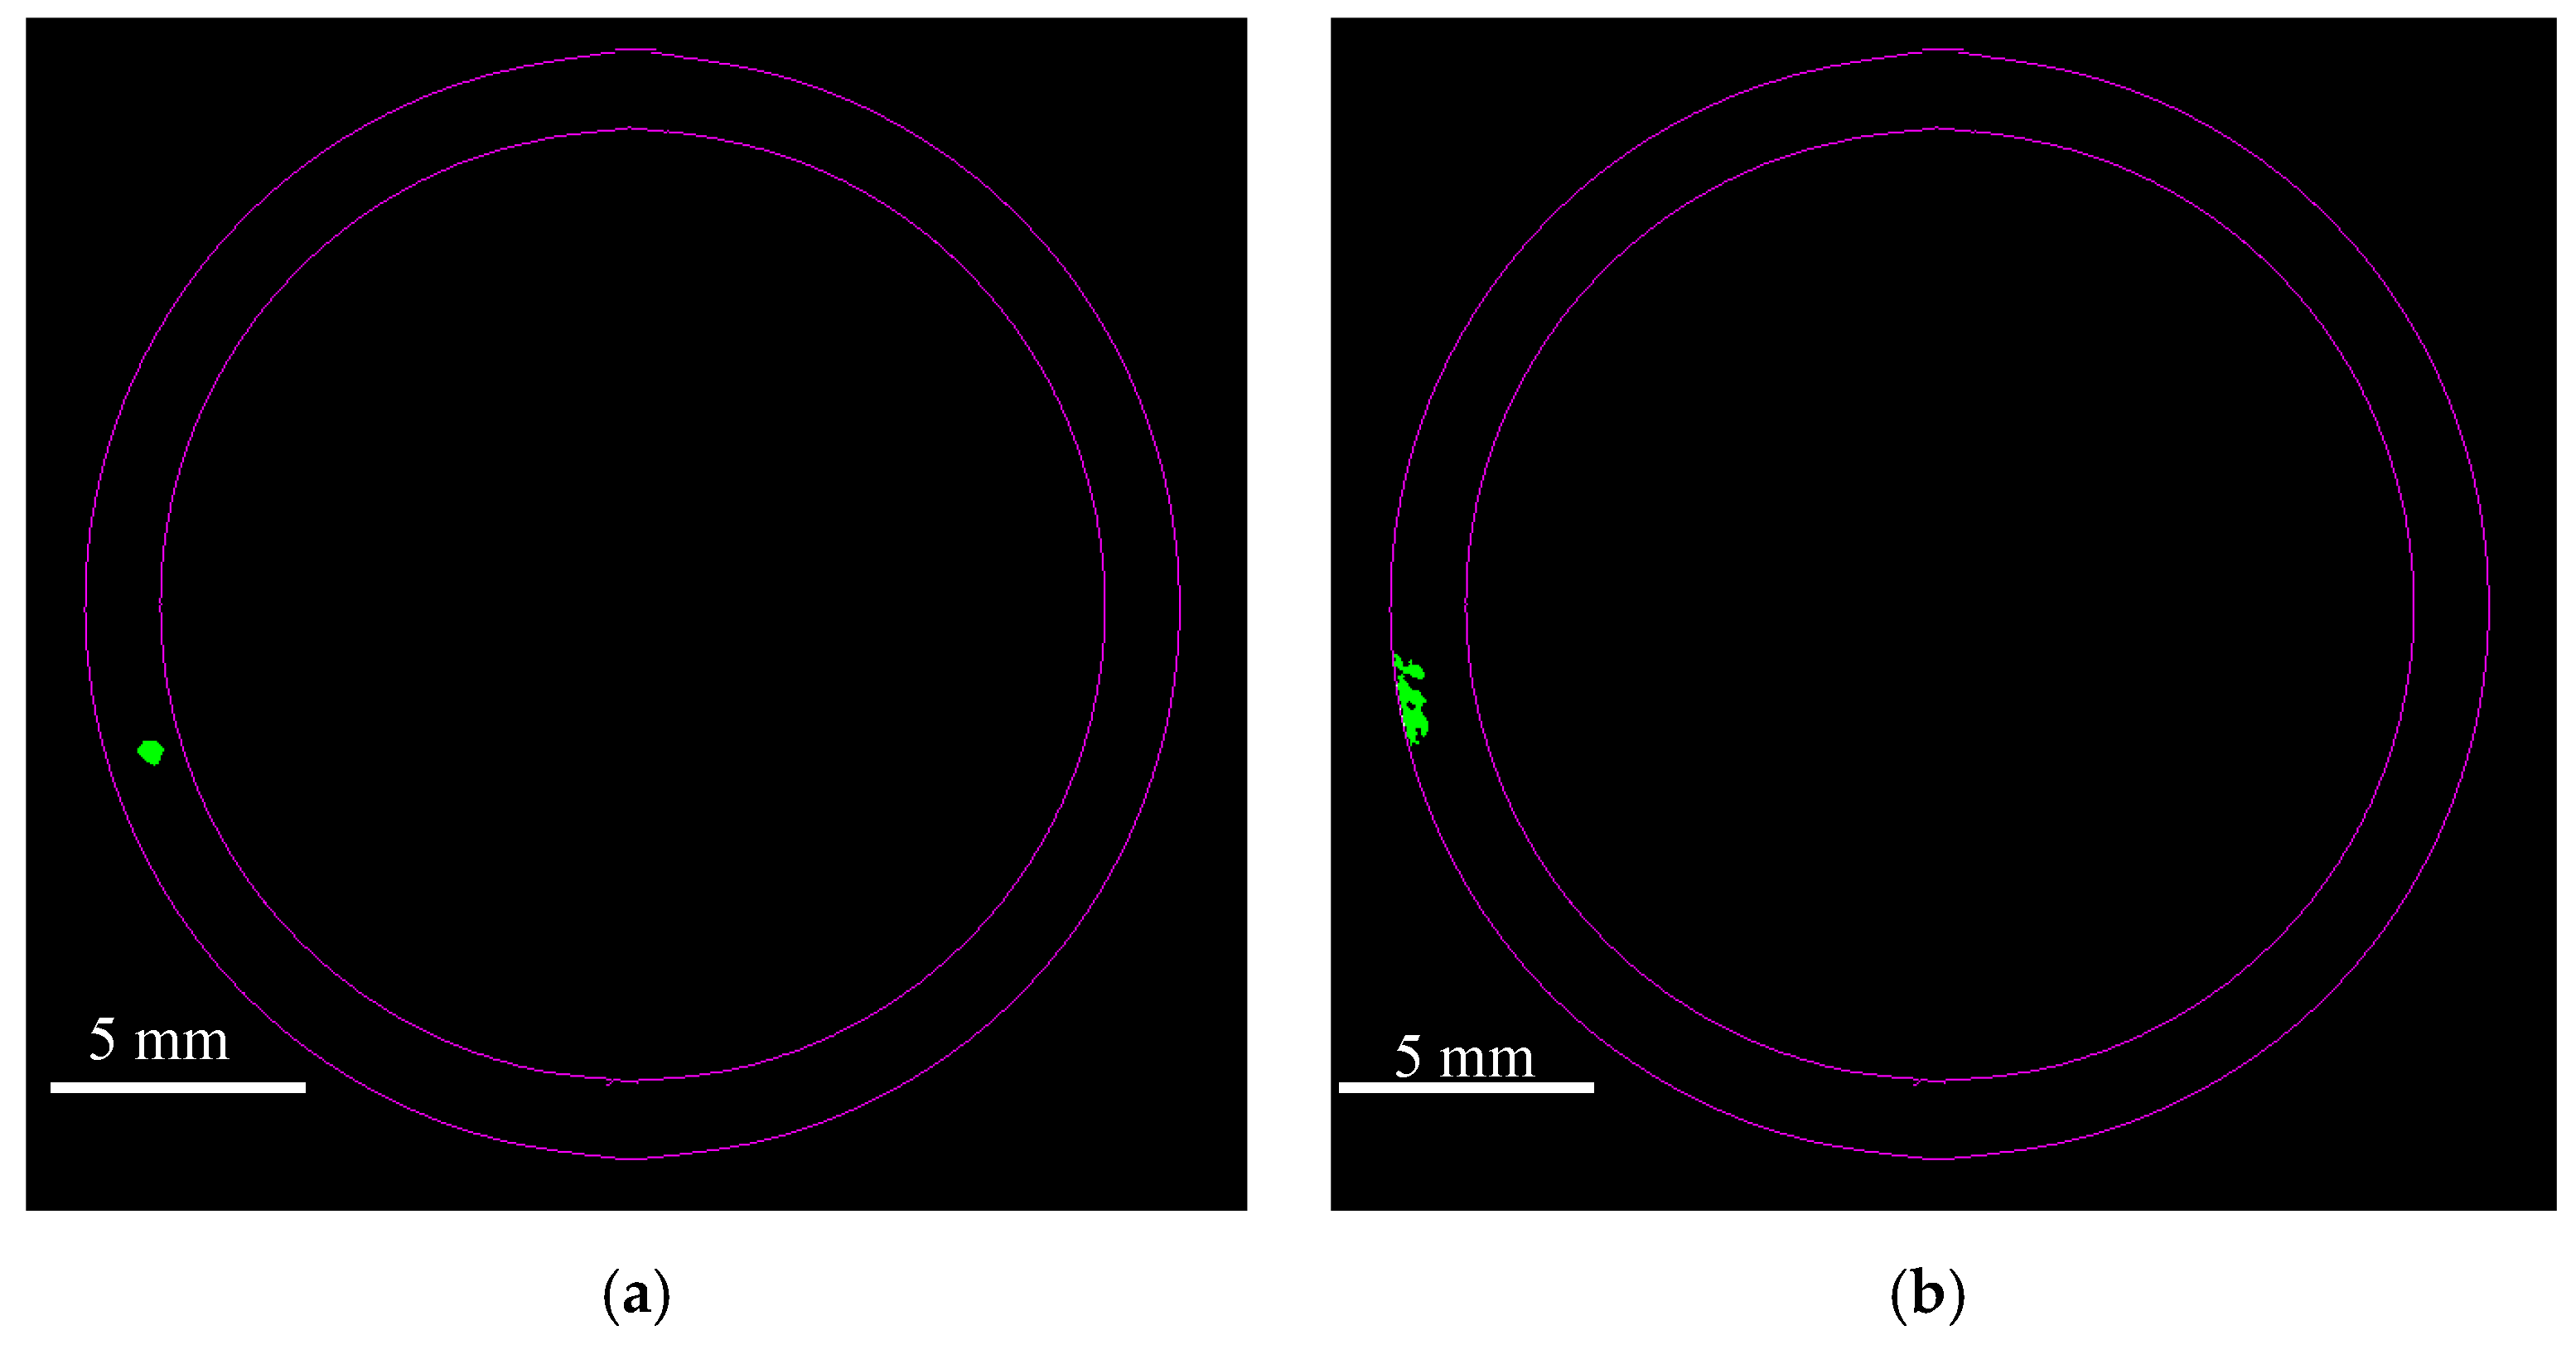
3.3. Image Segmentation

To characterise the defects in a CT image, e.g., sizes, locations and shapes, they need to be segmented from the background. One simple way to do this is by image thresholding. Thresholding can be regarded as partitioning pixels in the images into foreground object and background based on the comparison between the grey level of a pixel and a threshold. Because of their simplicity in theory and efficiency in computation speed, thresholding techniques have been widely employed in image data segmentation and a variety of algorithms have been proposed [26,27]. These algorithms automatically compute a threshold based on a given distribution or histogram of grey levels. However, CT scan images have very specific grey level histograms, i.e., they can show a very unbalanced distribution due to many more background pixels than foreground pixels.
Among thresholding methods, the entropic method by Kapur et al. [28] seems well adapted to our application. It gives accurate results in the case of an unbalanced histogram as observed in this study. In the entropic method [28], the two classes in an image (i.e., foreground object and background) are regarded as two different signal sources. An optimal threshold Topt can be resolved through the maximisation of the sum of the two class entropies. It is mathematically expressed as:
Topt = arg max {Hb(T) + Hf(T)}
with
Hb(T) = −∑Ti = 1 pb(i) × log (pb(i)) and Hf(T) = −∑Li = T+1 pf(i) × log (pf(i))
where Hb(T) and Hf(T) are the background and foreground entropies respectively, p ( i ) = f i / N is the probability of grey level i with fi and N being the number of pixels of level i and total number of pixels in the image, respectively, and L is the maximum intensity value in the image, i.e., 255 for an 8-bit grey image.

3.4. Morphological Operation

The binary image after thresholding may contain noise and small residual spots which mask the useful information to be interpreted. To eliminate these artefacts, morphological processing can be applied. Dilation and erosion are two basic morphological operations [29]. Dilatations and erosions are usually utilised in pairs to constitute morphological opening and closing. Opening by a disk-structuring element can smooth the boundary, break narrow parts and eliminate small objects. Closing by a disk-structuring element can smooth the boundary, fill narrow bays and eliminate small holes. In view of our purpose in this paper, i.e., smoothing the binary image after thresholding to remove small residual spots, it is appropriate to use an opening operation.

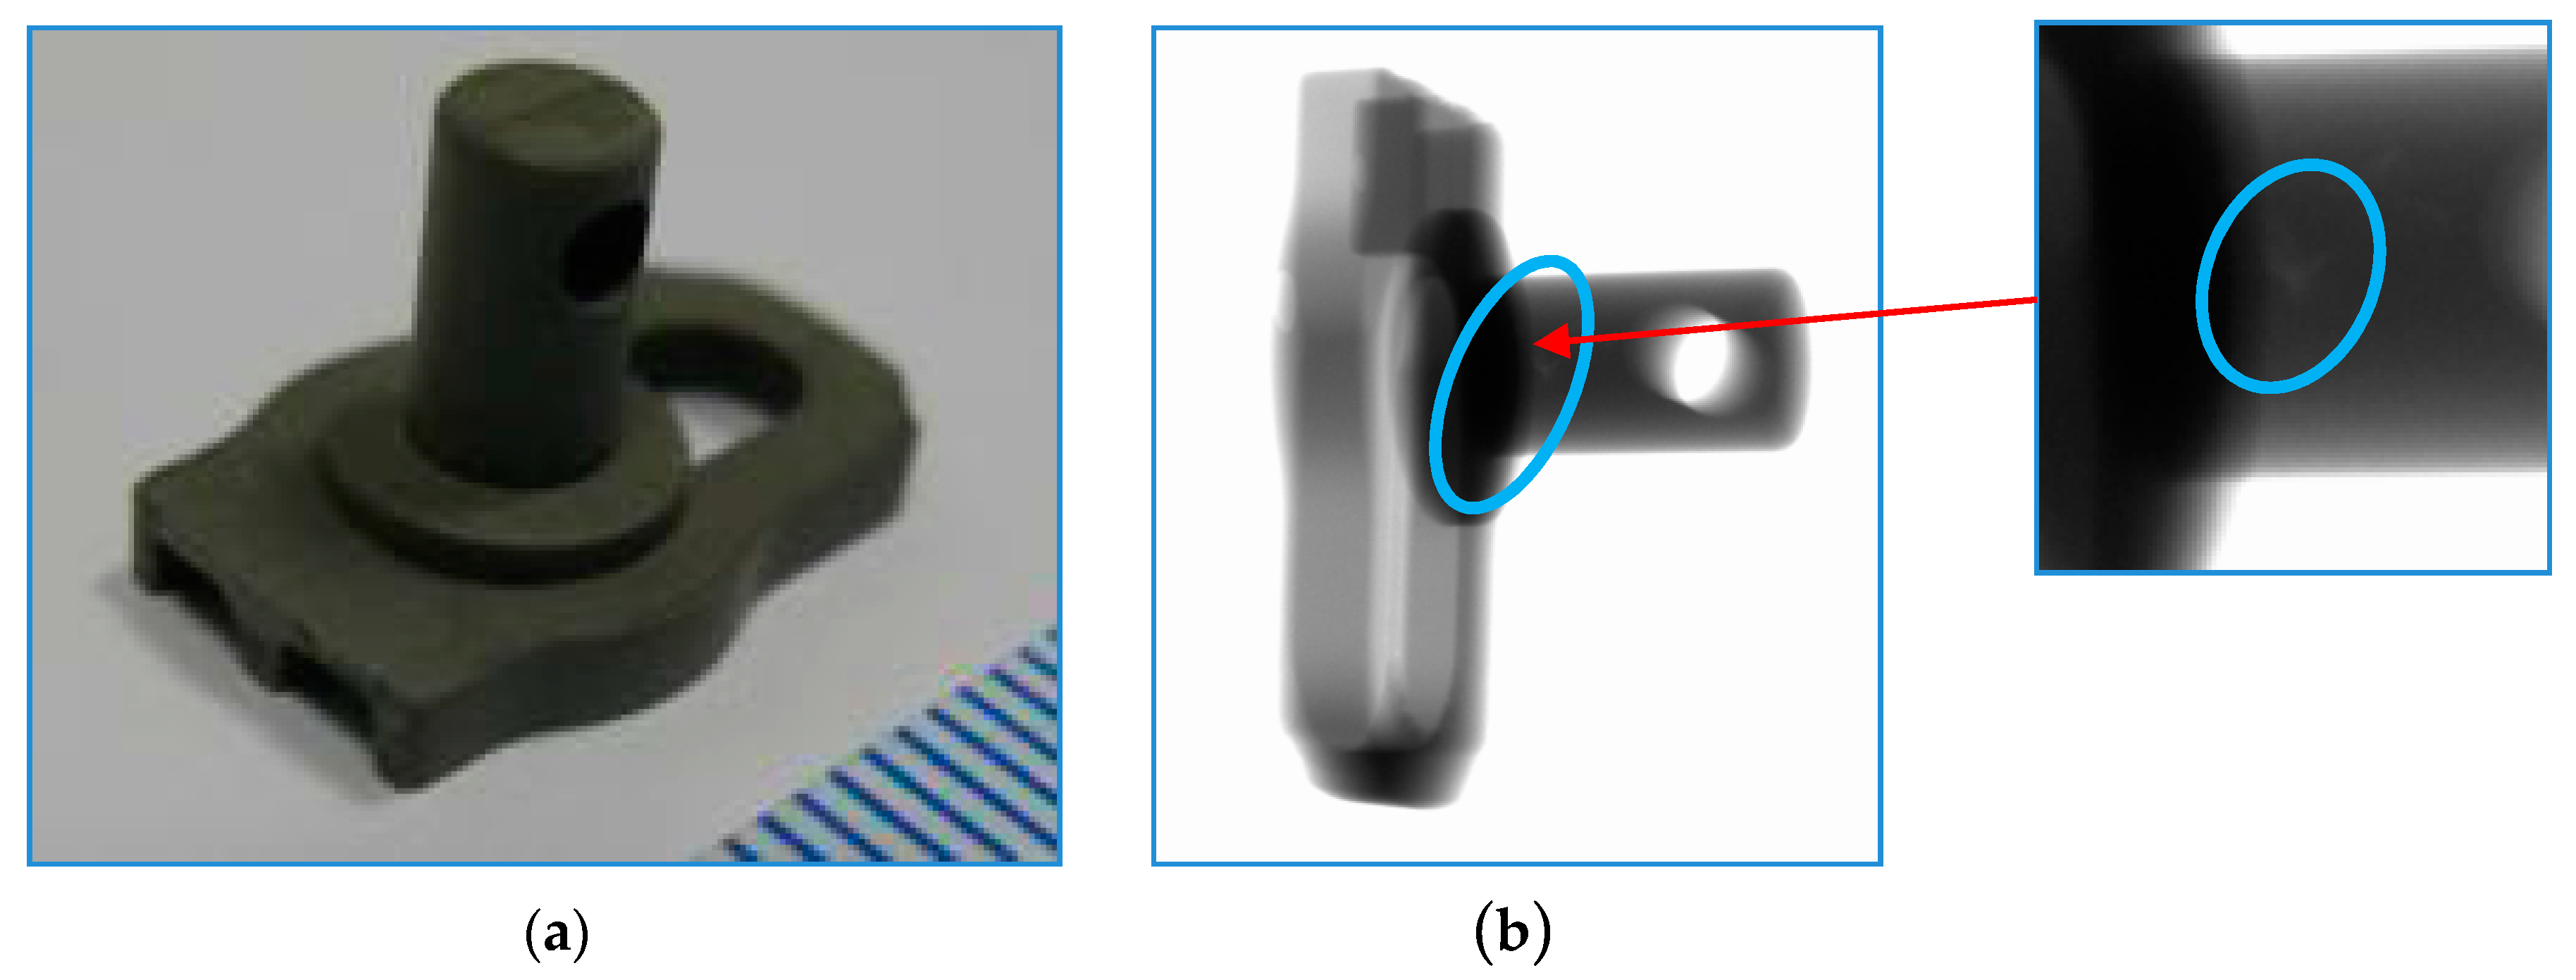
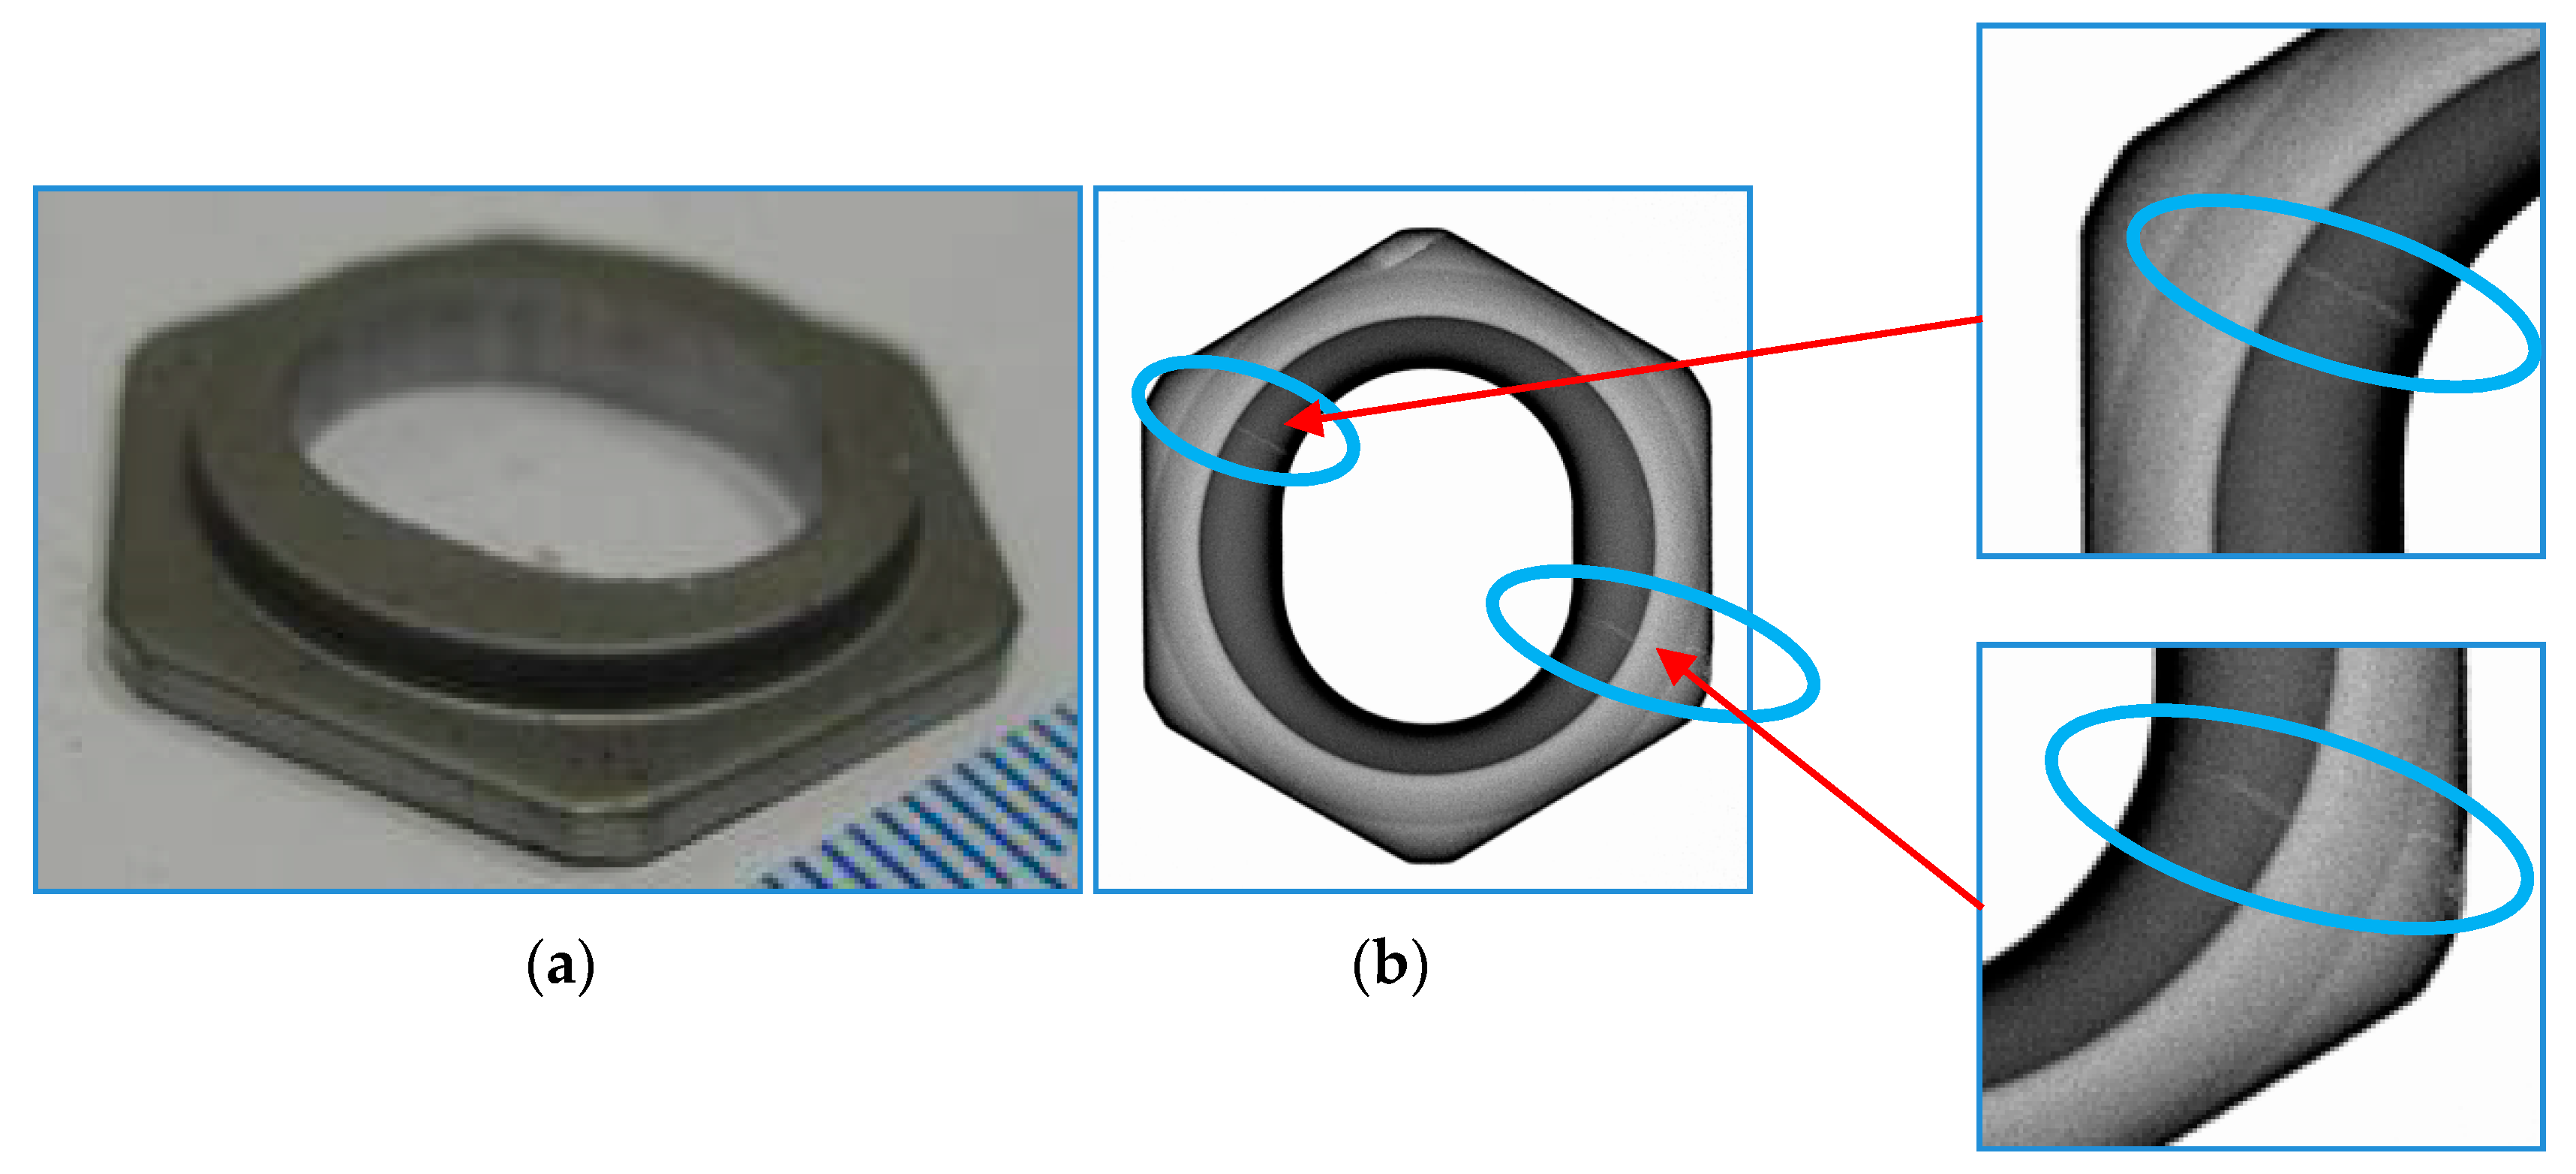
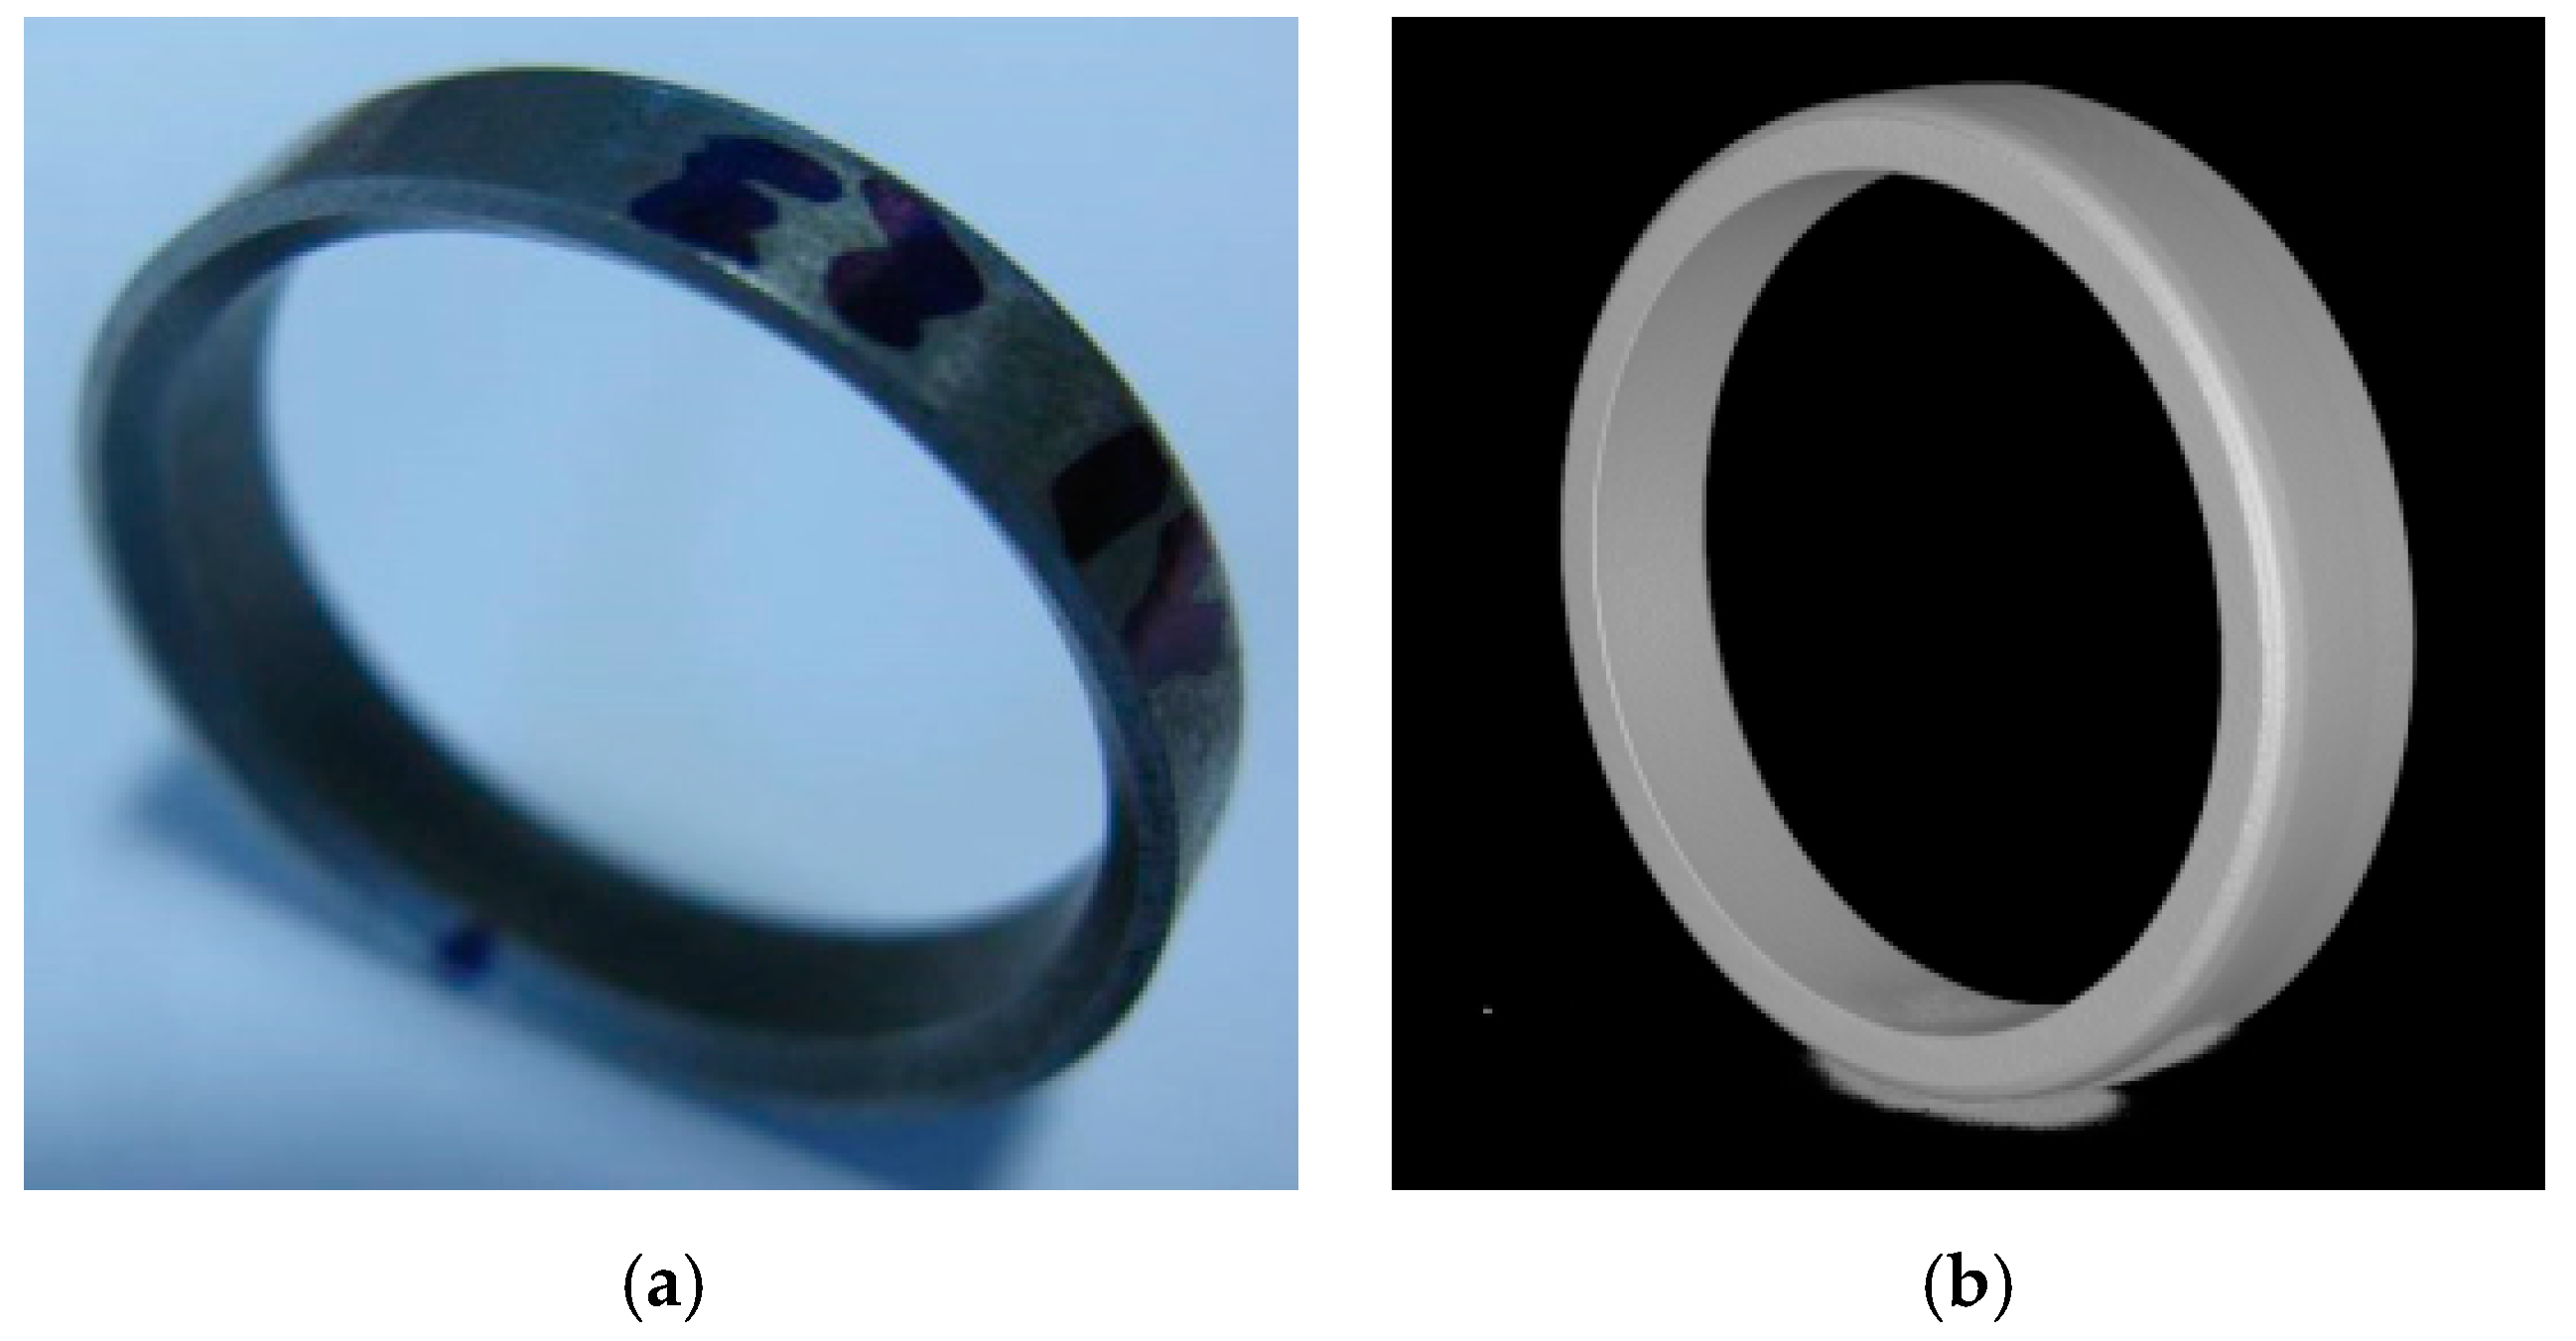
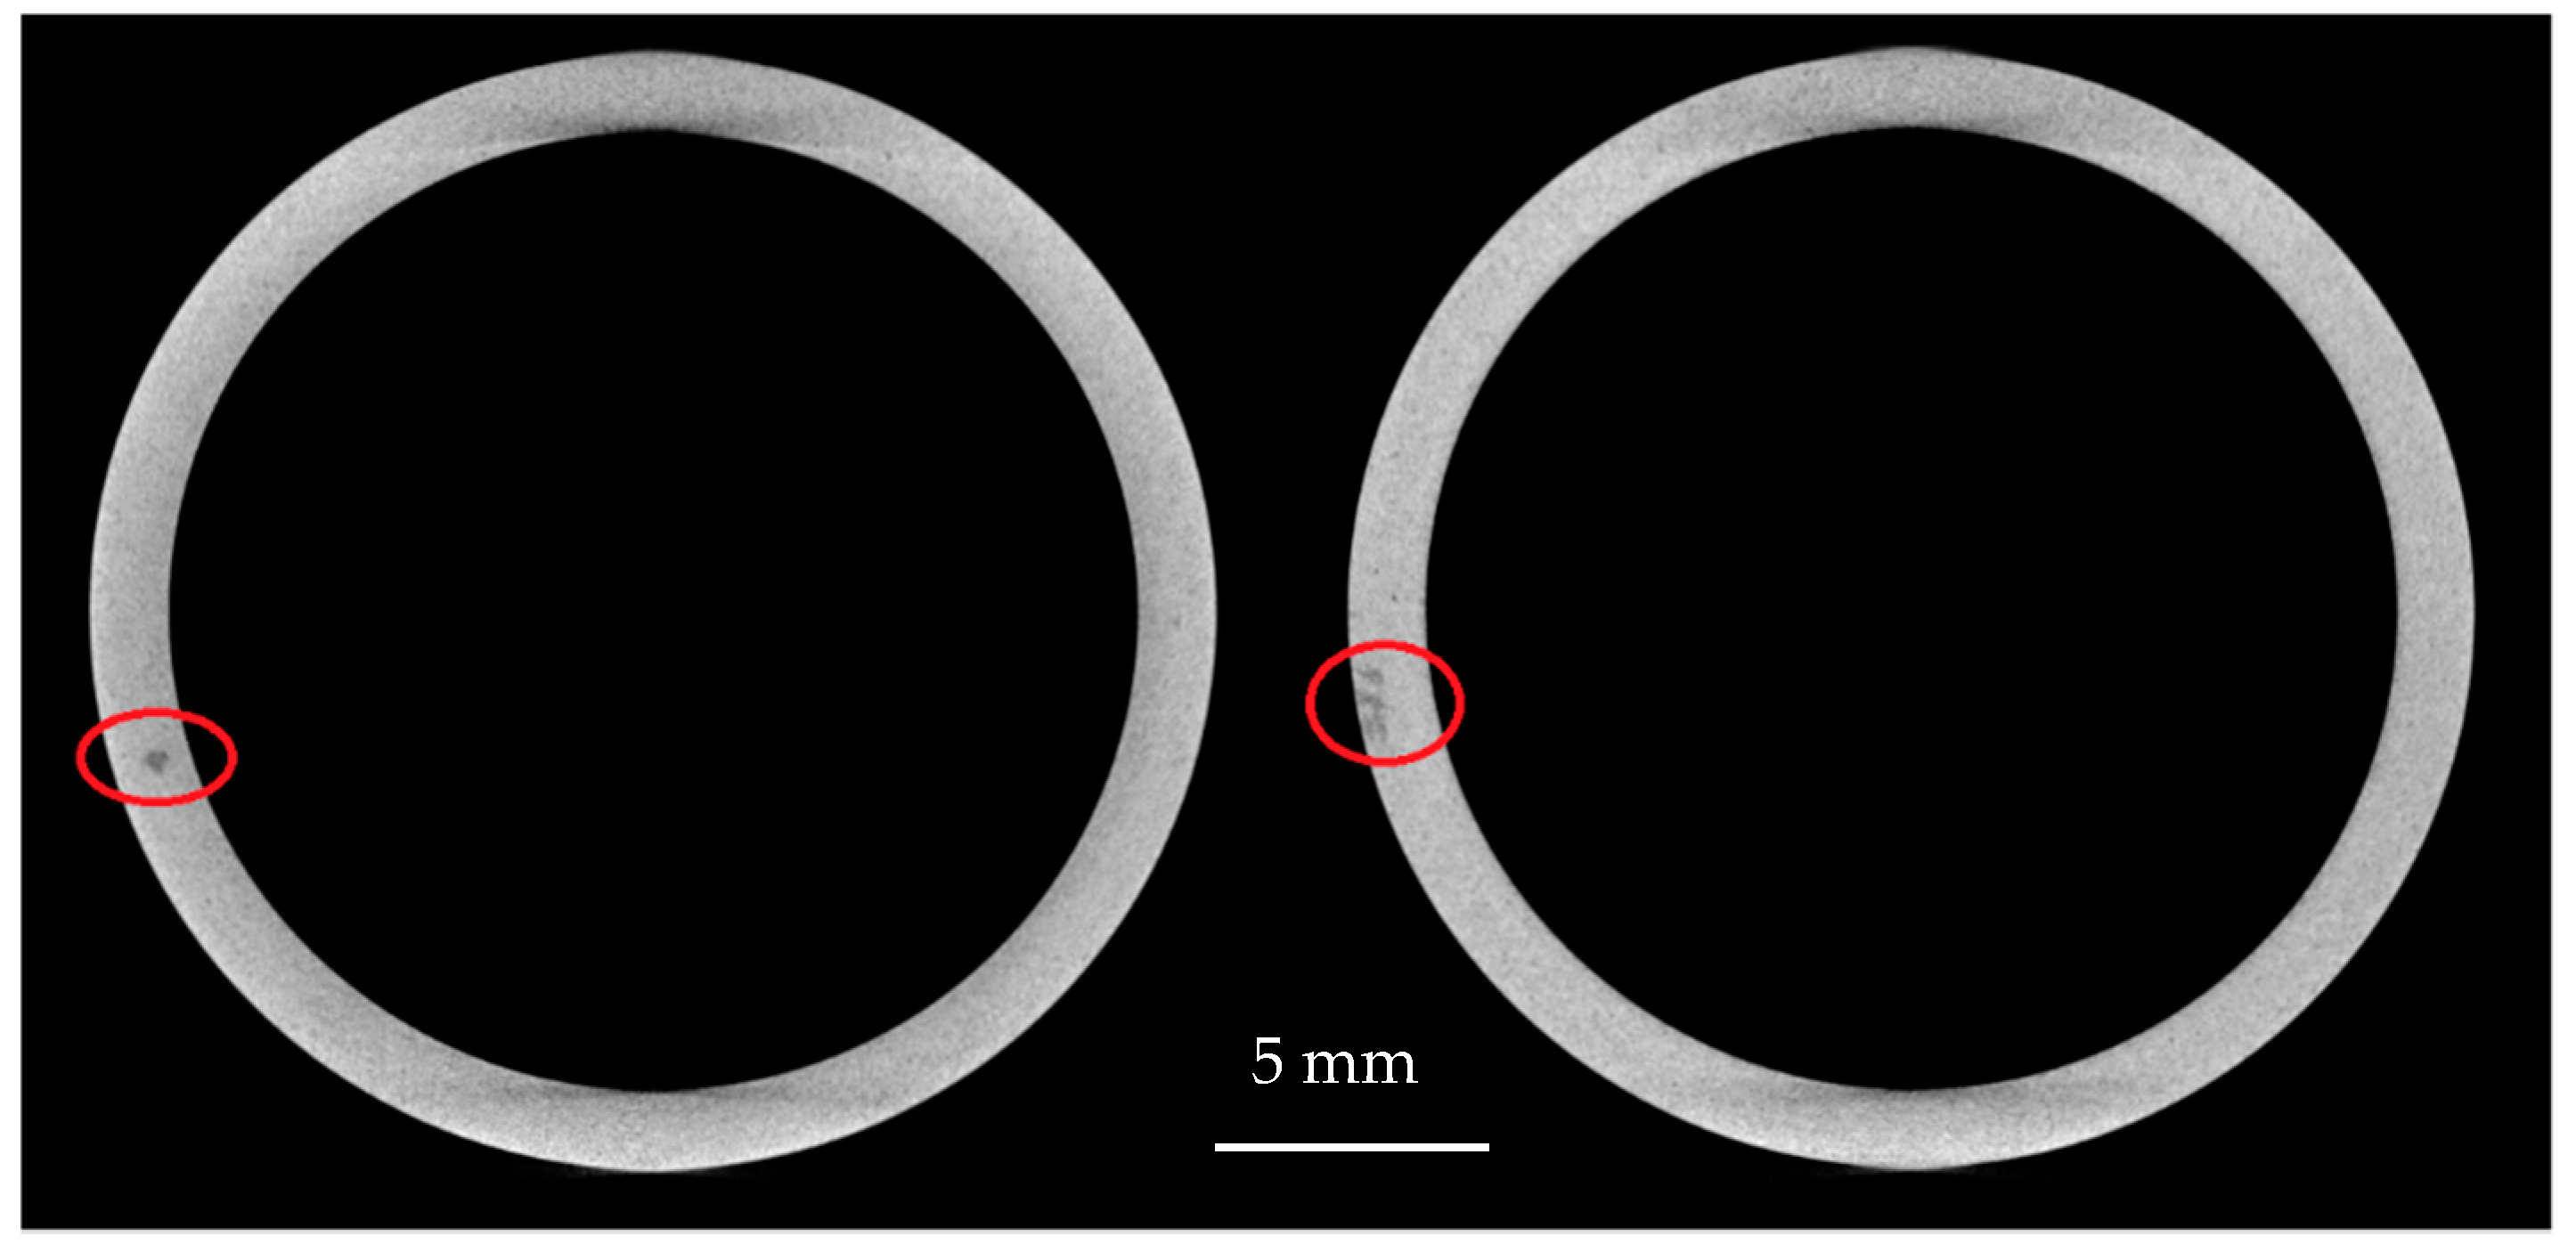
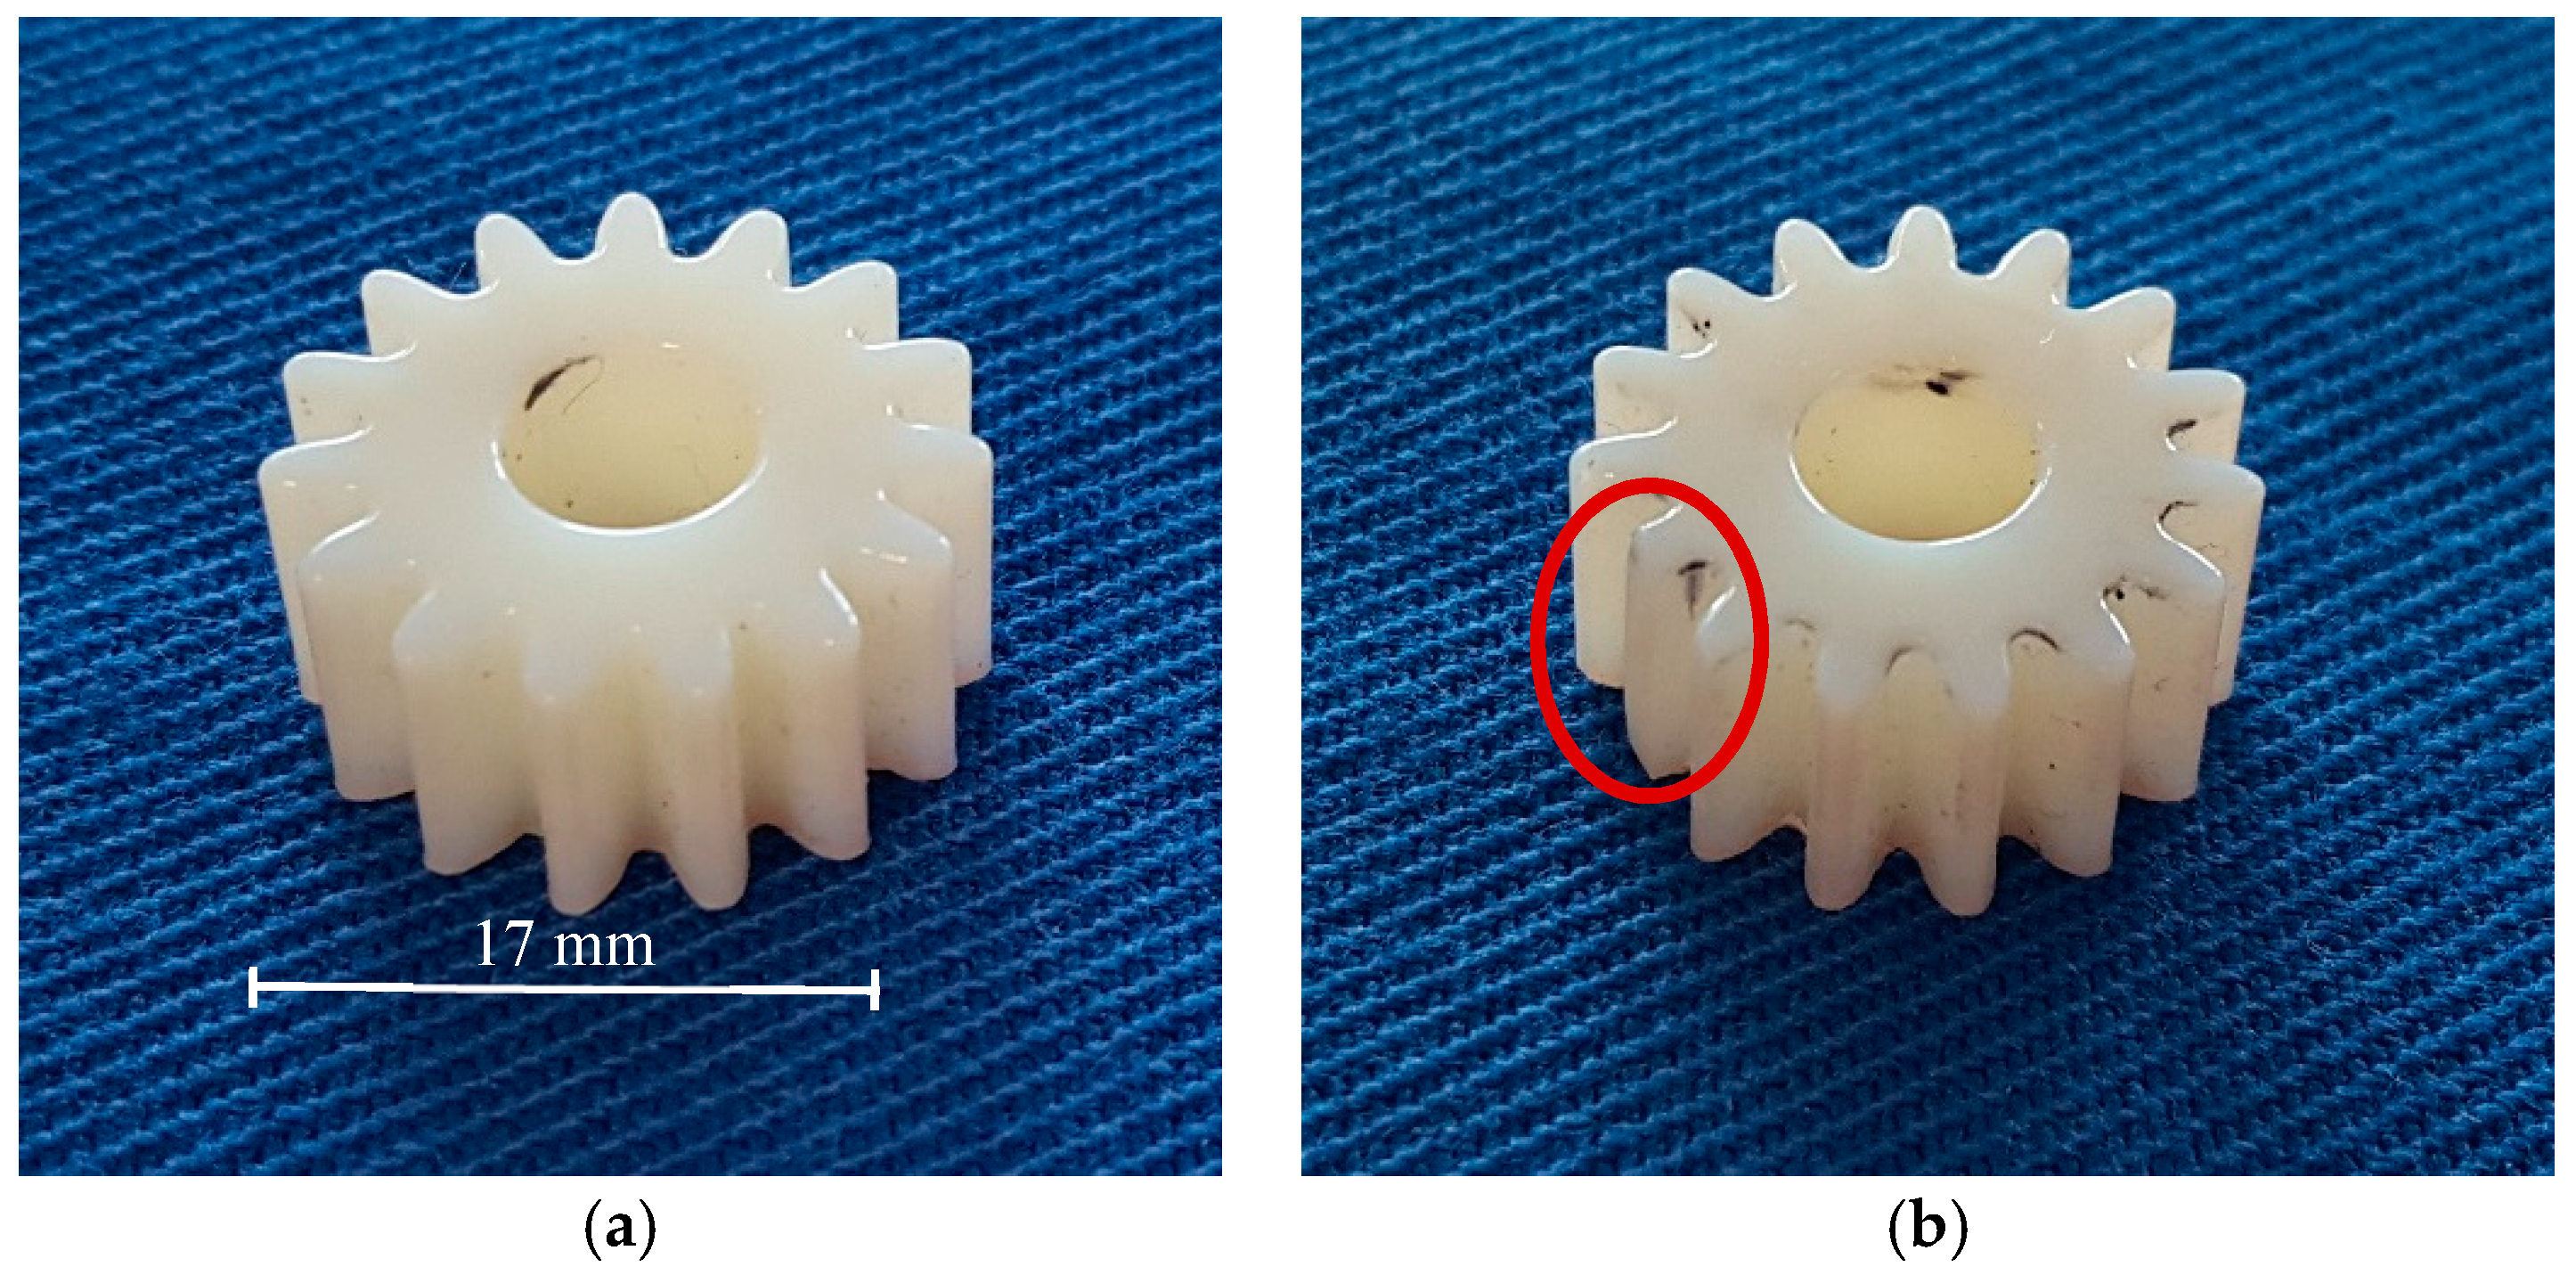
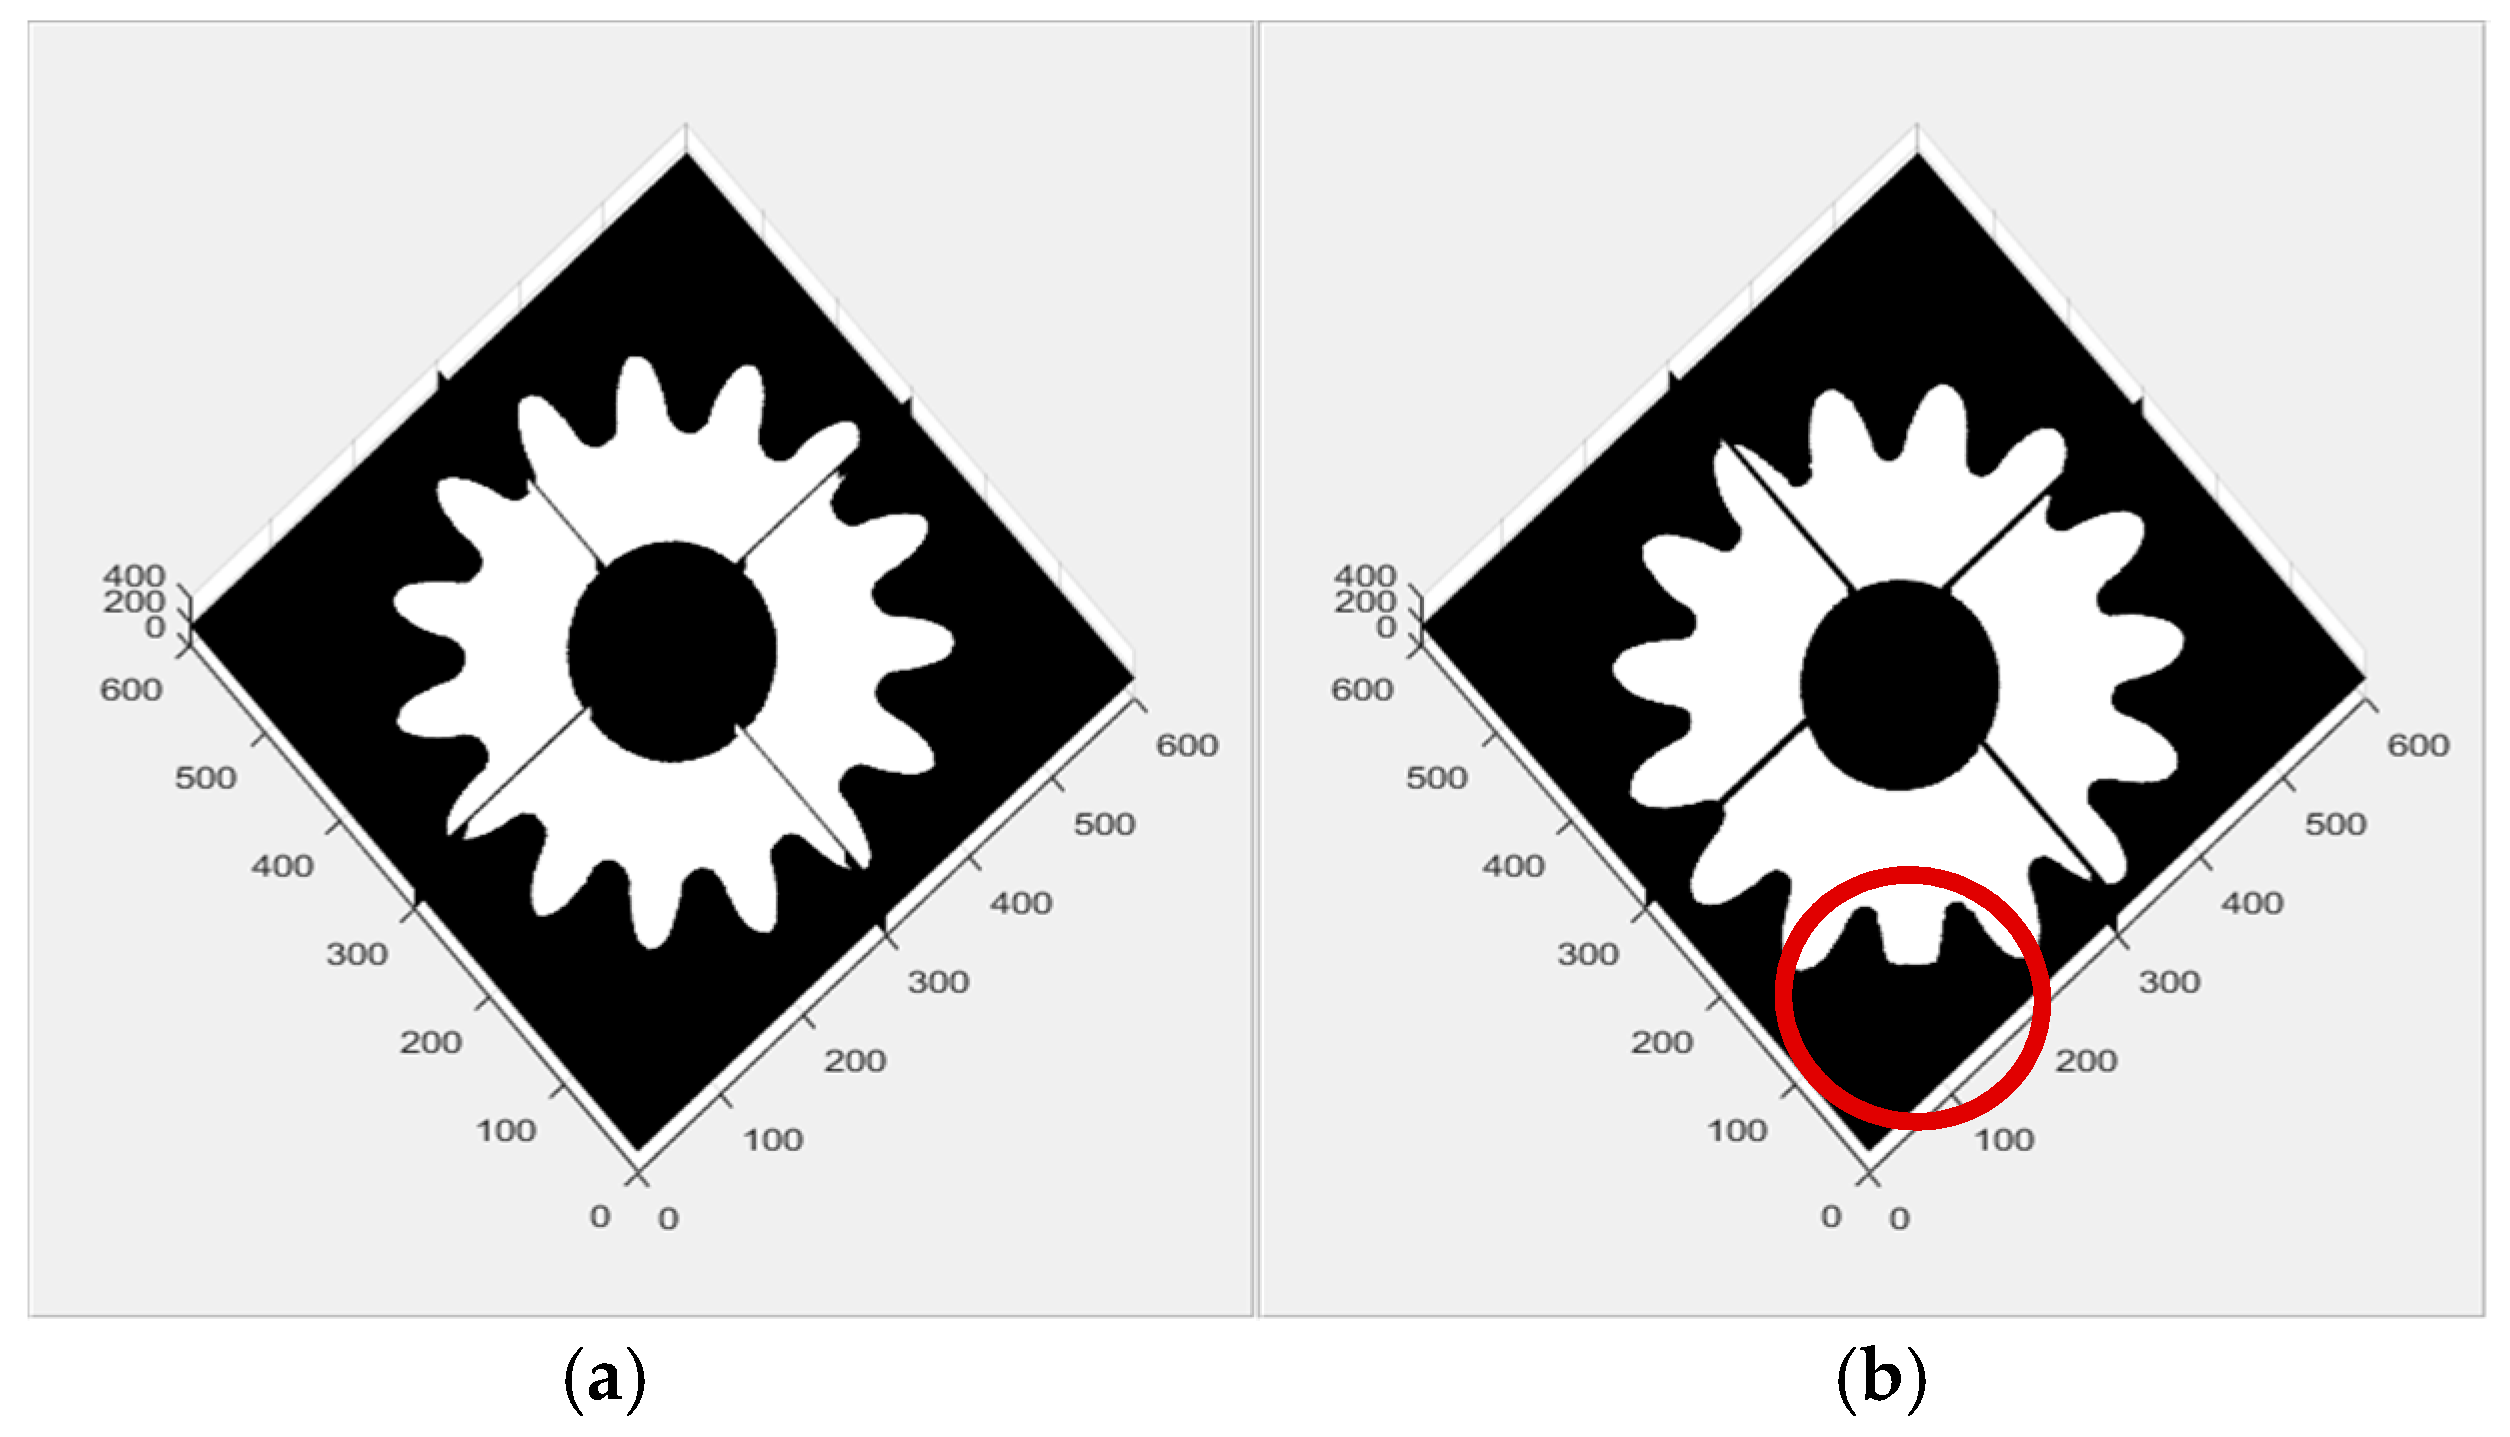
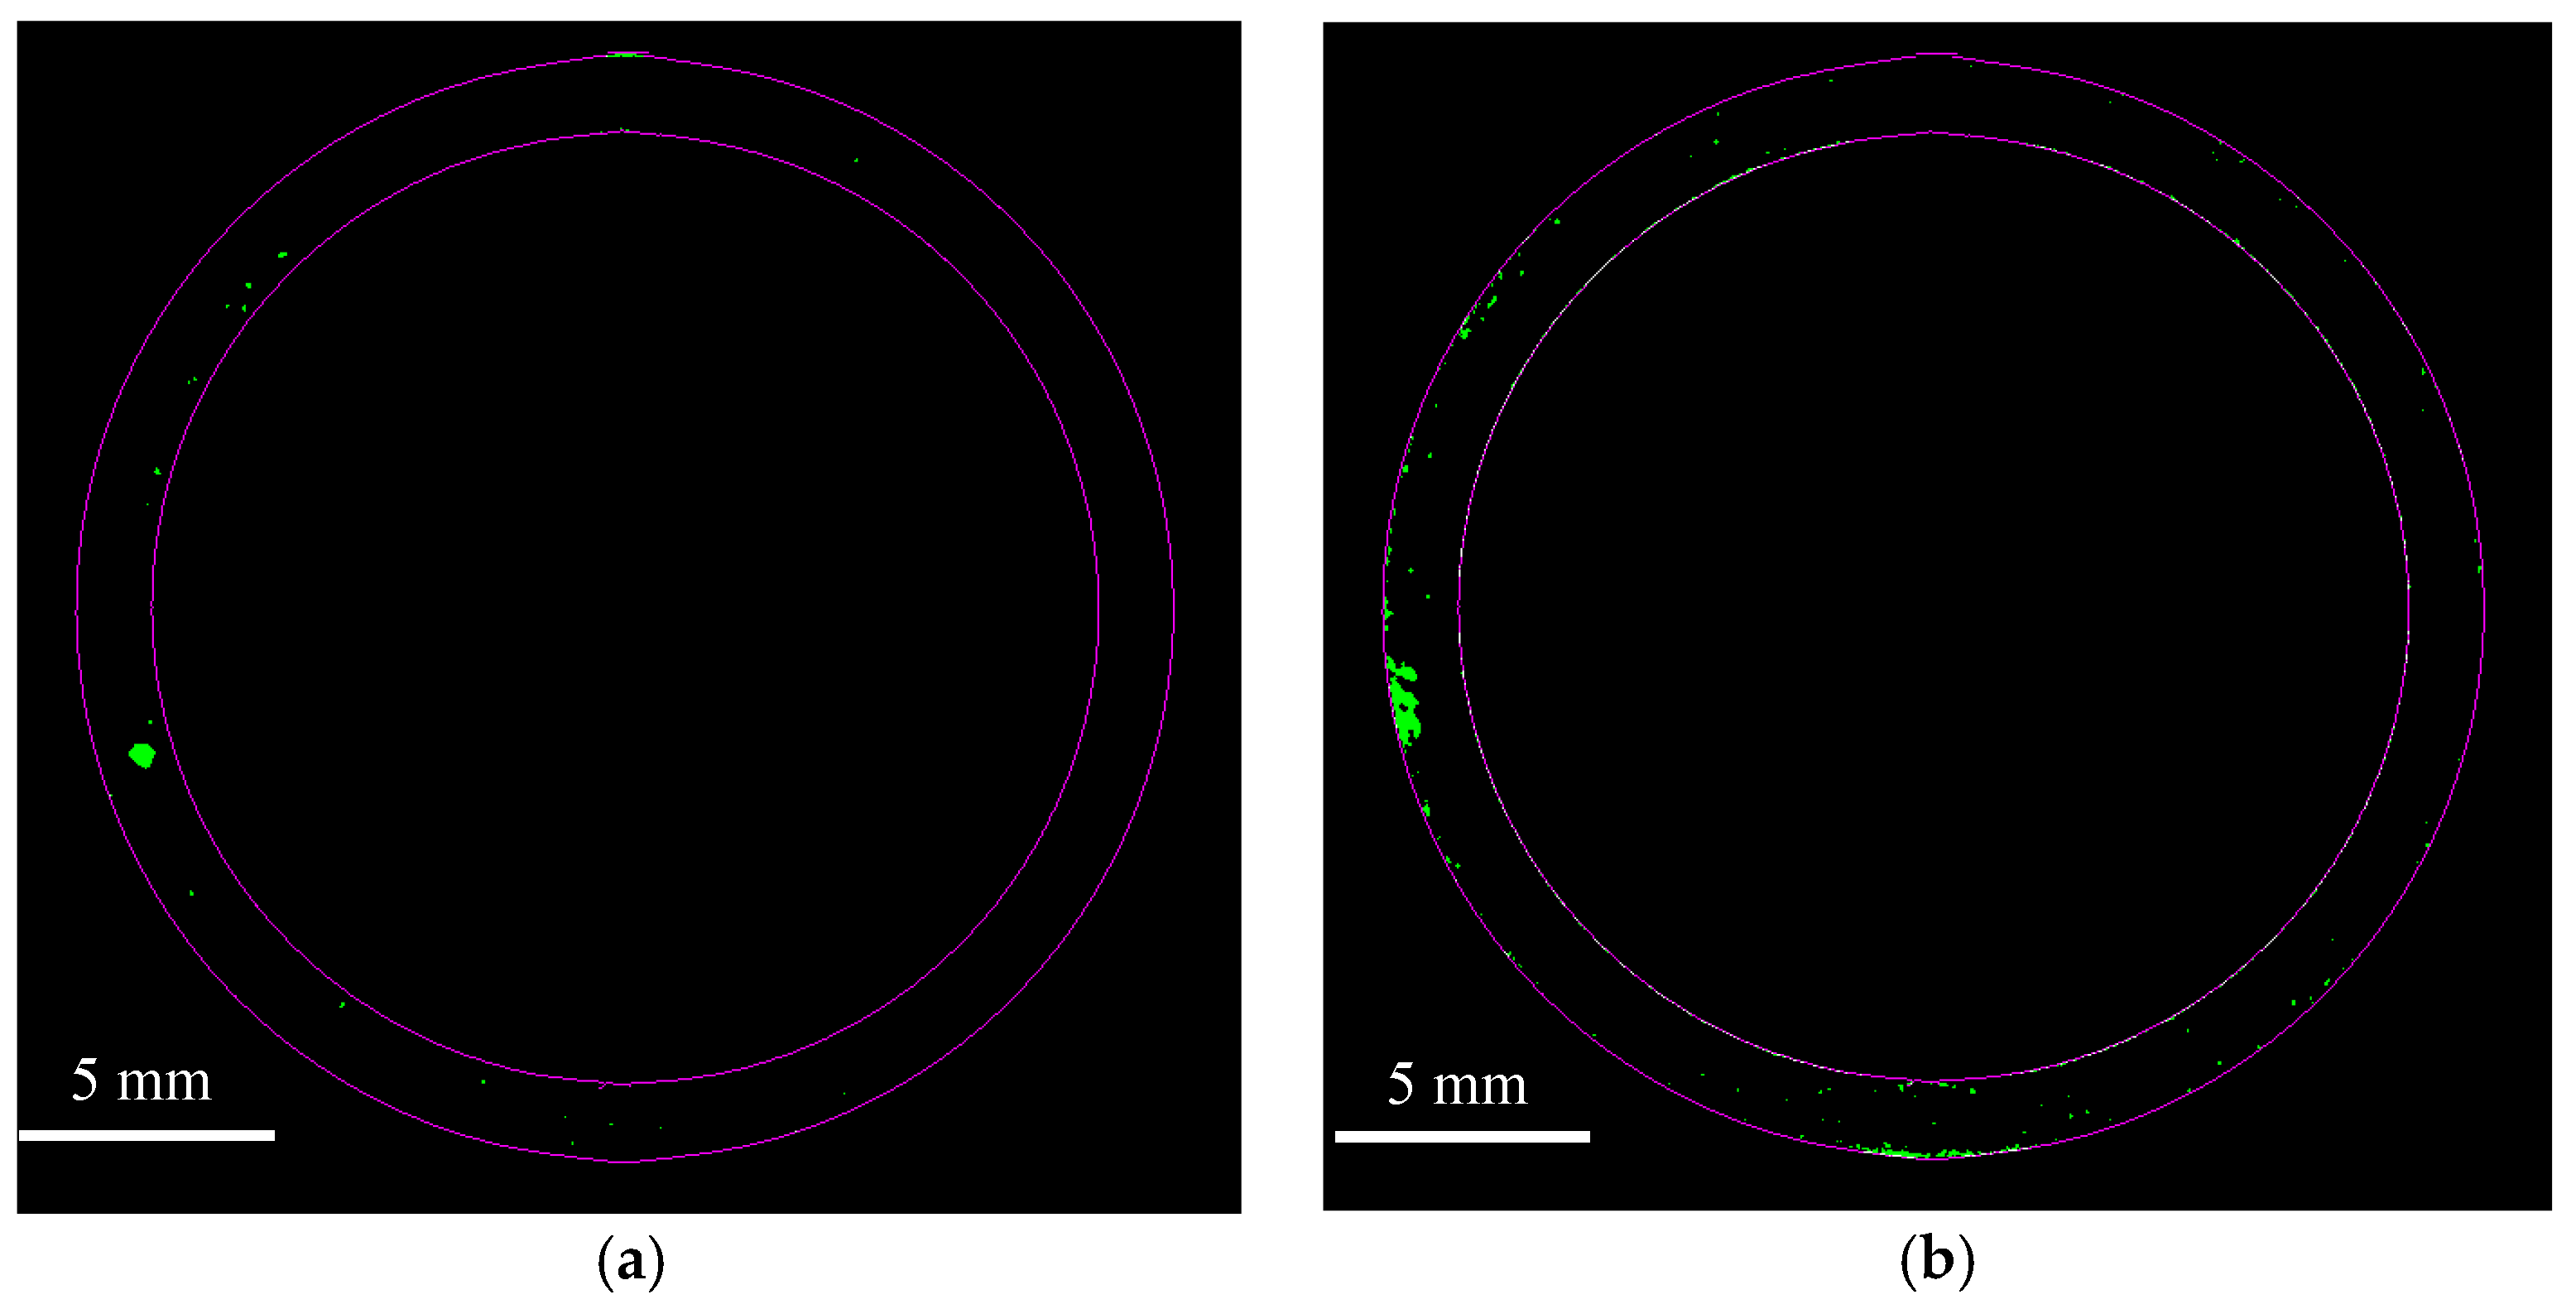
4. Experimental Results

In this section, real CT images are processed with the procedure shown above. The configuration parameters of the CT scanner used can be found in Table 1. A 3D CT image was acquired for a ferrous PM ring sample. A photograph of the ring is shown in Figure 5a with its 3D CT image shown in Figure 5b. To illustrate the effectiveness of the image processing procedure, two 2D slices were taken from the 3D CT image with a distinct defect identified by a red circle in each, as shown in Figure 6. Note that the ‘golden image’ restriction relaxes here since the defects in the two 2D slices are at different locations and they can be the substitutional ‘golden image’ for each other. Details regarding this change in operation are provided below. Both 2D images are de-noised first using a Wiener filter and the resultant images are shown in Figure 7, which shows that the filtered images are smoother than the images in Figure 6, i.e., with reduced noise.
After image filtering, one crucial step is the image registration based on the intensity distribution and the subsequent image subtraction to highlight the defect [30,31]. For comparison, the two overlapped images before and after image registration are shown in Figure 8a,b, respectively. The red and green outlines in Figure 8a represent the contours of the two different parts from Figure 7 when they are placed on top of each other. This difference is caused by the misalignment of the two images and is being removed through the image registration. Note that the red colour represents the part from Figure 7, left, while the green represents the part from Figure 7, right. In Figure 8b, it can be seen that the two images are almost totally overlapped or matched. This means that a good accuracy has been achieved for image registration. On this basis, image subtraction can be carried out. As mentioned previously, one of the two images can be used as the ‘golden’ image for the other to calculate the respective change in grey level brought by the defect in the latter. To remove the influence of the defect in each ‘golden’ image, a truncation is made, i.e., when the value of a grey level after image subtraction is negative, it is set to zero. The two difference images after image subtraction are shown in Figure 9a,b, respectively.
In Figure 9, defects are highlighted in each image, but with multiple artefacts present, i.e., a new background. The entropic thresholding described above is used to segment the defect in each image from the noise background. The binary images after segmentation are shown in Figure 10. Some small residual spots are still visible in each image of Figure 10. Note that the purple circle represents the part edge and green-coloured objects represent defects. To remove these artefacts, the opening morphological operation is implemented with a disk structure of size 80 pixels. The smoothed images are presented in Figure 11 with the defect identified in each image, ready to be characterised to form the basis for later defect recognition.

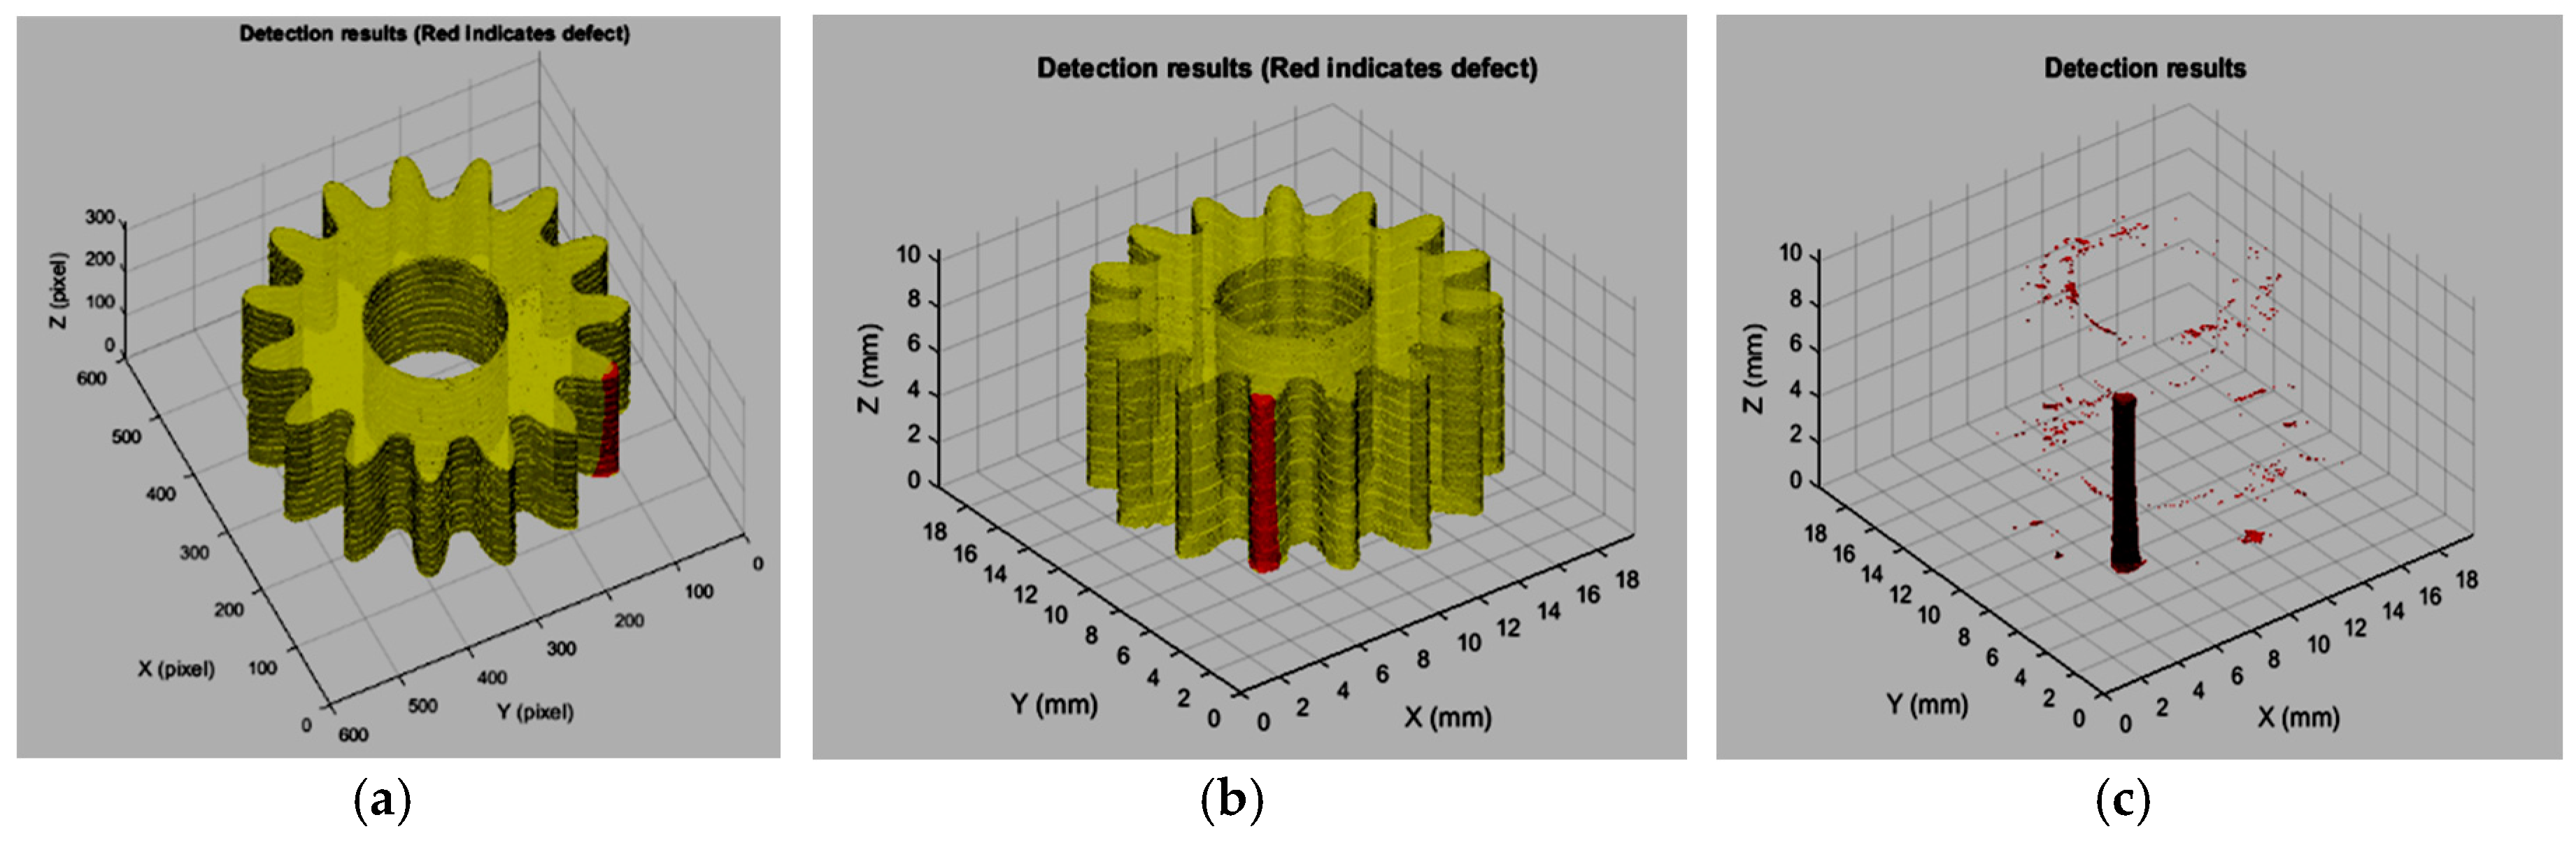
5. Automated Defect Recognition across the Whole 3D Reconstructed CT Image

A major achievement in developing the Automated Defect Recognition algorithm is that it is capable of processing the complete 3D CT reconstructed image all at once. This improvement results in a significant time saving in feature recognition compared to the previously detailed method of one-by-one processing of arbitrary 2D slices of a reconstructed 3D CT image.
Figure 12 shows the image of the purpose-made 3D printed gear part with and without a known external defect (crack on gear tooth) that was introduced for demonstration purposes.
Following X-ray CT imaging Figure 13 shows the reconstructed 3D images of the parts without (a) and with (b) defect. The defect area is circled in red. Figure 14 represents a horizontal slice of the reconstructed CT image; the part with the defect highlighted is on the right.
Through the image registration stage the CT images are perfectly aligned with each other allowing the extraction of the differences. Before registration the selected 2D slices are matched to each other; Figure 15a indicates the differences between the two slices, caused mainly by the misalignment of the axis. The purple area represents the slice image of the part without the defect, green represents the slice image of the part with the defect, and the area in white is the area that is covered by both images. In Figure 15b following registration the two images are perfectly aligned allowing the defect related difference to be highlighted.
Once the image registration is complete using the 2D slice images, feature recognition can be implemented at the full 3D level. Figure 16a,b are isometric views of the registered 3D objects; the difference/defect area is highlighted in red. In Figure 16c, the difference is extracted from the background allowing further operations such as volume measurement.

6. Conclusions

This paper briefly highlights the advantages and drawbacks of near net-shape production techniques. It also describes the system design for an automated X-ray CT scanning system for net-shape parts, the tree structure of defect image library and the image processing procedure, taken for automatic defect identification. Real CT images of PM and Additive Manufacturing parts with and without defects are processed using the proposed technique. The results show that defects in the images can be automatically segmented from the background, which lays the basis for effective feature extraction and defect recognition.
The major difference between the introduced ADR system and other industrial CT based NDT systems, such as the cited state of the art CT inspection techniques for composite materials and also electronics components, is that whilst those systems rely on signal analysis, the technique proposed in this paper is using similarity analysis.
Efforts are still needed to further investigate techniques for automatic image registration and segmentation to improve their robustness because of the diverse intensity distributions of the CT images encountered in practice. Although making the leap from 2D image slice processing to 3D CT reconstructed image processing as a whole has resulted in significant potential time savings on image processing (and therefore the inspection process), further optimisation is required to make it more attractive and applicable to more Powder Metallurgy and net-shape manufacturing methods such as 3D printing and hot isostatic pressing (HIP).

Acknowledgments

The Qualinet project has received funding from the Innovate UK https://www.gov.uk/government/organisations/innovate-uk under grant agreement no. 28874-208246. The project is collaboration between the following organisations: Computer Information Technology Limited; InnoTecUK; Brunel University; and Laser Cladding Technology Limited. http://www.qualinet-project.com/. The authors would like to thank the funding body and the project partners for their contribution to the successful realisation of such a long awaited quality assurance system and also the information that helped the authors in writing this publication.

Author Contributions

Istvan Szabo has written the introduction as well as organised and ensured the ideal conditions for the efficient R&D work; Jiangtao Sun had a major role in the ADR system development; researched and developed the core 3D CT image processing algorithm. Contributed significantly to this publication by summarizing the outcomes of his work; Guojin Feng had significant contribution at the final stage of the ADR development through CT reconstruction library integration and system automation as well as the development of the Graphical User Interface. He revised and also contributed to the publication in the areas of ADR system development; Jamil Kanfoud closely followed and advised the technical aspects of the system development, revised the paper; Tat-Hean Gan greatly contributed to the final version of the publication while he also followed and advised technically the software development; Cem Selcuk created the research project, actively advised the ADR development in the area of PM and revised the publication.

Conflicts of Interest

The authors declare no conflict of interest.

References

  1. German, R.M. Powder Metallurgy Science; Metal Powder Industries Federation: Princeton, NJ, USA, 1994. [Google Scholar]
  2. Klar, E. (Ed.) Powder Metallurgy: Applications, Advantages and Limitations; American Society for Metals: Metals Park, OH, USA, 1983. [Google Scholar]
  3. Selcuk, C. Advanced Powder Metallurgy, Properties, Processing and Applications; Chang, I., Zhao, Y., Eds.; Woodhead Publishing Ltd.: Cambridge, UK, 2013; p. 380. [Google Scholar]
  4. Zenger, D.; Cai, H. The Common Cracks in Green P/M Compacts Handbook; Powder Metallurgy Research Centre, Worcester Polytechnic Institute: Worcester, MA, USA, 1996. [Google Scholar]
  5. Olakanmi, E.O.; Cochrane, R.F.; Dalgarno, K.W. A review on selective laser sintering/melting (SLS/SLM) of aluminium alloy powders: Processing, microstructure, and properties. Prog. Mater. Sci. 2015, 74, 401–477. [Google Scholar] [CrossRef]
  6. Olakanmi, E.O.; Cochrane, R.F.; Dalgarno, K.W. Densification mechanism and microstructural evolution in selective laser sintering of Al–12Si Powders. J. Mater. Process. Technol. 2011, 211, 113–121. [Google Scholar] [CrossRef]
  7. Kobryn, P.A.; Moore, E.H.; Semiatin, S.L. The effect of laser power and traverse speed on microstructure, porosity, and build height in laser-deposited Ti–6Al–4V. Scr. Mater. 2000, 43, 299–305. [Google Scholar] [CrossRef]
  8. Vander Voort, G.F. ASM Handbook—Metallography and Microstructures Volume 9; ASM International: Almere, The Netherlands, 2004; ISBN 978-0-87170-706-2. [Google Scholar]
  9. DeGarmo, E.P.; Black, J.T.; Kohser, R.A. DeGarmo’s Materials and Processes in Manufacturing; John Wiley & Sons: Hoboken, NJ, USA, 2011; p. 660. [Google Scholar]
  10. Clark, L.A.; Vieyra, M.; Nicholson, P.I.; Szabo, I.; Logeswaran, G.; Kappatos, V.; Selcuk, C. Development of an automated digital radiography system for the non-destructive inspection of green powder metallurgy parts. In Proceedings of the Euro PM2014 Congress, Salzburg, Austria, 21–24 September 2014. [Google Scholar]
  11. Bulkai, A.; Baranyai, Z.; Halmi, G.; Their, F.; Ignatev, M.; Scharff, W.; Szabo, I.; Logeswaran, G.; Kappatos, V.; Selcuk, C.; et al. Enable the powder metallurgy process to expand to new markets with more reliable parts and lower manufacturing costs through the inspection of green parts. In Proceedings of the Euro PM2014, Salzburg, Austria, 21–4 September 2014. [Google Scholar]
  12. Vander Voort, G.F. Metallography: Principles and Practice; Materials Park, ASM International: Almere, The Netherlands; Mc Grow Hill Ltd.: New York, NY, USA, 1999; Chapter 2; p. 60. [Google Scholar]
  13. Ketcham, R.A.; Carlson, W.D. Acquisition, optimization and interpretation of X-ray computed tomographic imagery: Applications to the geosciences. Comput. Geosci. 2001, 27, 381–400. [Google Scholar] [CrossRef]
  14. De Chiffre, L.; Carmignato, S.; Kruth, J.P.; Schmitt, R.; Weckenmann, A. Industrial applications of computed tomography. CIRP Ann. Manuf. Technol. 2014, 63, 655–677. [Google Scholar] [CrossRef]
  15. Sterzing, A.; Neugebauer, R.; Drossel, W.-G. Metal Forming—Challenges from a Green Perspective. In Proceedings of the International Conference on Competitive Manufacturing (COMA 2013), Stellenbosch, South Africa, 30 January–1 February 2013; pp. 19–24. [Google Scholar]
  16. Christoph, R.; Neumann, H.J. X-ray Tomography in Industrial Metrology; Suddeutscher Verlag onpact GmbH: Munich, Germany, 2011; ISBN 978-3-86236-020-8. [Google Scholar]
  17. Szabo, I.; Sun, J.; Kappatos, V.; Selcuk, C.; Gan, T.H. Enclosure design and development for non-destructive inspection tool based on digital radiography of green PM parts. In Proceedings of the 7th International Powder Metallurgy Conference and Exhibition (TPM-7), Ankara Turkey, 24–28 June 2014. [Google Scholar]
  18. Yoon, J.; Lee, J.; Kim, B.; Shin, Y.G. An Automated Detection Method of Solder Joint Defects using 3D Computed Tomography for IC Package Inspection. In Proceedings of the 2011 First ACIS International Symposium on Software and Network Engineering, Seoul, Korea, 19–20 December 2011. [Google Scholar]
  19. Katunin, A.; Dańczak, M.; Kostka, P. Automated identification and classification of internal defects in composite structures using computed tomography and 3D wavelet analysis. Arch. Civ. Mech. Eng. 2015, 15, 436–448. [Google Scholar] [CrossRef]
  20. Fernandez, R.; Legoupil, S.A.; Costin, M.; Leveque, A. CIVA computed tomography modelling. In Proceedings of the 18th World Conference on Non-destructive Testing, Durban, South Africa, 16–20 April 2012. [Google Scholar]
  21. Rosenfeld, A.; Kak, A.C. Digital Picture Processing, Vol. 2; Academic Press: Cambridge, MA, USA, 1982. [Google Scholar]
  22. Kong, T.Y.; Rosenfeld, A. Digital topology: Introduction and survey. Comput. Vis. Graph. Image Process. 1989, 48, 357–393. [Google Scholar] [CrossRef]
  23. Udupa, J.K. Multidimensional digital boundaries. CVGIP Graph. Models Image Process. 1994, 56, 311–323. [Google Scholar] [CrossRef]
  24. Available online: http://uk.mathworks.com/help/images/intensity-based-automatic-image-registration.html (accessed on 7 November 2017).
  25. Khunt, D.P.; Makwana, Y.N. Image registration using intensity based technique. J. Inf. Knowl. Res. Electron. Commun. Eng. 2013, 2, 607–609. [Google Scholar]
  26. Wong, A.K.; Sahoo, P.K.; Soltani, S.A.K.C. Chen A survey of thresholding techniques. Comput. Vis. Graph. Image Process. 1988, 41, 233–260. [Google Scholar]
  27. Sezgin, M.; Sankur, B. Selection of thresholding methods for non-destructive testing applications. In Proceedings of the 2001 International Conference on Image Processing, Thessaloniki, Greece, 7–10 October 2001; pp. 764–767. [Google Scholar]
  28. Kapur, J.N.; Sahoo, P.K.; Wong, A.K.C. A new method for grey-level picture thresholding using the entropy of the histogram. Comput. Vis. Graph. Image Process. 1985, 29, 273–285. [Google Scholar] [CrossRef]
  29. Haralick, R.M.; Sternberg, S.R.; Zhuang, X. Image analysis using mathematical morphology. IEEE Trans. Pattern Anal. Mach. Intell. 1987, 9, 532–550. [Google Scholar] [CrossRef] [PubMed]
  30. Ponomarev, M.G.; Kappatos, V.; Selcuk, C.; Gan, T.-H.; Amos, M.; Halai, H.; Gierl, C.; Iovea, M. Digital radiographic inspection technique for production friendly quality assessment of PM parts. Powder Metall. 2013, 56, 92–95. [Google Scholar] [CrossRef]
  31. Ponomarev, M.G.; Secuk, C.; Gan, T.-H.; Amos, M.; Nicholson, I.; Iovea, M.; Neagu, M.; Stefanescu, B.; Mateiasi, G. Defect detection and classification system for automatic analysis of digital radiography images of PM parts. Powder Metall. 2014, 57, 17–20. [Google Scholar] [CrossRef]
Figure 1. Powder Metallurgy part by Metal Injection Moulding) (a) and Radiographic image after image processing; (b), revealing porosity in bulk (circled) (courtesy of TWI Ltd., Cambridge, UK).
Applsci 07 01156 g001
Figure 2. Powder Metallurgy part (a) and Radiographic image after image processing; (b), revealing crack-like features (circled) (courtesy of TWI Ltd., Cambridge, UK).
Applsci 07 01156 g002
Figure 3. Tree structure of the defect image library.
Applsci 07 01156 g003
Figure 4. Flow diagram of image processing.
Applsci 07 01156 g004
Figure 5. Photo and 3D CT image of a powder metallurgy valve ring sample (ring diameter: Ø24 mm). (a) Photo; (b) 3D CT image.
Applsci 07 01156 g005
Figure 6. Original 2D CT slices of the PM valve ring sample with defects.
Applsci 07 01156 g006
Figure 7. After de-noising with Wiener filter.
Applsci 07 01156 g007
Figure 8. Before and after image registration. (a) Before; (b) After.
Applsci 07 01156 g008
Figure 9. Difference images after image subtraction. (a) Slice 1; (b) Slice 2.
Applsci 07 01156 g009
Figure 10. Images after thresholding and before morphological operation. (a) Slice 1; (b) Slice 2.
Applsci 07 01156 g010
Figure 11. Images after thresholding and morphological operation. (a) Slice 1; (b) Slice 2.
Applsci 07 01156 g011
Figure 12. Image of the purpose made gear part without (a) and with (b) defect. (a) Without defect; (b) with defect (chipped gear tooth).
Applsci 07 01156 g012
Figure 13. Reconstructed 3D image of the gear part without (a) and with (b) defect. (a) Without defect; (b) with defect.
Applsci 07 01156 g013
Figure 14. 2D slices of the reconstructed 3D images of the gear part without (a) and with (b) defect. (a) Without defect; (b) with defect.
Applsci 07 01156 g014
Figure 15. 2D slices of the reconstructed 3D images before (a) and after (b) registration. (a) Before registration; (b) After registration.
Applsci 07 01156 g015
Figure 16. Isometric view of the reconstructed 3D images following registration (a) and the defect area is extracted (b). (a,b) Isometric view of the 3D images following registration; (c) Difference is extracted from the background.
Applsci 07 01156 g016
Table 1. Configuration parameters of the Computed Tomography (CT) scanner.
Type of Equipment: X-Tek HMXCT 225Source to Detector Distance: 1112 mm
Detector: Perkin Elmer 1620 16-bit flat-panelSource to object distance: 125 mm
Focal spot/source size: 0.005 mmMagnification: 8.9
Target Material: Tungsten (W)Tube voltage: 210 kV
Beam angle: 90°Tube current: 280 µA
Exposure: 354 msFilters: 2 mm Copper at source
Number of frames averaged: 4/projectionIQI: NA
Number of projections: 1000Voxel Resolution: 0.023 µm3
Rotation Angle Step: 0.36 degreesReconstruction Algorithm: Filter back projection

