Analysis of the Dynamic Wheel Loads in Railway Transition Zones Considering the Moisture Condition of the Ballast and Subballast


Abstract
:
1. Introduction of Transition Zones
- rail surface defects and cracks in the rail foot;
- broken fasteners;
- cracks in concrete sleepers;
- breakage of ballast particles and voids between sleepers and ballast, also known as hanging sleepers.
- Significant abrupt changes in the vertical stiffness of the track;
- Differential settlement or uneven profile of the ballast track, which inherently settles more than a concrete structure;
- Geotechnical issues, such as poor drainage conditions and poor quality of materials.
2. Review of the Mechanism of Saturated Ballast
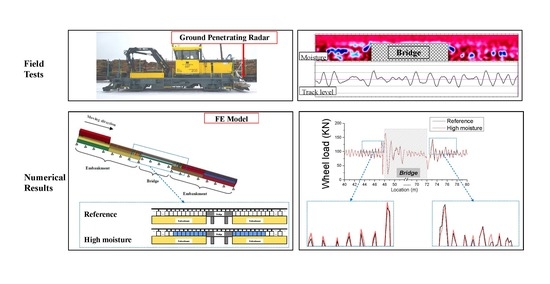
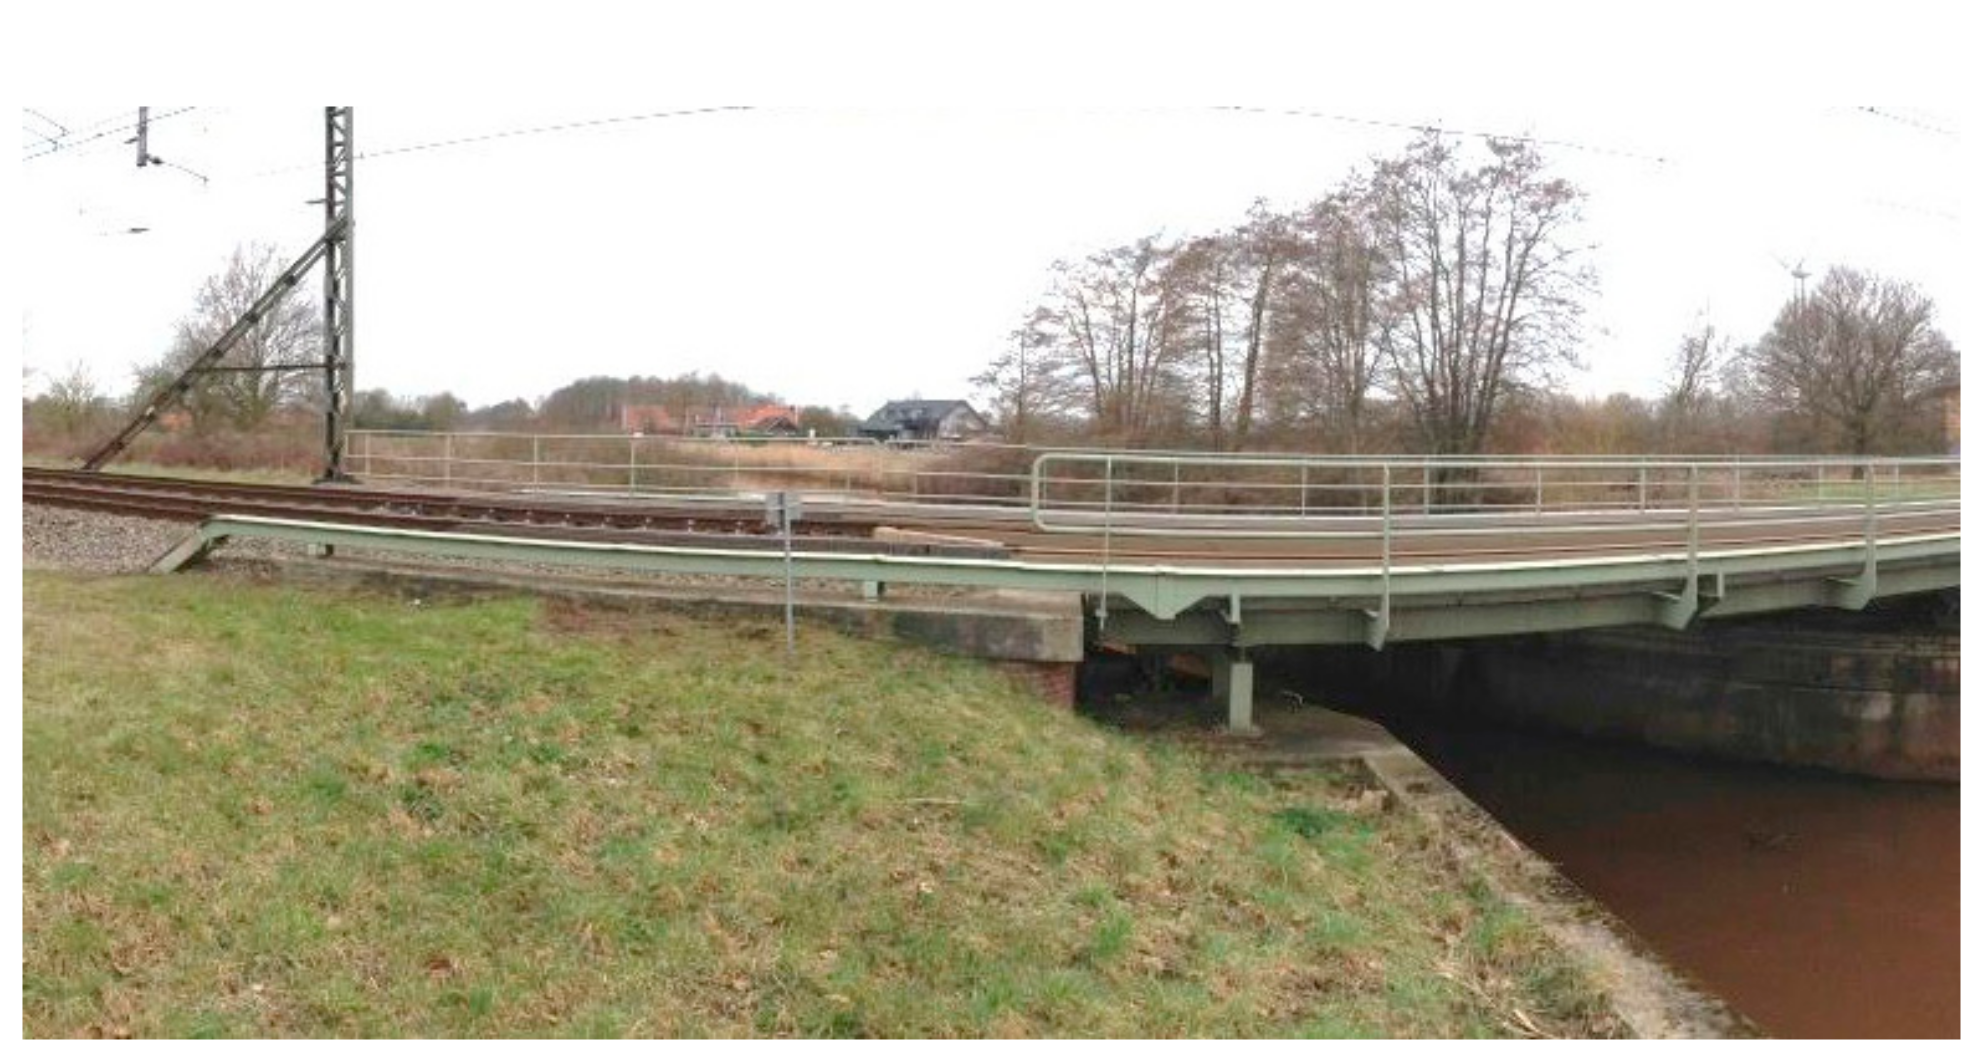
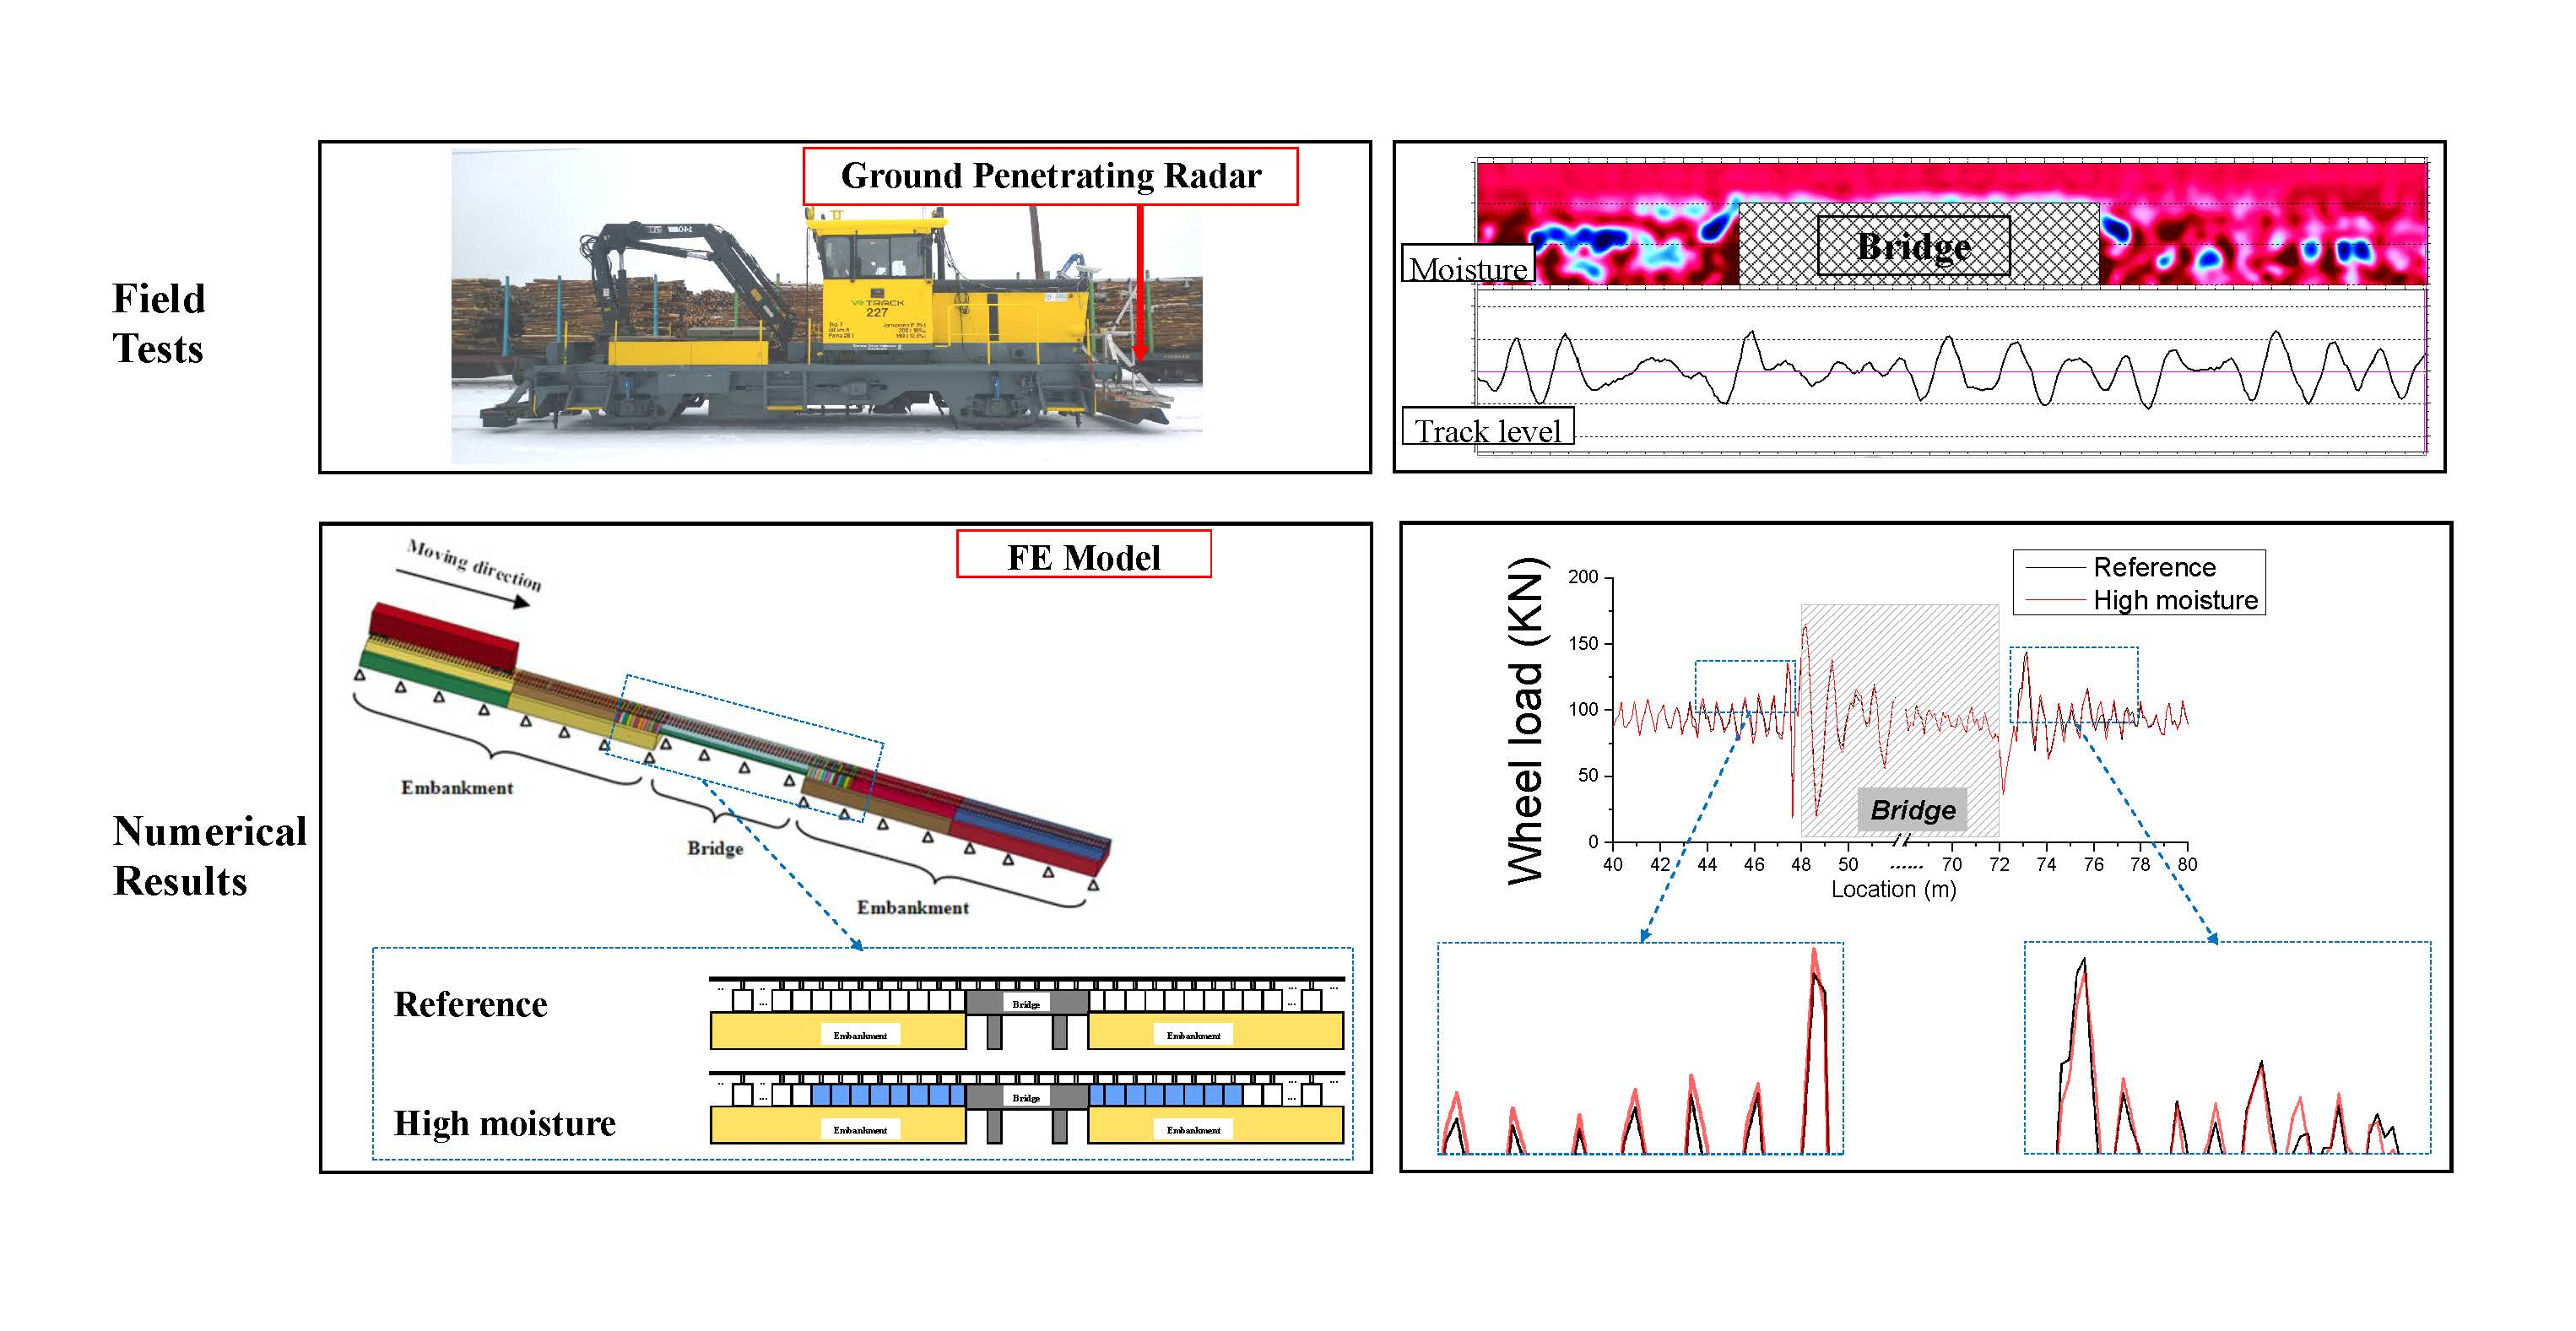
3. Experiment Analysis of Transition Zones
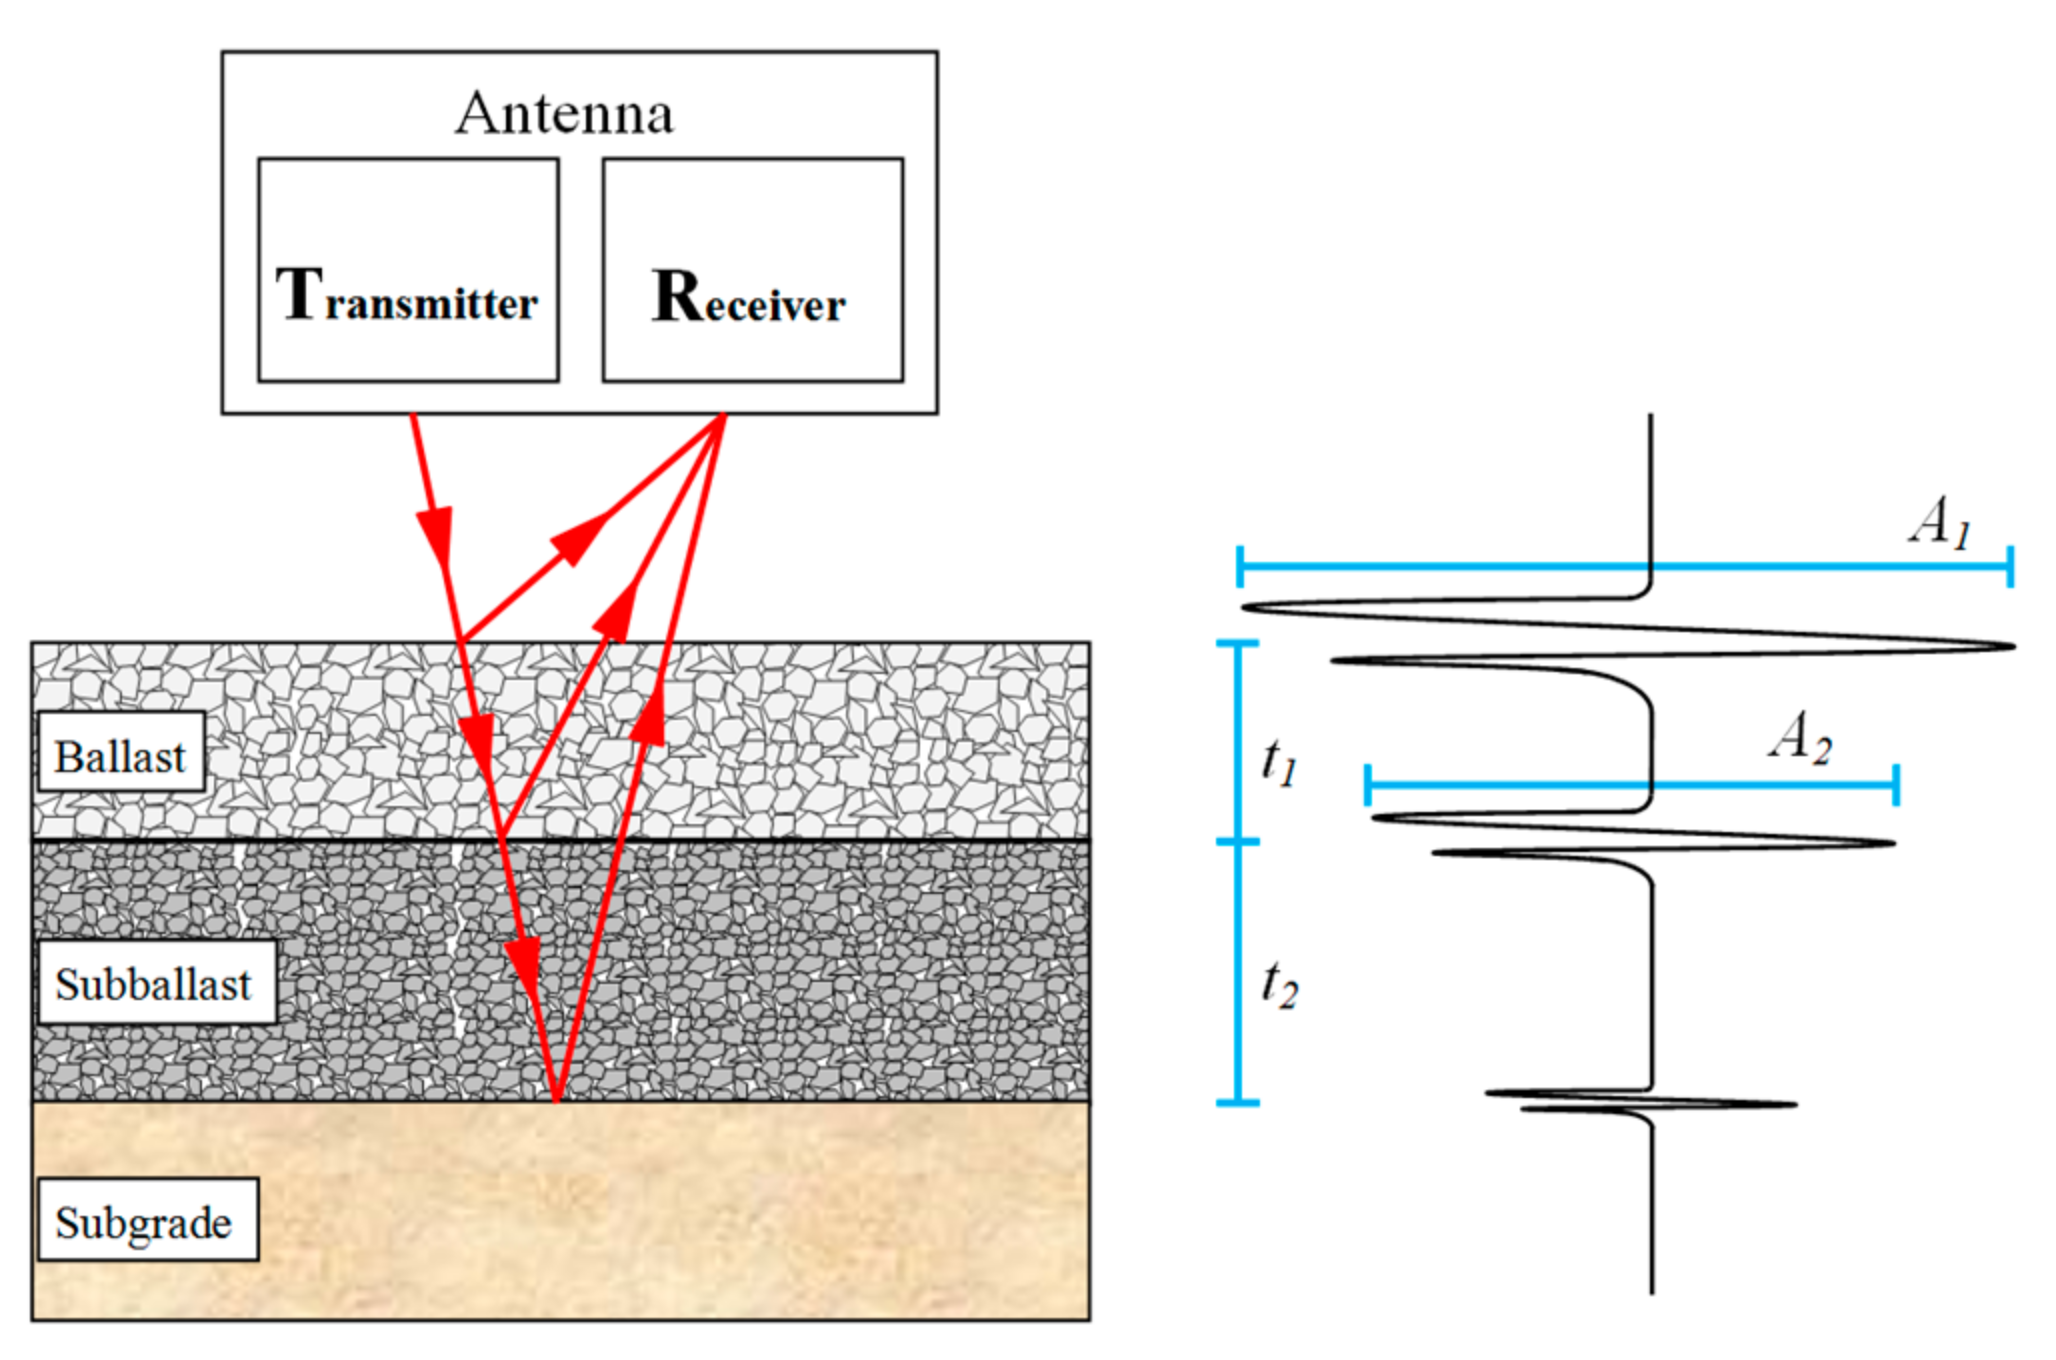
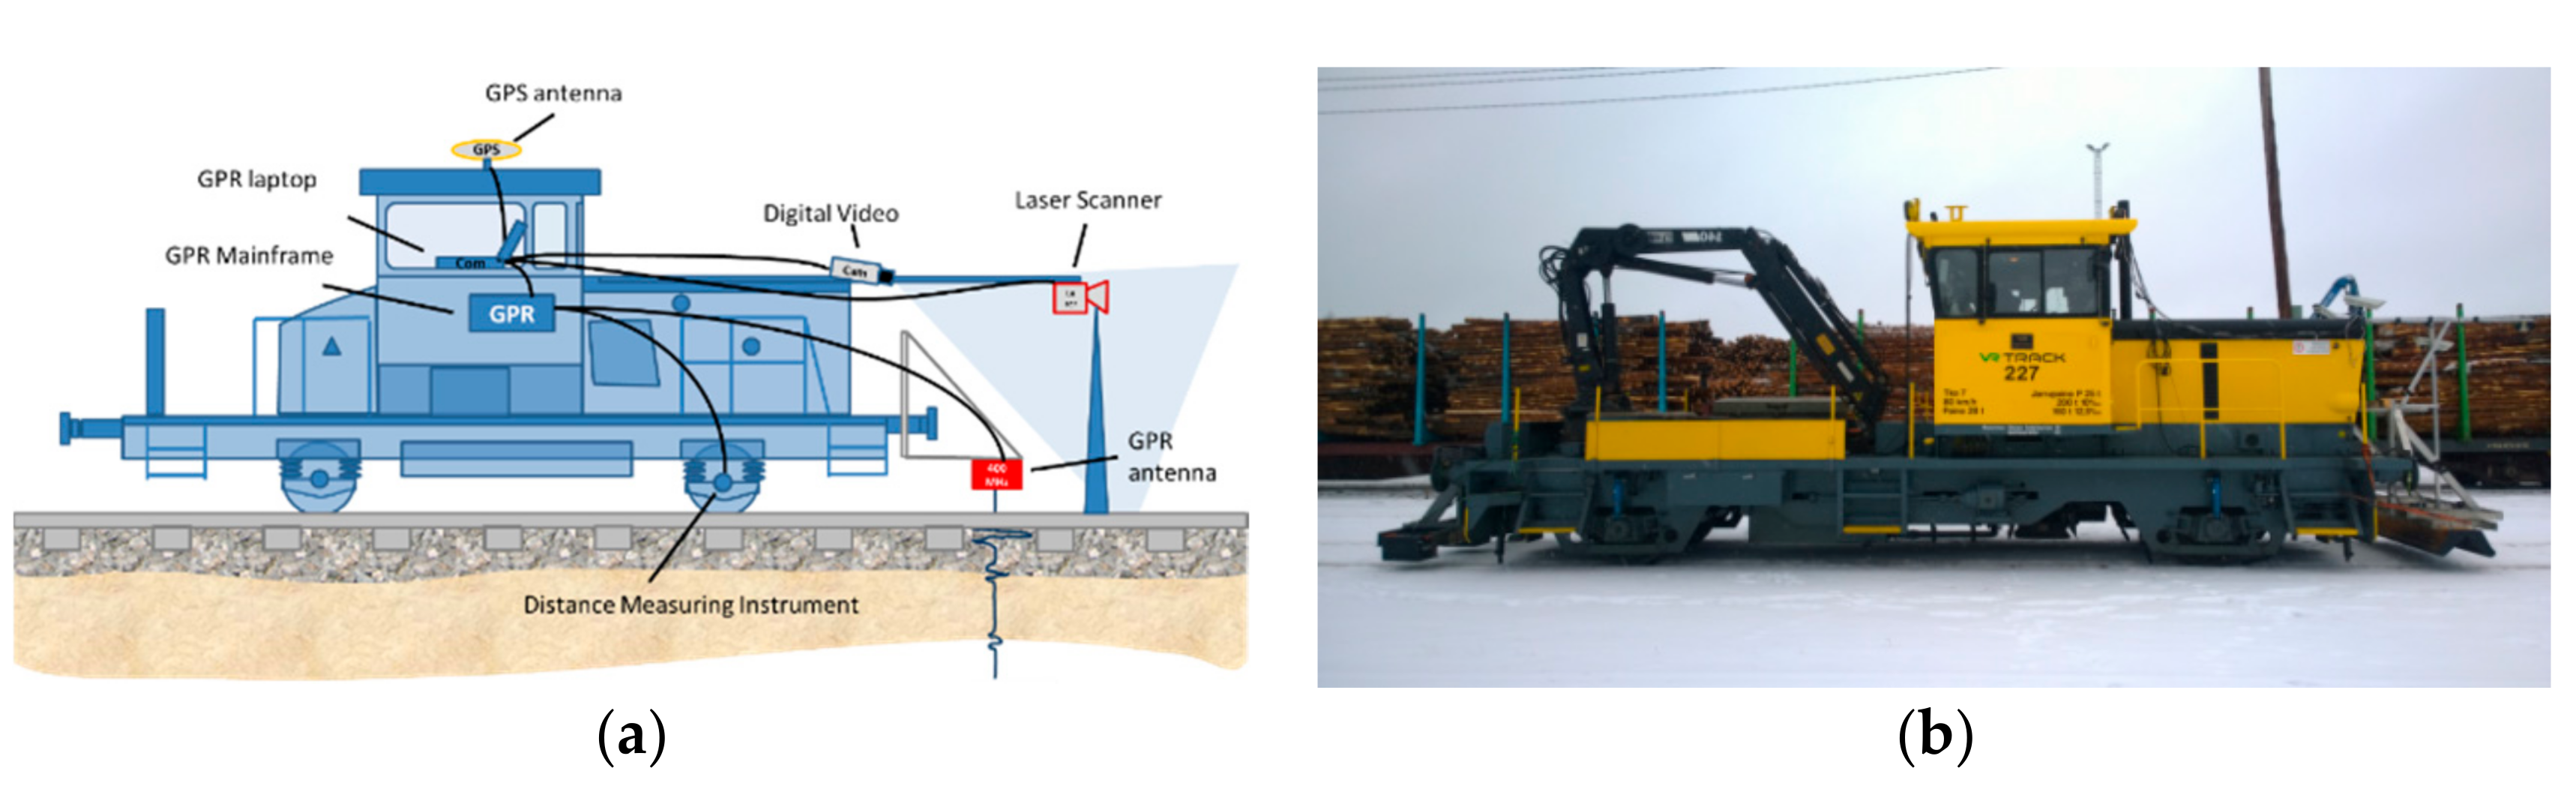
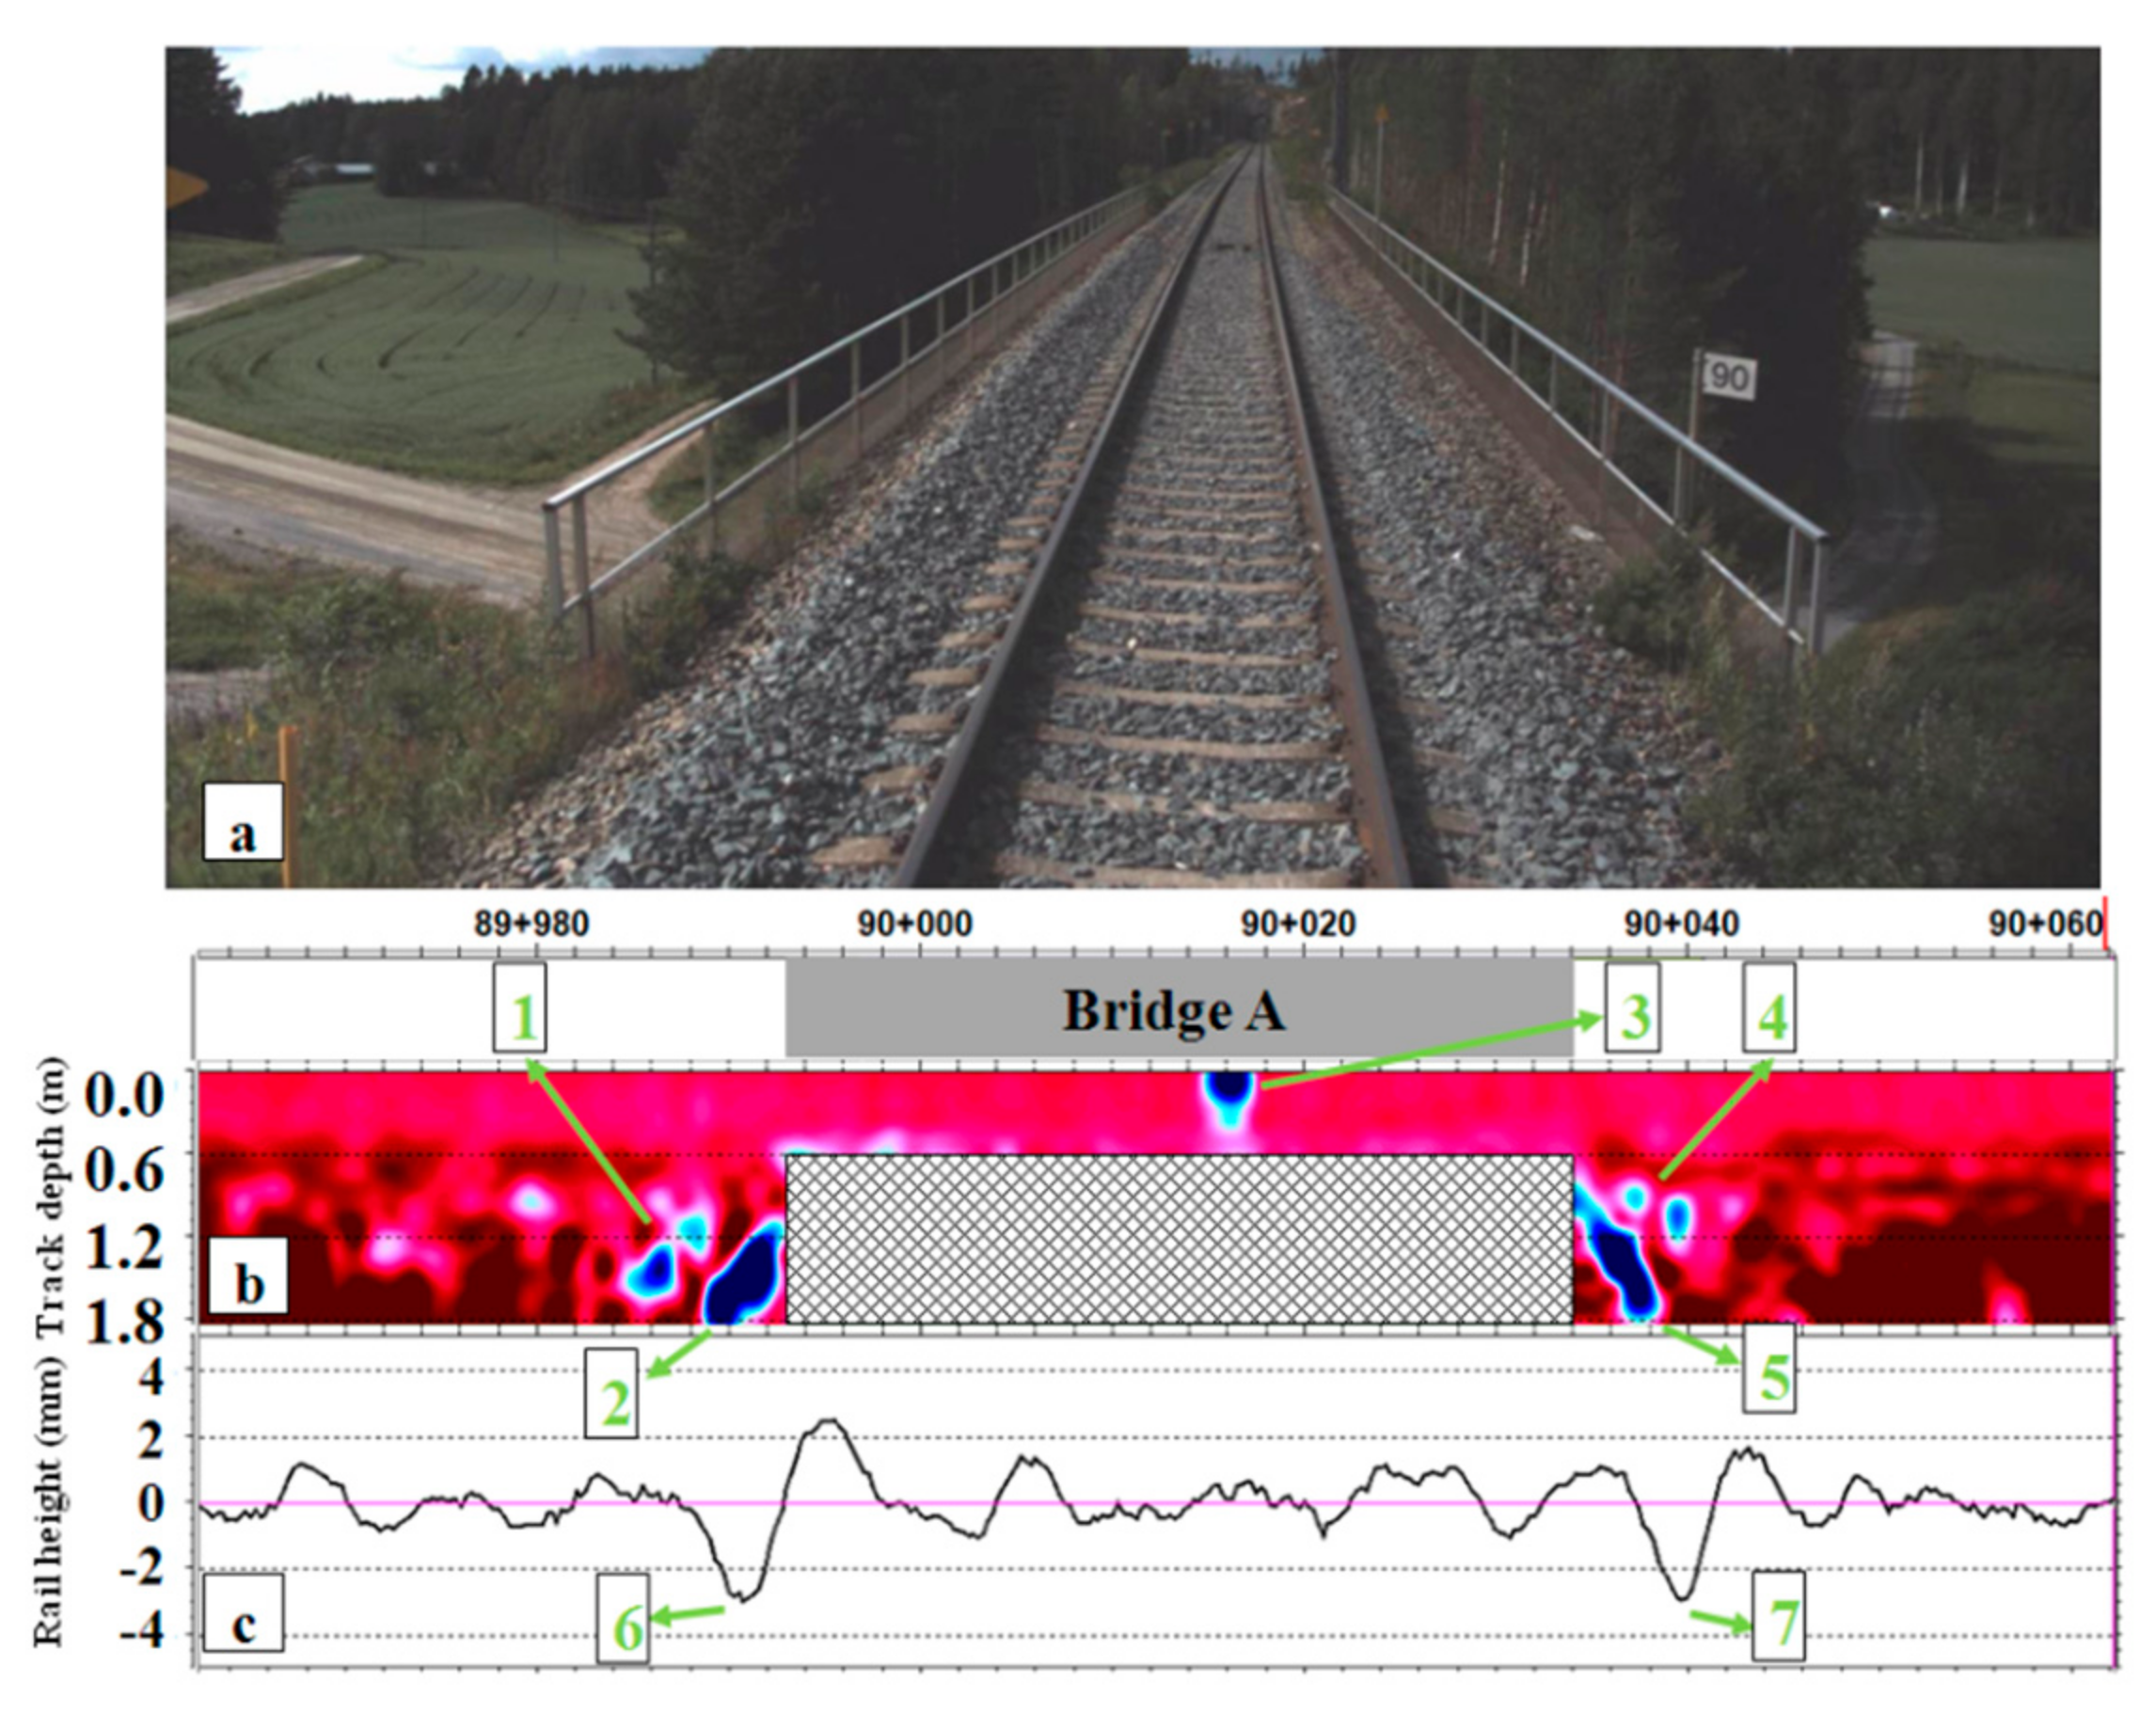
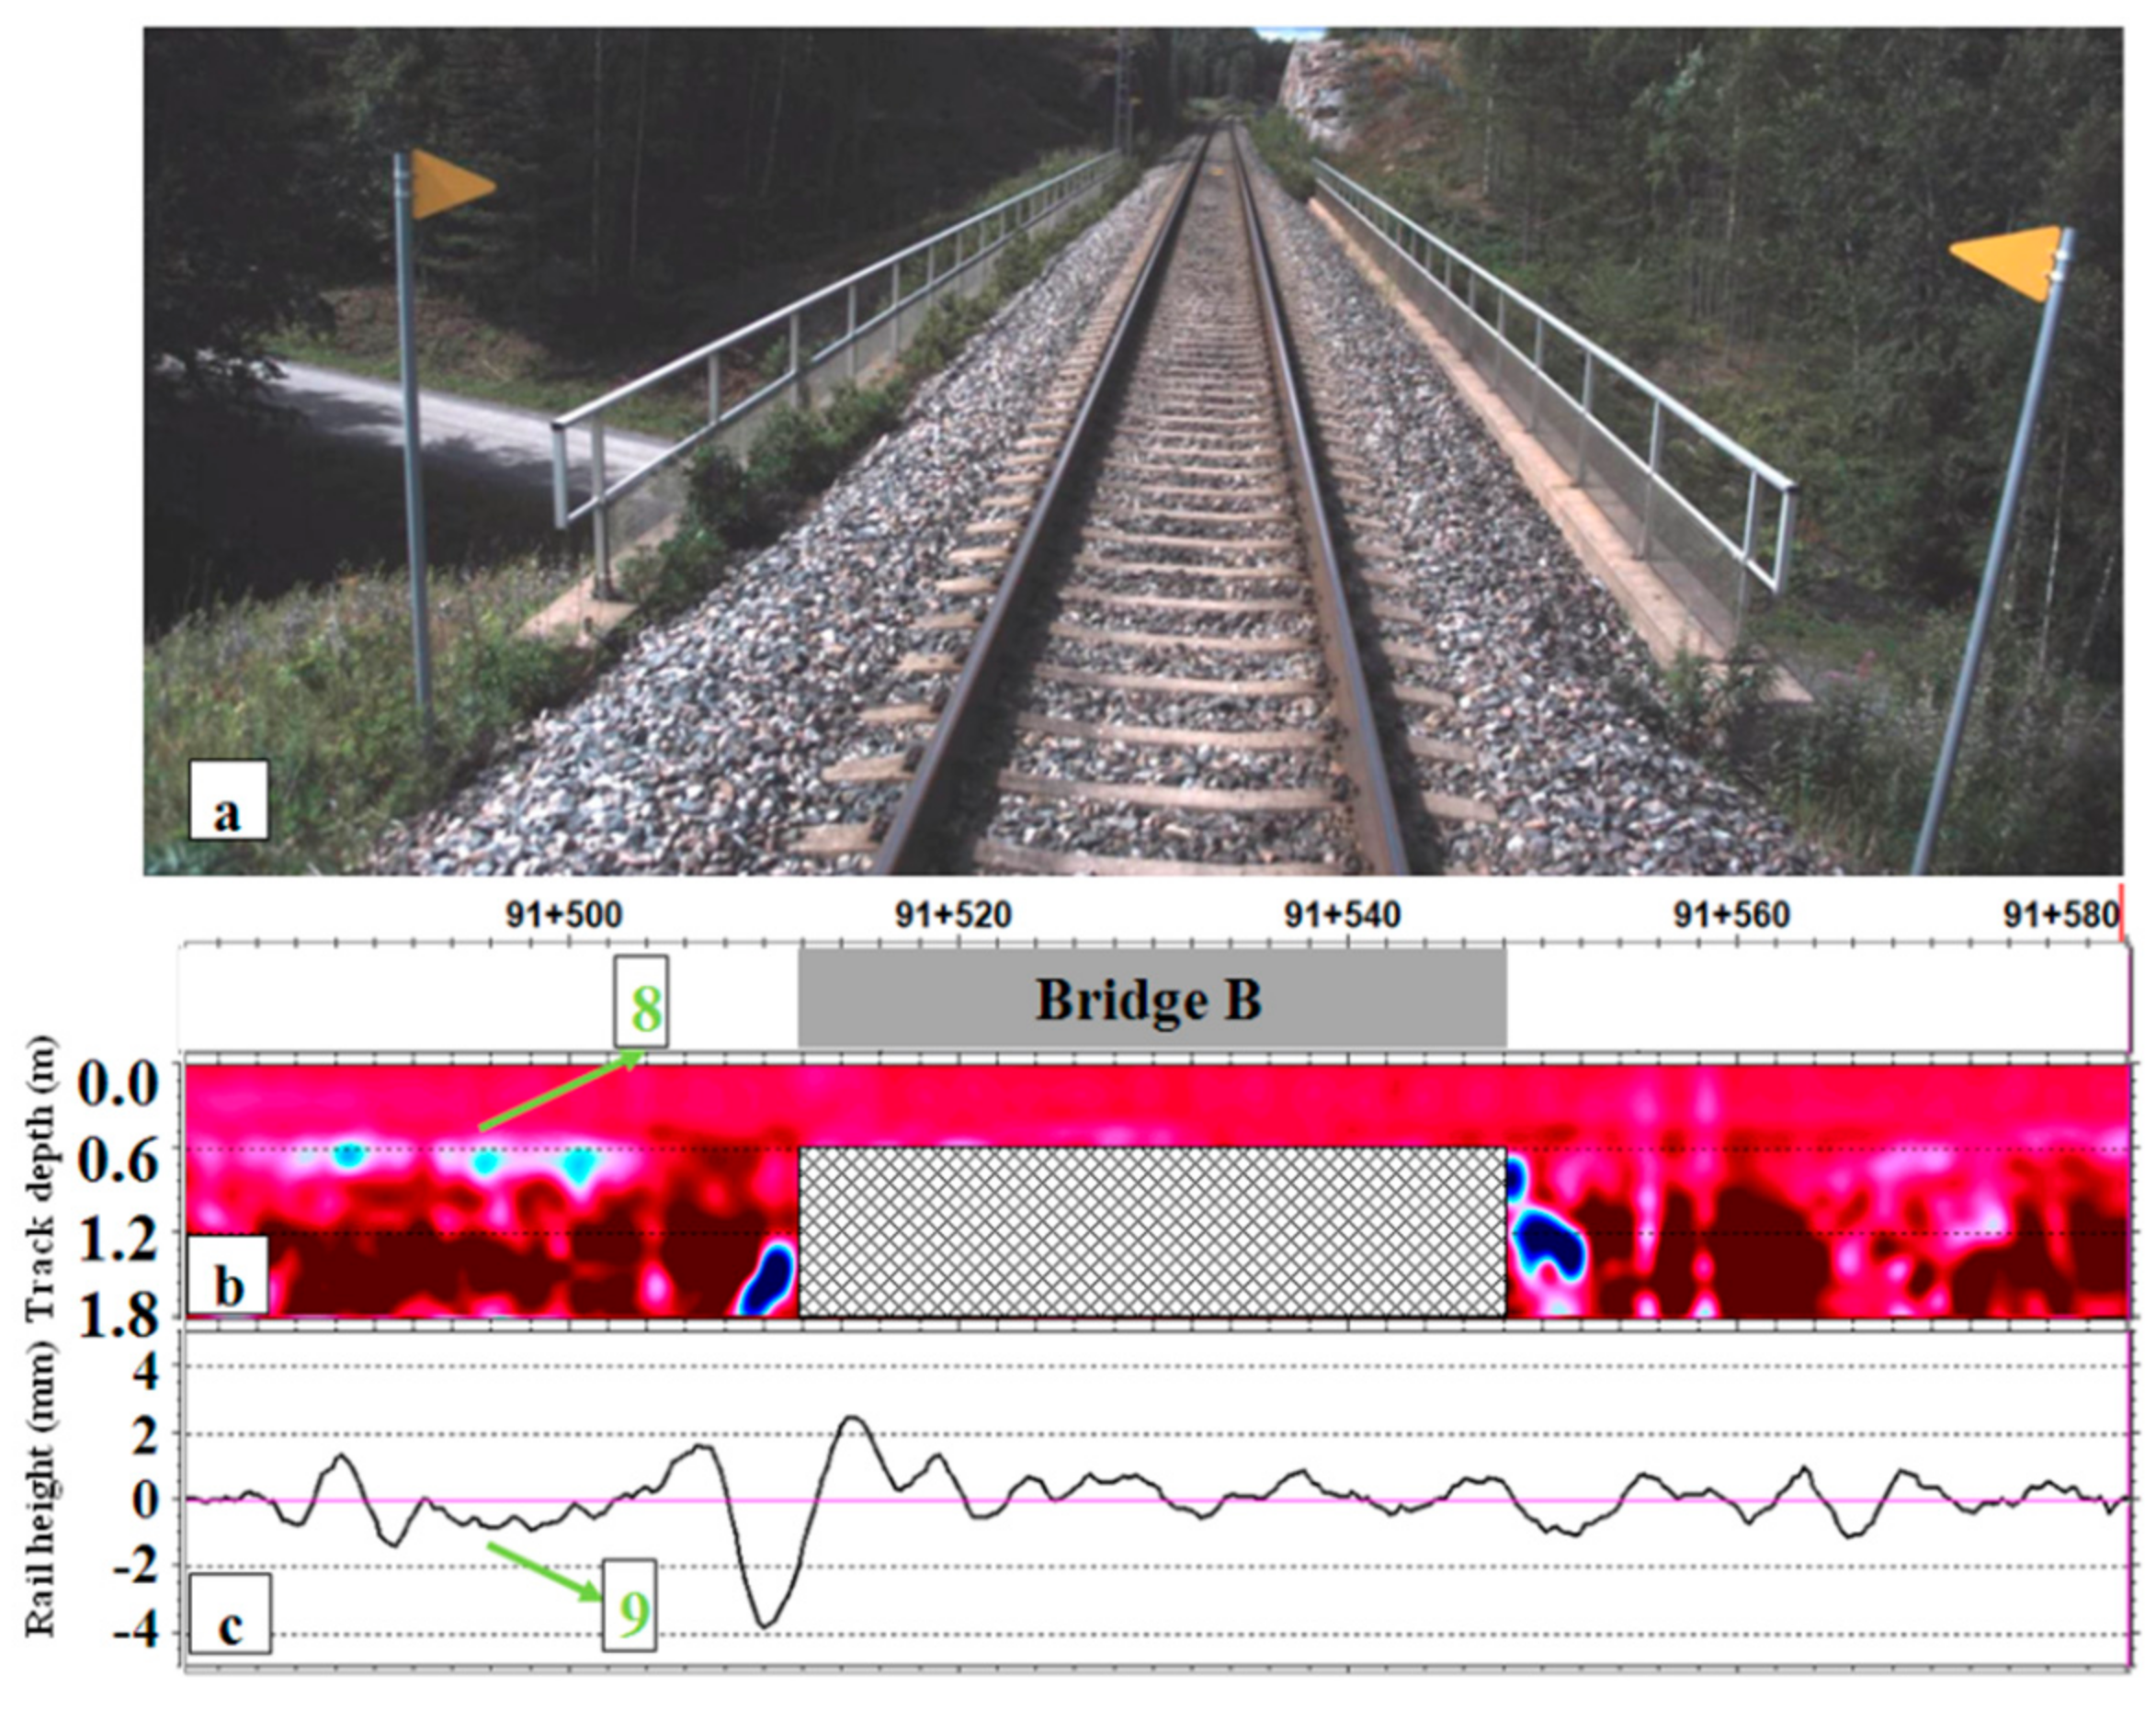
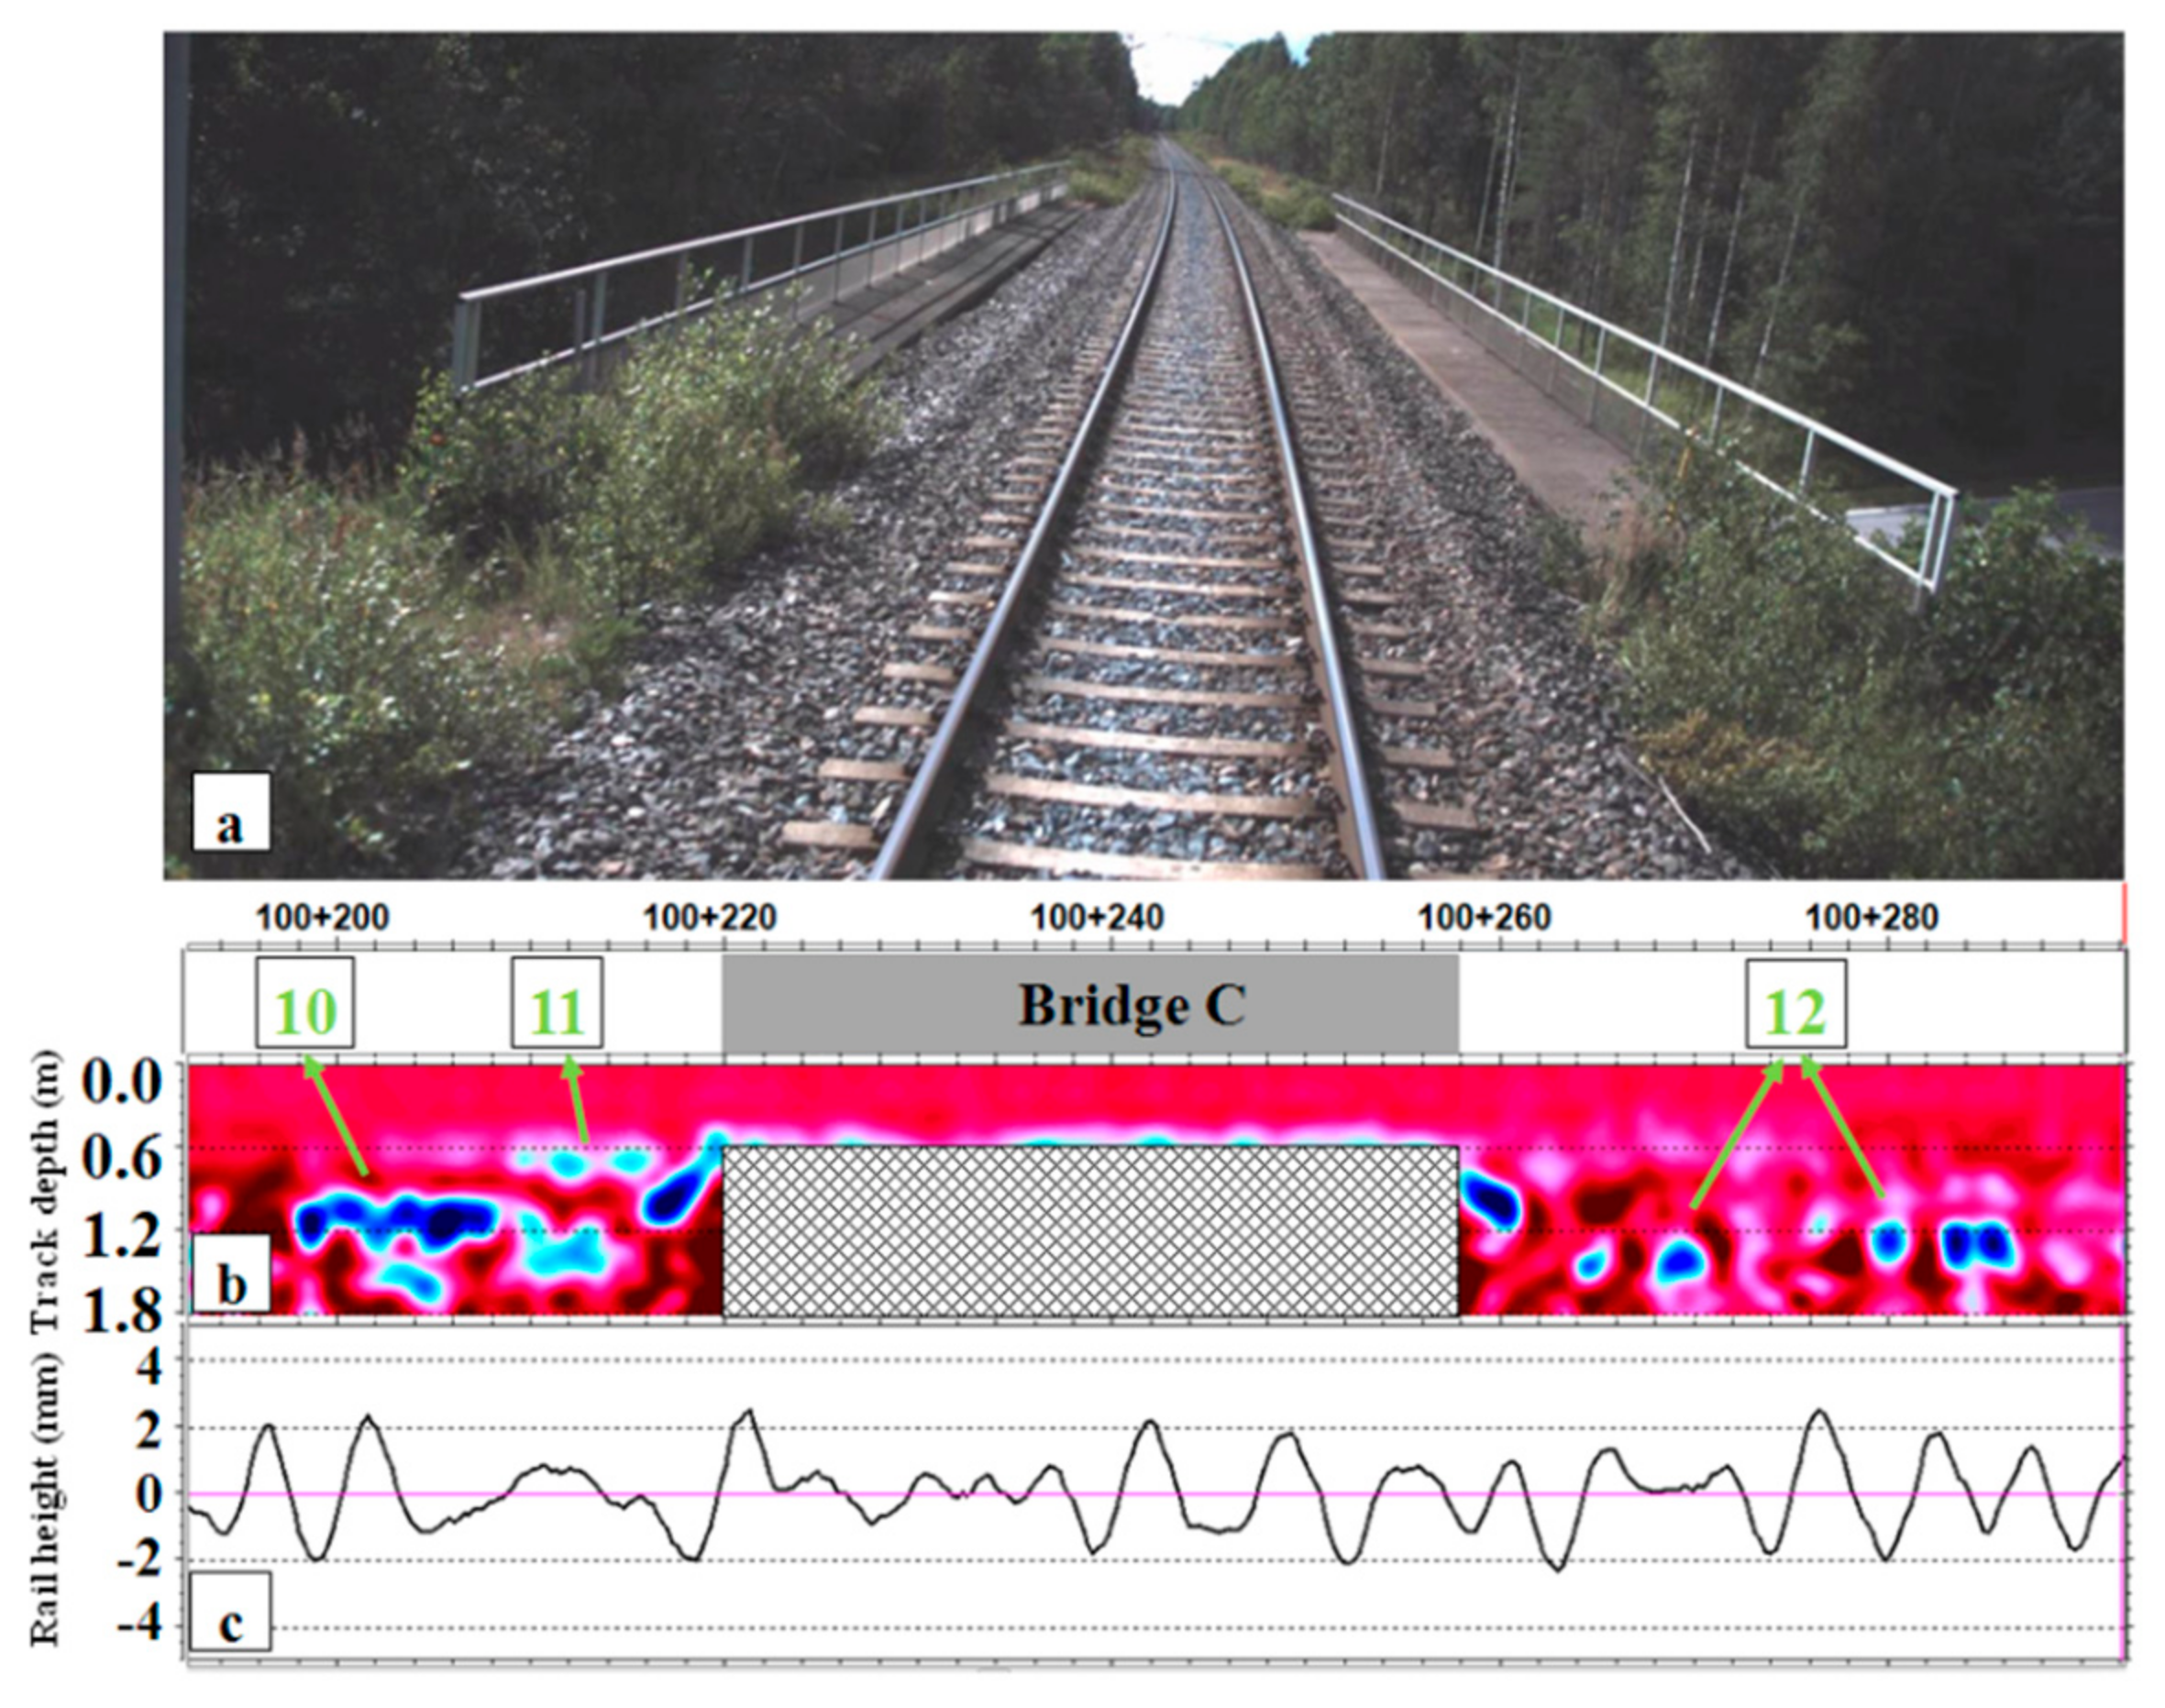
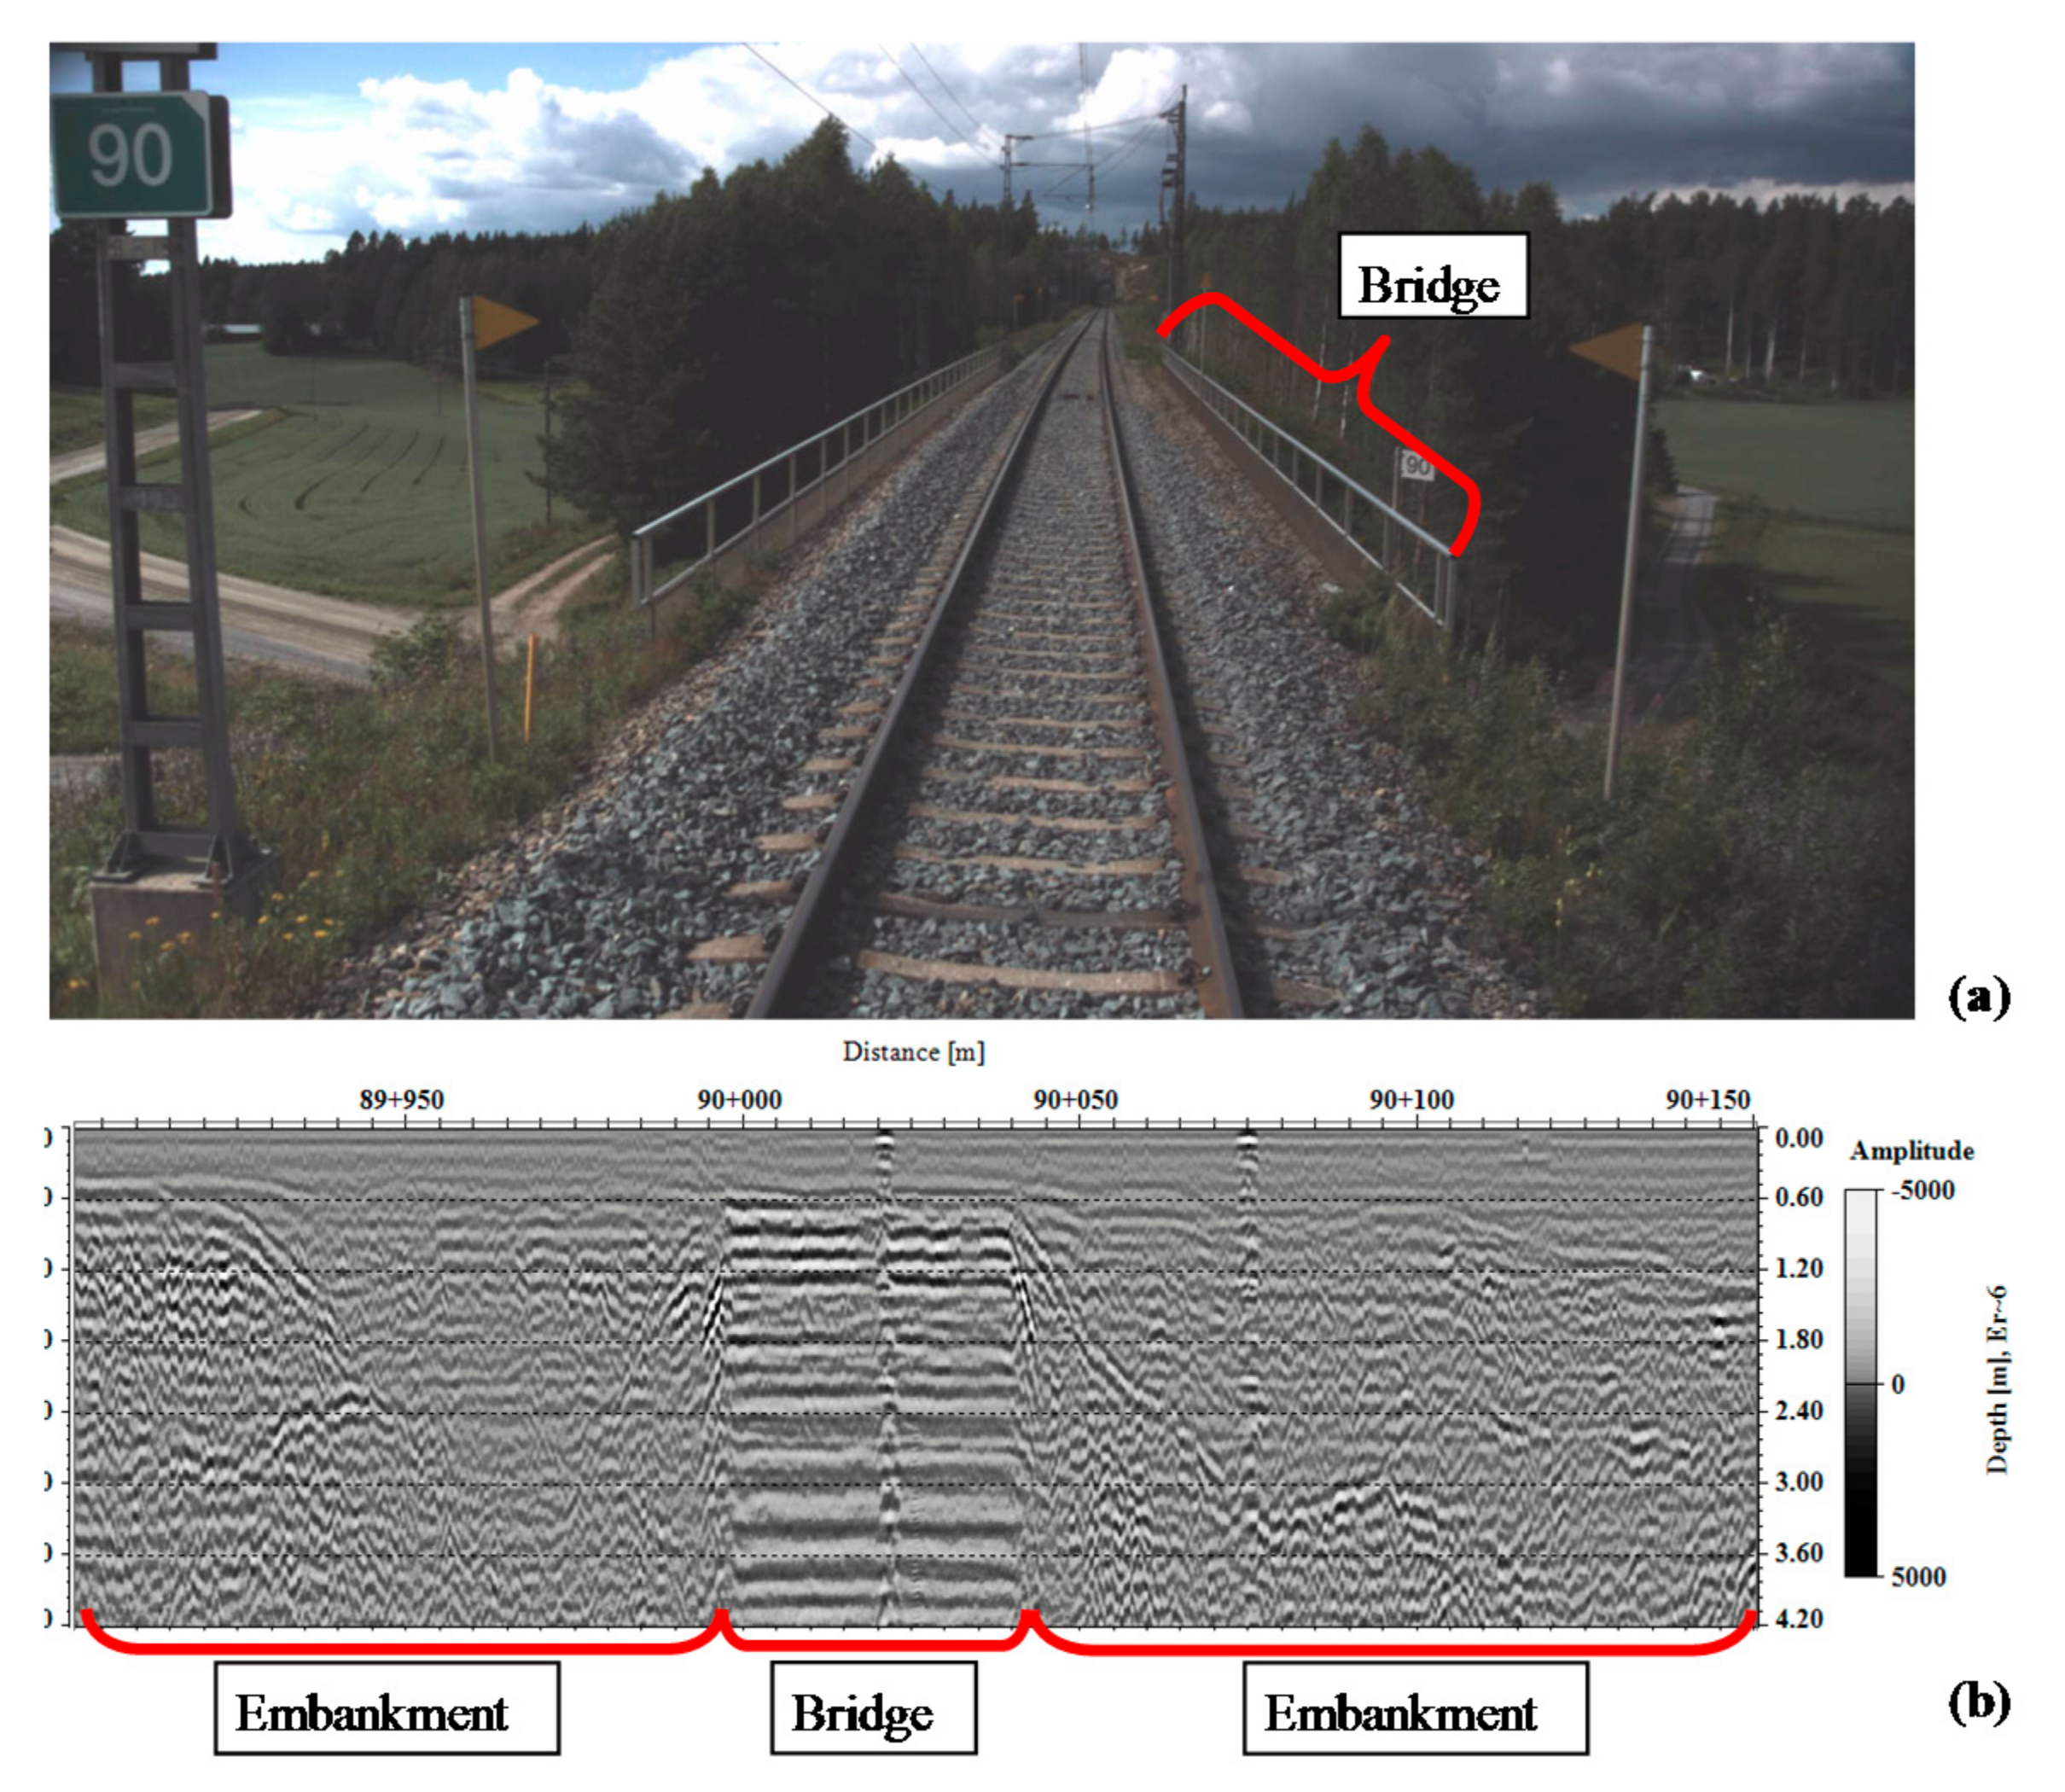
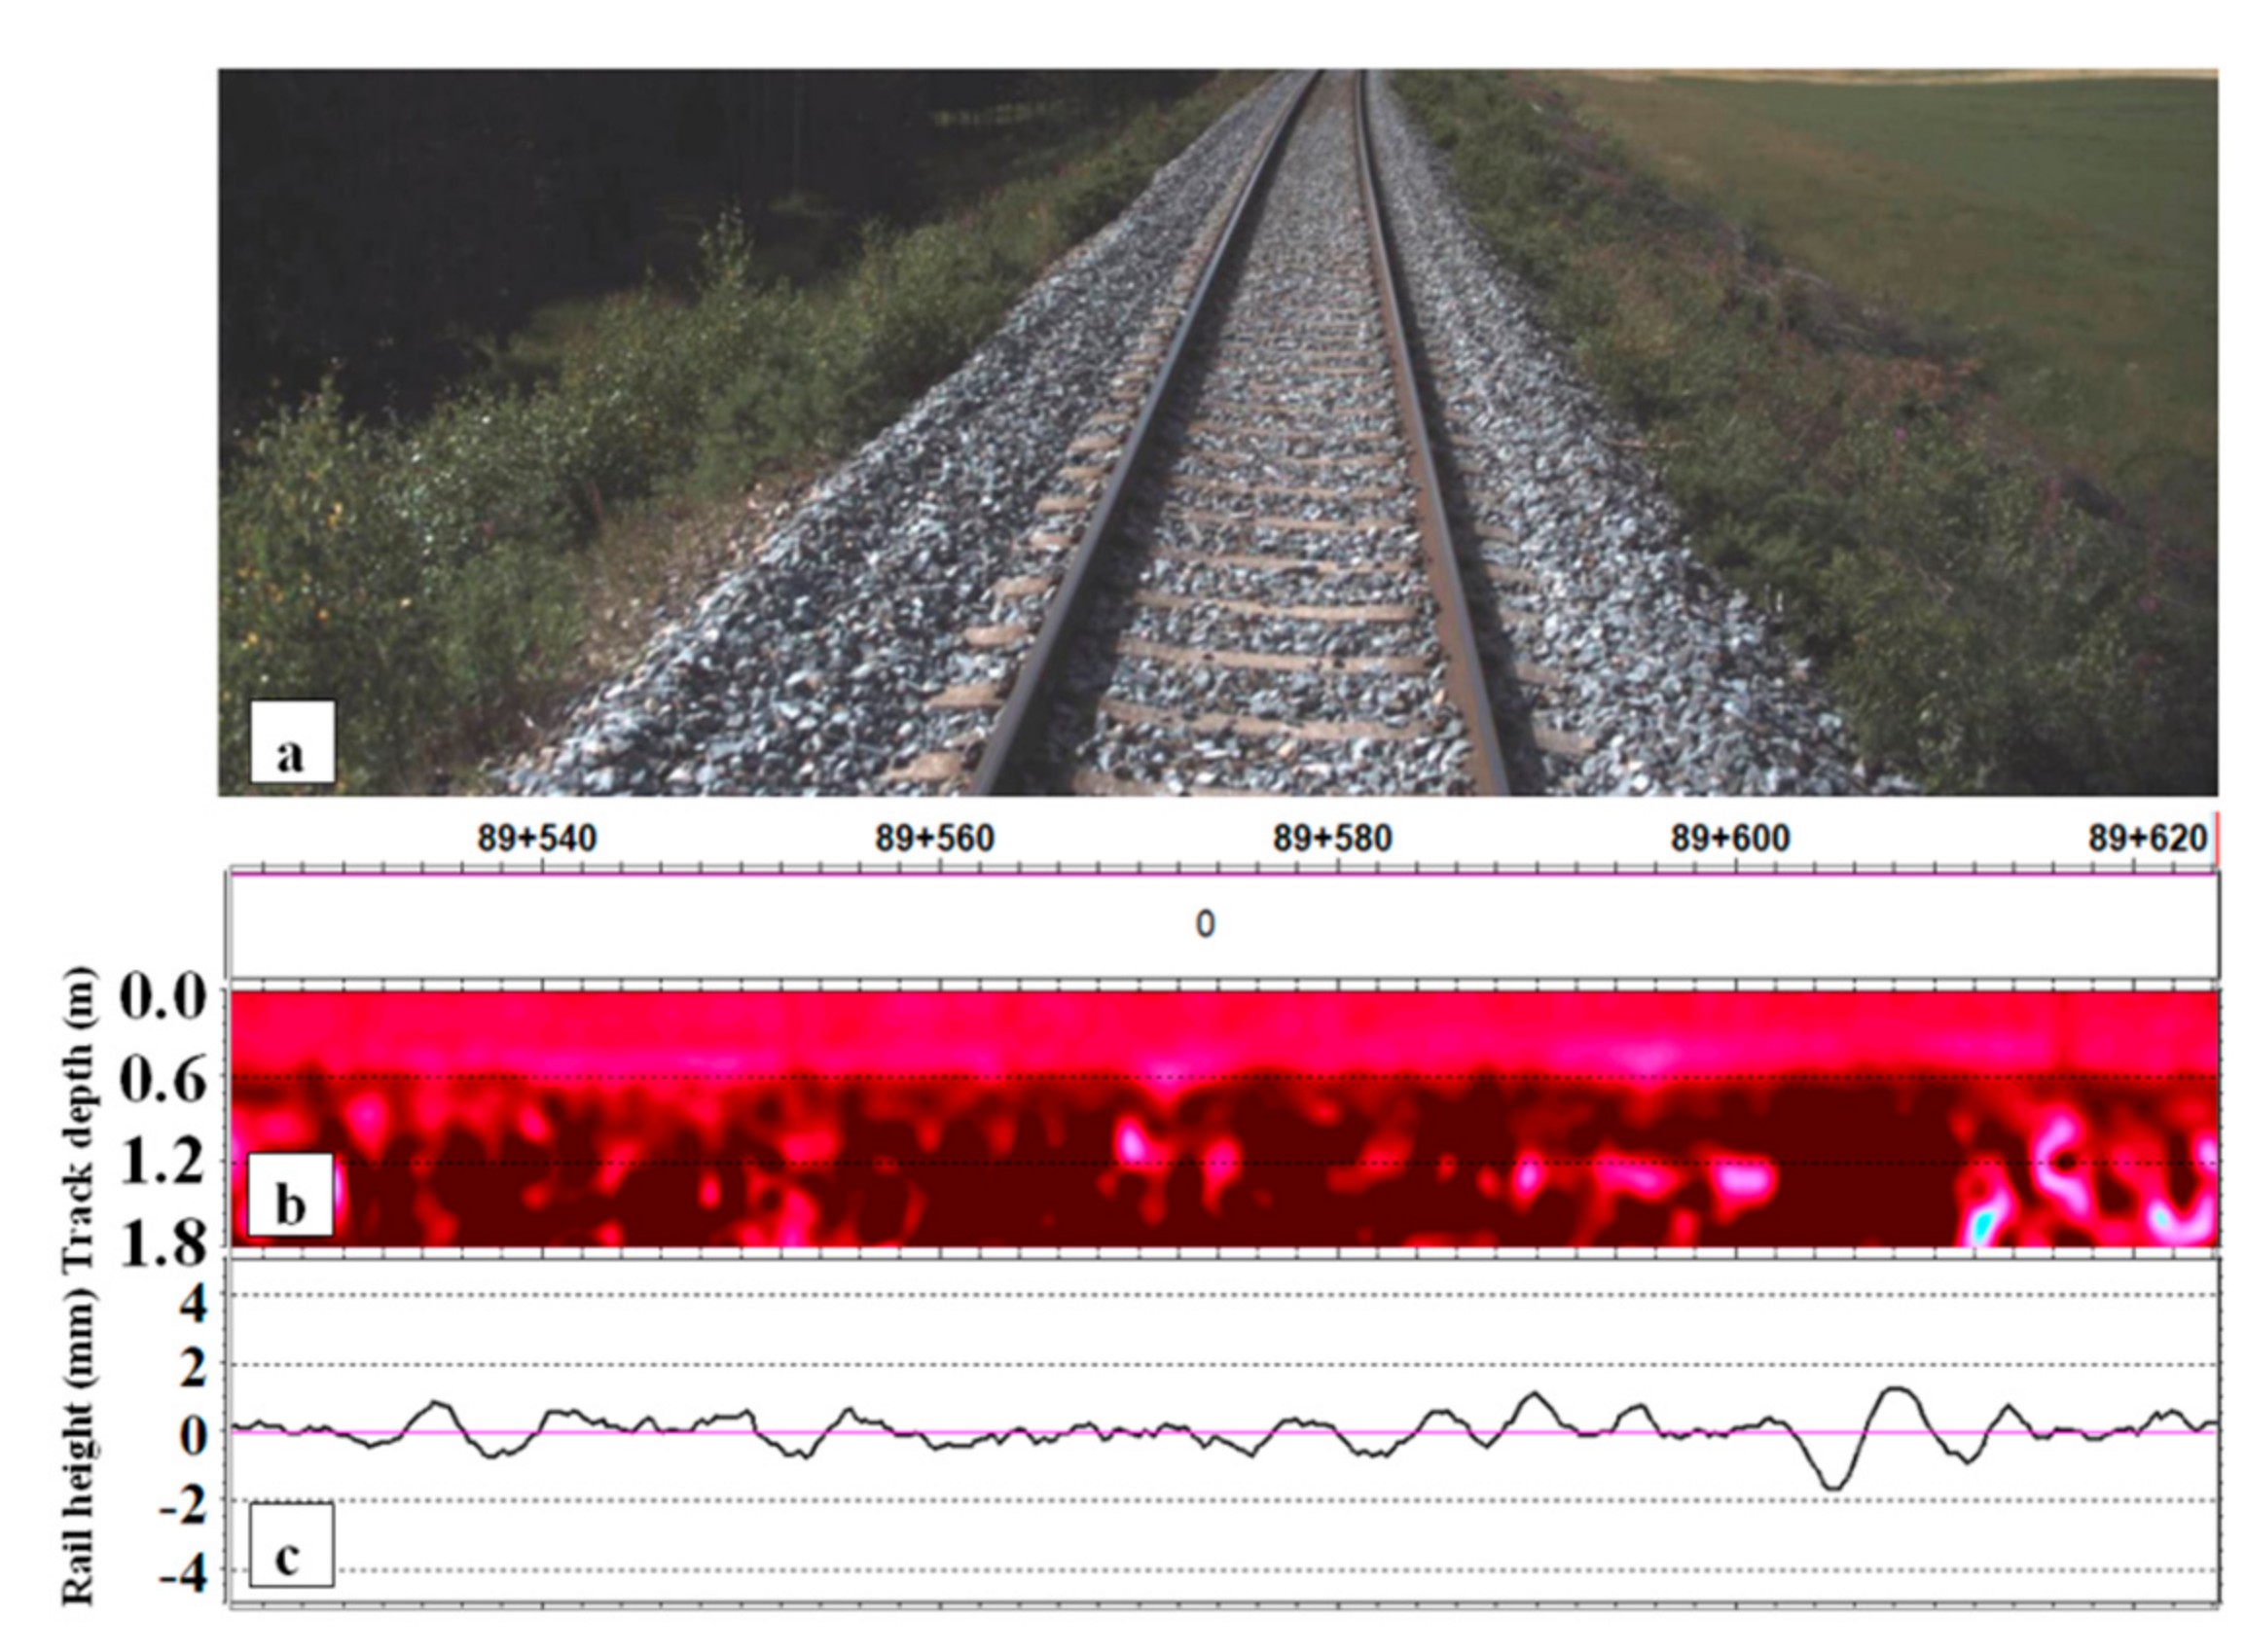
3.1. Introduction of GPR
3.2. Measurement Results
4. Finite Element Analysis of Transition Zones with High Moisture
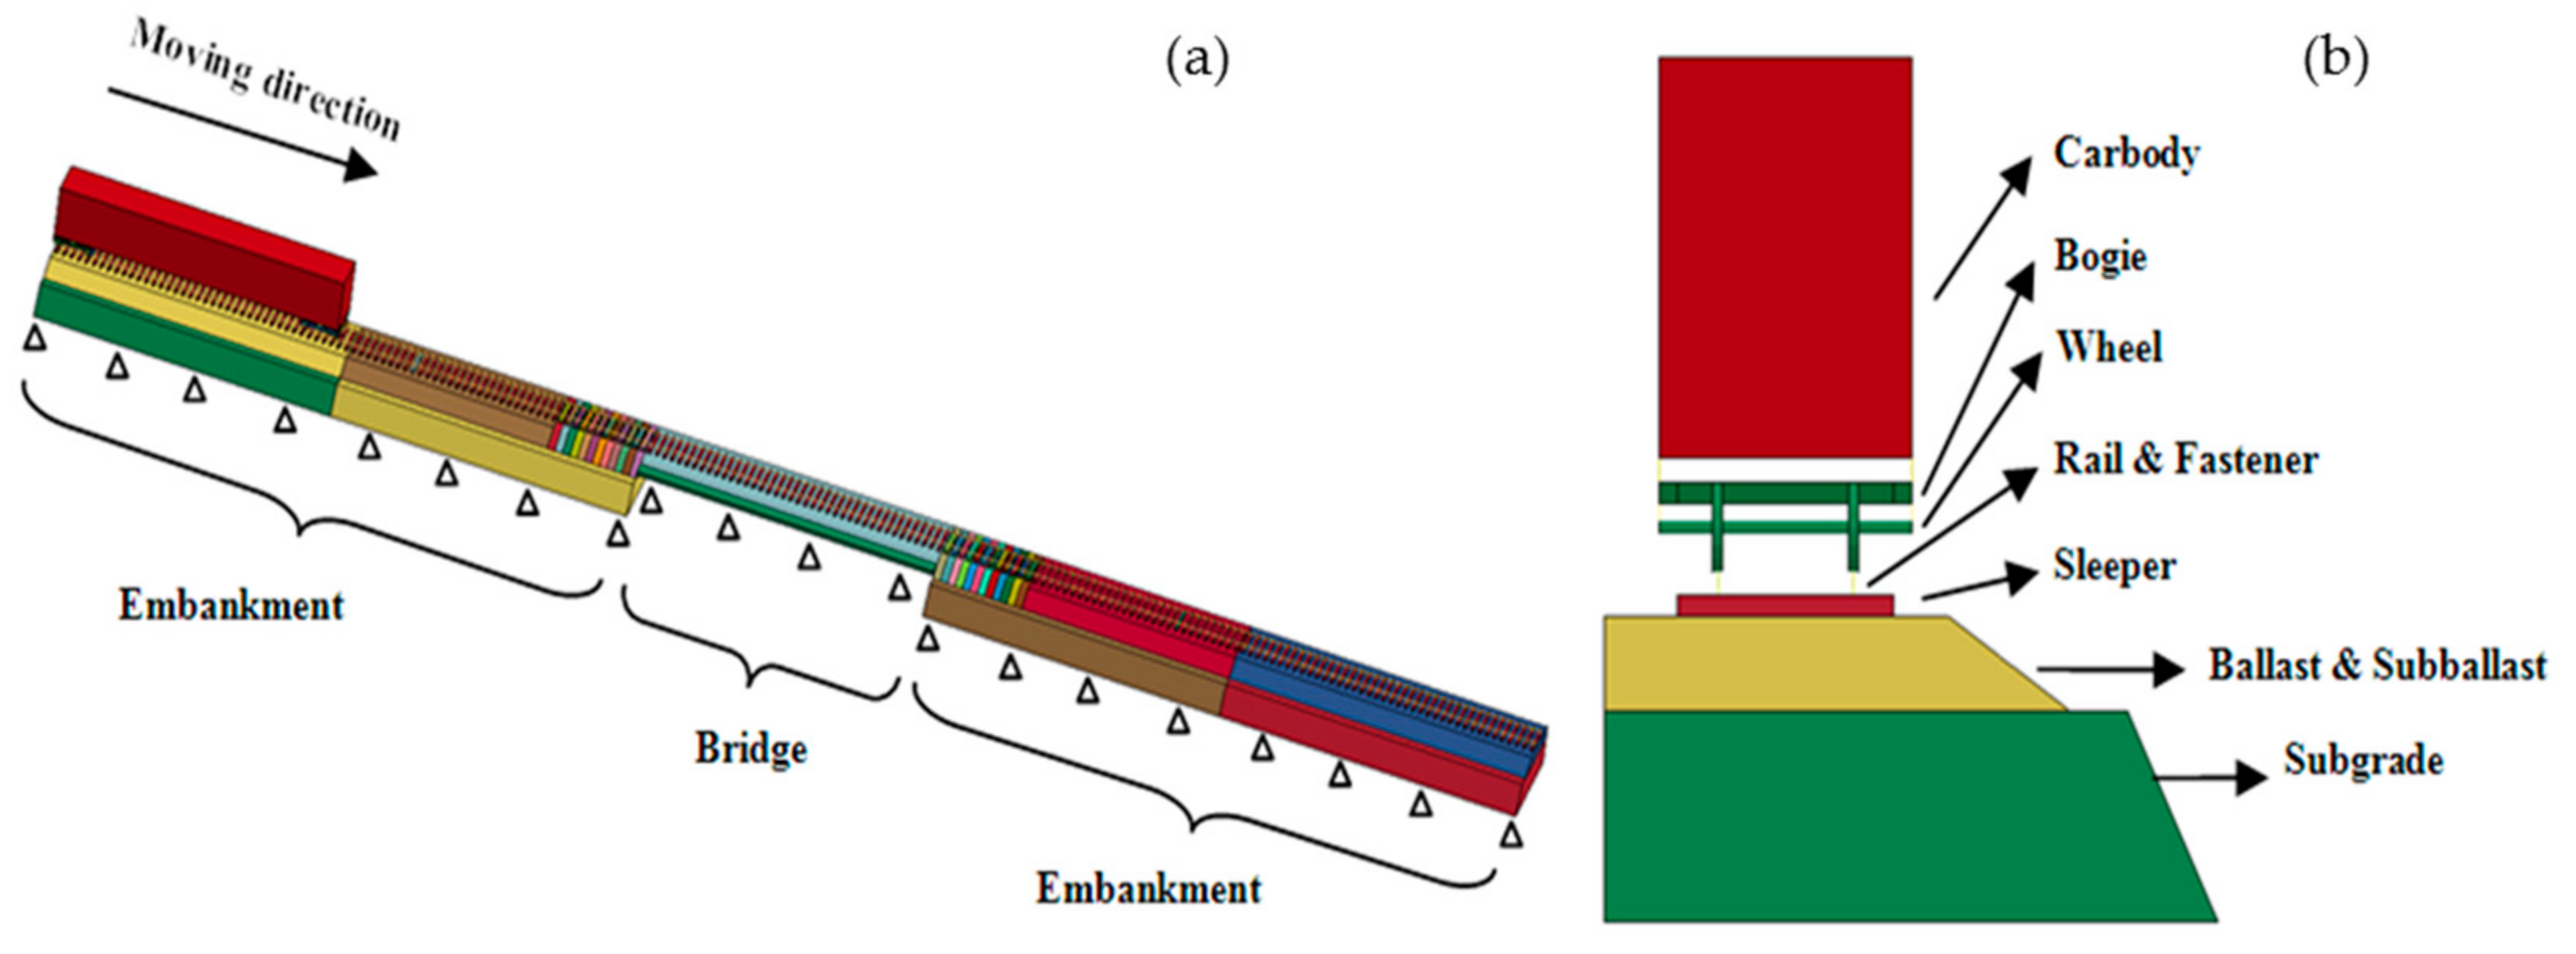
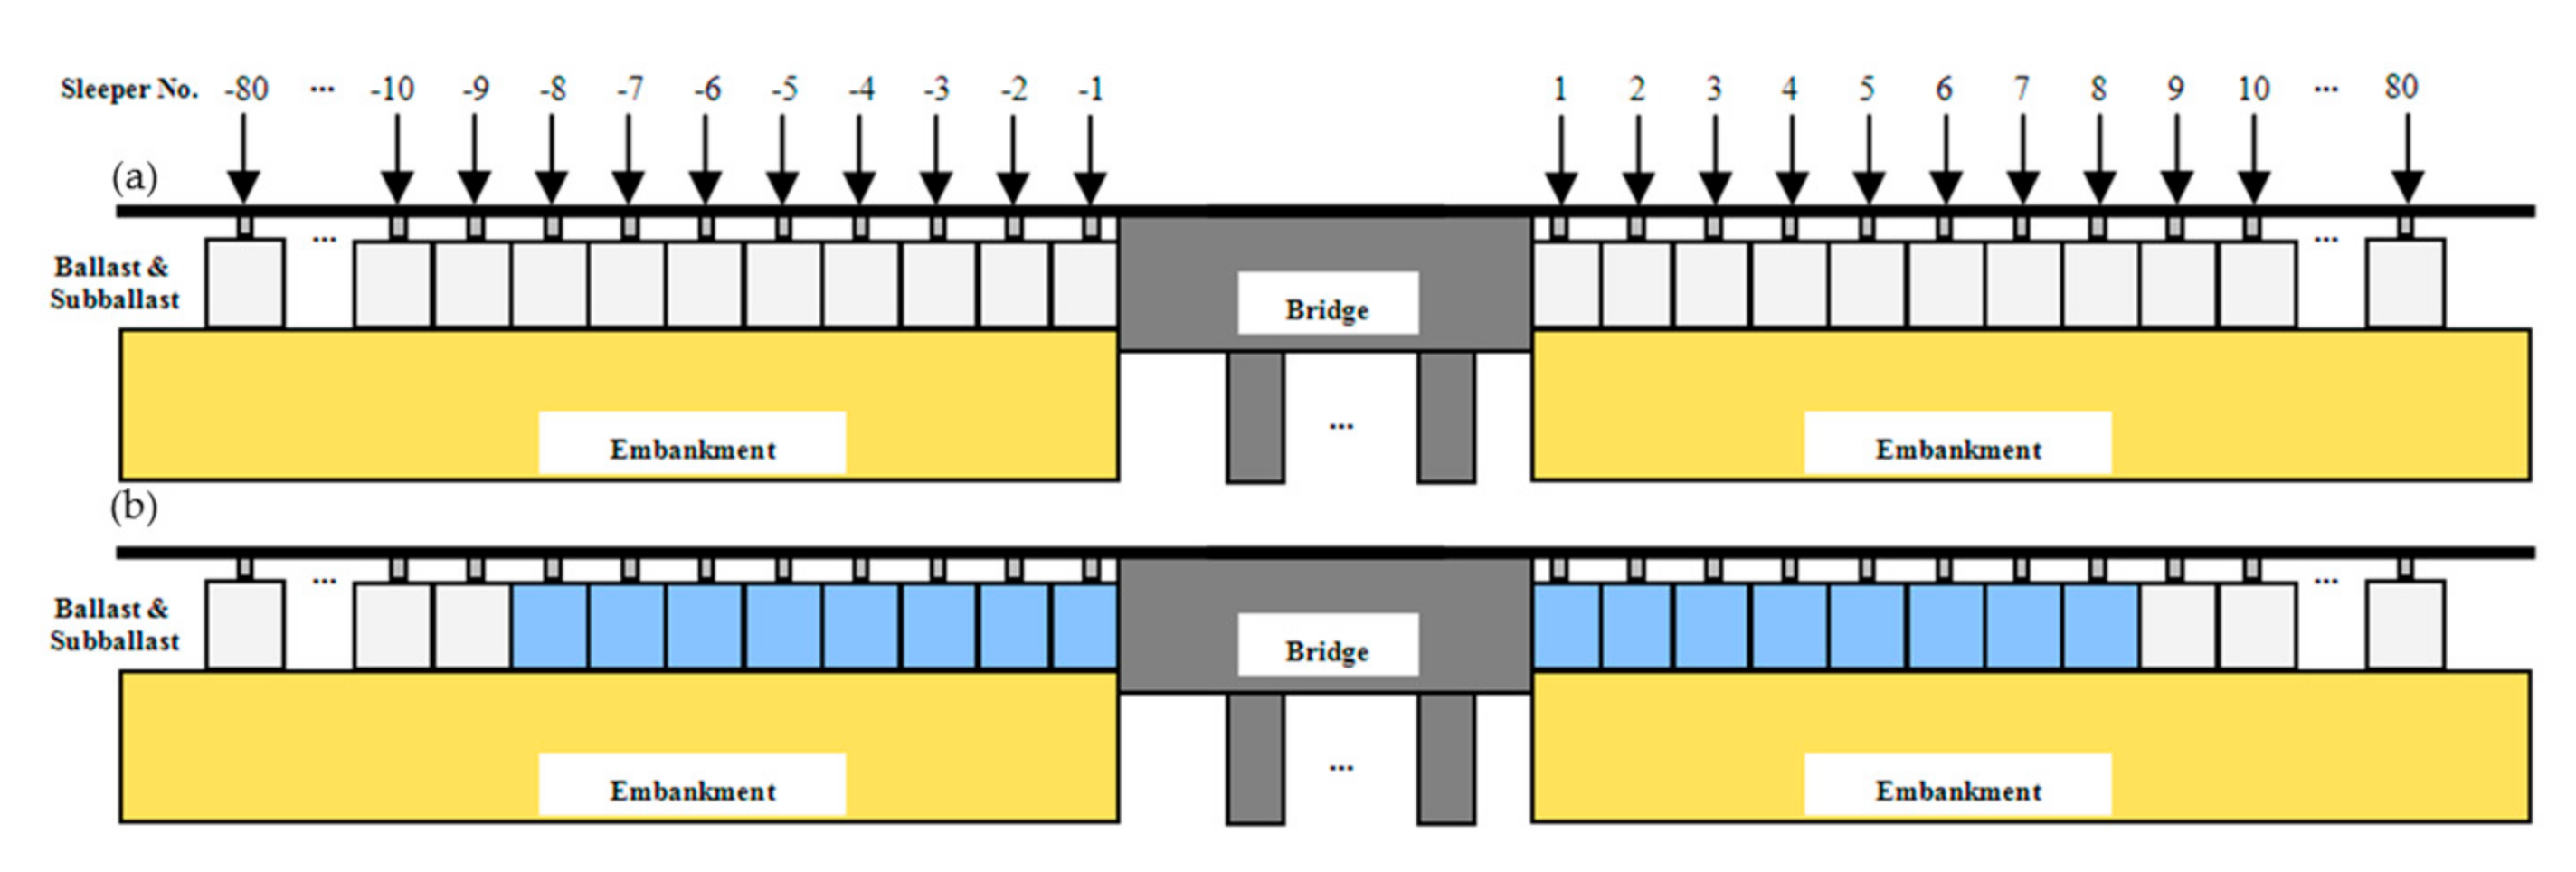
4.1. Introduction of the Finite Element Model
4.2. Simulation of the Transition Zone with High Moisture
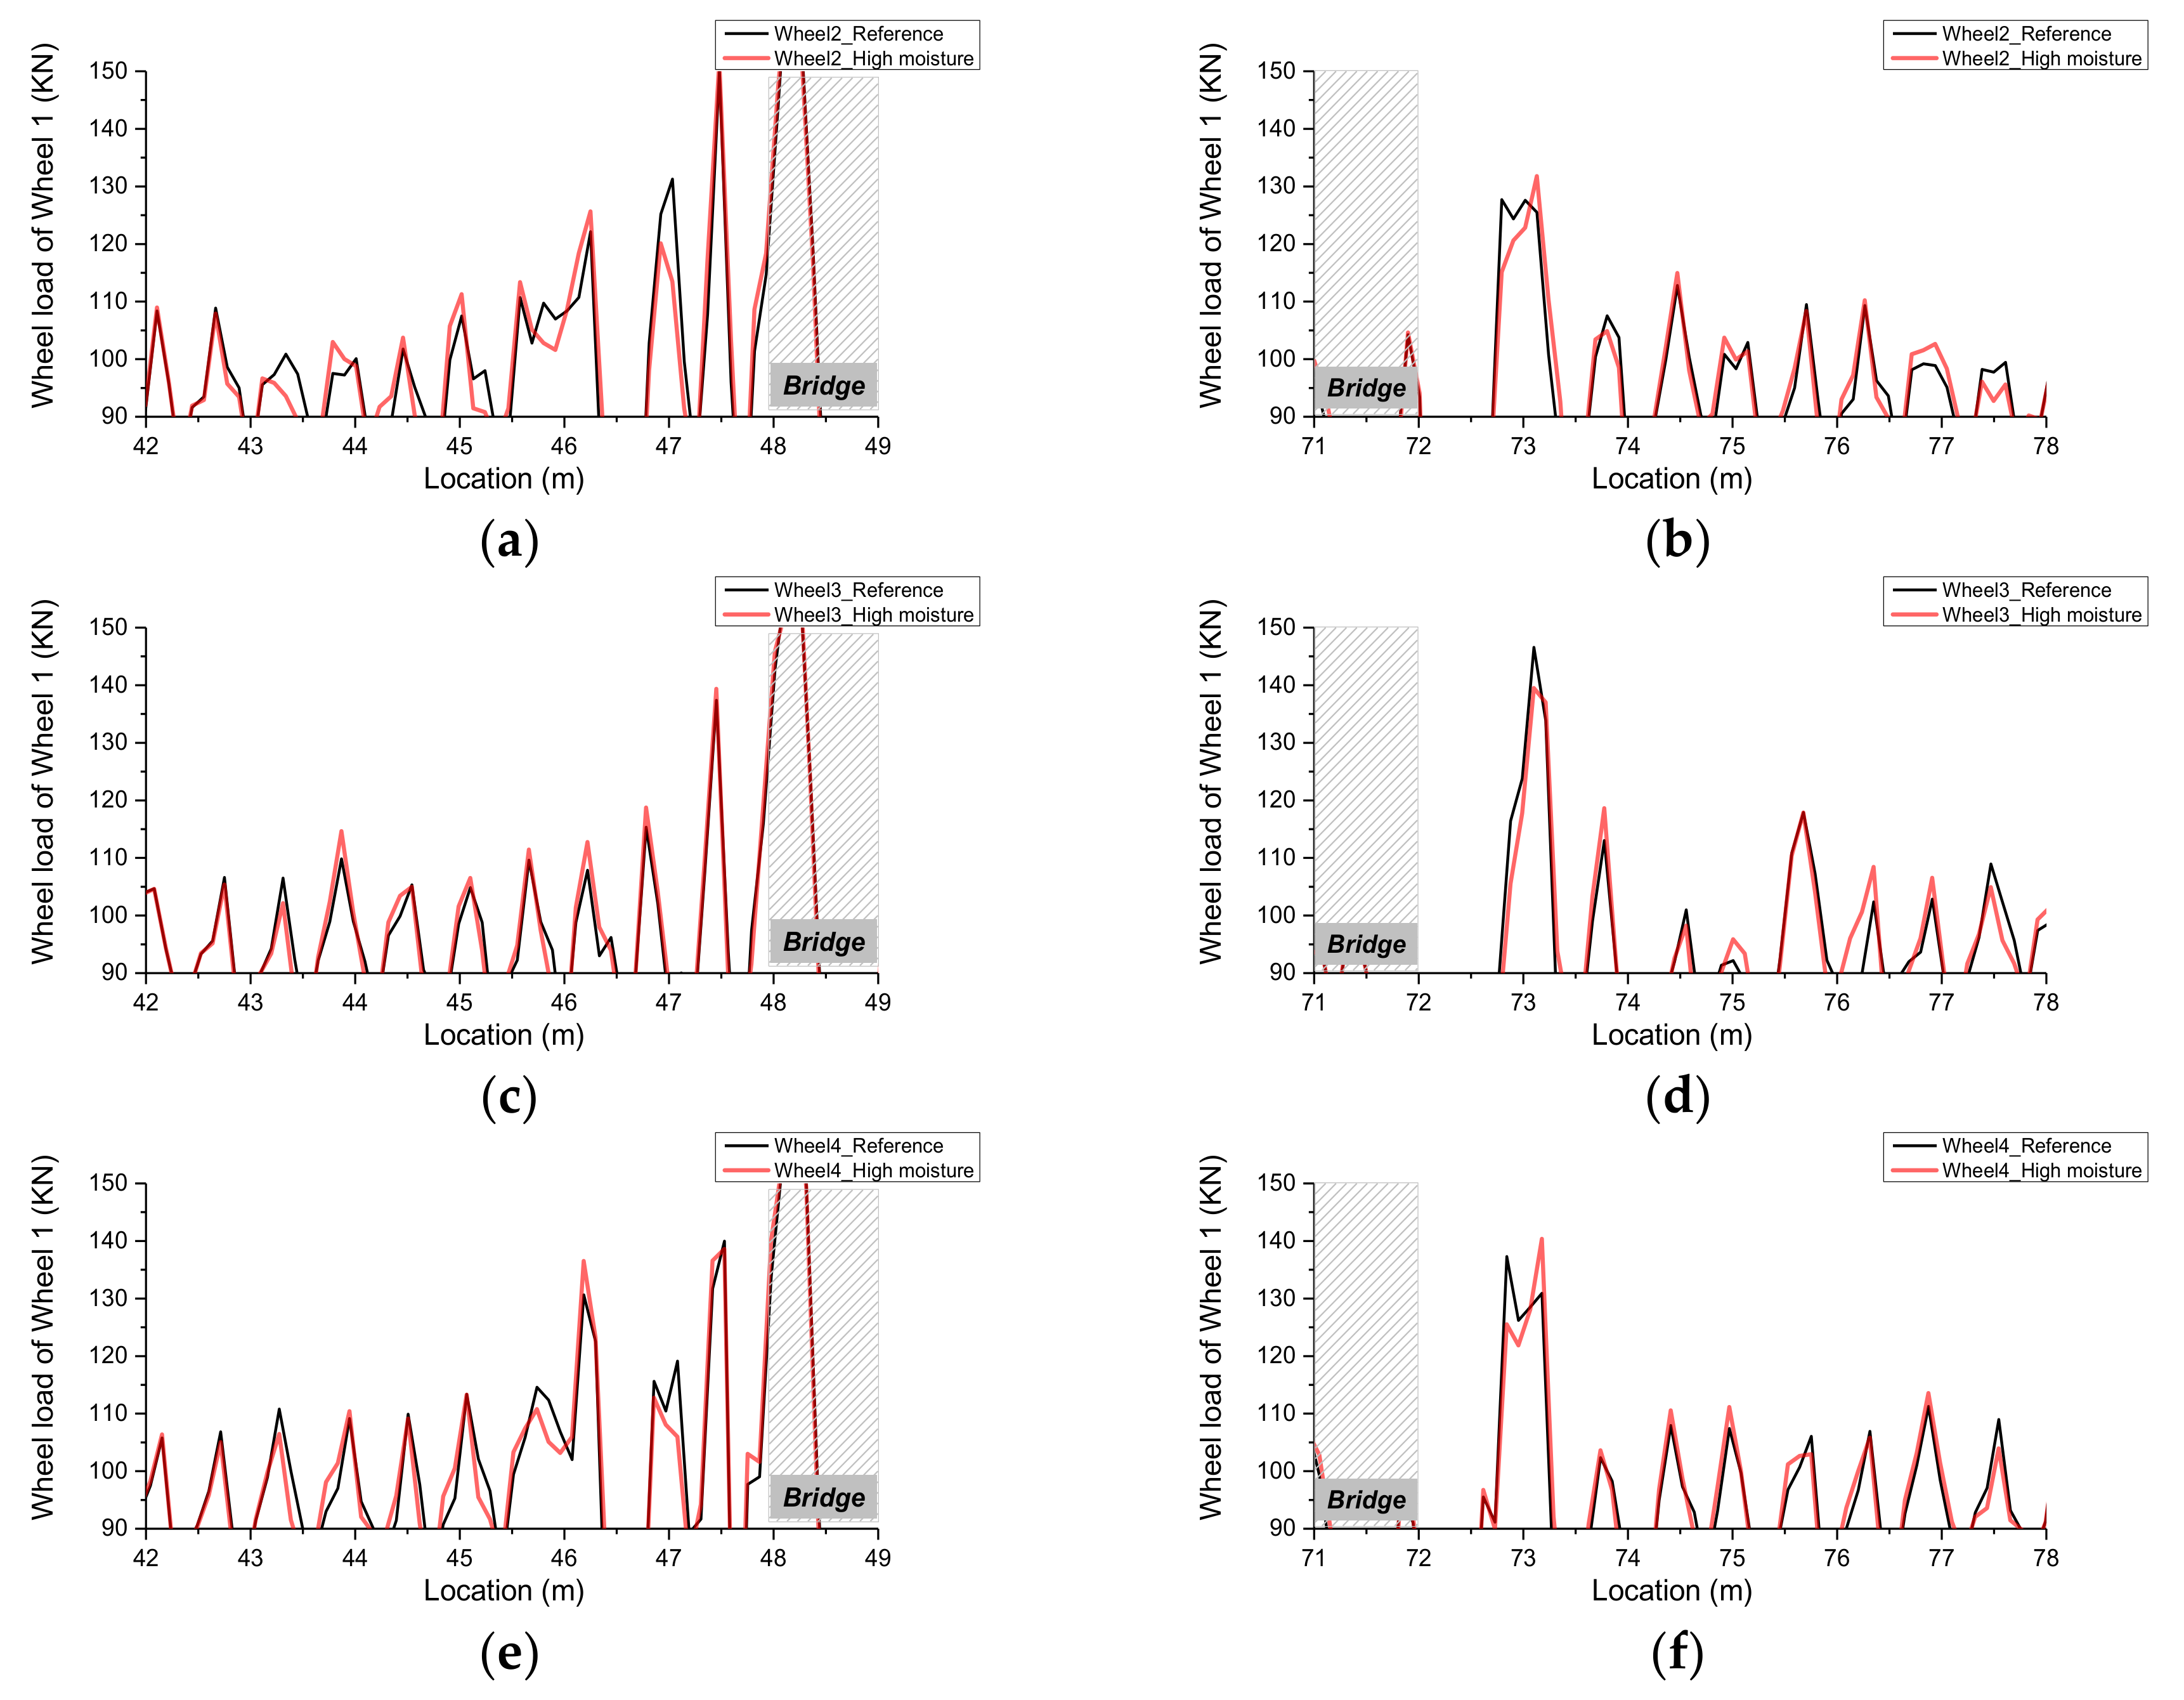
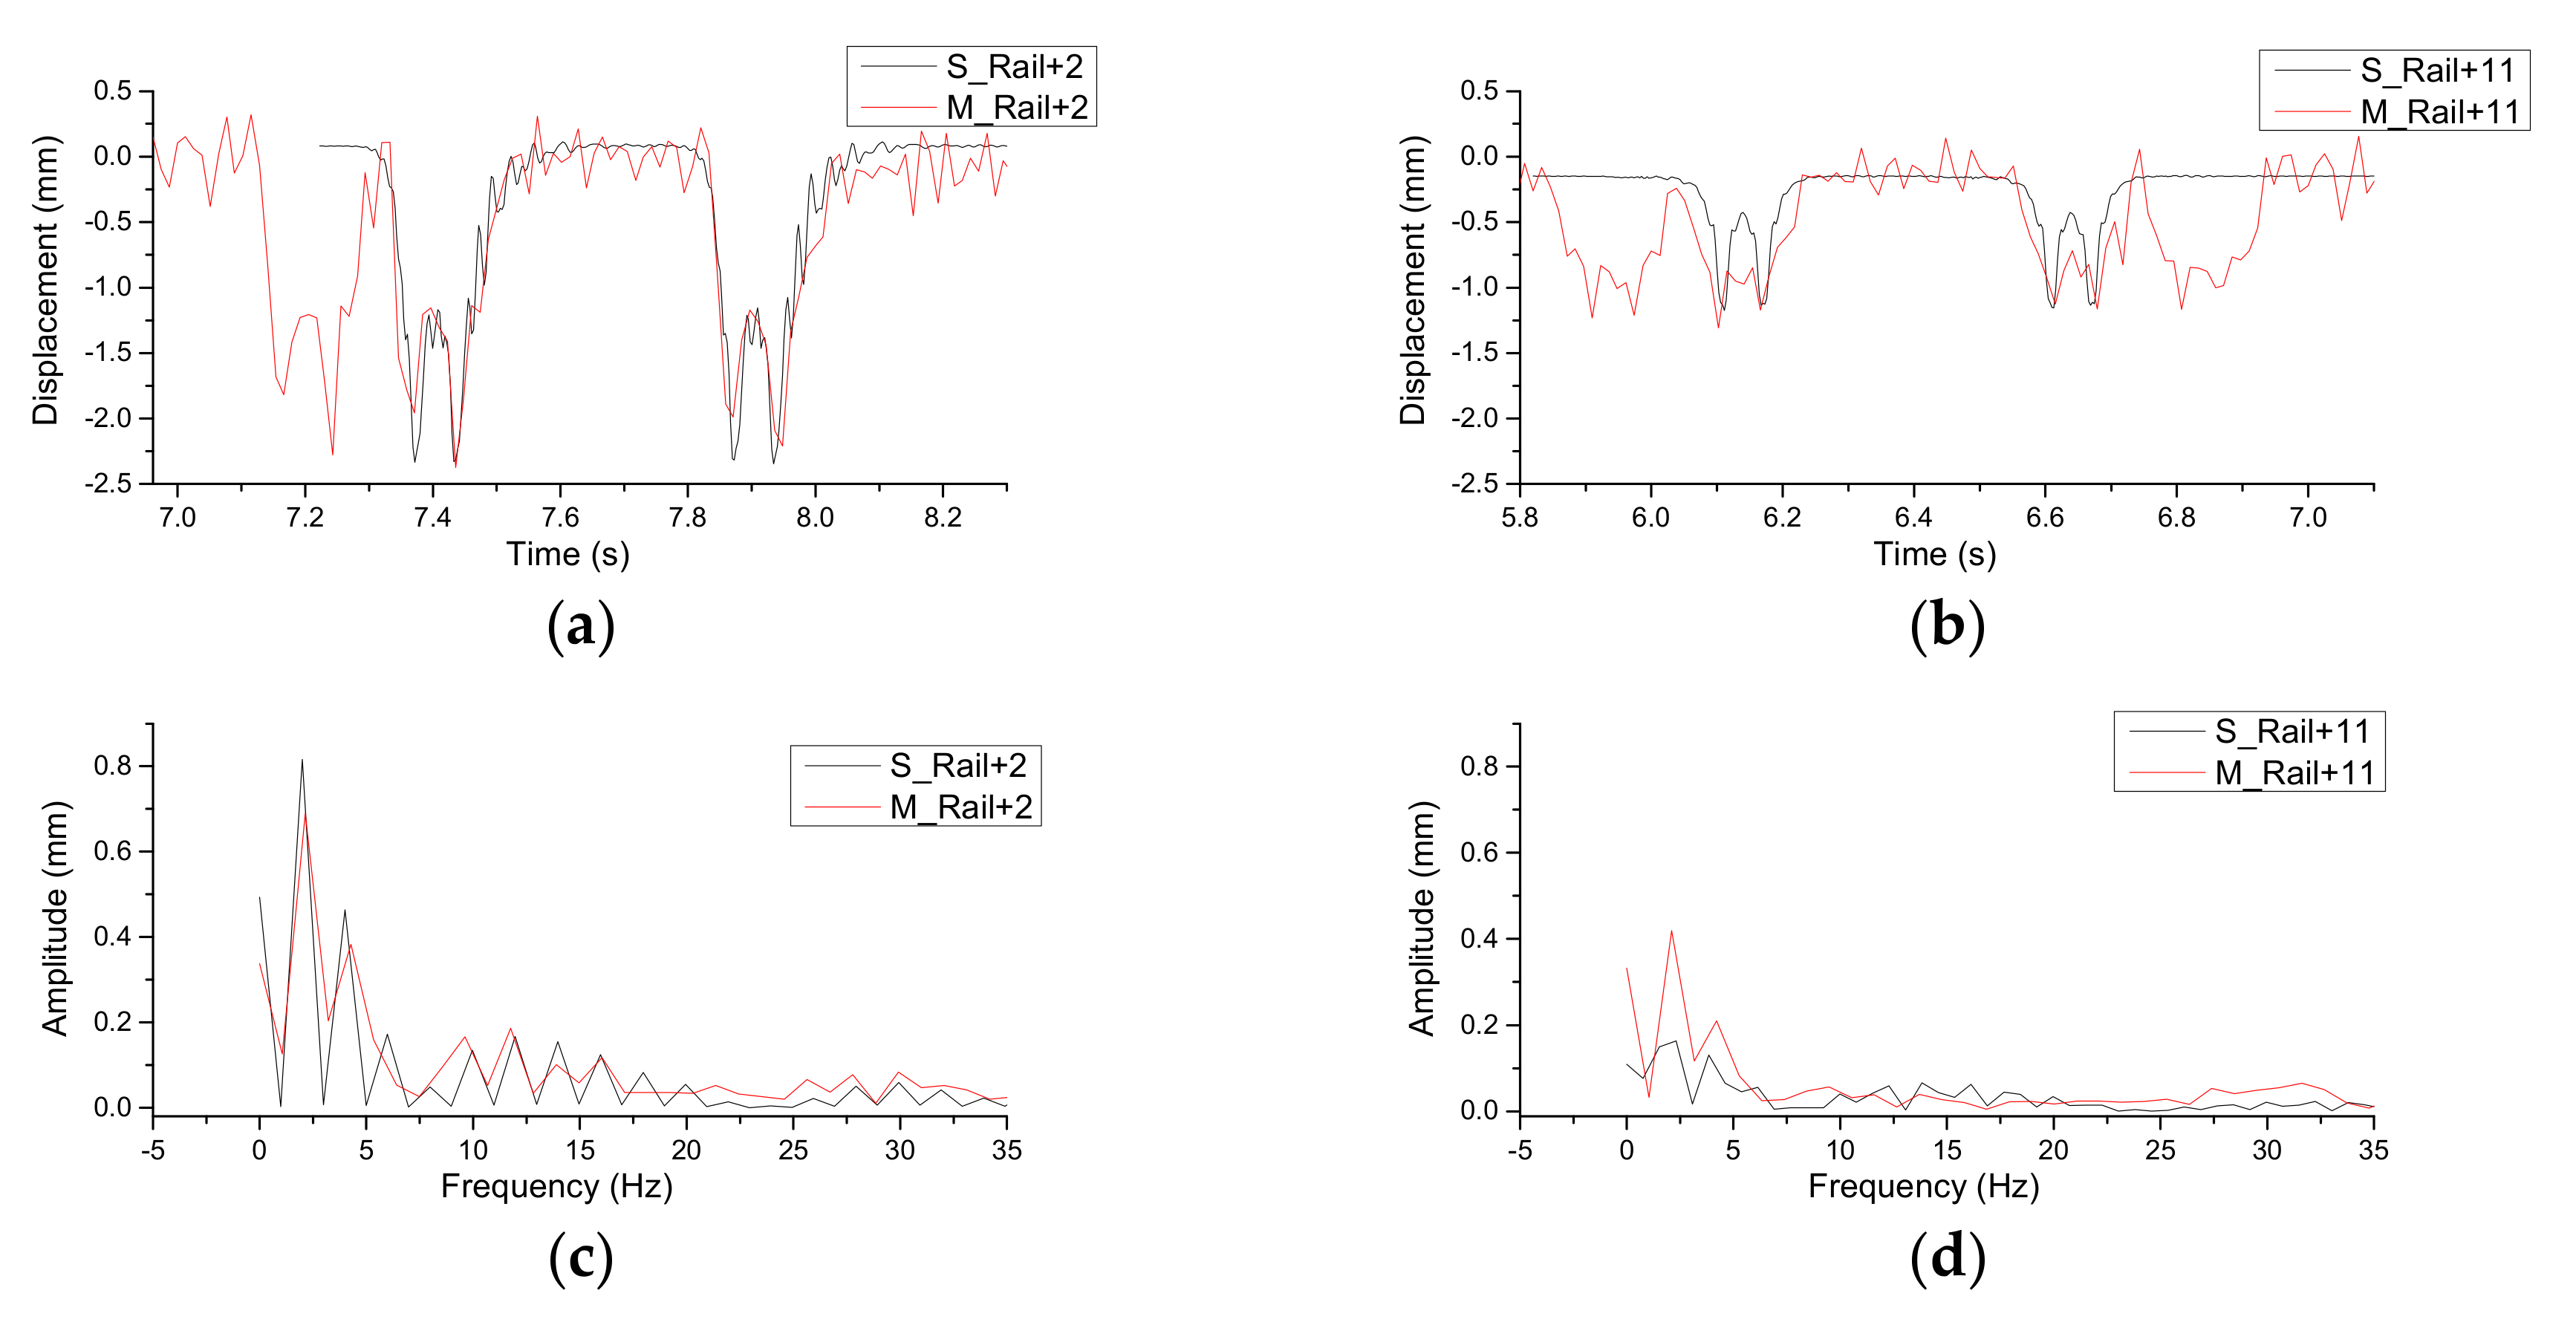
4.3. Results of the Finite Element Analysis
5. Discussion
- Changes in physical properties of tracks, such as: pore pressure increases under cyclic load causing increase in plastic strain accumulation, decrease in stiffness.
- Damage to track components, such as: subgrade attrition and slurry formation from ballast action; ballast degradation from slurry abrasion, chemical action, and freezing of water; sleeper attrition from slurry abrasion.
6. Conclusions
Acknowledgments
Author Contributions
Conflicts of Interest
References
- Li, D.; Davis, D. Transition of Railroad Bridge Approaches. J. Geotech. Geoenviron. Eng. 2005, 131, 1392–1398. [Google Scholar] [CrossRef]
- Coelho, B.; Hölscher, P.; Priest, J.; Powrie, W.; Barends, F. An assessment of transition zone performance. Proc. Inst. Mech. Eng. Part F J. Rail Rapid Transit 2011, 225, 129–139. [Google Scholar] [CrossRef]
- Stark, T.D.; Wilk, S.T. Root cause of differential movement at bridge transition zones. Proc. Inst. Mech. Eng. Part F J. Rail Rapid Transit 2015, 230, 1257–1269. [Google Scholar] [CrossRef]
- Markine, V.; Wang, H.; Shevtsov, I. Experimental Analysis of the Dynamic Behaviour of a Railway Track in Transition Zones. In Proceedings of the Ninth International Conference on Engineering Computational Technology, Naples, Italy, 2–5 September 2014; Iványi, P., Topping, B.H.V., Eds.; Paper 3. Civil-Comp Press: Stirlingshire, UK, 2014. [Google Scholar]
- European Rail Research Institute. Embankment Structure Transition: State of the Art Report; European Rail Research Institute: Utrecht, The Netherlands, 1999; Available online: https://books.google.nl/books?id=Sd_mtgAACAAJ (accessed on 10 November 2017).
- Nicks, J.E. The Bump at the End of the Railway Bridge. Ph.D. Thesis, Texas A&M University, College Station, TX, USA, 2009. [Google Scholar]
- Le Pen, L.; Watson, G.; Powrie, W.; Yeo, G.; Weston, P.; Roberts, C. The behaviour of railway level crossings: Insights through field monitoring. Transp. Geotech. 2014, 1, 201–213. [Google Scholar] [CrossRef]
- Wang, H.; Markine, V.L.; Shevtsov, I.Y.; Dollevoet, R. Analysis of the Dynamic Behaviour of a Railway Track in Transition Zones with Differential Settlement. In Proceedings of the 2015 Joint Rail Conference, San Jose, CA, USA, 23–26 March 2015; p. 7. [Google Scholar]
- Paixao, A.; Fortunato, E.; Calcada, R. Design and construction of backfills for railway track transition zones. Proc. Inst. Mech. Eng. Part F J. Rail Rapid Transit 2013, 229, 58–70. [Google Scholar] [CrossRef]
- Alves Ribeiro, C.; Paixão, A.; Fortunato, E.; Calçada, R. Under sleeper pads in transition zones at railway underpasses: Numerical modelling and experimental validation. Struct. Infrastruct. Eng. 2014, 11, 1432–1449. [Google Scholar] [CrossRef]
- Coelho, B.Z. Dynamics of Railway Transition Zones in Soft Soils. Ph.D. Thesis, University of Porto, Porto, Portugal, 2011. [Google Scholar]
- Lei, X.; Zhang, B. Influence of track stiffness distribution on vehicle and track interactions in track transition. Proc. Inst. Mech. Eng. Part F J. Rail Rapid Transit 2010, 224, 592–604. [Google Scholar] [CrossRef]
- Gallage, C.; Dareeju, B.; Dhanasekar, M. State-of-the-art: Track degradation at bridge transitions. In Proceedings of the 4th International Conference on Structural Engineering and Construction Management, Kandy, Sri Lanka, 13–15 December 2013. [Google Scholar]
- Hölscher, P.; Meijers, P. Literature Study of Knowledge and Experience of Transition Zones; Technical Report; GeolDelft: Delft, The Netherlands, 2007. [Google Scholar]
- Read, D.; Li, D. Design of Track Transitions; Transit Cooperative Research Program: Research Results Digest 79; Federal Transit Administration: Pueblo, CO, USA, 2006.
- Thompson, D.R.; Woodward, P.K. Track stiffness management using the XiTRACK GeoComposite. Perm. Way Inst. J. Rep. Proc. 2004, 122, 135–138. [Google Scholar]
- Kerr, A.D.; Moroney, B.E. Track Transition Problems and Remedies; Bulletin 742; American Railway Engineering Association: Landover, MD, USA, 1993; Volume 94, p. 25. [Google Scholar]
- Banimahd, M.; Woodward, P.K.; Kennedy, J.; Medero, G.M. Behaviour of train–track interaction in stiffness transitions. Proc. Inst. Civ. Eng.-Transp. 2012, 165, 205–214. [Google Scholar] [CrossRef]
- Dahlberg, T. Railway Track Stiffness Variations-Consequences and Countermeasures. Int. J. Civ. Eng. 2010, 8, 1–12. [Google Scholar]
- Hunt, H. Settlement of railway track near bridge abutments. Proc. Inst. Civil Eng. Transp. 1997, 123, 68–73. [Google Scholar]
- Frohling, R.D.; Scheffel, H.; EbersÖHn, W. The Vertical Dynamic Response of a Rail Vehicle caused by Track Stiffness Variations along the Track. Veh. Syst. Dyn. 1996, 25 (Suppl. 1), 175–187. [Google Scholar] [CrossRef]
- Li, D.; Otter, D.; Carr, G. Railway bridge approaches under heavy axle load traffic: Problems, causes, and remedies. Proc. Inst. Mech. Eng. Part F J. Rail Rapid Transit 2010, 224, 383–390. [Google Scholar] [CrossRef]
- Varandas, J.N.; Hölscher, P.; Silva, M.A.G. Dynamic behaviour of railway tracks on transitions zones. Comput. Struct. 2011, 89, 1468–1479. [Google Scholar] [CrossRef]
- Sasaoka, C.; Davis, D. Long Term Performance of Track Transition Solutions in Revenue Service; Technology Digest TD-05-036; Association of American Railroads: Washington, WA, USA, 2005. [Google Scholar]
- Hyslip, J.P.; Li, D.; McDaniel, C. Railway bridge transition case study. In Proceedings of the 8th International Conference on Bearing Capacity of Roads, Railways and Airfields (BCR2A’09), Champaign, IL, USA, 29 June–2 July 2009. [Google Scholar]
- Sañudo, R.; Dell’Olio, L.; Casado, J.A.; Carrascal, I.A.; Diego, S. Track transitions in railways: A review. Constr. Build. Mater. 2016, 112, 140–157. [Google Scholar] [CrossRef]
- Lekarp, F.; Isacsson, U.; Dawson, A. State of the art. I: Resilient response of unbound aggregates. J. Transp. Eng. 2000, 126, 66–75. [Google Scholar] [CrossRef]
- Stark, T.D.; Wilk, S.T.; Thompson, H.B.; Sussmann, T.R.; Baker, M.; Ho, C.L. Evaluating Fouled Ballast Using Seismic Surface Waves. In Proceedings of the 2016 Joint Rail Conference, Columbia, SC, USA, 12–15 April 2016; American Society of Mechanical Engineers: New York, NY, USA, 2016. [Google Scholar]
- Indraratna, B.; Ionescu, D.; Christie, D.; Chowdhury, R. Compression and degradation of railway ballast under one-dimensional loading. Aust. Geomech. 1997, 32, 48–61. [Google Scholar]
- Indraratna, B.; Khabbaz, H.; Salim, W.; Christie, D. Geotechnical Properties of Ballast and the Role of Geosynthetics; Institution of Civil Engineers, Thomas Telford Ltd.: London, UK, 2006; Available online: http://hdl.handle.net/10453/9243 (accessed on 1 August 2017).
- Han, X.; Selig, E.T. Effects of fouling on ballast settlement. In Proceedings of the 6th International Heavy Haul Railway, Capetown, South Africa, 6–10 April 1997. [Google Scholar]
- Saarenketo, T. Electrical Properties of Road Materials and Subgrade Soils and the Use of Ground Penetrating Radar in traffic Infrastructure Surveys; University of Oulu: Oulu, Finland, 2006. [Google Scholar]
- Daniels, D.J. Ground Penetrating Radar, 2nd ed.; Institution of Electrical Engineers: London, UK, 2005. [Google Scholar]
- Wang, H.; Markine, V.L.; Dollevoet, R.P.B.J.; Shevtsov, I.Y. Improvement of train-track interaction in transition zones via reduction of ballast damage. In The Dynamics of Vehicles on Roads and Tracks; CRC Press: Boca Raton, FL, USA, 2016. [Google Scholar]
- Wang, H.; Markine, V. Finite element analysis of the dynamic behaviour of track transition zones during train passing processes. Veh. Syst. Dyn. 2017. submitted. [Google Scholar]
- Selig, E.T.; Waters, J.M. Track Geotechnology and Substructure Management; Thomas Telford: London, UK, 1994. [Google Scholar]
- Haynes, J.H.; Yoder, E.J. Effects of Repeated Loading on Gravel and Crushed Stone Base Course Materials Used in the AASHO Road Test; Purdue University: Lafayette, IN, USA, 1963; Available online: http://docs.lib.purdue.edu/cgi/viewcontent.cgi?article=2767&context=jtrp (accessed on 1 September 2017).
- Silvast, M.; Nurmikolu, A.; Wiljanen, B.; Levomaki, M. An inspection of railway ballast quality using ground penetrating radar in Finland. Proc. Inst. Mech. Eng. Part F J. Rail Rapid Transit 2010, 224, 345–351. [Google Scholar] [CrossRef]
- Silvast, M.; Nurmikolu, A.; Wiljanen, B.; Levomäki, M. Identifying frost-susceptible areas on Finnish railways using the ground penetrating radar technique. Proc. Inst. Mech. Eng. Part F J. Rail Rapid Transit 2013, 227, 3–9. [Google Scholar] [CrossRef]
- Saarenketo, T.; Silvast, M.; Noukka, J. Using GPR on railways to identify frost susceptible areas. In Proceedings of the International Conference and Exhibition Railway Engineering, London, UK, 30 April–1 May 2003. [Google Scholar]
- Hugenschmidt, J. Railway track inspection using GPR. J. Appl. Geophys. 2000, 43, 147–155. [Google Scholar] [CrossRef]
- Saarenketo, T. Electrical properties of water in clay and silty soils. J. Appl. Geophys. 1998, 40, 73–88. [Google Scholar] [CrossRef]
- Clark, M.R.; Gillespie, R.; Kemp, T.; McCann, D.M.; Forde, M.C. Electromagnetic properties of railway ballast. NDT E Int. 2001, 34, 305–311. [Google Scholar] [CrossRef]
- Silvast, M.; Levomäki, M.; Nurmikolu, A.; Noukka, J. NDT techniques in railway structure analysis. In Proceedings of the 7th World Congress on Railway Research, Montreal, QC, Canada, 4–8 June 2006. [Google Scholar]
- Vorster, D.J.; Gräbe, P.J. The use of ground-penetrating radar to develop a track substructure characterisation model. J. S. Afr. Inst. Civ. Eng. 2013, 55, 69–78. [Google Scholar]
- Saarenketo, T. Experiences of integrated GPR and Laser Scanner analysis. In Proceedings of the 17th Nordic Geotechnical Meeting Challenges in Nordic Geotechnic, Reykjavik, Iceland, 25–28 May 2016. [Google Scholar]
- Wang, H.; Markine, V.; Shevtsov, I. The Analysis of Degradation Mechanism in Track Transition Zones Using 3D Finite Element Model; Civil-Comp Press: Stirlingshire, UK, 2014; Available online: https://www.researchgate.net/publication/269198691_The_Analysis_of_Degradation_Mechanism_in_Track_Transition_Zones_using_3D_Finite_Element_Model (accessed on 1 July 2017).
- Lundqvist, A.; Dahlberg, T. Load impact on railway track due to unsupported sleepers. Proc. Inst. Mech. Eng. Part F J. Rail Rapid Transit 2005, 219, 67–77. [Google Scholar] [CrossRef]
- Shi, J.; Burrow, M.P.; Chan, A.H.; Wang, Y.J. Measurements and simulation of the dynamic responses of a bridge-embankment transition zone below a heavy haul railway line. Proc. Inst. Mech. Eng. Part F J. Rail Rapid Transit 2012, 227, 254–268. [Google Scholar] [CrossRef]
- Paixao, A.; Fortunato, E.; Calcada, R. A numerical study on the influence of backfill settlements in the train/track interaction at transition zones to railway bridges. Proc. Inst. Mech. Eng. Part F J. Rail Rapid Transit 2015, 230, 866–878. [Google Scholar] [CrossRef]
- Alves Ribeiro, C.; Calçada, R.; Delgado, R. Calibration and experimental validation of a dynamic model of the train-track system at a culvert transition zone. Struct. Infrastruct. Eng. 2017, 1–15. [Google Scholar] [CrossRef]
- Zhai, W.M.; Wang, K.Y.; Lin, J.H. Modelling and experiment of railway ballast vibrations. J. Sound Vib. 2004, 270, 673–683. [Google Scholar] [CrossRef]
- Varandas, J.N.; Holscher, P.; Silva, M.A. Settlement of ballasted track under traffic loading: Application to transition zones. Proc. Inst. Mech. Eng. Part F J. Rail Rapid Transit 2013, 228, 242–259. [Google Scholar] [CrossRef]
- Iwnick, S. Manchester Benchmarks for Rail Vehicle Simulation. Veh. Syst. Dyn. 1998, 30, 295–313. [Google Scholar] [CrossRef]
- Wan, C.; Markine, V.L.; Shevtsov, I.Y. Improvement of vehicle–turnout interaction by optimising the shape of crossing nose. Veh. Syst. Dyn. 2014, 52, 1517–1540. [Google Scholar] [CrossRef]
- Esveld, C. Modern Railway Track; MRT-Productions: Zaltbommel, The Netherlands, 2001; Volume 385, Available online: https://books.google.fi/books/about/Modern_Railway_Track.html?id=DYaQQgAACAAJ&redir_esc=y (accessed on 1 July 2017).
- Sato, Y. Japanese Studies on Deterioration of Ballasted Track. Veh. Syst. Dyn. 1995, 24, 197–208. [Google Scholar] [CrossRef]
- Dahlberg, T. Some railroad settlement models—A critical review. Proc. Inst. Mech. Eng. Part F J. Rail Rapid Transit 2001, 215, 89–300. [Google Scholar] [CrossRef]
- Indraratna, B.; Nimbalkar, S.; Christie, D.; Rujikiatkamjorn, C.; Vinod, J. Field assessment of the performance of a ballasted rail track with and without geosynthetics. J. Geotech. Geoenviron. Eng. 2010, 136, 907–917. [Google Scholar] [CrossRef]
- Hallquist, J. LS-DYNA Theoretical Manual; Livemore Software Technology Corporation: Livermore, CA, USA, 1998. [Google Scholar]
- Kreiser, D.; Jia, S.X.; Han, J.J.; Dhanasekar, M. A nonlinear damage accumulation model for shakedown failure. Int. J. Fatigue 2007, 29, 1523–1530. [Google Scholar] [CrossRef]
- Anderson, W.F.; Key, A.J. Model testing of two-layer railway track ballast. J. Geotech. Geoenviron. Eng. 2000, 126, 317–323. [Google Scholar] [CrossRef]
- ProRail. Constructive Measures to Prevent Settlement of the Track (in Dutch Constructieve Maatregelen ter Voorkoming Van Ontoelaatbare Zakkingen Van Het Spoor); ProRail: Utrecht, The Netherlands, 2010. [Google Scholar]
- Varandas, J.N. Long-Term Behaviour of Railway Transitions under Dynamic Loading Application to Soft Soil Sites. Ph.D. Thesis, Universidade Nova de Lisboa, Lisbon, Protugal, 2013. [Google Scholar]


| Material | Dielectric Constant | Velocity (m/s) |
|---|---|---|
| Air | 1.0 | 3 × 10⁸ |
| Dry spent ballast | 4.3 | 1.45 × 10⁸ |
| Wet spent ballast (5% water) | 7.8 | 1.07 × 10⁸ |
| Saturated spent ballast | 38.5 | 0.58 × 10⁸ |
| Water | 81.0 | 0.33 × 10⁸ |
| Parameter | Value |
|---|---|
| Sleeper Elastic Modulus (Pa) | 3.65 × 10¹⁰ |
| Sleeper Poisson’s ratio | 0.167 |
| Ballast Elastic Modulus (Pa) | 1.20 × 10⁸ |
| Ballast Poisson’s ratio | 0.250 |
| Subgrade Elastic Modulus (Pa) | 1.80 × 10⁸ |
| Subgrade Poisson’s ratio | 0.250 |
| Concrete bridge Elastic Modulus (Pa) | 3.50 × 10¹⁰ |
| Concrete bridge Poisson’s ratio | 0.167 |
| Fastening system horizontal stiffness (N/m) | 1.5 × 10⁶ |
| Fastening system horizontal damping (N*s/m) | 5.00 × 10⁴ |
| Fastening system longitudinal stiffness (N/m) | 1.5 × 10⁶ |
| Fastening system longitudinal damping (N*s/m) | 5.00 × 10⁴ |
| Fastening system vertical (compression) stiffness (N/m) | 1.20 × 10⁸ |
| Fastening system vertical (compression) damping (N*s/m) | 5.00 × 10⁴ |
| Fastening system vertical (tension) stiffness (N/m) | 1.20 × 10¹¹ |
| Fastening system vertical (tension) damping (N*s/m) | 5.00 × 10⁴ |
| Distance between wheels (m) | 2.5 |
| Distance between axles (m) | 20.0 |
| Length of train body (m) | 23.0 |
| Primary suspension stiffness (N/m) | 4.25 × 10⁵ |
| Primary suspension damping (N*s/m) | 1.00 × 10⁶ |
| Secondary suspension stiffness (N/m) | 4.68 × 10⁵ |
| Secondary suspension damping (N*s/m) | 6.50 × 10⁴ |
| Secondary suspension Bending stiffness (Nm/rad) | 1.05 × 10⁴ |
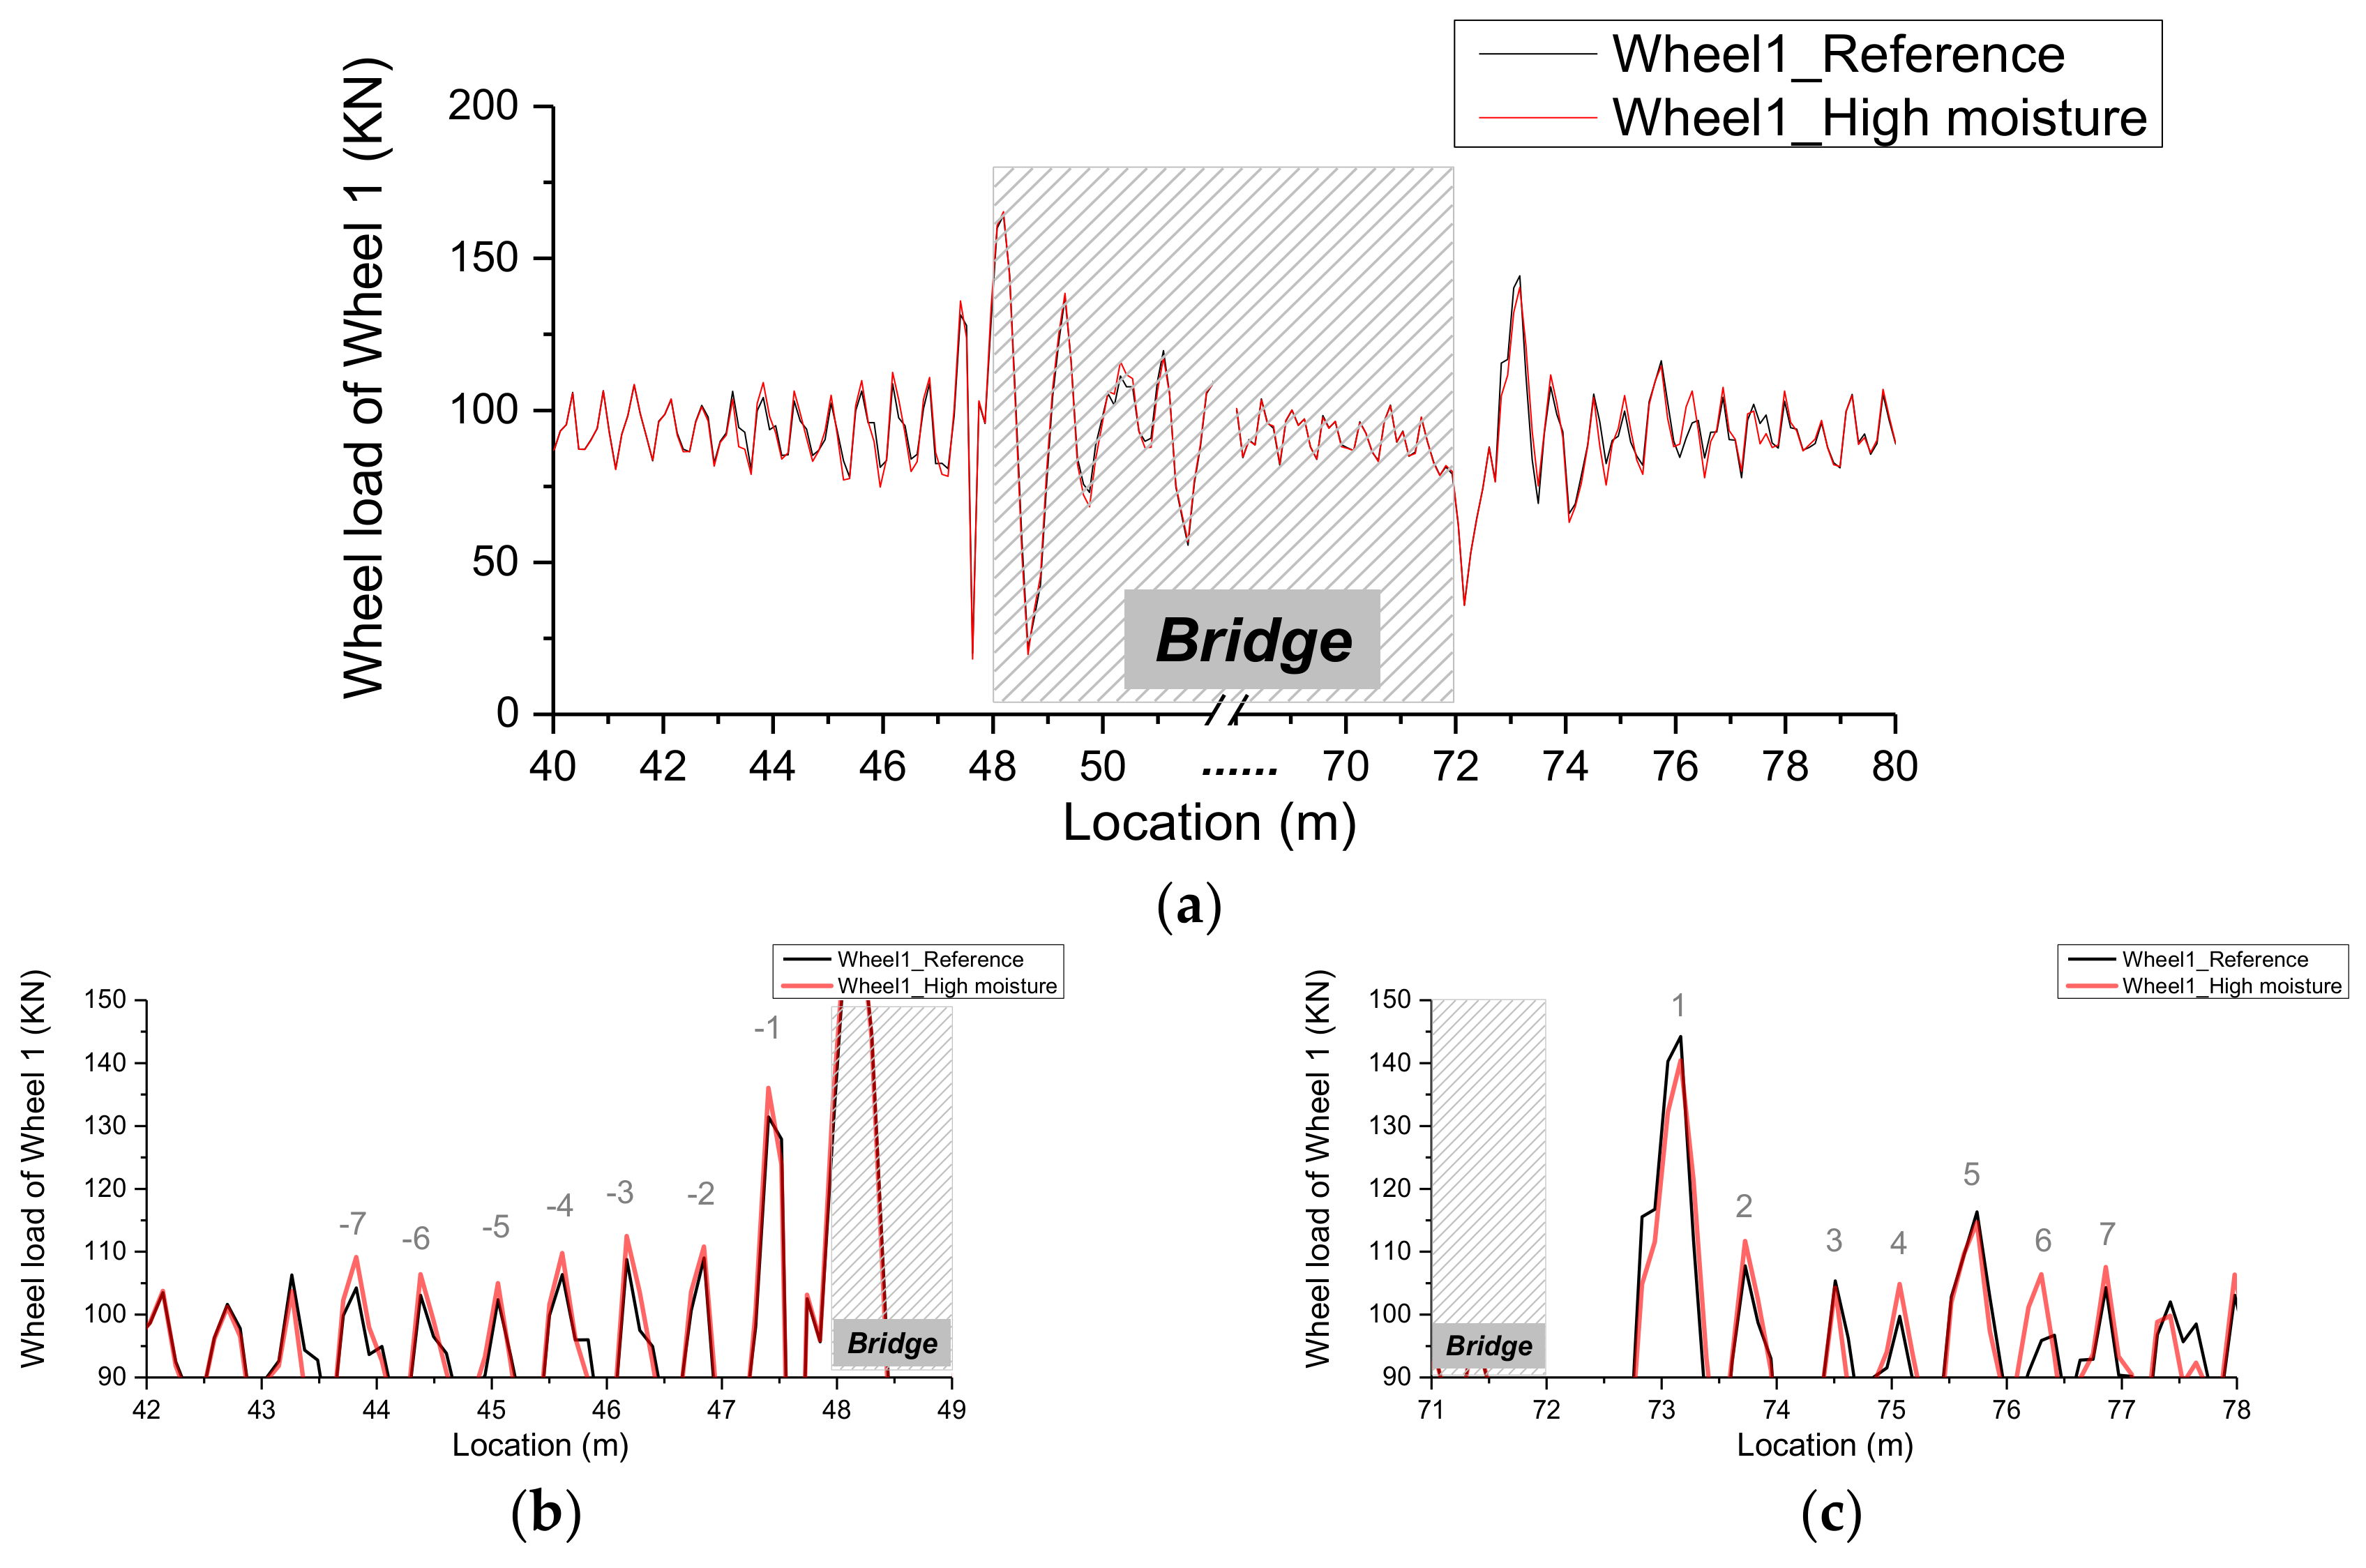
| Peak | Wheel 1 | Wheel 2 | Wheel 3 | Wheel 4 |
|---|---|---|---|---|
| −7 | 4.7 | 2.9 | 4.4 | 1.1 |
| −6 | 3.2 | 1.9 | −0.3 | −0.7 |
| −5 | 2.5 | 3.5 | 1.6 | −0.1 |
| −4 | 3.2 | 2.4 | 1.7 | −3.3 |
| −3 | 3.4 | 2.9 | 4.5 | 4.5 |
| −2 | 1.6 | −8.5 | 3.0 | −5.4 |
| −1 | 3.5 | 1.0 | 1.4 | −1.0 |
| 1 | −2.6 | 3.2 | −4.8 | 2.2 |
| 2 | 3.7 | −2.5 | 5.0 | 1.2 |
| 3 | −1.0 | 1.9 | −2.7 | 2.4 |
| 4 | 5.1 | 0.8 | 4.0 | 3.4 |
| 5 | −1.4 | −1.0 | 0.0 | −2.9 |
| 6 | 10.0 | 0.8 | 5.9 | −1.0 |
| 7 | 3.1 | 3.5 | 3.6 | 2.1 |
| Average | 2.6 | 0.8 | 1.7 | 0.2 |
© 2017 by the authors. Licensee MDPI, Basel, Switzerland. This article is an open access article distributed under the terms and conditions of the Creative Commons Attribution (CC BY) license (http://creativecommons.org/licenses/by/4.0/).
Share and Cite
Wang, H.; Silvast, M.; Markine, V.; Wiljanen, B. Analysis of the Dynamic Wheel Loads in Railway Transition Zones Considering the Moisture Condition of the Ballast and Subballast. Appl. Sci. 2017, 7, 1208. https://doi.org/10.3390/app7121208
Wang H, Silvast M, Markine V, Wiljanen B. Analysis of the Dynamic Wheel Loads in Railway Transition Zones Considering the Moisture Condition of the Ballast and Subballast. Applied Sciences. 2017; 7(12):1208. https://doi.org/10.3390/app7121208
Chicago/Turabian StyleWang, Haoyu, Mika Silvast, Valeri Markine, and Bruce Wiljanen. 2017. "Analysis of the Dynamic Wheel Loads in Railway Transition Zones Considering the Moisture Condition of the Ballast and Subballast" Applied Sciences 7, no. 12: 1208. https://doi.org/10.3390/app7121208