Experimental and Numerical Investigation of Convective Heat Transfer of Supercritical Carbon Dioxide at Low Mass Fluxes

1
State Key Laboratory of Multiphase Flow in Power Engineering, Xi’an Jiaotong University, Xi’an 710049, China
2
Nuclear Engineering Department, North Carolina State University, Raleigh, NC 27606, USA
*
Author to whom correspondence should be addressed.
Appl. Sci. 2017, 7(12), 1260; https://doi.org/10.3390/app7121260
Submission received: 30 September 2017
/
Revised: 28 November 2017
/
Accepted: 29 November 2017
/
Published: 4 December 2017
(This article belongs to the Special Issue The Applications of Supercritical Carbon Dioxide)
Abstract
:Featured Application
Supercritical carbon dioxide Brayton cycle, geothermal system, nuclear reactor.
Abstract
Significant differences in the heat transfer behaviors of supercritical carbon dioxide in a heated channel have been observed at different mass fluxes. At low mass fluxes, a unique heat transfer characteristic is accompanied by a monotonously smooth temperature variation without any temperature peak, even though the ratio of heat flux to mass flux (q/G) is high. In this study, experimental and numerical investigations explore the hidden mechanism of the peculiar heat transfer characteristics of supercritical carbon dioxide at low mass fluxes in vertically upward tubes with inside diameters (ID) of 5 mm. The range of operating conditions examined within the study include a mass flux (G) between 0–200 kg/m2s, and a heat flux (q) of up to 120 kW/m2. The parametric effects within these experimental conditions were analyzed on the basis of the obtained heat transfer data. Furthermore, a qualitative modeling force analysis and quantitative numerical simulation of vertical flow at low mass flux reveal the heat transfer mechanism for these temperature profiles. In addition, the distribution of flow parameters and thermo-physical properties (such as shear stress, density, and specific heat) in the near-wall region were also studied. It is found that the heat transfer behavior of supercritical CO2 at low mass flux is similar to “film boiling” at subcritical pressure, where “vapor-like” fluid occupies the sublayer region. Due to reduced buoyancy, the fluid does not cause enough mixing/instability to bring it to the bulk flow.
1. Introduction
Supercritical carbon dioxide’s (s-CO2) Brayton cycle has attracted much research attention due to its superior cycle efficiency, compact system structure, and low engineering cost. Furthermore, s-CO2 is a potential working fluid, and due to its high thermal efficiency and minimal initial cost, it has become the preferred choice for enhanced geothermal systems and nuclear reactors in Generation IV nuclear power plants. In such advanced energy systems, the unique thermo-hydraulic characteristics of supercritical fluids have undoubtedly become one of the major concerns.
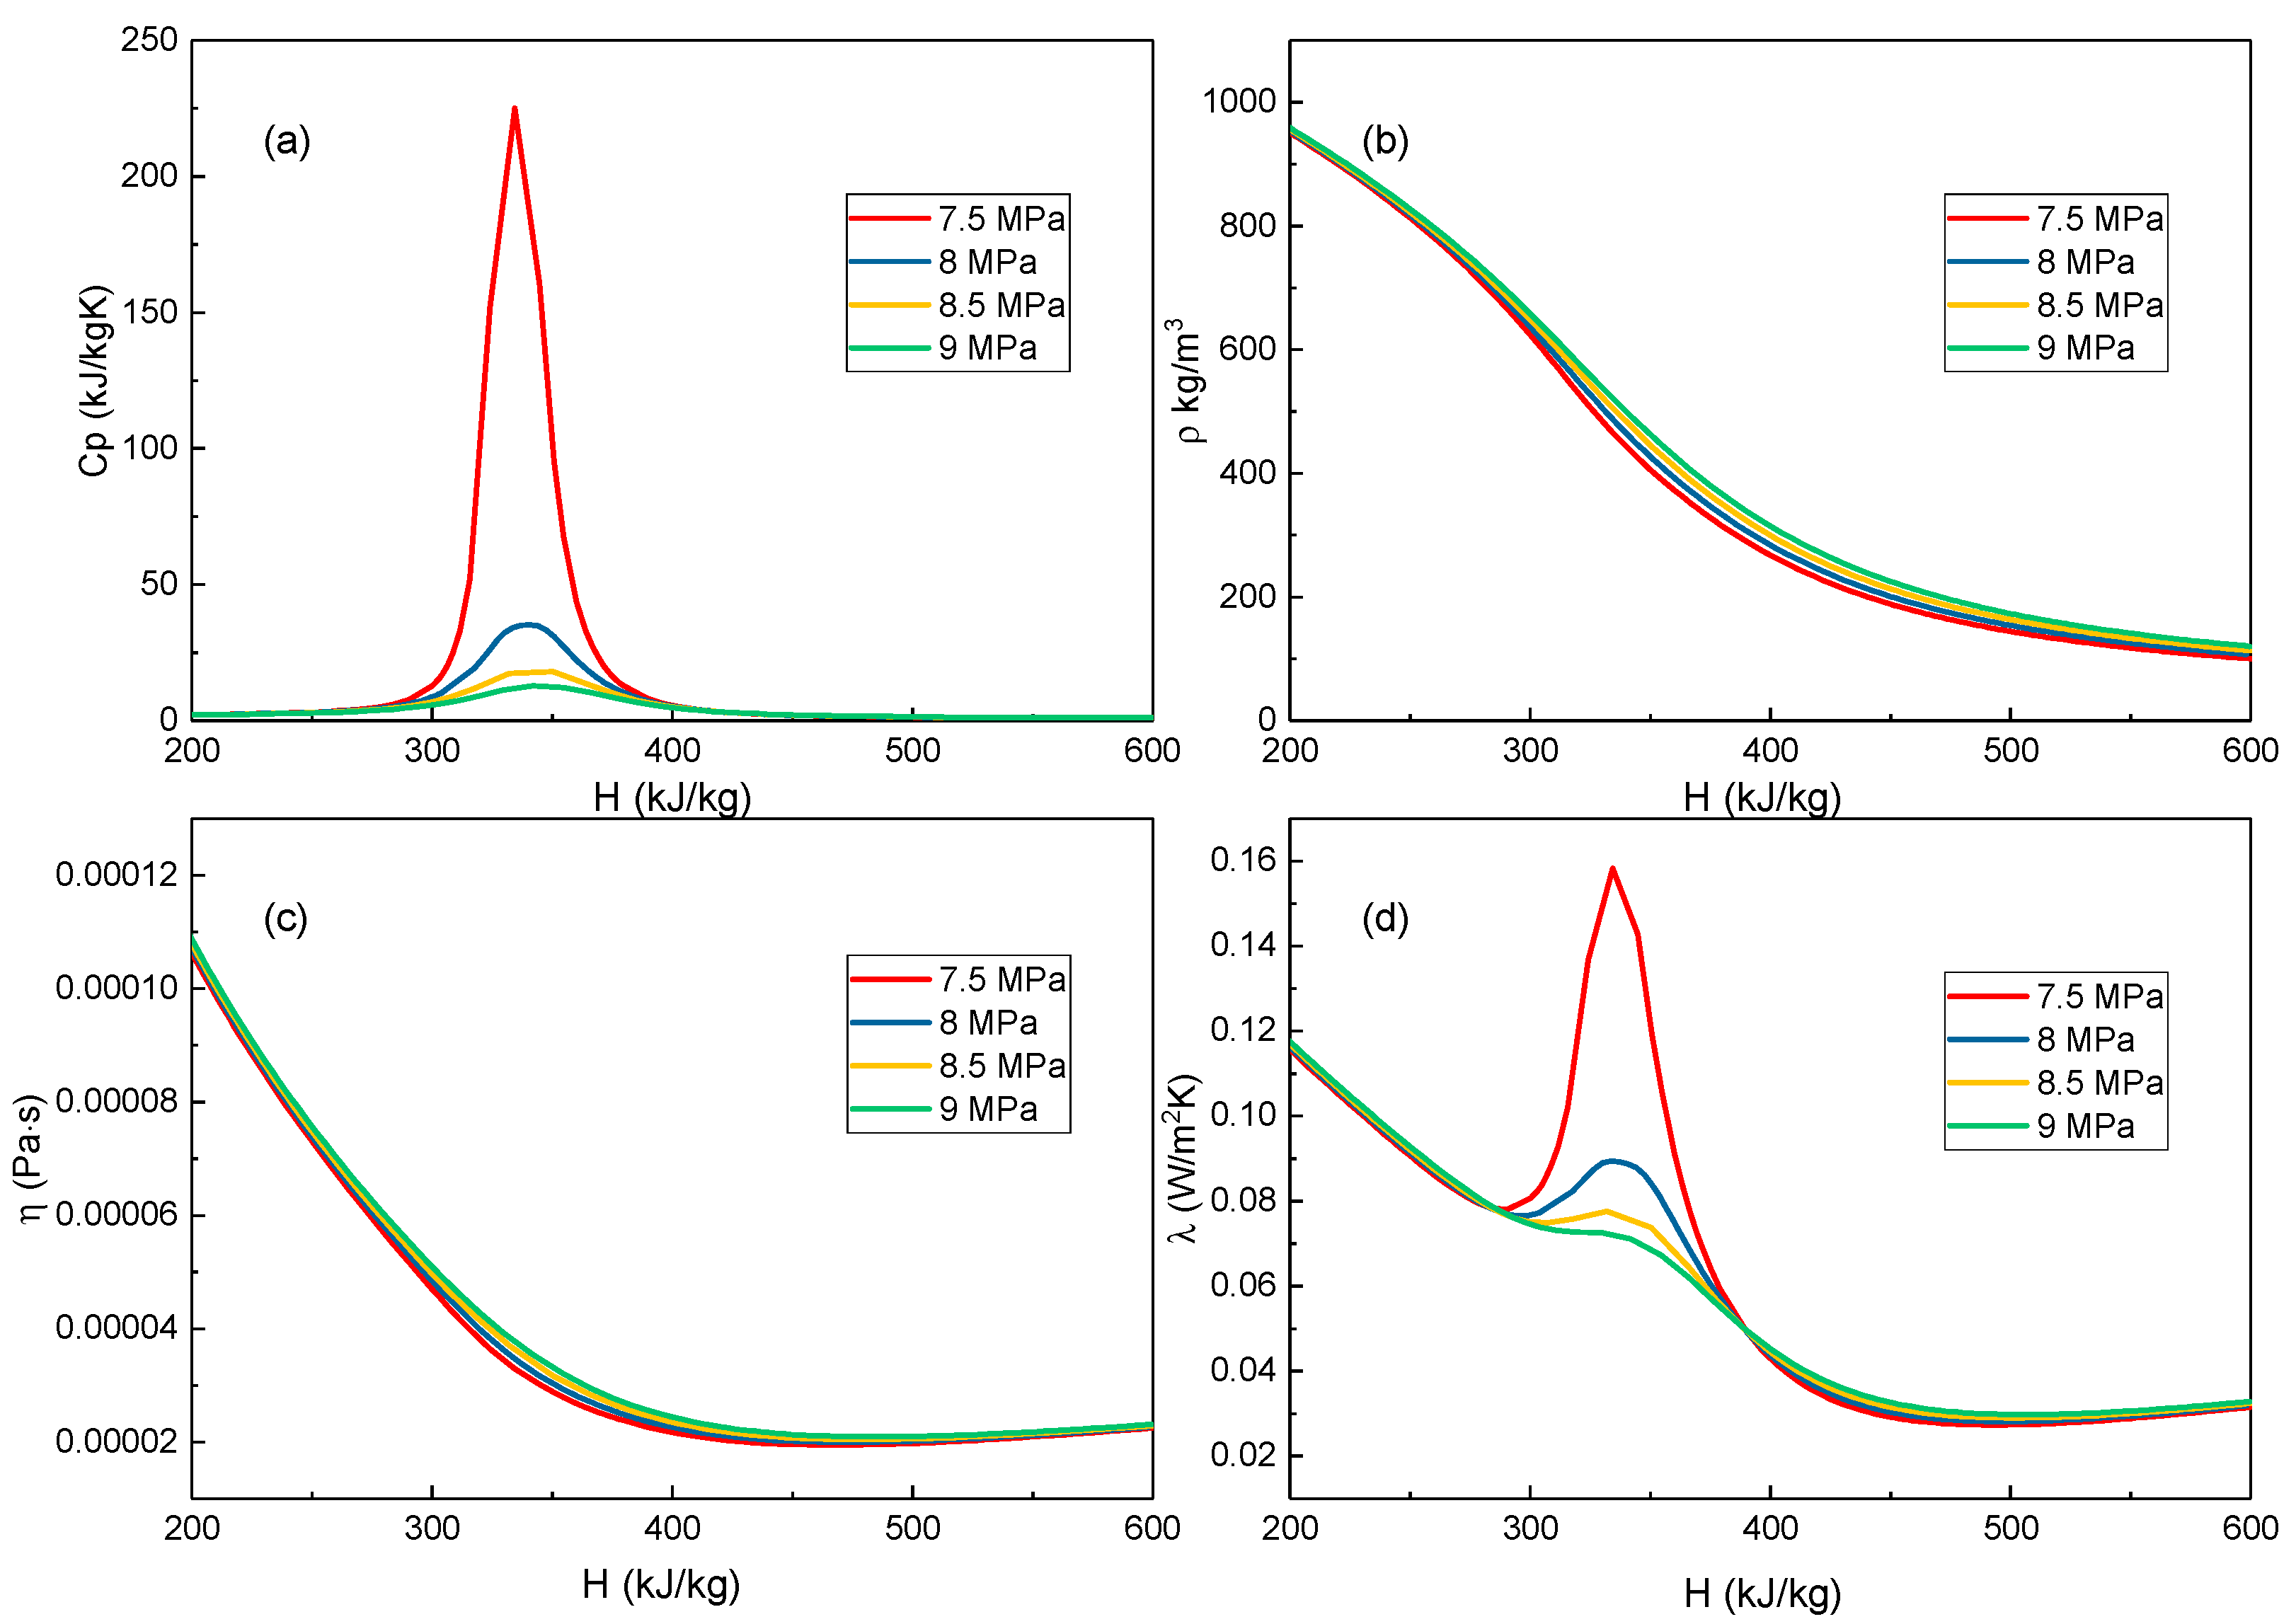
It is well known that upon exceeding the critical point, the boundaries between the gas and liquid phases will disappear. The thermo-physical properties of certain fluids exhibit drastic and fast variations with temperatures, particularly within a narrow temperature range close to the pseudocritical temperature Tpc(p), as shown in Figure 1 (for CO2). When the CO2 enthalpy increased from 300 kJ/kg to 500 kJ/kg, the density decreased to about one third. Fluid with strongly temperature-dependent density variation in a circular tube may undergo intensified buoyancy effect for convective heat transfer. The change in viscosity, thermal conductivity, and specific heat of fluid also have significant influences on heat transfer, making the heat transfer characteristic of supercritical fluids (SCFs) more complicated.
Since the 1960s, many studies have been conducted to understand heat transfer in SCFs’ flowing tubes, including review papers, such as those by Jackson [1], Duffey and Pioro [2], and Cheng et al. [3]. Some primary sources of experimental heat transfer data for carbon dioxide flowing inside the vertical and horizontal circular tubes before 2007 are listed in Pioro and Duffey [4]. Bae and Kim [5,6] conducted extensive experiments on heat transfer of vertically upward flowing CO2 under supercritical pressure in tubes (internal diameters (ID) of 4.4 mm and 9.0 mm), and proposed a new correlation for heat transfer by CO2. Xu et al. [7,8] experimentally analyzed the turbulent convective heat transfer of CO2 flowing in a helical pipe at near-critical pressure with a constant heat flux boundary condition, and discussed the effect of inclination angles on the heat transfer of supercritical CO2 in a 0.5 mm diameter tube. Bae et al. [9,10] investigated the turbulent heat transfer of CO2 at supercritical pressure flowing in heated vertical tubes using direct numerical simulation (DNS) at the inlet Reynolds numbers of 5400 and 8900. Nemati et al. [11] and Peeters [12] studied the turbulent attenuation and the effect of thermal boundary conditions on the development of turbulent pipe flows with fluids at the inlet Reynolds numbers of 360 and 8000. Chen [13] numerically studied the heat transfer and various convection structures of CO2 flow in microchannels. Cao [14] studied the convective flow and heat transfer characteristics of supercritical CO2 through natural circulation in a uniform diameter rectangular loop. Bovard [15] and Fard [16] numerically investigated the heat transfer of supercritical CO2 in circular and porous tubes, respectively. Jiang et al. [17,18,19,20] conducted a series of experimental and numerical investigations regarding the local heat transfer of CO2 at supercritical pressures in vertical tube and multi-port mini-channels under cooling conditions. The authors mainly focused on flows with relatively low Reynolds numbers. Cao [21] and Du [22] numerically studied the convective heat transfer of supercritical CO2 in horizontal miniature circular and triangular tubes.
Nevertheless, due to the coupling of steeply varying thermo-physical properties of the fluid and the formation of special flow patterns in heating tubes [23,24,25], the flow and heat transfer in heating or cooling channels has become more complex. At present, there is still no consensus on the effects of various parameters on the convective heat transfer, especially in cases with high heat flux (q)/ mass flux (G) ratios. Figure 2 shows three kinds of completely different temperature distributions for various bulk enthalpy values at different mass fluxes, which were derived from Kim [26] (used electric heater, experimental range: G = 285–1200 kg/m2s, q = 30–170 kW/m2), Zahlan [27], and Kurganov [28]. At moderate (G = 700 kg/m2s; q/G = 0.14 kJ/kg, as seen in Figure 2b, data from Zahlan [27] (used electrical heater, inlet temperature is 7.1–13.8 °C)) and high (G = 1200 kg/m2s, q/G = 0.216 kJ/kg, as seen in Figure 2c, data from Kurganov [28] (used electric heater, Rein = 2.3 × 10⁵–1.18 × 10⁶)) mass fluxes, deteriorated heat transfer occurred, and a temperature peak appeared in the region of 240–280 kJ/kg. At low mass flux (G = 232 kg/m2s, q/G = 0.259 kJ/kg, as seen in Figure 2a, data from Kim [23]), the temperature increased monotonously, and no temperature peak was observed, even for high heat fluxes.
At low mass flux (G = 100 kg/m2s), the temperature changed smoothly without any distinct temperature peak, as seen in Figure 3 This behavior was different from that observed for the moderate (G = 500 kg/m2s) and high (G = 1000 kg/m2s) mass fluxes, where an apparent temperature peak occurred. The uneven temperature profiles indicated the presence of convective instability. For the conditions of heat transfer in supercritical CO2 at low mass fluxes, no obvious temperature peaks were observed, even if the q/G was identical (q/G = 0.2) or much higher (q/G = 0.3).
It is worth mentioning that this phenomenon has not been studied in detail in the literature. Until now, satisfactory analytical methods were not available, due to the difficulty of dealing with temperature-dependent nonlinear property variations. The corresponding and precise mechanisms of heat transfer regimes that cause deteriorated heat transfer at moderate and high mass fluxes are still not well understood. Instead, the viewpoint that supercritical fluid was analogous to subcritical fluid has prevailed in the past few decades. Hall [29] briefly surveyed the existing experimental data of supercritical fluids, and suggested that heat transfer at supercritical pressure was accompanied by a “boiling-like” phenomenon. Goldmann [30] proposed that an unusual heat transfer mode could be explained by a boiling-like phenomenon resembling nucleate boiling. The author proposed a model with liquid-like clusters of molecules below the pseudocritical temperature, and gas-like aggregates above the pseudocritical temperature. Later, Kafangauz [31] argued that this interesting pseudo-boiling was a characteristic of heat transfer under the conditions of P > Pcr and Tb < Tcr < Tw. Shitsman [32] also observed the unusual mode of heat transfer, and attributed it to a crisis-like process analogous to the process by which film boiling occurs at subcritical pressures. Ackerman [33] claimed that more evidence had been collected, and that one of causes for unusual temperature peaking at higher heat fluxes is ascribed to the pseudo film-boiling process. The same author proposed that a pseudo film-boiling phenomenon can occur at supercritical pressures, which is similar to film boiling occurring at subcritical pressures. Recently, Kurganov and Kaptil’nyi [34] attempted to directly measure the hydrodynamic and thermal fields of carbon dioxide flowing vertically upwards by using a micro-Pitot tube. The authors experimentally verified that an M-shaped velocity distribution and a subsequent reduction in shear stress were the major causes of heat transfer deterioration. During this evolution, buoyancy played an important role in heat transfer at supercritical pressures. A number of research papers [35,36,37,38] discussed the effect of buoyancy on heat transfer in supercritical fluids.
From the above literature review, it can be observed that mixed convection heat transfer in supercritical CO2, flowing vertically in a uniformly-heated circular tube at low mass flux, has not received much research attention. Furthermore, its hidden mechanism is not well understood in the literature. In the present study, these unique heat transfer behaviors were experimentally and numerically investigated in a 5.0-mm diameter vertical tube at low mass fluxes. The effects of various operating parameters, such as the heat flux, pressure, and mass fluxes, were further analyzed. The effect of buoyancy on the convection heat transfer was discussed. In order to understand the mechanism hidden in this special heat transfer behavior occurring at low mass fluxes, computational fluid dynamics (CFD) were implemented with the Shear-Stress Transfer (SST) k-w turbulent model. The corresponding parameters at different cross-sections were compared. The heat transfer mechanism at low mass fluxes was then revealed based on the experimental data and numerical results.
2. Experimental Setup and Data Reduction
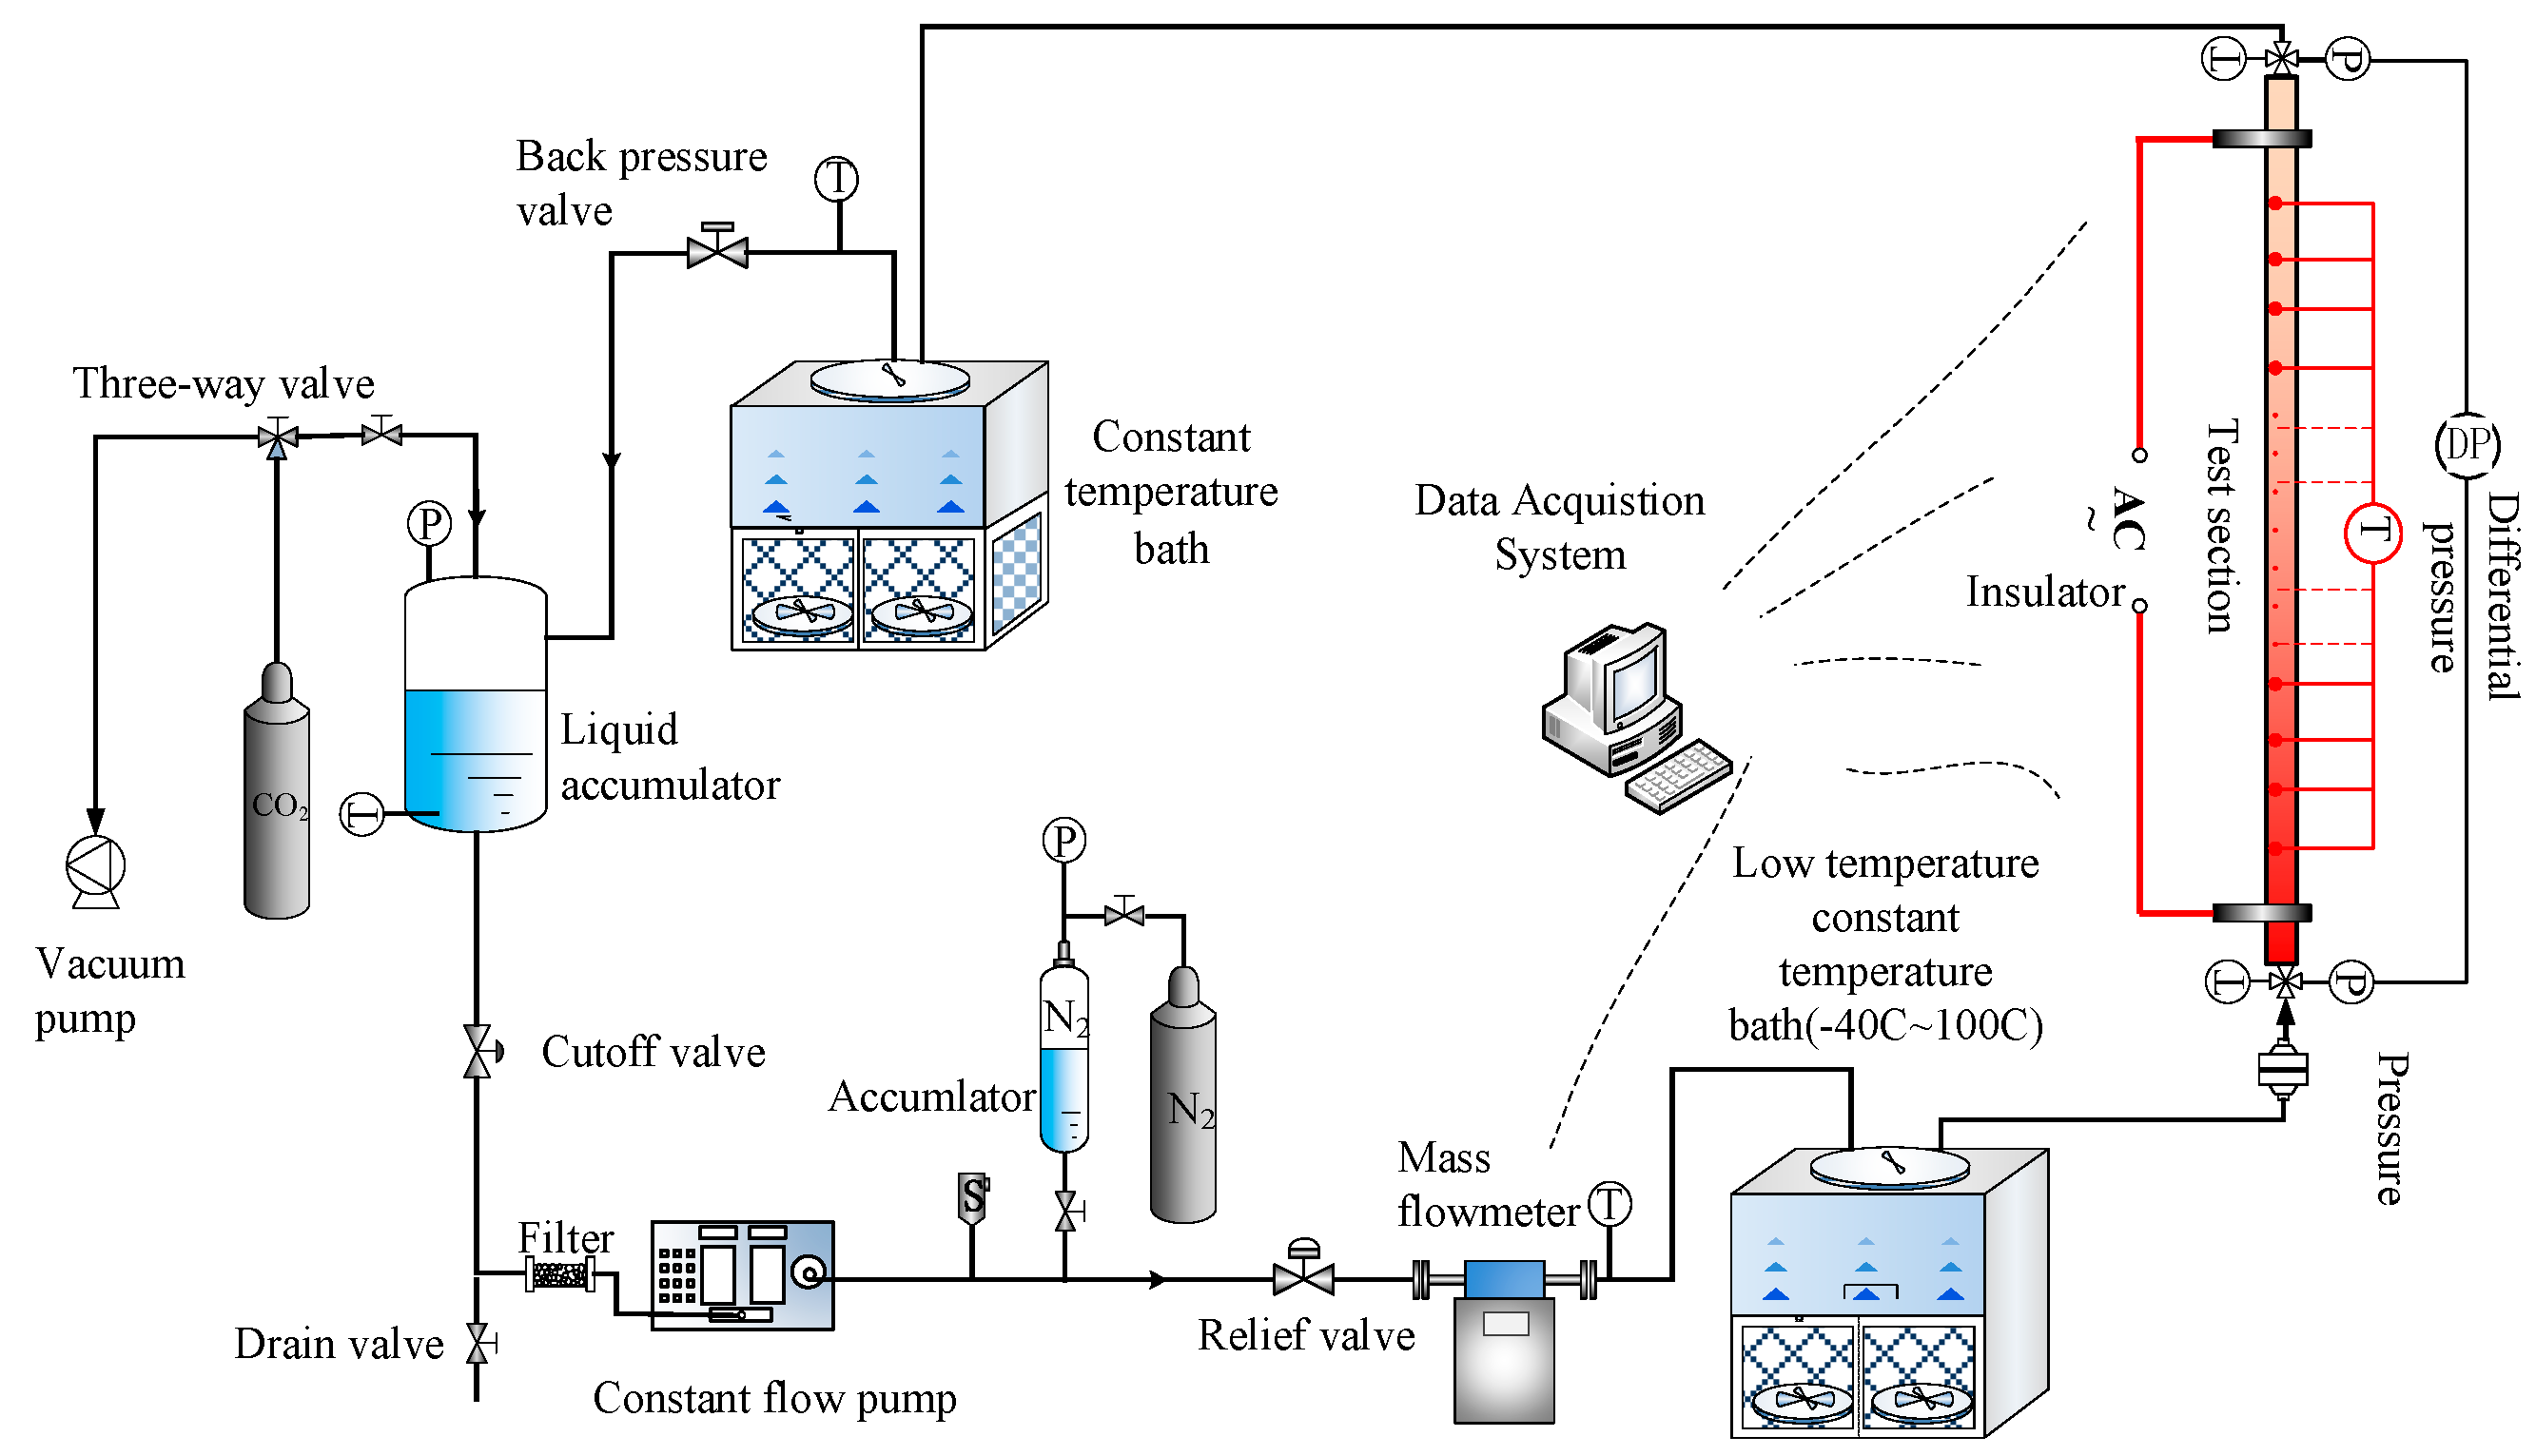
Figure 4 shows the schematic of the experimental setup to study the thermo-physical behavior of supercritical carbon dioxide (s-CO2). Firstly, the liquid carbon dioxide was poured into the accumulator (High-pressure labratory, Xi’an, China). The whole system was then evacuated to 2 Pa. Then, the working fluid was pumped from the tank into the circulation system using a high-pressure constant flow pump (Elite Analytical Instruments Co. Ltd., Dalian, China). Carbon dioxide was cooled/heated when passing through the low-temperature bath (Hepu biotechnology Co. Ltd., Xi’an, China), and reached the desired test conditions. It then flowed into the test section, which was electrically heated using an alternating current (in the range of 0–500 A) at low voltages. Then, the working fluid from the exit of the test section flowed through another constant temperature bath, and was returned to the tank. In this system, all of the connecting tubes were thermally insulated using glass wool to minimize heat losses.
A Micro Motion Coriolis flow meter and a transmitter (Emerson, St. Louis, MO, USA) were used to measure the mass flow rate in the system. The flow meter was capable of measuring flow rates up to 0.1 kg/s with a ±0.01% full-scale accuracy. The pressure was monitored through Rosemount gauge pressure transducers (Emerson, St. Louis, MO, USA) with the manufacturer’s specified accuracy of ±0.04% of full scale. The temperature in the loop was controlled using two constant-temperature baths (Hepu biotechnology Co. Ltd., Xi’an, China). The bath was used to increase or decrease the temperature of s-CO2 to the desired test section inlet temperature. Several K-type thermocouples (OMEGA Engineering Inc., Shanghai, China) installed in the outer surfaces were used to monitor the amount of energy put into and removed from the flow. Thirty-five (35) K-type thermocouples’ wires (OMEGA Engineering Inc., Shanghai, China) were welded on the outer wall’s surface, and were 20 mm apart from each other, starting from the inlet. These K-type thermocouple wires had the uncertainty of ±0.5 °C. The bulk temperatures of the fluid at the inlet and outlet were monitored using K-type sheathed thermocouples with the maximum uncertainty of ±0.5 °C. These thermocouples were calibrated against a high oil bath to quantify the systematic error.
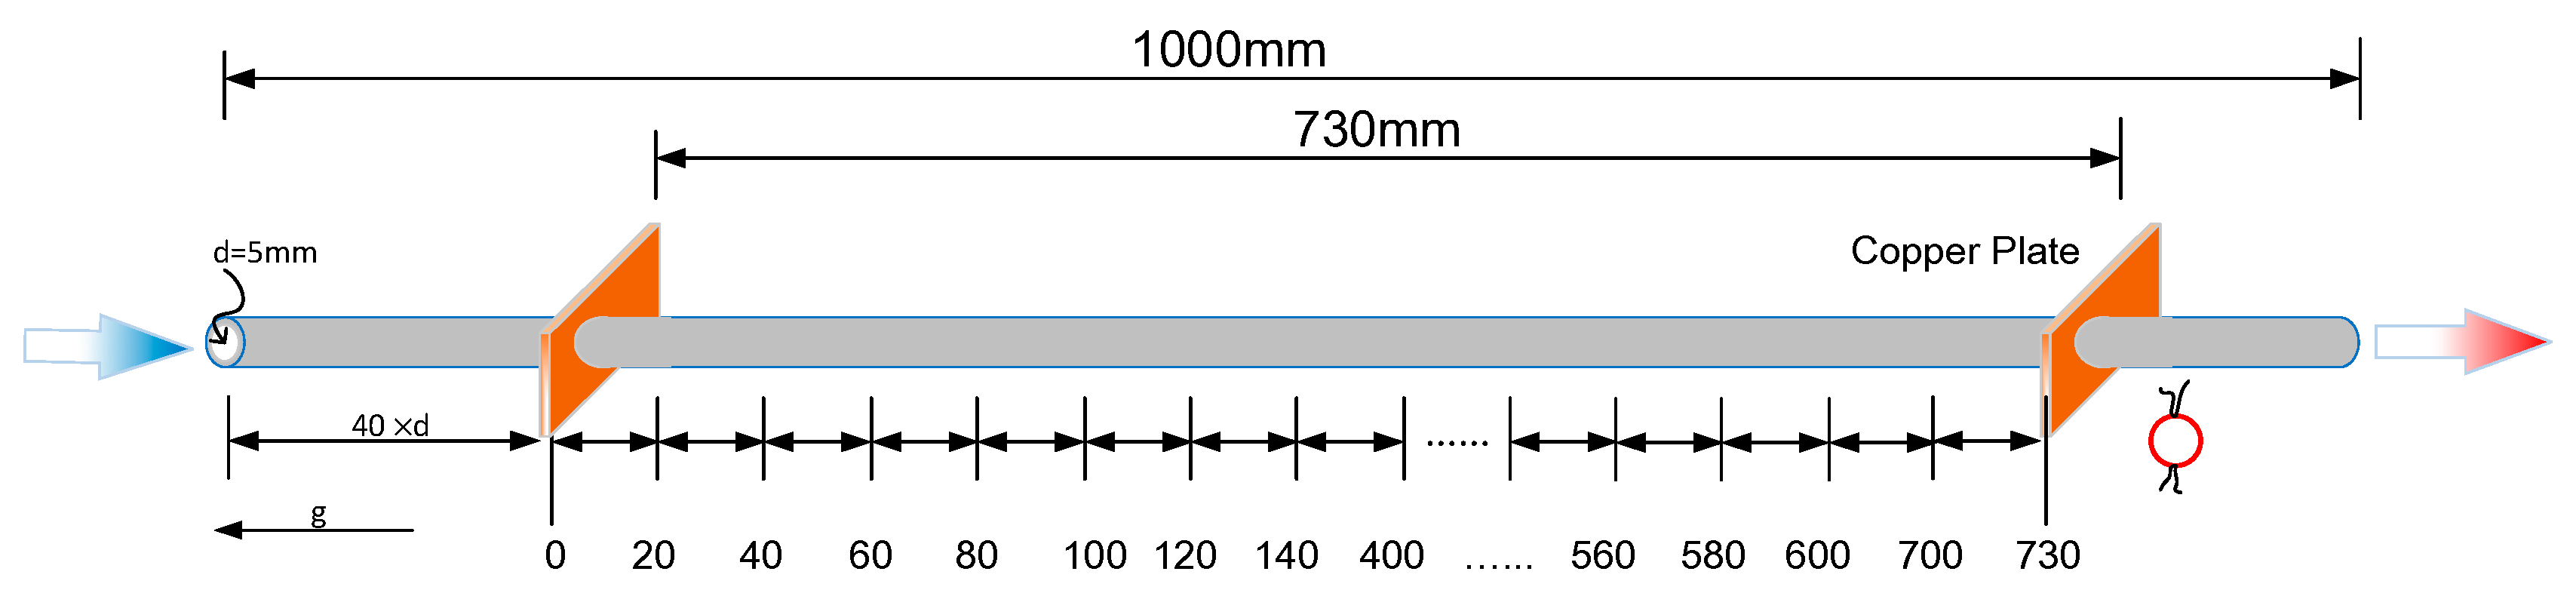
The material of the test section was a 304 stainless steel circular pipe (Changtai precision alloy Co. Ltd., Xi’an, China) with an outer diameter (OD) and ID of 6 mm and 5 mm, respectively, and a length of 730 mm, as seen in Figure 5. The test section was directly heated by an AC power supply (0–12 V, 0–500 A) to provide the required constant heat flux. The heat flux to the test section was varied by adjusting the current between copper plates at the ends of the pipe. The accuracy of the voltage control was ±0.01% of full scale, while that of the current control was ±0.04% of full scale.
A 20-mm long developing section was provided to ensure that the flow was hydrodynamically fully developed at the entrance of the test section. Furthermore, the test section was electrically and thermally insulated from the rest of loop by using dielectric fitting at the end of the test section.
A series of integral experiments were performed by changing the mass flow rate and heat flux for the operating pressures of 7.5, 8.0, 8.5, and 9.0 MPa. The inlet temperature to the test section was varied from −50 °C to 100 °C in order to cover the whole range of bulk temperature spanning the pseudocritical temperature. The mass flux was varied in the range of 100–200 kg/m2s, while the heat flux was varied in the range of 5–120 kW/m2. All of the independent parameters, such as the test section’s inlet temperature, mass flow rate, pressure, and heat flux, were monitored and controlled by an NI (National instruments) Labview data acquisition system. During the experimental process, when the system achieved steady state, the data was recorded for 40 s at the rate of 3 Hz, and the average of these data points was used for the analysis.
For each operating condition, the test system was assumed to be at steady state, while the energy balance was obtained using Equation (1).
where η is the thermal efficiency, G is the mass flux (kg/m2s), U is the voltage (V), I is the current (A), din is the inside diameter (equal to 5 mm), and Hout and Hin are the inlet and outlet bulk fluid enthalpies (kJ/kg), respectively. The energy balance of the whole system was found to have a deviation of ±4%.
The total averaged heat generation of the test section was determined using Equation (2).
where is the averaged heat flux, and L is the heating length, whereas all of the other symbols carry the same meaning and units of measurement as described for Equation (1). However, the ohmic resistance varies with temperature for 304 stainless steel, and does not remain constant. The electric resistivity almost varies linearly with temperature. According to the variation in slope, it is estimated that when the temperature lies within the range of 0–200 °C, the uncertainty in heat flux is ±3.8%. However, the uncertainty in heat flux becomes ±8.2% when the temperature of the test section lies within the range of 0–400 °C due to the variation of electric resistivity.
Based on the measured outer-wall temperature data, inner wall temperatures were estimated by assuming a simple one-dimensional, steady-state conduction equation, which is given by Equation (3).
where are the inner and outer diameters of the test sections, respectively, q(x) is the local heat flux, and Kss is the thermal conductivity of the stainless steel. Furthermore, Kss is calculated using Equation (4).
where h is the heat transfer coefficient, which is given by Equation (5).
where is the inner-wall temperature, and is the bulk fluid temperature.
To describe the large buoyancy effect in supercritical flow, Jackson [39] summarized a criterion defined using the buoyancy parameter for predicting the onset of deteriorated heat transfer.
where, , ρ is the density (kg/m3), μ is the viscosity (Pa·s), g is the gravity (kg/m2), d is the inner diameter (mm), and subscript b indicates the bulk fluid . The thermal conductivity of the bulk fluid is .
Jackson et al. [39] proposed another criterion to determine the onset of heat transfer deterioration.
where , , .
3. Results and Discussion
In this section, first the convective heat transfer of supercritical CO2 is discussed. Then, the effects of several operating parameters on the heat transfer characteristics of supercritical carbon dioxide are compared and discussed. These parameters include heat fluxes, mass fluxes, and pressures. To explain the mechanism of such a particular heat transfer behavior, the flow and heat transfer in the vertical flow channel is numerically simulated. Additionally, the distributions of velocity, temperature, and shear stress in different cross-sections at low mass fluxes are also investigated.
3.1. Convective Heat Transfer of Supercritical CO2
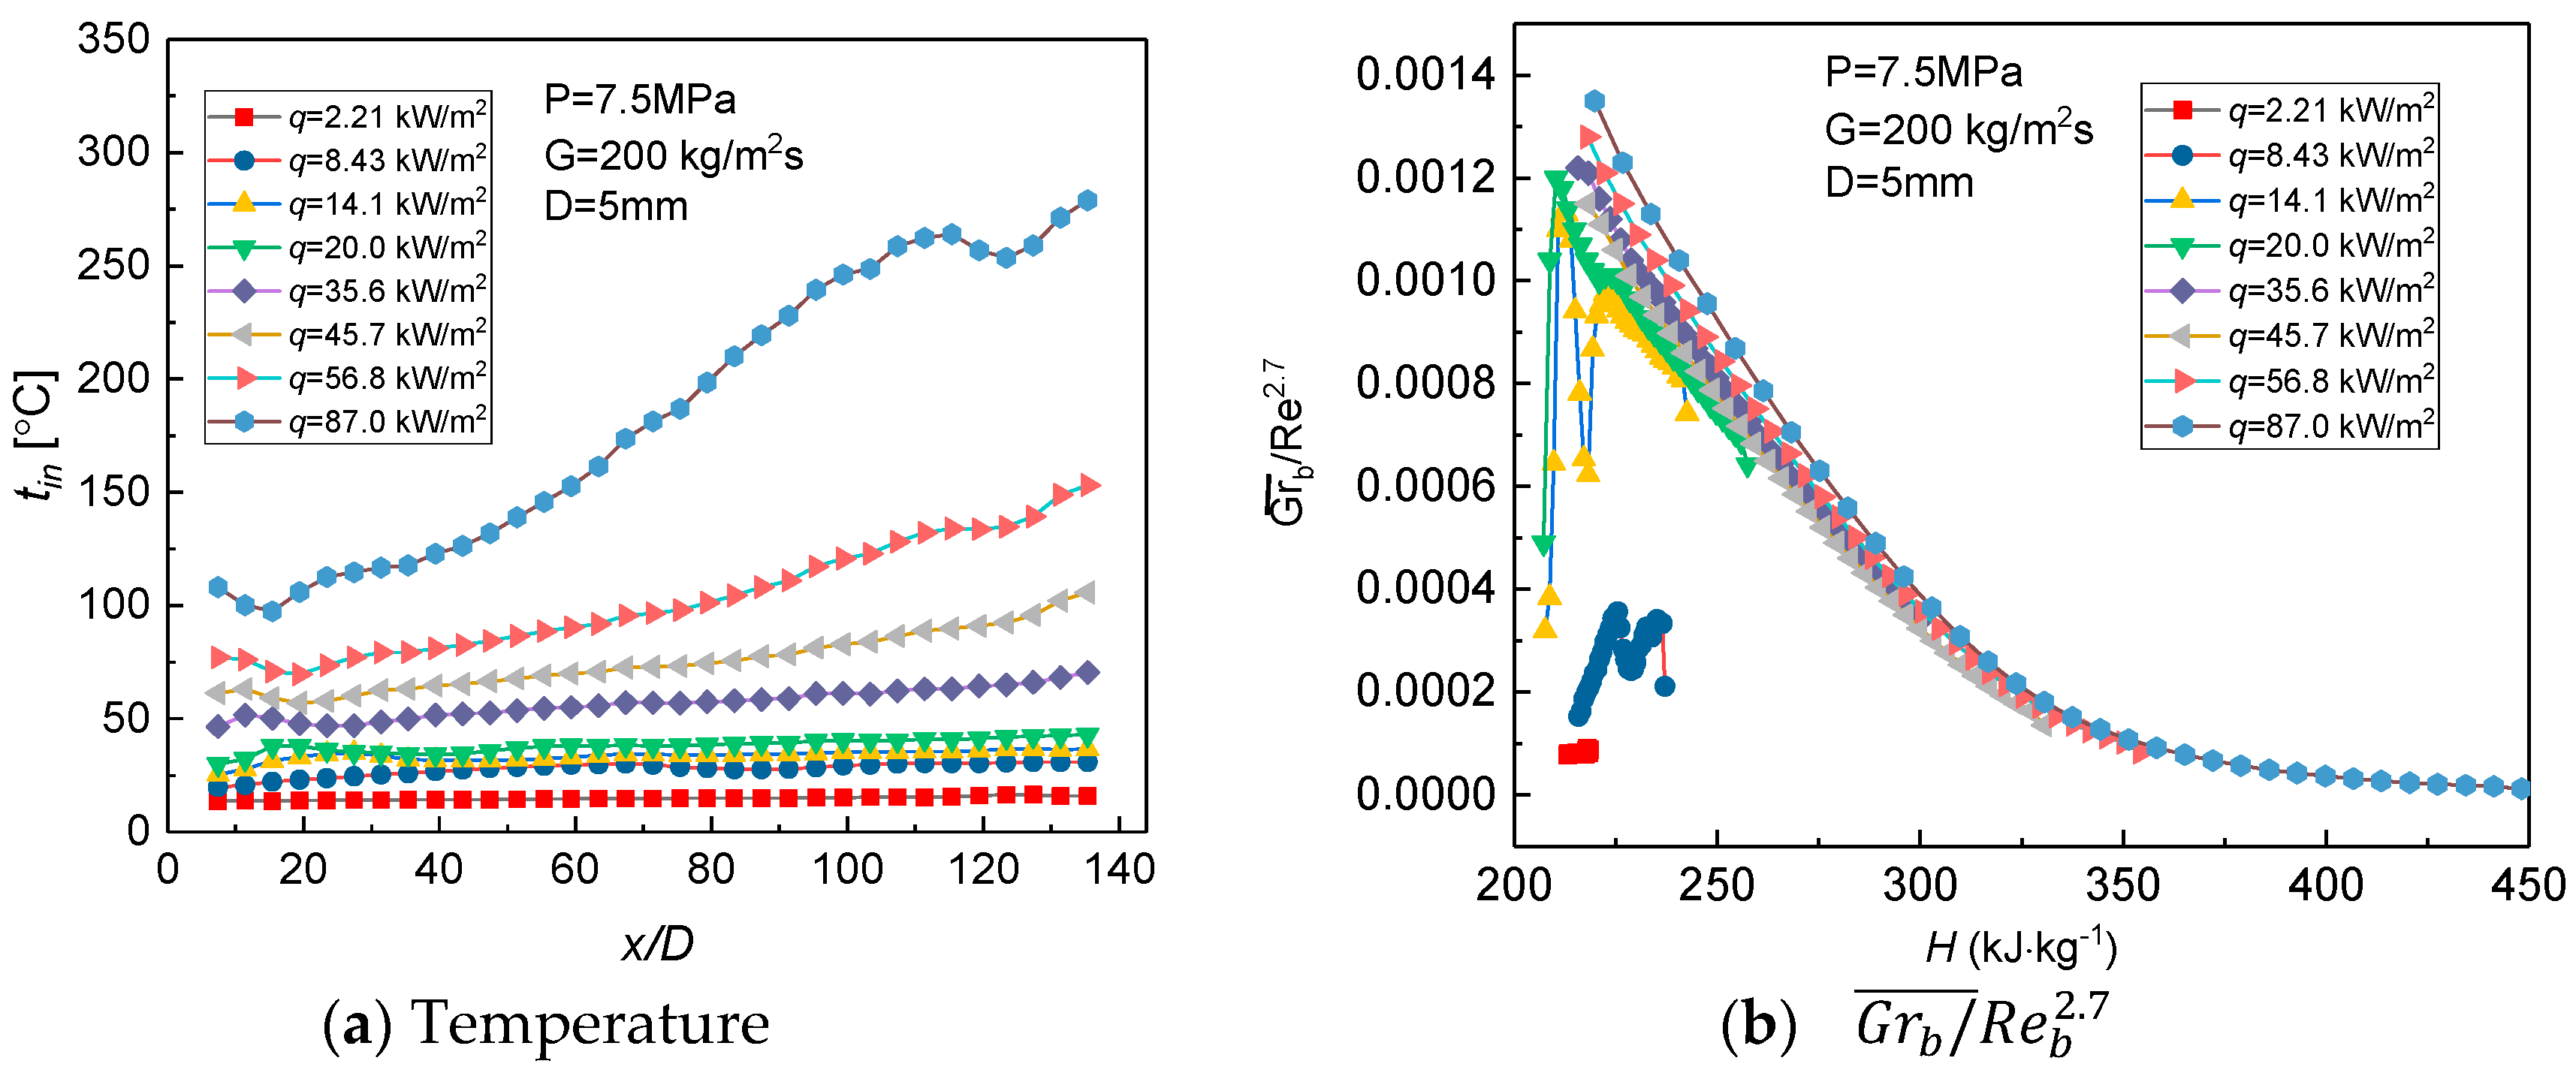
Figure 6 shows the variations in inner-wall temperature along the tube length (x/D), and the variation of the ratio of forced convection to natural convection against different heat fluxes for the pressure and mass flux of 7.5 MPa and 200 kg/m2s (Rein = 10,400–11,800), respectively.
It can be seen from Figure 6a that the inner-wall temperature smoothly increased at low heat flux. With the increase in heat flux, the wall temperature slowly increased in the first half of the x/D ratio (x/D < 70), though it quickly increased in the second half (x/D > 70). At low heat fluxes, the difference in fluid temperature between the near-wall region and the central domain was tiny, and resulted in a small degree of buoyancy. The corresponding value of was not significant. However, at high heat fluxes, the fluid temperature quickly exceeded the pseudocritical value, and the thermo-physical properties dramatically changed, inducing significant buoyancy in the thermal developing region. Furthermore, the buoyancy effect (represented by natural convection) and its ratio to forced convection reached the maximum value in this region, as shown in Figure 6b. Moreover, with the temperature still far away from the pseudocritical temperature at high heat fluxes, the slow drop in density caused the value of to continuously decrease with the increase in bulk enthalpy. Besides, in the thermal developing region (x/D < 40), irregular temperature profiles were observed, which may be ascribed to the development of unstable thermal boundary conditions. When the heat flux was below 35.5 kW/m2, a slight maximum appeared within the region of x/D < 40. However, when the heat flux increased to the higher value, a temperature “pit” was observed in this region. This was mainly because the fluid in the near-wall region far exceeded its pseudocritical point, while the large density gradient moved toward the inlet. Furthermore, the flow mixing occurred either at a lower enthalpy value, or close to the entrance at high heat fluxes. As seen in Figure 6b, the variation in profiles were unstable, whereas a pit was observed in a certain position at low heat fluxes. However, at high heat fluxes, the value reached its maximum at the beginning of the test section.
3.2. Parametric Effect on Heat Transfer
3.2.1. Effect of Heat Flux
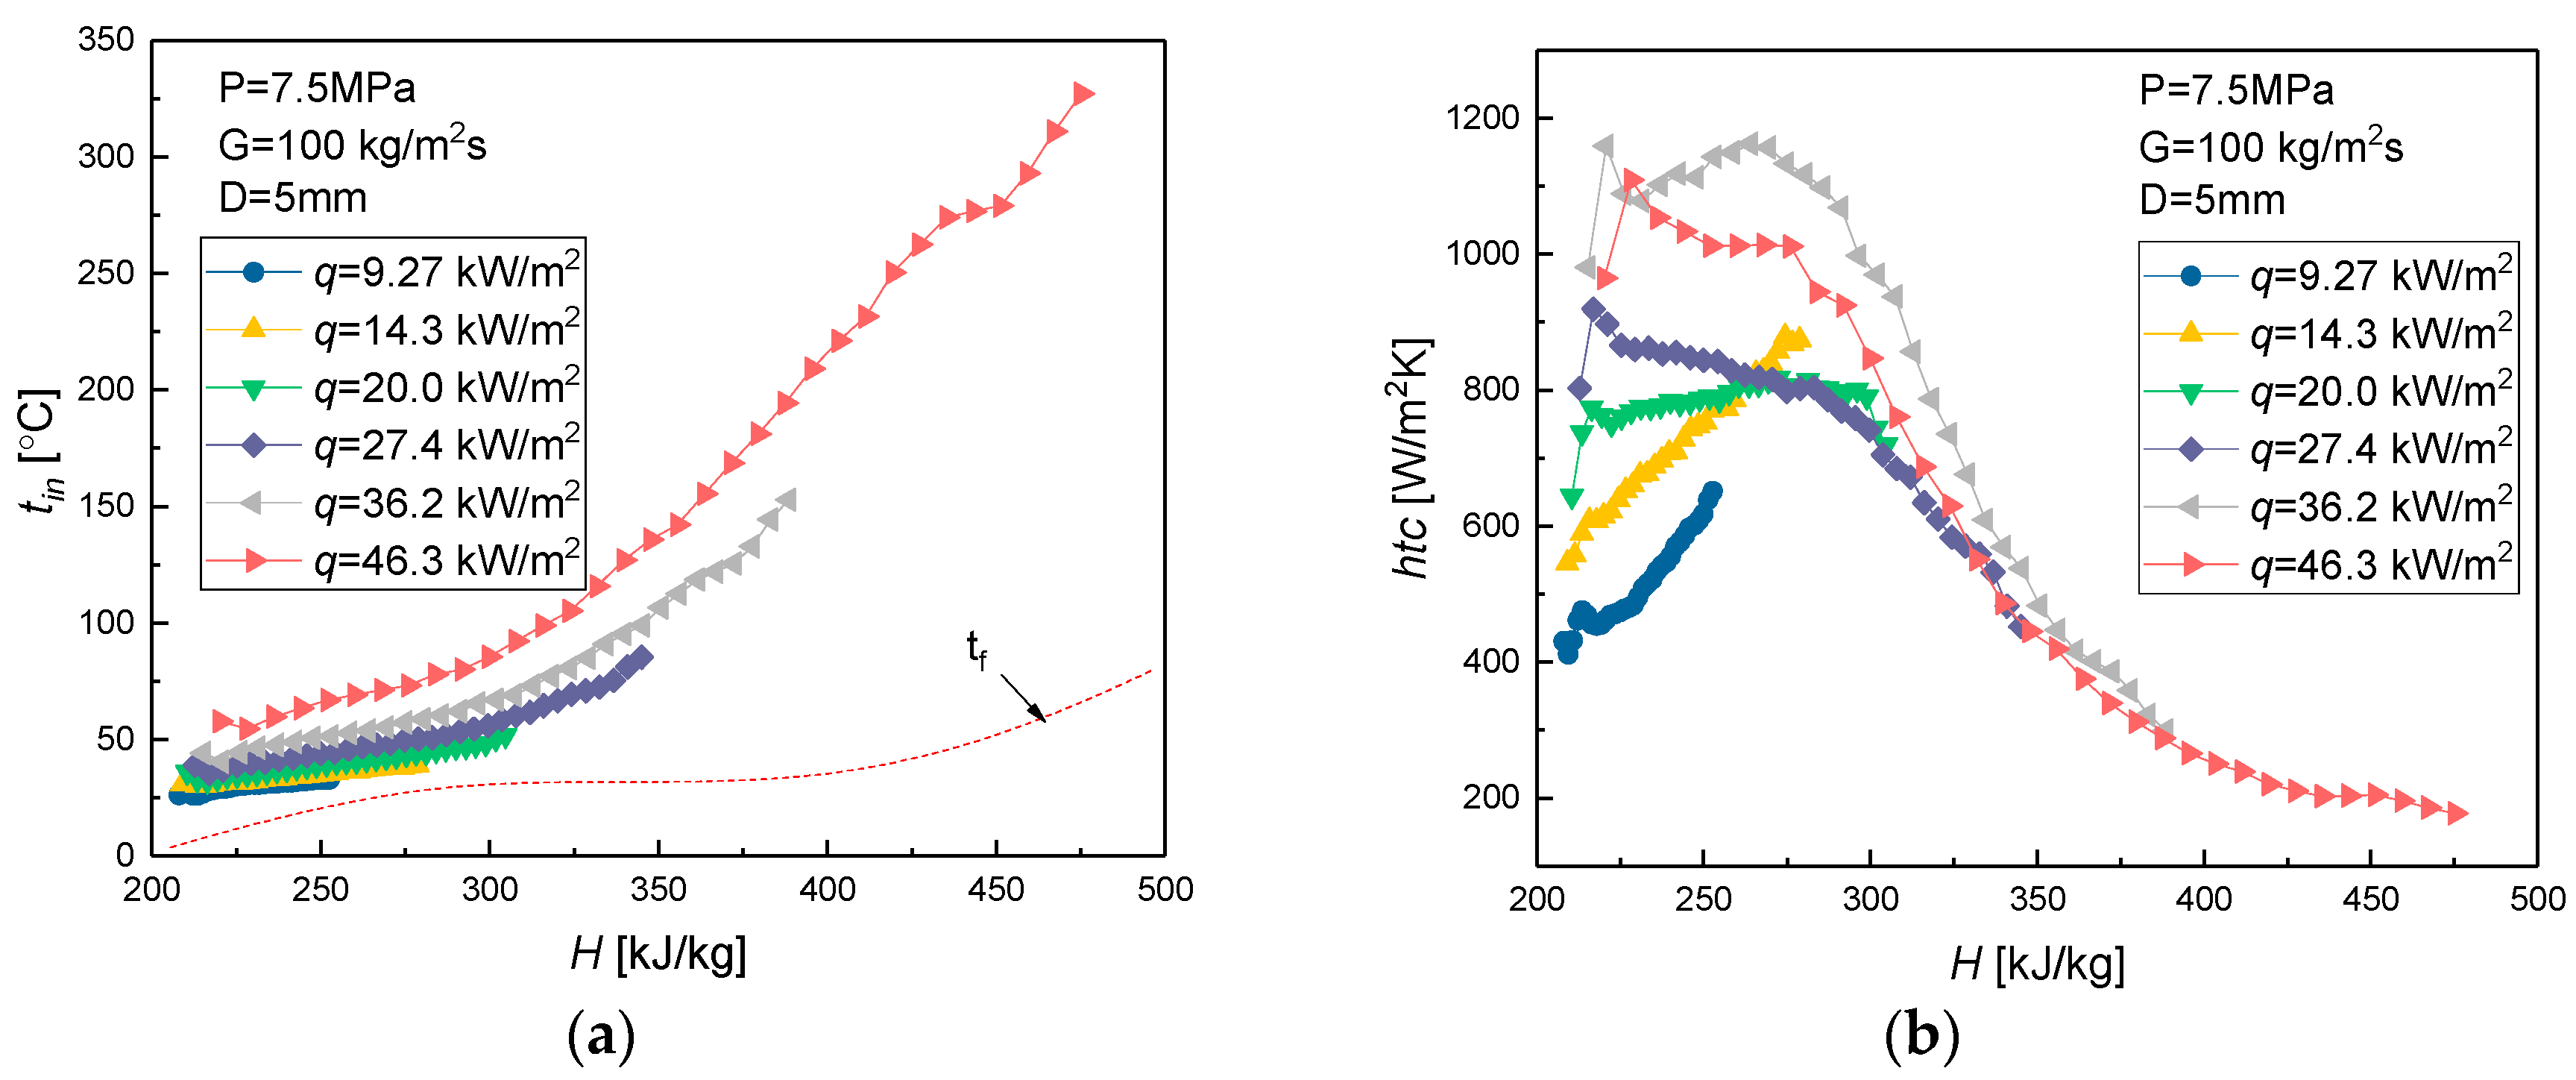
Figure 7 and Figure 8a show the variations in inner-wall temperature with bulk fluid enthalpy at different heat fluxes with the pressure of 7.5 MPa and 8.0 MPa (Rein = 5100–5300), respectively.
As seen in Figure 7 and Figure 8a, when the bulk enthalpy was less than 300 kJ/kg, the inner-wall temperature slowly increased, as the bulk fluid temperature was still lower than the pseudocritical temperature. This might be because the bulk fluid with large specific-heat capacity can take away the added heat. However, when the enthalpy was higher than 300 kJ/kg, the inner-wall temperature quickly increased with the increase in heat flux.
At low heat fluxes, the effect of buoyancy is still small due to its slow variation in thermo-physical properties, whereas the temperature differences between the inner-wall and the bulk fluid gradually enlarged along the tube. With the increase in heat flux, the heat transfer coefficients (HTCs) first increased due to the intense variations in fluid thermo-physical properties, as seen in Figure 1. However, when the high-temperature “vapor-like” fluid in the region was close to the inner wall, the added heat that was transferred from the near-wall region to the central region reduced. Due to this reason, the corresponding heat transfer coefficient decreased. Besides, in the region of 200–230 kJ/kg (corresponding to x/D < 40), a typically enhanced HTC was observed, which was affected by the development of “thermal entrance effect”.
3.2.2. Effect of Mass Flux
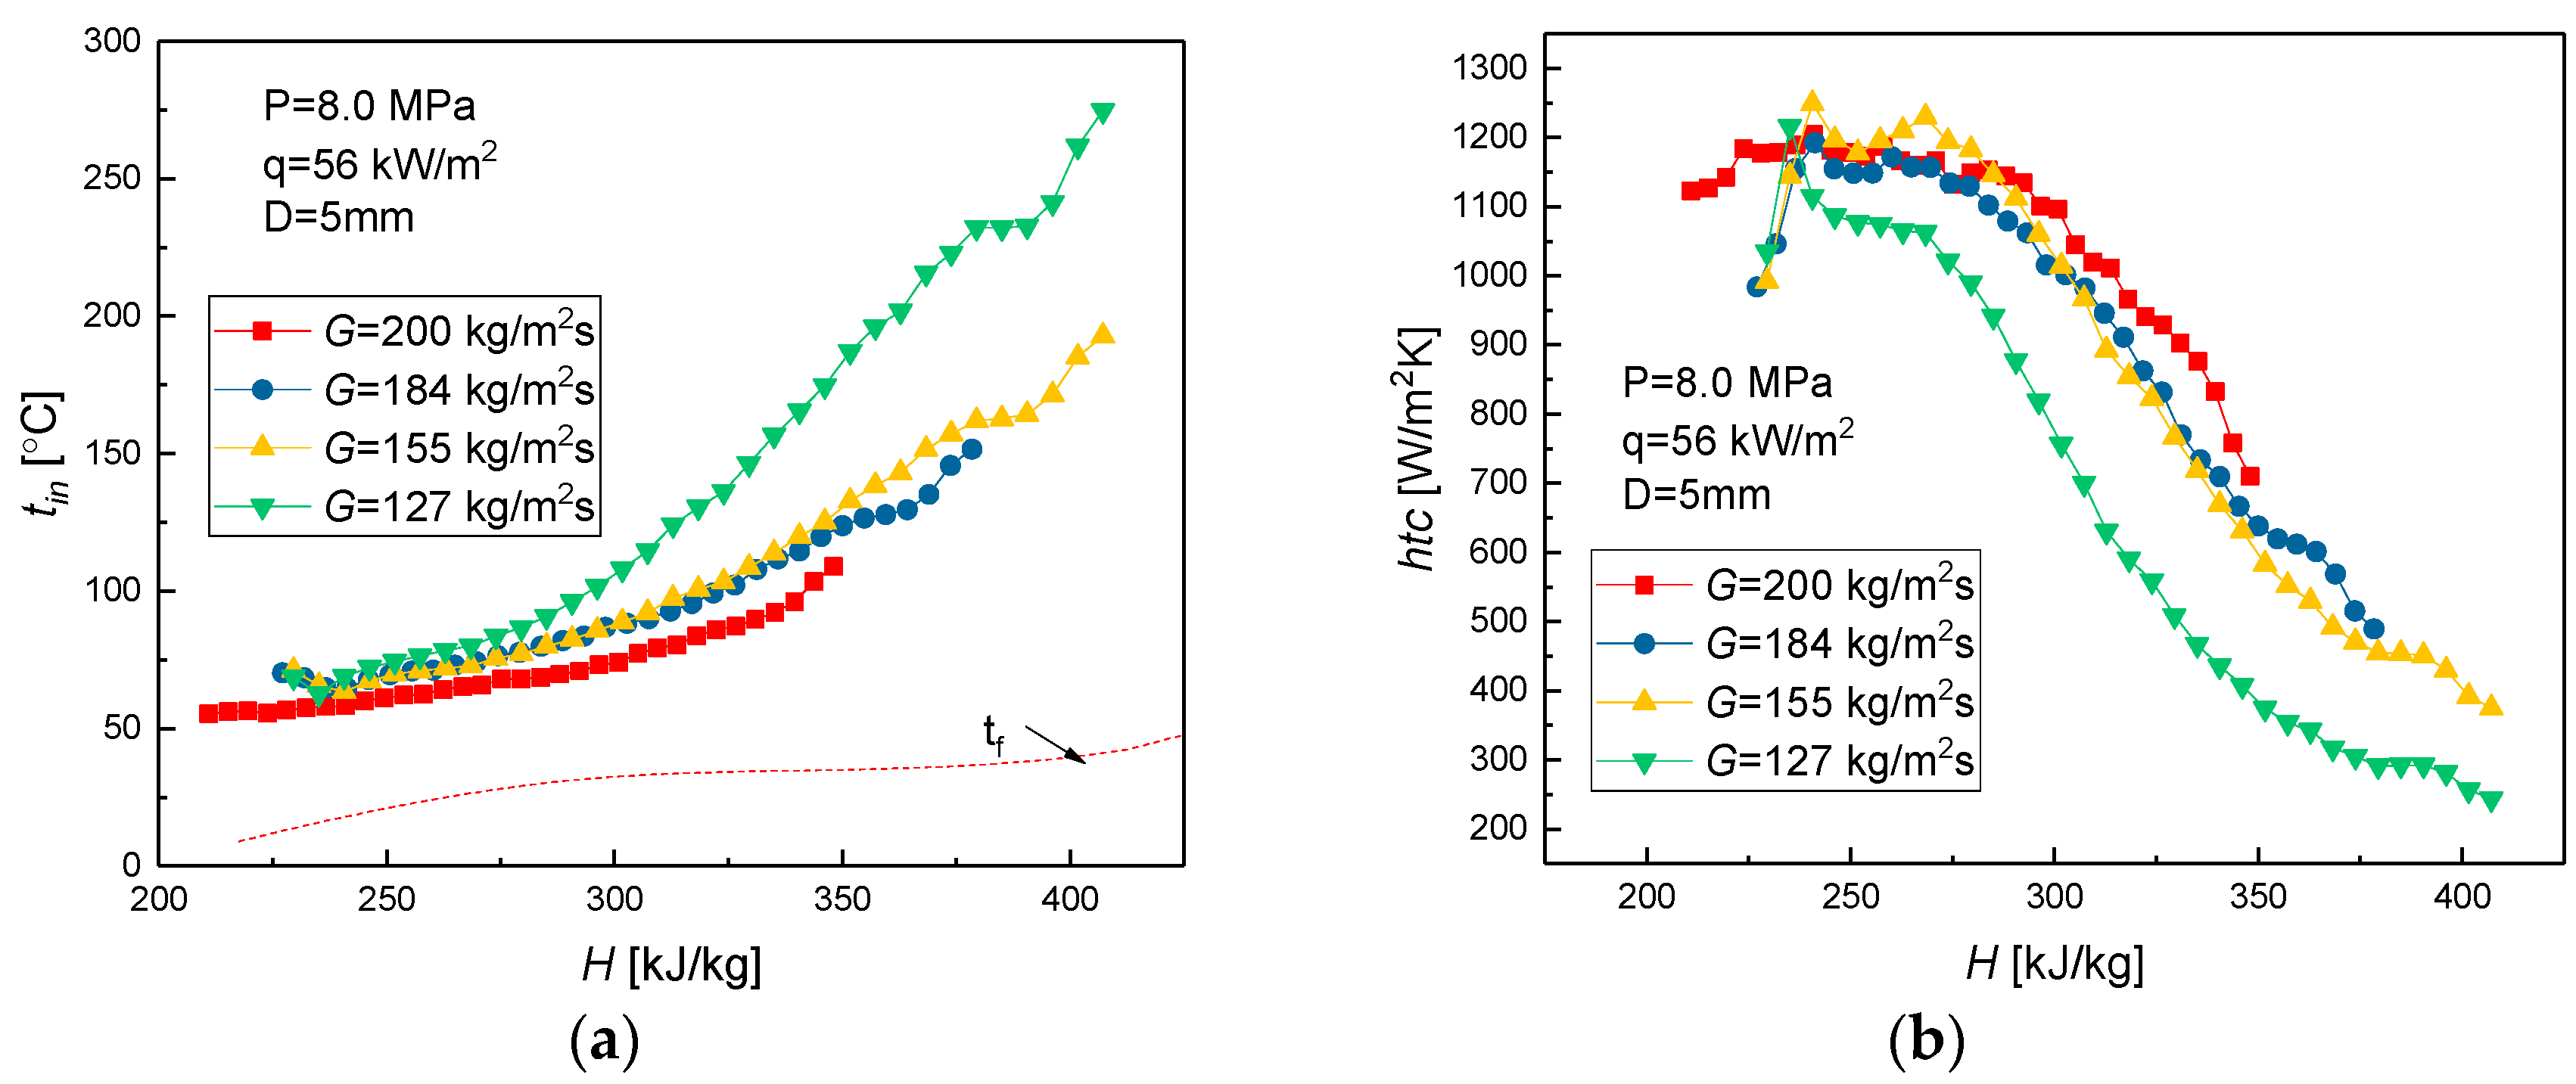
Figure 9 shows the variation in inner-wall temperature at different mass fluxes at the pressure of 8.0 MPa.
As seen in Figure 9, mass flux greatly influenced the heat transfer coefficients, which increased significantly with the increase in mass flux. The characteristic is consistent with the results of regular fluids, whose thermo-physical properties do not vary too much with temperature. The turbulence intensity increased with the increase in mass flow rate, which resulted in a strong mixing effect and unstable flow. These factors led to an enhancement in heat transfer between the fluid and solid tube wall [18]. Meanwhile, unlike the ordinary fluids, the heat capacity and heat conductivity of supercritical CO2 were much higher than that in the constant-property fluid. With the increase in mass flux, a large amount of heat was transferred and taken away when the system approached the pseudocritical temperature in the central domain, which also resulted in the enhancement of heat transfer between CO2 and the solid tube wall. Therefore, the combination of these two factors enhanced the heat transfer coefficient with the increase in CO2 mass flow rate.
3.2.3. Effect of Pressure
Generally, for the single-phase fluids, there was no big difference in the heat transfer coefficient among the various cases under different pressures. However, for the supercritical fluid, the convective heat transfer may present some differences. Figure 10 shows the effect of pressure on the heat transfer coefficient of supercritical CO2 under various heating conditions (Rein = 5100–5300). To exhibit the differences in the supercritical and subcritical pressure, heat transfer behavior at 7 MPa was introduced in Figure 10.
As seen in Figure 10, when the heat flux was 35.5 kW/m2, the inner-wall temperature profiles presented incredibly similar variations under supercritical pressure. These profiles were also similar to those obtained under subcritical pressure in the “vapor” region (x/D > 100). However, when the heat flux increased to 45.5 kW/m2, the inner-wall temperature discrepancy was affected by pressure. This is mainly due to the drop in heat capacity at high pressures, which also significantly decreased the transportation of added heat. Therefore, the inner-wall temperature was always higher at high pressures than at low pressures. Interestingly, at the pressure of 7 MPa, inner-temperature was kept constant at first, which is different from supercritical pressure. Since the latent heat disappears in supercritical pressure, the phase transition from “liquid-like” to “vapor-like” is instantly completed; thus, the temperature is always higher than that in the two-phase flow region at subcritical pressure. At a certain x/D, temperature suddenly increased to a higher temperature and became similar to the “vapor” temperature at the supercritical pressure in the downstream.
3.3. Buoyancy Effect on the Heat Transfer
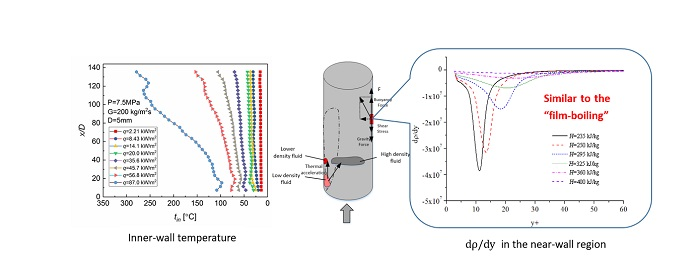
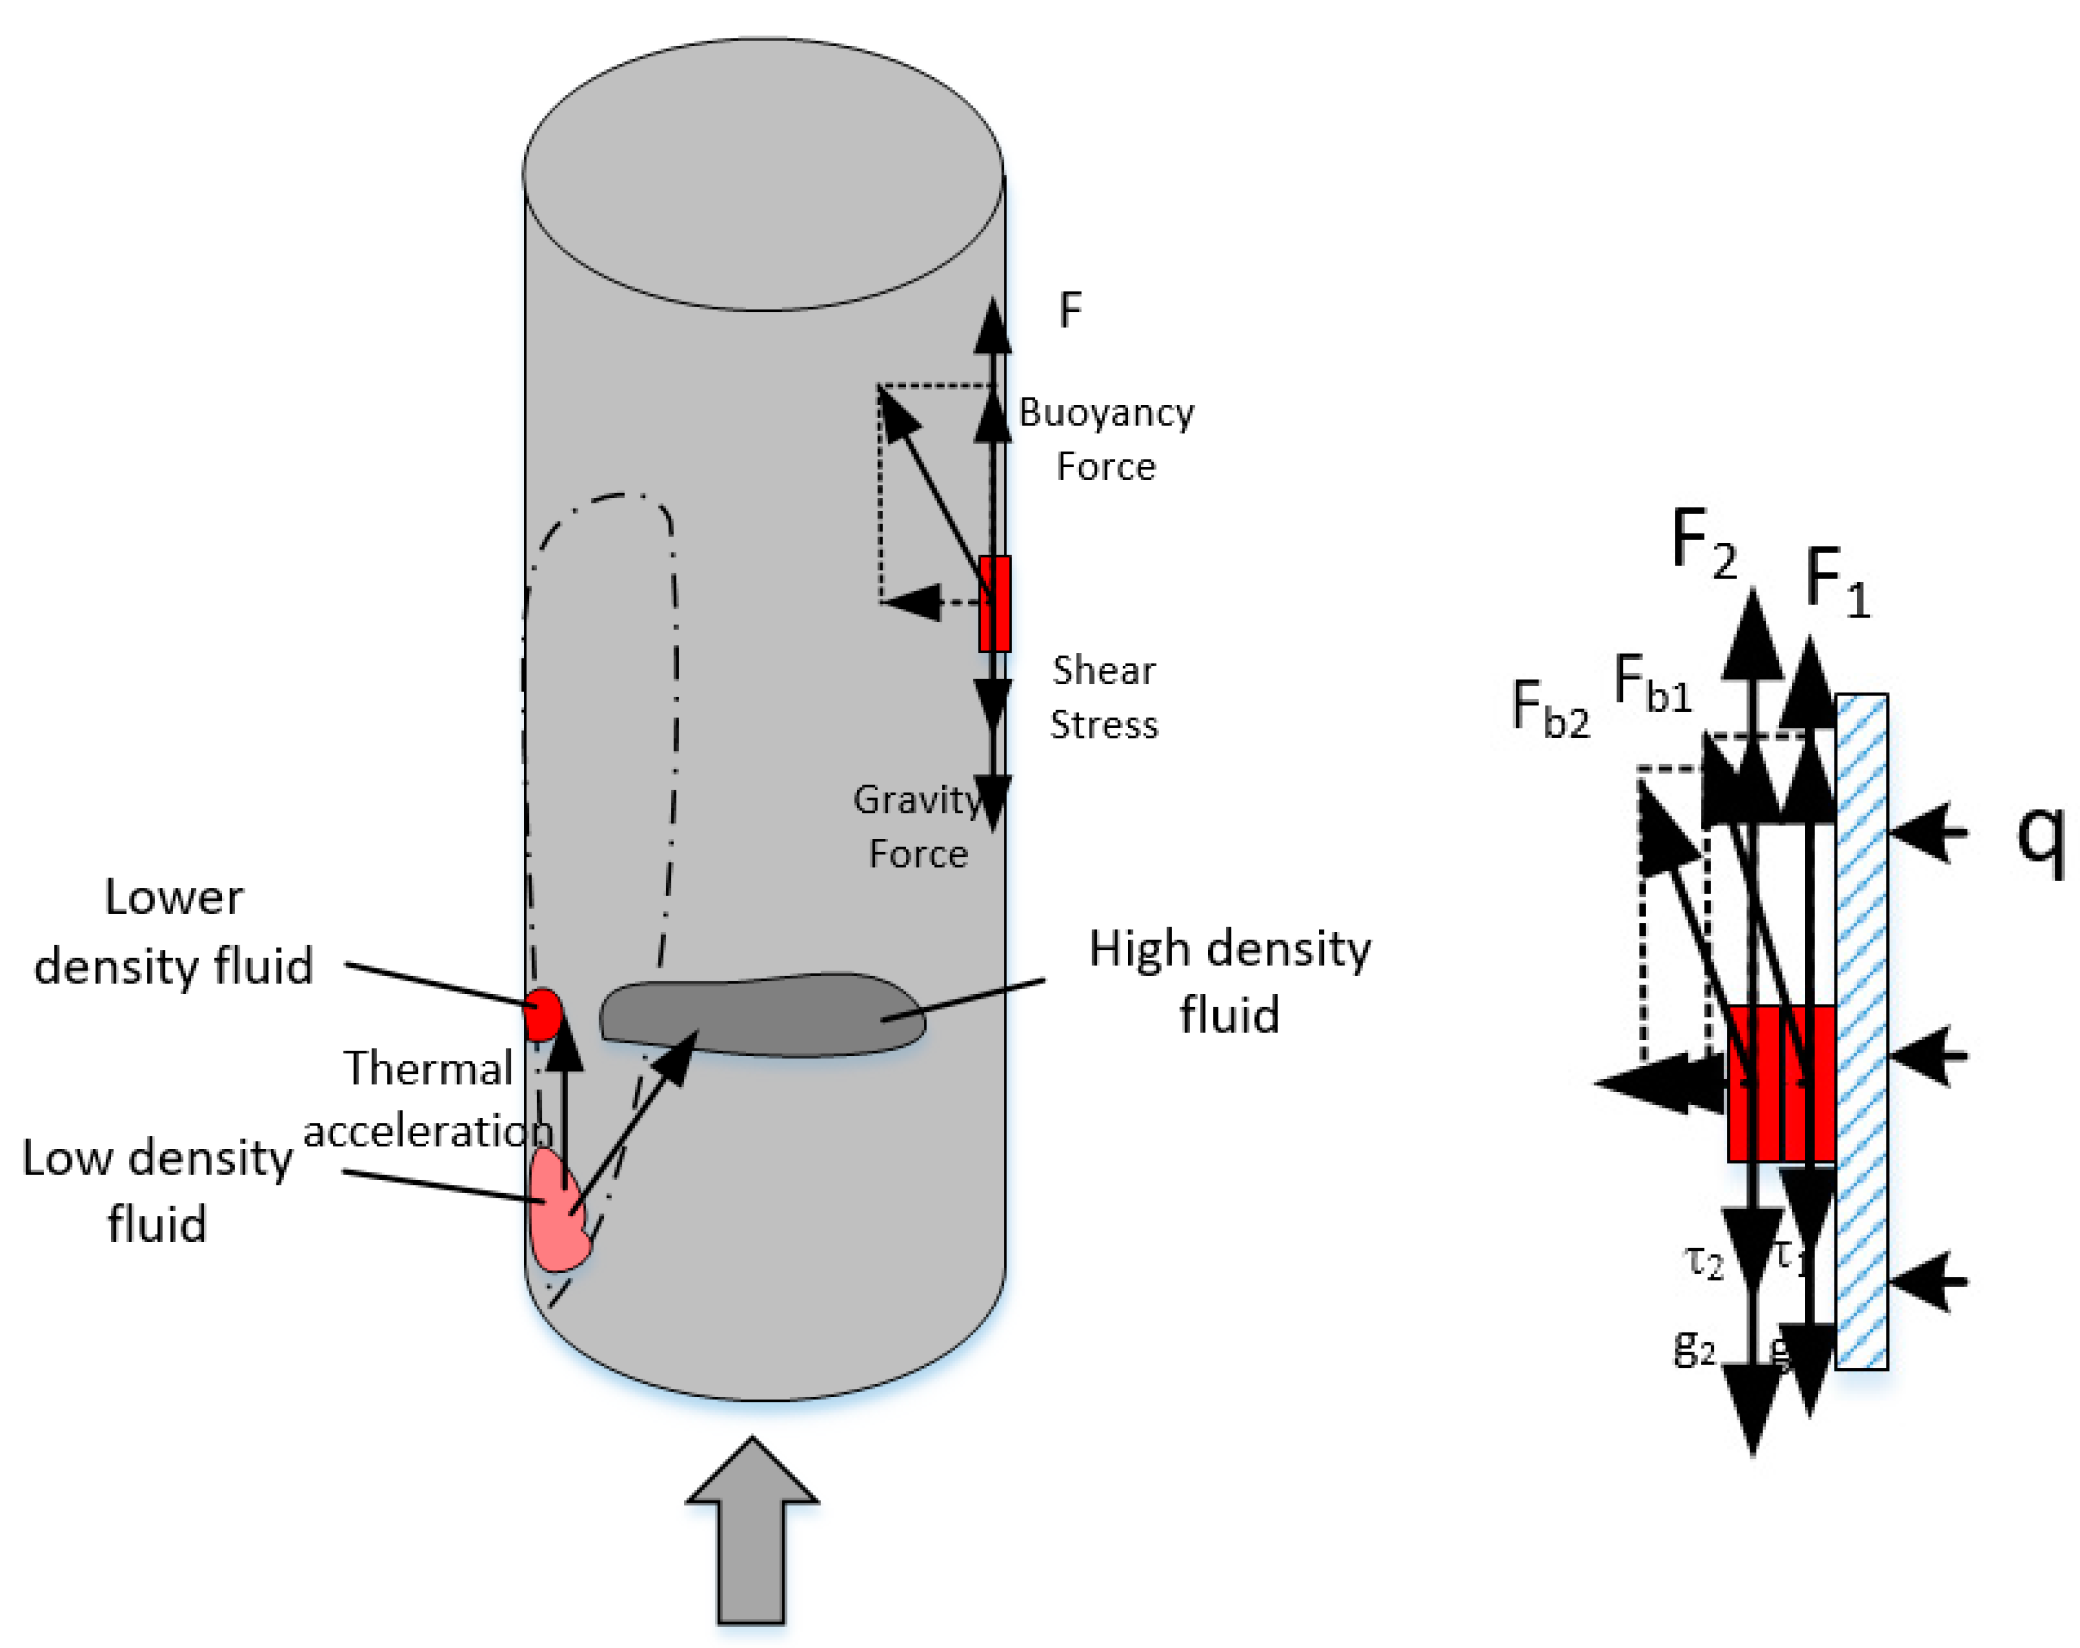
Although there has been extensive research on the convective heat transfer of supercritical fluids in different channels under both heating and cooling conditions, a clear understanding of the special convective heat transfer of supercritical fluids at low mass fluxes is still missing in the literature. Further investigation on the mixed convective heat transfer in a supercritical fluid at low mass fluxes is undoubtedly necessary, and could improve the understanding of this heat transfer mechanism. Figure 11 shows the qualitative analysis of forces in the near-wall fluid for the vertical flow.
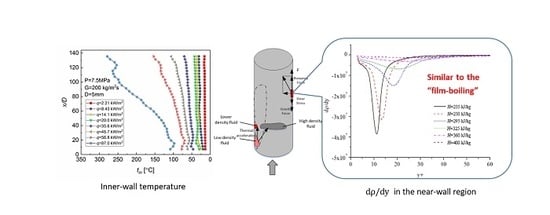
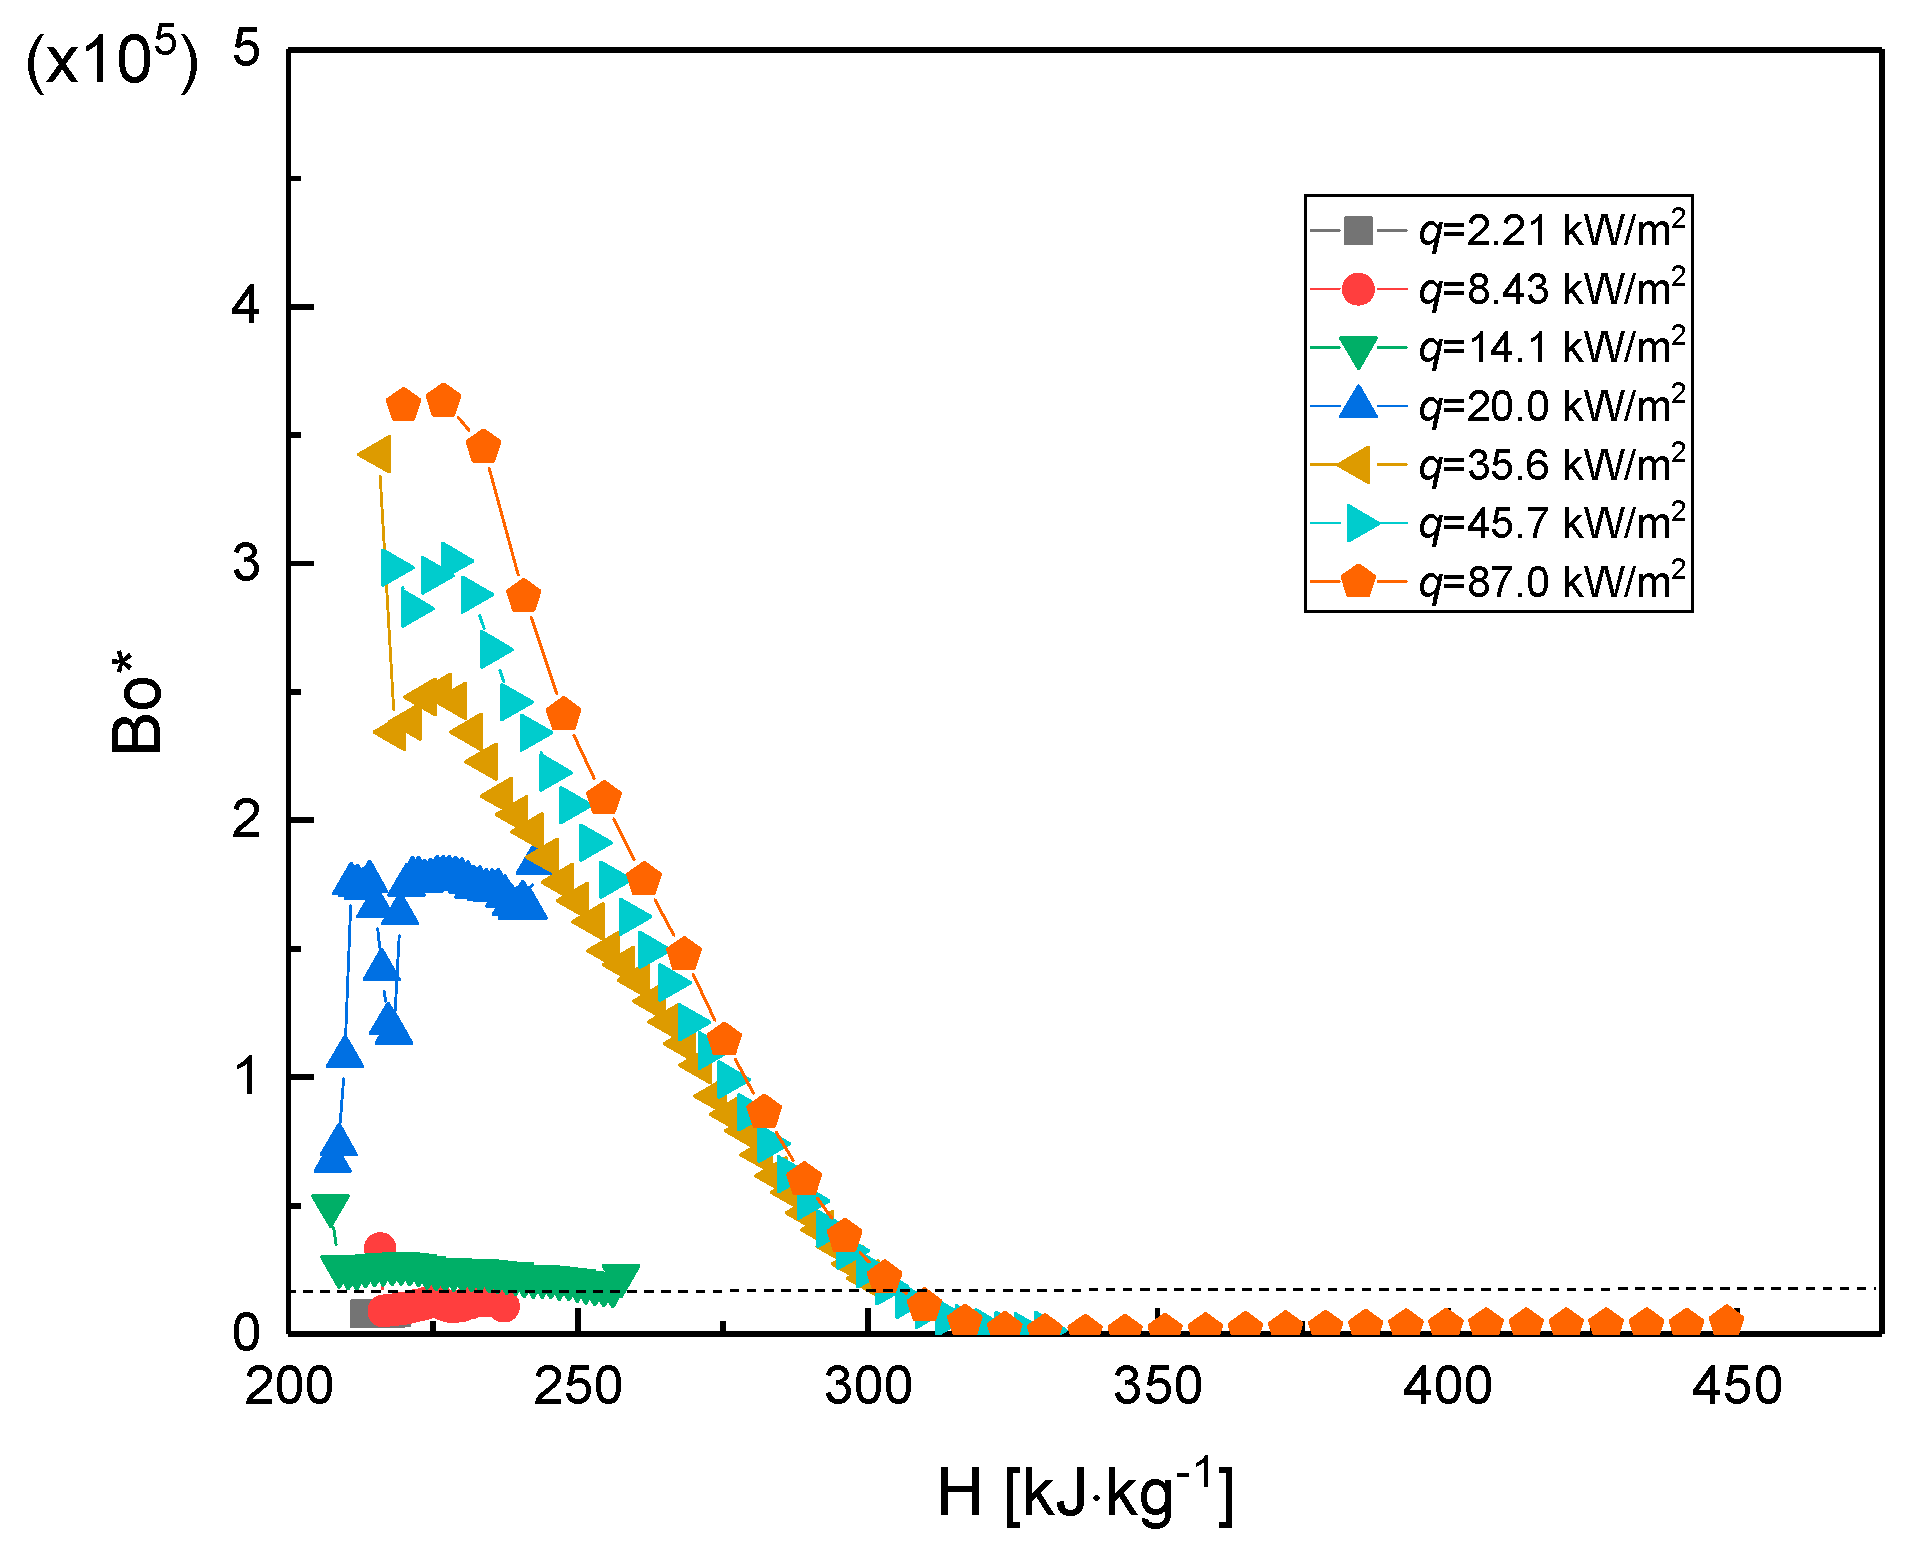
For fluids with constant thermo-physical properties, the fluid in the vicinity of wall achieves a balance under the combined effect of gravity, shear stress, and driving force (F1 = mg + τ1, F2 = mg + τ12). However, for strongly-varying density fluids, the buoyancy induced by the density difference between the central domain and the near-wall region may enhance and promote the mixing of fluid, and thus, intensify the mass transfer in the heated pipe. As can be seen from Figure 11, the direction of the resultant force was not perpendicular to the wall, and exhibited a certain angle between the flow direction and the wall. This was because the high-density fluid was always located in the central domain. The deflection angle was related to the magnitude of the heat fluxes. For low heat fluxes, there was not much density difference between the fluid in the near-wall region and the fluid in the central domain, while the direction of the resultant force almost became perpendicular to the wall. Additionally, the effect of buoyancy on the heat transfer induced by a small density gradient can be neglected. However, for high heat fluxes, the direction of buoyancy was similar to the flow direction as the large density gradient fluid changed position. Since the buoyancy was very strong at high heat flux (as seen in Figure 6b), natural convection was far higher than that of forced convection. Thus, the fluid in the near-wall region was hard to detach from the wall, and entered the mainstream area in the small channel. At the same time, the fluid close to the solid wall accelerated along the flow direction due to the drop in density, and the shear stress in the near-wall region reduced. Under the effects of buoyancy and thermal acceleration, the fluid with low density and low conductivity adhered to the near-wall region; thus, the heat transfer behavior in small heating channels at low mass flux was similar to “film boiling”, where the sublayer was occupied by a “vapor”, and the low mass flux did not cause enough mixing/instability to bring it to the bulk flow. The “vapor film” did get disturbed along the channel, leading to some decrease in HTC. The abovementioned modeling analysis can be verified using the results presented in Figure 12. Figure 12 shows the variations in buoyancy (Bo*) with the increase in bulk enthalpy at different heat fluxes for the pressure and mass flux of 7.5 MPa and 200 kg/m2s.
At a rather low heat flux (q < 14.1 kW/m2), which corresponded to a small temperature difference (tw − tb), the effect of thermal acceleration and buoyancy forces can be neglected () [39]. However, for a moderate or high heat flux, the manifestation of buoyancy forces and thermal acceleration was coupled with the density change that became more intense with the increase in heat flux [40]. However, the intensive buoyancy only took effect in the low-enthalpy region (H < 300 kJ/kg), which was accompanied by a strong variation in physical properties. As the bulk enthalpy exceeded the value of 300 kJ/kg, the buoyancy quickly decreased and reached the minimum value. In addition, low density and low conductivity “vapor” occupied the sublayer in the near-wall region, which was similar to the phenomenon observed in “film boiling”.
4. Numerical Simulation of Mixed Convection
To understand the mechanism of this particular heat transfer behavior at low mass flux, a three-dimensional (3D) axisymmetric physical model was built. In order to obtain the fully developed flow upstream, the tested heated section with a length of 1000 mm was arranged after the adiabatic section along the length of 200 mm. Besides, the hydraulic pressure drop in this study was negligible compared with the system pressure.
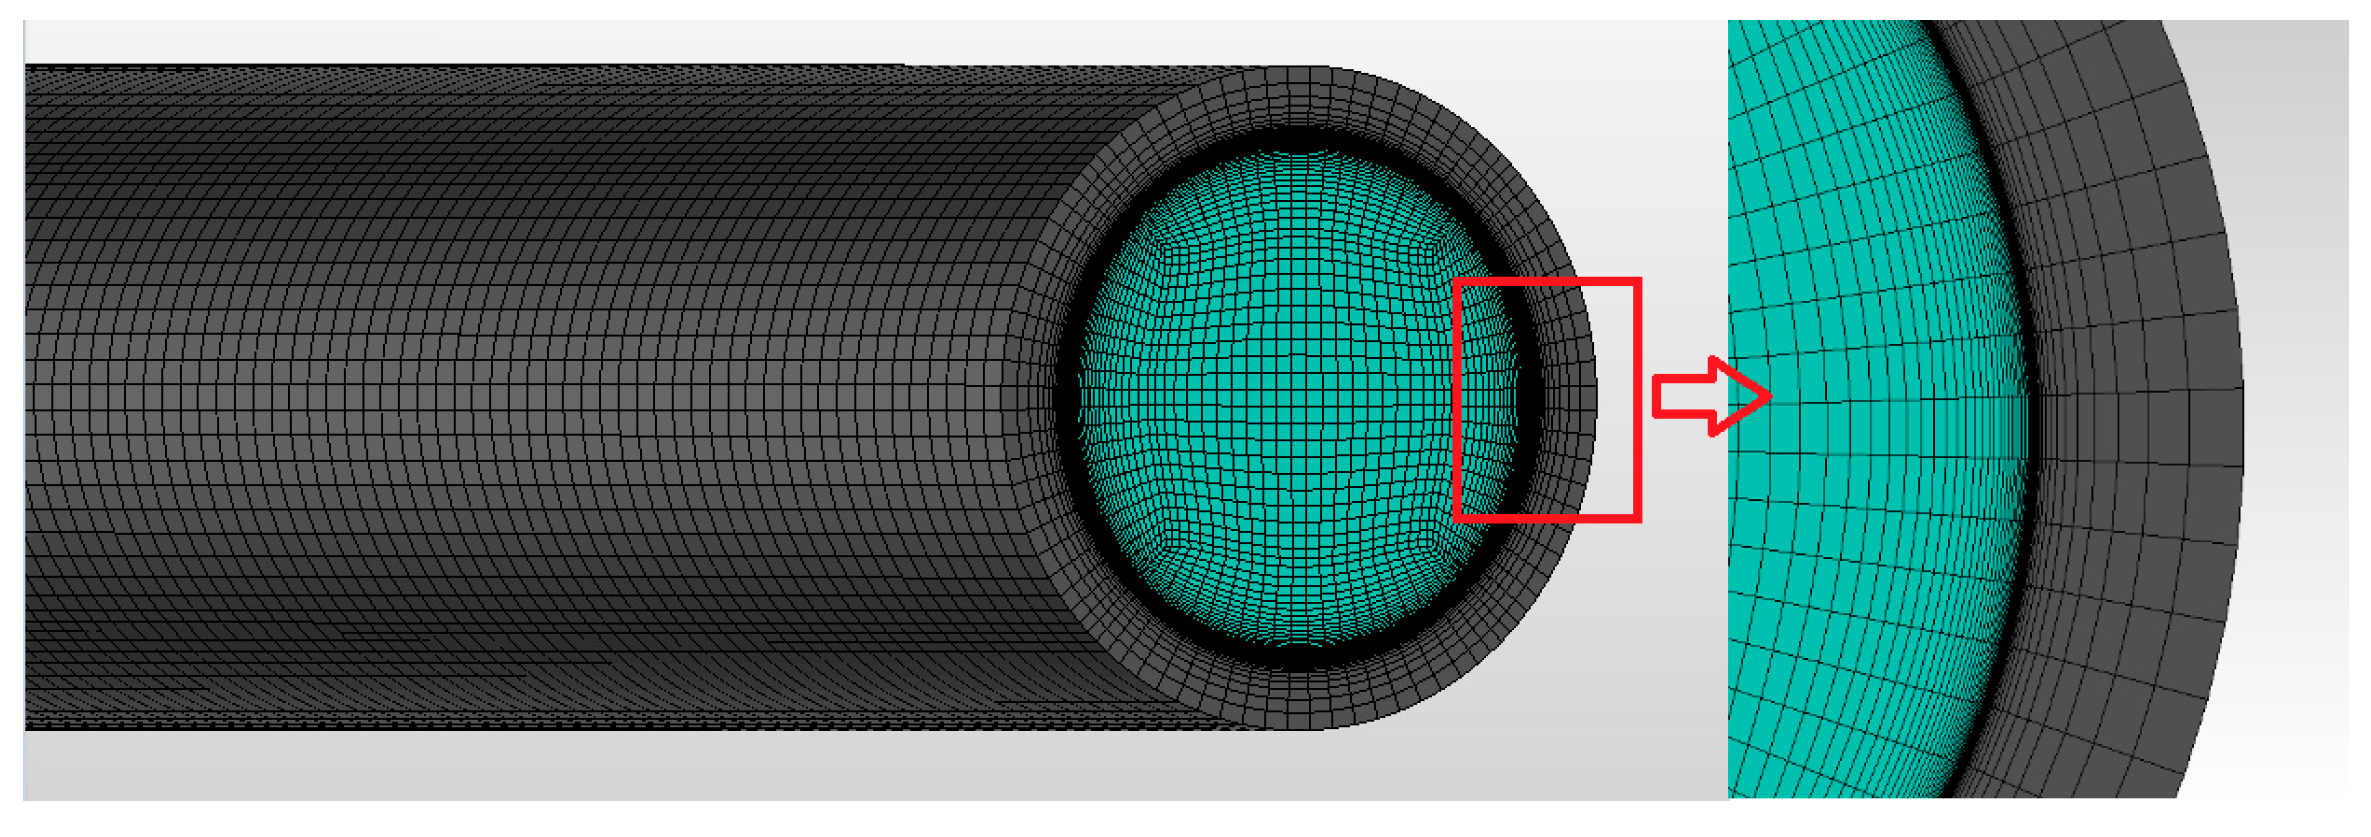
In order to significantly reduce the computational cost, the axisymmetric mesh was used. Finer mesh near the wall was built to ensure that the gradient in physical property could be properly resolved. The resolution of the boundary layer (mesh spacing near walls) plays a significant role in the accuracy of the determination of the wall’s shear-stress and heat-transfer coefficients; therefore, it should be carefully adjusted. To fulfill the requirement of near-wall models, the non-dimensional distance (y+) values at the wall-adjacent nodes should always be less than unity. Therefore, the position of the first near-wall node was adjusted for different fluids, as seen in Figure 13. At the inlet of the test section, the mass flux, temperature, turbulence intensity, and hydraulic diameter were specified, as seen in Table 1.
The outlet pressure was specified as the condition of the outlet boundary for the calculation domain, and the wall face was set as the heat-flux boundary. A finite-volume method [41] was employed, and the equations of momentum and continuity were integrated over each computational cell. The computations of the heat transfer deterioration phenomenon were performed using the well-validated commercial CFD code Fluent. The coupling between the pressure and velocity was implemented using the SIMPLEC algorithm. A quick upwind scheme was used to discretize the equations in this work, while the discretization equations were then linearized and solved in a segregated manner. Considering the fast and steep variation in the supercritical fluid’s thermo-physical properties in the pseudocritical region, precise thermo-physical properties should be given using a proper equation. Therefore, in this paper, a standard reference database derived from NIST RefProp [42] (National Institute of Standards and Technology) was called upon in the simulations.
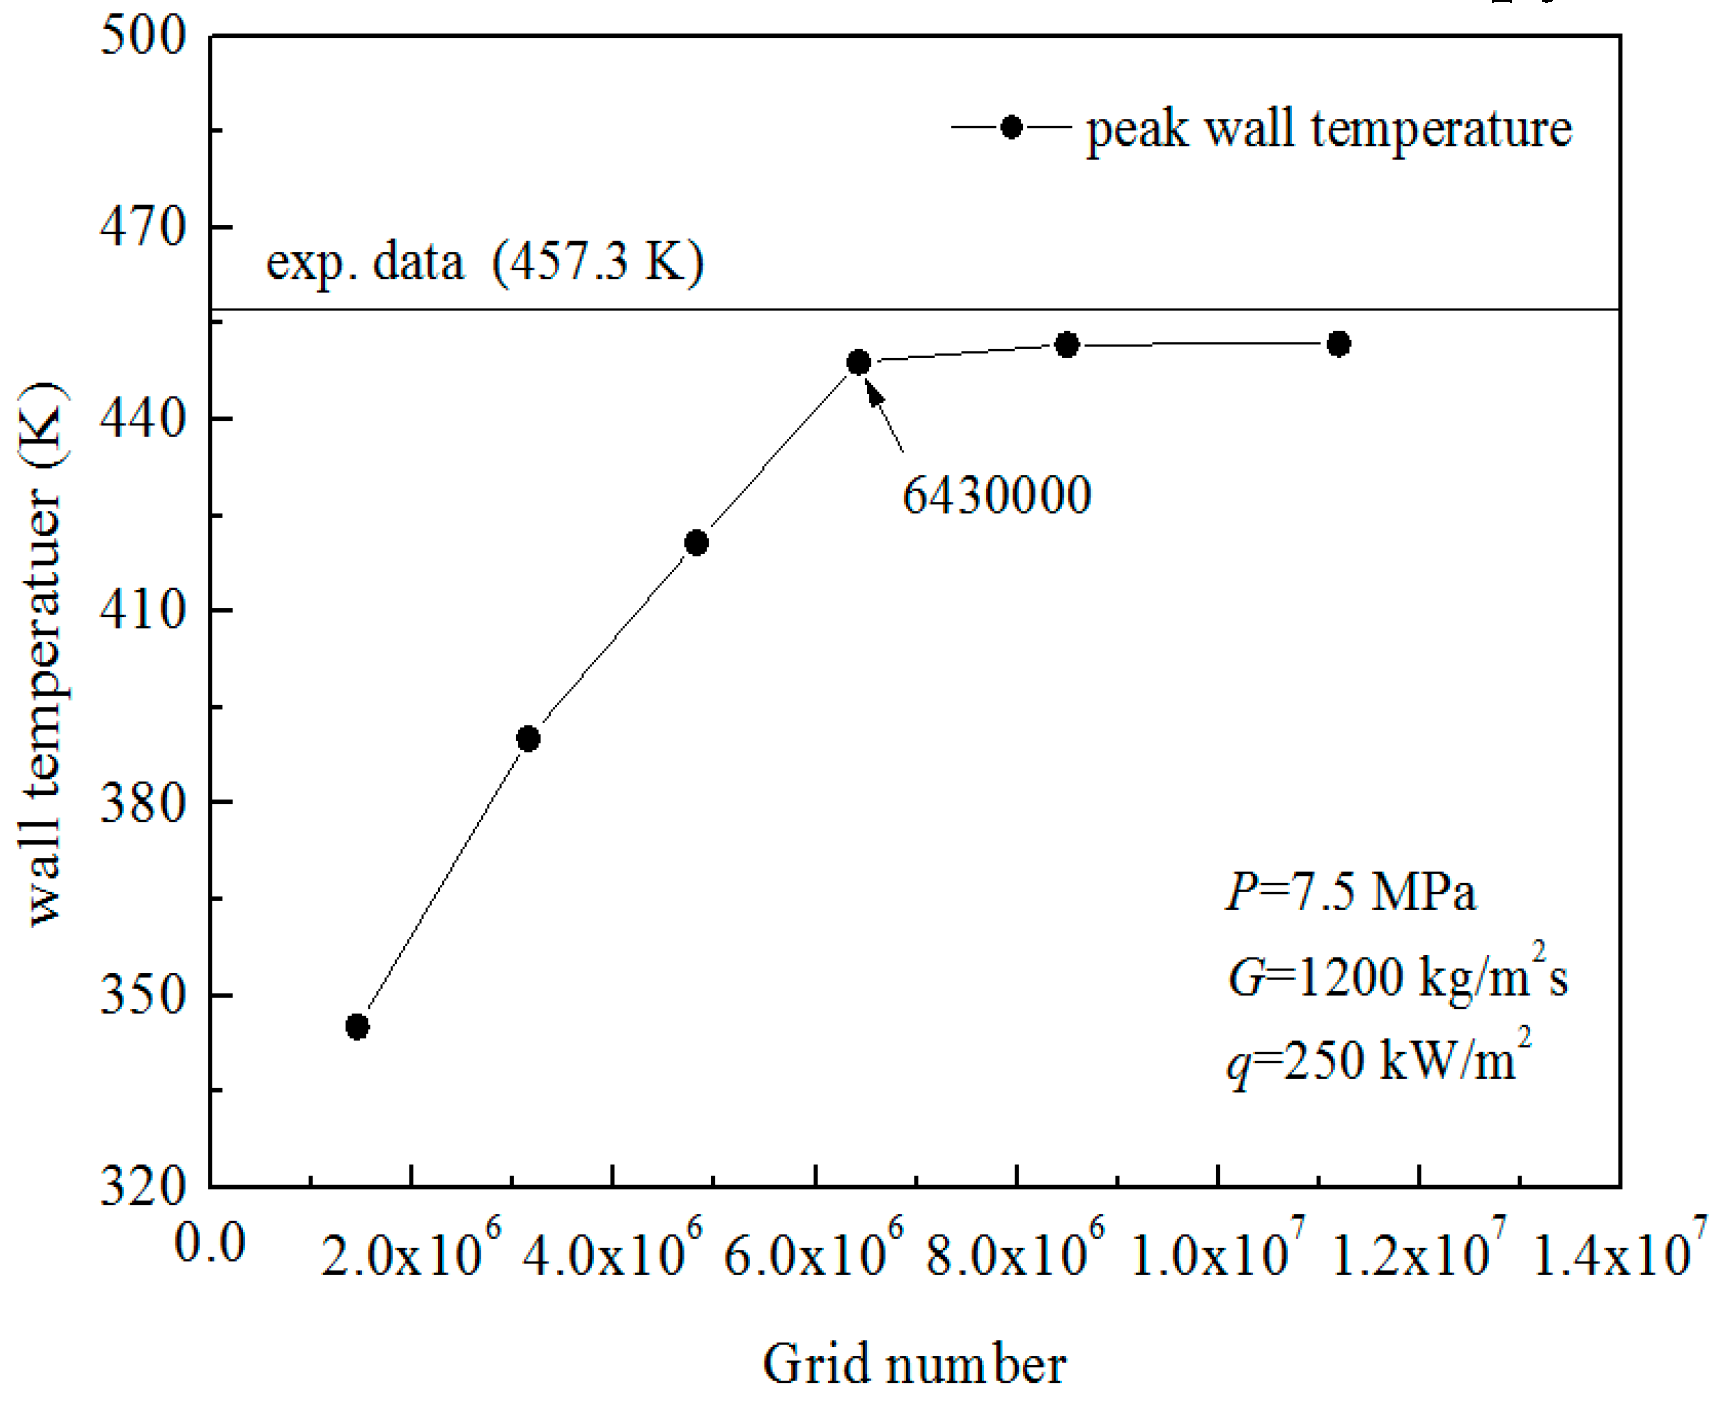
Firstly, the mesh dependence was analyzed, as shown in Figure 14. It was found that when the grid mesh number was 6.43 million, the wall temperature was similar to the experimental data. Further increase in the grid number did not improve the solution’s accuracy.
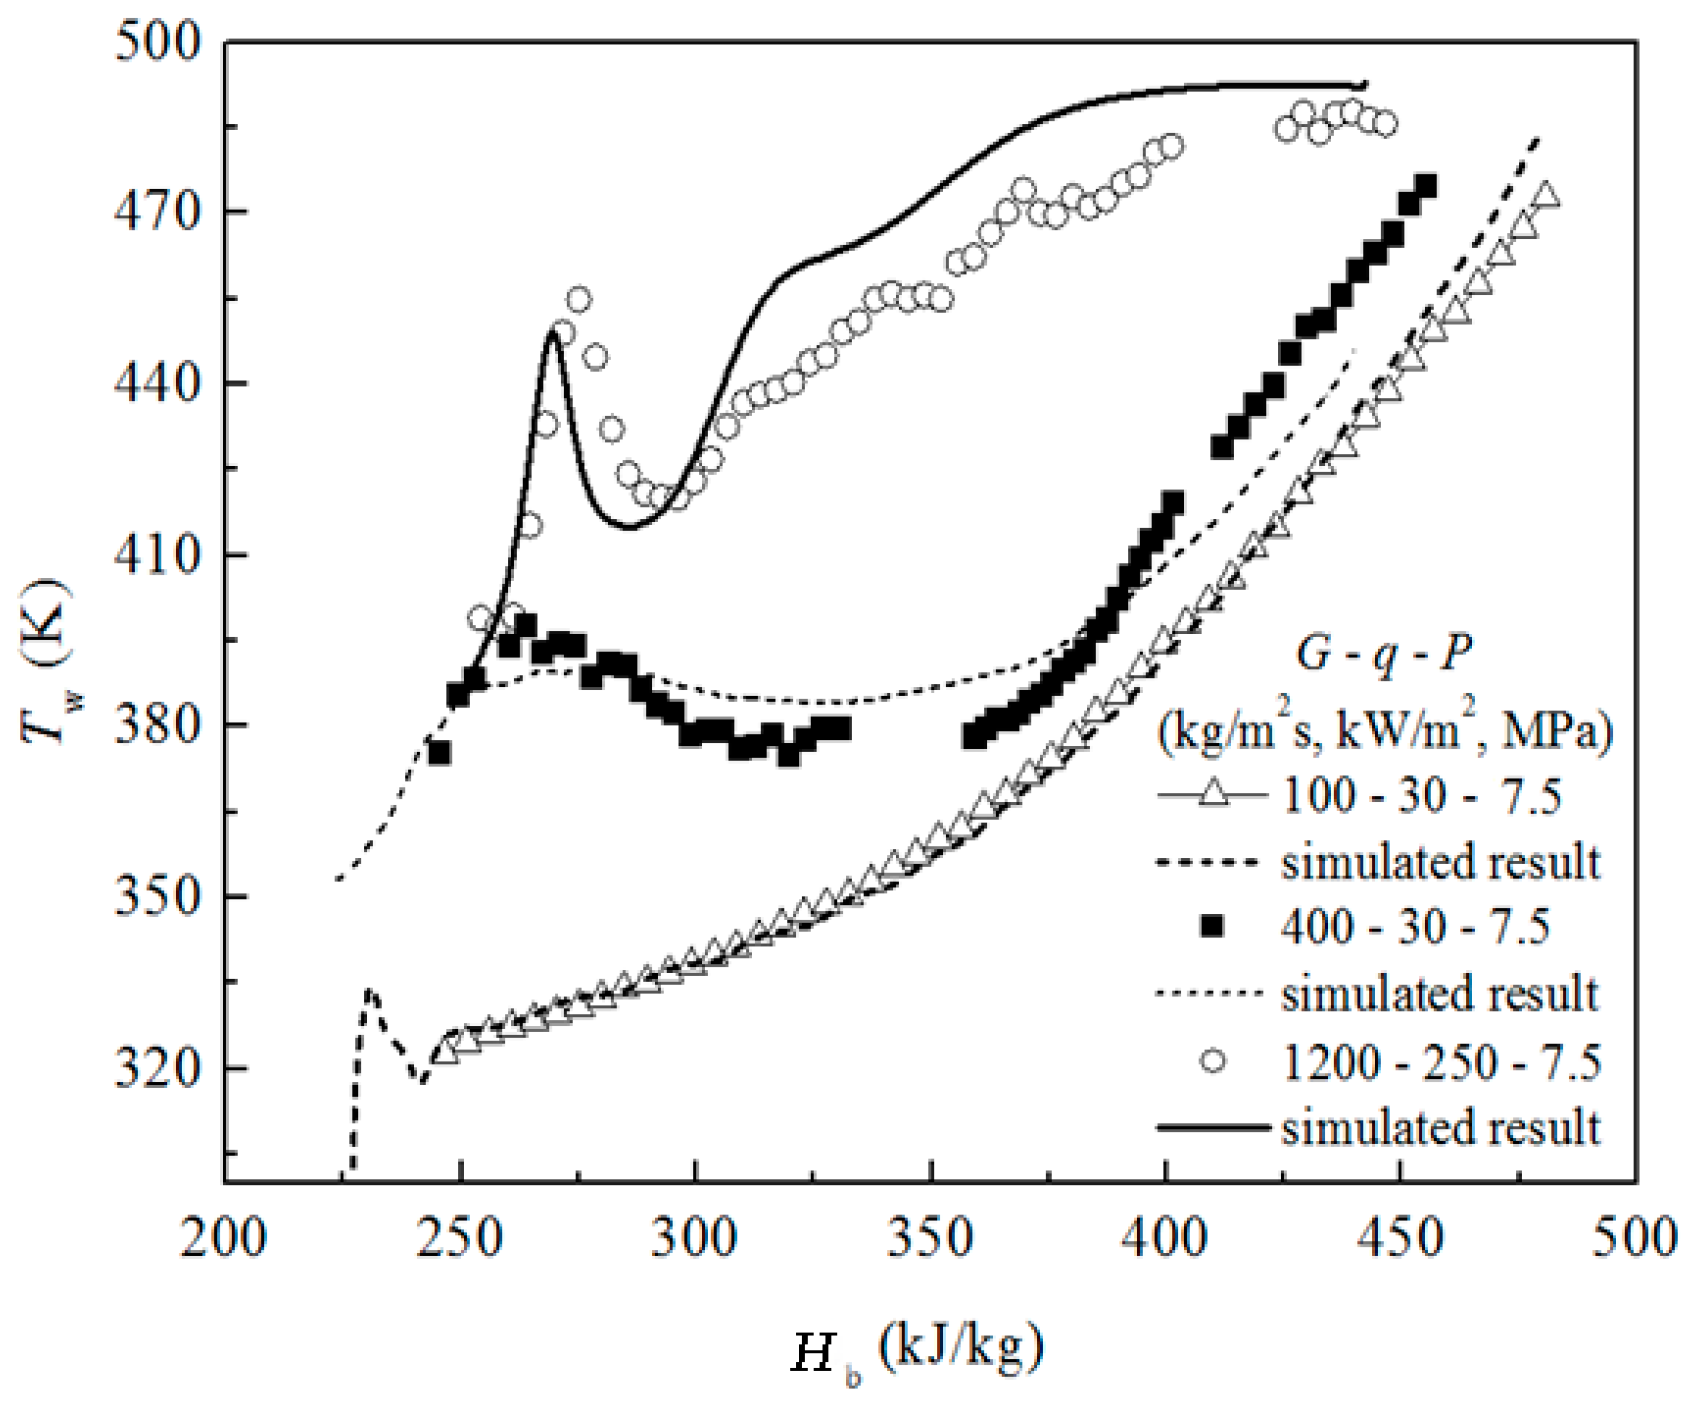
It is worth noticing that the accuracy of the numerical simulation of the heat transfer of supercritical carbon dioxide may strongly depend on the turbulence models employed in the numerical calculations. A previous study [36] pointed out that the SST k-w turbulent model can obtain a better result than that of other turbulent models for supercritical vertical flow. Therefore, in the present paper, the numerical simulation was implemented based on this model, whereas the verification of the model is shown in Figure 15. A series of temperature profiles for different mass fluxes are shown in Figure 15. The calculated inner-wall temperatures for all of the mass fluxes were found to be in very good agreement with the experimental data, especially for the cases with low mass fluxes.
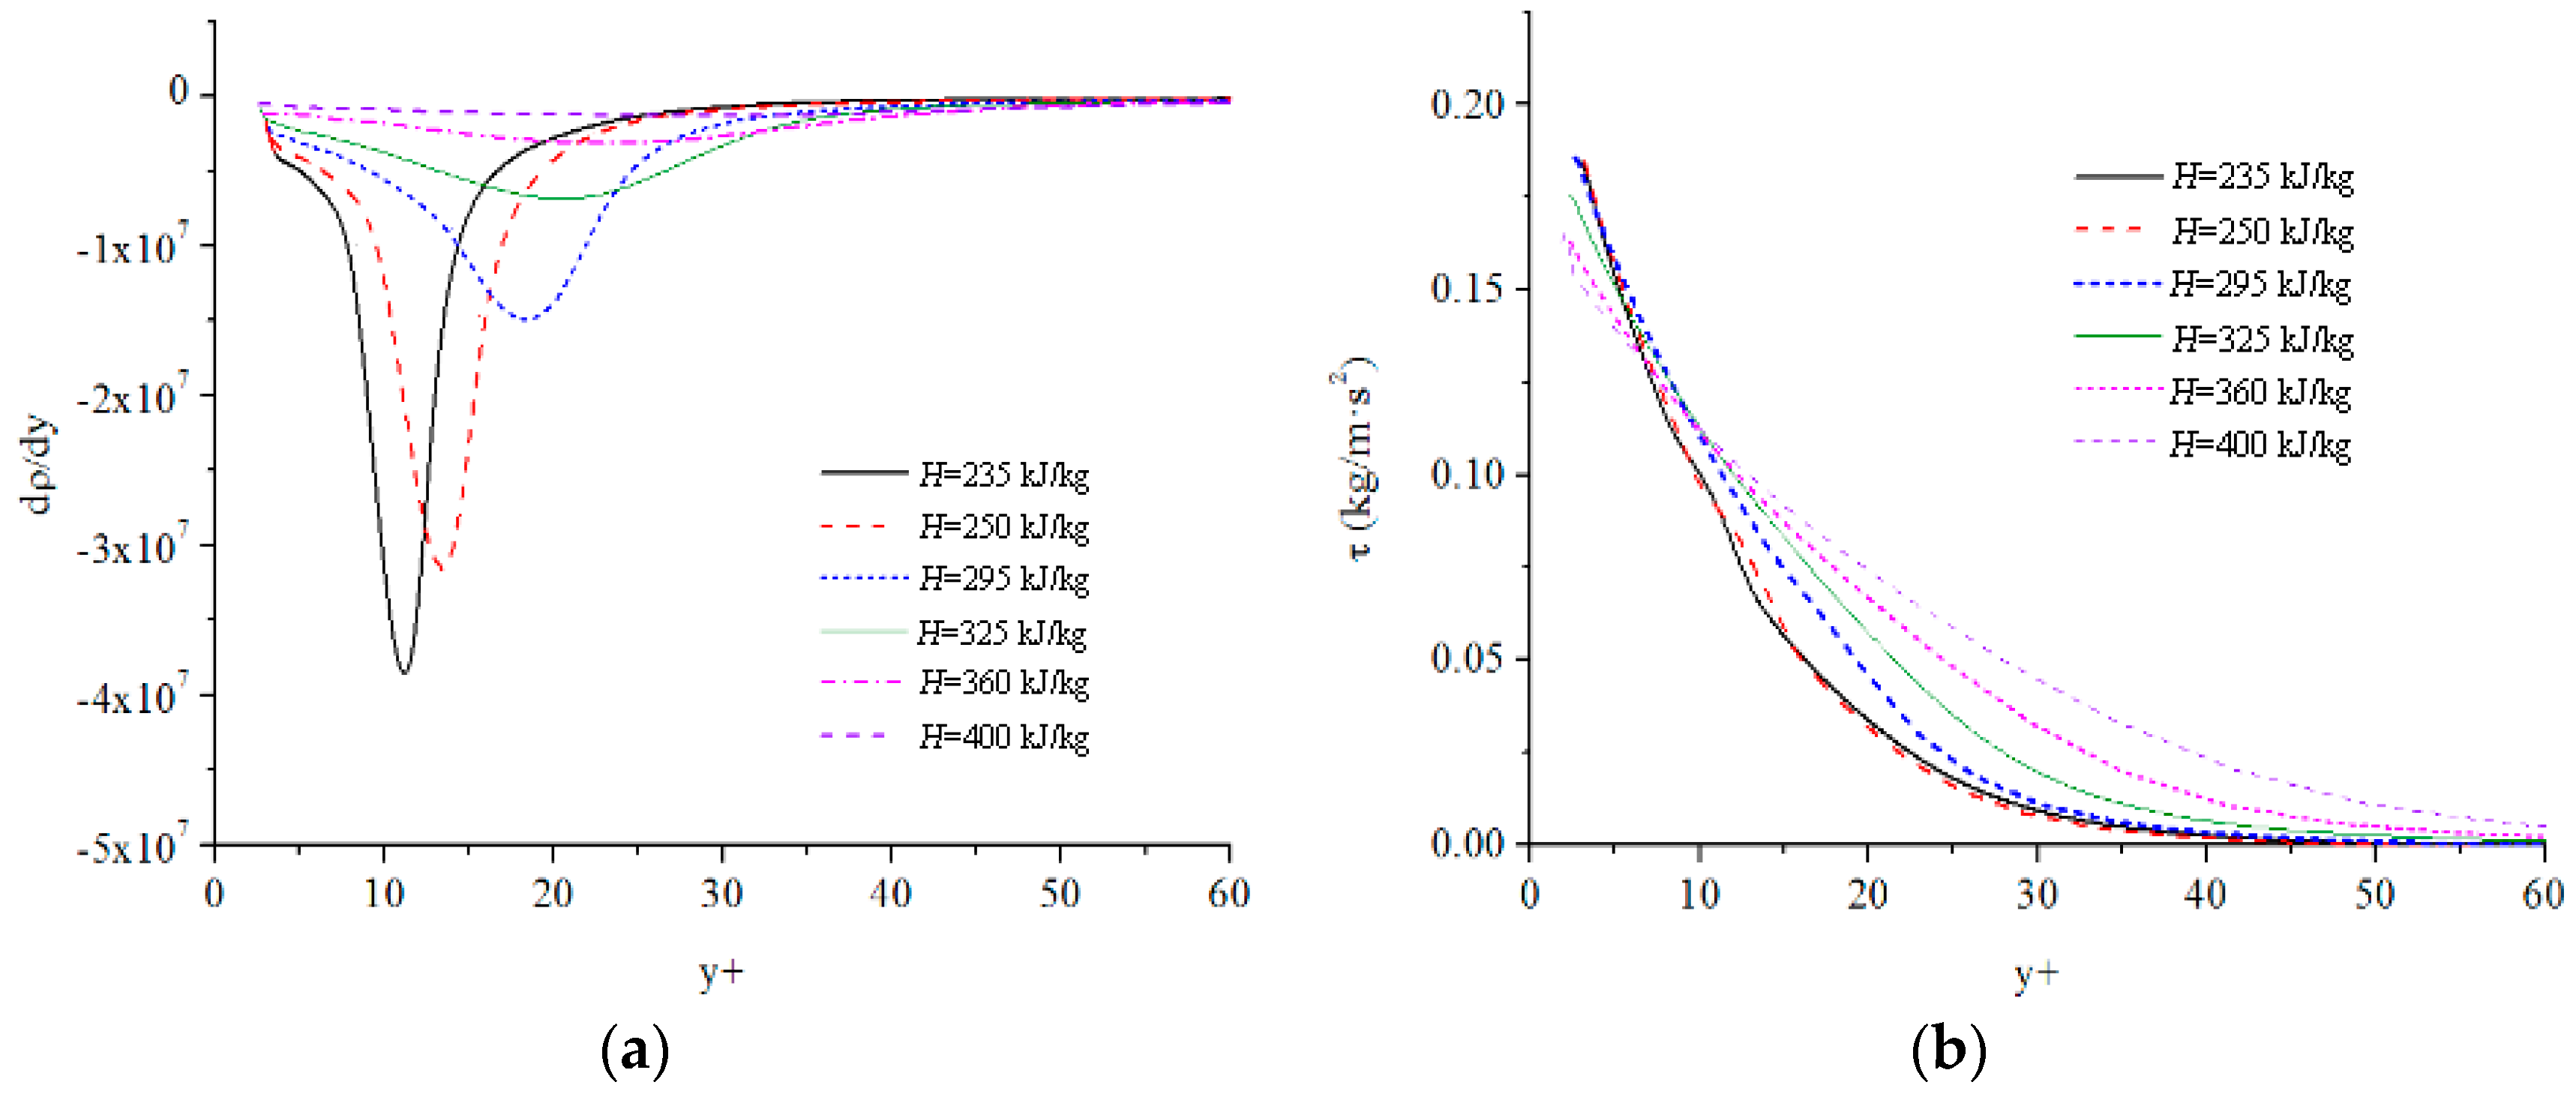
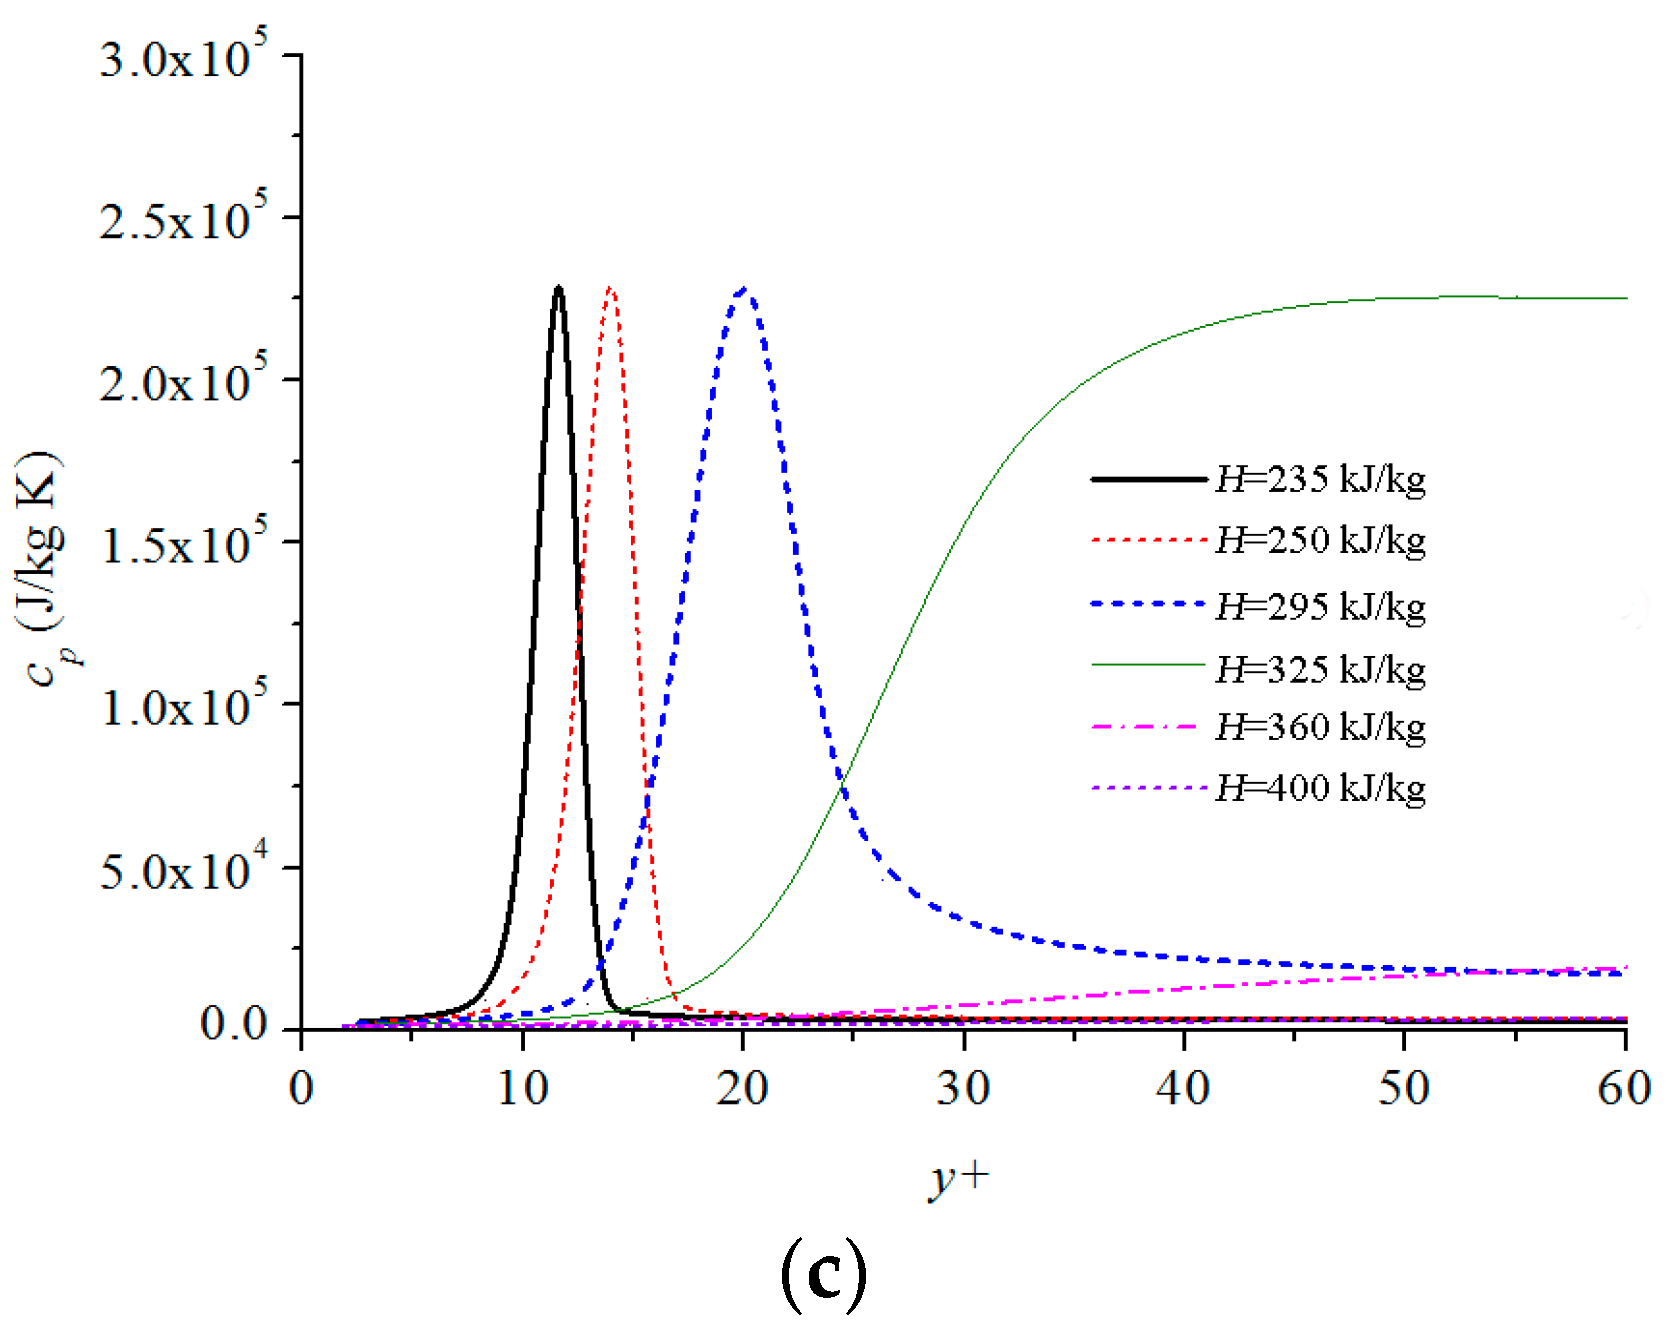
After validation, the mechanism of heat transfer at low mass flux was further discussed. The case in which the pressure, mass flux, and heat flux were 7.5 MPa, 100 kg/m2s, and 30 kW/m2, respectively, was chosen as an example to describe the distribution of various parameters along the cross-section. Figure 16 shows the distributions of density gradient, shear stress, and specific heat in the near-wall region at different cross-sections (H is the bulk enthalpy).
As can be seen in Figure 16, an obvious density gradient was formed in the near-wall region (y+ < 10) when the bulk enthalpy attained the value of 235 kJ/kg. This may lead to a large buoyancy effect. The fluid in the near-wall region was easy to drive away from the wall under the effect of the enhancement of the driving force, which was inconsistent with the flow direction. Meanwhile, a large reduction in density accelerated the local fluid, whereas the corresponding shear stress attained a high value. Furthermore, the fluid with high specific heat occupied the near-wall region, and could carry significant amount of added heat. Therefore, the temperature increased slowly and gradually.
However, with the increase in bulk enthalpy, the density gradient reduced, and the “pit” moved away from the wall. Therefore, the driving force gradually decreased, while the shear stress in the near wall region (y+ < 10) also decreased due to the reduced variations in density gradient and viscosity. The fluid with high specific heat also moved away from the wall, which demonstrated that once lower specific-heat capacity, lower thermal conductivity, lower viscosity, and lighter density continuously gathered in the near-wall region, the phenomenon became similar to the one that takes place in film boiling at subcritical pressure. This phenomenon increases the thermal resistance, and enormously hinders the transmission of heat flux from the wall to the fluid. This makes the wall temperature increase quickly, and weakens the heat transfer in this layer; as a result, the temperature increases faster than in the low-enthalpy region.
5. Conclusions
This work experimentally and numerically investigated the hidden mechanism of special heat transfer characteristics for supercritical carbon dioxide at low mass fluxes in vertically upward tubes with inside diameters (ID) of 5 mm. Based on the results, following conclusions are drawn.
- (1).
- Special heat transfer behaviors at low mass flux are observed that are different from the cases at moderate and high mass fluxes. In this particular heat transfer process, the temperature monotonously increases without any remarkable peak with the increase in either bulk enthalpy or x/D.
- (2).
- Mixed convection in the heated channel is analyzed for different heat fluxes, and the parametric effects on the convective heat transfer are discussed. The buoyancy took effect only in a certain enthalpy range (for G = 100 kg/m2s, P = 7.5 MPa, and H < 300 kJ/kg). Furthermore, in the other high-enthalpy region, the “vapor-like” fluid occupies the near-wall region. The mass flux will promote the heat transfer, though pressure does just the opposite to heat transfer.
- (3).
- The mechanism of this particular heat transfer behavior at low mass fluxes is further investigated numerically. The lower specific heat capacity, lower thermal conductivity, lower viscosity, and lighter density continuously gather in the near-wall region, which is similar to the phenomenon that occurs in film boiling at subcritical pressure.
Acknowledgements
The authors acknowledge the support of State Key Development Program for Basic Research of China (Grant No. 2015CB251502), National Science Foundation for Young Scientists of China (Grant No. 51506170), National Science Foundation for Post-doctoral Scientists of China (Grant No. 2015M570840), and the Fundamental Research Funds for the Central Universities and China Scholarship Council.
Author Contributions
Xianliang Lei and Jun Zhang conceived and designed the experiments; Xianliang Lei performed the experiments; Xianliang Lei and Qian Zhang analyzed the data; Xianliang Lei and Huixiong Li wrote the paper.
Conflicts of Interest
The authors declare no conflict of interest.
Nomenclature
| Bo* | Buoyancy parameter, , dimensionless |
| cp | specific heat at constant pressure (J/kg·K) |
| d | inside diameter (m) |
| DNS | direct numerical simulation |
| G | mass flux (kg/m2s) |
| g | gravitational acceleration (m/s2) |
| Gr | Grashof number ( ), dimensionless |
| Gr* | Grashof number ( ), dimensionless |
| h | heat transfer coefficient (W/m2K) |
| H | specific enthalpy (kJ/kg) |
| L/ | length (m) |
| Pr | Prandtl number ( ), dimensionless |
| P | Pressure (MPa) |
| averaged heat flux (kW/m2) | |
| q | heat flux (kW/m2) |
| Re | Reynolds number ( ), dimensionless |
| r | radius (m) |
| t | temperature (°C) |
| T | temperature (K) |
| u | velocity vector (m/s) |
| x | location (m) |
| Greek symbols | |
| β | thermal expansion coefficient (1/°C) |
| μ | dynamic viscosity (Pa·s) |
| λ | thermal conductivity (W/(m·K)) |
| ν | viscosity (m2/s) |
| ρ | density (kg/m3) |
| τ | shear stress (Pa·s) |
| Subscripts | |
| b | at bulk temperature |
| c | at thermodynamic critical pressure |
| min | Minimum |
| pc | pseudocritical |
| w | at the wall temperature |
References
- Jackson, J.D. Fluid flow and convective heat transfer to fluids at supercritical pressure. Nucl. Eng. Des. 2013, 264, 24–40. [Google Scholar] [CrossRef]
- Duffey, R.; Pioro, I. Experimental heat transfer of supercritical carbon dioxide flowing inside channels (survey). Nucl. Eng. Des. 2005, 235, 913–924. [Google Scholar] [CrossRef]
- Cheng, L.; Ribatski, G.; Thome, J.R. Analysis of supercritical CO2 cooling in macro- and micro-channels. Int. J. Refrig. 2008, 31, 1301–1316. [Google Scholar] [CrossRef]
- Pioro, I.L.; Duffey, R.B. Heat Transfer & Hydraulic Resistance at Supercritical Pressures in Power Engineering Applications; ASME Press: New York, NY, USA, 2007. [Google Scholar]
- Bae, Y.-Y.; Kim, H.-Y.; Kang, D.-J. Forced and mixed convection heat transfer to supercritical CO2 vertically flowing in a uniformly-heated circular tube. Exp. Therm. Fluid Sci. 2010, 34, 1295–1308. [Google Scholar] [CrossRef]
- Bae, Y.Y.; Kim, H.Y. Convective heat transfer to CO2 at a supercritical pressure flowing vertically upward in tubes and an annular channel. Exp. Therm. Fluid Sci. 2009, 33, 329–339. [Google Scholar] [CrossRef]
- Xu, J.L.; Yang, C.Y.; Zhang, W.; Sun, D. Turbulent convective heat transfer of CO2 in a helical tube at near-critical pressure. Int. J. Heat Mass Transf. 2015, 80, 748–758. [Google Scholar] [CrossRef]
- Yang, C.Y.; Xu, J.L.; Wang, X.D.; Zhang, W. Mixed convective flow and heat transfer of supercritical CO2 in circular tubes at various inclination angles. Int. J. Heat Mass Transf. 2013, 64, 212–223. [Google Scholar] [CrossRef]
- Bae, J.H.; Yoo, J.Y.; Choi, H. Direct numerical simulation of turbulent supercritical flows with heat transfer. Phys. Fluids 2005, 17. [Google Scholar] [CrossRef]
- Bae, J.H.; Yoo, J.Y.; McEligot, D.M. Direct numerical simulation of heated CO2 flows at supercritical pressure in a vertical annulus at Re = 8900. Phys. Fluids 2008, 20. [Google Scholar] [CrossRef]
- Nemati, H.; Patel, A.; Boersma, B.J.; Pecnik, R. The effect of thermal boundary conditions on forced convection heat transfer to fluids at supercritical pressure. J. Fluid Mech. 2016, 800, 531–556. [Google Scholar] [CrossRef]
- Peeters, J.W.R.; Pecnik, R.; Rohde, M.; van der Hagen, T.H.J.J.; Boersma, B.J. Turbulence attenuation in simultaneously heated and cooled annular flows at supercritical pressure. J. Fluid Mech. 2016, 799, 505–540. [Google Scholar] [CrossRef]
- Chen, L.; Zhang, X.-R.; Jiang, B. Effects of Heater Orientations on the Natural Circulation and Heat Transfer in a Supercritical CO2 Rectangular Loop. J. Heat Transf. 2014, 136. [Google Scholar] [CrossRef]
- Cao, Y.; Zhang, X.-R. Flow and heat transfer characteristics of supercritical CO2 in a natural circulation loop. Int. J. Therm. Sci. 2012, 58, 52–60. [Google Scholar] [CrossRef]
- Bovard, S.; Abdi, M.; Nikou, M.R.K.; Daryasafar, A. Numerical investigation of heat transfer in supercritical CO2 and water turbulent flow in circular tubes. J. Supercrit. Fluids 2017, 119, 88–103. [Google Scholar] [CrossRef]
- Fard, M.H. CFD modeling of heat transfer of CO2 at supercritical pressures flowing vertically in porous tubes. Int. Commun. Heat Mass Transf. 2010, 37, 98–102. [Google Scholar] [CrossRef]
- Jiang, P.-X.; Zhang, Y.; Zhao, C.-R.; Shi, R.F. Convection heat transfer of CO2 at supercritical pressures in a vertical mini tube at relatively low reynolds numbers. Exp. Therm. Fluid Sci. 2008, 32, 1628–1637. [Google Scholar] [CrossRef]
- Jiang, P.X.; Zhang, Y.; Xu, Y.J.; Shi, R.F. Experimental and numerical investigation of convection heat transfer of CO2 at supercritical pressures in a vertical tube at low Reynolds numbers. Int. J. Therm. Sci. 2008, 47, 998–1011. [Google Scholar] [CrossRef]
- Jiang, P.; Zhao, C.; Deng, J.; Zhang, W. Experimental Investigation of Local Heat Transfer of Carbon Dioxide at Super-Critical Pressures in a Vertical Tube and Multi-Port Mini-Channels Under Cooling Conditions. In Proceedings of the International Refrigeration and Air Conditioning Conference, West Lafayette, Indiana, 14–17 July 2008. [Google Scholar]
- Jiang, P.-X.; Xu, Y.-J.; Shi, R.-F.; He, S. Experimental and Numerical Investigation of Convection Heat Transfer of CO2 at Supercritical Pressures in a Vertical Mini TUBE; Rochester, N.Y., Ed.; American Society of Mechanical Engineers: New York, NY, USA, 2004; pp. 333–340. [Google Scholar]
- Cao, X.L.; Rao, Z.H.; Liao, S.M. Laminar convective heat transfer of supercritical CO2 in horizontal miniature circular and triangular tubes. Appl. Therm. Eng. 2011, 31, 2374–2384. [Google Scholar] [CrossRef]
- Du, Z.; Lin, W.; Gu, A. Numerical investigation of cooling heat transfer to supercritical CO2 in a horizontal circular tube. J. Supercrit. Fluids 2010, 55, 116–121. [Google Scholar] [CrossRef]
- Cheng, X.; Liu, X.J.; Gu, H.Y. Fluid to Fluid scaling of heat transfer in circular tubes cooled with supercritical fluids. Nucl. Eng. Des. 2011, 241, 498–508. [Google Scholar] [CrossRef]
- Loewenberg, M.; Laurien, E.; Class, A.; Schulenberg, T. Supercritical water heat transfer in vertical tubes: A look-up table. Prog. Nucl. Energy 2008, 50, 532–538. [Google Scholar] [CrossRef]
- Yamagata, K.; Yoshida, S.; Fujii, T.; Yoshida, S. Forced Convective Heat-Transfer to Supercritical Water Flowing in Tubes. Int. J. Heat Mass Transf. 1972, 15, 2575–2593. [Google Scholar] [CrossRef]
- Kim, D.E.; Kim, M.-H. Experimental investigation of heat transfer in vertical upward and downward supercritical CO2 flow in a circular tube. Int. J. Heat Fluid Flow 2011, 32, 176–191. [Google Scholar] [CrossRef]
- Zahlan, H.; Groeneveld, D.; Tavoularis, S. Measurements of convective heat transfer to vertical upward flows of CO2 in circular tubes at near-critical and supercritical pressures. Nucl. Eng. Des. 2015, 289, 92–107. [Google Scholar] [CrossRef]
- Kurganov, V.A. Predicting Normal and Deteriorated Heat-Transfer with Mixed Convection of Heat Carrier at Supercritical Pressure in Vertical Tubes. Therm. Eng. 1991, 38, 40–45. [Google Scholar]
- Hall, W.B.; Jackson, J.D.; Watson, A. A review of forced convection heat transfer to fluids at supercritical pressures. Proc. Inst. Mech. Eng. 1967, 182, 10–22. [Google Scholar] [CrossRef]
- Goldmann, K. Heat transfers to supercritical water at 5000 psi flowing at high mass flow rates through round tubes. Int. J. Heat Mass Transf. 1961, Part III, 561–568. [Google Scholar]
- Kafengauz, N.; Federov, M. Pseudoboiling and heat transfer in a turbulent flow. Inzhenerno-Fizicheskii Zhurnal 1968, 14, 923–924. [Google Scholar] [CrossRef]
- Shitsman, M.E. Impairment of the heat transmission at supercritical pressure. Teplofizika Vysokikh Temp. 1963, 1, 267–275. [Google Scholar]
- Ackerman, J.W. Pseudoboiiing Heat Transfer to Supercritical Pressure Water in Smooth and Ribbed Tubes. J. Heat Transf. 1970, 92, 490–497. [Google Scholar] [CrossRef]
- Kurganov, V.A.; Kaptilny, A.G. Velocity and Enthalpy Fields and Eddy Diffusivities in a Heated Supercritical Fluid-Flow. Exp. Therm. Fluid Sci. 1992, 5, 465–478. [Google Scholar] [CrossRef]
- Bazargan, M.; Fraser, D.; Chatoorgan, V. Effect of buoyancy on heat transfer in supercritical water flow in a horizontal round tube. J. Heat Transf. 2005, 127, 897–902. [Google Scholar] [CrossRef]
- Huang, D.; Wu, Z.; Sunden, B.; Li, W. A brief review on convection heat transfer of fluids at supercritical pressures in tubes and the recent progress. Appl. Energy 2016, 162, 494–505. [Google Scholar] [CrossRef]
- Mohseni, M.; Bazargan, M. Effect of turbulent Prandtl number on convective heat transfer to turbulent flow of a supercritical fluid in a vertical round tube. J. Heat Transf. 2011, 133. [Google Scholar] [CrossRef]
- Lei, X.; Li, H.; Zhang, W.; Dinh, N.T.; Guo, Y.; Yu, S. Experimental study on the difference of heat transfer characteristics between vertical and horizontal flows of supercritical pressure water. Appl. Therm. Eng. 2017, 113, 609–620. [Google Scholar] [CrossRef]
- Jackson, J.D.; Lutterodt, K.E.; Weinberg, R. Experimental Studies of Buoyancy-influenced Convective Heat Transfer in Heated Vertical Tubes at Pressures Just Above and Just Below the Thermodynamic Critical Value. In Proceedings of the Joint International Conference on Global Environment and Nuclear Energy System/Advanced Power Plants, Kyoto, Japan, 15–19 September 2003. GENES4/ANP2003; Paper 1177. [Google Scholar]
- Polyakov, A.F. Heat Transfer under Supercritical Pressures. Adv. Heat Transf. 1991, 21, 1–53. [Google Scholar]
- Tao, W.Q. Numerical Heat Transfer; Xi’an Jiaotong University Press: Xi’an, China, 2001; pp. 333–392. [Google Scholar]
- Lemmon, E.W.; Huber, M.L.; McLinden, M.O. NIST Reference Fluid Thermodynamic and Transport Properties—REFPROP; U.S. Secretary of Commerce on Behalf of the United States of America: Gaithersburg, MD, USA, 2007.
Figure 1.
Variation in thermo-physical properties of CO2 in the supercritical region at different pressures (a) specific heat; (b) density; (c) viscosity; (d) thermal conductivity.
Figure 1.
Variation in thermo-physical properties of CO2 in the supercritical region at different pressures (a) specific heat; (b) density; (c) viscosity; (d) thermal conductivity.

Figure 2.
Profiles of the inner-wall temperatures for different mass fluxes. (a) Mass flux (G) = 232 kg/m2s (data from Kim [26]); (b) G = 700 kg/m2s (data from Zahlan [27]); (c) G = 1200 kg/m2s (data from Kurganov [28]).
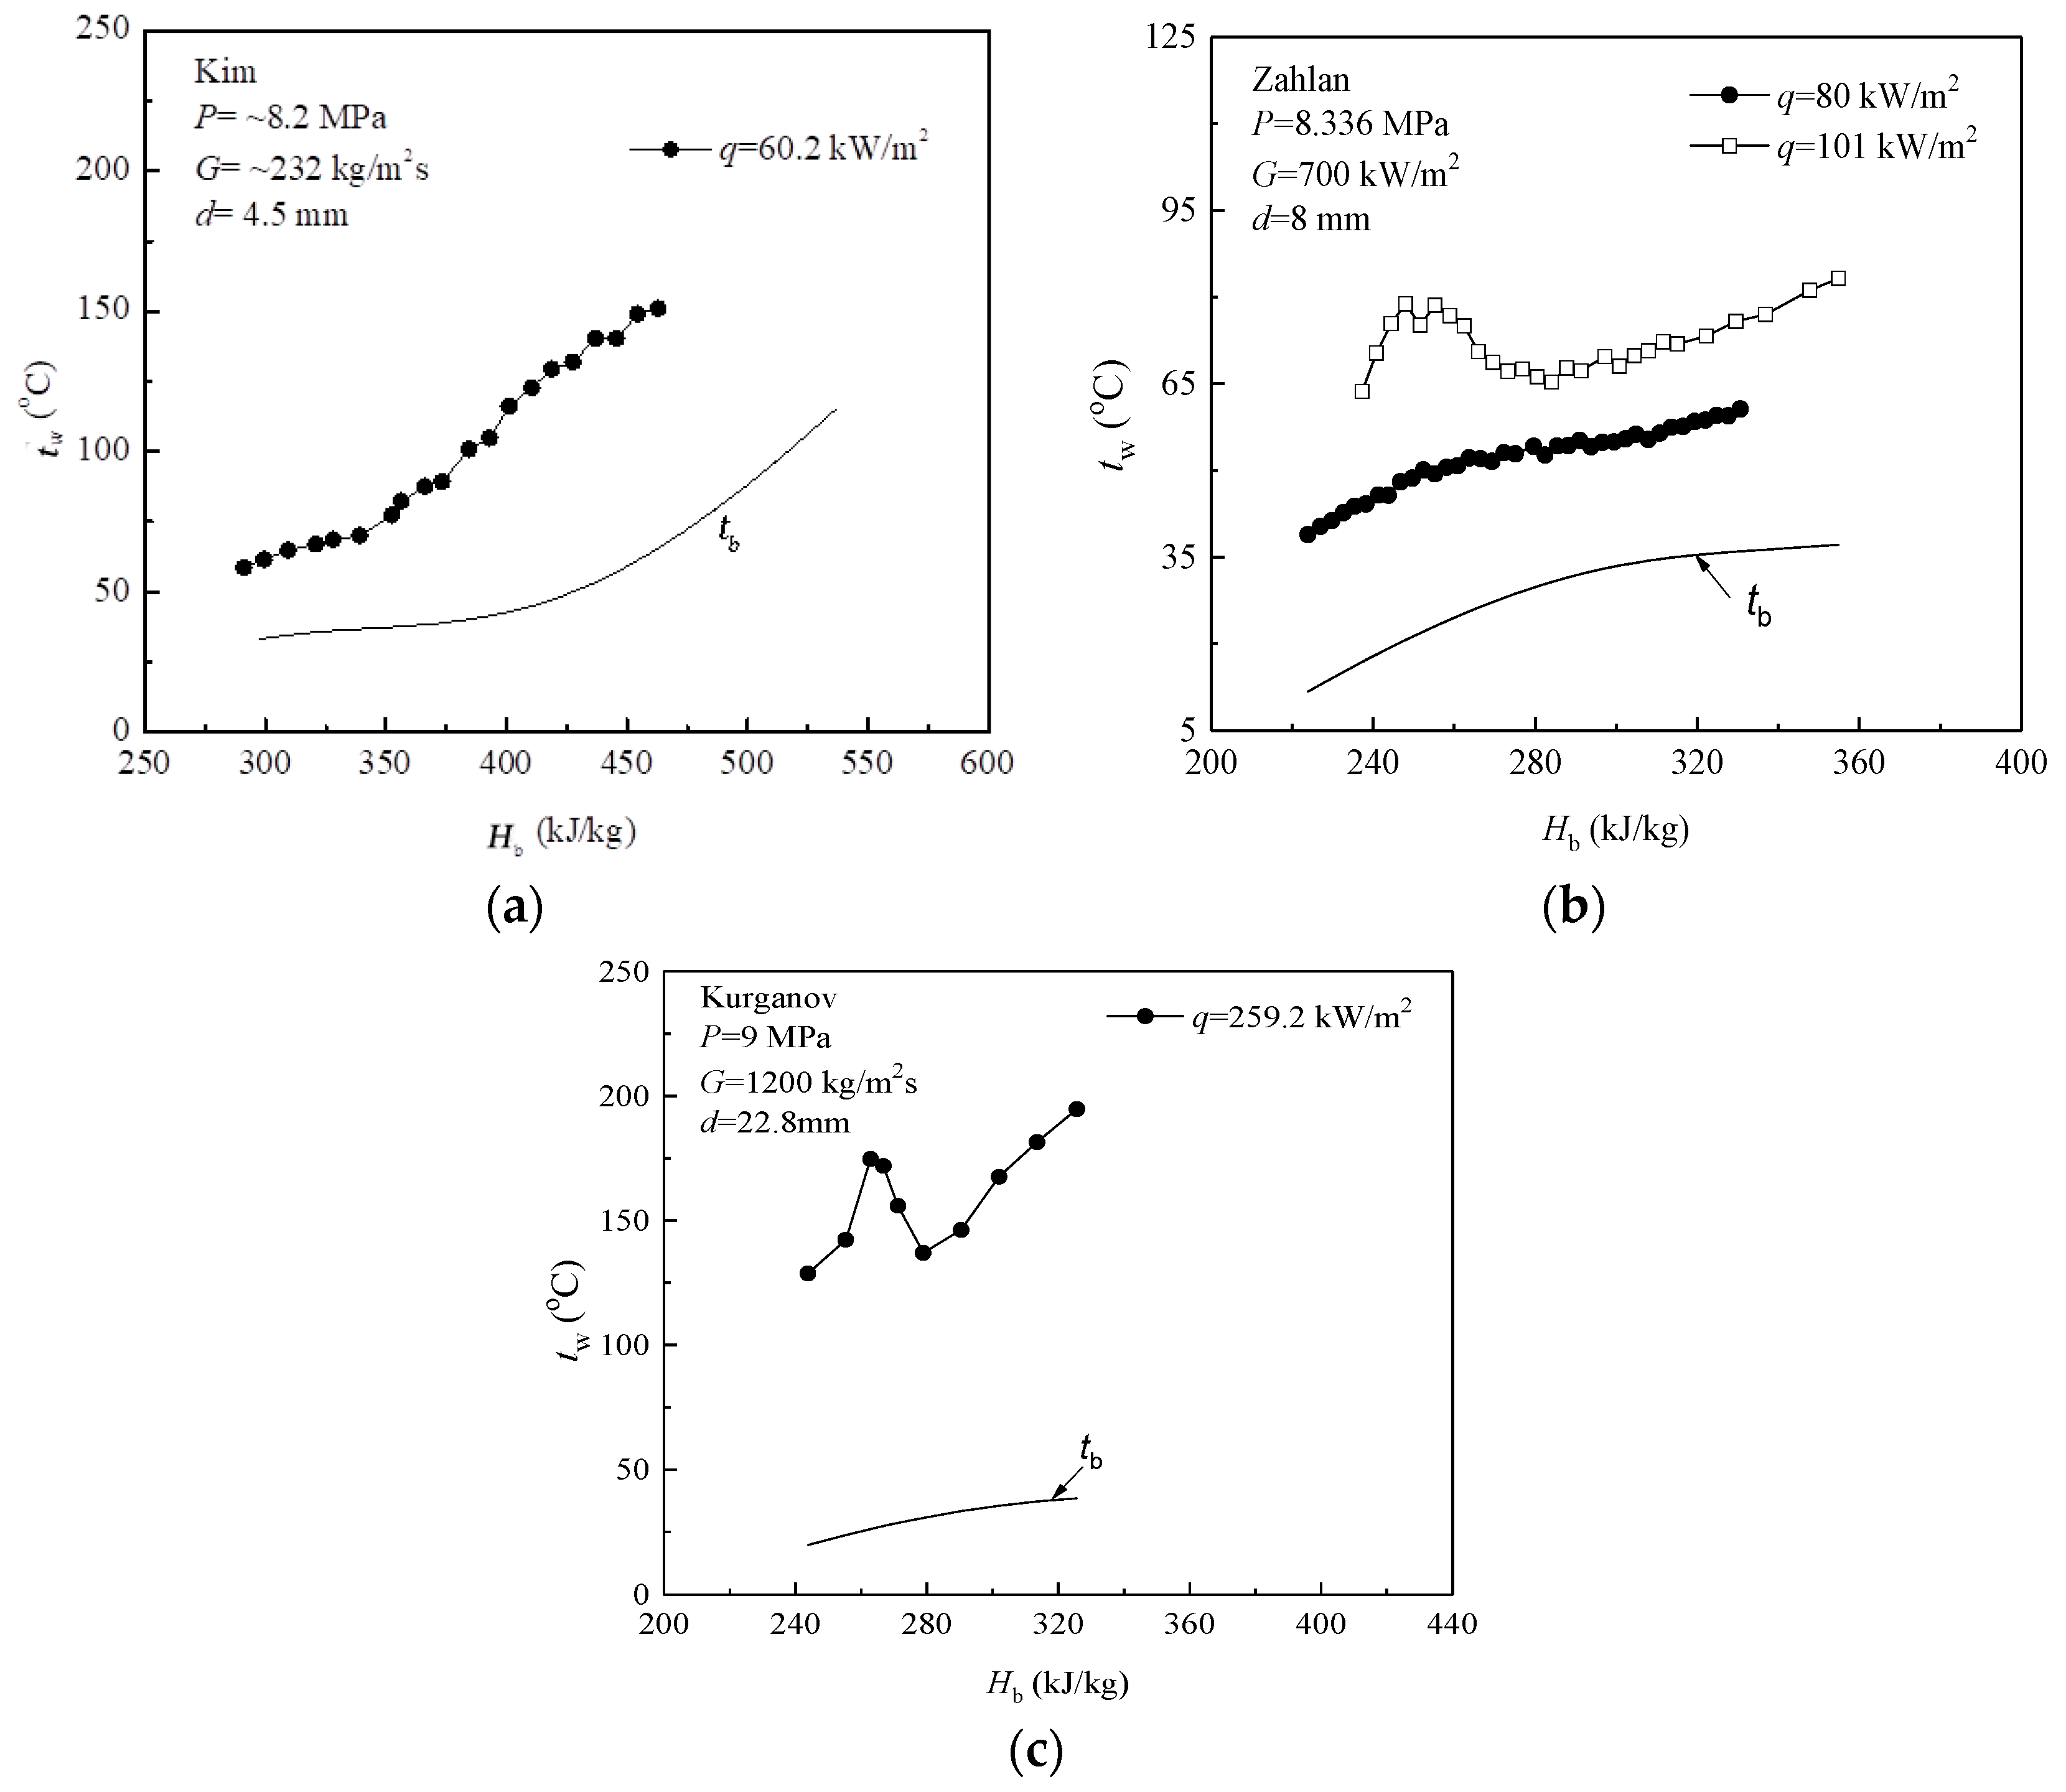
Figure 3.
Experimental profiles of the inner-wall temperatures for different mass fluxes. (a) G = 100 kg/m2s; (b) G = 500 kg/m2s; (c) G = 1000 kg/m2s.
Figure 3.
Experimental profiles of the inner-wall temperatures for different mass fluxes. (a) G = 100 kg/m2s; (b) G = 500 kg/m2s; (c) G = 1000 kg/m2s.
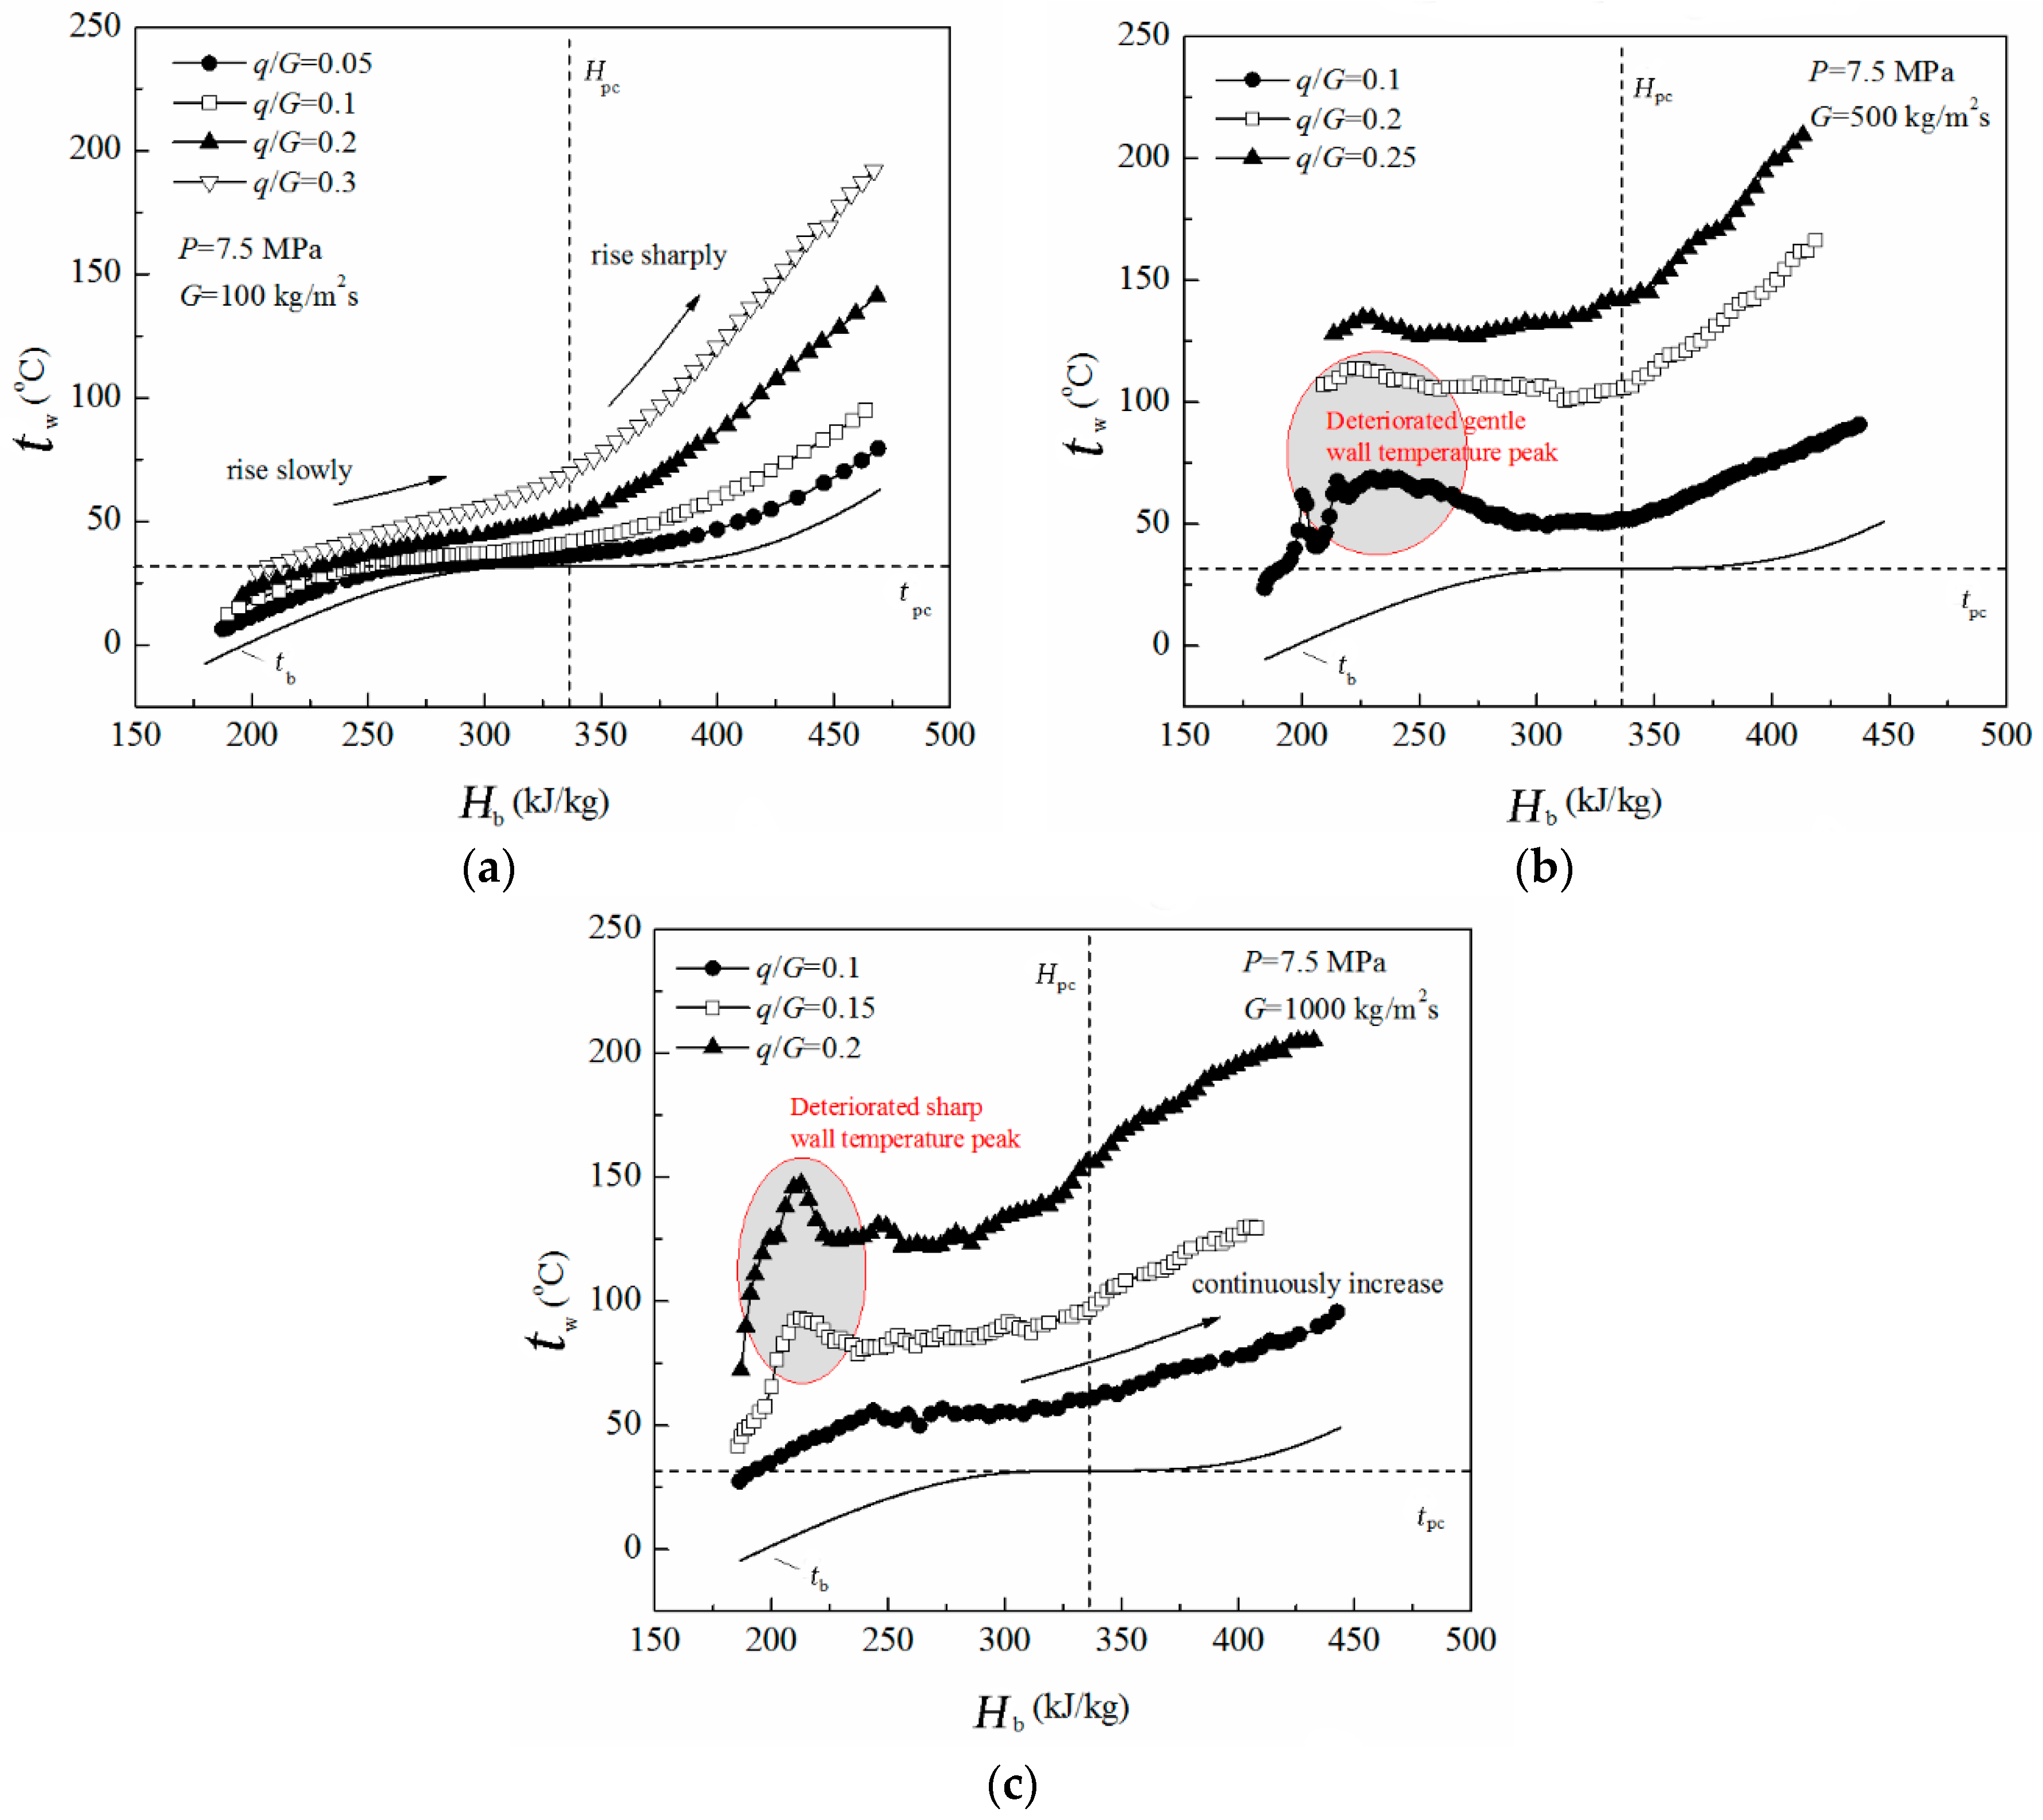
Figure 4.
Schematic of the experimental setup used to study the heat transfer behavior of Supercritical carbon dioxide (s-CO2). AC: Alternating Current; DAS: Data Acquisition System.
Figure 4.
Schematic of the experimental setup used to study the heat transfer behavior of Supercritical carbon dioxide (s-CO2). AC: Alternating Current; DAS: Data Acquisition System.

Figure 5.
Installation of the thermocouples at the outer wall of the test section.

Figure 6.
Variation of inner-wall temperatures and mixed convection () at different heat fluxes for pressure of 7.5 MPa and mass flux of 200 kg/m2s. (a) Relationship between temperature and tube length (x/D); (b) Relationship between and enthalpy.
Figure 6.
Variation of inner-wall temperatures and mixed convection () at different heat fluxes for pressure of 7.5 MPa and mass flux of 200 kg/m2s. (a) Relationship between temperature and tube length (x/D); (b) Relationship between and enthalpy.

Figure 7.
Variations in inner-wall temperatures and heat transfer coefficients for various bulk enthalpies at different heat fluxes for the pressure and mass flux of 7.5 MPa and 100 kg/m2s, respectively. (a) Temperature; (b) Heat transfer coefficient.
Figure 7.
Variations in inner-wall temperatures and heat transfer coefficients for various bulk enthalpies at different heat fluxes for the pressure and mass flux of 7.5 MPa and 100 kg/m2s, respectively. (a) Temperature; (b) Heat transfer coefficient.

Figure 8.
Variations in inner-wall temperatures and heat transfer coefficients for various bulk enthalpies at different heat fluxes for the pressure and mass flux of 8.0 MPa and 100 kg/m2s, respectively. (a) Temperature; (b) Heat transfer coefficient.
Figure 8.
Variations in inner-wall temperatures and heat transfer coefficients for various bulk enthalpies at different heat fluxes for the pressure and mass flux of 8.0 MPa and 100 kg/m2s, respectively. (a) Temperature; (b) Heat transfer coefficient.

Figure 9.
Variations in inner-wall temperatures and heat transfer coefficients for various bulk enthalpies at different mass fluxes and the pressure of 8.0 MPa. (a) Temperature; (b) Heat transfer coefficient.
Figure 9.
Variations in inner-wall temperatures and heat transfer coefficients for various bulk enthalpies at different mass fluxes and the pressure of 8.0 MPa. (a) Temperature; (b) Heat transfer coefficient.

Figure 10.
Variations in inner-wall temperatures with pressure. (a) Heat flux (q) = 35.5 kW/m2; (b) q = 45.5 kW/m2.
Figure 10.
Variations in inner-wall temperatures with pressure. (a) Heat flux (q) = 35.5 kW/m2; (b) q = 45.5 kW/m2.
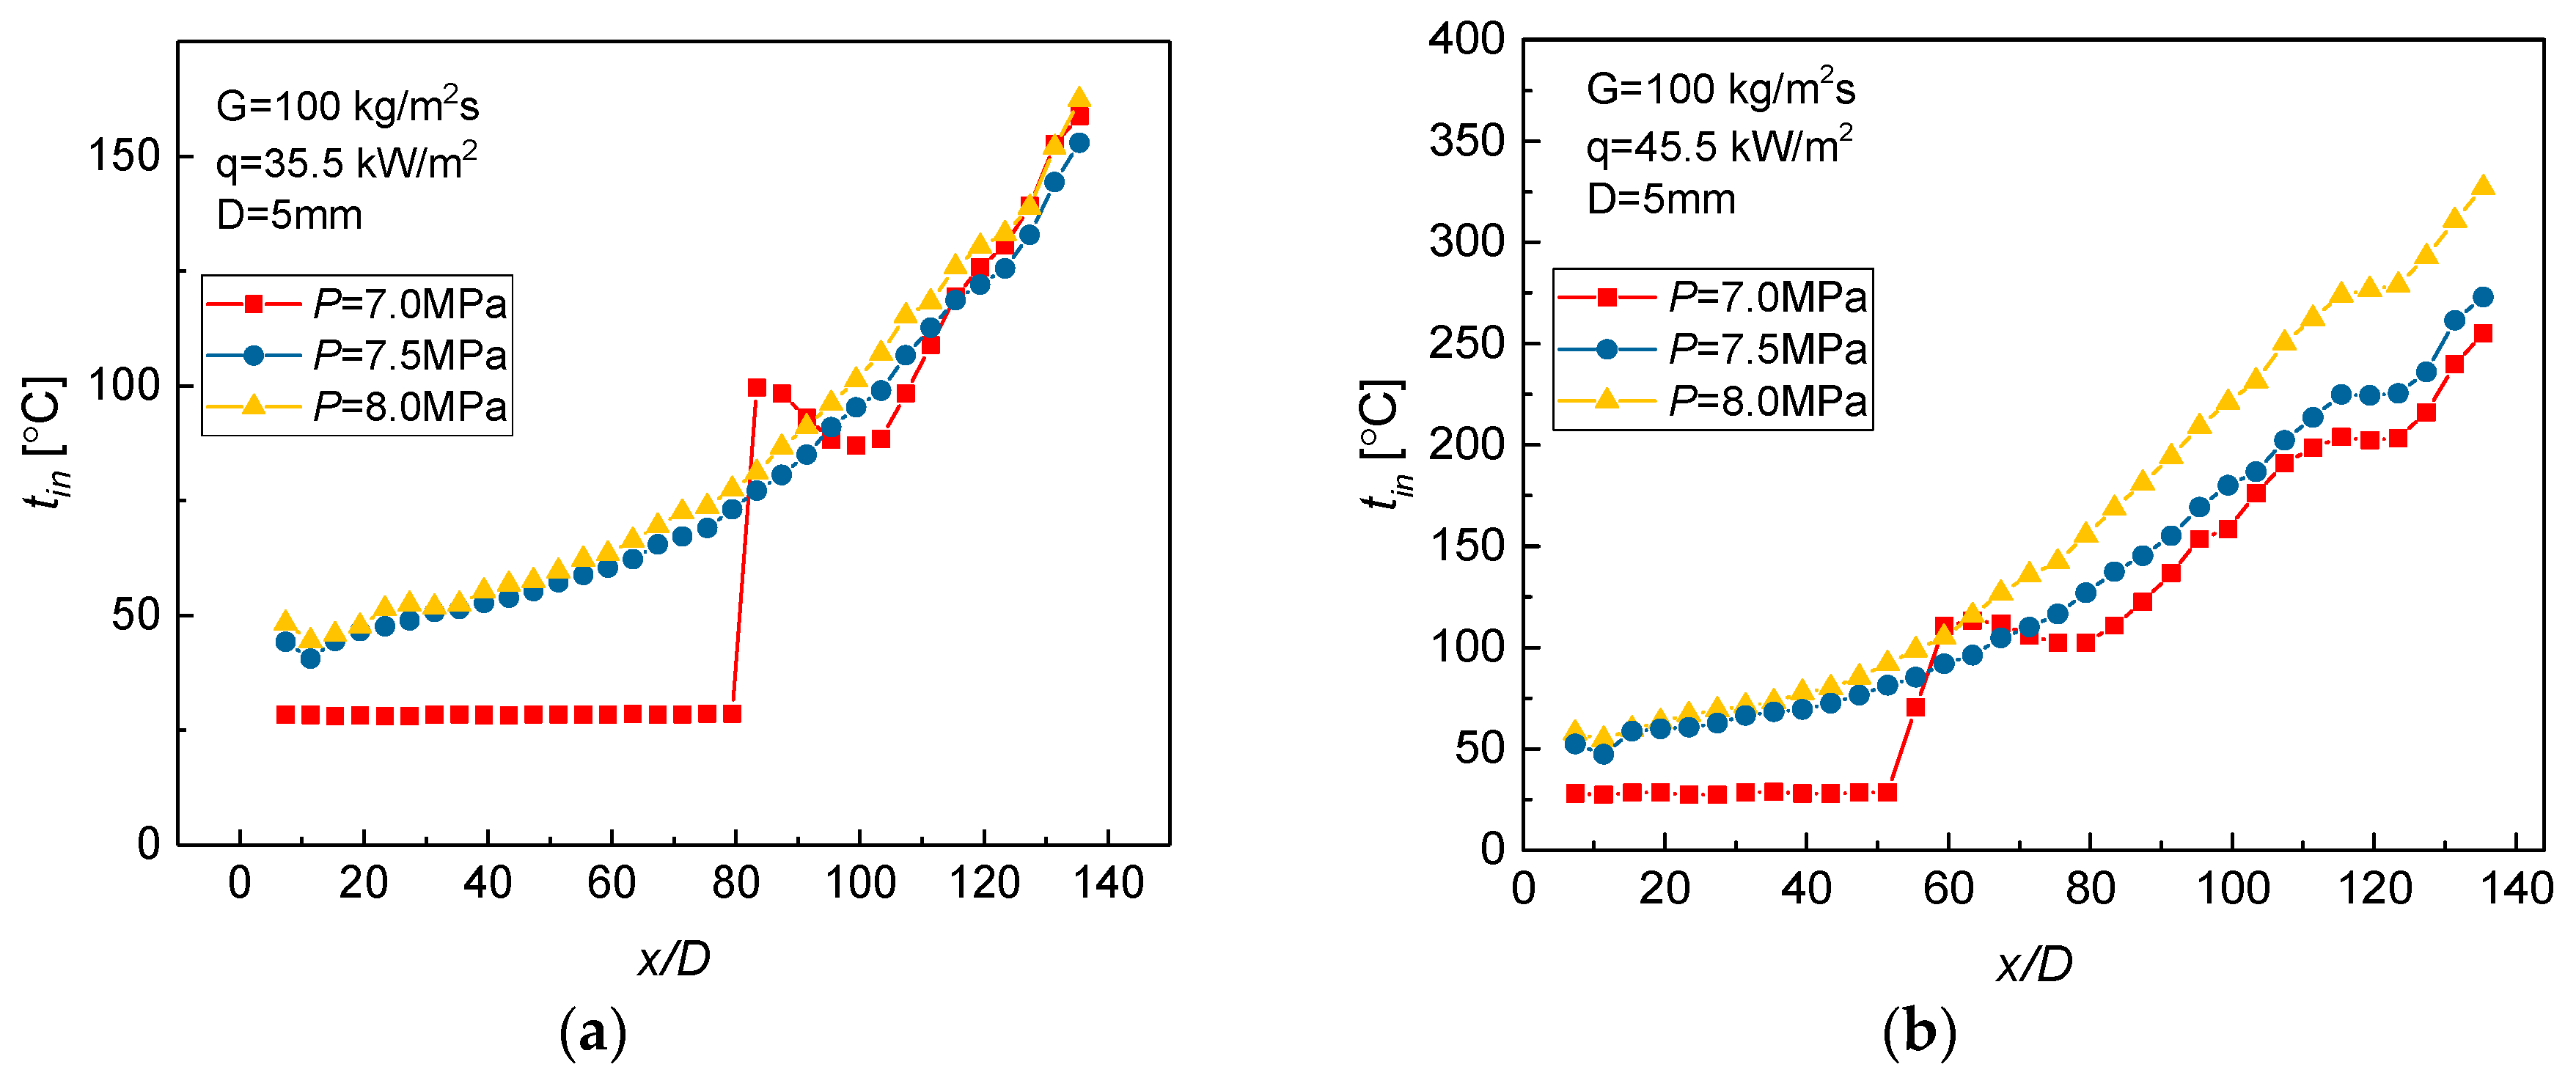
Figure 11.
Force analysis of near-wall fluid in the vertical tube.

Figure 12.
Mixed convection in supercritical carbon dioxide.

Figure 13.
Mesh generation of the domain and near-wall region.

Figure 14.
Validation of the grid dependence.

Figure 15.
Comparison of the simulated and experimental results.

Figure 16.
Variation of various parameters at low mass flux. (a) Relationship between the density gradient and y+; (b) Relationship between the shear stress and y+; (c) Relationship between the heat capacity and y+.
Figure 16.
Variation of various parameters at low mass flux. (a) Relationship between the density gradient and y+; (b) Relationship between the shear stress and y+; (c) Relationship between the heat capacity and y+.

Table 1.
Parameters used for the simulation.
| Parameters | Value |
|---|---|
| Pressure (MPa) | 7.5 |
| Mass flux (kg/m2s) | 100, 400, 1200 |
| Heat flux (kW/m2) | 30, 120, 250 |
© 2017 by the authors. Licensee MDPI, Basel, Switzerland. This article is an open access article distributed under the terms and conditions of the Creative Commons Attribution (CC BY) license (http://creativecommons.org/licenses/by/4.0/).
Share and Cite
MDPI and ACS Style
Lei, X.; Zhang, Q.; Zhang, J.; Li, H. Experimental and Numerical Investigation of Convective Heat Transfer of Supercritical Carbon Dioxide at Low Mass Fluxes. Appl. Sci. 2017, 7, 1260. https://doi.org/10.3390/app7121260
AMA Style
Lei X, Zhang Q, Zhang J, Li H. Experimental and Numerical Investigation of Convective Heat Transfer of Supercritical Carbon Dioxide at Low Mass Fluxes. Applied Sciences. 2017; 7(12):1260. https://doi.org/10.3390/app7121260
Chicago/Turabian StyleLei, Xianliang, Qian Zhang, Jun Zhang, and Huixiong Li. 2017. "Experimental and Numerical Investigation of Convective Heat Transfer of Supercritical Carbon Dioxide at Low Mass Fluxes" Applied Sciences 7, no. 12: 1260. https://doi.org/10.3390/app7121260
Note that from the first issue of 2016, this journal uses article numbers instead of page numbers. See further details here.