1. Introduction
In China, and in many other regions of the world, tea is an important economic crop ranking first among other types of well-known beverages, including cocoa and coffee. Tea is also a major part of China’s culture and history. It is planted in large and geographically-diverse production areas across the country; there are numerous types of tea with distinct regional and qualitative features to be found in different regions. Their market approval and consumer preference also vary. Thus, tea is considered a typical product with protected geographical indication.
Most countries govern products with protected geographical indication under specialized policies and laws. For example, Regulations for Protecting Products of Original Origins are implemented by the General Administration of Quality Supervision, Inspection, and Quarantine of the People’s Republic of China to protect the products of original tea sources [
1]. Regulations on agricultural products with protected designation of origin and protected geographical indication are also implemented by the European Commission [
2]. Imported foods in the U.S., Japan, and other developed countries are strictly tracked. Although the regulations on teas with protected geographical indication are generally upheld, false labeling of products and disguising fake products as high-quality do occur. Consequently, fair market trade, brand protection, and consumer rights and interests can be severely infringed upon. Effective tracing techniques are necessary to track the origin and types of products conveniently, rapidly, and accurately to protect locally-featured products.
Sensory evaluation and chemical methods are traditional techniques applied to identify tea. The former may be rendered subjective or unreliable due to human factors and external environments [
3,
4]. The latter, such as those using trace minerals, aromatic substances, and thermo-chemical properties, can be employed to accurately identify the type and source of tea; nevertheless, unfortunately, they are complex and expensive and, thus, unable to rapidly identify the origin of various teas [
5,
6,
7,
8].
Unlike other detection techniques, terahertz time-domain spectroscopy (THz-TDS) is non-destructive, non-ionizing, highly flexible, and efficient. THz-TDS also provides a high signal-to-noise ratio for an absorption spectrum of samples. THz radiation usually refers to an electromagnetic wave with a frequency between 0.1 and 10 THz or wavelength of 30 μm to 3 mm, and a wave band between microwave and infrared within the scope of far-infrared radiation. THz-TDS is commonly employed in a variety of fields, such as bio-molecule identification [
9], material development research [
10], explosive tests [
11], drug analysis [
12], and research on the reorientation of dipoles in liquids [
13].
Four kinds of tea were selected from different geographical origins where cumulative temperature, illumination, weather conditions, soil, altitude, and other natural factors differ. The organic matter inside the respective teas is unique, to this effect, which allows for identifying teas of by origin via THz spectroscopy.
THz-TDS is applicable to quantitative, as well as qualitative, analysis. Zhang et al. qualitatively researched the THz spectra of acephate based on both first principles calculations and experimental data [
14], for example. Hua et al. qualitatively and quantitatively analyzed the THz spectra of pesticides, food powders, and a mixture to obtain the weight ratios of imidacloprid in a mixture using the partial least squares (PLS) method [
15]. Ma et al. qualitatively and quantitatively analyzed a mixture of thiabendazole and polyethylene using various algorithms (biPLS, iPLS, PLS, mwPLS) [
16]. These reports demonstrated qualitative and quantitative analyses using linear regression methods.
This paper proposes a new approach for detecting and identifying green tea samples with different origins, but similar spectral characteristics. A classification model was established by combining a support vector machine (SVM) with a genetic algorithm (GA). The proposed method, called GA-SVM, was compared with other approaches including the support vector machine combined with grid search (Grid Search-SVM) and back-propagation (BP) neural networks. The results showed that GA-SVM outperforms the other methods and is, thus, an attractive potential identification tool for the determination of the geographical origins of tea samples.
2. Experiment
2.1. Experimental Setup
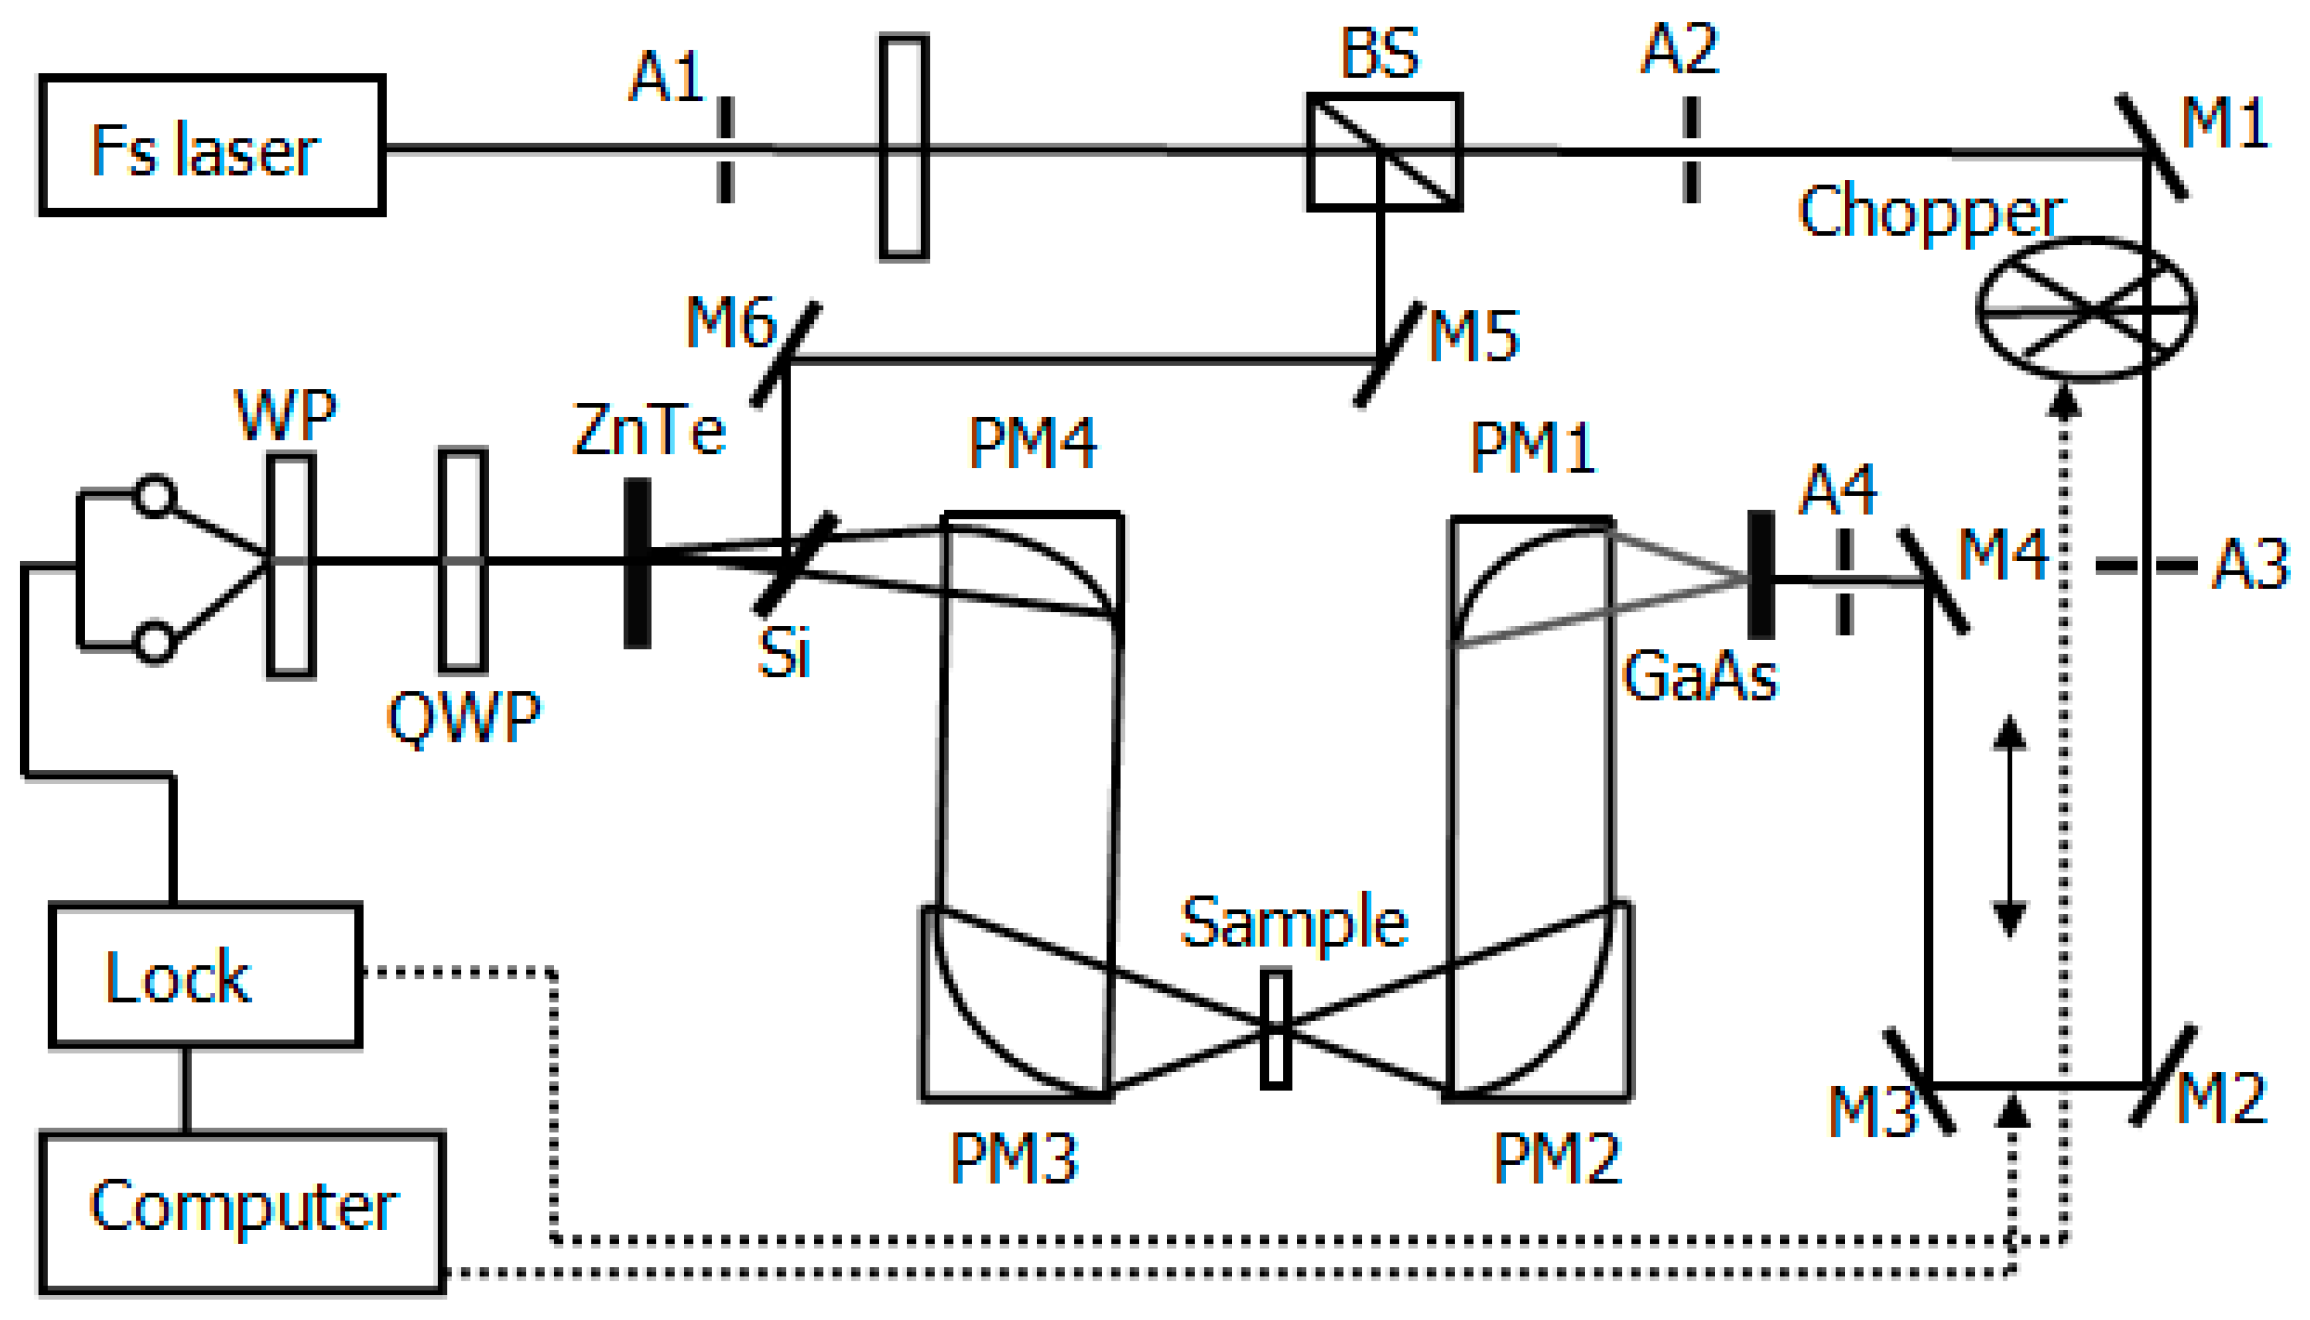
A THz-TDS detection system (Advanced Photonix, Inc., T-Ray 5000, Roanoke, VA, USA) configured in transmission mode was adopted for the purposes of our experiment. The system includes a Ti-sapphire laser that produces a central wavelength of 1064 nm. A femtosecond laser pulse with repetition frequency of 100 MHz provides THz at an average power of 130 nW. A schematic diagram of the experimental setup is shown in
Figure 1. The chamber containing the sample and the entire THz paths was filled with pure nitrogen to avoid the strong absorption of THz by water. The humidity and temperature of the chamber were maintained below 4% and at 21 °C, respectively.
2.2. Sample Preparation
Four types of tea, namely, Longjing tea of Zhejiang, Maofeng tea of Yunan, Xiangbiluo tea of Guangxi, and Zhuyeqing tea of Sichuan, were obtained and 60 samples were randomly collected from each type, making a total of 240 samples. The samples were randomly divided into a molding set and a prediction set. The former comprised 160 samples and the latter consisted of 80 samples. The four different teas were placed in a 50 °C drying oven for 24 h, then ground into powder, and mixed with pure polyethylene powder at a rate of 1:3 to avoid the absorption of THz by water. Polyethylene was used for bonding and dilution when pressing tablets from polyethylene powder with tea, variations in applied pressure and pressing duration can cause the dielectric properties of the tablets to vary. In order to ensure as much consistency as possible among the dielectric properties of each tea tablet, the powder samples were pressed into tablets with a thickness of 1.4 mm and a diameter of 13 mm under a pressure of 15 MPa for approximately 2 min [
17].
2.3. Data Analysis
In theory, the energy level of molecules such as DNA, proteins, and amino acids, for vibration and rotation lies within the THz band. Thus, every type of green tea is characterized by a unique THz absorption spectrum. This is what allows THz-TDS detection to be employed to detect biological components [
18,
19]. We calculated the absorption of our green tea samples from THz time-domain data [
20].
The following is the equation for calculating the absorption coefficient:
where
d is the thickness of sample;
n is the refractive index of sample;
is the extinction coefficient.
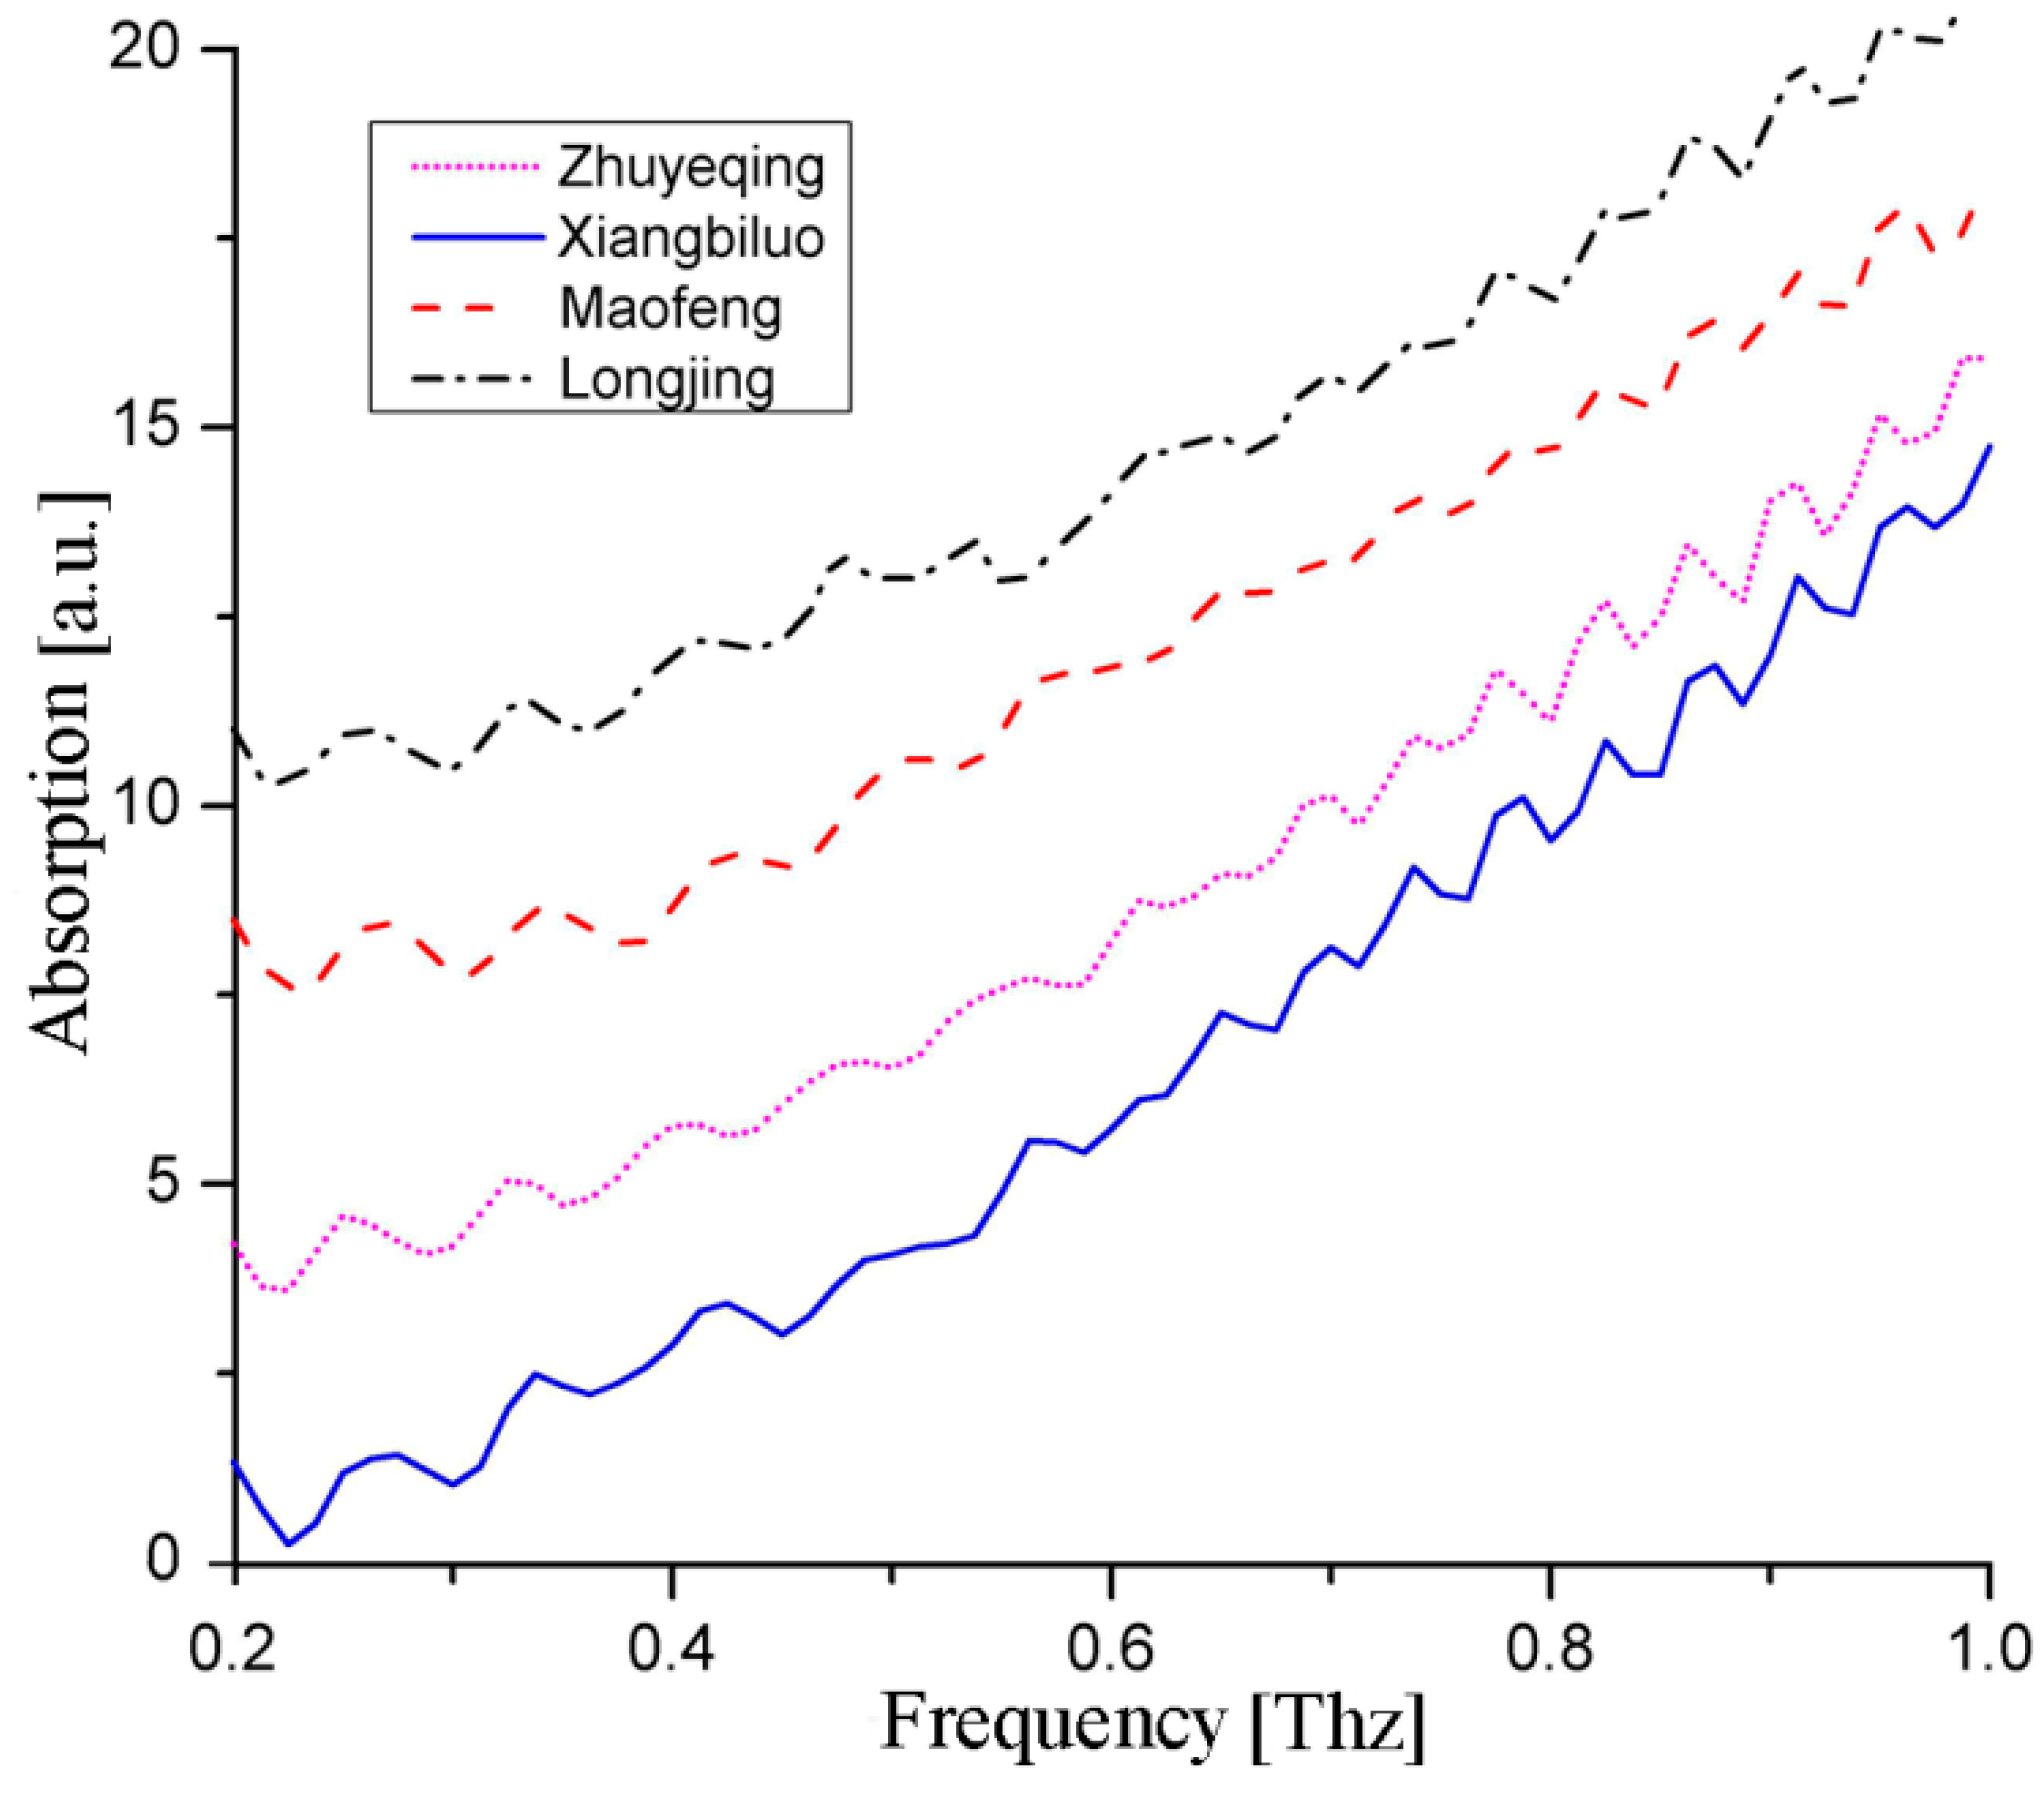
Absorption spectra were obtained and moved upward along the vertical axis, as shown in
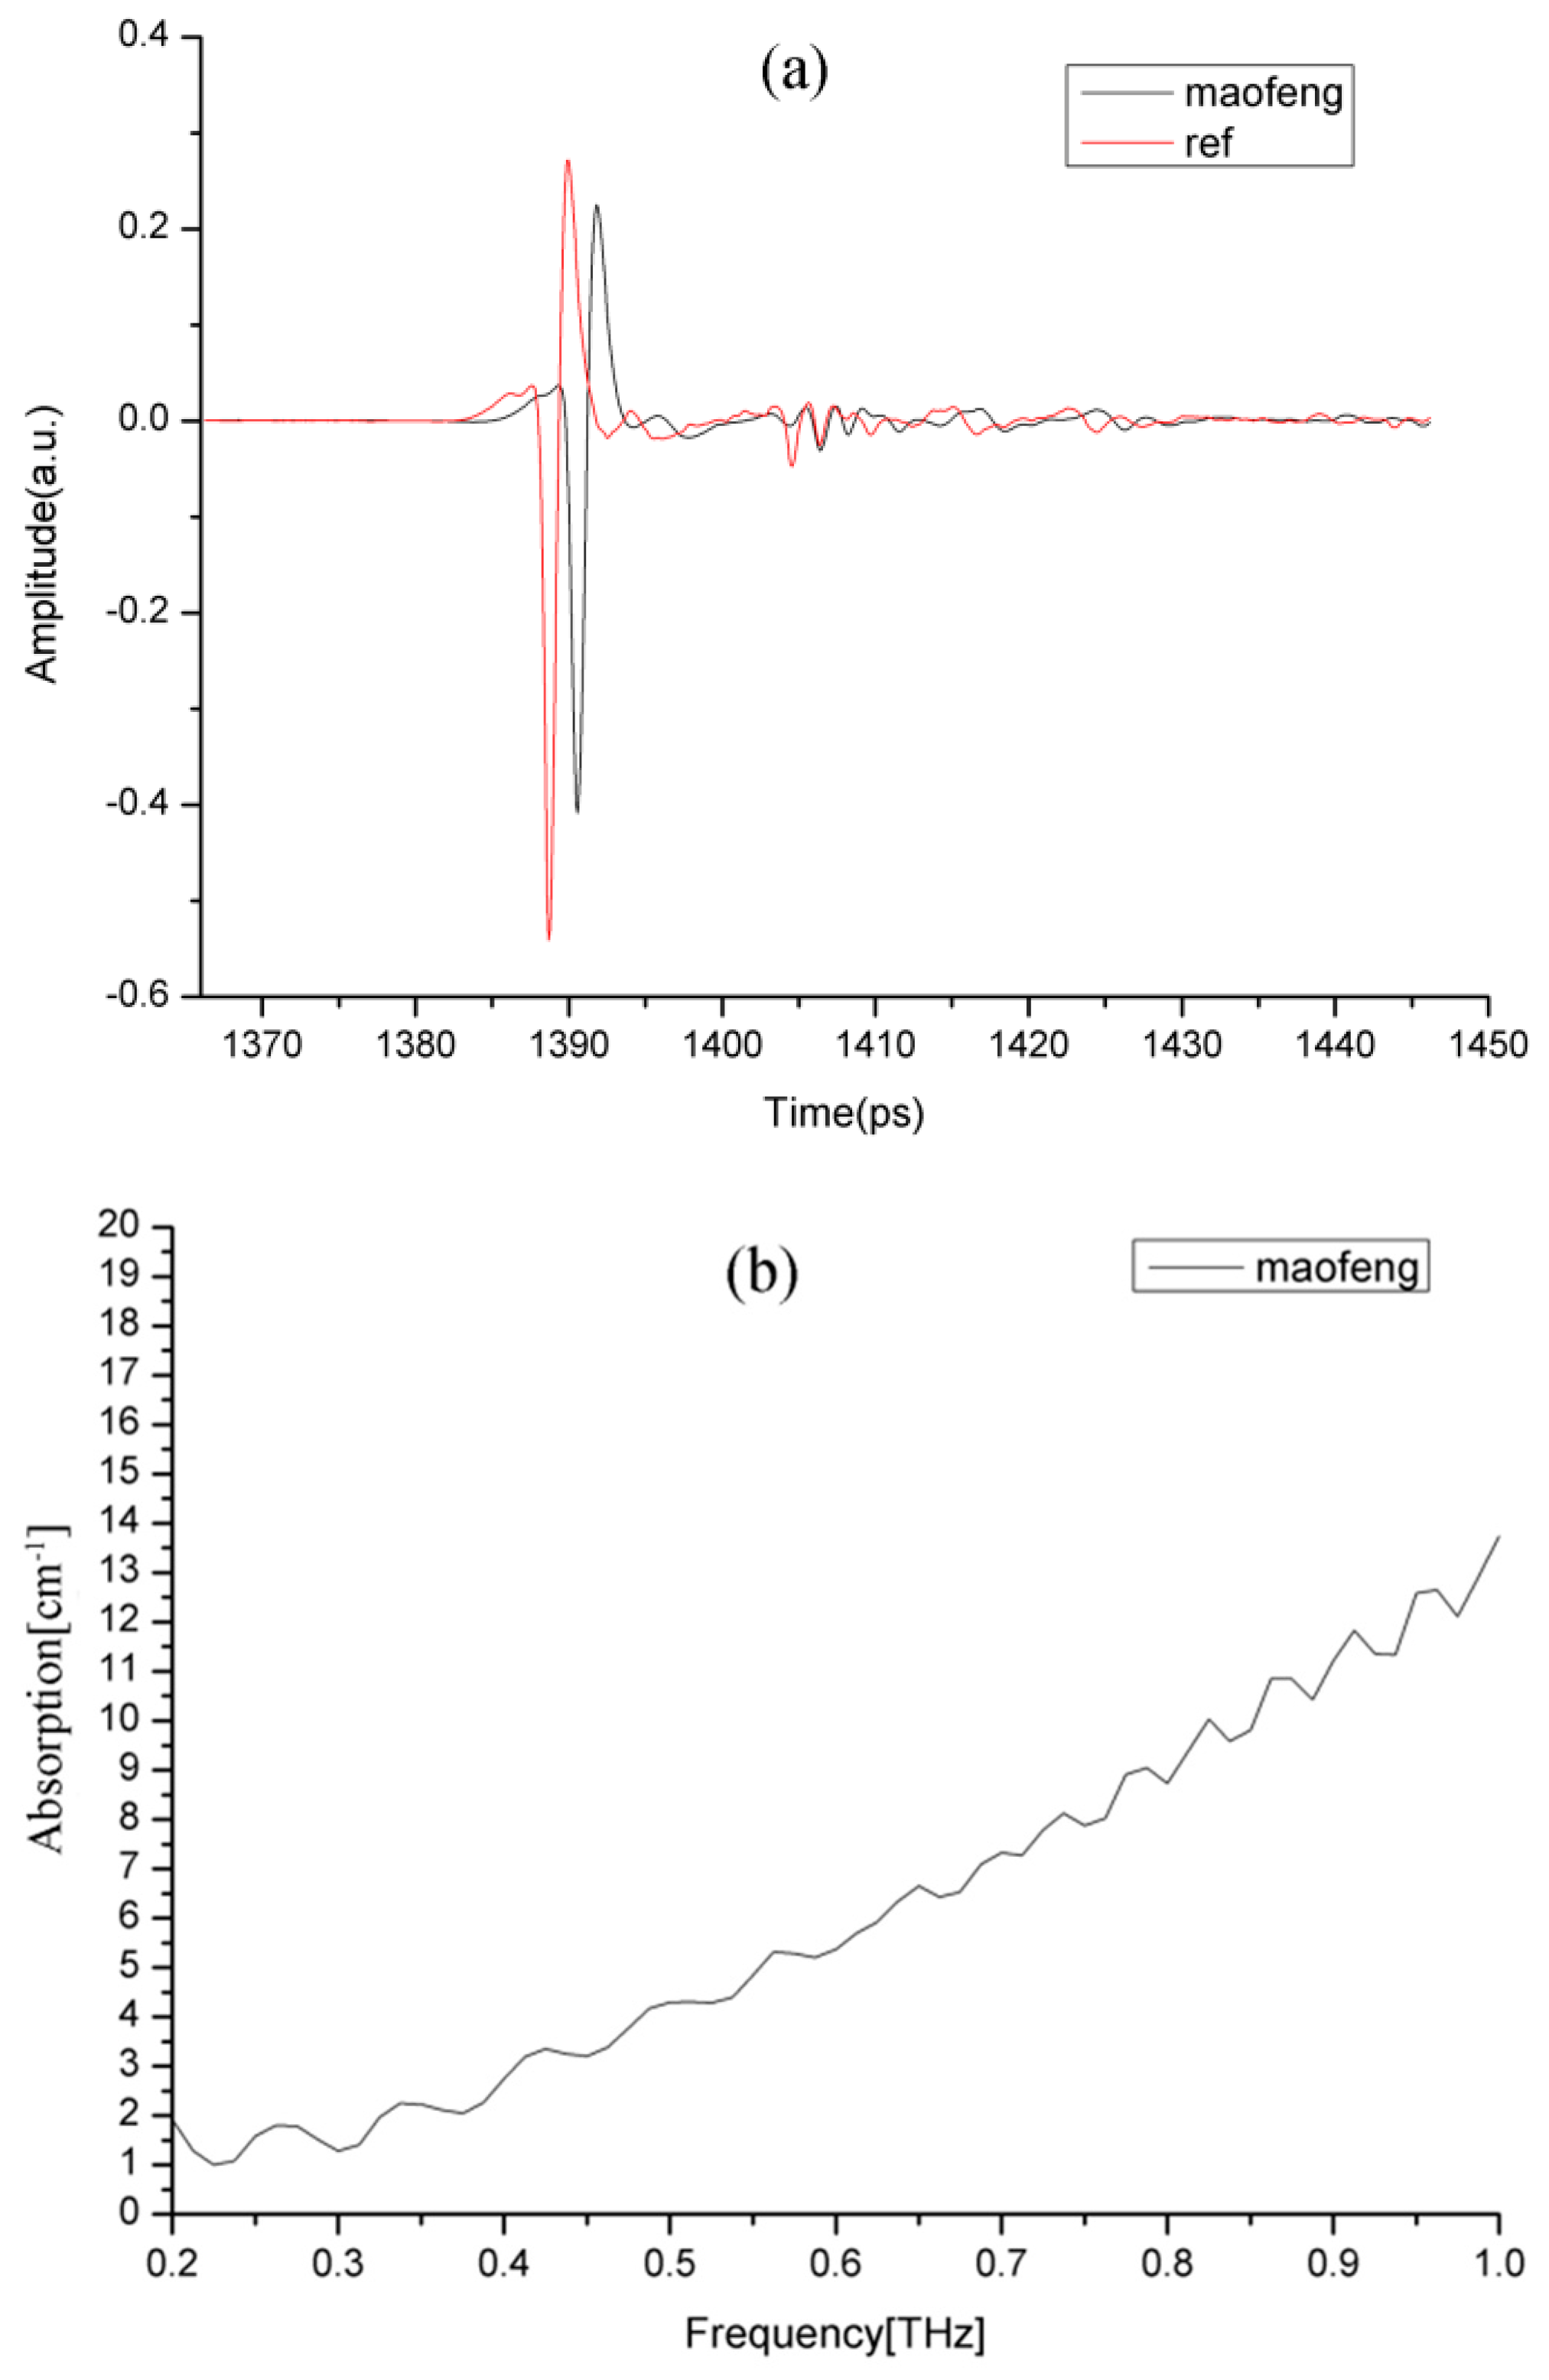
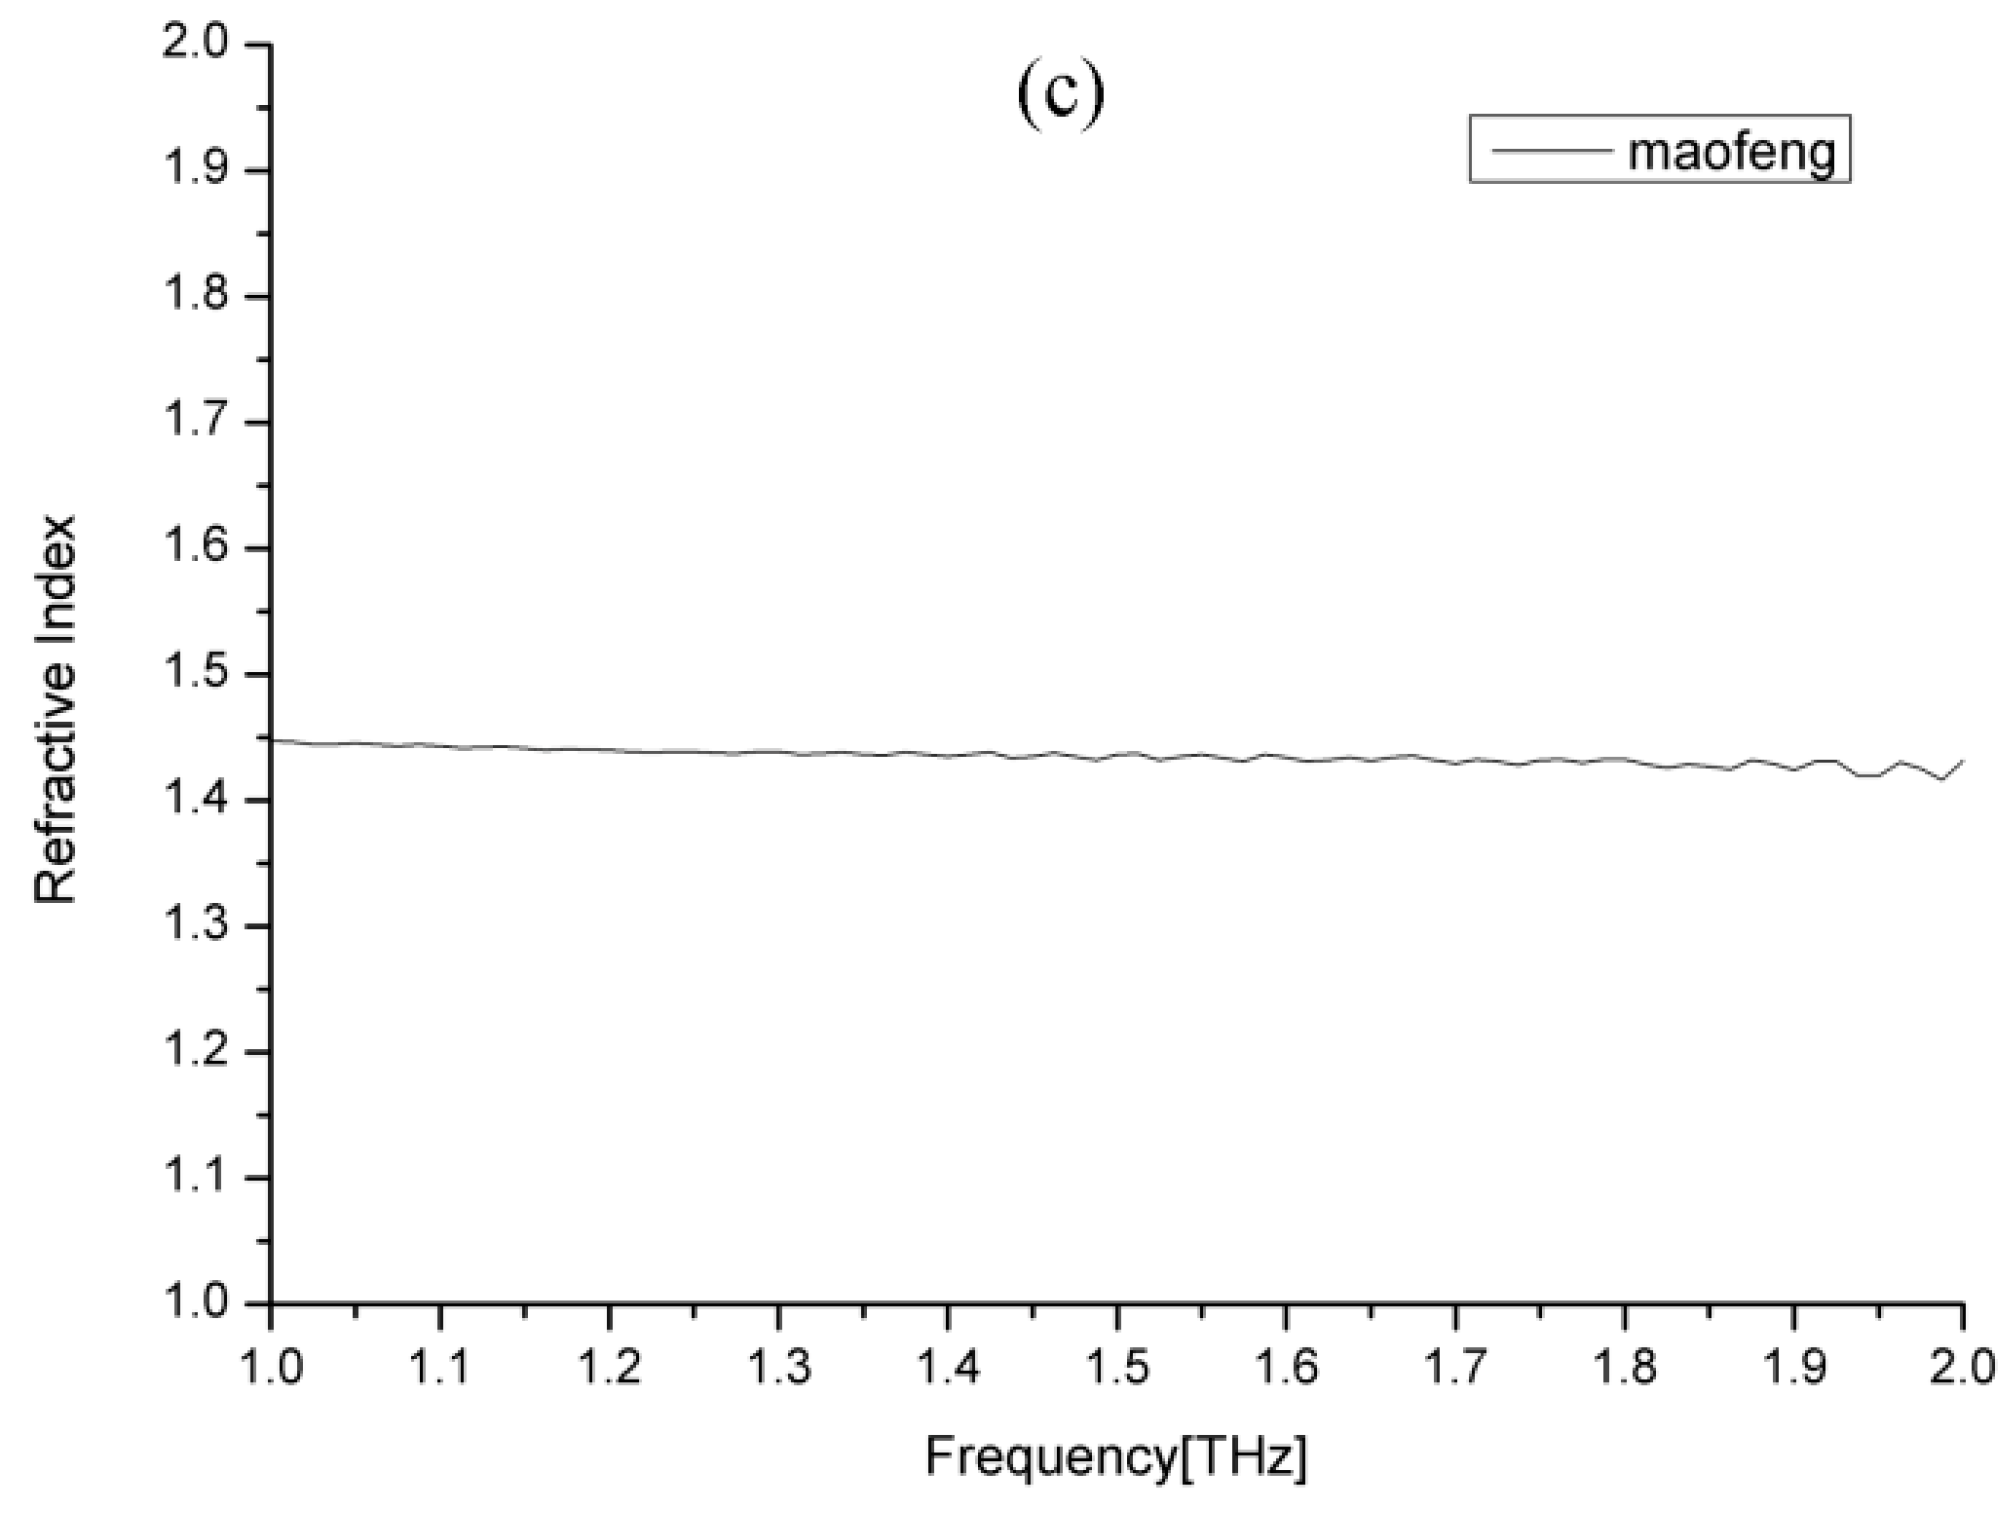
Figure 2, to make the tea samples’ absorption characteristics as clear as possible. To observe the dielectric properties of the tea samples, the time domain signals (
Figure 3a), absorption (
Figure 3b), and refractive index (
Figure 3c) of Maofeng tea were obtained. The THz absorption spectra of the four types of tea are similar and do not exhibit evident absorption peaks; i.e., the types of tea cannot be easily identified based on their absorption peaks. The four graphs in
Figure 2 are only examples of the datasets of each tea sample and, in general, the datasets are much harder to distinguish. The datasets for different teas are not presented in one figure, because they would have been crossed, which would have made classification using the (second order) polynomial fit or exponential fit very challenging. To determine the THz absorption spectrum of the four types of tea, we employed pattern-recognition methods [
21].
3. Classification Model
In the proposed combination method, SVM is used to establish the classifiers of the four types of green tea. The SVM method is based on Vapnik-Chervonenkis theory and structural risk minimization principle, which is based on statistical learning theory; this method can be applied by using limited information of samples to determine an ideal compromise between model complexity and learning ability, and to achieve optimum generalization [
22]. SVM is characterized by strong theoretical and mathematical bases and is not prone to local minimum problems. Learning a small sample also provides a strong generalization ability [
23,
24]. In short, SVM application reduces the dependence on the quantity of samples.
Considering the training samples
xi,
yi,
i = 1, …,
n;
yi ∈ {−1,1} with
xi as the
i-th sample of the input model and
yi as the symbol, we derived the hyperplane equation of separation as follows:
where ω is a normal vector of the hyperplane,
b is a constant of the hyperplane, and
d is the
d-dimensional space.
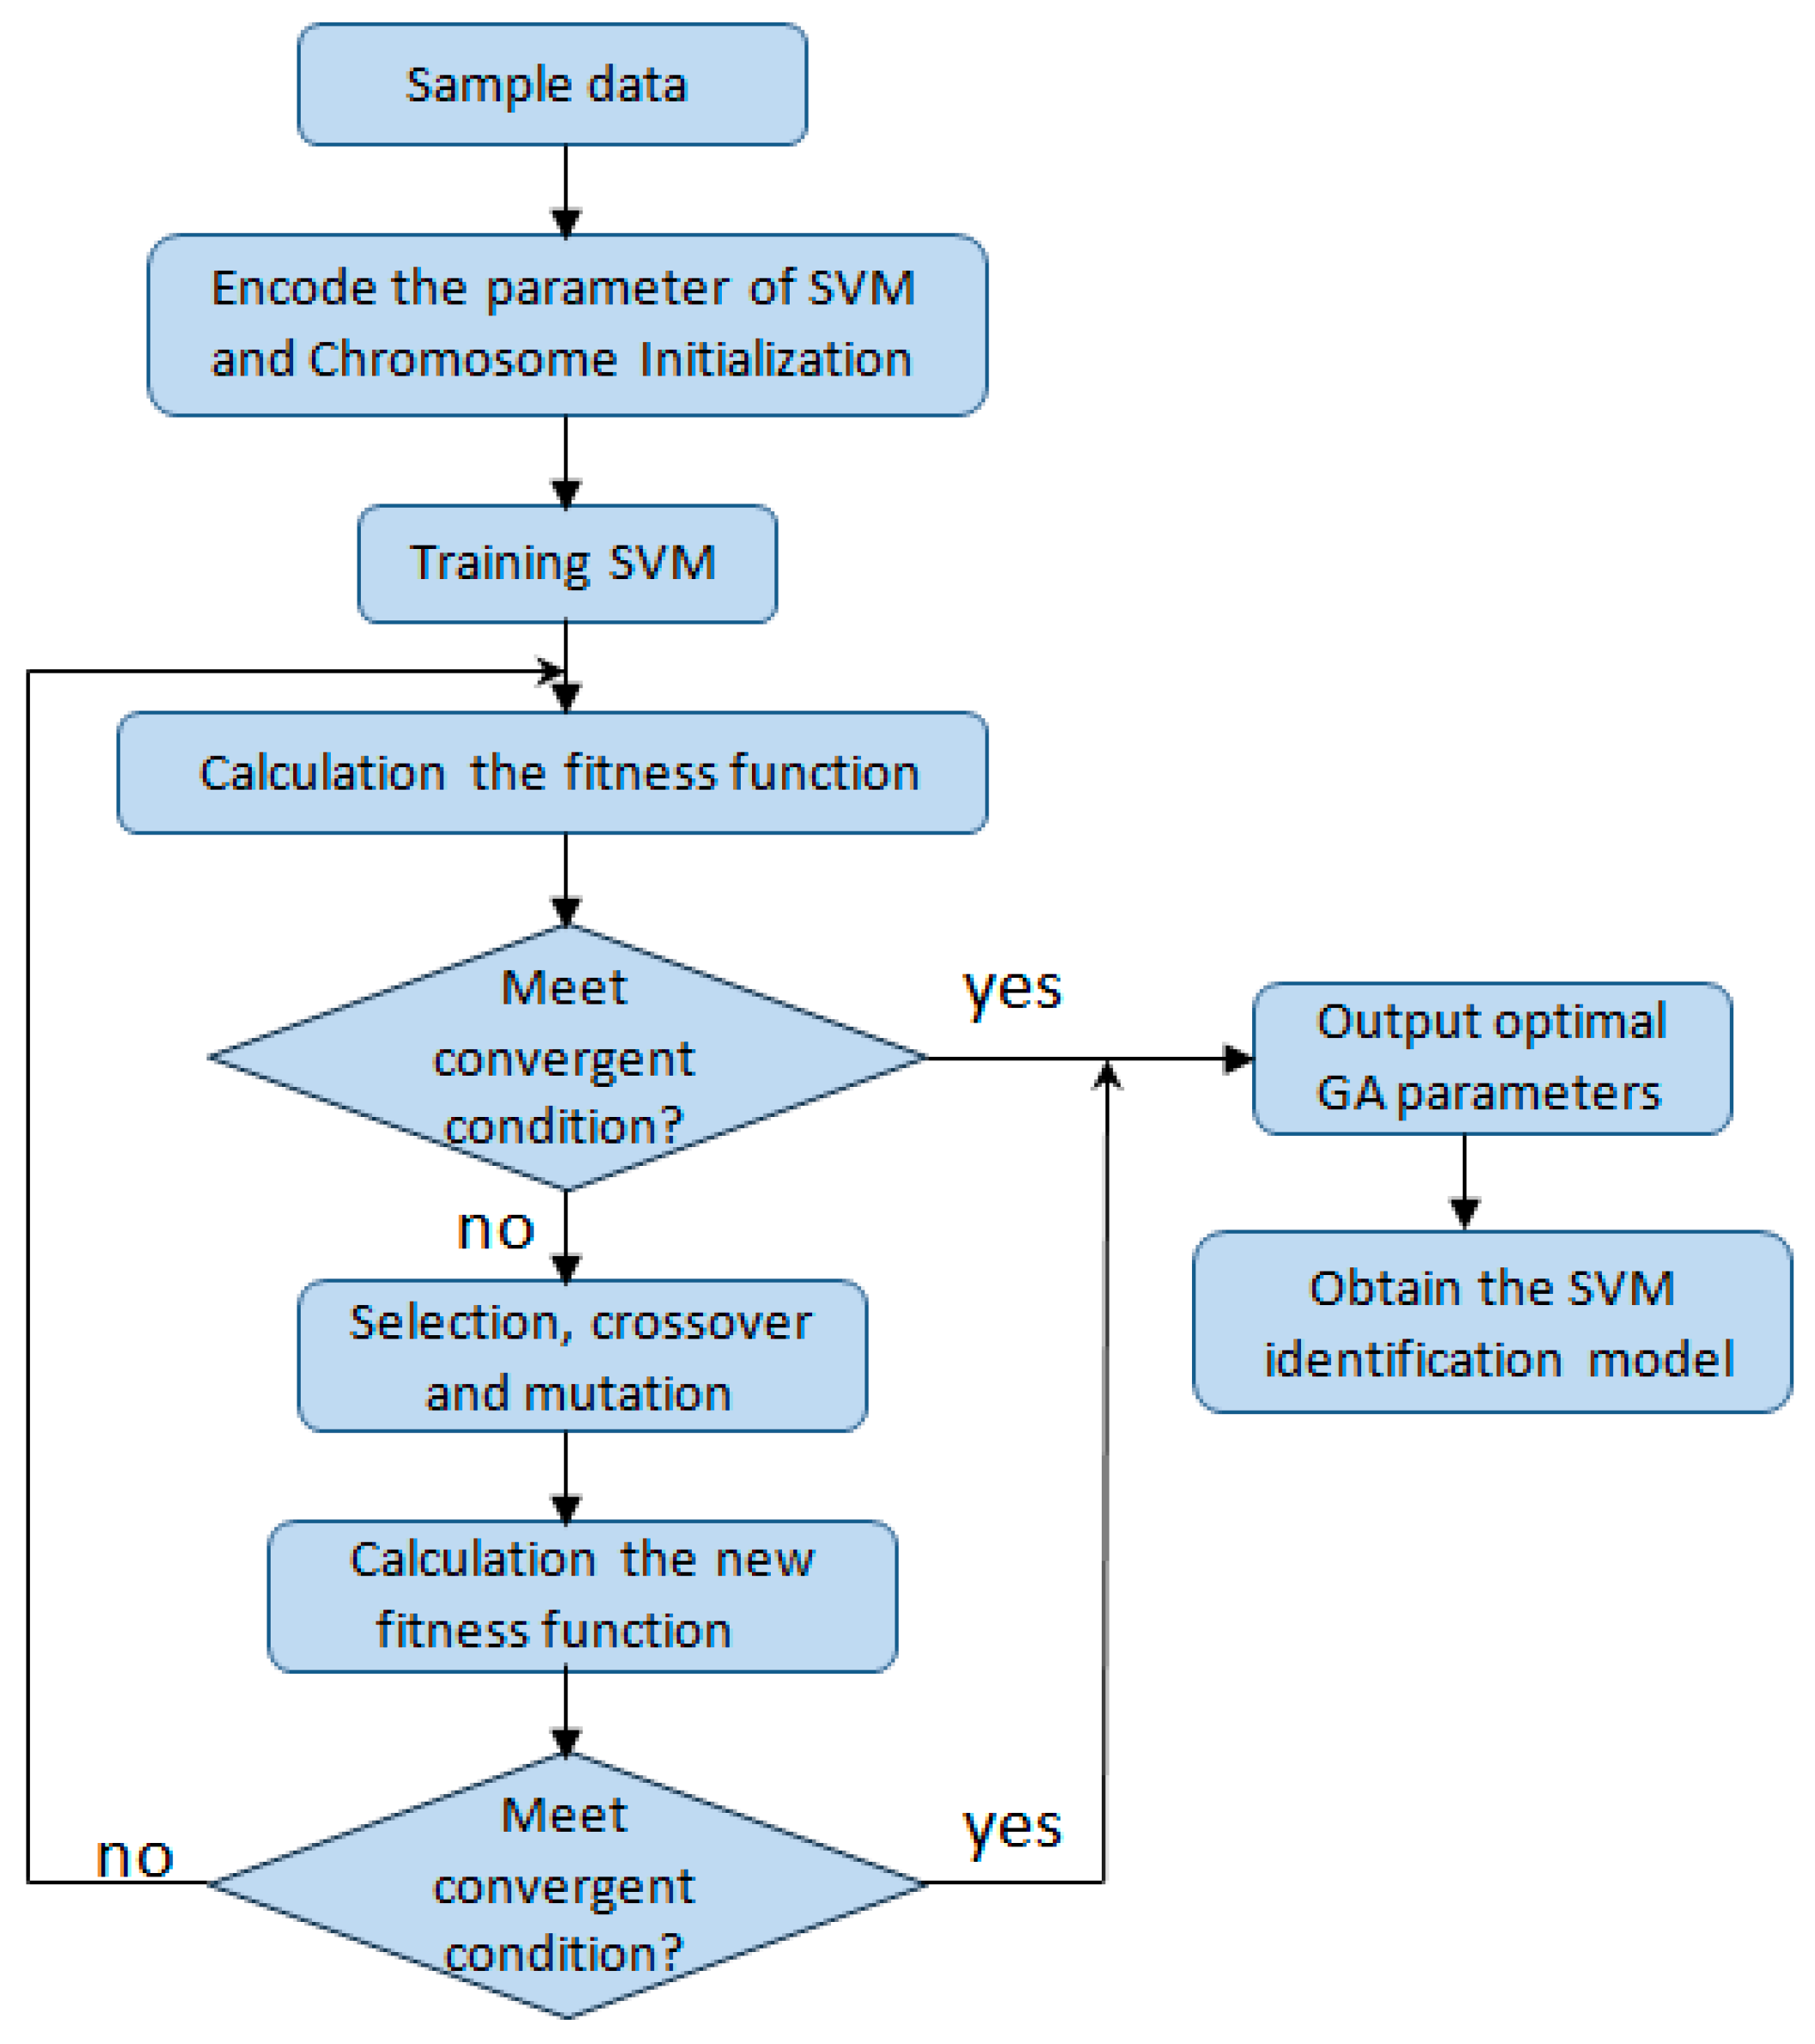
The GA derives from computer simulation research on biological systems. It is a tool used for random overall searching and optimization developed on the basis of simulations of natural biological evolution, Darwin’s evolution theory, and Mendel’s heredity theory. It is an efficient, parallel, and comprehensive searching method that automatically obtains and accumulates knowledge of a searching space through a searching process which is controlled to determine optimum solutions through self-adaptation. GA is used in the proposed combination method to optimize the parameters. The selection of penalty factor c and kernel parameter g directly influence the identification results of the SVM model, so the parameters should be optimized accordingly. A flowchart of the GA-SVM algorithm is provided in
Figure 4. The detailed steps of GA for the selection of SVM parameters are as follows:
- 1
Produce a set of SVM parameters at random and obtain a certain coding scheme to encode each parameter of the SVM to create the initial group.
- 2
Calculate the error function and affirm its adaptation. If the error is large, adaptation is small.
- 3
Select several individuals with the best adaptation and directly pass them to the next generation.
- 4
Use crossed, variant, and other genetic operators to manage the group of the current generation and produce the group of the next generation.
- 5
Repeat Step 2 and continuously evolve the group of the SVM parameters affirmed initially until the training objectives are satisfied.
Principal component analysis (PCA) is mainly utilized to reduce data dimensions and remove overlapping information [
25]. A small number of new variables can be created by converting the original spectral variables into linear combinations of the original variables; the new variables can maximize the presentation of the data structure and desirable features of the original variables without losing essential information. The set of original data can apply the first k principal components to replace the approximation when the contribution rate of the accumulative variance of the currently-stated k principal component is sufficiently large (85%, usually).
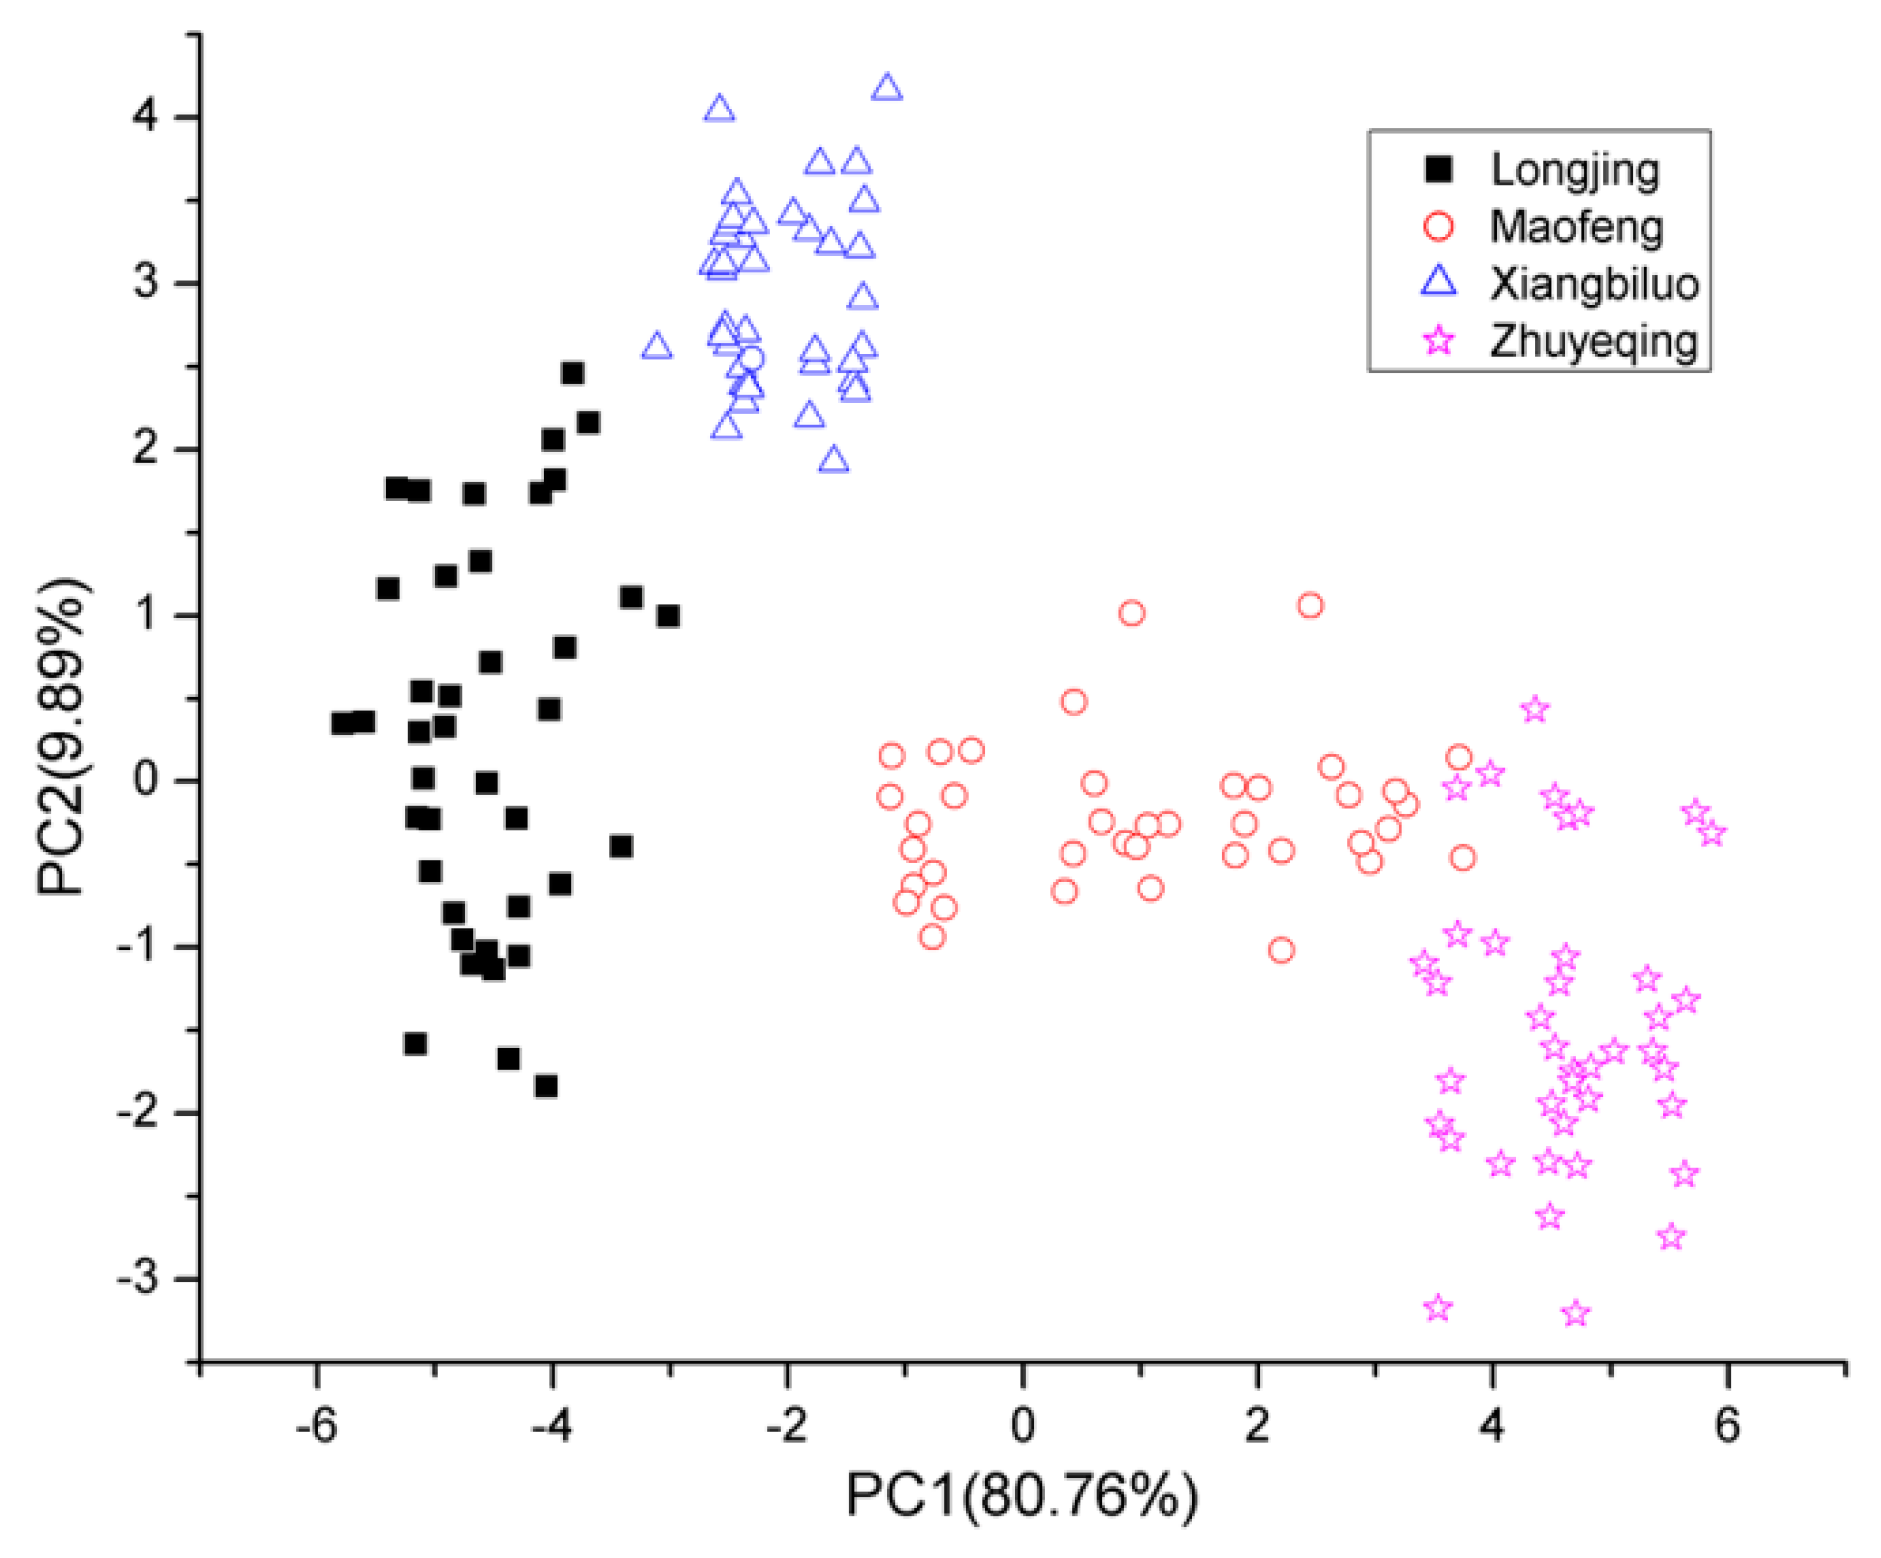
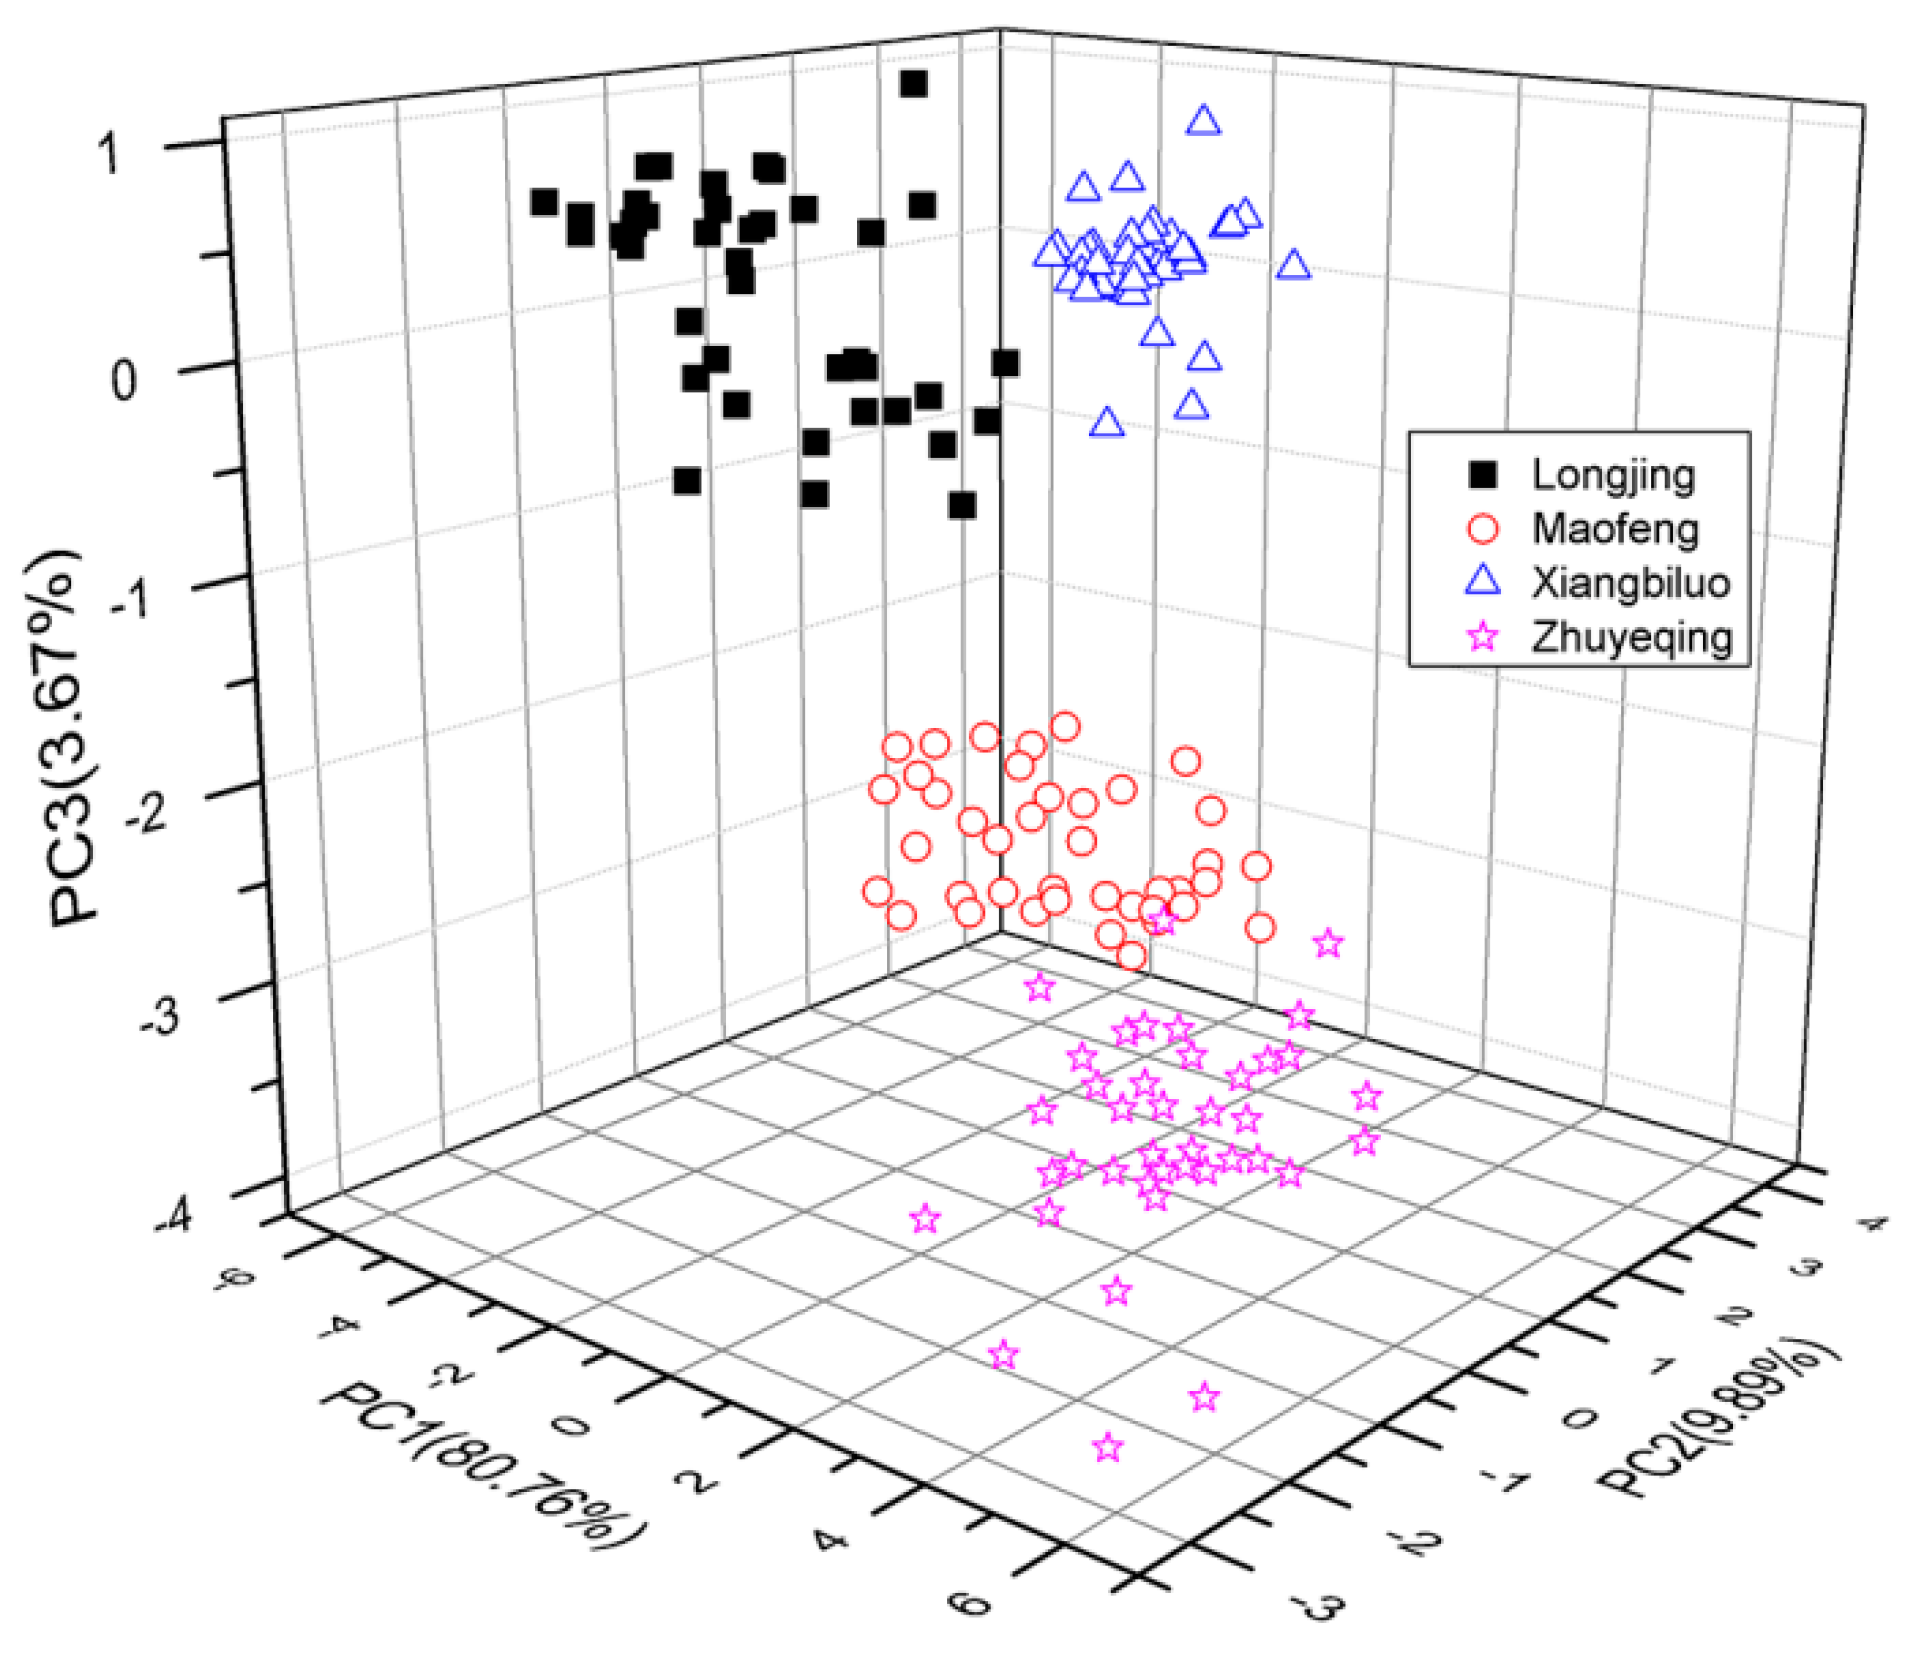
The THz spectrum between 0.2 and 1.0 THz of tea samples was selected as a feature for identification. PCA was performed to reduce the dimensionality of original THz spectroscopic data and extract the features of said data. After performing PCA, the first three principal components were extracted from the THz spectra data of 160 reference samples. The first three principal components were those three whose cumulative contribution rates were the largest. The principal components were created by converting the original spectral variables (i.e., the THz spectrum of tea samples) into linear combinations. The frequency range of the THz spectrum of tea samples was 0.2–1.0 THz. Therefore, the three principal components contained spectral information in the same frequency range. The contribution rates of these first three principal components reached 80.76%, 9.89%, and 3.67%, indicating that the original data set was effectively reduced into reasonable approximations via the first three principal components.
A scoring drawing of the principal components of the samples can indicate their internal features and clustering information. We established a 2-D scoring drawing (
Figure 5) of the first two principal components and a 3-D scoring drawing of the first three principal components (
Figure 6), accordingly.
Supervised learning necessitates two datasets: The training set (for modeling) and the testing set (for testing the quality of the established model). In our experiment, 40 groups of experimental data of each type of tea sample were randomly obtained as the training data and input to the SVM to establish the model. The 20 remaining groups of experimental data were used as the testing set. The model as-established was then employed to classify and identify the four groups of tea samples.
PCA can also be used to obtain the THz spectral features of samples and distinguish similar features across THz spectra. As shown in
Figure 5, the cumulative contribution variance of the first three principal components reached 94.32%. Thus, PC1, PC2, and PC3 were selected as the featured spectrum of the green tea samples for identification with the GA-SVM model.
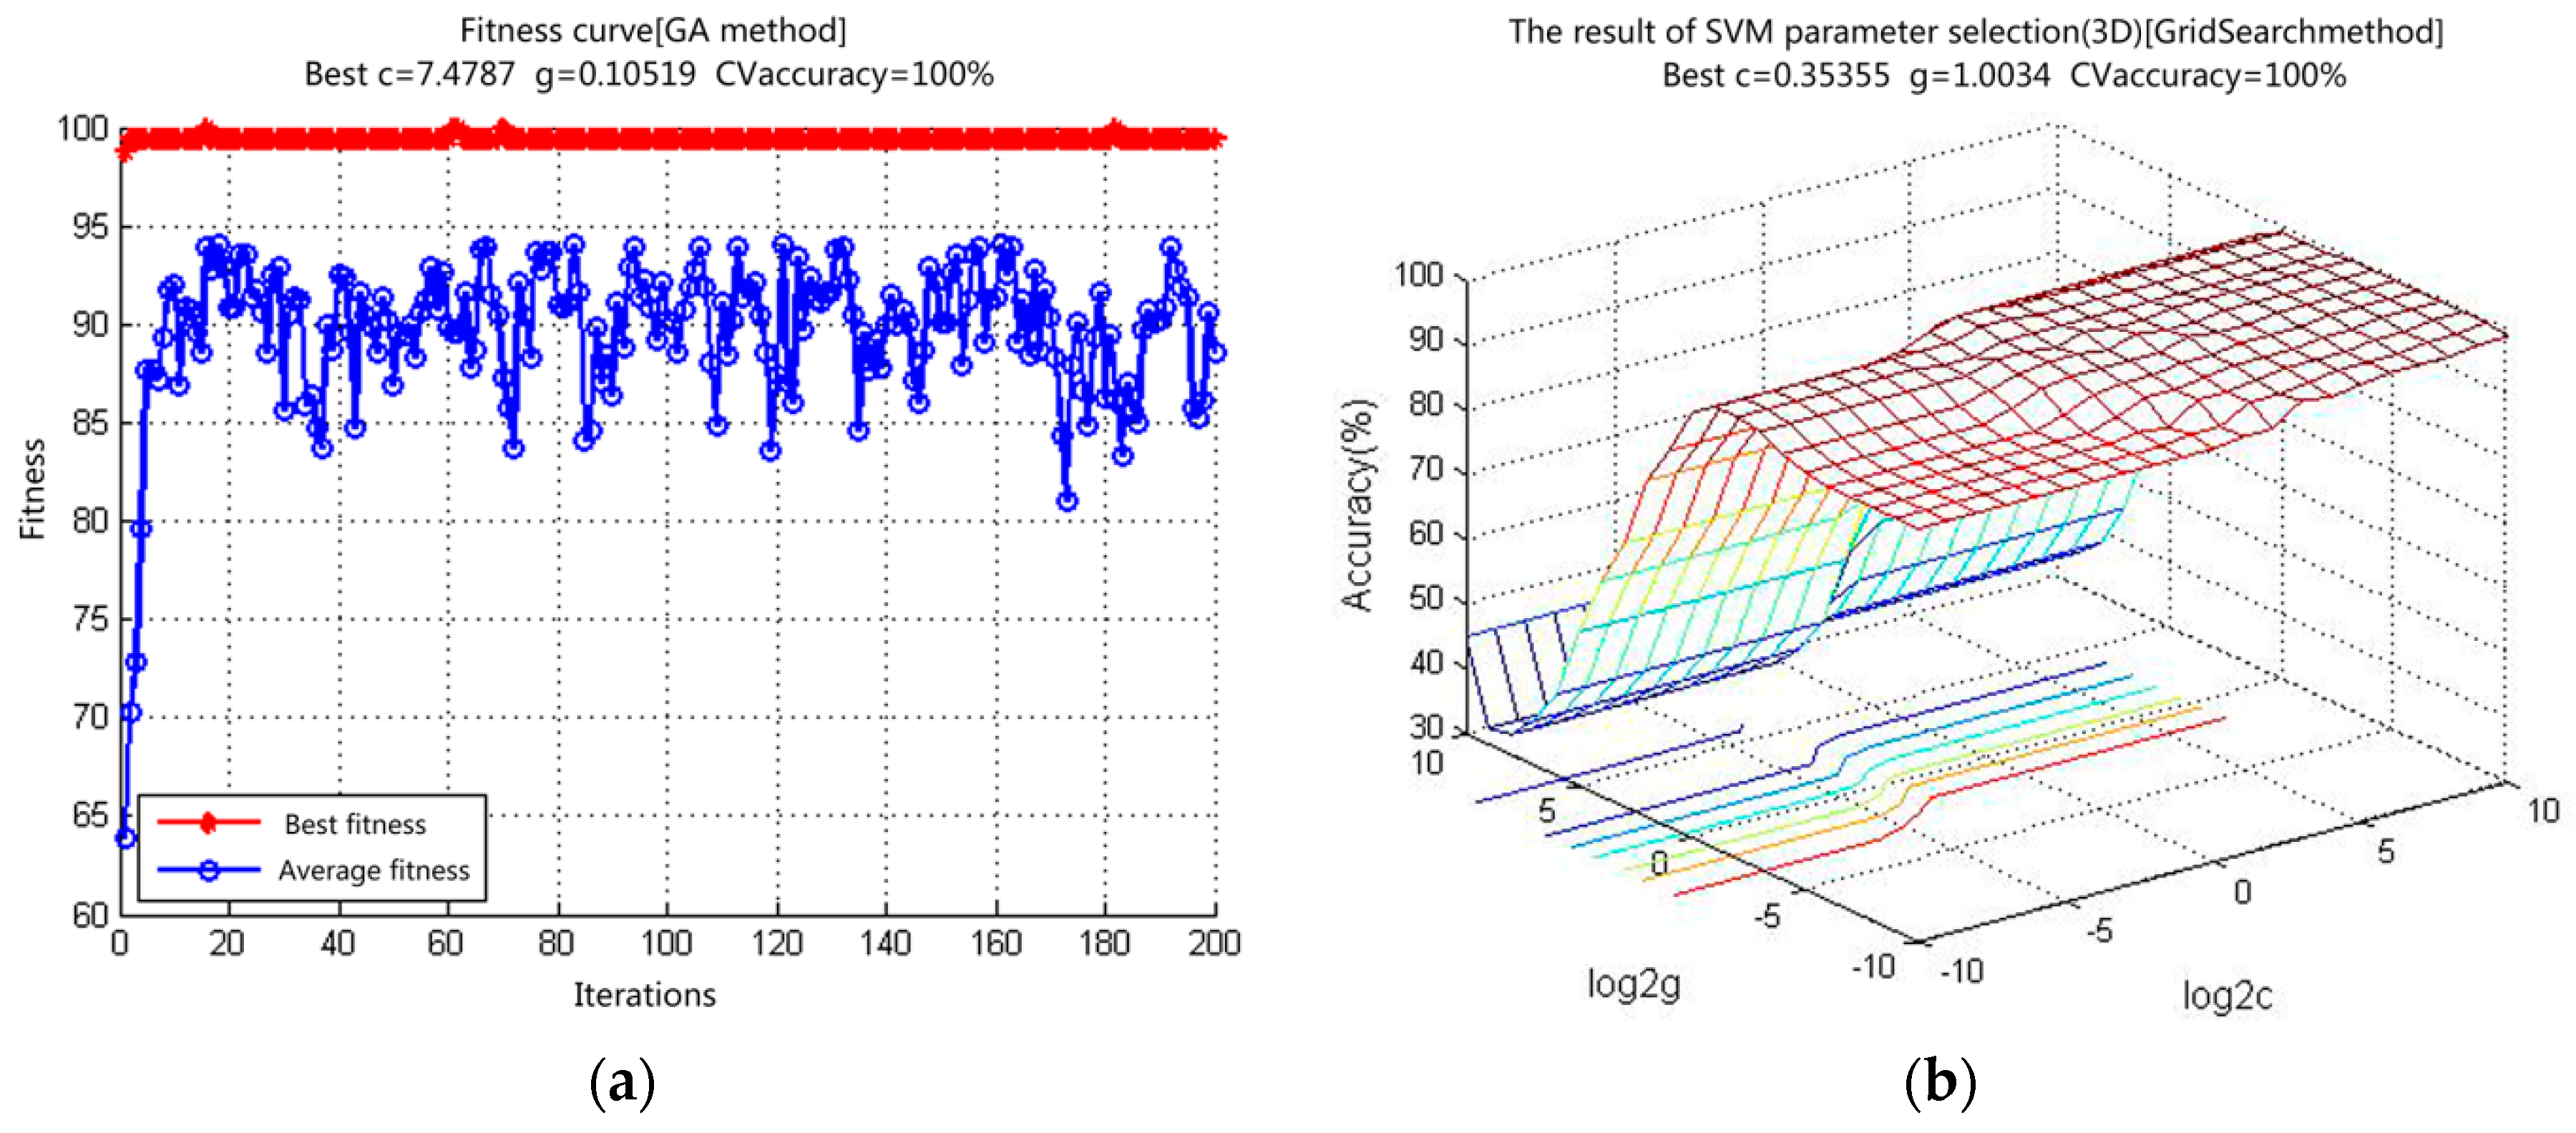
We used the SVM to establish the classification model with a kernel function as a radius basis function. GA was applied to optimize the highest penalty factor
C and kernel parameter g of the kernel function based on synchronous optimization. In the GA, various possible values of (
C,
g) were examined and cross-verified to determine the set with the highest accuracy. The optimized SVM parameters were
C = 7.4787 and
g = 0.10519 (
Table 1).
4. Results and Discussion
The GA iteration and fitness values, 3-D drawing of the grid search, and optimized parameters are shown in
Figure 7.
Table 1 lists the optimized parameters and the accuracy of the training samples yielded by two different methods (GA and Grid Search).
Table 2 and
Table 3 further indicates that the identification accuracy of the established model to the training samples reached 100%.
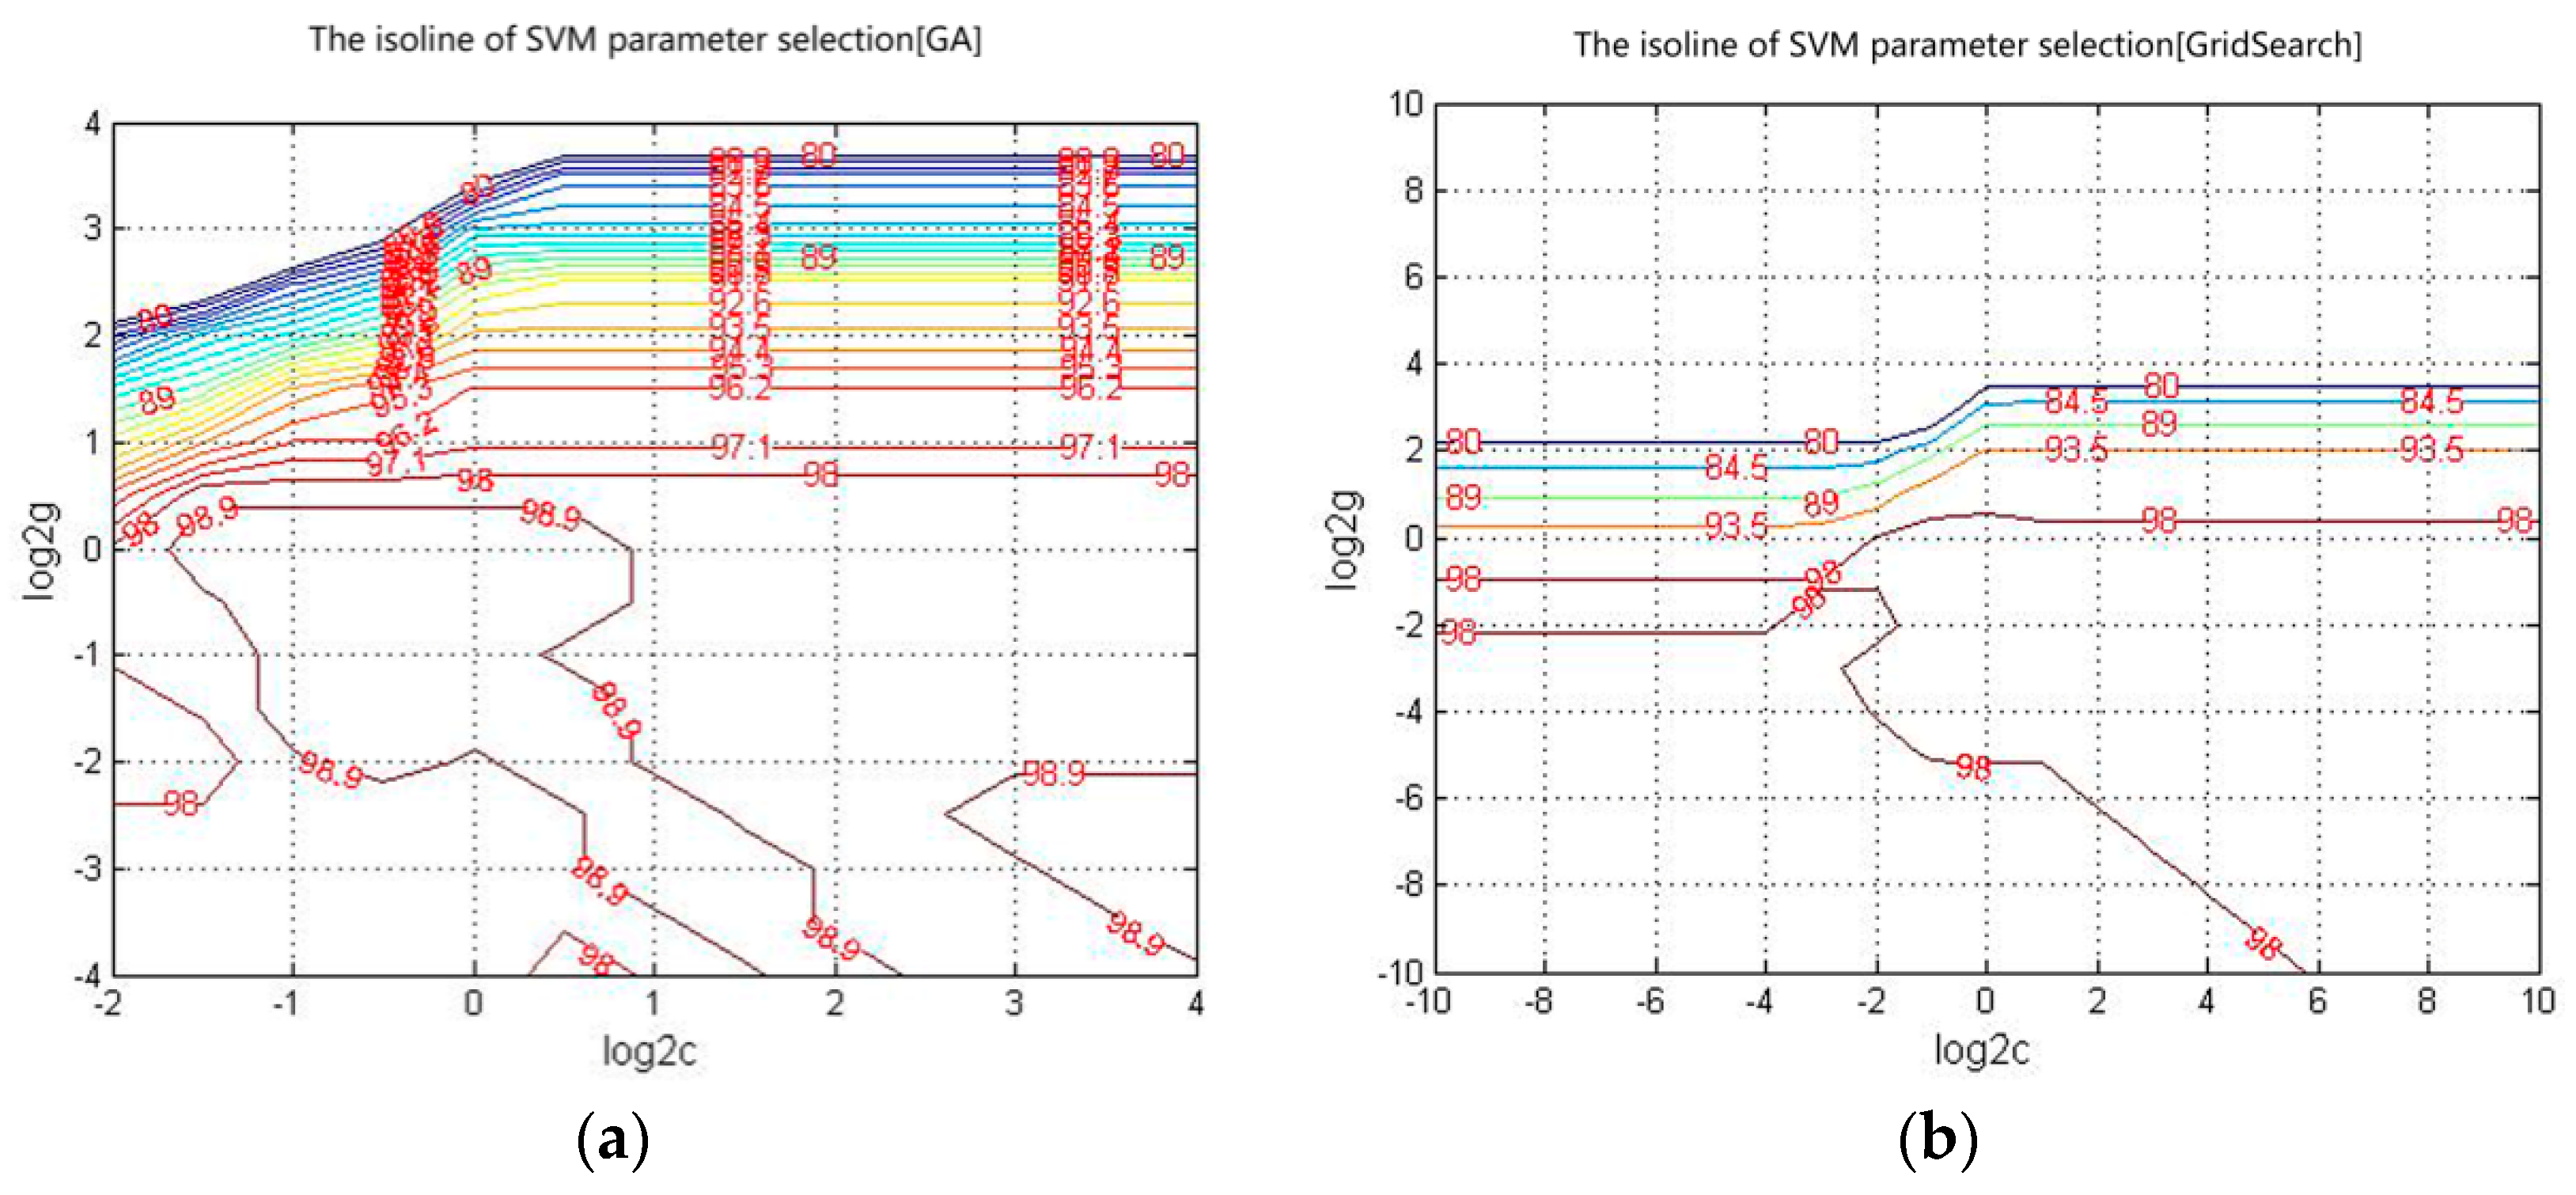
The isolines of the GA and Grid Search are shown in
Figure 8. The principles and approaches for parameter optimization of the two methods differ: GA requires a longer time than Grid Search (
Table 1) and can optimize the overall parameters of the SVM.
In the SVM model training process, the K-fold cross-validation was used. In K-fold cross-validation, the original sample is randomly partitioned into K subsamples. Of the K subsamples, a single subsample is retained as the validation data for testing the model, and the remaining K − 1 subsamples are used as training data. The cross-validation process is then repeated K times (the folds), with each of the K subsamples used exactly once as the validation data. The K results from the folds can then be averaged (or otherwise combined) to produce a single estimation. The advantage of this method over repeated random sub-sampling is that all observations are used for both training and validation, and each observation is used for validation exactly once. Five-fold cross-validation was used in this paper.
In fact, the K-fold cross-validation method cannot only improve the utilization of data, but also effectively avoid over-trained and under-trained states, with the final results being more convincing.
Two different parameter optimization methods were adopted to obtain the SVM model for the four different types of tea: Grid Search-SVM and the proposed GA-SVM. The accuracy of identification and miscalculated information on the samples are indicated in
Table 2 and
Table 3. The identification rates of grid search-SVM and GA-SVM for the training set of the samples reached 100%. Before classifying the test set, we knew in advance which type of tea would be measured. When the Grid Search-SVM model was used to classify the test set, three samples of Zhuyeqing were wrongly identified as Maofeng and two samples of Maofeng were mistakenly identified as Zhuyeqing. When the GA-SVM model was utilized to classify the samples, two samples of Zhuyeqing were wrongly identified as Maofeng and one sample of Maofeng was mistaken for Zhuyeqing. In the GA-SVM model, the identification rate of the test set of the green tea samples reached 96.25%—higher than that of the Grid Search-SVM model (93.75%).
The BP neural network is a nonlinear mapping from input to output [
26]. It is a multi-layer feedforward network based on an error back propagation algorithm including input layer nodes, one or more layers of hidden nodes, and output layer nodes. Information is transmitted across nodes of different layers in a single direction, and the connection weights control the degree of connection; the weights are adjusted based on the training data. The information includes input from the input layer and outputs decisions to the output layer.
We chose a three-layer BP neural network for tea classification. The design idea of a BP neural network in this paper is as follows: Firstly, we design a network with only one hidden layer node; In the process of training, a hidden layer node is added according to the rate of error descent and the variation of verification error, that is, when the rate of error descent is below the threshold and the validation error has reached the minimum value, a hidden layer node is added; When the minimum value of the validation error increases after the increase of the node, or the network training reaches the error target, the network training is stopped, so that we could obtain the minimum neuron network structure to ensure high enough network performance and generalization ability, and avoid as far as possible, the over-training problem. The network was trained with a scaled conjugate gradient algorithm with a tangent sigmoid function as the transfer function in the hidden layer. The network was trained with the traingd function; the tansig function was selected as the hidden layer transfer function and purelin was used as the output layer. The training goal was set to 0 and the maximum number of training iterations was set to 1000. In fact, when the number of hidden layer nodes reached eight and the number of iterations reached 15, we obtained the training goal 0.00040572, which is closest to the training target goal, the network training was stopped, and the best training model was obtained (
Figure 9).
As shown in
Table 4, when the BP neural network model was used to classify the test set, four samples of Zhuyeqing were wrongly identified as Maofeng and four samples of Maofeng were mistakenly identified as Zhuyeqing. In the BP neural network, the identification rate of the test set of the green tea samples reached 90%—lower than that of the Grid Search-SVM model (93.75%) and GA-SVM model (96.25%).
The experimental results altogether indicate that GA-SVM has very strong generalization ability in contrast to Grid Search-SVM and BP neural network methods. The Grid Search-SVM has faster convergence speed, but insufficient convergence accuracy; it is likely to miss the global optimal solution. The identification results of the BP neural network are affected by training sample size, training errors, and the structural complexity of the network. Networks that are too small cannot learn the correct number of hidden neurons, while excessively large networks tend to over fit the training data, resulting in weak performance. As mentioned above, the GA-SVM is an efficient, parallel, and comprehensive searching algorithm that automatically controls the searching process to determine optimum solutions through self-adaptation; the algorithm yields accurate identification results and converges well, even when the training samples are limited.
5. Conclusions
This study demonstrated that THz spectrum can provide accurate and qualitative information regarding four types of green tea with varying origin. The THz spectra combined with the proposed GA-SVM model can be successfully used to identify the geographical origins of green teas, at up to a 96.25% identification rate. In effect, the proposed algorithm enhances the identification accuracy of the THz spectra of green tea. This simple approach involves non-destructive sample preparation and rapid processing and identification. THz spectroscopy can be effectively applied to identify types of green tea with various origins.
This approach would also apply to the quantitative detection of other types of samples. As of now, it is not possible to detect subtle differences in the same type of green tea from different fields within the same region; we will attempt to secure a method for doing so in our next research project. As-is, the proposed approach may be a valuable and versatile on-line quality-control tool for foods, drugs, and health products.
Acknowledgments
This work is supported by the Chinese Ministry of Science and Technology (Project No. 2012BAK04B03), National 973 Program of China (Project No. 2015CB755401) and the Chongqing Science and Technology Commission (Project No. cstc2013jcyjC00001 and cstc2014jcyjA10036).
Author Contributions
Mingliang Li, Tianying Chang and Hong-Liang Cui conceived and designed the study. Guangbin Dai, Changcheng Shi, Dongshan Wei, and Chunlei Du performed the experiments. Mingliang Li and Tianying Chang wrote the paper. Mingliang Li, Tianying Chang and Hong-Liang Cui reviewed and edited the manuscript. All authors read and approved the manuscript.
Conflicts of Interest
The authors declare no conflict of interest.
References
- General Administration of Quality Supervision, Inspection and Quarantine of the People’s Republic of China. Regulations for Protecting Products of Original Origins, Beijing: General Administration of Quality Supervision, Inspection and Quarantine of the People’s Republic of China; General Administration of Quality Supervision, Inspection and Quarantine of the People’s Republic of China: Beijing, China, 1999.
- Todea, A.; Roian, I.; Holonec, L.; Arion, F.; Mocanu, C. Legal protection for geographical indications and designations of origin for agricultural products and foodstuffs. Bull. Univ. Agric. Sci. Vet. Med. Cluj-Napoca 2009, 66, 463–466. [Google Scholar]
- Zhi, Y.; Dong, H. A discussion on the methodology of tea sensory ssessment. J. Tea 2015, 41, 15–18. [Google Scholar]
- Huiwen, G.; Chunfang, Y. Problems and suggestions of the sensory inspection in tea. J. Food Saf. Qual. 2013, 4, 1292–1295. [Google Scholar]
- Moreda-Piñeiro, A.; Fisher, A.; Hill, S.J. The lassification of tea according to region of origin using pattern recognition techniques and trace metal data. J. Food Compos. Anal. 2003, 16, 195–211. [Google Scholar] [CrossRef]
- Togari, N.; Kobayashi, A.; Aishima, T. Pattern recognition applied to gas chromatographic profiles of volatile components in three tea categories. Food Res. Int. 1995, 28, 495–502. [Google Scholar] [CrossRef]
- Guanghua, N. Distinction for different of origin tea by thermoanalysis. Hubei Agric. Sci. 2004, 5, 77–78. [Google Scholar]
- Haining, K.; Miaofeng, Y.; Bo, C.; Chao, H.; Ling, W.; Xiaoru, W. Trace Element Determination in Teas and Discrimination Analysis for Teas. Rock Miner. Anal. 2006, 25, 22–26. [Google Scholar]
- Matvejev, V.; Zizi, M.; Stiens, J. Hydration Shell Parameters of Aqueous Alcohols: THz Excess Absorption and Packing Density. Phys. Chem. B 2012, 116, 14071–14077. [Google Scholar] [CrossRef] [PubMed]
- Cao, B.H.; Fan, M.B. Identification and Classification of Textiles Based on Terahertz Time Domain Spectroscopy. Spectrosc. Spectr. Anal. 2010, 30, 1748–1751. [Google Scholar]
- Lu, S.H. Detetion of Explosives by Terahertz Spectroscopic Techniques. Laser Optoelectron. Prog. 2012, 49, 040006. [Google Scholar]
- He, T.; Shen, J.L. Applications of Terahertz Spectroscopy in Illicit Drugs Detection. Spectrosc. Spectr. Anal. 2013, 33, 2348–2353. [Google Scholar]
- Haddad, J.E.; Bousquet, B.; Canioni, L.; Mounaix, P. Review in terahertz spectral analysis. TrAC Trends Anal. Chem. 2013, 44, 98–105. [Google Scholar] [CrossRef]
- Zhang, Y.; Peng, X.H.; Chen, Y.; Chen, J.; Curioni, A.; Andreoni, W.; Nayak, S.K.; Zhang, X.-C. A first principle study of terahertz (THz) spectra of acephate. Chem. Phys. Lett. 2008, 452, 59–66. [Google Scholar] [CrossRef]
- Hua, Y.; Zhang, H. Qualitative and Quantitative Detection of Pesticides with Terahertz Time-Domain Spectroscopy. IEEE Trans. Microw. Theory 2010, 58, 2064–2070. [Google Scholar]
- Ma, Y.; Wang, Q.; Li, L. PLS model investigation of thiabendazole based on THz spectrum. J. Quant. Spectrosc. Radiat. Transf. 2013, 117, 7–14. [Google Scholar] [CrossRef]
- Namkung, H.; Kim, J.; Chung, H.; Arnold, M.A. Impact of Pellet Thickness on Quantitative Terahertz Spectroscopy of Solid Samples in a Polyethylene Matrix. Anal. Chem. 2013, 85, 3674–3681. [Google Scholar] [CrossRef] [PubMed]
- Kikuchi, N.; Tanno, T.; Watanabe, M.; Kurabayashi, T. A membrane method for terahertz spectroscopy of amino acids. Aanal. Sci. 2009, 25, 457–459. [Google Scholar] [CrossRef]
- Markelz, A.G.; Roitberg, A.; Heilweil, E.J. Pulsed terahertz spectroscopy of DNA, bovine serum albumin and collagen between 0.1 and 2.0 THz. Chem. Phys. Lett. 2000, 320, 42–48. [Google Scholar] [CrossRef]
- Pupeza, I.; Wilk, R.; Koch, M. Highly accurate optical material parameter determination with THz time-domain spectroscopy. Opt. Express 2007, 15, 4335–4350. [Google Scholar] [CrossRef]
- Burges, C.J.C. A tutorial on support vector machines for pattern recognition. Data Min. Knowl. Discov. 1998, 2, 121–167. [Google Scholar] [CrossRef]
- Vapink, V.N. An overview of statistical learning theory. IEEE Trans. Neural Netw. 1999, 10, 988–999. [Google Scholar] [CrossRef] [PubMed]
- Wang, L.; He, Y.; Liu, F. Rapid detection of sugar content and pH in beer by using spectroscopy technique combined with support vector machines. J. Infrared Millim. Waves 2008, 27, 51–55. [Google Scholar] [CrossRef]
- Snchez, A.V.D. Advanced support vector machines and kernel methods. Neurocomputing 2003, 55, 5–20. [Google Scholar] [CrossRef]
- Burnett, A.D.; Fan, W.H.; Upadhya, P.C.; Cunningham, J.E.; Hargreaves, M.D.; Munshi, T.; Edwards, H.G.M.; Linfield, E.H.; Davies, A.G. Broadband terahertz time-domain spectroscopy of drugs-of-abuse and the use of principal component analysis. Analyst 2009, 134, 1658–1668. [Google Scholar] [CrossRef] [PubMed]
- Qin, J.; Yu, Z.; Hao, Z.; Ou, G.; Zhao, J.; Liu, D. Division-based rainfall-runoff simulations with BP neural networks and Xinanjiang model. Neurocomputing 2009, 72, 2873–2883. [Google Scholar]
© 2017 by the authors. Licensee MDPI, Basel, Switzerland. This article is an open access article distributed under the terms and conditions of the Creative Commons Attribution (CC BY) license ( http://creativecommons.org/licenses/by/4.0/).

 ,
, 


