Article

Global Synchronization of Multichannel EEG   Based on Rényi Entropy in Children with Autism  Spectrum Disorder

1
State Key Laboratory of Cognitive Neuroscience and Learning & IDG/McGovern Institute for Brain Research, Beijing Normal University, Beijing 100875, China
2
Center for Collaboration and Innovation in Brain and Learning Sciences, Beijing Normal University, Beijing 100875, China
3
Institute of Electrical Engineering, Yanshan University, Qinhuangdao 066004, China
4
College of Electronic & Information Engineering, Hebei University, Baoding 071002, China
5
Key Laboratory of Digital Medical Engineering of Hebei Province, Baoding 071002, China
*
Authors to whom correspondence should be addressed.
Appl. Sci. 2017, 7(3), 257; https://doi.org/10.3390/app7030257
Submission received: 31 December 2016 / Accepted: 4 March 2017 / Published: 6 March 2017

Abstract

:
Autism spectrum disorder (ASD) has been defined as a pervasive neurodevelopmental disorder, involving communication, social interaction and repetitive behaviors. Currently, it is still challenging to understand the differences of brain activity between ASD and healthy children. In this study, we propose calculating the Rényi entropy of the eigenvalues derived from the signal correlation matrix to measure the global synchronization in multichannel electroencephalograph (EEG) from 16 children with ASD (aged 8–12 years) and 16 age- and sex-matched healthy controls at the resting state. The results indicate that there is a significantly diminished global synchronization from ASD to healthy control. The proposed method can help to reveal the intrinsic characteristics of multichannel EEG signals in children with ASD and aspects that distinguish them from healthy children.

1. Introduction

Autistic spectrum disorders (ASD) have been defined as heterogeneous neurodevelopmental disorders with some core characteristics that highlight social and communication impairments as well as repetitive and restricted interests and behaviors [1,2]. The associated deficits include executive function, language, emotional, and social function [3,4,5]. Moreover, individuals with ASD usually have difficulties in perception and attention [6]. The above findings indicate widespread brain anomalies in ASD.
EEG primarily measures postsynaptic brain activity directly in the neocortex [7], which can resolve neurophysiological oscillations and dynamics on the millisecond scale. Many studies investigated EEG patterns to understand the presumed mechanisms underlying neurodevelopmental disorders, such as disruption of the excitatory/inhibitory balance of neural activity [8]. Some studies employing spectral analysis of the EEG signals of ASD reveals that a U-shaped profile of EEG power alterations abnormally increase the power in the low-frequencies, in range of delta and theta, and high-frequencies, in range of beta and gamma, and the power in the alpha band is abnormally reduced [9,10]. ASD subjects have significantly greater relative power in the theta and beta frequency range in frontal region while they have reduced alpha power in frontal and posterior region [11]. In the sleep analysis of ASD, the ASD group has lower absolute beta amplitude during REM sleep and higher absolute theta spectral amplitude during evening wakefulness [12]. These studies have demonstrated that neural oscillations are abnormal in ASD.
Additionally, in many neurological studies, synchronization refers to a greatly important mechanism which can help to describe information processing for a typical or atypical brain [13,14,15,16]. Usually, the neural signals in different brain areas were recorded by employing multiple electrodes simultaneously. Functional connectivity between different brain regions was also assessed. Some neuronal network studies showed short-range hyper-connectivity between intra-hemispheres and long-range hypo-connectivity between two hemispheres and cortex in children with ASD [17,18,19]. Ghanbari et al. [10] employed the synchronization likelihood to access functional connectivity, and they found there is increased short-range connectivity in ASD in the frontal lobe in the range of delta and long-range connectivity in the alpha band. There is much evidence that has suggested abnormalities in the synchronized oscillatory activity of neurons.
Currently, an increasing amount of evidence, from physiological and electrophysiological studies, has proven that abnormalities in the synchronous oscillatory activity of neurons may dominate in the pathophysiology of brain disorder [15,16,20,21], and these will be reflected in EEG signals. Therefore, to evaluate the cooperation strength between neurons or cortical networks, a common approach is to measure them from EEG signals. To this end, bivariate measures have been widely used in many studies. These measures involve cross-correlation, coherence, mutual information, and phase synchronization in neural signals that demonstrate abnormalities of synchronization in different brain region [22,23]. Notably, these mentioned bivariate approaches fail to imply the global synchronization of multivariate neural signals [24]. Considering multivariate property of multichannel signals in the time domain, an issue to infer cooperation among them has gained considerable attention and correspondingly. Novel indices have been proposed to address this [25,26].
In the study of coupled systems, cross-correlation is a classical way to explore the interdependencies between two signals. For the multichannel EEG signals, cross-correlation has been used, and the corresponding index is generally calculated using the Shannon entropy of the eigenvalues of the signal correlation matrix [27]. Recently, Righero proposed a new cross-correlation index employing the Rènyi entropy of the eigenvalues of the correlation matrix and an optimization were performed [25]. This extension from Shannon entropy to Rényi entropy and the optimization processing provide a better way to use the information conveyed in the correlation matrix, especially for a small number of signals. In view of this point, it can be also used to estimate the synchronization among multichannel EEG signals and characterize the changes in global synchronization in different brain disorders. Following the Rènyi entropy methodology [25], this paper focuses on revealing the differences of global synchronization between children with ASD and healthy subjects through resting-state EEG.

2. Materials and Methods

2.1. Participants

Sixteen participants with ASD (age range 8–12 years) and 16 age- , sex- and IQ-matched typical controls were recruited for this study. Diagnosis was done according to the Diagnostic and Statistical Manual of Mental Disorders, Fifth Edition DSM-V. The IQ of all children were required to meet the full scale IQ ≥ 75, which is assessed by the Wechsler Abbreviated Scale of Intelligence (WASI) [28]. This study was approved by the School of Psychology Research Ethics Committee at the University of Beijing Normal University and all participants were given informed written consent.

2.2. EEG Data Collection

Multichannel resting-state EEG signals were acquired with 128 Ag/AgCl electrodes (Electrical Geodesics Inc., Eugene, OR, USA). Continuous EEG signals were amplified, digitized with a sampling rate of 1000 Hz, and collected employing Net Amps 300 amplifier and Net Station 4.5.2 software (Electrical Geodesics Inc., Eugene, OR, USA) on a Mac PC. Prior to recording, channel gains and zeros were measured to provide an accurate scaling factor for the display of waveform data. The children’s head size and Cz was measured and marked with a wax pencil to ensure the right size and accurate placement of the net. Scalp impedances were checked online using Net Station (EGI, Inc.) to ensure the scalp impedances below 50 KΩ. Data were referenced online to Cz. Ten minutes of “resting-state” open-eye EEG were recorded while children were comfortably seated in on an armchair or on a caregiver’s lap in a dimly lit room. According to the standard international 10–20 electrode placement, we selected 19 electrodes (i.e., Fp1, Fp2, F3, F4, C3, C4, P3, P4, O1, O2, F7, F8, T3, T4, T5, T6, Fz, Cz, and Pz) for a more accurate result.

2.3. EEG Preprocessing

The recorded resting-state EEG signals were first filtered with a bandpass frequency band from 0.5 to 45 Hz [29]. Sensors were marked as bad channels when the sensors were above 50 KΩ or recording segments exceeded a 200 μV threshold, and their corresponding data were interpolated from the neighboring channels. Then, EEG data were cut into non-overlapping epochs of 4 s. An artifact detection algorithm was used to select the segments without artifact including eye movements, eye-blinks, power supply (50 Hz), breathing, muscle, abrupt slopes, and outlier values [30]. The epoch was marked as an artifact and then was rejected if any of parameters calculated for each type of artifact exceeded a threshold. Preprocessed signals were then visually inspected to reject those segments containing ocular or muscle. The data were down-sampled to 250 Hz. Afterwards, the EEG signals from ASD and control subjects were selected in this study. For each dataset, a total of 160 four-second 19-channel EEG epochs from 16 children were extracted. There were altogether 320 artifact-free EEG epochs.

2.4. EEG Data Analysis

2.4.1. The Correlation Matrix Analysis and S-Estimator

Consider N sampled neuronal data (time-series), [s1(l),…,sN(l)], with l ϵ { 1 , 2 , , L } , where N and l denote the channel number and the number of data points contained in time-window L, respectively. Let P R N × N be the calculated correlation matrix whose elements Pij are represented as follows
P i j = Cov ( s i , s j ) Cov ( s i , s i ) · Cov ( s j , s j )
where Cov(∙) denotes the covariance calculation function. Assuming { λ 1 , , λ N } are the eigenvalues of P, the Shannon entropy measure of the eigenvalues distribution can be calculated as [31]
I = n = 1 N λ n N log ( λ n N )
Note that the above measure I is inversely related to the cooperation strength in multivariate time-series and lies in the range of [0, log(N)]. In this study, we use the S estimator to evaluate synchronization in multichannel EEG signals by using the distributions of the eigenvalues of the covariance matrix P. We normalize and take the complement to 1, the normalized index S based on S-estimator can be summarized as follows [25]:
S = 1 I / log ( N )
This index S reflects the cooperation among the N sampled neuronal signals, i.e., [s1(l),…,sN(l)].

2.4.2. Rènyi Entropy and the Index S α

The S index in Equation (3) is calculated by using the classic Shannon entropy of the eigenvalues distribution of the correlation matrix P. In this study, instead of Shannon entropy, we use its generalization version [32,33,34,35]. A new parameter α is introduced to provide a better way to obtain an optimal index S α . The Rényi entropy I α to measure the distribution of the given eigenvalues of P, which is defined as follows:
I α = 1 1 α log ( n = 1 N ( λ n N ) α )
Obviously, when the order α goes to 1, the Rényi entropy I α converges to the Shannon entropy I defined in Equation (2). Similarly, the quantity I α is also inversely related to the amount of cooperation among the multivariate EEG time-series and ranges in [0, log(N)]. Accordingly, its normalized index S α can be calculated as follows [25]:
S α = 1 I α / log ( N )
The order α provides the choices for different degree of freedom, thus allowing us to optimally tune the index S α .

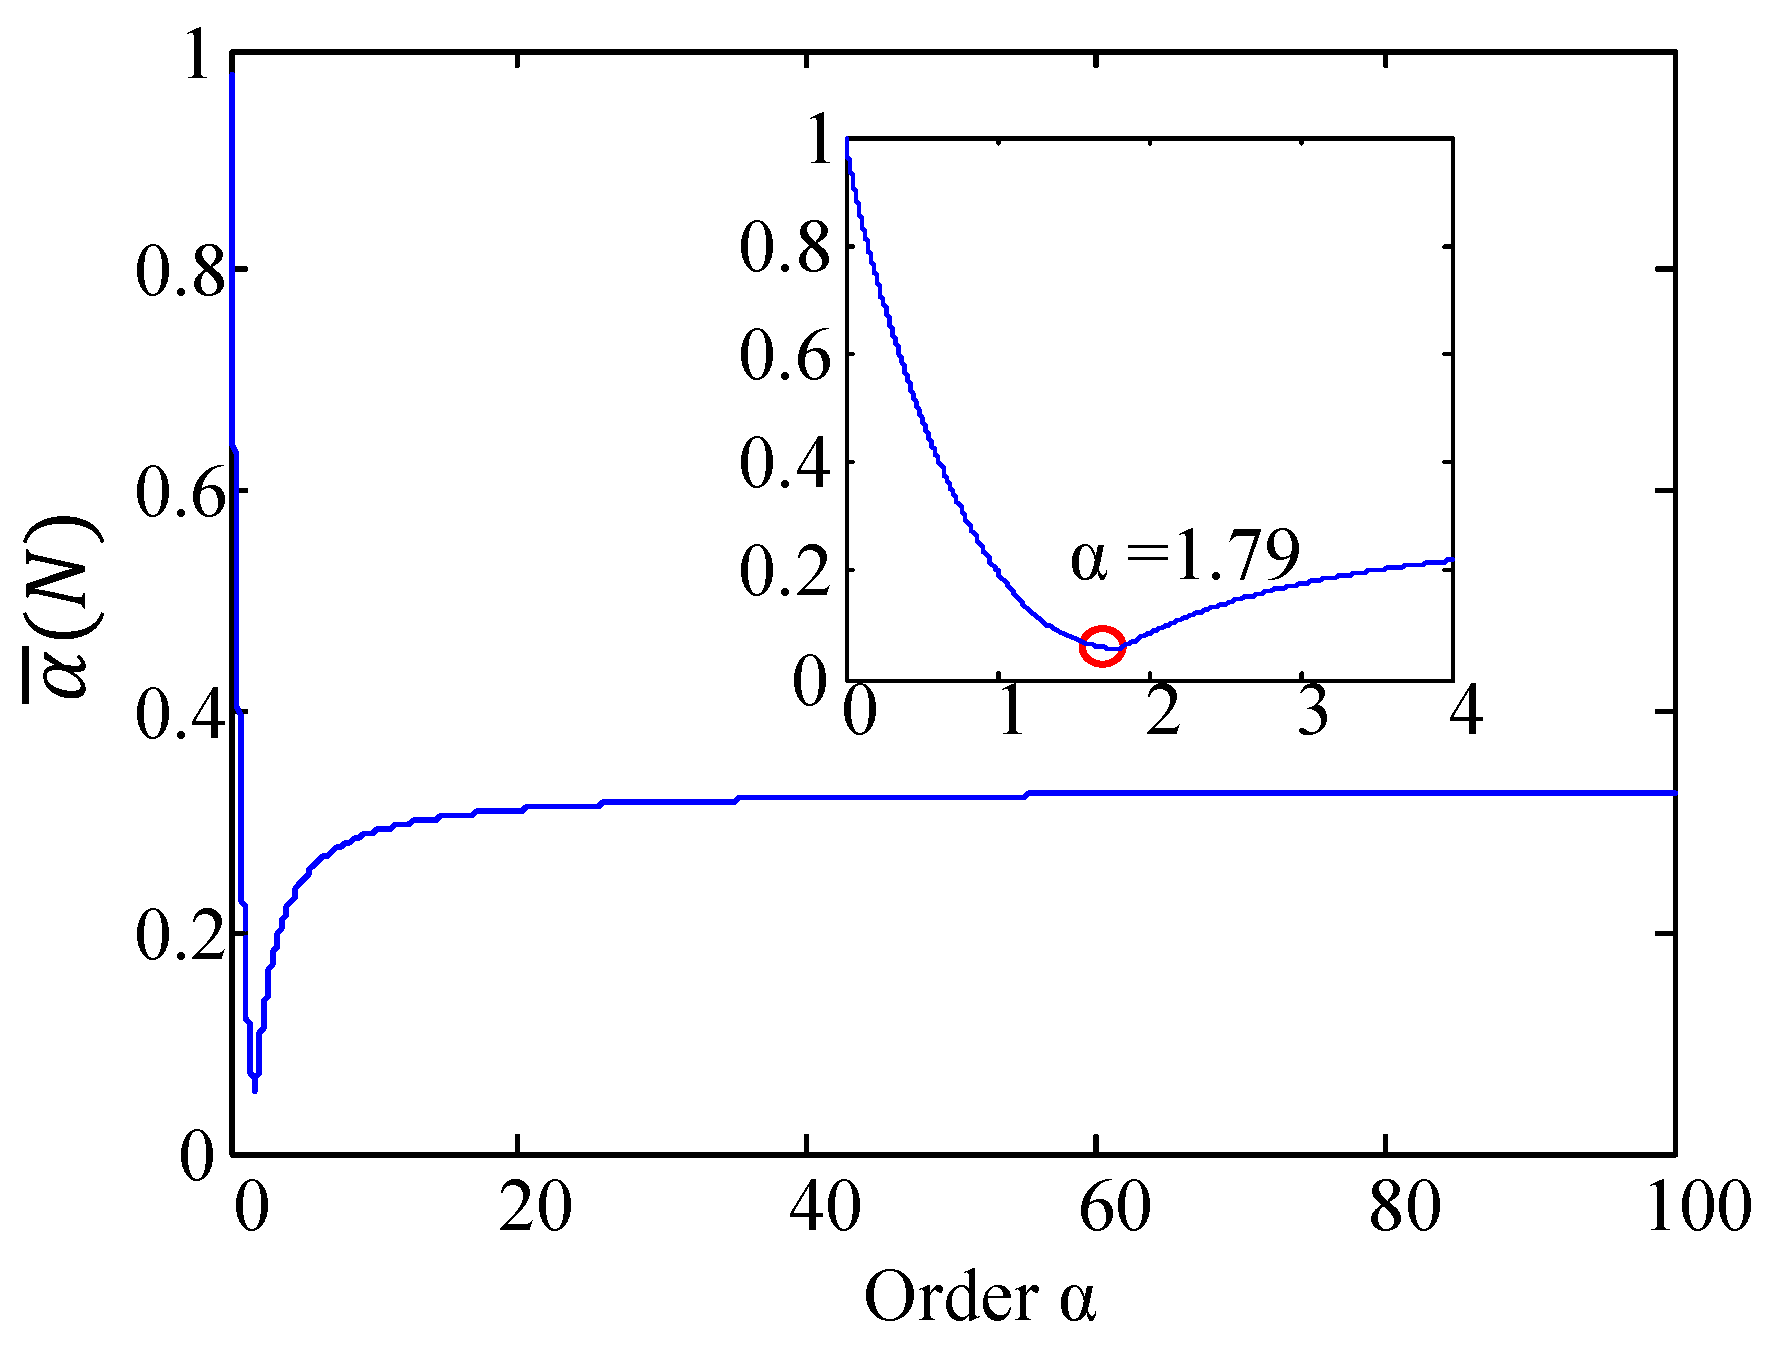
2.4.3. Optimal Order α
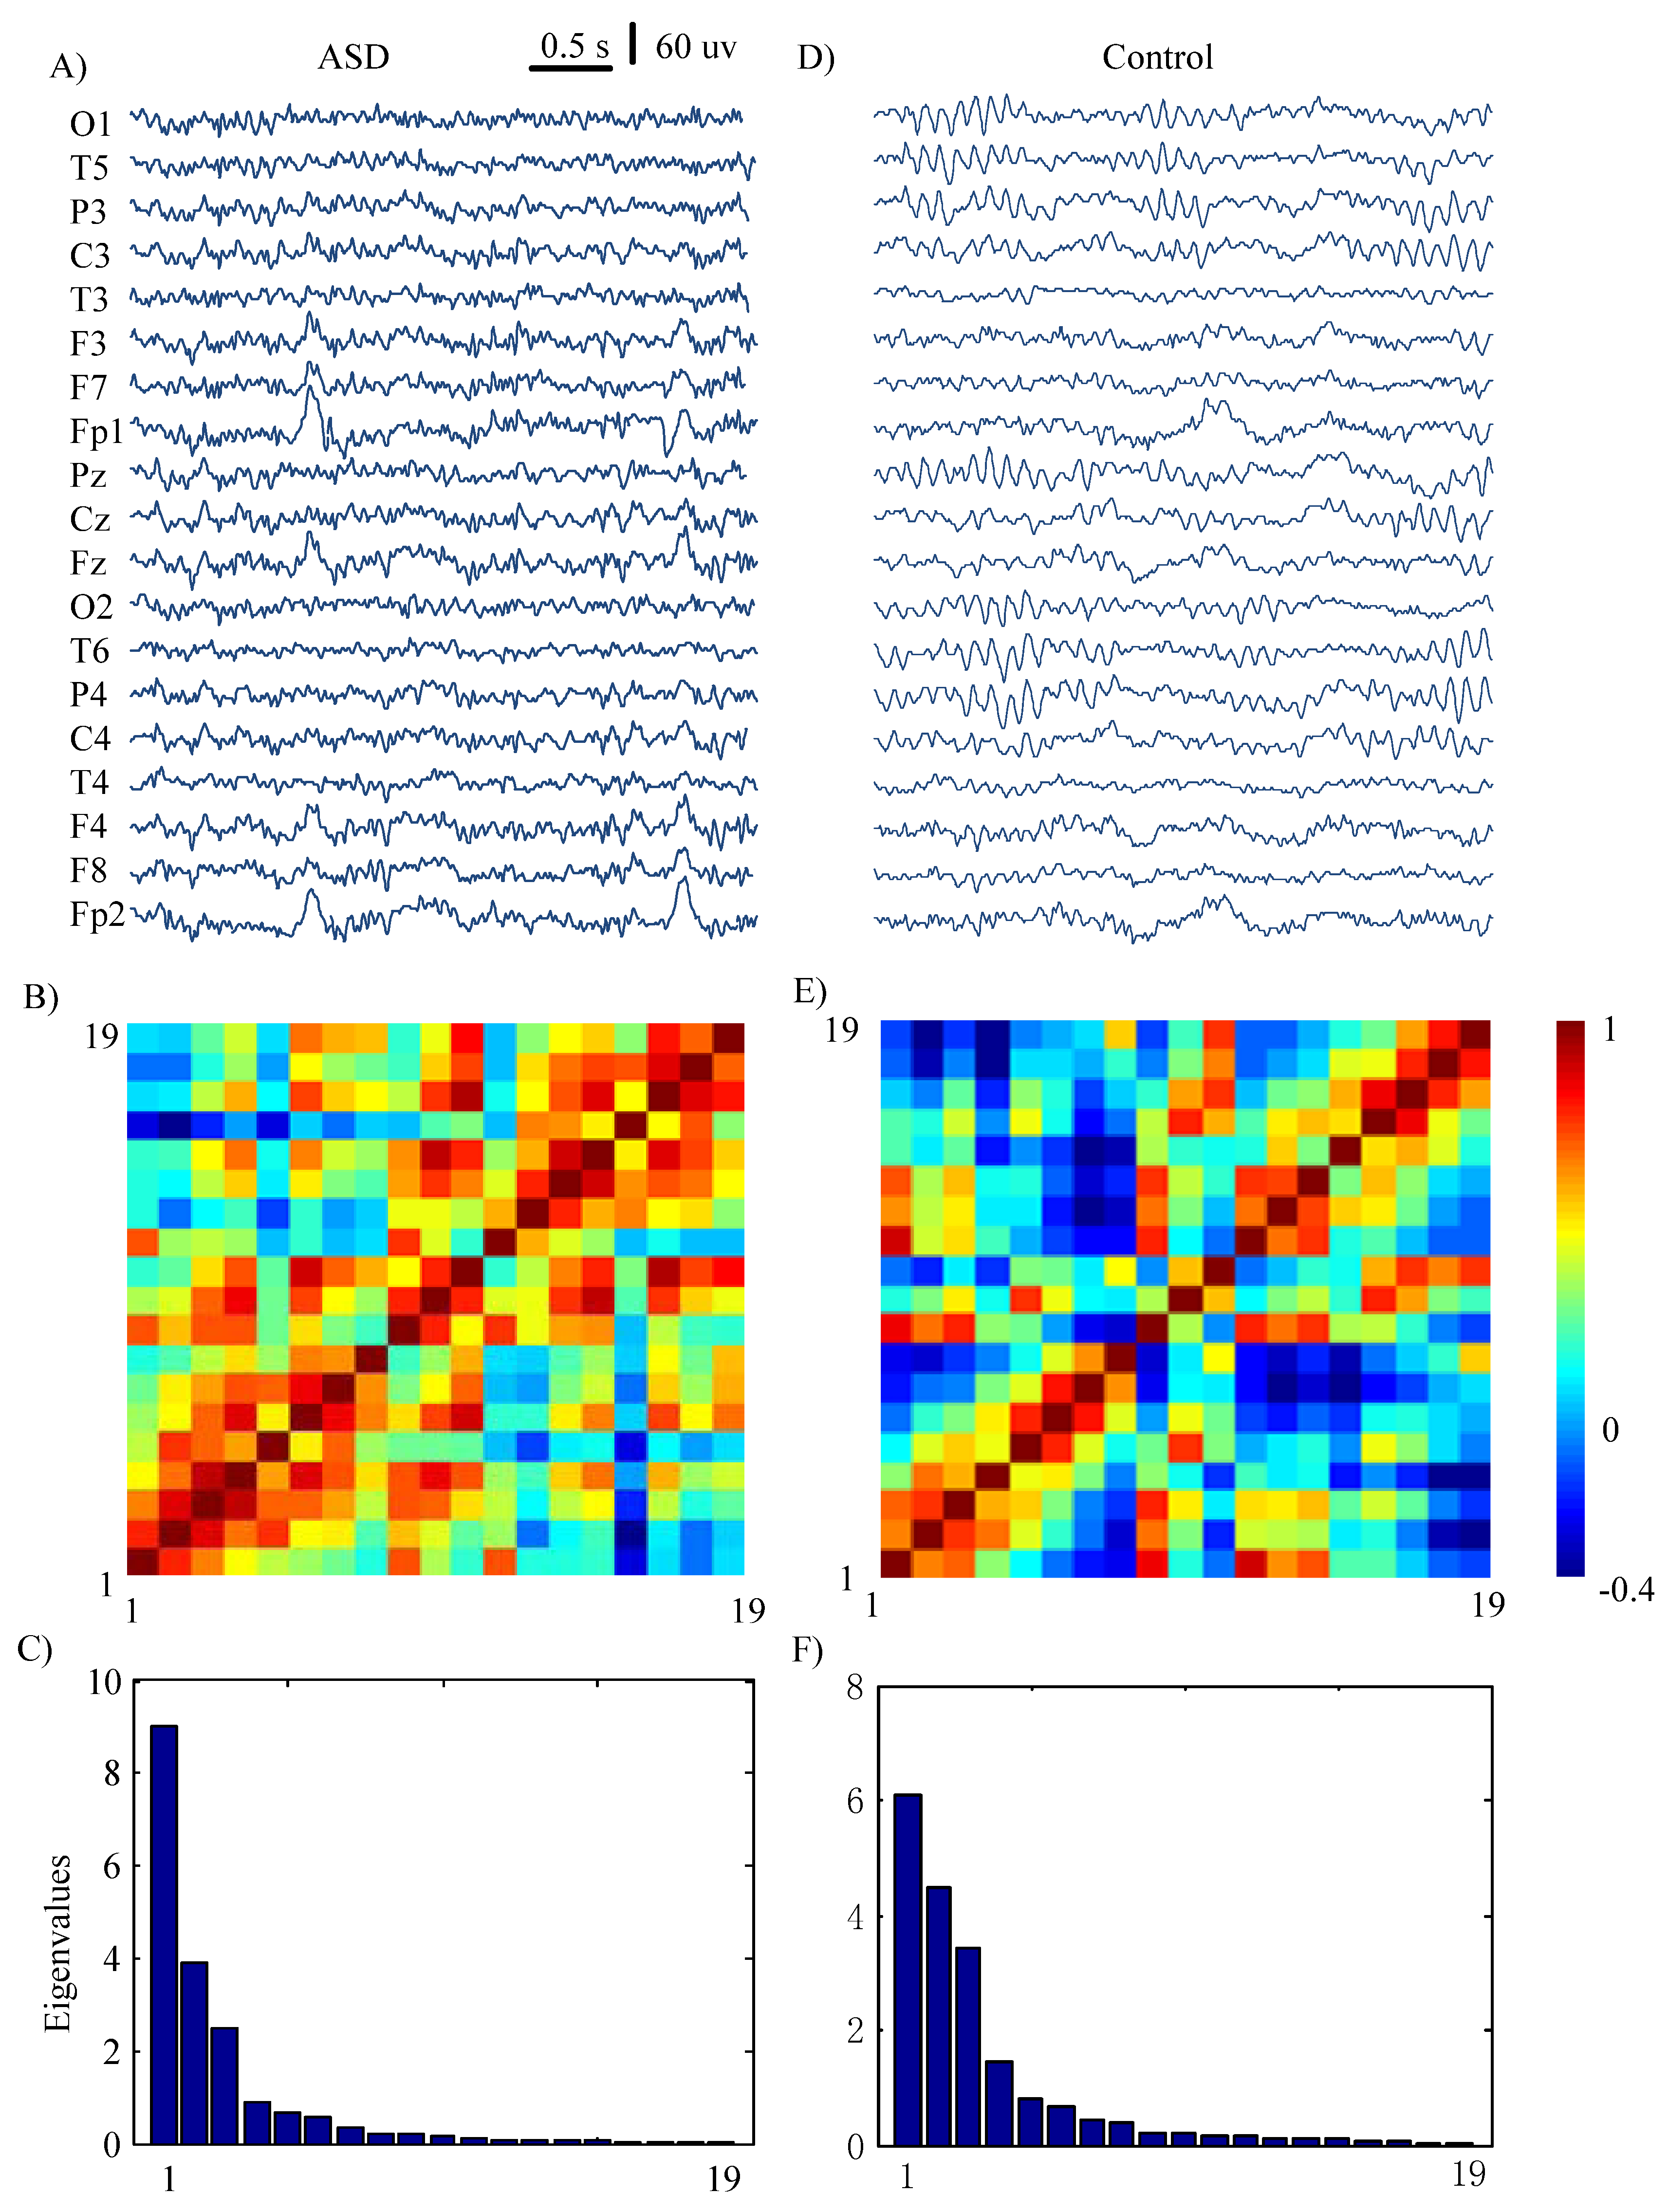
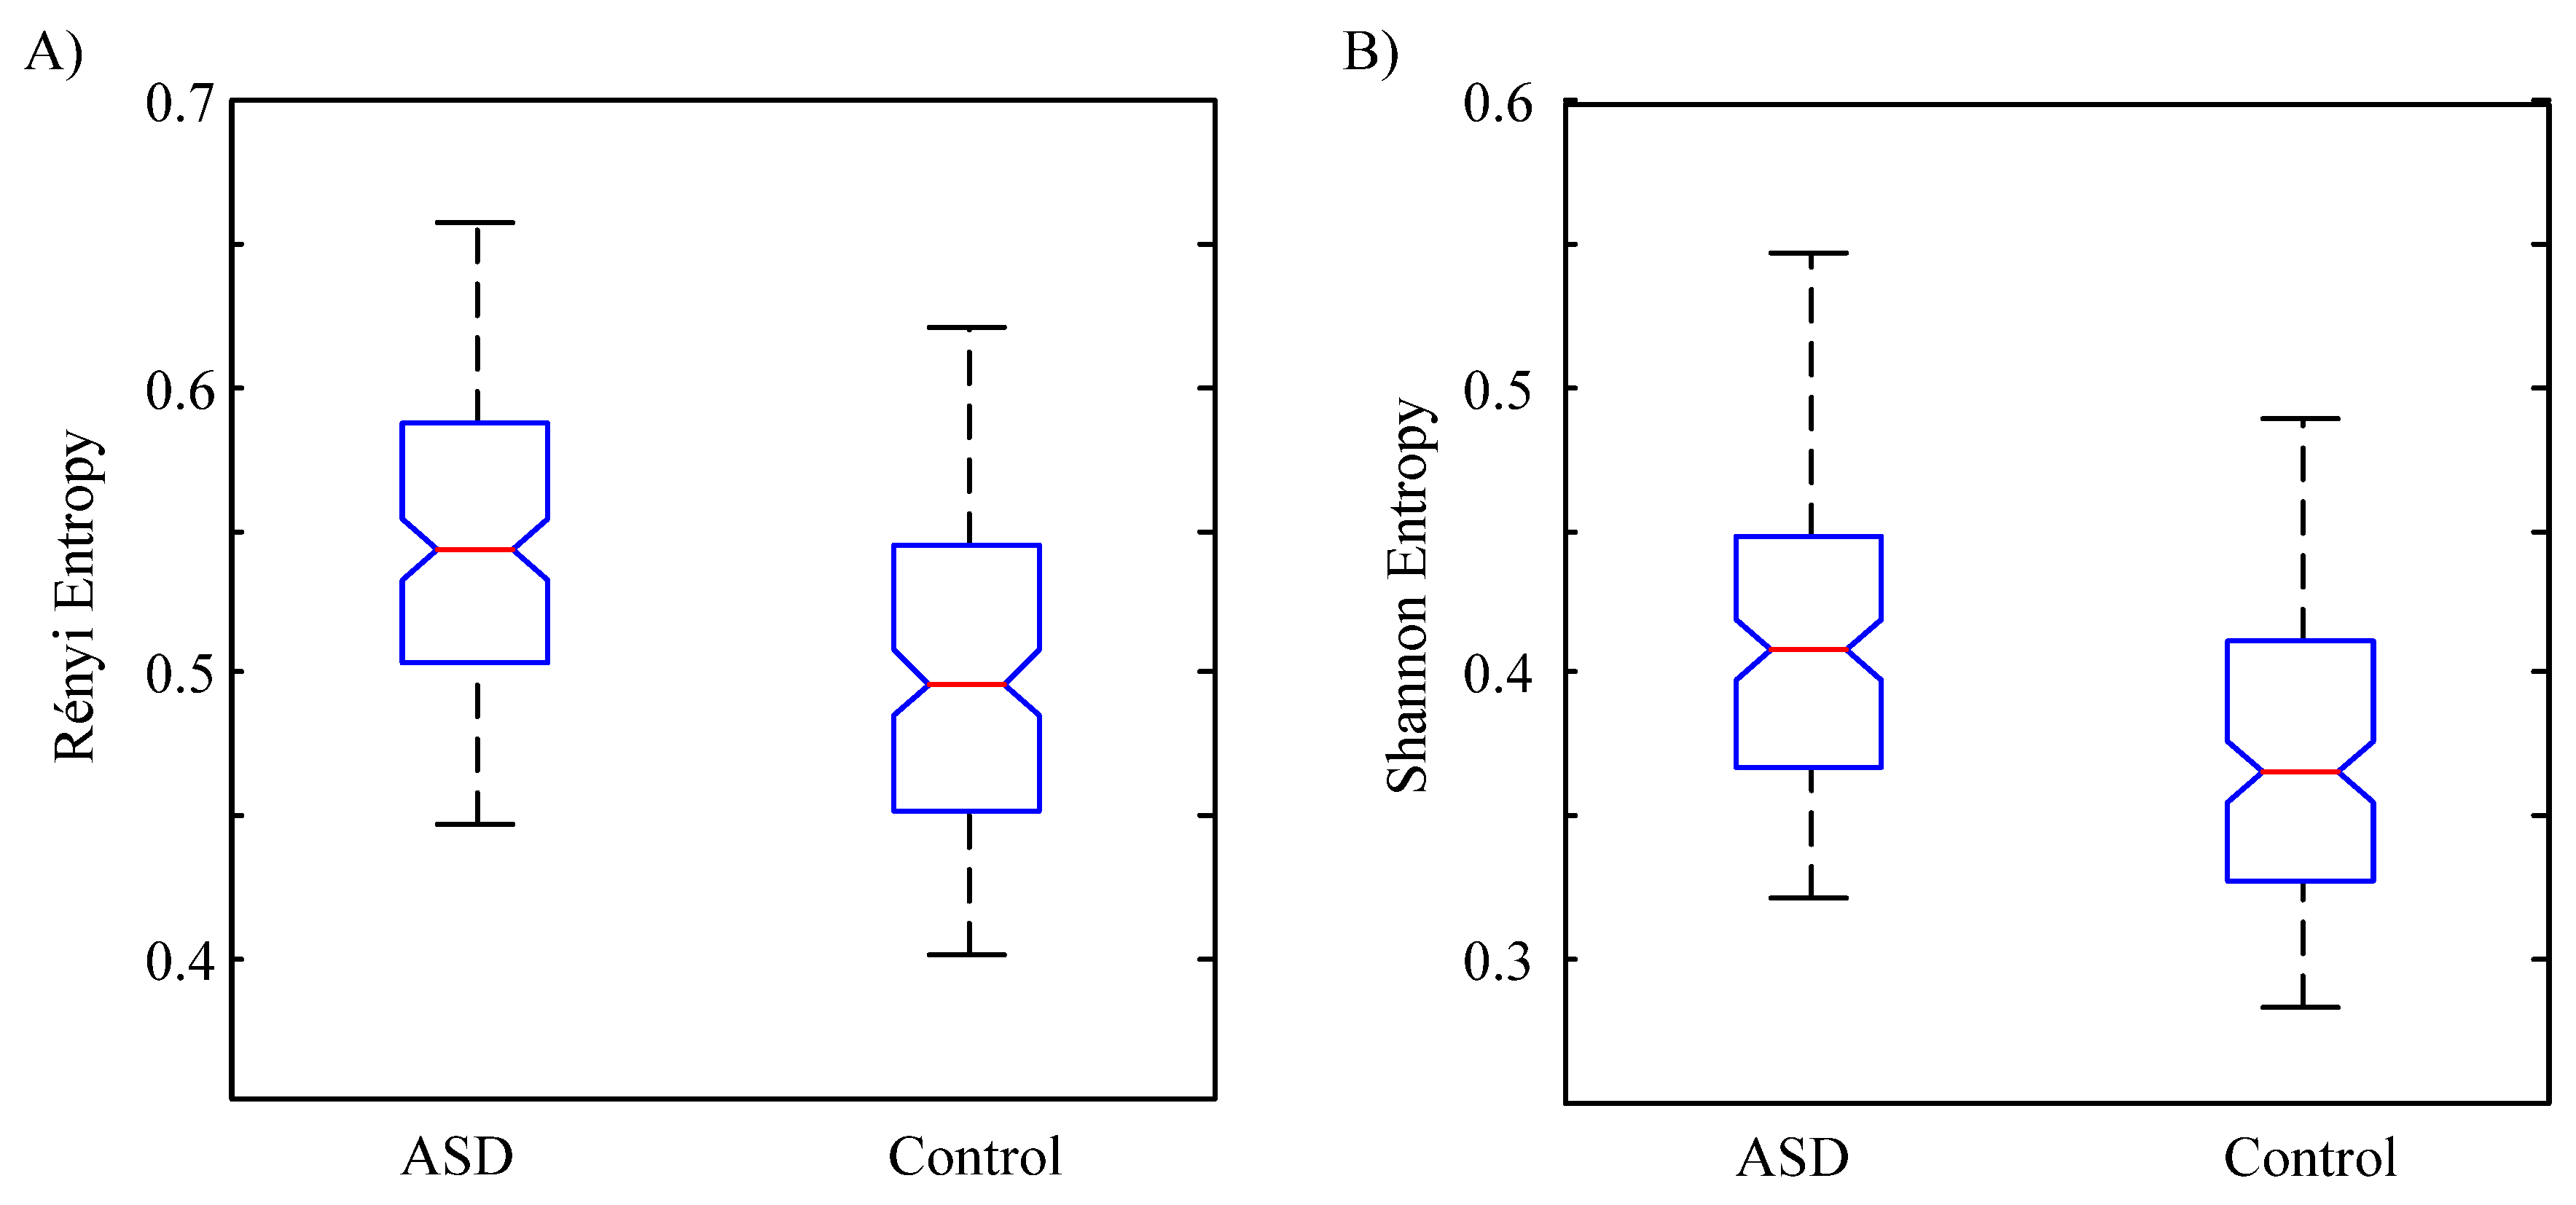
As has been reported in [25], an optimized index S α ( N ) ( ρ , N ) was calculated, where α ¯ (N) is as follows:
α ¯ ( N ) = α [ 0 , 100 ] a r g m i n ( | ρ [ 0 , 1 ] m a x S α ( ρ , N ) ρ | )
where ρ [ 1 , 1 ] indicates the cross-correlation between two time series of s1(l) and s2(l). In general, our goal is to obtain an optimal index that discerns among different cooperation strengths as much as possible.

3. Results

We consider the value of max ρ [ 0 , 1 ] | S α ( ρ ) ρ | as a function of the order α and find the optimized index. As shown in Figure 1, the circle indicates the minimum when α changes from 0 to 100 with 0.01 as the increment. When taking the optimized order α as 1.79 (α = 1.79), the optimized index can achieve good performance.
Figure 2A shows an example of 19-channel selected EEG data of a child with ASD with a 4-s period after preprocessing. Figure 2D shows an example of 19-channel selected EEG data of a healthy child with a four-second period after preprocessing. To measure and compare the global synchronization of multichannel EEG, we perform the correlation matrix analysis on 19-channel EEG data from subjects with ASD and healthy control subjects, respectively. The correlation matrix results for ASD subjects and healthy control subjects are shown in Figure 2B,E, respectively. Then, their corresponding eigenvalues are computed to show different correlation structures of EEG signals between ASD and healthy controls, and the results are given in Figure 2C,F respectively.
From Figure 2B,E, the correlation matrix reveals increasing synchronization activities in ASD than healthy control. The results shown in Figure 2C,F reveal that the maximal eigenvalues in ASD are higher than those in healthy controls. The maximal eigenvalue of correlation matrix of EEG of ASD group is 9.0376, while the maximal eigenvalue of healthy controls is 6.0938.
The Rényi entropy and Shannon entropy results for all the 160 EEG epochs between ASD and control groups are shown in Figure 3A,B, respectively. In both figures, each box shows the interquartile range containing 50% of values with a line denoting the median. The whiskers presents the overall data range. The averaged Rényi entropy values for the EEG epochs were averaged by 0.5460 ± 0.0571 and 0.4994 ± 0.0580 (mean ± SD) in ASD and Control subjects, respectively. The averaged Shannon entropy values for the EEG epochs were averaged by 0.4135 ± 0.0554 and 0.3710 ± 0.0542 (mean ± SD) in ASD and Control subjects, respectively. According to the statistical analysis, the t-test of Rényi entropy shows that synchronization activities of ASD significantly increases than in healthy control (p = 3.2894 × 10⁻¹²). The t-test of Shannon entropy shows that synchronization activities of ASD significantly increases than in healthy control (p = 2.2836 × 10⁻¹¹). Both of the Rényi entropy and Shannon results reveal increasing synchronization activities in ASD than in healthy control. Moreover, the Rényi entropy possesses high distinguishing degree.

4. Discussion

Atypical functional connectivity features have been considerably investigated as a primary deficit in individuals with ASD. EEG is an appropriate tool because of its high temporal resolution for exploring the deficient dynamics and functional connectivity of neuronal networks in brain disorders. To our best knowledge, this study is the first attempt to employ the S estimator to process multichannel EEG signals for better understanding the changes of global synchronization in ASD.
Results in this study showed that a significant increase of global synchronization in EEG with ASD can be observed. Teipel et al. showed that there was a correlation between alpha EEG coherence and the structural integrity of white matter in the studies for adult [36]. The increases in white matter in individuals with ASD tend to reduce in toddlerhood [37] or later childhood [38], thus finally resulting in predominantly hypo-connectivity between cortical areas in adults with ASD [38].
Results in this study were consistent with Chan et al. [39]. Chan et al. showed that the EEG coherence was statistically elevated during the memory tasks. Moreover, the increased theta coherence was correlated with the lower performance of the memories in ASD.
The study results in [40] suggested that, for adults with ASD, local hyper-connectivity in the frontal area appeared with long-range hypo-connectivity. The abnormal connectivity appeared in in ASD may be due to a primary imbalance between excitation/inhibition (E/I) ratio [41]. Therefore, the hyper-connectivity observed in ASD possibly results from their elevated E/I ratio.
More and more evidence suggests that there are abnormalities in the synchronized oscillatory activity of neurons in ASD. Bagherzadeh et al. employed the cross-approximate entropy to investigate EEG signals synchronization of autism children [42]. They have demonstrated that there is more synchrony in pairs of sensors at alpha band in children with ASD. Some studies have attributed excessive short-range connectivity to increased density of cortical mini-columns [43] and increasing white matter in many regions of the cortex, including frontal, temporal and parietal [44].
In summary, the S estimator approach is employed to describe the changes in global synchronization of multichannel EEG signals of children with ASD in this study. We used an improved version of a cooperation index as S estimator, which is based on Rényi entropy, a generalization version of classic Shannon entropy, and an optimization step to quantitatively measure the global synchronization of multi-channel EEG both in children with ASD and healthy children. According to t-test results on Rényi entropy and Shannon entropy as described above, both Rényi entropy and Shannon entropy in children with ASD are higher than normal development children, and the index Sα could indeed handle multivariate EEG signals for overall integration function of the brain.
In conclusion, our findings in this study described more global synchrony in children with ASD, which confirms that there are abnormalities in brain synchronization. In addition, the proposed method may offer insight into a more mechanistic understanding of autism, and may serve as a potential biomarker for diagnosis and treatment response of ASD.

Acknowledgments

This research was founded in part by the National Key R&D Program (grant No. 2016YFC1306203), National Science Foundation of China (grant Nos. 81571346, 81230023, and 61273063), Beijing Municipal Science & Technology Commission, and Beijing Municipal Commission of Education.

Author Contributions

Xiaoli Li and Gaoxiang Ouyang conceived and designed the experiments; Junxia Han, Yanzhu Li, Jiannan Kang, Erjuan Cai and Zhen Tong performed the experiments; Gaoxiang Ouyang analyzed the data; Junxia Han wrote the manuscript. All authors have read and approved the final manuscript.

Conflicts of Interest

The author declares no conflict of interest.

References

  1. Association, A.P. Diagnostic and Statistical Manual of Mental Disorders, 5th ed.; American Psychiatric Publishing: Arlington, VA, USA, 2013. [Google Scholar]
  2. Braun, C.M.; Daigneault, R.; Gaudelet, S.; Guimond, A. Diagnostic and statistical manual of mental disorders, fourth edition symptoms of mania: Which one(s) result(s) more often from right than left hemisphere lesions? Compr. Psychiatry 2008, 49, 441–459. [Google Scholar] [CrossRef] [PubMed]
  3. Belmonte, M.K.; Allen, G.; Beckel-Mitchener, A.; Boulanger, L.M.; Carper, R.A.; Webb, S.J. Autism and abnormal development of brain connectivity. J. Neurosci. 2004, 24, 9228–9231. [Google Scholar] [CrossRef] [PubMed]
  4. Coben, R.; Clarke, A.R.; Hudspeth, W.; Barry, R.J. EEG power and coherence in autistic spectrum disorder. Clin. Neurophysiol. 2008, 119, 1002–1009. [Google Scholar] [CrossRef] [PubMed]
  5. Rapin, I.; Dunn, M. Update on the language disorders of individuals on the autistic spectrum. Brain Dev. 2003, 25, 166–172. [Google Scholar] [CrossRef]
  6. Willyard, C. New efforts to design better tools to track autism therapy response. Nat. Med. 2016, 22, 570–571. [Google Scholar] [CrossRef] [PubMed]
  7. Jeste, S.S.; Frohlich, J.; Loo, S.K. Electrophysiological biomarkers of diagnosis and outcome in neurodevelopmental disorders. Curr. Opin. Neurol. 2015, 28, 110–116. [Google Scholar] [CrossRef] [PubMed]
  8. Rubenstein, J.L.; Merzenich, M.M. Model of autism: Increased ratio of excitation/inhibition in key neural systems. Genes Brain Behav. 2003, 2, 255–267. [Google Scholar] [CrossRef] [PubMed]
  9. Wang, J.; Barstein, J.; Ethridge, L.E.; Mosconi, M.W.; Takarae, Y.; Sweeney, J.A. Resting state EEG abnormalities in autism spectrum disorders. J. Neurodev. Disord. 2013, 5, 24. [Google Scholar] [CrossRef] [PubMed]
  10. Ghanbari, Y.; Bloy, L.; Christopher Edgar, J.; Blaskey, L.; Verma, R.; Roberts, T.P. Joint analysis of band-specific functional connectivity and signal complexity in autism. J. Autism Dev. Disord. 2015, 45, 444–460. [Google Scholar] [CrossRef] [PubMed]
  11. Murias, M.; Webb, S.J.; Greenson, J.; Dawson, G. Resting state cortical connectivity reflected in EEG coherence in individuals with autism. Biol. Psychiatry 2007, 62, 270–273. [Google Scholar] [CrossRef] [PubMed]
  12. Daoust, A.M.; Limoges, E.; Bolduc, C.; Mottron, L.; Godbout, R. EEG spectral analysis of wakefulness and rem sleep in high functioning autistic spectrum disorders. Clin. Neurophysiol. 2004, 115, 1368–1373. [Google Scholar] [CrossRef] [PubMed]
  13. Buzsaki, G. Large-scale recording of neuronal ensembles. Nat. Neurosci. 2004, 7, 446–451. [Google Scholar] [CrossRef] [PubMed]
  14. Cui, D.; Liu, X.; Wan, Y.; Li, X. Estimation of genuine and random synchronization in multivariate neural series. Neural Netw. 2010, 23, 698–704. [Google Scholar] [CrossRef] [PubMed]
  15. Ouyang, G.; Wang, Y.; Yang, Z.; Li, X. Global synchronization of multichannel EEG in patients with electrical status epilepticus in sleep. Clin. EEG Neurosci. 2015, 46, 357–363. [Google Scholar] [CrossRef] [PubMed]
  16. Bhat, S.; Acharya, U.R.; Dadmehr, N.; Adeli, H. Clinical neurophysiological and automated EEG-based diagnosis of the alzheimer’s disease. Eur. Neurol. 2015, 74, 202–210. [Google Scholar] [CrossRef] [PubMed]
  17. Courchesne, E.; Karns, C.M.; Davis, H.R.; Ziccardi, R.; Carper, R.A.; Tigue, Z.D.; Chisum, H.J.; Moses, P.; Pierce, K.; Lord, C.; et al. Unusual brain growth patterns in early life in patients with autistic disorder: An mri study. Neurology 2001, 57, 245–254. [Google Scholar] [CrossRef] [PubMed]
  18. Hazlett, H.C.; Poe, M.; Gerig, G.; Smith, R.G.; Provenzale, J.; Ross, A.; Gilmore, J.; Piven, J. Magnetic resonance imaging and head circumference study of brain size in autism: Birth through age 2 years. Arch. Gen. Psychiatry 2005, 62, 1366–1376. [Google Scholar] [CrossRef] [PubMed]
  19. Lainhart, J.E.; Bigler, E.D.; Bocian, M.; Coon, H.; Dinh, E.; Dawson, G.; Deutsch, C.K.; Dunn, M.; Estes, A.; Tager-Flusberg, H.; et al. Head circumference and height in autism: A study by the collaborative program of excellence in autism. Am. J. Med. Genet. A 2006, 140, 2257–2274. [Google Scholar] [CrossRef] [PubMed]
  20. Patidar, S.; Pachori, R.B.; Upadhyay, A.; Rajendra Acharya, U. An integrated alcoholic index using tunable-q wavelet transform based features extracted from EEG signals for diagnosis of alcoholism. Appl. Soft Comput. 2017, 50, 71–78. [Google Scholar] [CrossRef]
  21. Zeng, K.; Yan, J.; Wang, Y.; Sik, A.; Ouyang, G.; Li, X. Automatic detection of absence seizures with compressive sensing EEG. Neurocomputing 2016, 171, 497–502. [Google Scholar] [CrossRef]
  22. Pecora, L.M.; Carroll, T.L. Synchronization of chaotic systems. Chaos 2015, 25, 097611. [Google Scholar] [CrossRef] [PubMed]
  23. Xu, J.W.; Bakardjian, H.; Cichocki, A.; Principe, J.C. A new nonlinear similarity measure for multichannel signals. Neural Netw. 2008, 21, 222–231. [Google Scholar] [CrossRef] [PubMed]
  24. Yan, J.; Wang, Y.; Ouyang, G.; Yu, T.; Li, X. Using max entropy ratio of recurrence plot to measure electrocorticogram changes in epilepsy patients. Phys. A Stat. Mech. Its Appl. 2016, 443, 109–116. [Google Scholar] [CrossRef]
  25. Righero, M. A cooperation index based on the rényi entropy of correlation matrix spectrum. Commun. Nonlinear Sci. Numer. Simul. 2012, 17, 2960–2968. [Google Scholar] [CrossRef]
  26. Huang, Y.; Lowe, H.J. A novel hybrid approach to automated negation detection in clinical radiology reports. J. Am. Med. Inform. Assoc. JAMIA 2007, 14, 304–311. [Google Scholar] [CrossRef] [PubMed]
  27. Humeau-Heurtier, A. Multivariate generalized multiscale entropy analysis. Entropy 2016, 18, 411. [Google Scholar] [CrossRef]
  28. McCrimmon, A.W.S.; Amanda, D. Wechsler abbreviated scale of intelligence, 2nd edition (WASI-II). J. Psychoneurotic Assess. 2013, 31, 337–341. [Google Scholar] [CrossRef]
  29. Jamal, W.; Das, S.; Oprescu, I.-A.; Maharatna, K.; Apicella, F.; Sicca, F. Classification of autism spectrum disorder using supervised learning of brain connectivity measures extracted from synchrostates. J. Neural Eng. 2014, 11, 046019. [Google Scholar] [CrossRef] [PubMed]
  30. Durka, P.J.; Klekowicz, H.; Blinowska, K.J.; Szelenberger, W.; Niemcewicz, S. A simple system for detection of EEG artifacts in polysomnographic recordings. IEEE Trans. Bio-Med. Eng. 2003, 50, 526–528. [Google Scholar] [CrossRef] [PubMed]
  31. Carmeli, C.; Knyazeva, M.G.; Innocenti, G.M.; De Feo, O. Assessment of EEG synchronization based on state-space analysis. NeuroImage 2005, 25, 339–354. [Google Scholar] [CrossRef] [PubMed]
  32. Mammone, N.; Duun-Henriksen, J.; Kjaer, T.; Morabito, F. Differentiating interictal and ictal states in childhood absence epilepsy through permutation rényi entropy. Entropy 2015, 17, 4627–4643. [Google Scholar] [CrossRef]
  33. Mammone, N.; Inuso, G.; La Foresta, F.; Versaci, M.; Morabito, F.C. Clustering of entropy topography in epileptic electroencephalography. Neural Comput. Appl. 2011, 20, 825–833. [Google Scholar] [CrossRef]
  34. Apolloni, B.; Bassis, S.; Marinaro, M. New Directions in Neural Networks: 18th Italian Workshop on Neural Networks Wirn 2008—Volume 193 Frontiers in Artificial Intelligence and Applications; IOS Press: Amsterdam, The Netherlands, 2009; p. 270. [Google Scholar]
  35. Apolloni, B. Multiresolution Minimization of Renyi’s Mutual Information for Fetal-ECG Extraction, New Directions in Neural Networks: 18th Italian Workshop on Neural Networks: WIRN 2008; IOS Press: Amsterdam, The Netherlands, 2009; p. 50. [Google Scholar]
  36. Teipel, S.J.; Pogarell, O.; Meindl, T.; Dietrich, O.; Sydykova, D.; Hunklinger, U.; Georgii, B.; Mulert, C.; Reiser, M.F.; Moller, H.J.; et al. Regional networks underlying interhemispheric connectivity: An EEG and dti study in healthy ageing and amnestic mild cognitive impairment. Hum. Brain Mapp. 2009, 30, 2098–2119. [Google Scholar] [CrossRef] [PubMed]
  37. Mak-Fan, K.M.; Morris, D.; Vidal, J.; Anagnostou, E.; Roberts, W.; Taylor, M.J. White matter and development in children with an autism spectrum disorder. Autism Int. J. Res. Pract. 2013, 17, 541–557. [Google Scholar] [CrossRef] [PubMed]
  38. Walker, L.; Gozzi, M.; Lenroot, R.; Thurm, A.; Behseta, B.; Swedo, S.; Pierpaoli, C. Diffusion tensor imaging in young children with autism: Biological effects and potential confounds. Biol. Psychiatry 2012, 72, 1043–1051. [Google Scholar] [CrossRef] [PubMed]
  39. Chan, A.S.; Han, Y.M.Y.; Sze, S.L.; Cheung, M.-C.; Leung, W.W.-M.; Chan, R.C.K.; To, C.Y. Disordered connectivity associated with memory deficits in children with autism spectrum disorders. Res. Autism Spect. Disord. 2011, 5, 237–245. [Google Scholar] [CrossRef]
  40. Vissers, M.E.; Cohen, M.X.; Geurts, H.M. Brain connectivity and high functioning autism: A promising path of research that needs refined models, methodological convergence, and stronger behavioral links. Neurosci. Biobehav. Rev. 2012, 36, 604–625. [Google Scholar] [CrossRef] [PubMed]
  41. Zikopoulos, B.; Barbas, H. Altered neural connectivity in excitatory and inhibitory cortical circuits in autism. Front. Hum. Neurosci. 2013, 7, 609. [Google Scholar] [CrossRef] [PubMed]
  42. Bagherzadeh, S.; Sheikhani, A.; Behnam, H. Evaluation of EEG synchronization in autistic children using cross-sample entropy and cross-approximate entropy. Open Sci. J. Biosci. Bioeng. 2015, 2, 1–9. [Google Scholar]
  43. Carper, R.A.; Moses, P.; Tigue, Z.D.; Courchesne, E. Cerebral lobes in autism: Early hyperplasia and abnormal age effects. NeuroImage 2002, 16, 1038–1051. [Google Scholar] [CrossRef] [PubMed]
  44. Geschwind, D.H.; Levitt, P. Autism spectrum disorders: Developmental disconnection syndromes. Curr. Opin. Neurobiol. 2007, 17, 103–111. [Google Scholar] [CrossRef] [PubMed]
Figure 1. Value of max ρ [ 0 , 1 ] | S α ( ρ ) ρ | as a function of order α for the value of N = 19 (correspond to the number of EEG channels).
Applsci 07 00257 g001
Figure 2. Examples of multichannel electroencephalograph (EEG) analysis. (A) The multichannel EEG epochs; (B) its corresponding correlation matrix based on S estimator and (C) its eigenvalues distribution for autism spectrum disorder (ASD) subject; (D) The multichannel EEG epochs; (E) its correlation matrix based on S estimator and (F) its eigenvalues distribution for controls subject.
Applsci 07 00257 g002
Figure 3. Boxplots for all the 160 EEG epochs with ASD and control subjects using (A) Rényi entropy and (B) Shannon entropy. Each box gives the interquartile range containing 50% of values with a red line denoting the median. The whiskers present the overall range of the considered data.
Applsci 07 00257 g003

