Article

Gear Wear Process Monitoring Using a Sideband Estimator Based on Modulation Signal Bispectrum

1
School of Mechanical Engineering, Taiyuan University of Technology, Taiyuan 030024, China
2
School of Electronic Engineering, Bangor College Changsha, Central South University of Forestry and Technology, Changsha 410004, China
3
Centre for Efficiency and Performance Engineering, University of Huddersfield, Queensgate, Huddersfield HD1 3DH, UK
*
Author to whom correspondence should be addressed.
Appl. Sci. 2017, 7(3), 274; https://doi.org/10.3390/app7030274
Submission received: 6 February 2017 / Revised: 7 March 2017 / Accepted: 8 March 2017 / Published: 10 March 2017

Abstract

:
As one of the most common gear failure modes, tooth wear can produce nonlinear modulation sidebands in the vibration frequency spectrum. However, limited research has been reported in monitoring the gear wear based on vibration due to the lack of tools which can effectively extract the small sidebands. In order to accurately monitor gear wear progression in a timely fashion, this paper presents a gear wear condition monitoring approach based on vibration signal analysis using the modulation signal bispectrum-based sideband estimator (MSB-SE) method. The vibration signals are collected using a run-to-failure test of gearbox under an accelerated test process. MSB analysis was performed on the vibration signals to extract the sideband information. Using a combination of the peak value of MSB-SE and the coherence of MSB-SE, the overall information of gear transmission system can be obtained. Based on the amplitude of MSB-SE peaks, a dimensionless indicator is proposed to assess the effects of gear tooth wear. The results demonstrated that the proposed indicator can be used to accurately and reliably monitor gear tooth wear and evaluate the wear severity.

1. Introduction

Gears are critical mechanical components for power transmission systems and are widely used in automobiles, helicopters, and industrial power trains. Gear wear is a progressive material loss from contacting tooth surfaces, which is an inevitable phenomenon in the service lifetime of gears [1]. When gear wear reaches a certain degree of severity, it can lead to the occurrence of gear failures such as surface pitting, scuffing, and broken teeth. Therefore, the subject of gear wear monitoring and diagnosis is receiving a lot of attention from the field of condition monitoring (CM).
Wear debris analysis is popularly used for gear wear monitoring [1,2]. However, wear particles analysis cannot reveal changes in gear transmission dynamic features in a timely fashion, which can be used to examine if the gears are still working properly. In contrast, the vibro-acoustic signals can reflect the gear dynamic features at the measured instant, thus could be used to assess the effects of wear on gears in real-time.
Acoustic signals in conjunction with modulation signal bispectrum (MSB) signals processing methods have been used to monitor the gear wear process [3]. It was found that the meshing frequency components and the associated shaft modulating components can indicate tooth wear. The acoustic signature is a sequence of pressure waves that propagate through a compressible media; this media is often heavily contaminated by various noises from the surrounding environment and by nearby machines. Therefore, heavy noise content means that fault diagnosis by analysing airborne sound signals is difficult and unreliable, as such great care has to be taken when interpreting the information content [4].
As one of the mainstream techniques of CM, vibration-based methods are relatively easy to implement and to process the results. The influence of wear on gear dynamic features has already been investigated theoretically [5], but was not validated physically. Therefore, measuring the vibration signal for gear wear assessments is presented in this article.
Gear wear will usually result in a deviation from the intended tooth profile and alter the gear meshing excitations [6], which will produce a nonlinear coupling phenomenon that will present small sidebands, a variance of the meshing frequency and shaft rotational frequency; these phenomena are distributed around the meshing frequency and its harmonics. In gear fault diagnosis, the amplitudes of these small sidebands are useful for both detection and diagnosis. As these sidebands are usually influenced by random noise, in order to obtain more accurate results, many signal processing methods have been tried in many of the latest studies. The traditional methods—such as fast Fourier transform, power spectrum and cepstrum analysis [7]—are primarily based on stationary signals, and have difficulty in analysing nonlinear phenomenon and in suppressing noise. Therefore, many researchers have investigated alternative signal analysis methods such as smoothed pseudo-Wigner Ville distribution [8], time synchronous averaging (TSA) [2,9], cyclo-stationary analysis [10], empiric mode decomposition (EMD) [11], ensemble empirical mode decomposition (EEMD) [12], wavelet analysis [13], and combined methods [1] to analyse vibration signals for a more accurate feature extraction. Although these efforts have shown promising results, they may be still lacking because these signal analysis methods possess limited noise reduction capability.
Bispectrum analysis is a useful signal processing tool that has shown significant benefits over traditional spectral analyses due to its unique properties of nonlinear system identification, Gaussian noise elimination, and phase information retention [14,15,16,17,18,19,20,21]. Conventional bispectrum (CB) was applied to vibration signals for the detection of different degrees of tooth breakage of a two-stage helical gearbox and tooth crack [15]. Chen et al. [16] introduced MSB, which is a significant improvement of the CB in that it enhanced CB to apply the modulation signal efficiently. The results showed reliable fault diagnosis and revealed that random noise can be suppressed effectively, being much better than that of the power spectrum (PS) and CB for diagnosing different seeded faults, such as tooth breakage and shaft misalignment [16]. MSB-SE—an extension of MSB analysis—was developed recently, and is used to achieve a simple representation for the complicated signal contents [17], which allows the small sidebands be estimated with a good degree of accuracy and hence produce more accurate and consistent diagnostic results [17,18,19,20]. Inspired by the works presented in [17,19], where MSB was successfully used for identifying both the presence and magnitude of the seeded faults, MSB method would be used to evaluate the natural gear wear monitoring and severity assessment—although it may be more challenging, as the wear process may induce vibration signature changes far weaker than tooth breakages.
To examine the performance and extend the applications of modulation signal bispectrum-based sideband estimator (MSB-SE)-based vibration analysis technique to the monitoring of gearboxes, this paper investigates monitoring the deterioration process of an industrial multi-stage helical gearbox based on vibration measurements and MSB analysis. It applies MSB analysis to vibration signals measured progressively from a run-to-failure experiment to obtain accurate modulation sidebands characteristics, MSB-SE, and its corresponding coherence. A dimensionless indicator is proposed based on the peaks of MSB-SE slices, and its evolutionary behaviour with operating times are obtained, thereby implementing gear wear monitoring and severity evaluation. The paper has four sections. Section 2 presents the theoretical basis of gear wear detection based on the vibration signals analysis using MSB-SE. Section 3 describes the run-to-failure experimental setups for validating the proposed method. Section 4 shows the monitoring results in conjunction with critical interpretations, and finally, Section 5 is the conclusion.

2. Theoretical Basis for Gear Wear Monitoring

2.1. Gear Vibration Signal Model for Tooth Wear

For a healthy gear set, the vibration signal model can be expressed as the summation of a group of amplitude and frequency modulated sinusoidal components [22] shown in Equation (1):
x ( t ) = k = 1 K X k cos ( 2 π k f m t + φ k )
where fm = zfr is the meshing frequency, which is the product of tooth number z and the shaft rotating frequency fr, Xk and φk are the amplitude and phase of the kth meshing harmonic; and k is the order of meshing frequency harmonic.
Gear wear results in changes on the tooth’s working surface. As wear proceeds, the worn surfaces of the gears can be regarded as faults deviating from the perfect gear surfaces. In turn, it will produce amplitude modulation ak(t) and frequency modulation bk(t) (AMFM) effects on gear mesh vibrations [23]. Such modulation is periodic with the shaft rotation frequency, and can be written as [24]:
a k ( t ) = n = 1 N A k n cos ( 2 π n f r t + α k )
b k ( t ) = n = 1 N B k n sin ( 2 π n f r t + β k )
where Akn, Bkn are the amplitudes of the modulation function, and αk and βk are the respective initial phases of the nth modulation component.
Substituting these modulating components into Equation (1), the modulated vibration signal model is given by
x ( t ) = k = 1 K X k [ 1 + a k ( t ) ] cos [ 2 π k f m t + φ k + b k ( t ) ]
Therefore, considering the nonlinear modulation effects with the worn gear rotating frequency nfr as the modulating frequency, and with the corresponding meshing frequency kfm as the signal carrier frequency, a series of sidebands will appear at the frequency locations of kfm ± nfr (k, n = 1, 2, 3, …) in the Fourier spectrum [2,17,22]. From the analysis of vibration spectra, we can detect and locate the worn gear by monitoring the presence of amplitude changes of sidebands at the above mentioned frequency locations.

2.2. Modulation Signal Bispectrum-based Sideband Estimation

In general, these sidebands have small amplitudes and can be easily contaminated by random noise. In addition, there is also significant interference from different components in a multiple stage gear system, which can have high density clusters of sidebands associated with many different meshing components. To suppress noise and extract the fault-related sidebands accurately, MSB method is used in this study. According to the definition of MSB in the frequency domain, for gear vibration signal x(t) with corresponding Fourier transform (FT) X(f), the MSB-SE can be defined in the frequency domain as [17,18,19].
B M S S E ( f r , f m ) = E X ( f m + f r ) X ( f m f r ) X * ( f m ) X * ( f m ) / | X ( f m ) | 2
where X*(fm) is the complex conjugate of X(fm) and E denotes the statistical expectation operator, showing that a statistical average operation is necessary for the MSB-SE estimation process and therefore for achieving effective noise reduction, which is important to accurately estimate the sideband effects for measuring the fault severity.
The magnitude of MSB-SE is a combination of sidebands and normalized carrier components. Therefore, the sideband effect will be quantified without the effect of the meshing frequency amplitude. This means that the magnitude of MSB-SE peaks is determined only by the product of the upper sideband X(fm + fr) and the lower sideband X(fmfr). According to the properties of MSB-SE, if (fm + fr) and (fmfr) are both due to nonlinear effect between fm and fr, a bispectral peak will appear at bifrequency B M S S E (fr, fm).
In order to measure the coupling effects between sidebands and carrier components, MSB-SE coherence (MSB-SEc) can be defined as [20]:
b M S B S E 2 ( f r , f m ) = | B M S S E ( f r , f m ) | 2 E | X ( f m + f r ) X ( f m f r ) | 2
MSB-SEc will be close to 1 if the MSB-SE peak is produced from true modulation effects. On the other hand, a value of near 0 means an absence of interactions between the components. Thus, other values of MSB-SEc will indicate the interaction degree between the coupling components. Therefore, the amplitude of MSB-SEc can be used as an indicator to detect the nonlinear interactions and to measure the reliability of the MSB-SE peak. In this way, the modulation effects in vibration signals can be represented more accurately and reliably.
Furthermore, MSB-SE takes the sidebands distributed in the both sides of the mesh frequency fm into consideration simultaneously; therefore, it is a suitable indicator for monitoring the gear wear condition.
As such, this study will use MSB-SE to accurately extract the sideband characteristics in vibration signals for the purpose of gear wear monitoring and severity detection.

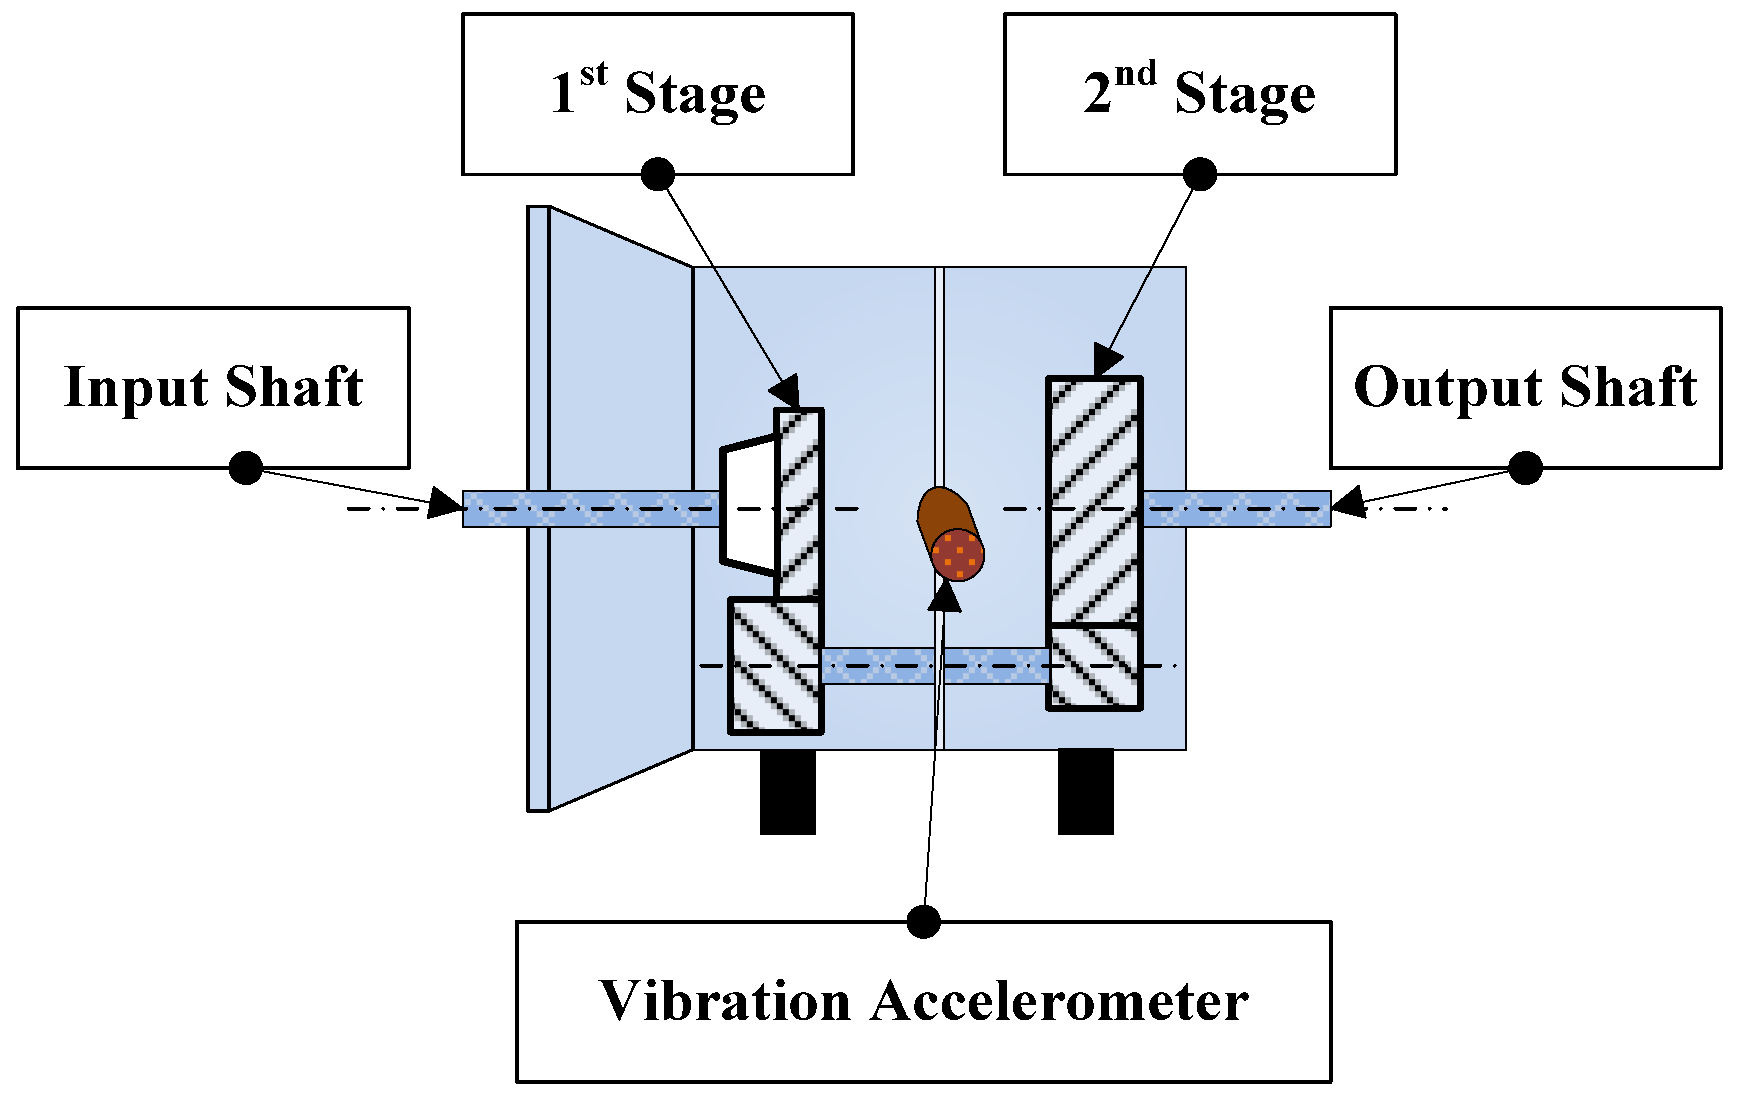
3. Experiment Setup and Procedure

To verify the effectiveness of MSB-SE-based gear wear monitoring, vibration signals were acquired from a two-stage gearbox test system under accelerated test conditions. The gearbox under test is rated at 11 kW at 1470 rpm with splash lubrication. The technical specification of the helical gearbox is given in Table 1. Figure 1 shows the position of the accelerometer mounted on the middle of the outer surface of the gearbox casing, where it is closer to the bearings on the middle shaft. In this way, both stages of the gears can be monitored by one sensor. To accelerate gear failure, the tooth width of the gear on the input shaft at the first stage was halved. This increases local contact stress from 727.8 MPa to 878.7 MPa, and it is still less than the contact fatigue strength limit of gear material 16MnCr5 with surface hardness 59 to 63 HRC, 1450 MPa [25].
In the experiment, the gearbox operated at its full speed under load cycle of five load conditions (0%, 40%, 60%, 80%, and 90% of the full load). In each cycle, the duration for the load of 90% was 34 min, and for other load conditions was four minutes individually. The vibration was measured by a general-purpose accelerometer with a sensitivity of 28.7 mv/(ms−2) and frequency response ranging from 1 Hz to 10 kHz. All the data were logged simultaneously with length of 30 s for each load case at an interval of 50 min by a multiple-channel high-speed data acquisition system with 96 kHz sampling rate and 16-bit resolution.
The test was terminated after 574 h (689 load cycles), due to a significantly growth of the vibration level, which indicated that there was a clear abnormality occurring in the system. The gearbox was then dismantled and inspected. It was found that clear tooth defects were present on the gear teeth surface, as illustrated in Figure 2. It shows that the tooth surface of the driving gear had obvious scuffing marks, as illustrated in Figure 2a,b, in which excessive wear effect is more significant on the tooth flank below the pitch line. Moreover, it also shows that the wear marks in Figure 2b look slightly higher, showing non-uniform wear across the circumference of the gear or unsymmetrical wear due to inevitable eccentricity and run-out errors. These phenomena are typical features caused by the excessive wear under higher contact stress, which are common failures and have been previously observed in many studies [26,27,28,29,30,31,32].

4. Results and Discussion

In order to evaluate the performance of the MSB-SE approach in monitoring gear wear progression, the recorded vibration data were processed using MSB method in which 90 averages were achieved based on the data length and 50% overlap ratio between successive data frame. In addition, a Hanning window was applied to the data frame during the fast Fourier transform to suppress spectral leakages.

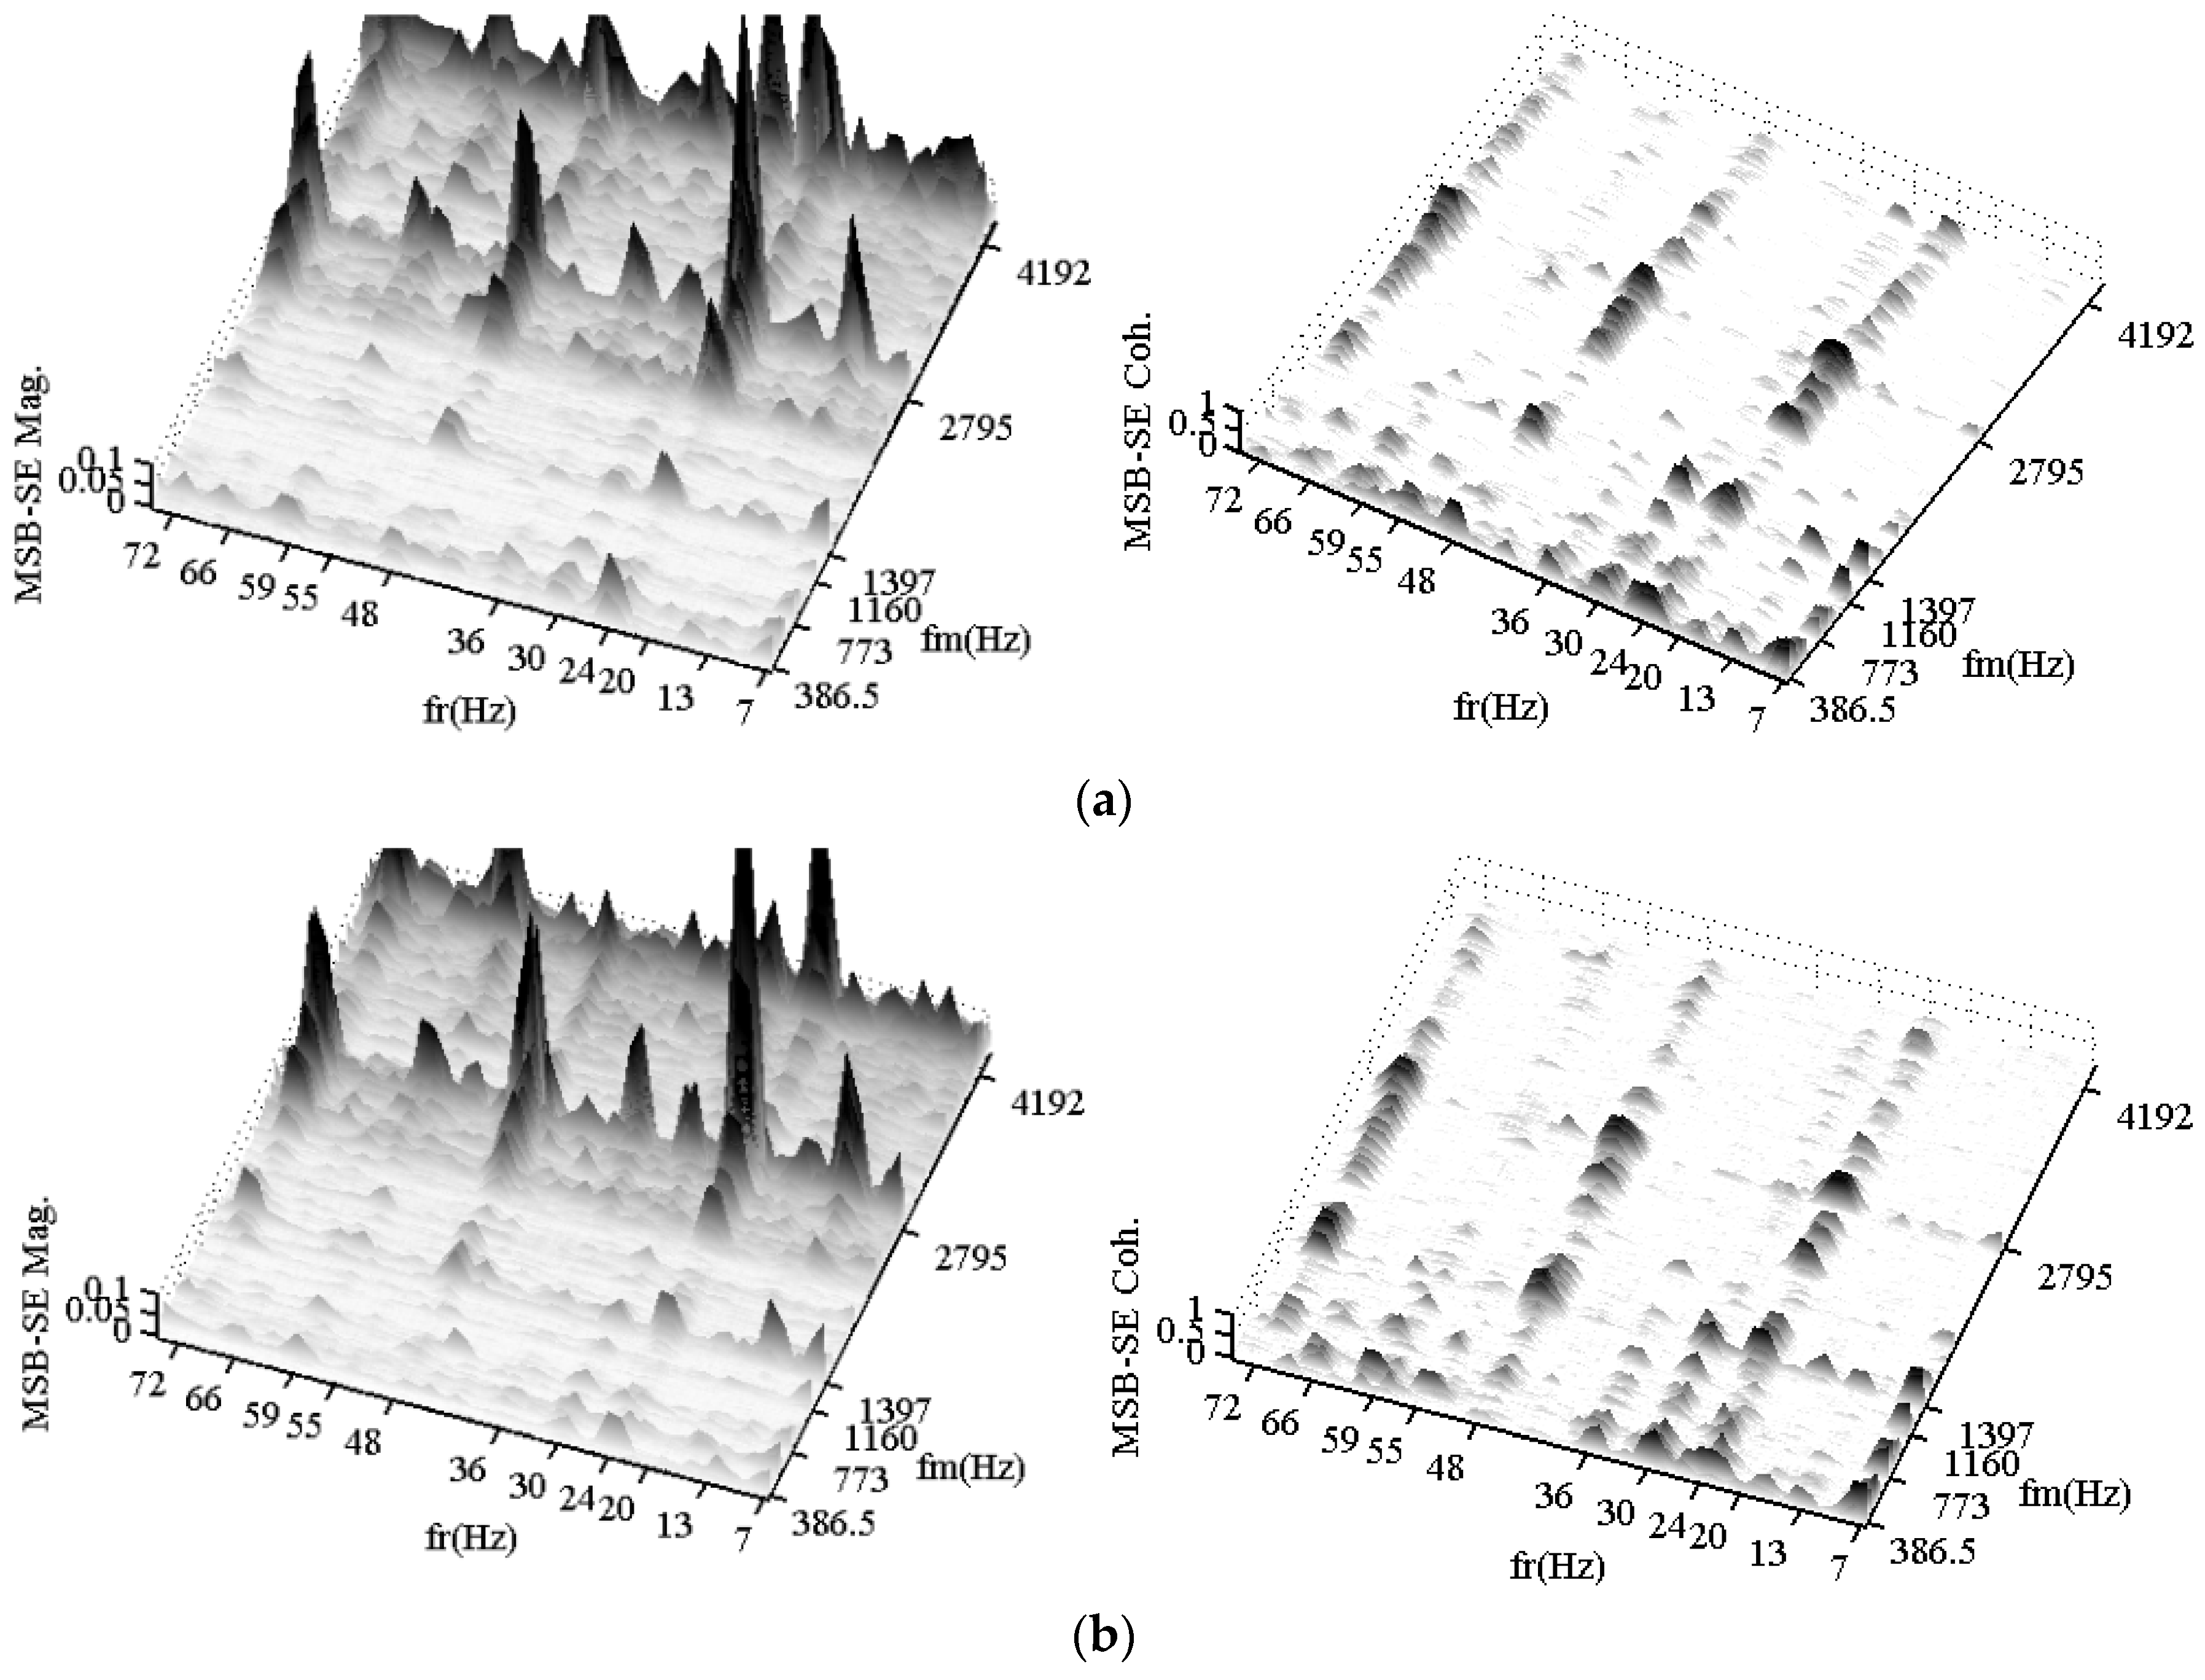
4.1. MSB-SE Characteristics of Gearbox Vibration Signals and Monitoring Indicator

Figure 3 shows typical MSB-SE results at early operating phases—specifically at the fourth hour under higher load cases. The MSB-SE magnitude and its corresponding MSB-SEc results are presented in the region fr < 75 Hz to include the sidebands up to 3fr1 (72 Hz) and fm < 4400 Hz to include the carrier frequency up to 3fr1 (4192 Hz).
In the graphs, the significant peaks at the mesh frequency of 2fr1 (2795 Hz) and 3fr1 can be seen for all load cases. In particular, the MSB-SE peak magnitudes at fr1 (24 Hz) and its harmonics are very dominant. In the meantime, all the bifrequency peaks are supported by MSB-SEc peaks, shown in the second column of Figure 3. In addition, the MSB-SE peaks at fr2 (30 Hz) and fr3 (7 Hz) and their responding harmonics around mesh frequency of 2fr1 and 3fr1 are also visible. However, their MSB-SEc magnitudes do not have significant corresponding peaks, showing lower amplitudes than that of fundamental mesh frequency of fr1 (1397 Hz), to confirm the nonlinear interactions. Therefore, these peaks are from a weaker nonlinear interaction than that between fm1 and fr1 and their harmonics.
In contrast, the MSB-SE coherence slice at mesh frequency of fm2 (386.5 Hz) shows significant peaks at the position of all shaft frequencies and their harmonics, even though their corresponding MSB-SE magnitudes are relatively small. A similar result can be found at the MSB-SEc slice of fm1 (1397 Hz). Moreover, the MSB-SEc of all shaft frequencies and their harmonics at the mesh frequency of 2fm2 (773 Hz) and 3fm2 (1160 Hz) for all load cases are relatively obvious. In general, these bispectral peaks show that MSB-SEc can reveal the nonlinear interaction between the mesh frequencies and shaft frequencies as the modulating components. This is in agreement with the proposed analysis made in Section 2.
In addition to the MSB-SEc peaks at gear shaft rotation frequencies and their harmonics, many other MSB-SEc peaks can be also observed undoubtedly at the MSB-SE spectrum; e.g., MSB-SEc peaks at fr2 + fr3 (36 Hz), 2fr1 + fr3 (55 Hz) and fr1 + fr2 + fr3 (60 Hz). These peaks indicate that the harmonics of the shaft rotation frequencies also cause nonlinear interactions. The reason for these couplings is that the gear wear-induced vibration has two main paths to go from its source to the sensor through the solid mechanical components and their contacts [17]. The first path is from vibration signal origin to the shaft, then to the gearbox casing, and then reaches the sensor. Whereas through the second path, the vibration signal follows a longer path, from its origin to the middle shaft, from the middle shaft going through the second gear pair, the third shaft, after that to the gearbox casing, and finally to the sensor.
These peaks also indicate that MSB-SE slices can provide reliable and sufficient information about the modulation effect of gear transmission. So, the peaks of MSB-SE slices will be used for diagnosis feature development. Only peaks at (nfrx, kfmy) (x = 1, 2, 3; y = 1, 2; n, k are the order of shaft rotation frequency harmonic and the order of meshing frequency harmonic, respectively) will be selected with the gear operating time. Moreover, using MSB-SE slices for wear monitoring will reduce computational work significantly, and hence the method can be implemented in a reliable online real-time diagnostic system.
As already shown, gear wear is an accumulation process; it will cause an ever-increasing change in the tooth surface from its initial state, and thus the gear state will change accordingly and can be reflected by certain gear vibration features [2]. Therefore, based on the MSB-SE slices peaks, the indicator is developed to characterise the dynamics of gear wear and hence to monitor gear vibration changes caused by accumulated gear wear, which is defined to be
R ( f r , f m , i ) = | B M S S E ( f r , f m ) | i | B M S S E ( f r , f m ) | b   ( i = 1 , 2 , , T )
where R(fr, fm, i) is the ratio of MSB-SE amplitude between the selected MSB-SE peaks at the measurement time i and that of baseline. For simplicity, R(fr, fm, i) is denoted as R in this paper.
In general, the larger the value of R, the more severe the resultant effect as gear wear is accumulated. However, as the wear accumulation may not cause the vibration deterioration (especially during the run-in period), it should be noted that R does not mean the volume of material removal from the gear tooth flanks with the wear accumulation. Therefore, if the baseline is relatively good, the trend of R would show the effect of gear wear severity on gear transmission dynamics directly. Furthermore, as R is a dimensionless parameter pertaining to individual gears, it could thus give a more reliable condition description of the individual gears.

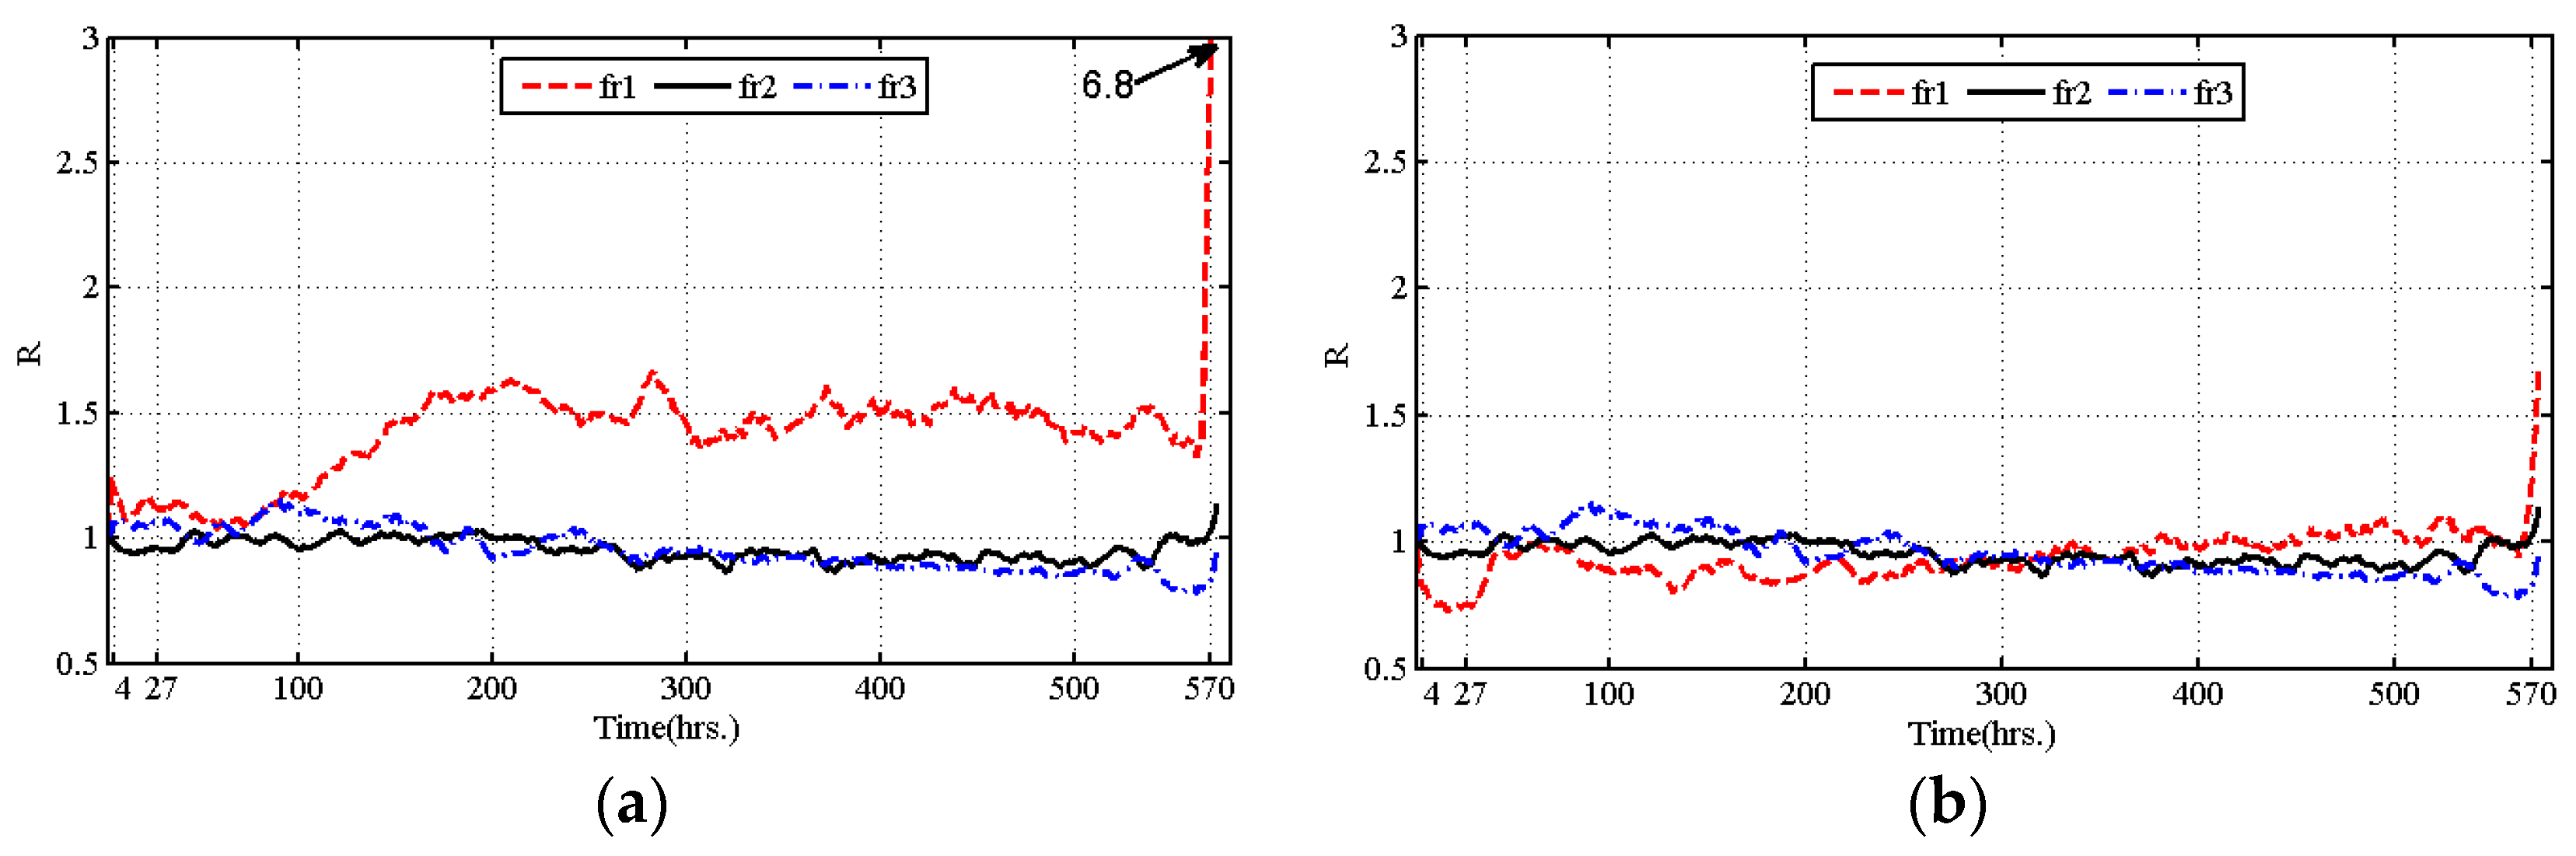
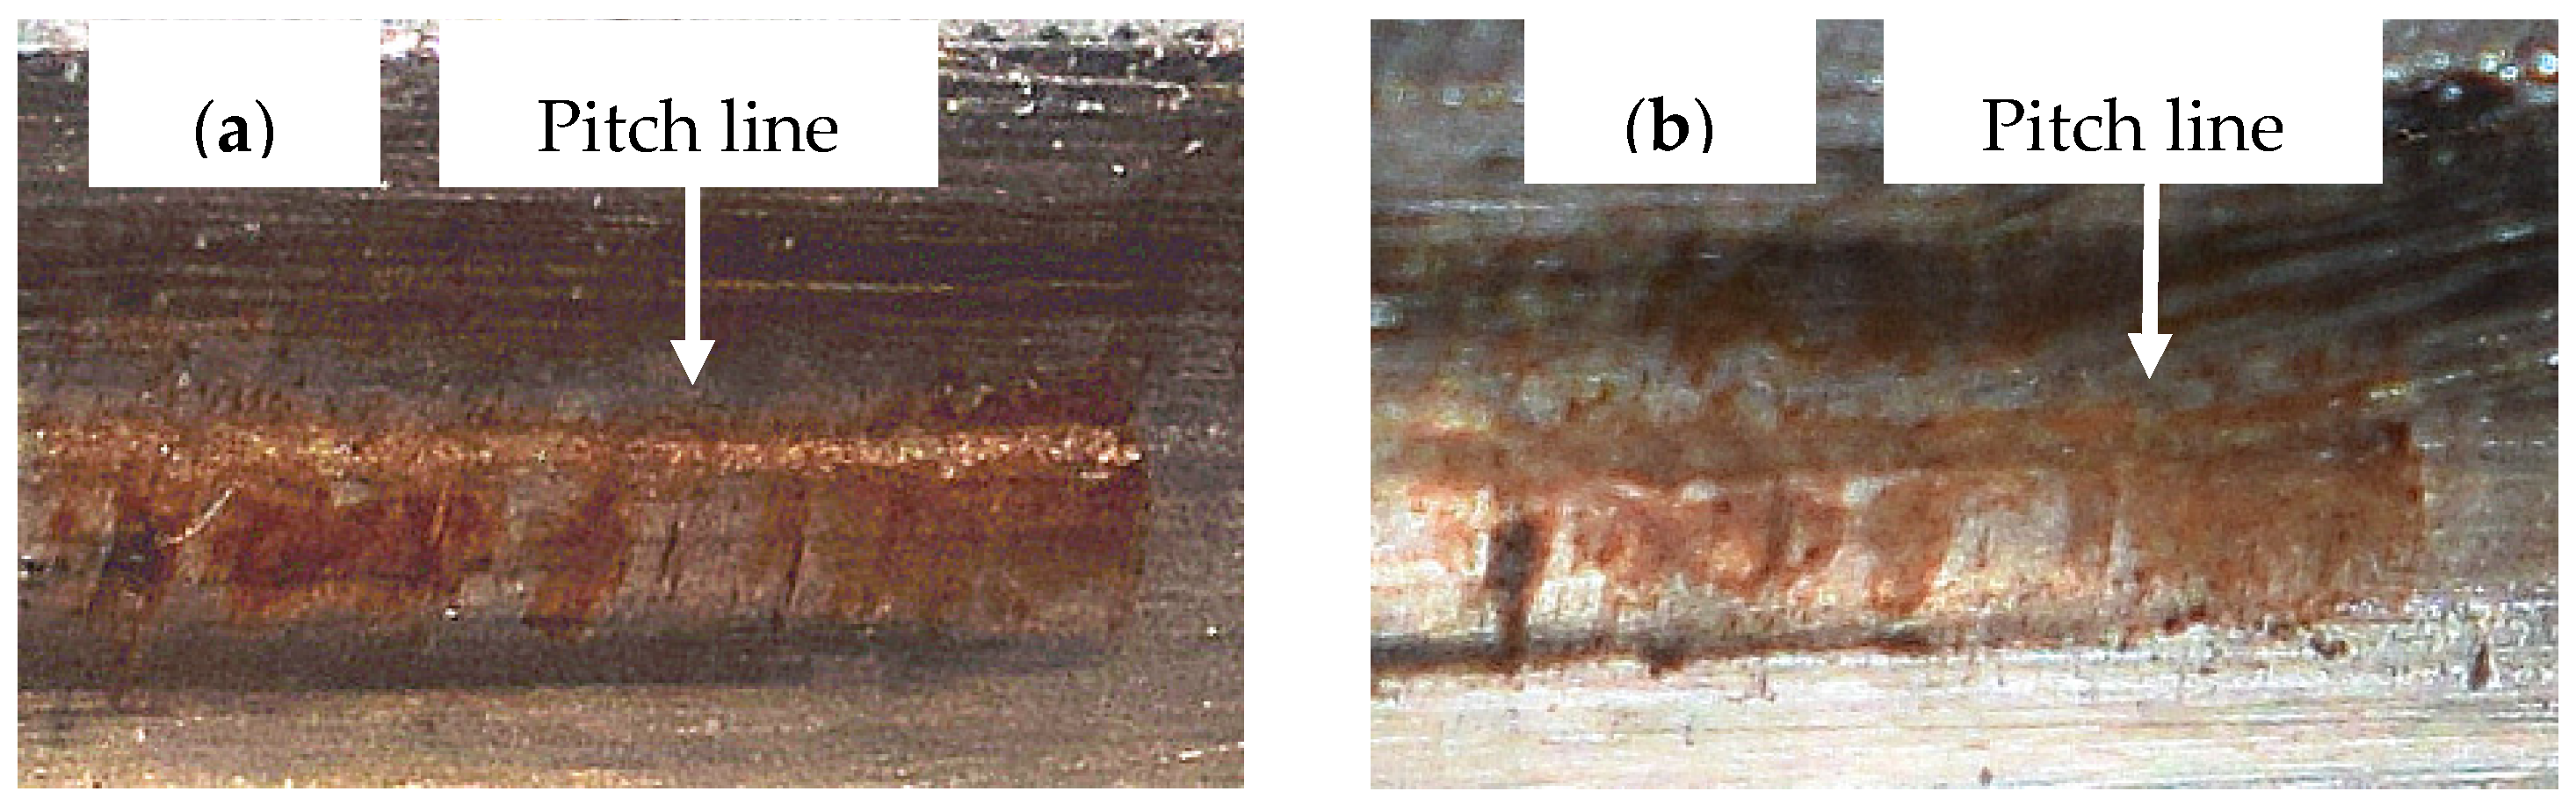
4.2. Gear Wear Monitoring

It can be seen from Figure 4a that the overall trend of the MSB-SE peak at fr1 increases with the operating time, whereas those at fr2 and fr3 remained almost unchanged. This shows that the driving gear of the first stage has experienced more significant wear process than other gears. Meanwhile, the overall trend of MSB-SE coherence peaks at these shaft rotation frequencies stayed almost constant, showing that the values of their corresponding MSB-SE peaks are reliable.
The trends of indicator R are presented in Figure 4. fr1, fr2 and fr3 represent the R value of gear shaft frequency at corresponding meshing frequency, respectively. The vibration signal measured at the beginning of the test is used as the baseline. It can be clearly seen that there are obvious differences in trend of R between fr1, fr2 and fr3.
In Figure 4, fr1 shows an increasing trend in the whole lifetime, whereas fr2 and fr3 stay with a mostly unchanged trend. This shows that the driving gear of the first stage has experienced a more severe wear process than other gears.
In particular, in Figure 4a, the R of fr1 first decreases then increases with wear, reaching its lower level at the 27th h, beyond which fr1 will increase generally with amplitude. It can be observed that fr1 remains at a lower level between the 27th and 100th h, showing that gear wear process is slower and the gear transmission is relatively smoother, which can be viewed as mild wear period because it is usually characterized by slow but steady material removal. From the 100th to 200th h, the fr1 increases slowly, showing that the gear wear is growing during this period. During the testing time between 200th and 570th h, fr1 reaches higher levels and exhibits higher fluctuation, clearly showing that the gear experiences faster wear. From the 570th h up to the test termination (the 574th h), the fr1 increases sharply, showing that severe gear wear is occurring. These changes show that the indicator fr1 can accurately and indicate the wear procedure in a timely fashion.
A similar trend can be observed for fr1 in Figure 4b. Between the 200th and 570th h, the general trend of fr1 exhibits a more clearly monotonic increase than that in Figure 4a. The explanation for this difference is that the driving gear of the first stage would transmit the strong nonlinear signal directly caused by severely worn surface, while the effects of this severe wear would go through torsional vibration, which is relatively linear [33] and increases with the wear deterioration process, to the second stage.
As mentioned before, the effects of wear accumulate over a relatively long period; the tooth surface state will become farther away from the ideal surface with wear, and the sideband will deviate further from its initial value. Although R will show fluctuations when inspecting its variations over a short period of time, the general trend of parameter R is still increasing, indicating an increase of wear severity. Therefore, it would be clearer to show the gear wear process and assess wear severity using the indicator R over a relatively long period of time.
Although fr1 exhibits a clear change trend with significant amplitude changes throughout the test period, both fr2 and fr3 exhibit high fluctuations in the first 100 h, and then fluctuate around a constant level in the following period. This means that these gears experience a long period of slow, steady wear throughout the operation course, reflecting the slow deterioration of gear surface condition. Meanwhile, fr2 is a little bit larger than fr3 after 400 h, showing that the gear of the second shaft is worn more than the gear of the third shaft. These results also confirm that the proposed indicator is reliable and sensitive in detecting and evaluating different wear severity occurring at the identified gear.
Based on the above analysis, it can also be concluded that the MSB-SE in conjunction with the MSB-SEc can reveal more overall information for the gear transmission system. The indicator R developed based on MSB-SE effectively shows the severity of the gear wear, and is sensitive to the changes in the gear wear. It can also be concluded that the tooth wear of the gear on the first shaft is significantly more severe and the other gears are relatively healthy. These findings can be used to achieve a high accuracy in predicting the fault advancement for implementing timely maintenance.
The authors of this paper have tried different methods, such as the popular time synchronous average, wavelet transforms, and different indicators such as amplitude of tooth meshing harmonics, ER and FM4. The similar monitoring results as presented in Reference [2] were obtained, none of these indicators is reliable for gear wear monitoring. The averaged logarithmic ratio (ALR) indicator based on root mean square (RMS) proposed by Hu et al. [2] is successful in gear wear evaluation, and will be examined in further study.

5. Conclusions and Future Work

The vibration signal contains the information of gearbox wear deterioration progression, since tooth wear has significant effects on gear dynamics. The theoretical analysis reveals that MSB-SE can include sideband pairs simultaneously and suppress the random components effectively. The MSB-SE peak will appear at the bifrequencies, which are harmonics of the meshing frequency and multiples of the shaft rotational frequency. This study physically shows that the MSB-SE-based vibration signals are an effective approach to accurately extracting sideband feature signals from complex modulation signals. The peak amplitude of MSB-SE and that of MSB-SE coherence relating to characteristic frequencies can give more accurate information of a gear transmission system when taken together. Based on the MSB-SE peak amplitude, a dimensionless indicator is proposed in this paper to assess the effect of the gear wear process. The results show that the indicator can provide more detailed and realistic information about the stable status of gear wear progression and the fast deterioration of its accumulated effects.
Obviously, further studies should be made to verify the proposed schemes for different wear process based on extensive experiments and theoretical analysis. Particularly, the threshold of the proposed indicator and remaining useful life prediction for gear transmissions still deserve further investigations.

Acknowledgments

The support for this research under the Chinese National Key Technology Research and Development Program (Grant No. 2014BAF08B01) and the National Natural Science Foundation of China (Grant No. 51375326) are gratefully acknowledged. Without their financial support, this work would not have been possible.

Author Contributions

R.Z. improved the algorithm and wrote this paper; X.G. analyzed the data; T.W. and F.G. conceived the experiments and designed the experiments; A.D.B. provided some key ideas and revised the manuscript.

Conflicts of Interest

The authors declare no conflict of interest.

References

  1. Choy, F.K.; Polyshchuk, V.; Zakrajsek, J.J. Analysis of the effects of surface pitting and wear on the vibration of a gear transmission system. Tribol. Int. 1996, 29, 77–83. [Google Scholar] [CrossRef]
  2. Hu, C.; Smith, W.A.; Randall, R.B. Development of a gear vibration indicator and its application in gear wear monitoring. Mech. Syst. Signal Process. 2016, 76, 319–336. [Google Scholar] [CrossRef]
  3. Anwar, A.; Zhen, D.; Gu, F.; Ball, A.D. Gear wear process monitoring using acoustic signals. In Proceedings of the 21st International Congress on Sound and Vibration, Beijing, China, 13–17 July 2014.
  4. Gu, F.; Li, W.; Ball, A.D.; Leung, A.Y.T. The Condition Monitoring of Diesel Engines Using Acoustic Measurements Part 1: Acoustic Characteristics of the Engine and Representation of the Acoustic Signals; SAE Technical Paper; SAE International: Warrendale, PA, USA, 2000. [Google Scholar]
  5. Ding, H.; Kahraman, A. Interactions between nonlinear spur gear dynamics and surface wear. J. Sound Vib. 2007, 307, 662–679. [Google Scholar] [CrossRef]
  6. Liu, X.; Yang, Y.; Zhang, J. Investigation on coupling effects between surface wear and dynamics in a spur gear system. Tribol. Int. 2016, 101, 383–394. [Google Scholar] [CrossRef]
  7. Ziaran, S.; Darula, R. Determination of the state of wear of high contact ratio gear sets by means of spectrum and cepstrum analysis. J. Vib. Acoust. 2013, 135, 021008. [Google Scholar] [CrossRef]
  8. Baydar, N.; Ball, A.D. A comparative study of acoustic and vibration signals in detection of gear failures using Wigner–Ville distribution. Mech. Syst. Signal Process. 2001, 15, 1091–1107. [Google Scholar] [CrossRef]
  9. Sawalhi, N.; Randall, R.B.; Forrester, D. Separation and enhancement of gear and bearing signals for the diagnosis of wind turbine transmission systems. Wind Energy 2013, 17, 729–743. [Google Scholar] [CrossRef]
  10. Zimroz, R.; Bartelmus, W. Gearbox condition estimation using cyclostationary properties of vibration signal. Key Eng. Mater. 2009, 413, 471–478. [Google Scholar] [CrossRef]
  11. Liu, B.; Riemenschneider, S.; Xu, Y. Gearbox fault diagnosis using empirical mode decomposition and Hilbert spectrum. Mech. Syst. Signal Process. 2006, 20, 718–734. [Google Scholar] [CrossRef]
  12. Amarnath, M.; Krishna, I.R.P. Detection and diagnosis of surface wear failure in a spur geared system using EEMD based vibration signal analysis. Tribol. Int. 2013, 61, 224–234. [Google Scholar] [CrossRef]
  13. Rafiee, J.; Rafiee, M.A.; Tse, P.W. Application of mother wavelet functions for automatic gear and bearing fault diagnosis. Expert Syst. Appl. 2010, 37, 4568–4579. [Google Scholar] [CrossRef]
  14. Jiang, L.; Liu, Y.; Li, X. Using bispectral distribution as a feature for rotating machinery fault diagnosis. Measurement 2011, 44, 1284–1292. [Google Scholar] [CrossRef]
  15. Cai, J.; Li, X. Gear Fault Diagnosis Based on Empirical Mode Decomposition and 1.5 Dimension Spectrum. Shock Vib. 2016, 1–10. [Google Scholar] [CrossRef]
  16. Chen, Z.; Wang, T.; Gu, F. Gear Transmission Fault Diagnosis Based on the Bispectrum Analysis of Induction Motor Current Signatures. J. Mech. Eng. 2012, 48, 84–90. [Google Scholar] [CrossRef]
  17. Tian, X.; Abdallaa, G.M.; Rehab, I. Diagnosis of combination faults in a planetary gearbox using a modulation signal bispectrum based sideband estimator. In Proceedings of the 21st International Conference on Automation & Computing, University of Strathclyde, Glasgow, UK, 11–12 September 2015.
  18. Gu, F.; Abdalla, G.; Zhang, R.; Xu, H.; Ball, A.D. A Novel Method for the Fault Diagnosis of a Planetary Gearbox based on Residual Sidebands from Modulation Signal Bispectrum Analysis. In Proceedings of the 27th International Congress of Condition Monitoring and Diagnostic Engineering, Brisbane, Australia, 16–18 September 2014.
  19. Gu, F.; Shao, Y.; Hu, N.; Naid, A.; Ball, A.D. Electrical motor current signal analysis using a modified bispectrum for fault diagnosis of downstream mechanical equipment. Mech. Syst. Signal Process. 2011, 25, 360–372. [Google Scholar] [CrossRef]
  20. Gu, F.; Wang, T.; Alwodai, A.; Tian, X.; Shao, Y.; Ball, A.D. A new method of accurate broken rotor bar diagnosis based on modulation signal bispectrum analysis of motor current signals. Mech. Syst. Signal Process. 2015, 50, 400–413. [Google Scholar] [CrossRef]
  21. Howard, I.M. Higher-order spectral techniques for machine vibration condition monitoring. Proc. Inst. Mech. Eng. G 1997, 211, 211–219. [Google Scholar] [CrossRef]
  22. Li, Y.; Ding, K.; He, G. Vibration mechanisms of spur gear pair in healthy and fault states. Mech. Syst. Signal Process. 2016, 81, 183–201. [Google Scholar] [CrossRef]
  23. Feng, Z.; Zuo, M. Fault diagnosis of planetary gearboxes via torsional vibration signal analysis. Mech. Syst. Signal Process. 2013, 36, 401–421. [Google Scholar] [CrossRef]
  24. Shen, G.; McLaughlin, S.; Xu, Y. Theoretical and experimental analysis of bispectrum of vibration signals for fault diagnosis of gears. Mech. Syst. Signal Process. 2014, 43, 76–89. [Google Scholar]
  25. International Organization for Standardization. Calculation of Load Capacity of Spur and Helical Gears—Application for Industrial Gear. ISO: Geneva, Switzerland, 2002. [Google Scholar]
  26. Powrie, H.E.G.; Fisher, C.E.; Tasbaz, O.D.; Wood, R.J.K. Performance of an electrostatic oil monitoring system during an FZG gear scuffing test. In Proceedings of the International Conference on Condition Monitoring, University of Wales, Swansea, UK, 12–15 April 1999; pp. 145–155.
  27. Proctor, M.P.; Oswald, F.B.; Krants, T.L. Shuttle Rudder/Speed Brake Power Drive Unit (pdu) Gear Scuffing Tests with Flight Gears; Technical Report NASA/TM-2005-214092; Glenn Research Center: Cleveland, OH, USA, 2005.
  28. Castro, J.; Seabra, J. Global and local analysis of gear scuffing tests using a mixed film lubrication model. Tribol. Int. 2008, 41, 244–255. [Google Scholar] [CrossRef]
  29. Klein, M.A. An Experimental Investigation of Materials and Surface Treatments on Gear Contact Fatigue Life. Master’s Thesis, The Ohio State University, Columbus, OH, USA, 2009. [Google Scholar]
  30. Xue, J.; Li, W.; Qin, C. The scuffing load capacity of involute spur gear systems based on dynamic loads and transient thermal elastohydrodynamic lubrication. Tribol. Int. 2014, 79, 74–83. [Google Scholar] [CrossRef]
  31. Ganti, V.; Dewangan, Y.; Arvariya, S.; Madhavan, S. Influence of Micro-Geometry on Gear Scuffing; SAE Technical Paper 2015-26-0187; SAE International: Warrendale, PA, USA, 2015. [Google Scholar]
  32. Zhang, J.; Li, W.; Wang, H. A comparison of the effects of traditional shot peening and micro-shot peening on the scuffing resistance of carburized and quenched gear steel. Wear 2016, 368–369, 253–257. [Google Scholar] [CrossRef]
  33. Vinayak, H.; Singh, R.; Padmanabhan, C. Linear dynamic analysis of multi-mesh transmissions containing external rigid gears. J. Sound Vib. 1995, 185, 1–32. [Google Scholar] [CrossRef]
Figure 1. Schematic diagram of two-stage gearbox.
Applsci 07 00274 g001
Figure 2. Scuffing on gear tooth surfaces of the tested gear. (a) Scuffing marks on one tooth surface; (b) Scuffing markers on the other tooth surface.
Applsci 07 00274 g002
Figure 3. Modulation signal bispectrum-based sideband estimator (MSB-SE) magnitude and its coherence spectrum of different meshing frequency at the fourth hour under different loads. (a) MSB-SE spectrum at Load = 80%; (b) MSB-SE spectrum at Load = 90%.
Applsci 07 00274 g003
Figure 4. The monitoring trends of R. (a) trend of R(frx, fm1, i); (b) trend of R(frx, fm2, i).
Applsci 07 00274 g004
Table 1. Specification of two-stage helical gearbox.
Gear Parameters1st Stage2nd Stage
Number of teeth58/4713/59
Meshing frequency (Hz)fm1 = 1421fm2 = 393.04
Shaft frequency (Hz)fr1 = 24.5, fr2 = 30.23, fr3 = 6.66

