Article

Experimental Investigation of a Base Isolation System Incorporating MR Dampers with the High-Order Single Step Control Algorithm

1
School of Civil Engineering, Qingdao University of Technology, Qingdao 266033, China
2
School of Civil Engineering, Heilongjiang University, Harbin 150080, China
3
Centre for Infrastructure Engineering, Western Sydney University, Penrith NSW 2751, Australia
4
School of Civil Engineering, Shenyang Jianzhu University, Shenyang 110168, China
*
Author to whom correspondence should be addressed.
Appl. Sci. 2017, 7(4), 344; https://doi.org/10.3390/app7040344
Submission received: 19 December 2016 / Revised: 7 March 2017 / Accepted: 25 March 2017 / Published: 30 March 2017

Abstract

:
The conventional isolation structure with rubber bearings exhibits large deformation characteristics when subjected to infrequent earthquakes, which may lead to failure of the isolation layer. Although passive dampers can be used to reduce the layer displacement, the layer deformation and superstructure acceleration responses will increase in cases of fortification earthquakes or frequently occurring earthquakes. In addition to secondary damages and loss of life, such excessive displacement results in damages to the facilities in the structure. In order to overcome these shortcomings, this paper presents a structural vibration control system where the base isolation system is composed of rubber bearings with magnetorheological (MR) damper and are regulated using the innovative control strategy. The high-order single-step algorithm with continuity and switch control strategies are applied to the control system. Shaking table test results under various earthquake conditions indicate that the proposed isolation method, compared with passive isolation technique, can effectively suppress earthquake responses for acceleration of superstructure and deformation within the isolation layer. As a result, this structural control method exhibits excellent performance, such as fast computation, generic real-time control, acceleration reduction and high seismic energy dissipation etc. The relative merits of the continuity and switch control strategies are also compared and discussed.

1. Introduction

The conventional base isolation method with rubber bearing is fundamentally a damping technology. It has the advantages of obvious damping effect, safety, reliability and low cost, and hence has been widely used in a number of low-rise buildings [1,2,3]. However, the isolation structure with the rubber bearings will normally have a large isolation layer deformation during rare earthquakes. In order to control the displacement of the isolation layer, more isolation bearings are generally embedded into the isolation layer system. After adding some stiffness and damping for the isolation layer, the acceleration of the superstructure and the displacement of the layer may be enlarged, sometimes even in low-level earthquakes [4,5]. This excessive acceleration will cause equipment damage in certain buildings, such as hospitals, communication centers, government buildings, etc. Moreover, articles falling in the building may cause secondary damages [6]. The need for security protection for the overall structure to mitigate such damages has led to the development of novel isolation technologies [7,8,9]. The mitigation of secondary damages is one of the design objectives in the present study.
Magnetorheological (MR) damper is a variable damping controller with excellent performance, which has been demonstrated by many research cases either experimentally or practically. It has the characteristics of a damping force in wide range, rapid response and requires little energy input. It has been widely used in hybrid or semi-active controlled structures [10,11,12,13]. In broader applications, MRD has been applied in protecting civil infrastructure systems against severe earthquake and wind loading [14], in semi-active seat suspension systems and in payload launch vibration isolation of a spacecraft [15,16]. Bharti et al. proposed a coupled building control scheme interconnecting the inline floors of two closely spaced adjacent buildings with semi-active Magnetorheological (MR) dampers [17]. It was noted that the control scheme is quite effective in response mitigation of both the buildings under a wide range of ground motions [18]. The efficacy of this smart system in reducing structural responses for a wide range of loading conditions was demonstrated in a series of experiments [19]. Amongst various control devices, seismic base isolation has proved to be a time tested method and semi-active MR dampers have also emerged as a very attractive proposition for a control device [20]. Maddaloni found that when the semi-active control is suitably designed and implemented, the seismic performance of the structure can be significantly improved [21]. A series of large scale experimental tests was conducted on a mass equipped with a seismic base isolation system that consists of high-damping rubber bearings and an MR damper [22,23]. Researchers have been exploring various approaches of seismic hazard mitigation of closely spaced adjacent buildings, by way of employing various control devices [24].
This study will focus on the base isolation control system using MR damper and rubber bearings with the high-order single-step algorithm (HSA) [25]. HSA is known to be well-suited for real-time control applications due to its excellent capability in high-speed computation and fast convergence. The new structural vibration control involves the use of two control strategies, namely, continuity and switch control. In this paper, both the numerical simulation and experimental test were subjected to seismic waves with different characteristics and intensities. The research work establishes a theoretical and experimental basis for the novel isolation system applications.

2. Magnetorheological Smart Isolation System
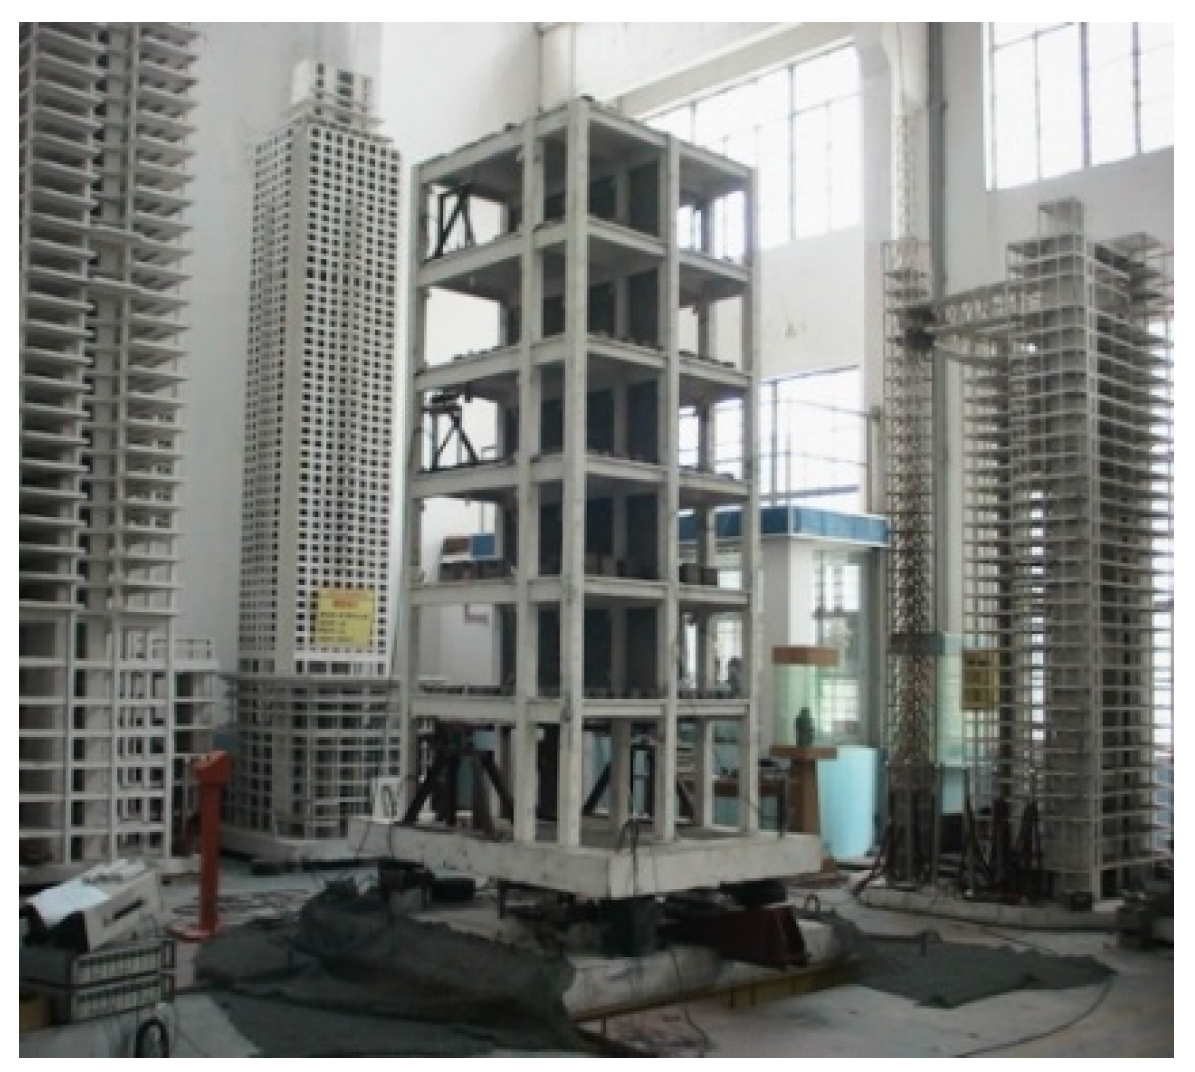
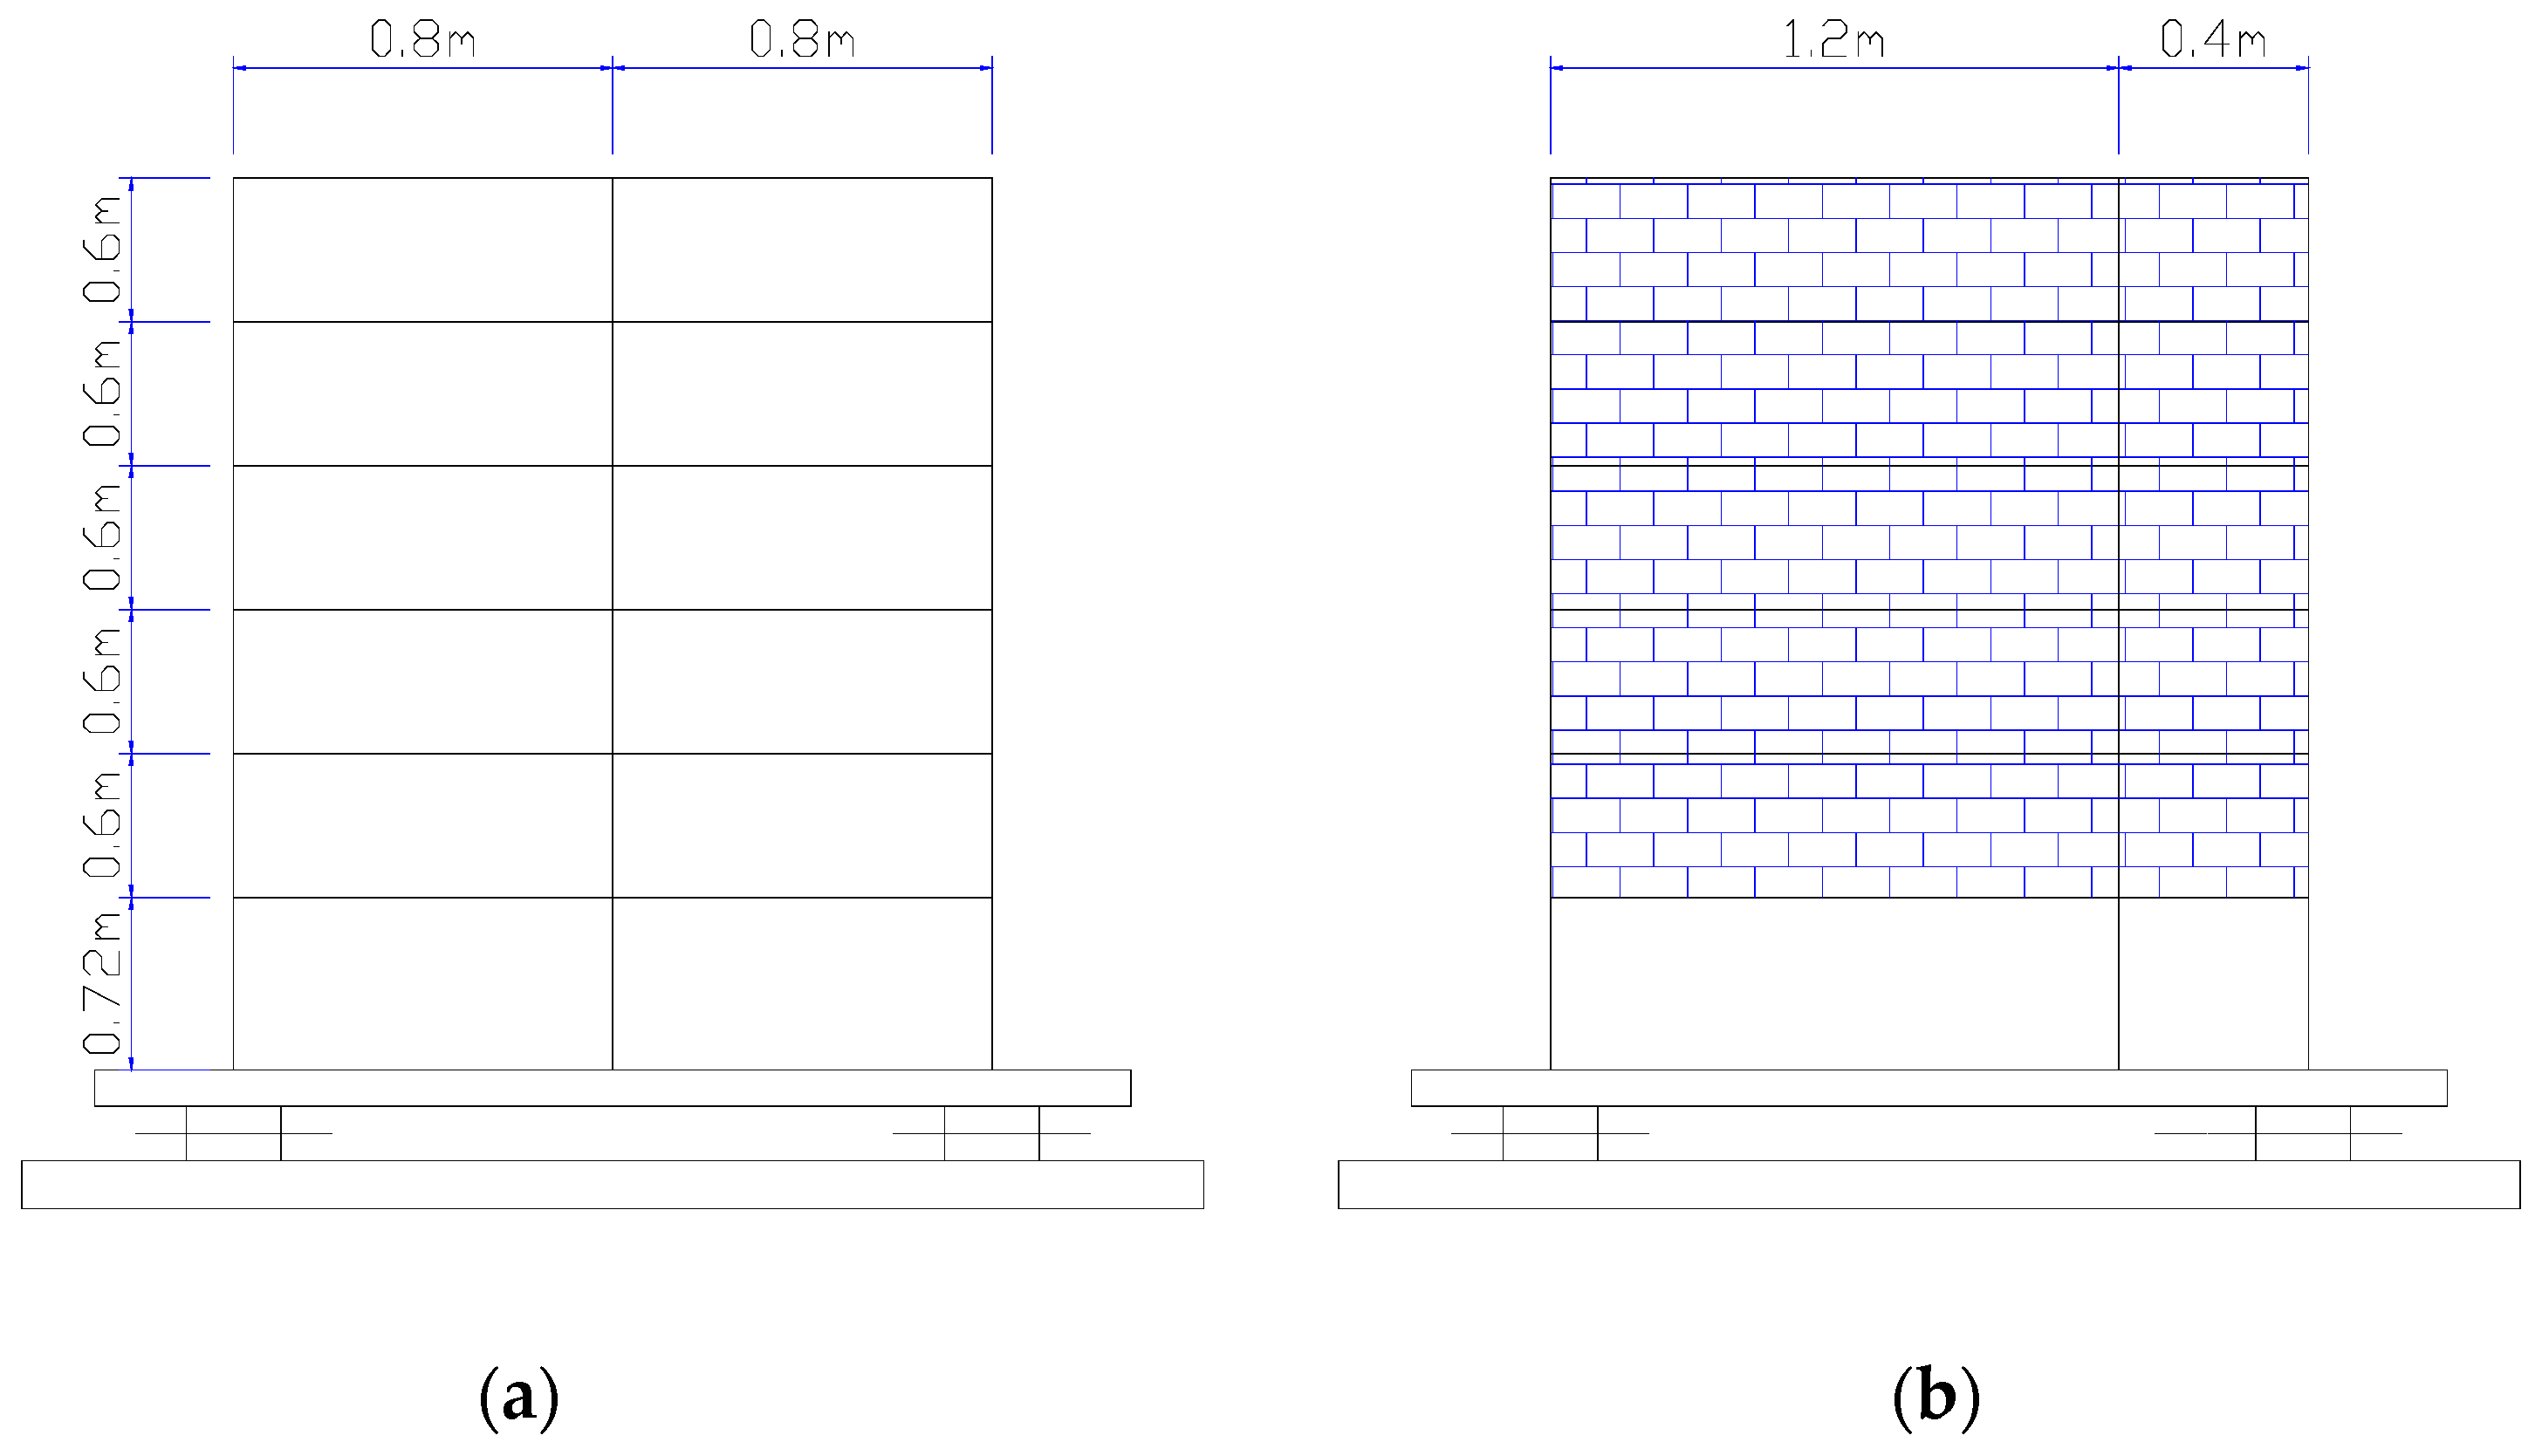
The base isolation system is composed of MR dampers, ordinary rubber bearings, real-time data acquisition, signal processing, control determination and actuation parts, etc., as shown in Figure 1. The rubber bearings are capable of providing restoring forces. The MR dampers can provide variable and controllable damping forces to the model structure by controlling the excitation voltages to the damper coils. The damping force of the damper in every moment is obtained by optimal control algorithm calculation and control rate adjustment. The control calculation uses real-time feedback data including displacement, velocity and acceleration response of the structure (Figure 1). The adjustment of the control approach for the control force should consider whether the damper is able to provide a damping control force in principle, although in rare cases the opposite situation could apply. This ensures that the damping force provided by the isolation device to the isolation layer is optimal and can be realized at every single temporal moment.

2.1. Test Model

The test model is a six storey frame structure with three frames and two spans. The prototype structure is designed using PKPM software. PKPM software is developed by the China Academy of Building Research (Beijing, China), and can be used for the design and calculation of the frame structure. The geometric ratio is 1:5. In the model, the cross section area of column is 90 mm × 90 mm, the cross section area of the main beam is 120 mm × 60 mm, and cross section size of secondary beam is 80 mm × 60 mm. The thickness of each floor is 30 mm. Figure 2 shows the photo of the model structure. Figure 3 shows the structure’s model dimension.
In the model structure, the beam column is made of C30 concrete material, and the slab is made of C20 concrete material, which is the same as the prototype structure. The concrete cube compressive strength standard value is equal to 30 in terms of the scale of concrete material; its strength grade is expressed as C30. C20 also has the same definition. The reinforcement including diameter, length, and number of roots of the model structure is obtained by the conversion of the actual structure according to the geometric ratio of 1:5.
Table 1 shows a similar coefficient of the model. According to the similarity coefficient, the model was made and the whole experiment was finished.
The two bottom plates in the model structure had a weight of about 3.75 × 10³ kg while the empty frame model had a weight of about 2.25 × 10³ kg. Since the actual structure weight was 281.55 × 10³ kg, the structure model needed to have an additional weight of approximately 4 tons according to the relationship of similarity ratio configuration. The additional weight was assigned evenly into six storeys, thus each storey weighed about 0.7 × 10³ kg. In order to adjust the dynamics of the model structure close to the actual structure, the concrete block wall was built from the second to the sixth storey of the model, while the bottom layer retained a larger space.

2.2. Control Algorithm and Strategy

The HSA method is a structural dynamic time history analysis method, which has the characteristics of high accuracy and simple calculation consumption. In real-time control scenarios, the issue of time delay is often encountered. When the system uses only one step in time delay, the control force produced by the HSA method will have minimum time delay. When the delay time is equal to the multiple (e.g., N) integral steps, the method can estimate the state vector of the (N−1)th step, then generate the optimal control force of the Nth time step for the structure by state vector calculation.
The formula for the structure dynamic response can be expressed by the following HSA method:
x n + 1 = G 11 x n + G 12 x ˙ n Q 12 x ¨ n + R 12 ( 1 x ¨ g , n + 1 M 1 B U n + 1 ) x ˙ n + 1 = G 12 x n + G 22 x ˙ n Q 22 x ¨ n + R 22 ( 1 x ¨ g , n + 1 M 1 B U n + 1 ) x ¨ n + 1 = 1 x ¨ g , n + 1 + M 1 ( B U n + 1 C x ˙ n + 1 K x n + 1 ) }
The performance index function is defined as follows:
J = 1 2 x T W 1 K x + 1 2 x ˙ T W 2 M x ˙ + 1 2 ( B U ) T K 1 B U
where W1 and W2 are the weight parameters of adjustment control effect for the displacement and velocity response of the isolation layer, where I is the identity matrix. The specific parameter values can be determined by simulation calculation. Detailed calculation procedure is given in the literature [26].
By setting δ J n + 1 = 0 , yields
B U n + 1 = D 1 x n + D 2 x ˙ n D 3 x ¨ n + D 4 I x ¨ g , n + 1
In order to realize the closed-loop control, by giving up D I x ¨ g , n + 1 , so each δ J n + 1 is no longer zero. This is only an approximate optimization:
B U n + 1 = D 1 x n + D 2 x ˙ n D 3 x ¨ n
where D1, D2 and D3 are all constant matrices, and U is the optimal control force vector for each single time step. The constant matrix B indicates the location or configuration of the dampers within the structure [16].
u ( i ) = { u max if f o p t × x ˙ b < 0 u min if f o p t × x ˙ b 0
For an MR control system with variable damping, the control strategy is usually divided into two types. One is similar to the switch control mode. The voltage regulation for the MR damper is either maximum or minimum in temporal series. The other is the continuity control mode, which considers the characteristics with continuously adjustable damping force of the MR damper. The control strategy is used to regulate the optimal control force in real-time [27,28,29].
u ( i ) = { u max if f o p t × x ˙ b < 0   and | f o p t | > | u max | f o p t if f o p t × x ˙ b < 0   and | u max | | f o p t | > | u min | u min if f o p t × x ˙ b < 0   and | f o p t | | u min | u min if f o p t × x ˙ b > 0
where umax and umin are the maximum and minimum damping forces which can be provided by the MR damper subject to velocity variations; x ˙ b is the relative velocity of the isolation layer, and fopt is the calculated optimal control force, whereas u is the adjusted damping force realized by the damper, which can be achieved by controlling the output current regulator.

2.3. Isolation Bearing

For this experiment, four ordinary rubber sandwich isolation pads were fabricated. They were placed on the four corners of the model structure. The isolation bearing diameter used in the experiment is 100 mm and the total thickness of the rubber layer is 22.5 mm. Other basic parameters for the rubber bearings have been shown in Table 2.
In order to test the actual performance of the rubber pad, the test of 100% horizontal shear deformation for the rubber bearings was performed. The pressure shear test for the rubber bearing was carried out under the compressive stress level of 10 MPa, while the horizontal shear deformations were 50% and 100%, respectively. The test setup is shown in Figure 4.
Vertical stress check: The upper structure was approximately 10 tons. The calculated compressive stress for each bearing was around 3.2 MPa. This met the allowable stress limit of 10 MPa.
Horizontal deformation check: for the second category site within the eighth degree zone (rare earthquakes), calculation values for the equivalent load (kN) was:
F e k = α × G e q = 0.3471 × 0.85 × 100 = 31.8
Maximum deformation of the isolation layer in mm was:
D m = F e k / K d = 31.8 / 1112 = 28.6
For the fourth category site within the eighth degree zone (rare earthquakes), the calculated value for the equivalent load (kN) was:
F e k = α × G e q = 0.507 × 0.85 × 100 = 43.08
In the above formula Fek is the standard value of total horizontal seismic force; α is the seismic influence coefficient; Geq is the equivalent Total Gravity Load.
Maximum deformation of the isolation layer in mm was:
D m = 43.08 / 1112 = 38.7
According to the seismic code, horizontal deformation of the rubber bearing was:
min ( 0.55   ×   D = 55   mm   |   3   ×   T r = 67.5   mm )
In the above formula Tr is total thickness of rubber layer; D is the diameter of rubber bearing.
Therefore, the allowable deformation of the bearing was 55 mm. The structure of the base isolation bearing was used to satisfy the deformation constraints for the second category site condition; however, for the fourth category site condition, the maximum deformation of the rubber bearing was noticeably too large, having exceeded the deformation limit value of 1.5 times the rubber layer thickness. The experimental results also prove that the rubber pad is not stable and an additional damper must be used to control the significant deformation requirement.

2.4. MR Damper

The maximum output of the MR damper in the experiment was 20 kN. The minimum output was 2.5 kN. The adjustable damping force ratio was 8. The stroke range of the damper was ±80 mm. The working excitation current was 0–4 A. Numerical simulation results indicated that the required maximum output was 1 × 10³ kg for the selected test model. The maximum deformation of the isolation layer was less than 60 mm. Selection of the larger output and stroke damper was to meet the needs of other test models, but also left a certain degree of security and safety for further test verifications.
Prior to the shaking table test, the performance test for the damper was carried out. The test results are shown in Figure 5 and Figure 6. Those are hysteresis curves for the damper, respectively, from the inside to the outside with 0.1 A as the excitation incremental step ranging from 0.2 to 1 A as the input current.
As can be seen from Figure 5 and Figure 6, the damper hysteresis curves were sufficiently fully expanded. The maximum and minimum outputs satisfy the design requirements. In the frequency domain of the shaking table test at 1 Hz, the performance of the damper force was demonstrated to be stable.
The curve above the working conditions can be obtained. The relationship can be given as shown in Figure 7 between the current and the damping force. The regression equation for the curve is shown in Equation (12). In the formula, v is the shear velocity of MR damper and I is the applied current for the MR damper.
F = C 0 v + F ( I ) = 10629 v + 1500 + 10891 I + 2291 I 2 1468 I 3

3. Test Scheme

3.1. Loading Pattern

In order to examine the control effect of the MR damper embedded base isolation system for structural vibration control under different earthquake intensities, the loading pattern was designed and described as follows. The input earthquake excitation magnitude was the fortification intensity and rare intensity corresponding to the code defined in the eighth degree zone’s regulations [30], whereas the El Centro wave, Taft wave and Tianjin wave were used in this study. The selected earthquake waves in the experiment are shown in Table 3.

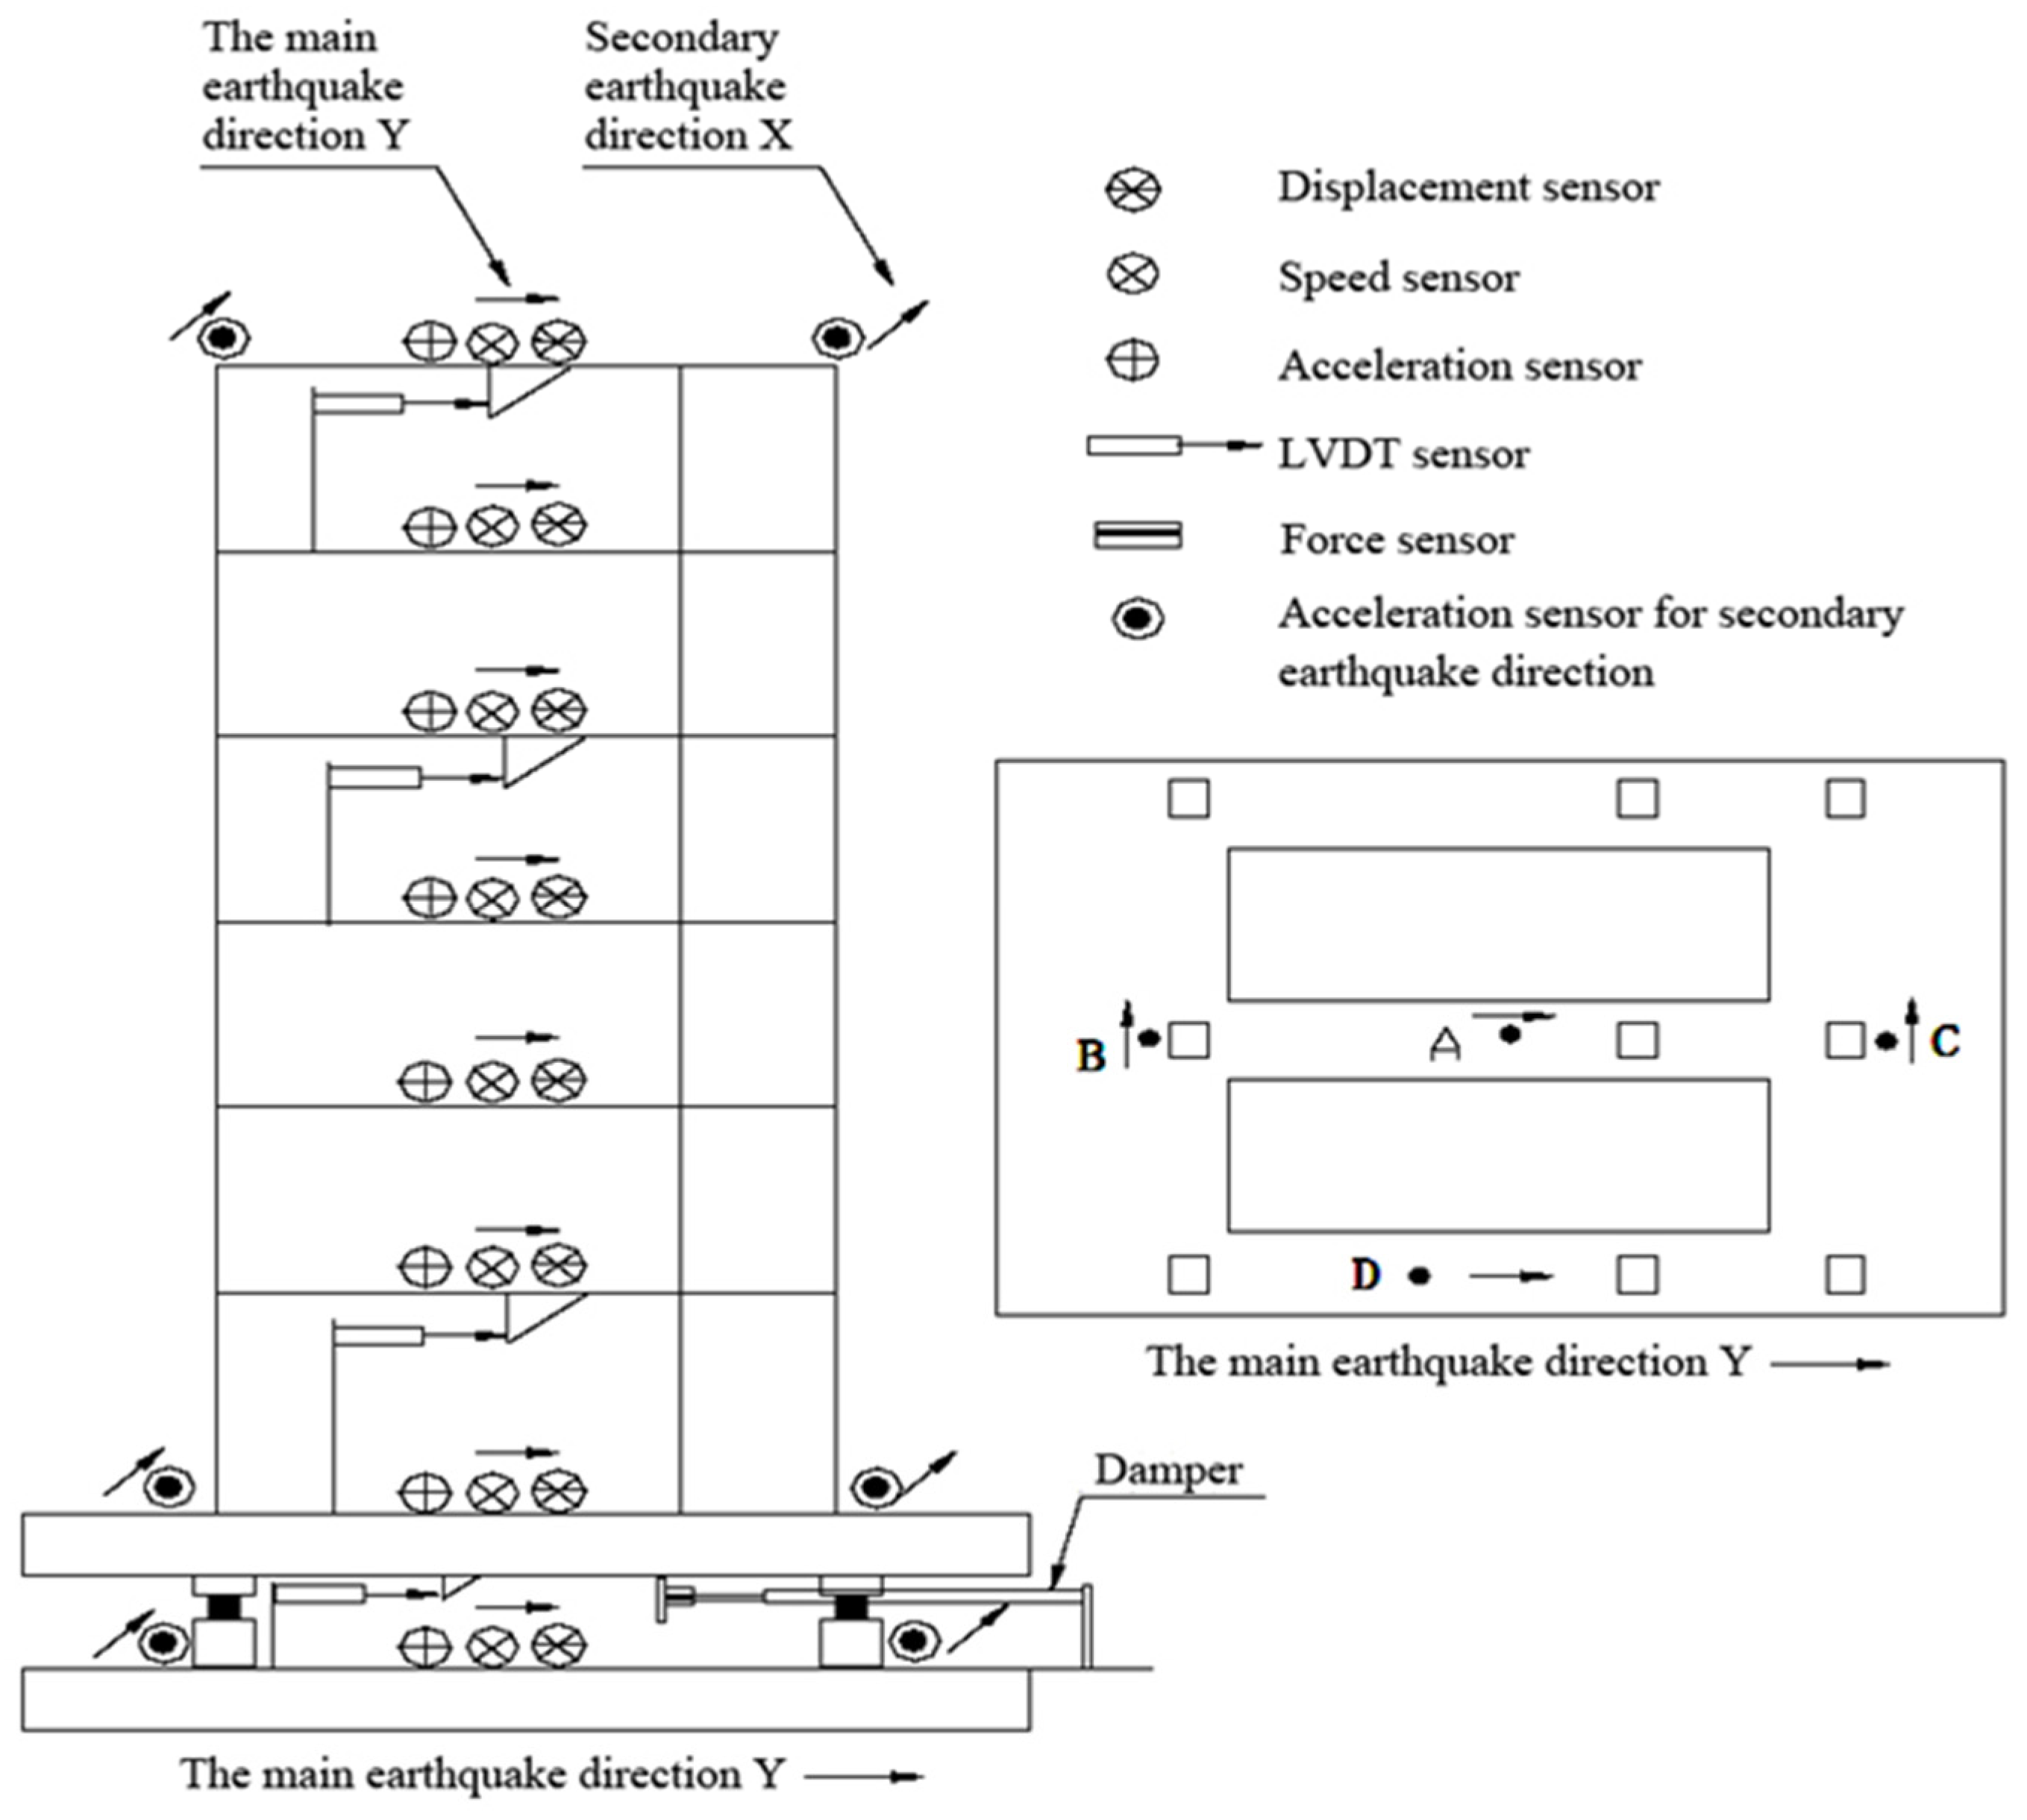
3.2. Measurement Scheme

In order to carry out the measurement and feedback of the state vector for the control system, the sensors of displacement, velocity, acceleration and force were arranged on the test model. Figure 8 shows the sensor arrangement for the experimental model. Moreover, in order to measure the actual working performance of the MR damper, a force transducer with a measuring range of 2 tons was setup in the experiment. It was directly connected with the damper embedded within the isolation layer.

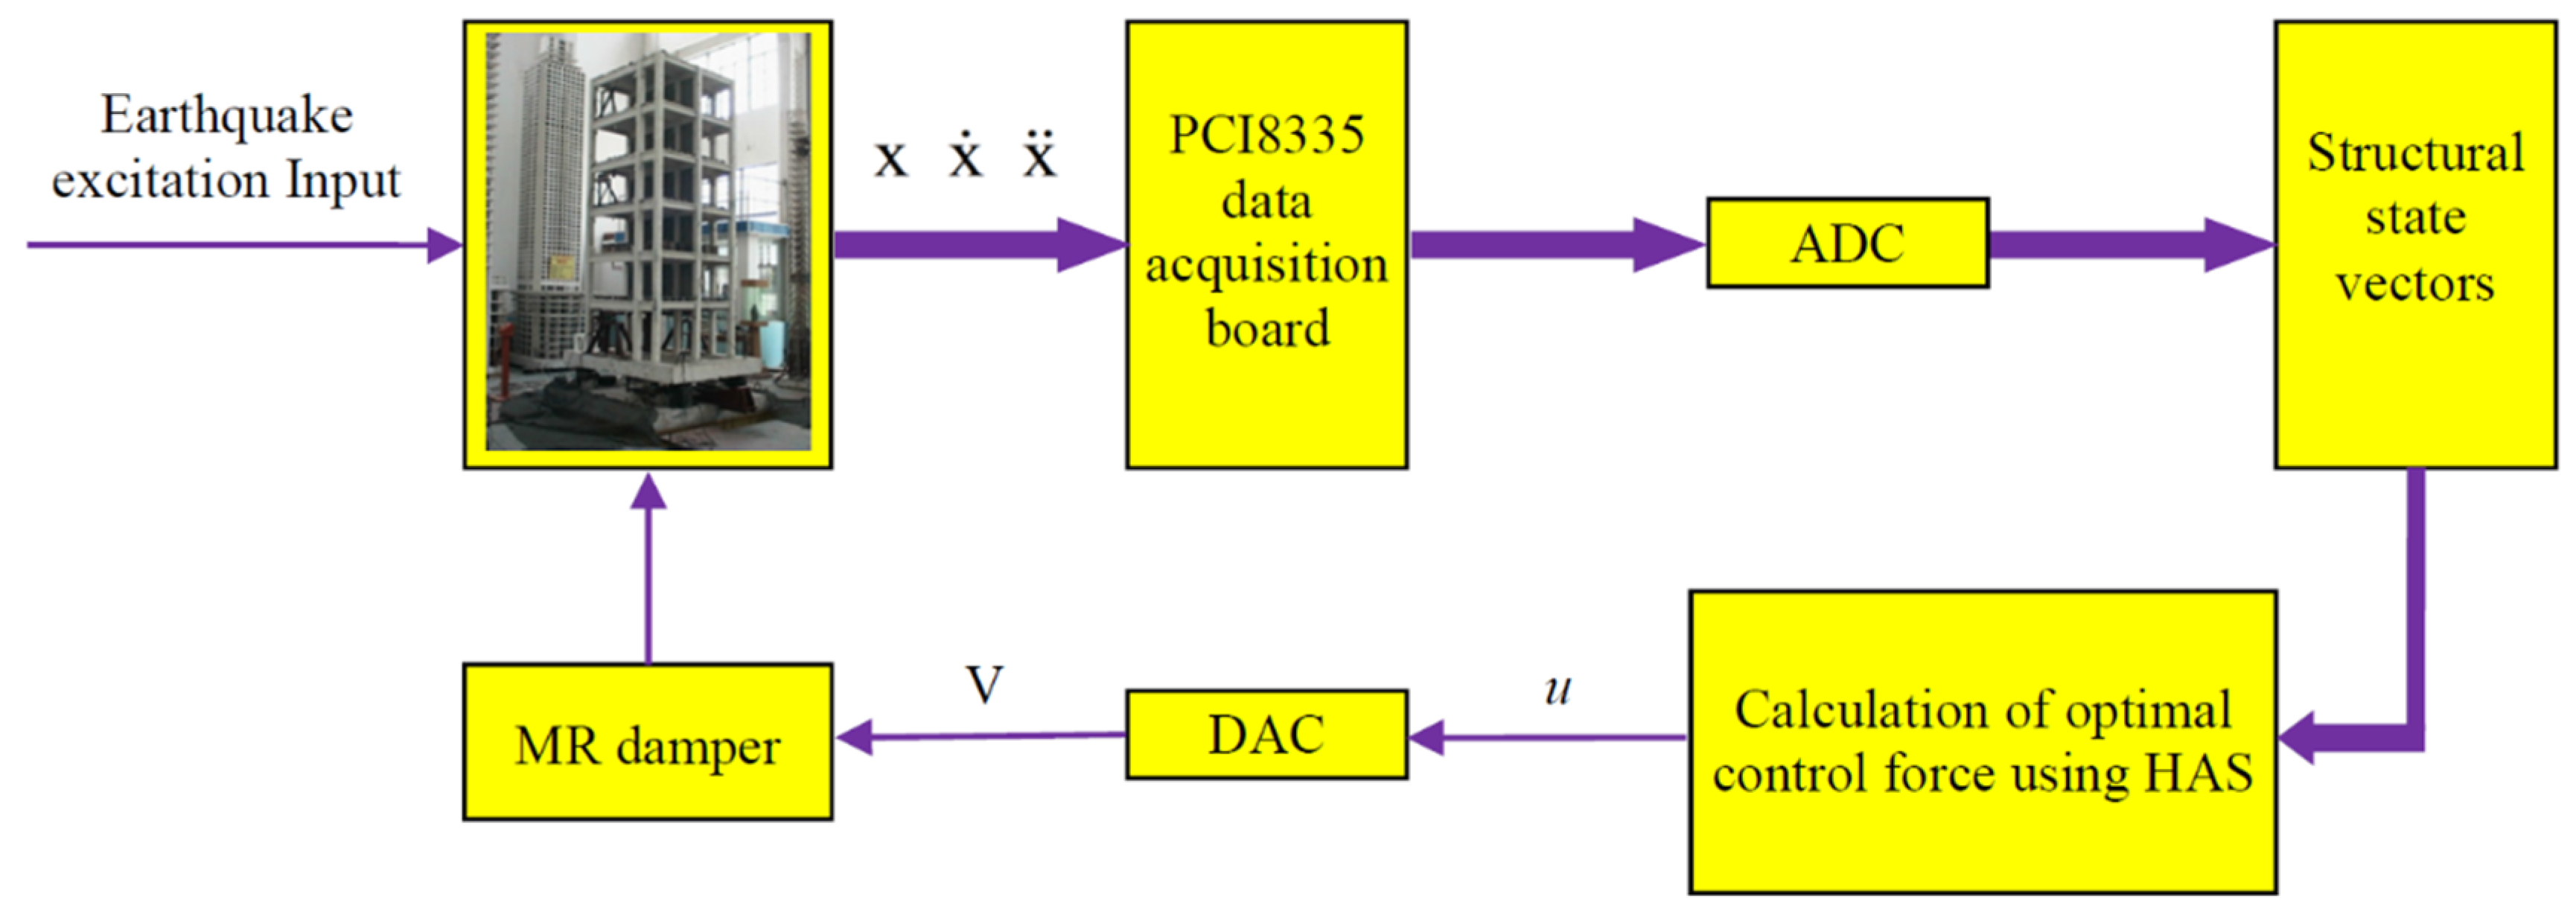
3.3. Feedback Control System Scheme

The control system exhibited a full state feedback scheme. The controller host computer was installed with a PCI 8335 data acquisition board. It can complete the whole process of data collection, calculation, and instruction. The data collection board using Visual Basic (VB) compiler transforms the two control algorithm into VB executable programs for structural signal collection, online calculation and control signal generation and communication. The interface of the control operating system is shown in Figure 8.

4. Analysis of Experimental Results

In order to proceed with the test smoothly, relevant numerical simulation for the control system was carried out prior to executing the experiments. Test results were also analyzed for the control system carried out by using HSA approach with two control strategies, namely, the continuity mode (CM) and switch mode (SM).

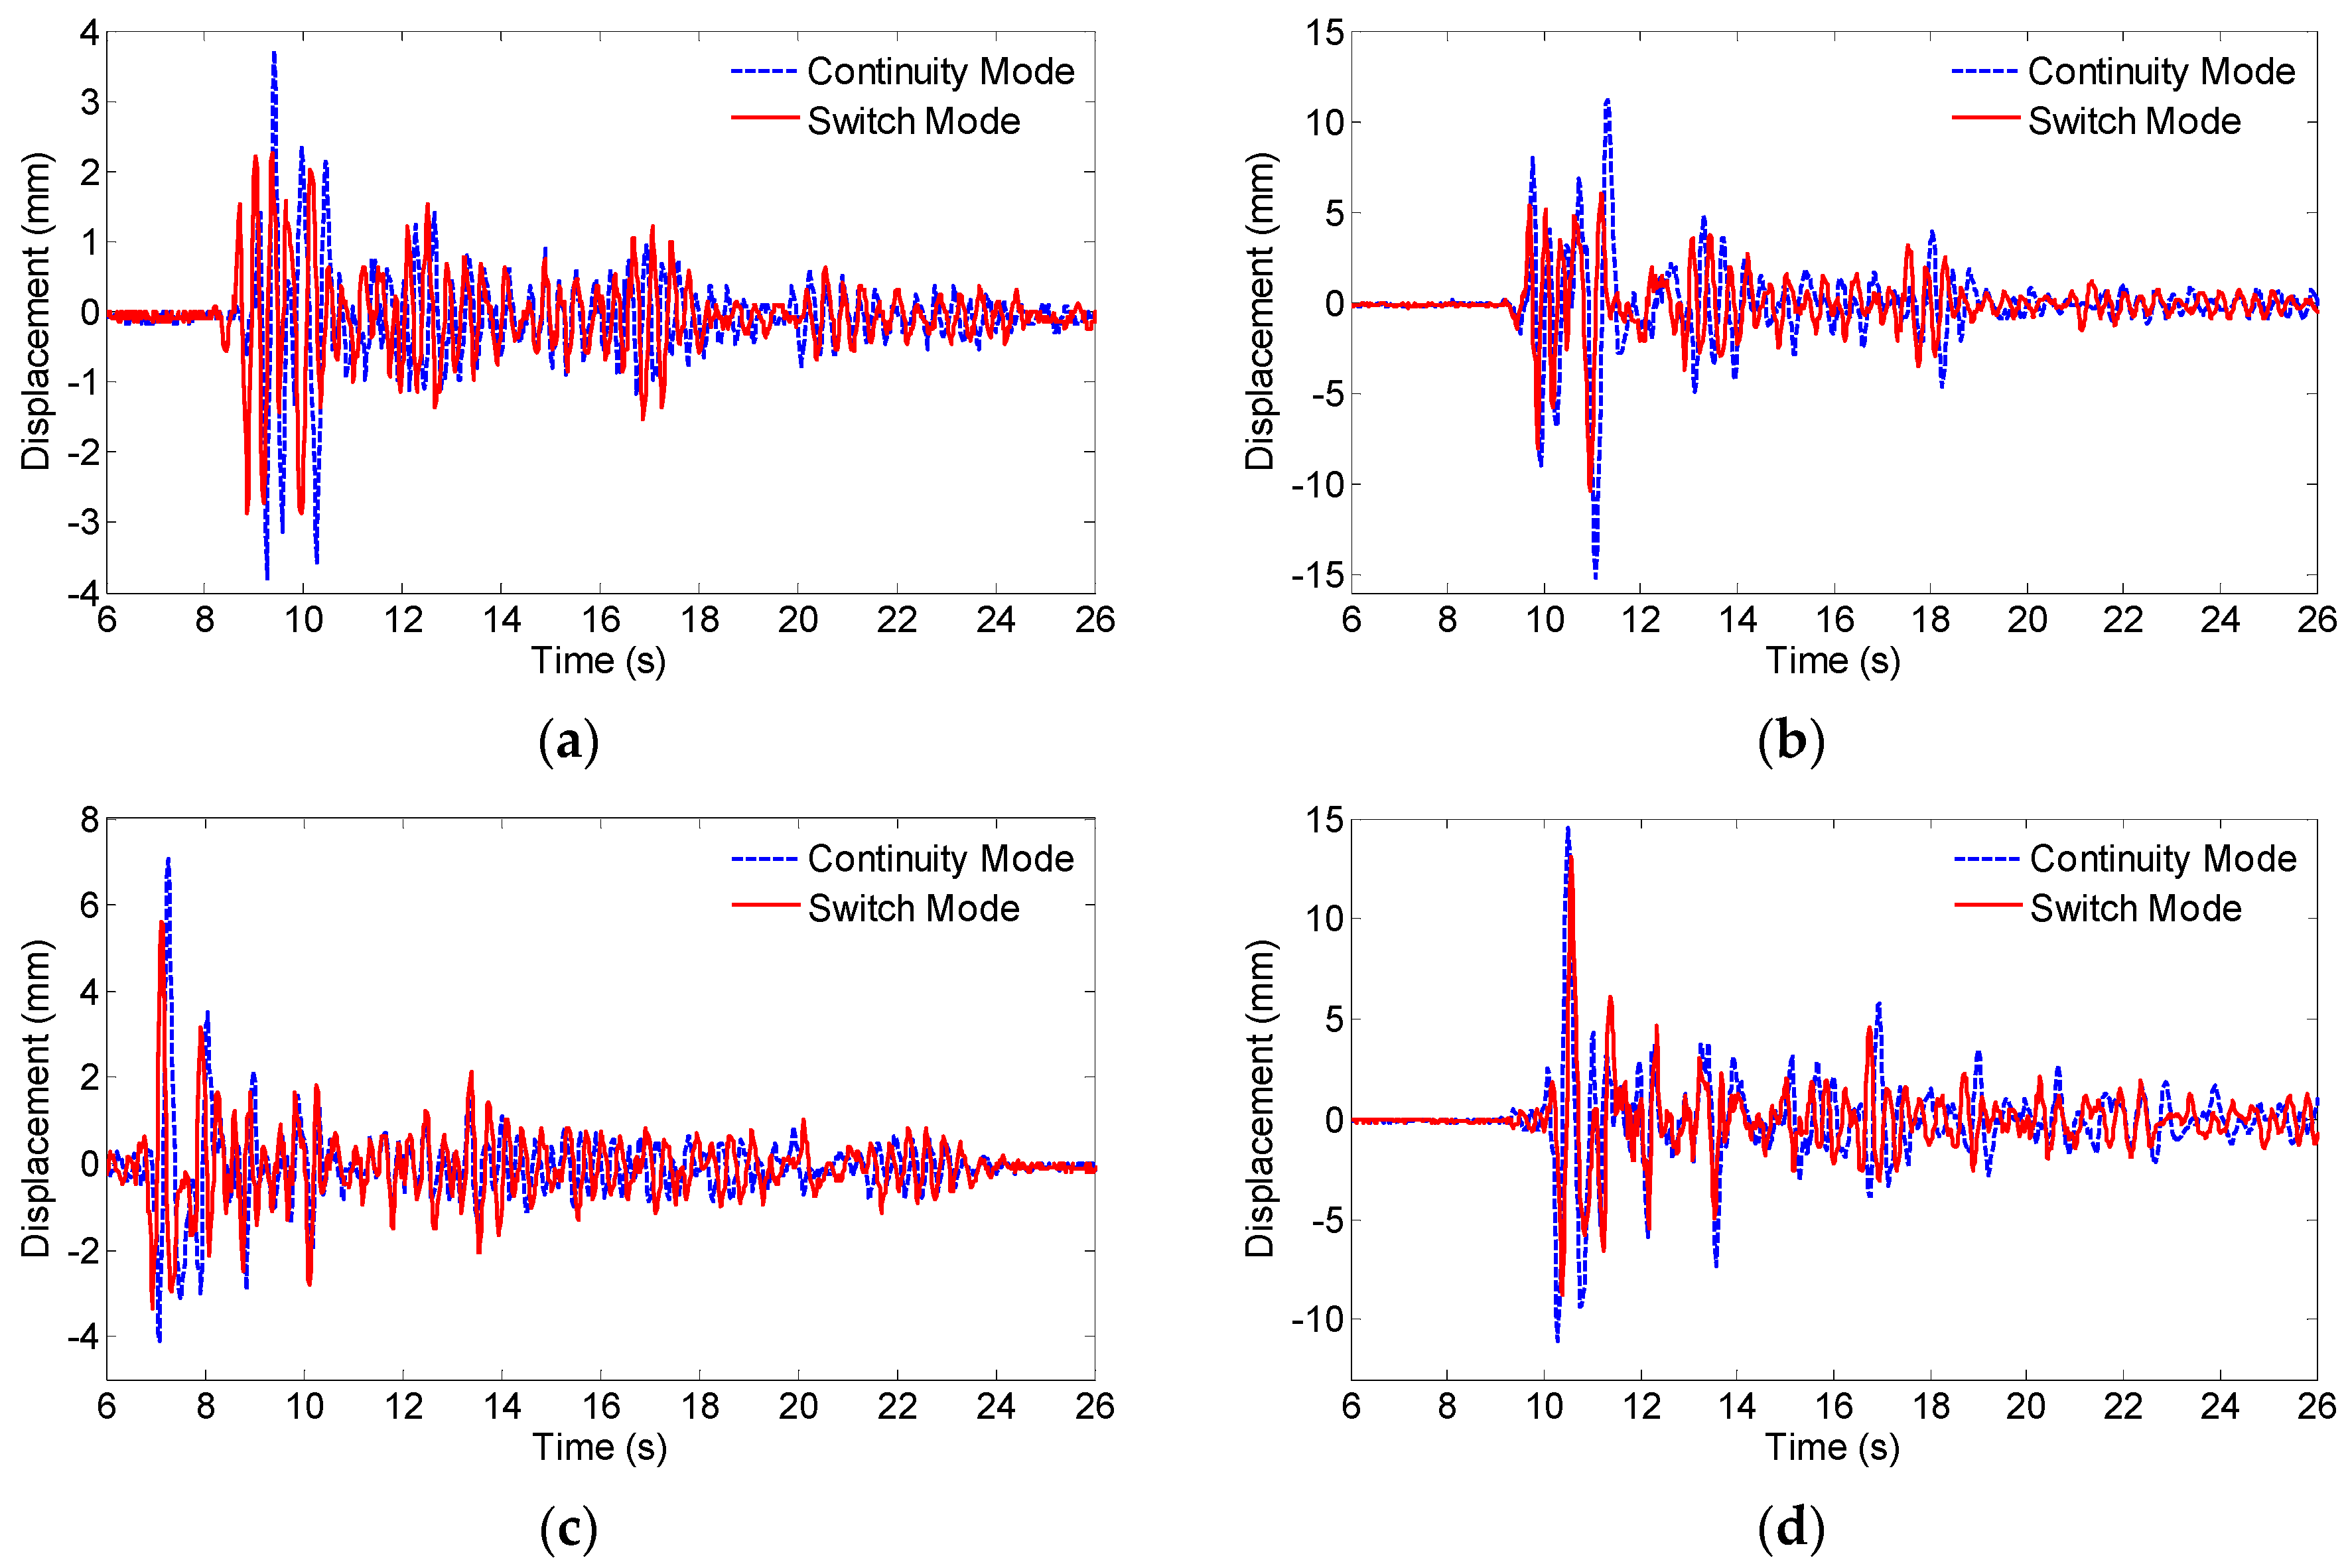
4.1. Structural Displacement Response

The peak value of storey drift response for each working condition is summarized in Table 4. The values in brackets are the results from numerical simulation. Figure 9 shows the time history curve for the isolation layer displacement response in the test.
As seen from Table 4, the maximum displacement of the isolation layer (30.52 mm) is only about 55% of displacement limit value for the rubber bearing (55 mm). Hence, the control system has the capacity to sustain greater seismic loading. In addition, the numerical calculation is shown to be in good accordance with the test measurements. It lays out a good foundation for further research on the design method associated with the control system.
When the switch mode control is employed, the displacement response of the isolation layer is relatively small compared to continuity control mode. This is because the damper force outputs change only between the maximum and minimum values. When the isolation layer has a larger displacement response, the damper is directly applied with the maximum control force under the switch control mode, rather than continuously changing its value between the maximum and minimum damping force. The displacement of the isolation layer is small under the switch control mode, but the storey displacement corresponding to all the upper floors of the structure is relatively large due to the constrained base isolator deformations.

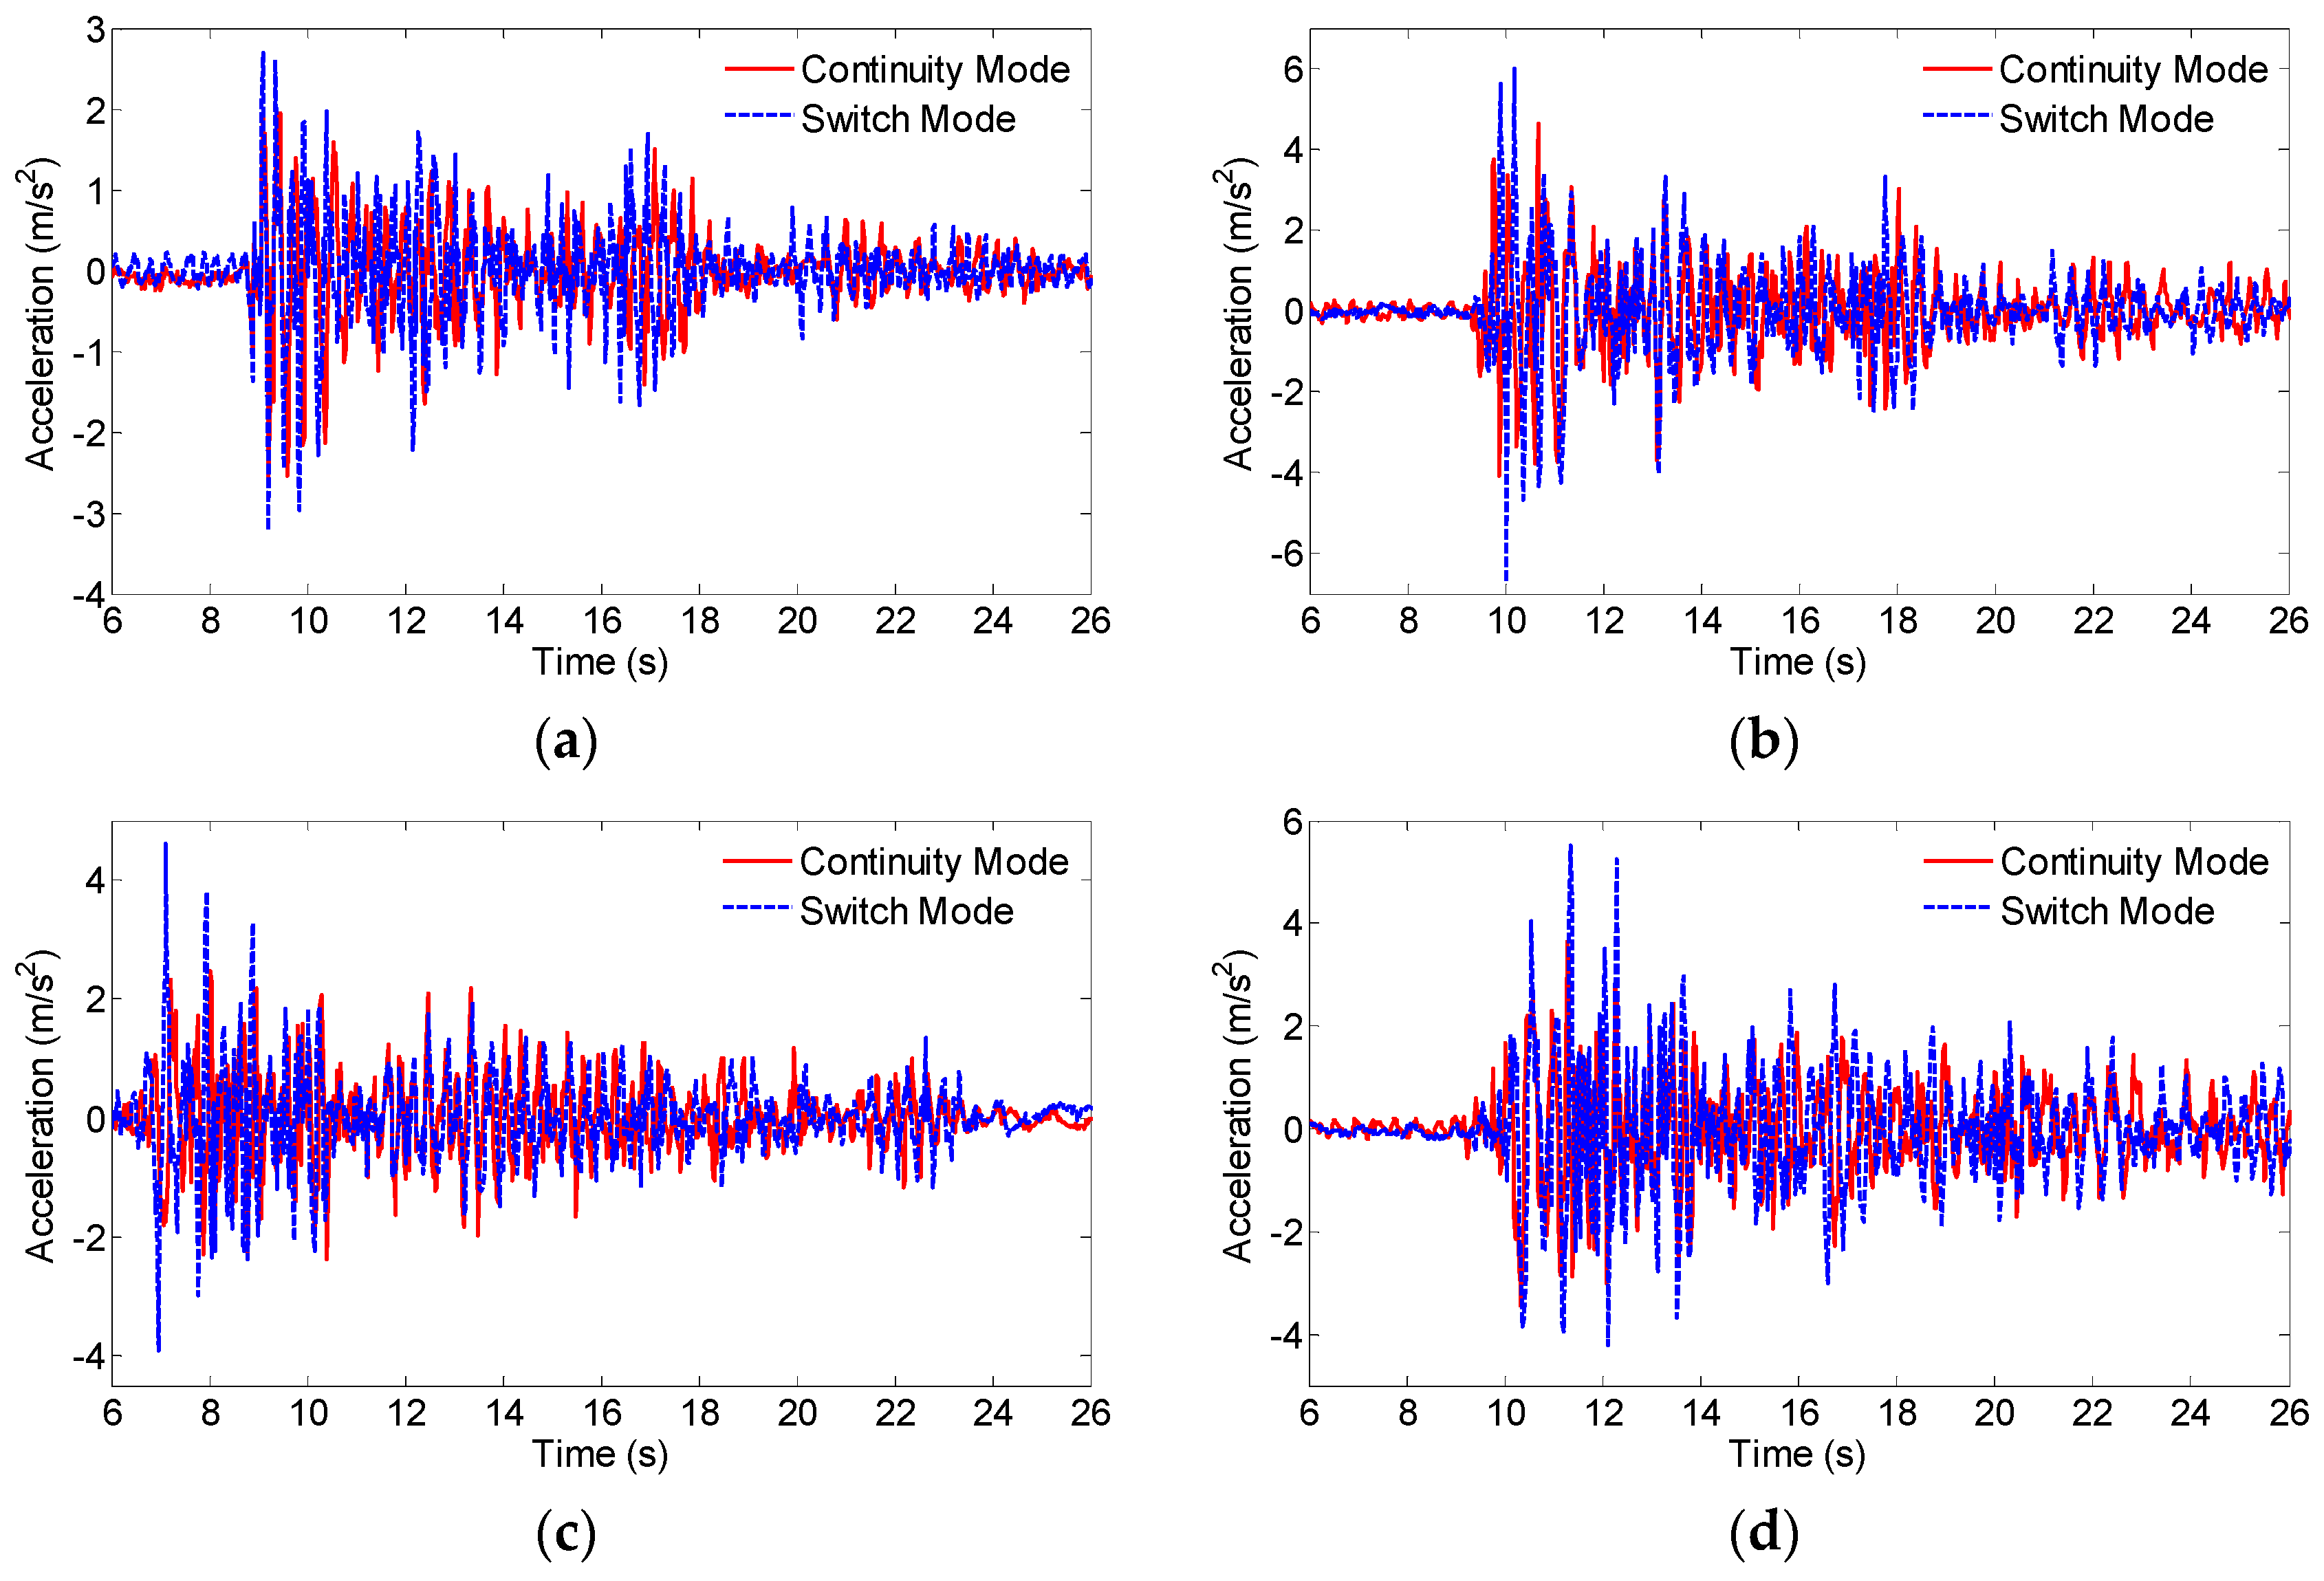
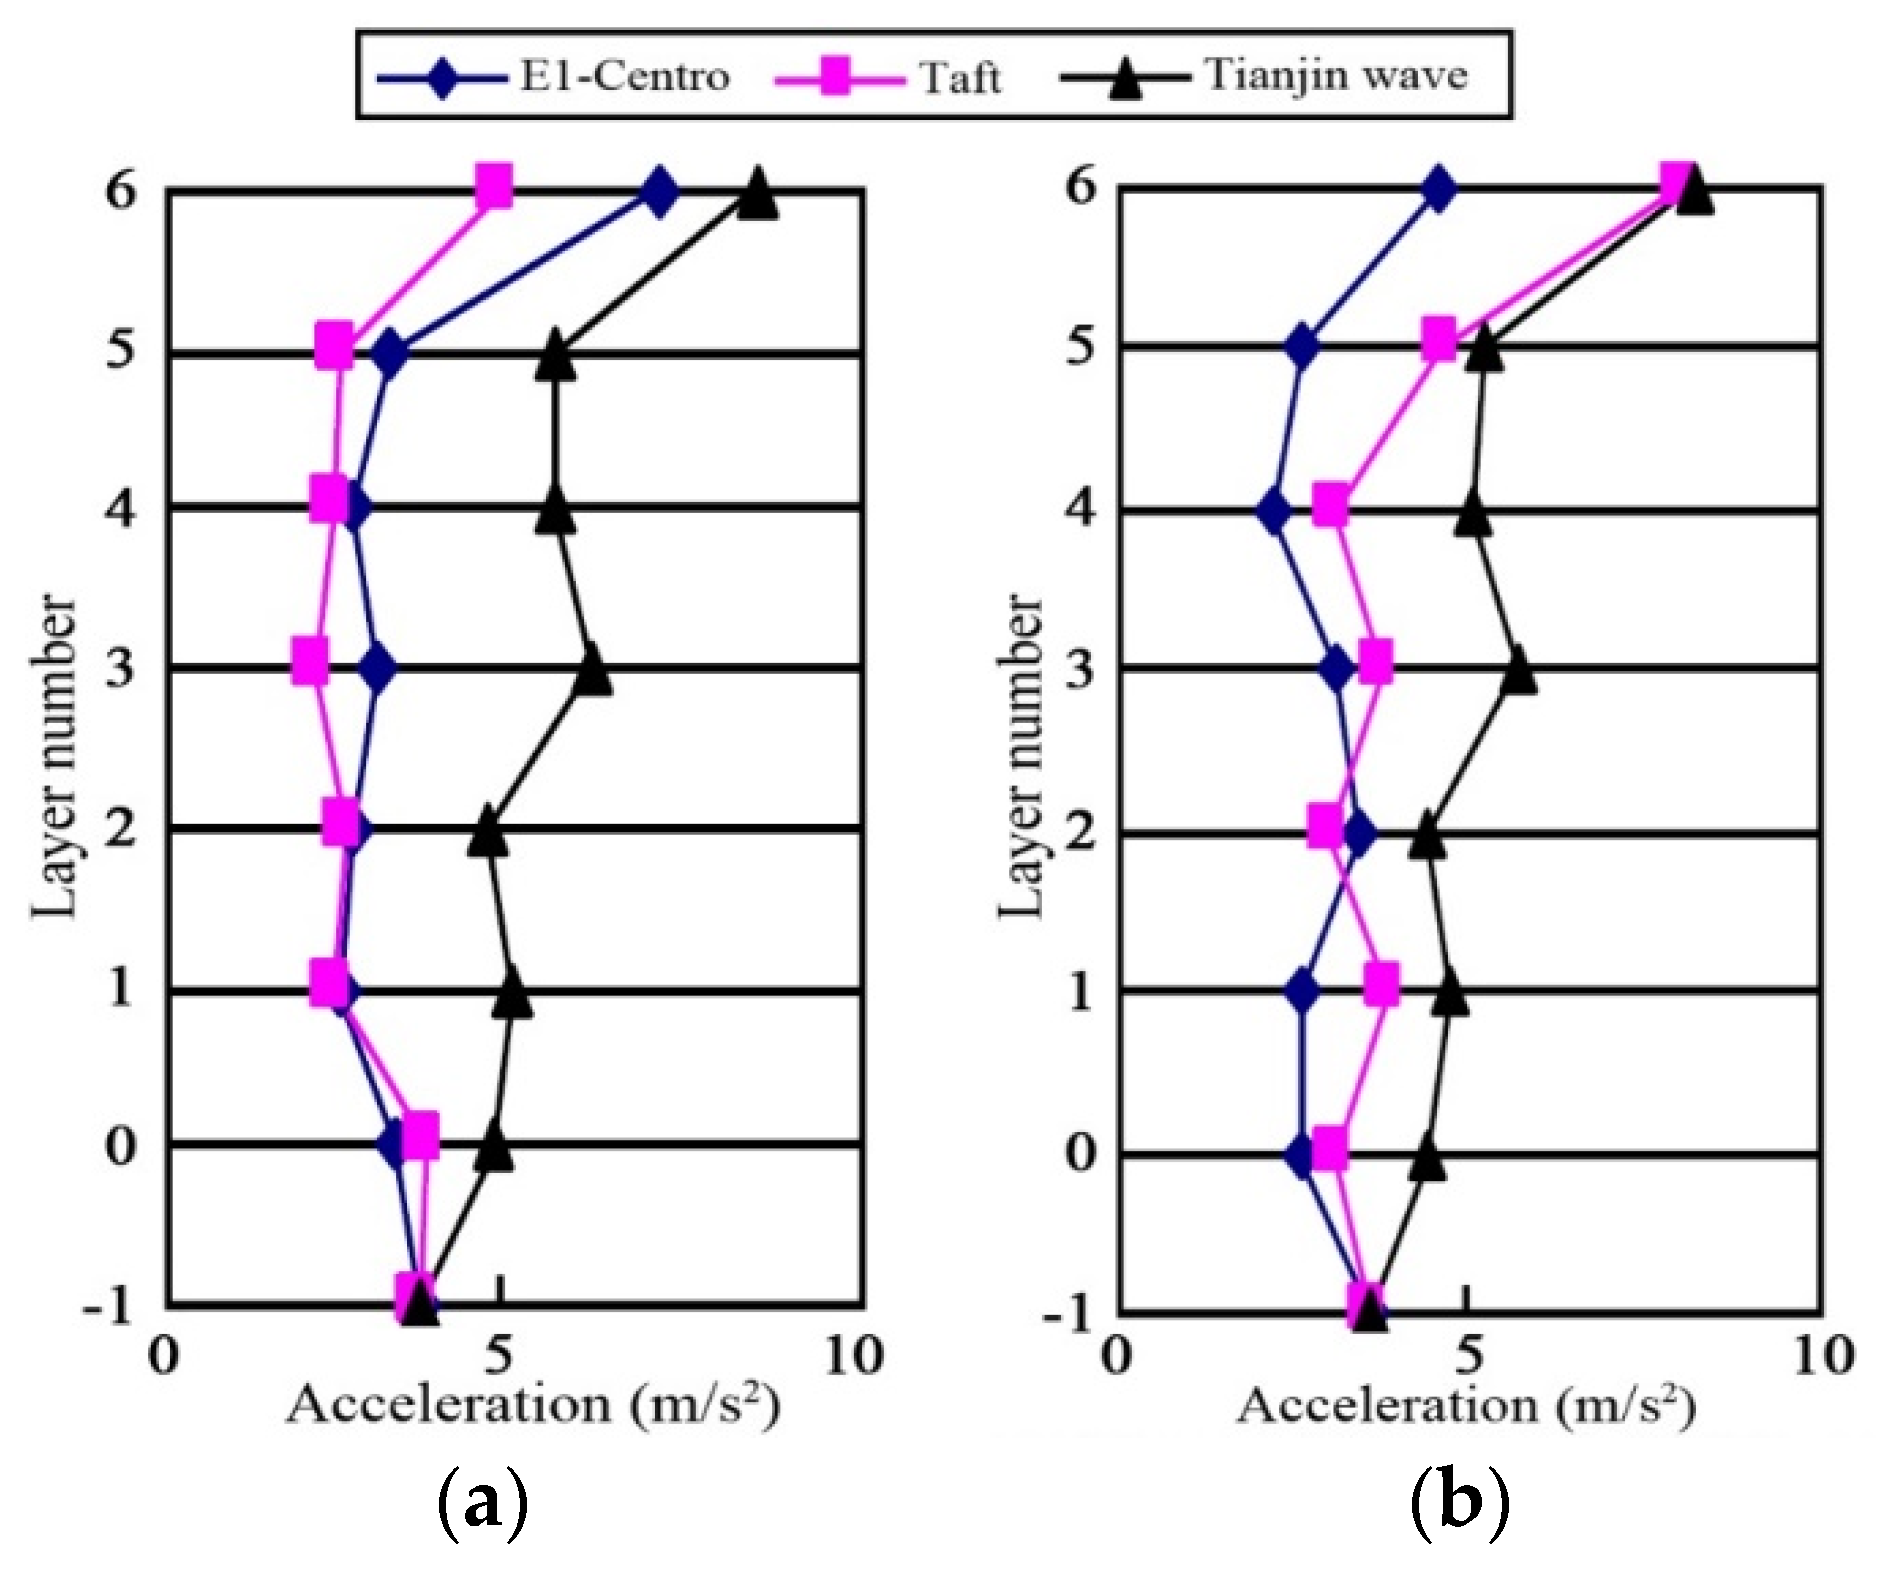
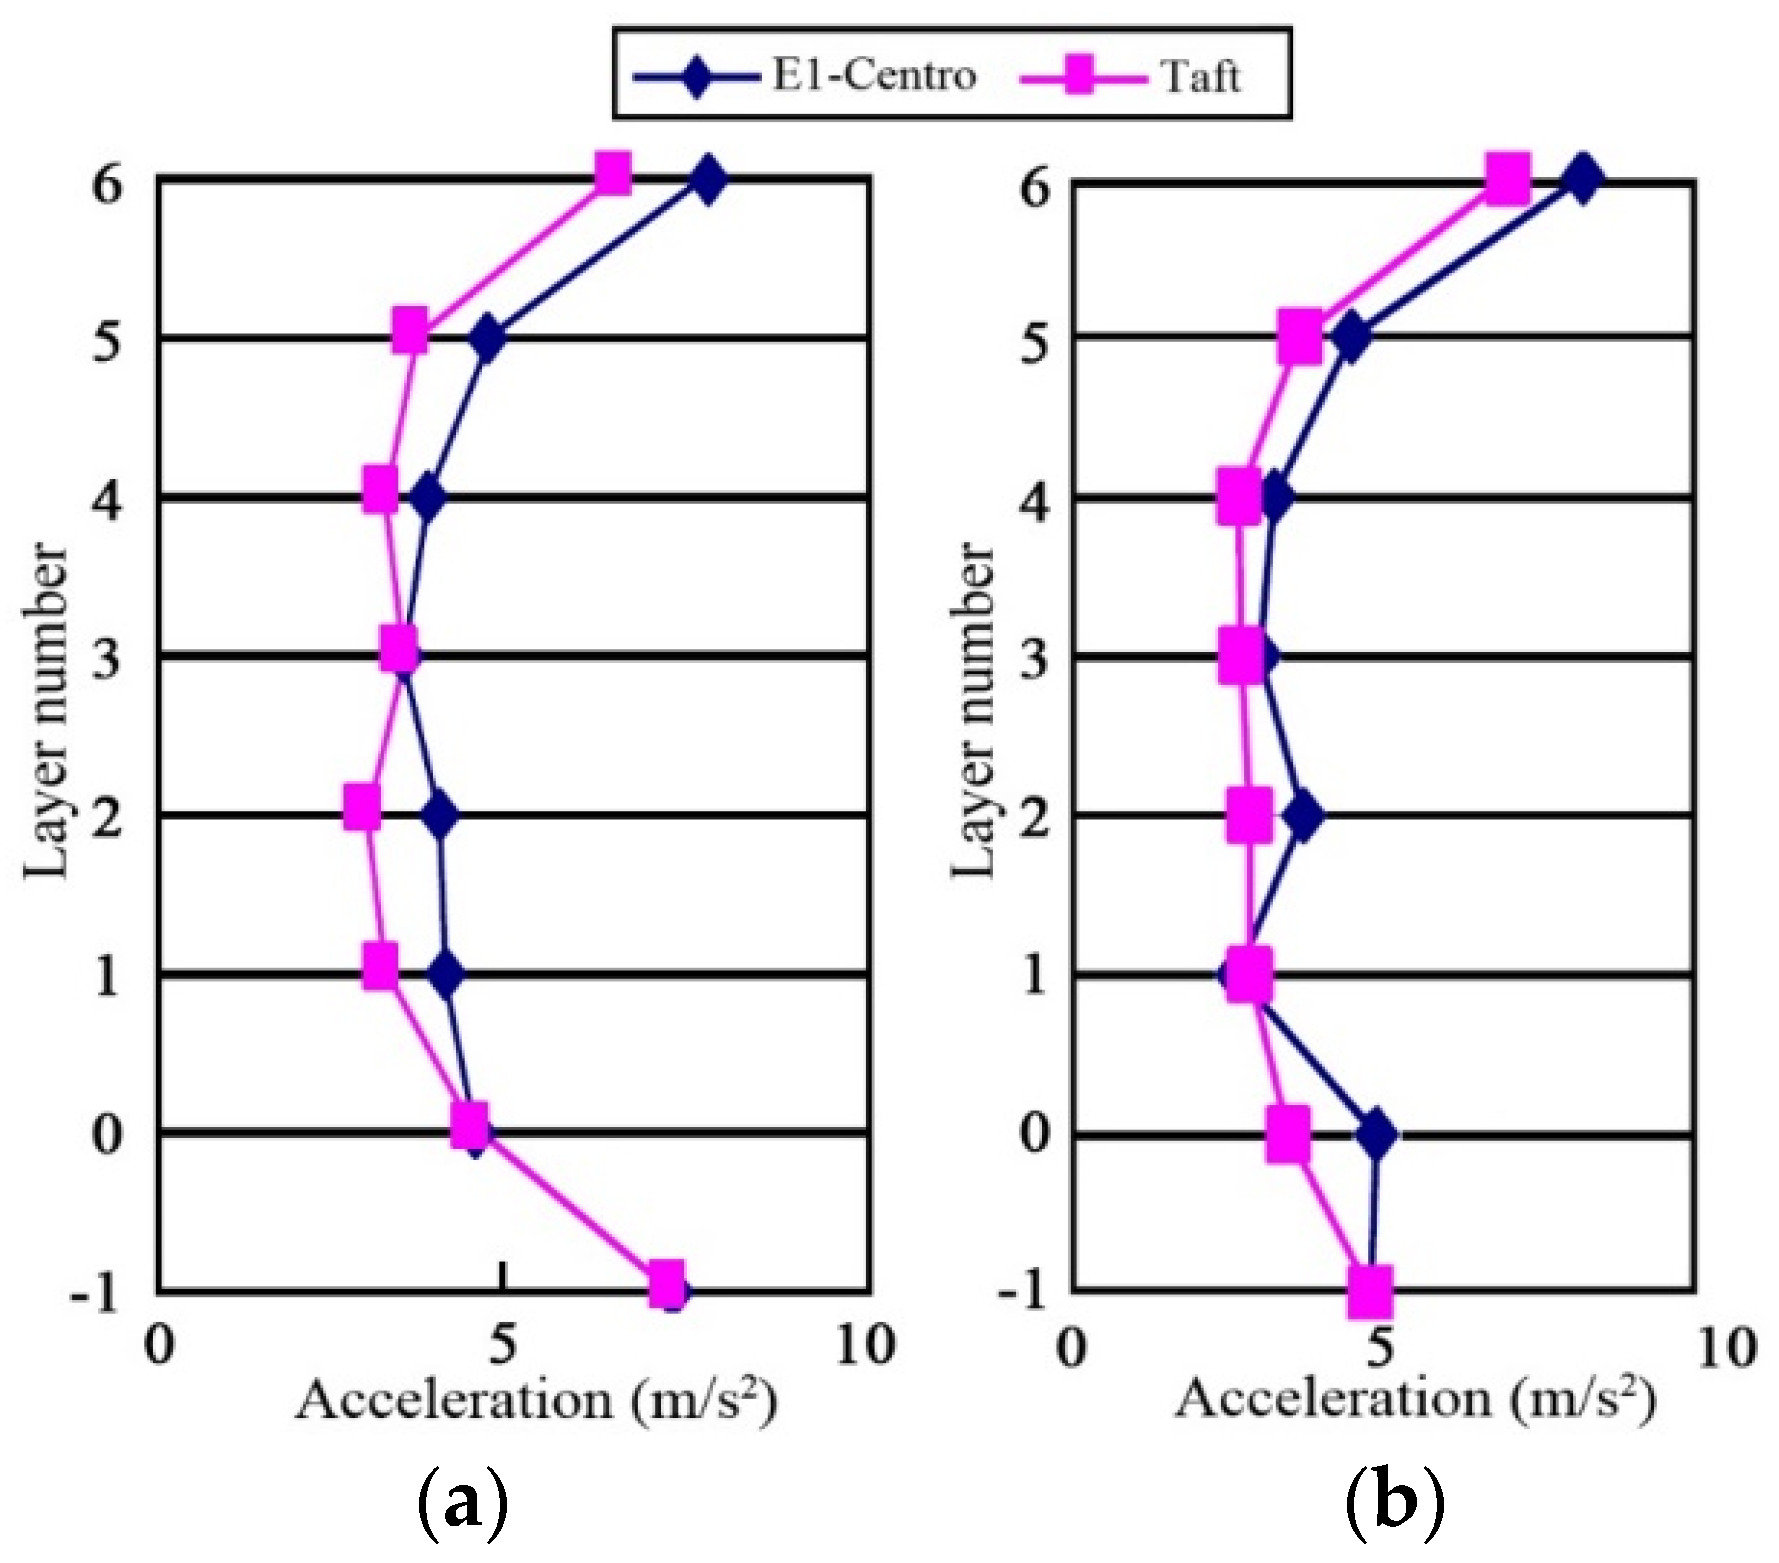
4.2. Structural Acceleration Response

The acceleration time history curves for the fifth storey of the structure under different control modes are compared and displayed in Figure 10. It is observed that the continuity control strategy outperforms the switch mode control, as the acceleration values in all scenarios have been suppressed lower than that from the switch mode control. Moreover, the control effect of continuity mode under rare intensity is found to be better than that under fortification intensity.
Figure 11 and Figure 12 show the peak acceleration responses of each structure storey under different earthquake profiles and amplitudes, for both the continuity control mode and switch control mode. Control effects for the El Centro wave and Taft wave are observed to be more significant than the Tianjin wave. In the rare intensity with continuity control mode for El Centro wave and Taft wave, the peak acceleration responses of the fifth storey are reduced by half of the acceleration peak of the input seismic waves. The structure vibration control effect is obvious, and structure response is reduced by 1/3 under the fortification intensity.
The reasons for the continuity control being better than the switch control can be attributed to the following displacement response analysis. Under switch control mode the isolation layer displacement is much smaller than that of the continuity control mode. The decrease of displacement makes the energy dissipation of the damper relatively limited to a smaller range. Thus the energy transferred to the upper structure increases, and the resulting acceleration response becomes larger. Meanwhile, the control effect under rare intensity is better than that of fortification intensity. This is because the initial viscous coefficient of the damper is larger. In rare intensity, a greater isolation layer displacement can completely overcome the initial viscous force. The dampers dissipate more energy, and hence, the acceleration response of the upper structure is significantly reduced.
It is worth noting that the peak acceleration response for the top storey of the structure model in various conditions, compared with other layers, has a large amplification. This does not conform with the control effect of the overall structure [31]. This may be due to the top storey of the structure model having been destroyed in the previous test, thereby the stiffness of the structure is reduced, and the a whiplash effect occurred in the test. The observation after the experiment also verified this hypothesis. Therefore, when the acceleration response is analyzed, the acceleration peak value of the fifth storey is adopted. The peak acceleration response of each structure storey is similar. The displacement response of the superstructure is small compared with the displacement of the isolation layer. This structure of the displacement reaction mainly occurred in the isolation layer, the upper structure close to the overall translational motion.

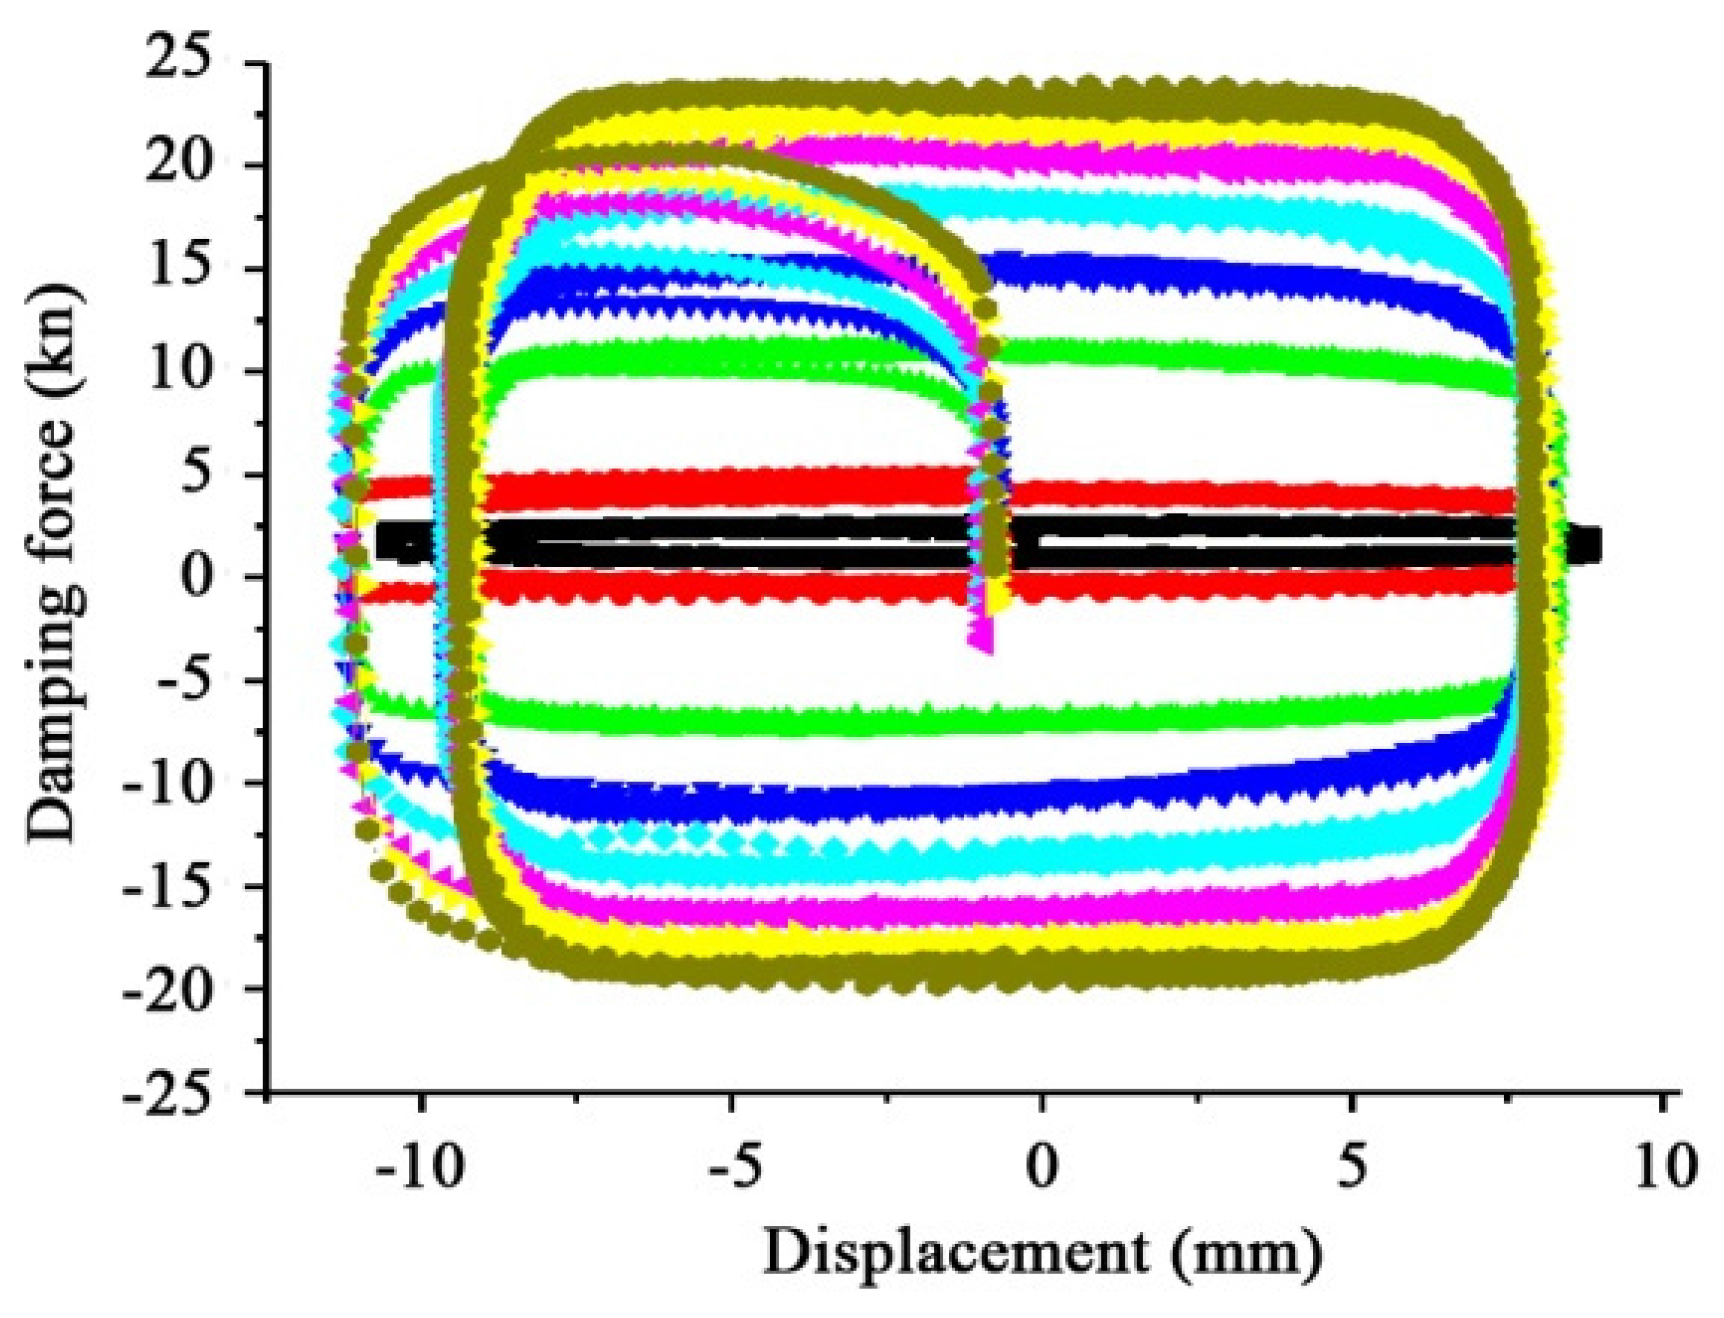
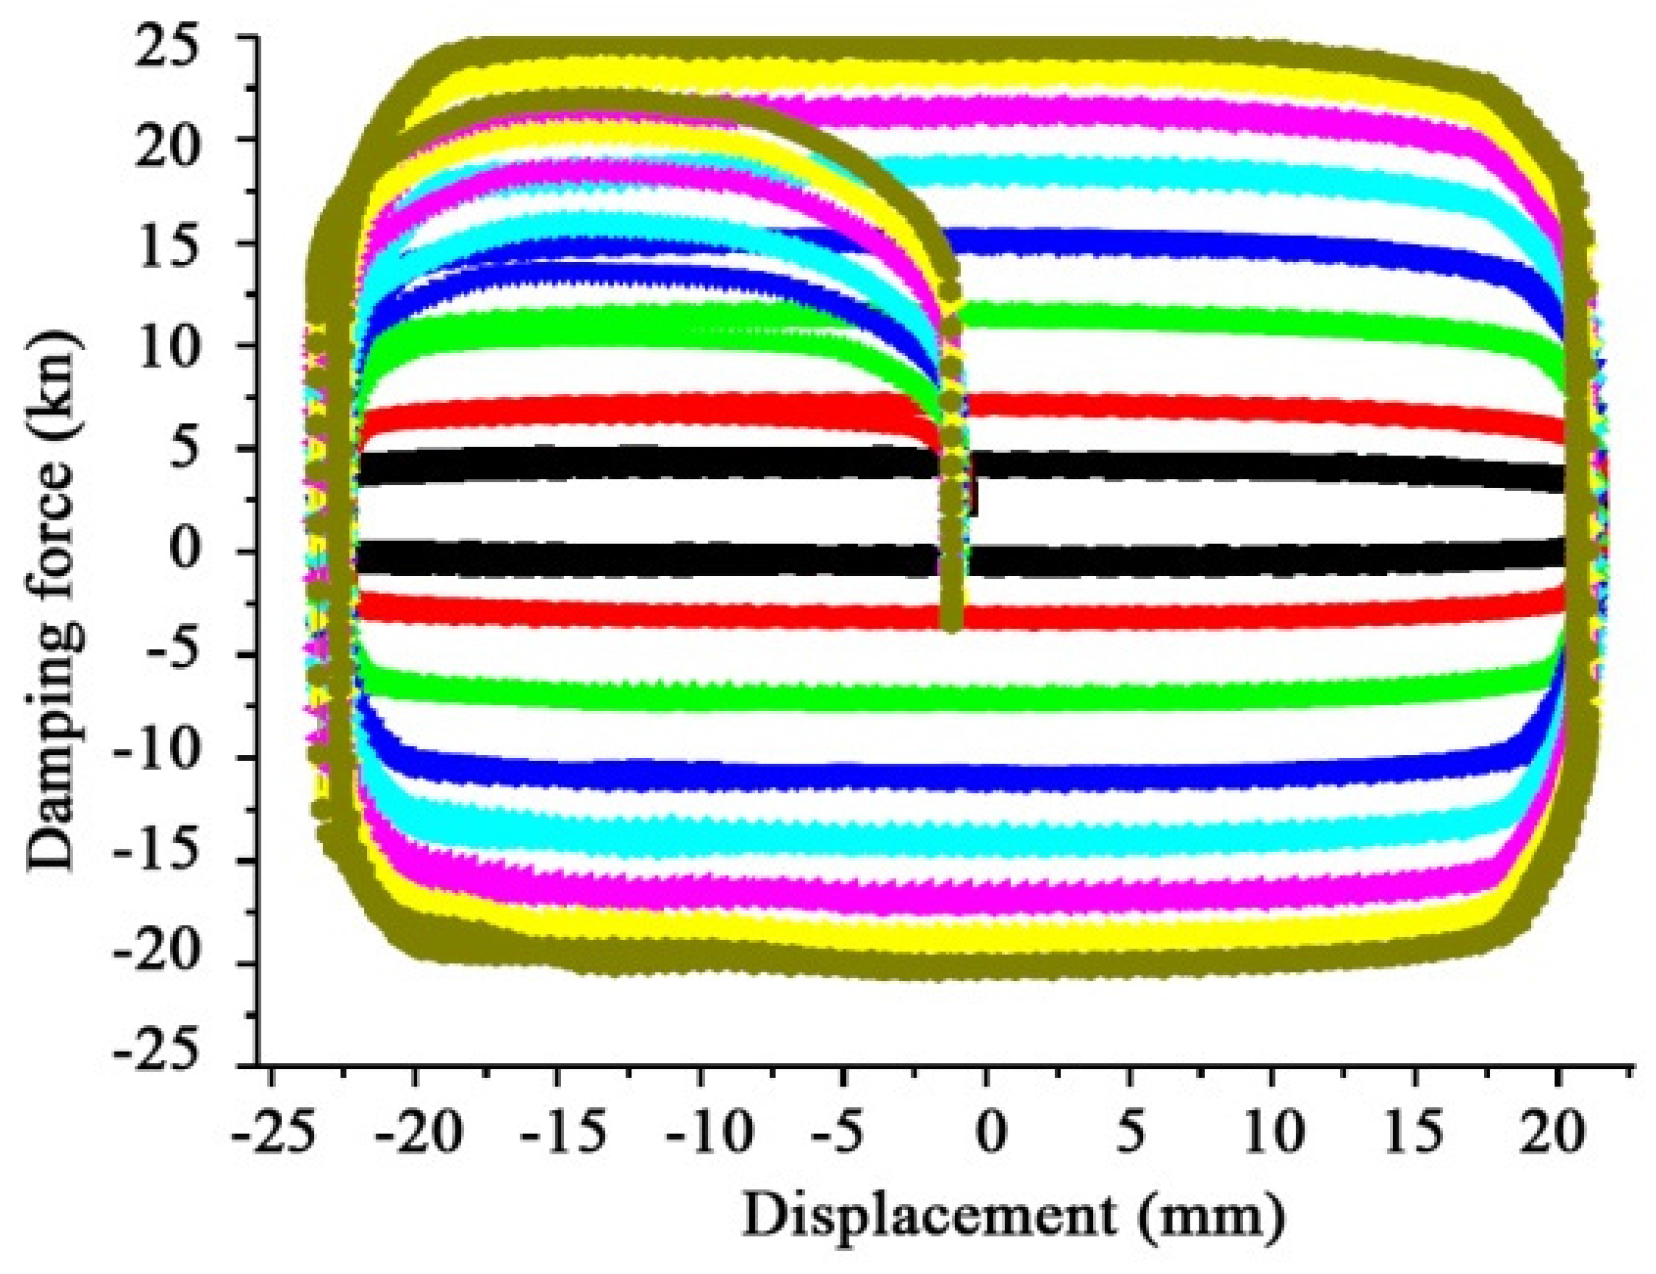
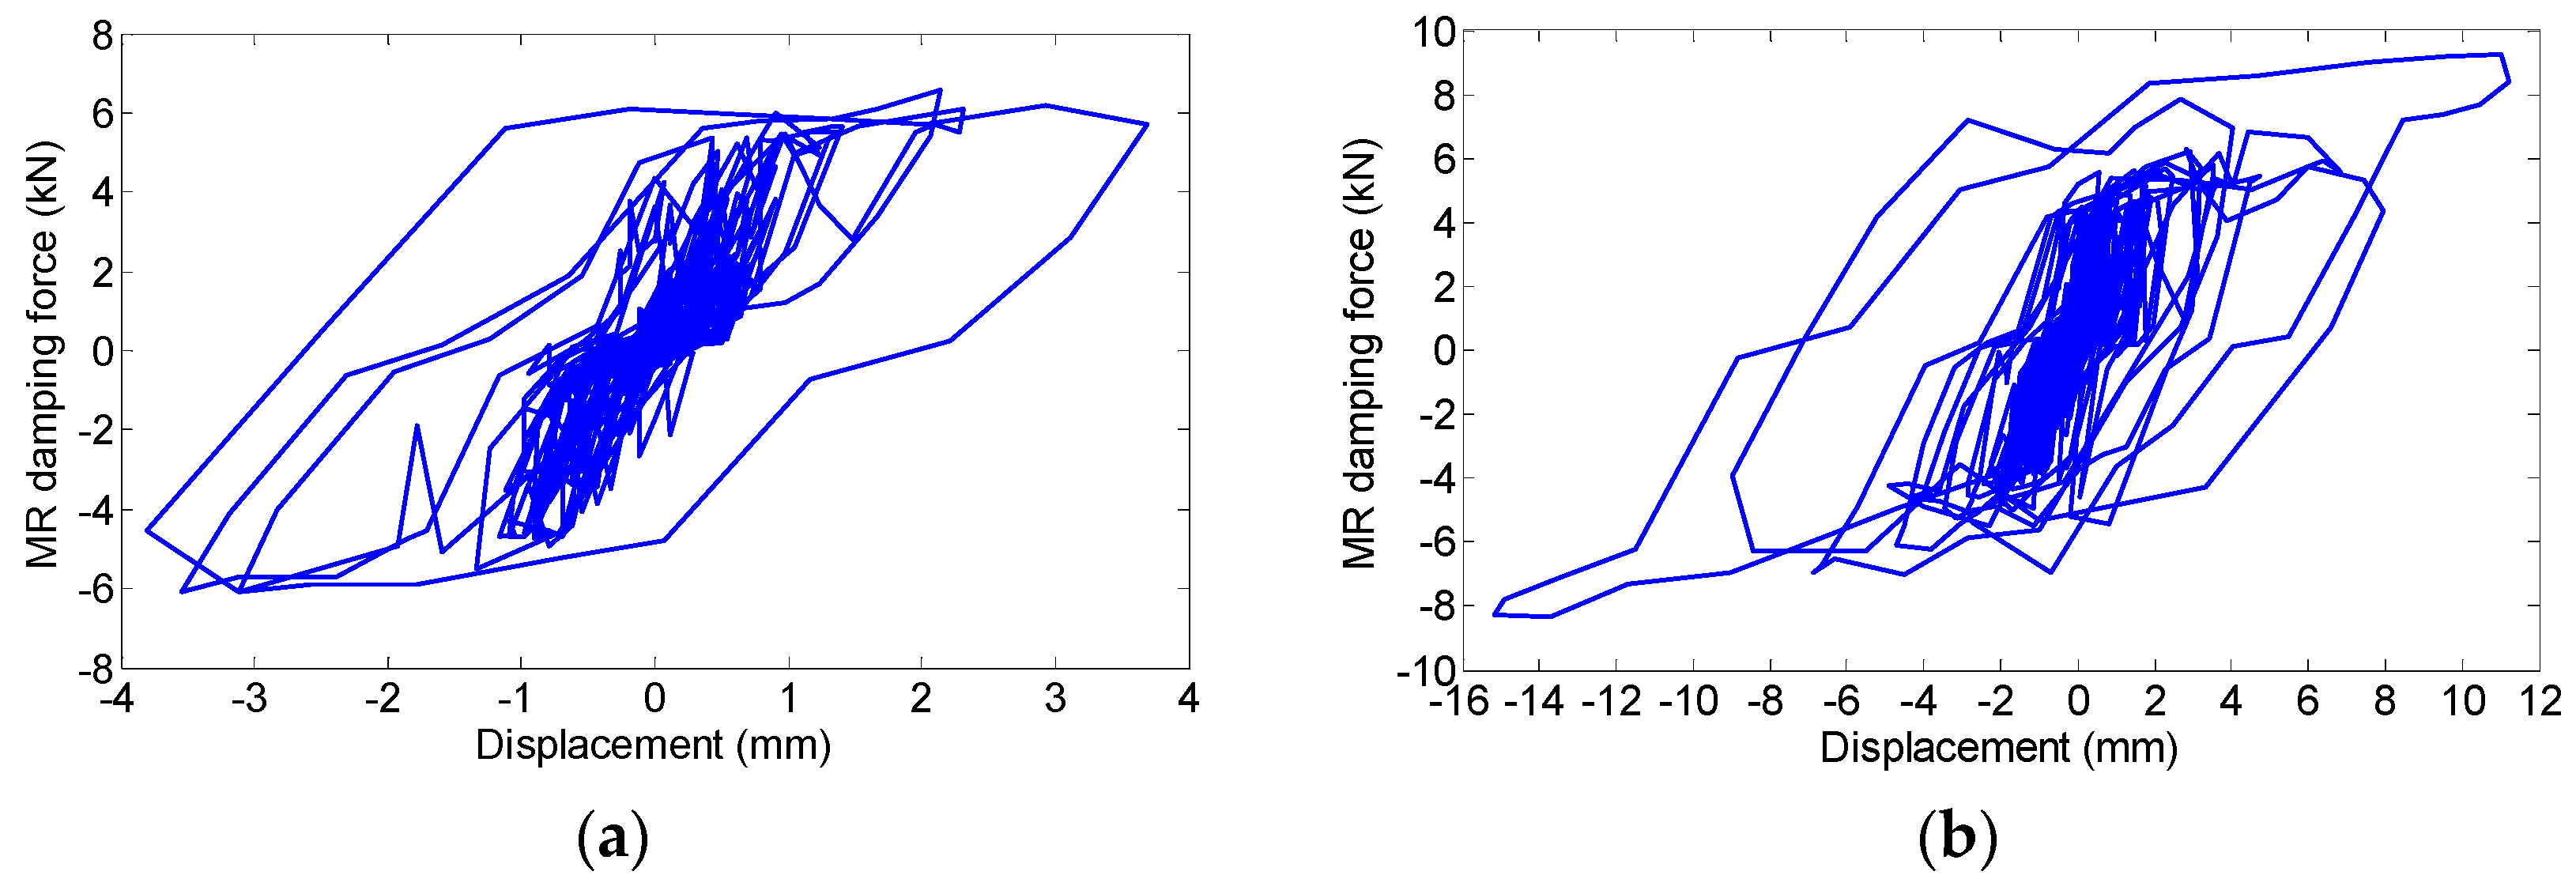
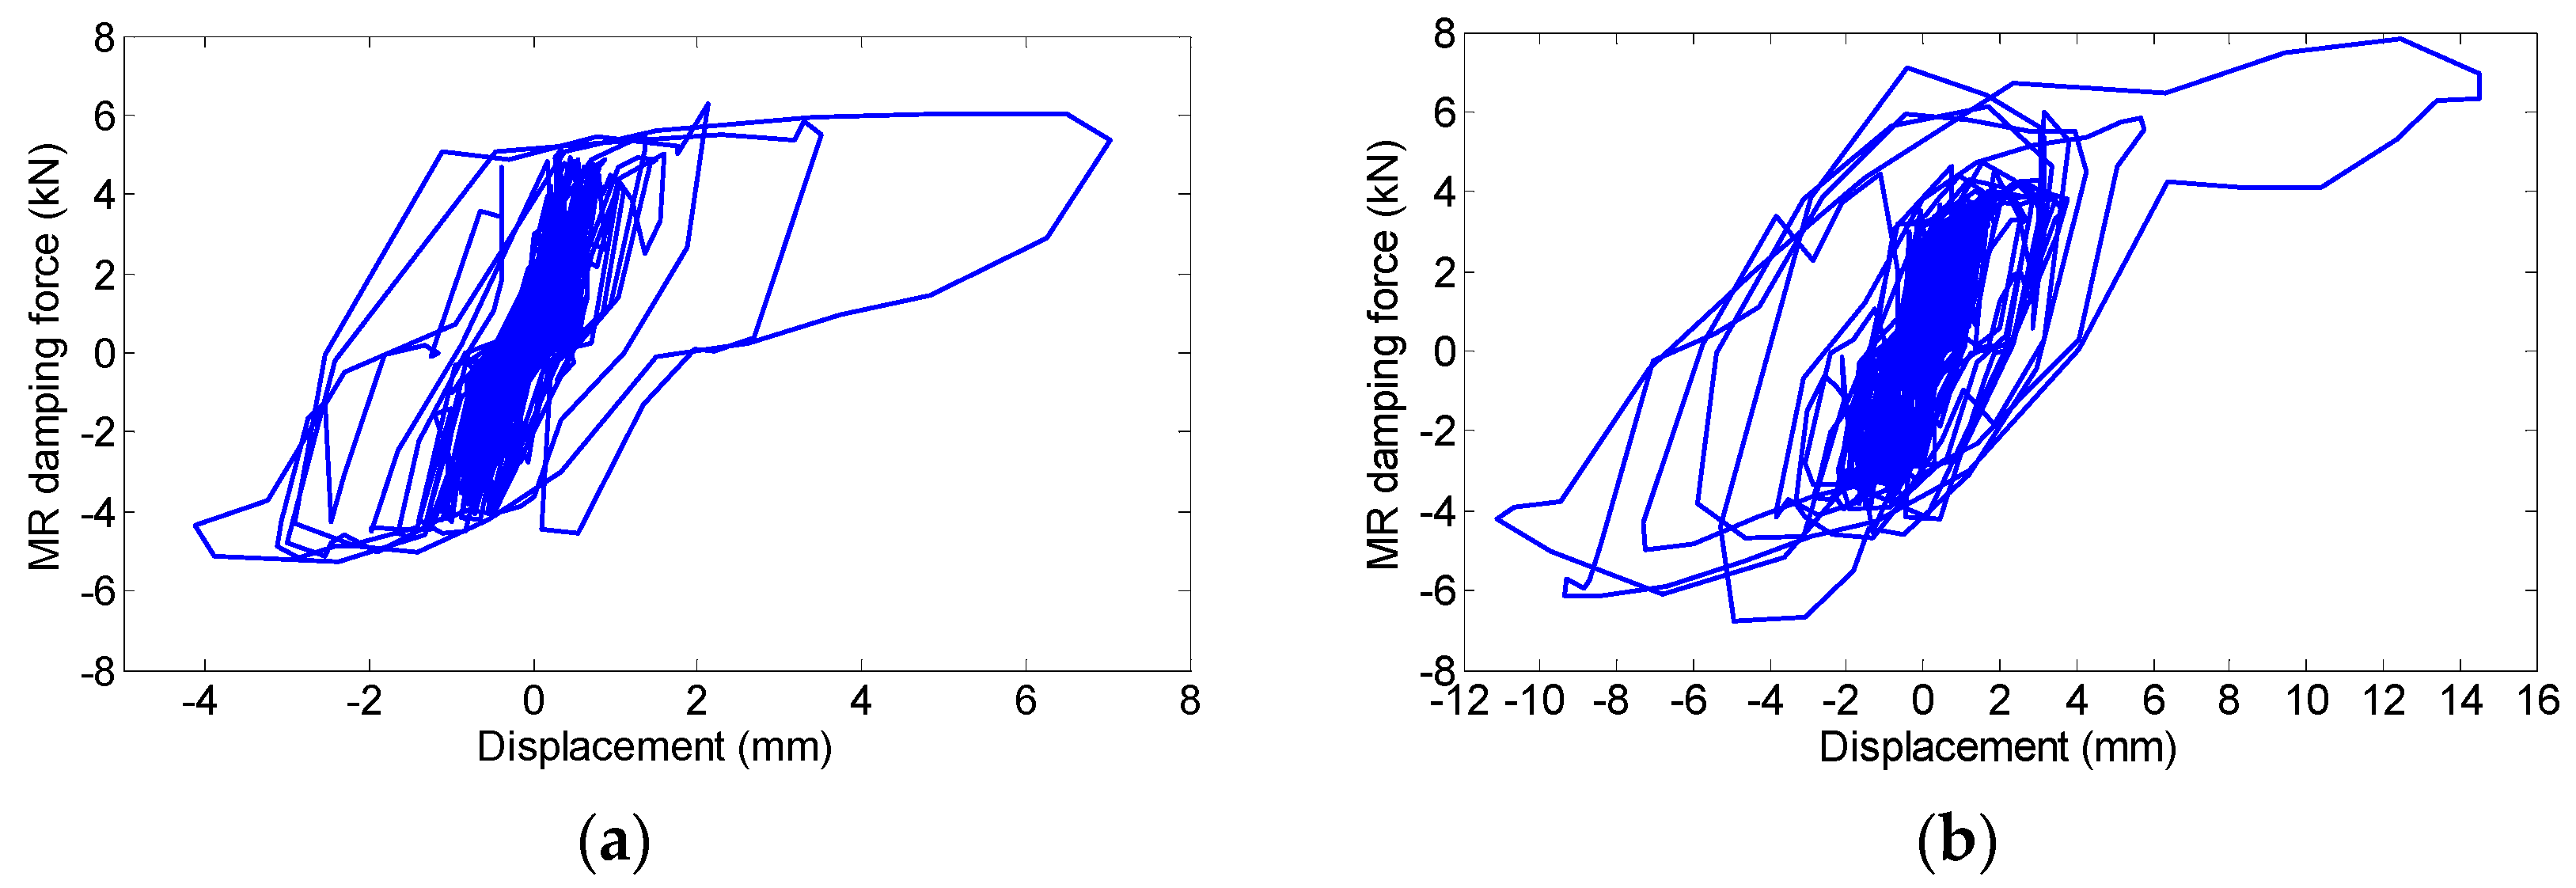
4.3. MR Damper Response

Figure 13 and Figure 14 illustrate the damper hysteresis curves with continuity control mode under the El Centro wave and Taft wave with fortification and rare intensities, respectively. It is known that the area enclosed by the hysteretic curve represents the energy dissipated by the MR damper. As observed from those curves shown in Figure 13 and Figure 14, the proposed control system is proven to effectively suppress the energy propagation upward under the different seismic scenarios. From the curve of damping force, it can be seen that the MR damper provides maximum damping force moment and seismic input peak close to the hysteretic curve of the damper to reduce energy consumption in order to reach the maximum response of the superstructure, namely, the El Centro wave and Taft wave with fortification and rare intensities. As a result, the energy transferred to the upper levels causing the secondary damages can be significantly mitigated.

4.4. Comparative Analysis of MR Isolation and LRB Isolation

For the same model, the isolation test with lead rubber bearing is completed in the literature [32]. Four lead rubber bearings (diameter 100 mm) were used in that shaking table experiment. General yield force for bearings is 8.652 kN. The shaking table test results are shown in Table 5 under different conditions.
Comparison with the displacement response of the isolation layer can be seen, wherein the isolation with MR dampers is significantly less than the passive isolation with the lead rubber bearing, both displaying maximum displacement of the isolation layer and the amplification factor of the upper acceleration. In this way the isolation system with MR dampers has the ability to resist the larger earthquakes. This shows that the MR isolation system has better vibration control performance with the passive lead rubber isolation.

5. Conclusions

In this paper, the numerical simulation and shaking table test are carried out for an isolation system with MR damper and rubber bearing by using a high-order single-step algorithm. Both the continuity and switch control strategies are examined. The main findings are summarized as follows:
(1)
The proposed isolation system can be applied to different site categories. The deformation corresponding to isolation layer can be effectively limited. Simultaneously, acceleration response of the superstructure can be reduced. Therefore, the smart isolation control system is shown to exhibit better control performance as compared with the traditional passive control method.
(2)
Energy dissipation paths can be adapted by MR dampers in accordance with varying earthquake input excitations, and variable damping can be provided for the isolation layer. From the acceleration reductions and the hysteresis curves, the seismic energy can be found to be effectively dissipated. Therefore, the design objective concerning the mitigation of secondary damages can also be fulfilled.
(3)
Restoring force can be provided by the rubber bearings to the isolation layer, thus the requirement of deformation limit of the isolation layer can be achieved under rare earthquakes.
(4)
The high-order single-step algorithm has the capability of real-time calculation of structural response. Therefore, time delay issues can be effectively addressed. The entire control process, including data acquisition, real-time calculation and the results updating can be achieved by the control system. The control effect is not affected by changes associated with external input.
(5)
The switch control strategy is found to be simple and reliable. The displacement response of isolation layer can be effectively controlled. Moreover, continuous regulated damping force can be achieved through a continuity control strategy. It is appropriate to consider the characteristics of MR dampers when instantaneous variable damping is needed.

Acknowledgments

The research is supported by the National Natural Science Foundation of China (Project No. 51678322, 51650110509 and 51578347), Natural Science Foundation of Heilongjiang Province (Project No. E2016053) and the Taishan Scholar Priority Discipline Talent Group program funded by the Shan Dong Province.

Author Contributions

Weiqing Fu and Chunwei Zhang developed the algorithm, conceived and designed the experimental works; Weiqing Fu, Chunwei Zhang, Li Sun, Mohsen Askari, Bijan Samali and Pezhman Sharafi investigated the control strategy and experimental implementation, Chunwei Zhang and Kwok Lun Chung analyzed the experimental data; Weiqing Fu drafted the manuscript, Chunwei Zhang, Li Sun and Kwok Lun Chung undertook the revision and editing.

Conflicts of Interest

The authors declare no conflict of interest.

References

  1. Kelly, J.M.; Leitmann, G.; Soldatos, A.G. Robust control of base-isolated structures under earthquake excitation. J. Optim. Theory Appl. 1987, 53, 159–180. [Google Scholar] [CrossRef]
  2. Jung, H.J.; Jang, D.D.; Lee, H.J.; Lee, I.W.; Cho, S.W. Feasibility test of adaptive passive control system using MR fluid damper with electromagnetic induction part. J. Eng. Mech. 2000, 136, 254–259. [Google Scholar] [CrossRef]
  3. Tsai, H.C.; Kelly, J.M. Seismic response of the superstructure and attached equipment in a base-isolated building. Earthq. Eng. Struct. Dyn. 1989, 18, 551–564. [Google Scholar] [CrossRef]
  4. Inaudi, J.A.; Kelly, J.M. Hybrid isolation systems for equipment protection. Earthq. Eng. Struct. Dyn. 1993, 22, 297–313. [Google Scholar] [CrossRef]
  5. Wu, M.; Samali, B. Shake table testing of a base isolated model. Eng. Struct. 2002, 24, 1203–1215. [Google Scholar] [CrossRef]
  6. Castaldo, P.; Palazzo, B.; Della, V.P. Seismic reliability of base-isolated structures with friction pendulum bearings. Eng. Struct. 2015, 95, 80–93. [Google Scholar] [CrossRef]
  7. Wang, Y.; McFarland, D.M.; Vakakis, A.F.; Bergman, L.A. Seismic base isolation by nonlinear mode localization. Arch. Appl. Mech. 2005, 74, 387–414. [Google Scholar] [CrossRef]
  8. Lu, L.Y.; Lin, G.L.; Kuo, T.C. Stiffness controllable isolation for near-fault seismic isolation. Eng. Struct. 2008, 30, 747–765. [Google Scholar] [CrossRef]
  9. Huang, B.; Zhang, H.; Wang, H.; Song, G. Passive base isolation with superelastic nitinol SMA helical springs. Smart Mater. Struct. 2014, 23, 065009. [Google Scholar] [CrossRef]
  10. Li, H.N.; Chang, Z.G.; Song, G. Studies on structural vibration control with MR dampers using mGA. Earthq. Eng. Eng. Vib. 2005, 4, 301–304. [Google Scholar] [CrossRef]
  11. Zhang, C. Control force characteristics of different control strategies for the wind-excited 76-story benchmark building structure. Adv. Struct. Eng. 2014, 17, 543–560. [Google Scholar]
  12. Zhang, C.; Ou, J. Control structure interaction of electromagnetic mass damper system for structural vibration control. ASCE Eng. Mech. 2008, 134, 428–437. [Google Scholar] [CrossRef]
  13. Ying, Z.G.; Ni, Y.Q.; Ko, J.M. A semi-active stochastic optimal control strategy for nonlinear structural systems with MR dampers. Smart Struct. Syst. 2009, 5, 69–79. [Google Scholar] [CrossRef]
  14. Yang, G.; Spencer, B.F.; Carlson, J.D.; Sain, M.K. Largescale MR fluid dampers: Modeling and dynamic performance considerations. Eng. Struct. 2002, 24, 309–323. [Google Scholar] [CrossRef]
  15. Choi, S.B.; Nam, M.H.; Lee, B.K. Vibration control of a MR seat damper for commercial vehicles. J. Intell. Mater. Syst. Struct. 2000, 11, 936–944. [Google Scholar] [CrossRef]
  16. Pierrick, J.; Ohayon, R.; Bihan, D. Semi-active control using magneto-rheological dampers for payload launch vibration isolation. In Proceedings of the Smart Structures and Materials 2006: Damping and Isolation SPIE 2006, San Diego, CA, USA, 26 February 2016. [Google Scholar]
  17. Bhaskararao, A.V.; Jangid, R.S. Seismic analysis of structures connected with friction dampers. Eng. Struct. 2006, 28, 690–703. [Google Scholar] [CrossRef]
  18. Bharti, S.D.; Dumne, S.M.; Shrimali, M.K. Seismic response analysis of adjacent buildings connected with MR dampers. Eng. Struct. 2010, 32, 2122–2133. [Google Scholar] [CrossRef]
  19. Calabrese, A.; Spizzuoco, M.; Serino, G.; Della Corte, G.; Maddaloni, G. Shake table investigation of a novel, low cost, base isolation technology using recycled rubber. Struct. Control Health Monit. 2014, 22, 107–122. [Google Scholar] [CrossRef]
  20. Caterino, N.; Spizzuoco, M.; Occhiuzzi, A. Promptness and dissipative capacity of MR dampers: Experimental investigations. Struct. Control Health Monit. 2013, 20, 1424–1440. [Google Scholar] [CrossRef]
  21. Maddaloni, G.; Caterino, N.; Occhiuzzi, A. Shake table investigation of a structure isolated by recycled rubber. Struct. Control Health Monit. 2016. [Google Scholar] [CrossRef]
  22. Lin, P.Y.; Roschke, P.N.; Loh, C.H. Hybrid base isolation with magnetorheological damper and fuzzy control. Struct. Control Health Monit. 2007, 14, 384–405. [Google Scholar] [CrossRef]
  23. Yoshioka, H.; Ramallo, J.C.; Spencer, B.F. “Smart” Base isolation strategies employing magnetorheological dampers. J. Eng. Mech. 2002, 128, 540–551. [Google Scholar] [CrossRef]
  24. Matsagar, V.A.; Jangid, R.S. Viscoelastic damper connected to adjacent structures involving seismic isolation. J. Civ. Eng. Manag. 2005, 11, 309–322. [Google Scholar] [CrossRef]
  25. Wang, H.; Zhang, Y.; Wang, W. The high order single step method for seismic response analysis of non-linear structures. Earthq. Eng. Eng. Vib. 1996, 16, 48–54. [Google Scholar]
  26. Wang, H.D.; Zhang, Y.S.; Wang, W. A high order single step-β method for nonlinear structural dynamic analysis. J. Harbin Inst. Technol. 2003, 10, 113–119. [Google Scholar]
  27. Zhang, C.; Ou, J. Evaluation Indices and Numerical Analysis on Characteristic of Active Control Force in Structural Active Mass Driver Control System. Pac. Sci. Rev. 2007, 9, 115–122. [Google Scholar]
  28. Zhang, C.; Ou, J.; Zhang, J. Parameter Optimization and Analysis of Vehicle Suspension System Controlled by Magnetorheological Fluid Dampers. Struct. Control Health Monit. 2006, 13, 885–896. [Google Scholar] [CrossRef]
  29. Zhang, C.; Ou, J. Improved semi-active control algorithm and simulation analysis for vibration reduction of structures using MR dampers. World Inf. Earthq. Eng. 2003, 19, 37–43. [Google Scholar]
  30. Code of China. Chinese Code for Seismic Design of Buildings; GB 50011-2010; Code of China: Beijing, China, 2010. [Google Scholar]
  31. Zhang, C.; Ou, J. Modeling and dynamical performance of the electromagnetic mass driver system for structural vibration control. Eng. Struct. 2015, 82, 93–103. [Google Scholar] [CrossRef]
  32. Wang, T. Research on the Overturn Effect of Rubber Isolation Structure. Ph.D. Thesis, Harbin Institute of Technology, Harbin, China, 2004. [Google Scholar]
Figure 1. Flow chart for the configuration of control system.
Applsci 07 00344 g001
Figure 2. Photo of the experimental structure model.
Applsci 07 00344 g002
Figure 3. Structure’s model dimension. (a) Secondary shock direction; (b) The main shock direction.
Applsci 07 00344 g003
Figure 4. Shear test of rubber bearing under axial pressures.
Applsci 07 00344 g004
Figure 5. Damper hysteretic curve under peak value of deflection 10 mm and 1-Hz sine wave.
Applsci 07 00344 g005
Figure 6. Damper hysteretic curve under peak value of deflection 20 mm and 0.5-Hz sine wave.
Applsci 07 00344 g006
Figure 7. Relation diagram for current and damping force.
Applsci 07 00344 g007
Figure 8. Sensors allocation scheme.
Applsci 07 00344 g008
Figure 9. Displacement time history of isolation layer under two earthquake waves and control modes: (a) E1-Centro wave under fortification intensity; (b) E1-Centro wave under rare intensity; (c) Taft wave under fortification intensity; (d) Taft wave under rare intensity.
Applsci 07 00344 g009
Figure 10. Acceleration time history of the fifth floor under continuity and switch modes: (a) El Centro wave under fortification intensity; (b) El Centro wave under rare intensity; (c) Taft wave under fortification intensity; (d) Taft wave under rare intensity.
Applsci 07 00344 g010
Figure 11. Acceleration peak curves under fortification intensity: (a) By continuity control mode; (b) By switch control mode.
Applsci 07 00344 g011
Figure 12. Acceleration peak curves under rare intensity. (a) By continuity control mode; (b) By switch control mode.
Applsci 07 00344 g012
Figure 13. Damper hysteretic curves for El Centro wave with (a) fortification intensity, and (b) rare intensity of earthquake.
Applsci 07 00344 g013
Figure 14. Damper hysteretic curves for Taft wave with (a) fortification intensity, and (b) rare intensity of earthquake.
Applsci 07 00344 g014
Table 1. The similar coefficient of the model.
Physical QuantitySymbolDimensionSimilar Coefficient
lengthSlL1/5
elastic modulusSEML−1T−21
stiffnessSkMT−21/5
accelerationSaL/T21
timeSTT 1 / 5
velocitySvL/T 1 / 5
displacementSxL1/5
massSmM1/25
Table 2. The basic parameters of designed rubber bearing.
Total Height87.5 mmThickness of Protective Layer5 mm
External diameter110 mmMiddle hole diameter18 mm
Height (excluding connection plate)63.5 mmRubber layer thickness1.5 mm
Effective diameter, D100 mmNo. of rubber layer15
Design bearing capacity75 kNTotal rubber thickness, Tr22.5 mm
Standard displacement (dmax)55 mmThick laminated sheet1.5 mm
maximum displacement23 mmThickness of connecting plate12 mm
Layers of laminated sheet14Sealing plate thickness10 mm
Design surface pressure10 MPa--
Table 3. Earthquake waves table in the experiment.
GroupDuration (s)Record Interval (s)Peak Acceleration (gal)Earthquake Occurrence Time (s)Seismic Wave Description
El-Centro waveX direction530.02341.695 (NS)2.12The seismic wave is recorded in El Centro city, California, USA.
Y direction210.142 (EW)11.44
Z direction−206.34 (UD)0.98
Taft waveX direction540.02175.9 (NS)9.3The seismic wave is recorded in Kern County, California, USA.
Y direction152.7 (EW)9.1
Z direction102.9 (UD)9.76
Tianjing waveX direction190.01145.805 (NS)7.65The seismic wave is recorded in Tianjin city, PRC.
Y direction104.18 (EW)7.59
Z direction73.14 (UD)9.03
Table 4. Peak value of story drift under different intensities and seismic waves (mm).
Earthquake MagnitudeFortification IntensityRare Intensity
Earthquake WaveEl Centro WaveTaft WaveTianjin WaveEl Centro WaveTaft Wave
Control StrategyCMSMCMSMCMCMSMCMSM
Isolation Layer3.80 (3.6) 2.87 (2.93)7.04 (8.52)5.61 (9.3)30.52 (25.1)15.18 (15.2)10.4 (11.7)14.5 (18.5)13.0 (15.3)
1st storey2.141.752.233.54.593.533.833.314.21
2nd storey1.381.221.031.743.912.762.531.572.18
3rd storey1.181.091.201.623.632.162.451.902.39
4th storey1.010.901.101.452.371.481.951.542.03
5th storey0.860.750.871.411.491.881.951.471.87
6th storey0.720.840.550.841.461.001.420.891.35
Table 5. Peak value for structure acceleration and isolation layer displacement response under lead rubber bearing (LRB) isolation and seismic level 8.
El-Centro WaveTaft Wave
The Earthquake WaveFortification IntensityRare IntensityFortification Intensity
Table acceleration peak−0.3510.727−0.368
Acceleration peak value of the first layer−0.281−0.596−0.503
Acceleration peak value for fifth layer −0.440−0.662−0.662
Acceleration amplification factor for structure fifth layers(LRB) 1.2540.911.79
Acceleration amplification factor for structure fifth layers(MR)0.890.640.69
Isolation layer displacement(LRB)8.3824.1514.36
Isolation layer displacement(MR)3.8015.187.04

