Article

Viscosity Prediction of Different Ethylene Glycol/Water Based Nanofluids Using a RBF Neural Network

College of Power and Energy Engineering, Harbin Engineering University, Harbin 150001, China
*
Author to whom correspondence should be addressed.
Appl. Sci. 2017, 7(4), 409; https://doi.org/10.3390/app7040409
Submission received: 15 March 2017 / Revised: 8 April 2017 / Accepted: 14 April 2017 / Published: 18 April 2017
(This article belongs to the Special Issue Recent Developments of Nanofluids)

Abstract

:
In this study, a radial basis function (RBF) neural network with three-layer feed forward architecture was developed to effectively predict the viscosity ratio of different ethylene glycol/water based nanofluids. A total of 216 experimental data involving CuO, TiO2, SiO2, and SiC nanoparticles were collected from the published literature to train and test the RBF neural network. The parameters including temperature, nanoparticle properties (size, volume fraction, and density), and viscosity of the base fluid were selected as the input variables of the RBF neural network. The investigations demonstrated that the viscosity ratio predicted by the RBF neural network agreed well with the experimental data. The root mean squared error (RMSE), mean absolute percentage error (MAPE), sum of squared error (SSE), and statistical coefficient of multiple determination (R2) were respectively 0.04615, 2.12738%, 0.46007, and 0.99925 for the total samples when the Spread was 0.3. In addition, the RBF neural network had a better ability for predicting the viscosity ratio of nanofluids than the typical Batchelor model and Chen model, and the prediction performance of RBF neural networks were affected by the size of the data set.

1. Introduction

As a very important heat transfer medium, ethylene glycol/water mixtures are widely used in many different kinds of industrial equipment including car radiators, air conditioning systems, and liquid cooled computers [1]. In the past few decades, with the rapid development of various compact heat exchange components, the conventional ethylene glycol/water mixtures have been unable to effectively meet the ever-increasing demand for cooling due to their lower thermal conductivity. Therefore, how to develop enhanced heat transfer technology has become a very important problem in the fields of thermal engineering [2].
Nanofluids, a special liquid-solid mixture containing a base fluid and nanoparticles (usually less than 100 nm), have drawn increasing attention recently because of their advantages in thermal conductivity and stability [3]. Many investigations indicated that nanofluids could be an effective technology to improve the heat transfer performance of systems using ethylene glycol/water mixtures as coolant [4]. For example, the experimental results of Vajjha and Das [5] showed that at the temperature of 299 K, the thermal conductivities of the 60:40 (by weight ratio) ethylene glycol/water mixture could be increased by about 12.3% by adding ZnO nanoparticles (29 nm) with a volume fraction of 2%. Sundar et al. [6] experimentally investigated the effects of Fe3O4 nanoparticles (13 nm) on three different kinds of ethylene glycol/water mixtures with weight ratios of 20:80, 40:60, and 60:40. They found that at the temperature of 60 °C and the nanoparticle volume fraction of 2%, the thermal conductivity enhancements of the above three ethylene glycol/water mixtures were 46%, 42%, and 33%, respectively.
Thermo-physical parameters are very important factors that affect the heat and mass transfer performance of nanofluids [7,8,9]. Due to the fact that viscosity can significantly affect the flow internal resistance, inlet Reynolds number, and pressure drop, many experimental investigations have been carried out regarding the viscosity of different nanofluids. As reported by Azmi et al. [10], the viscosity of the 40:60 (by volume ratio) ethylene glycol/water mixture could be increased obviously by dispersing TiO2 nanoparticles. For example, the viscosity enhancement was about 12% when the nanoparticle volume fraction changed from 0.5% to 1.5%. Sundar et al. [11] investigated the viscosity variations of Fe3O4-ethylene glycol/water nanofluids with different nanoparticle fractions and working temperatures. Their experimental results indicated that the viscosity of ethylene glycol/water based nanofluids could be increased by increasing the nanoparticle volume fraction and decreasing temperature. At a nanoparticle volume fraction of 1%, the viscosity of the base fluid could be enhanced by 2.9 times. Chen et al. [12], Jamshidi et al. [13], Kulkarni et al. [14], Rudyak et al. [15], Namburu et al. [16], Lim et al. [17], Chiam et al. [18], and Li et al. [19] respectively measured the viscosity of various ethylene glycol/water mixture based nanofluids with the effects of different factors. According to their experimental results, it was found that a suspension of nanoparticles could enhance the viscosity of the base fluid in different degrees. Additionally, temperature, base fluid, and nanoparticle properties including volume fraction, size, type, and shape were the important factors affecting the enhancement of nanofluids’ viscosity.
For the basis of the experimental research, the modeling and prediction of viscosity is also very important for understanding the rheological behavior of nanofluids. Murshed and Estellé [20] reviewed the latest developments of viscosity models for nanofluids. Their analysis indicated that although many theoretical models and empirical correlations have been developed for nanofluid viscosity, only a few of them were used for ethylene glycol/water based nanofluids. Additionally, since the effects of different factors on nanofluid viscosity were usually coupled and uncertain, it was still very difficult to accurately describe the viscosity characteristics of different nanofluids in a wide range of nanoparticle volume fractions, sizes, temperatures, etc. Therefore, how to develop an effective solution for the viscosity prediction of nanofluids is a hot topic in the field of nanofluids.
Artificial neural networks (ANN), a black box data analysis approach, has a strong nonlinear mapping ability to establish the relationship between input and output variables without considering the detailed physical process. Due to the advantages of ANNs such as high speed, simplicity, and large capacity, various ANNs were put forward to solve the modeling and prediction problems of nanofluid viscosity [
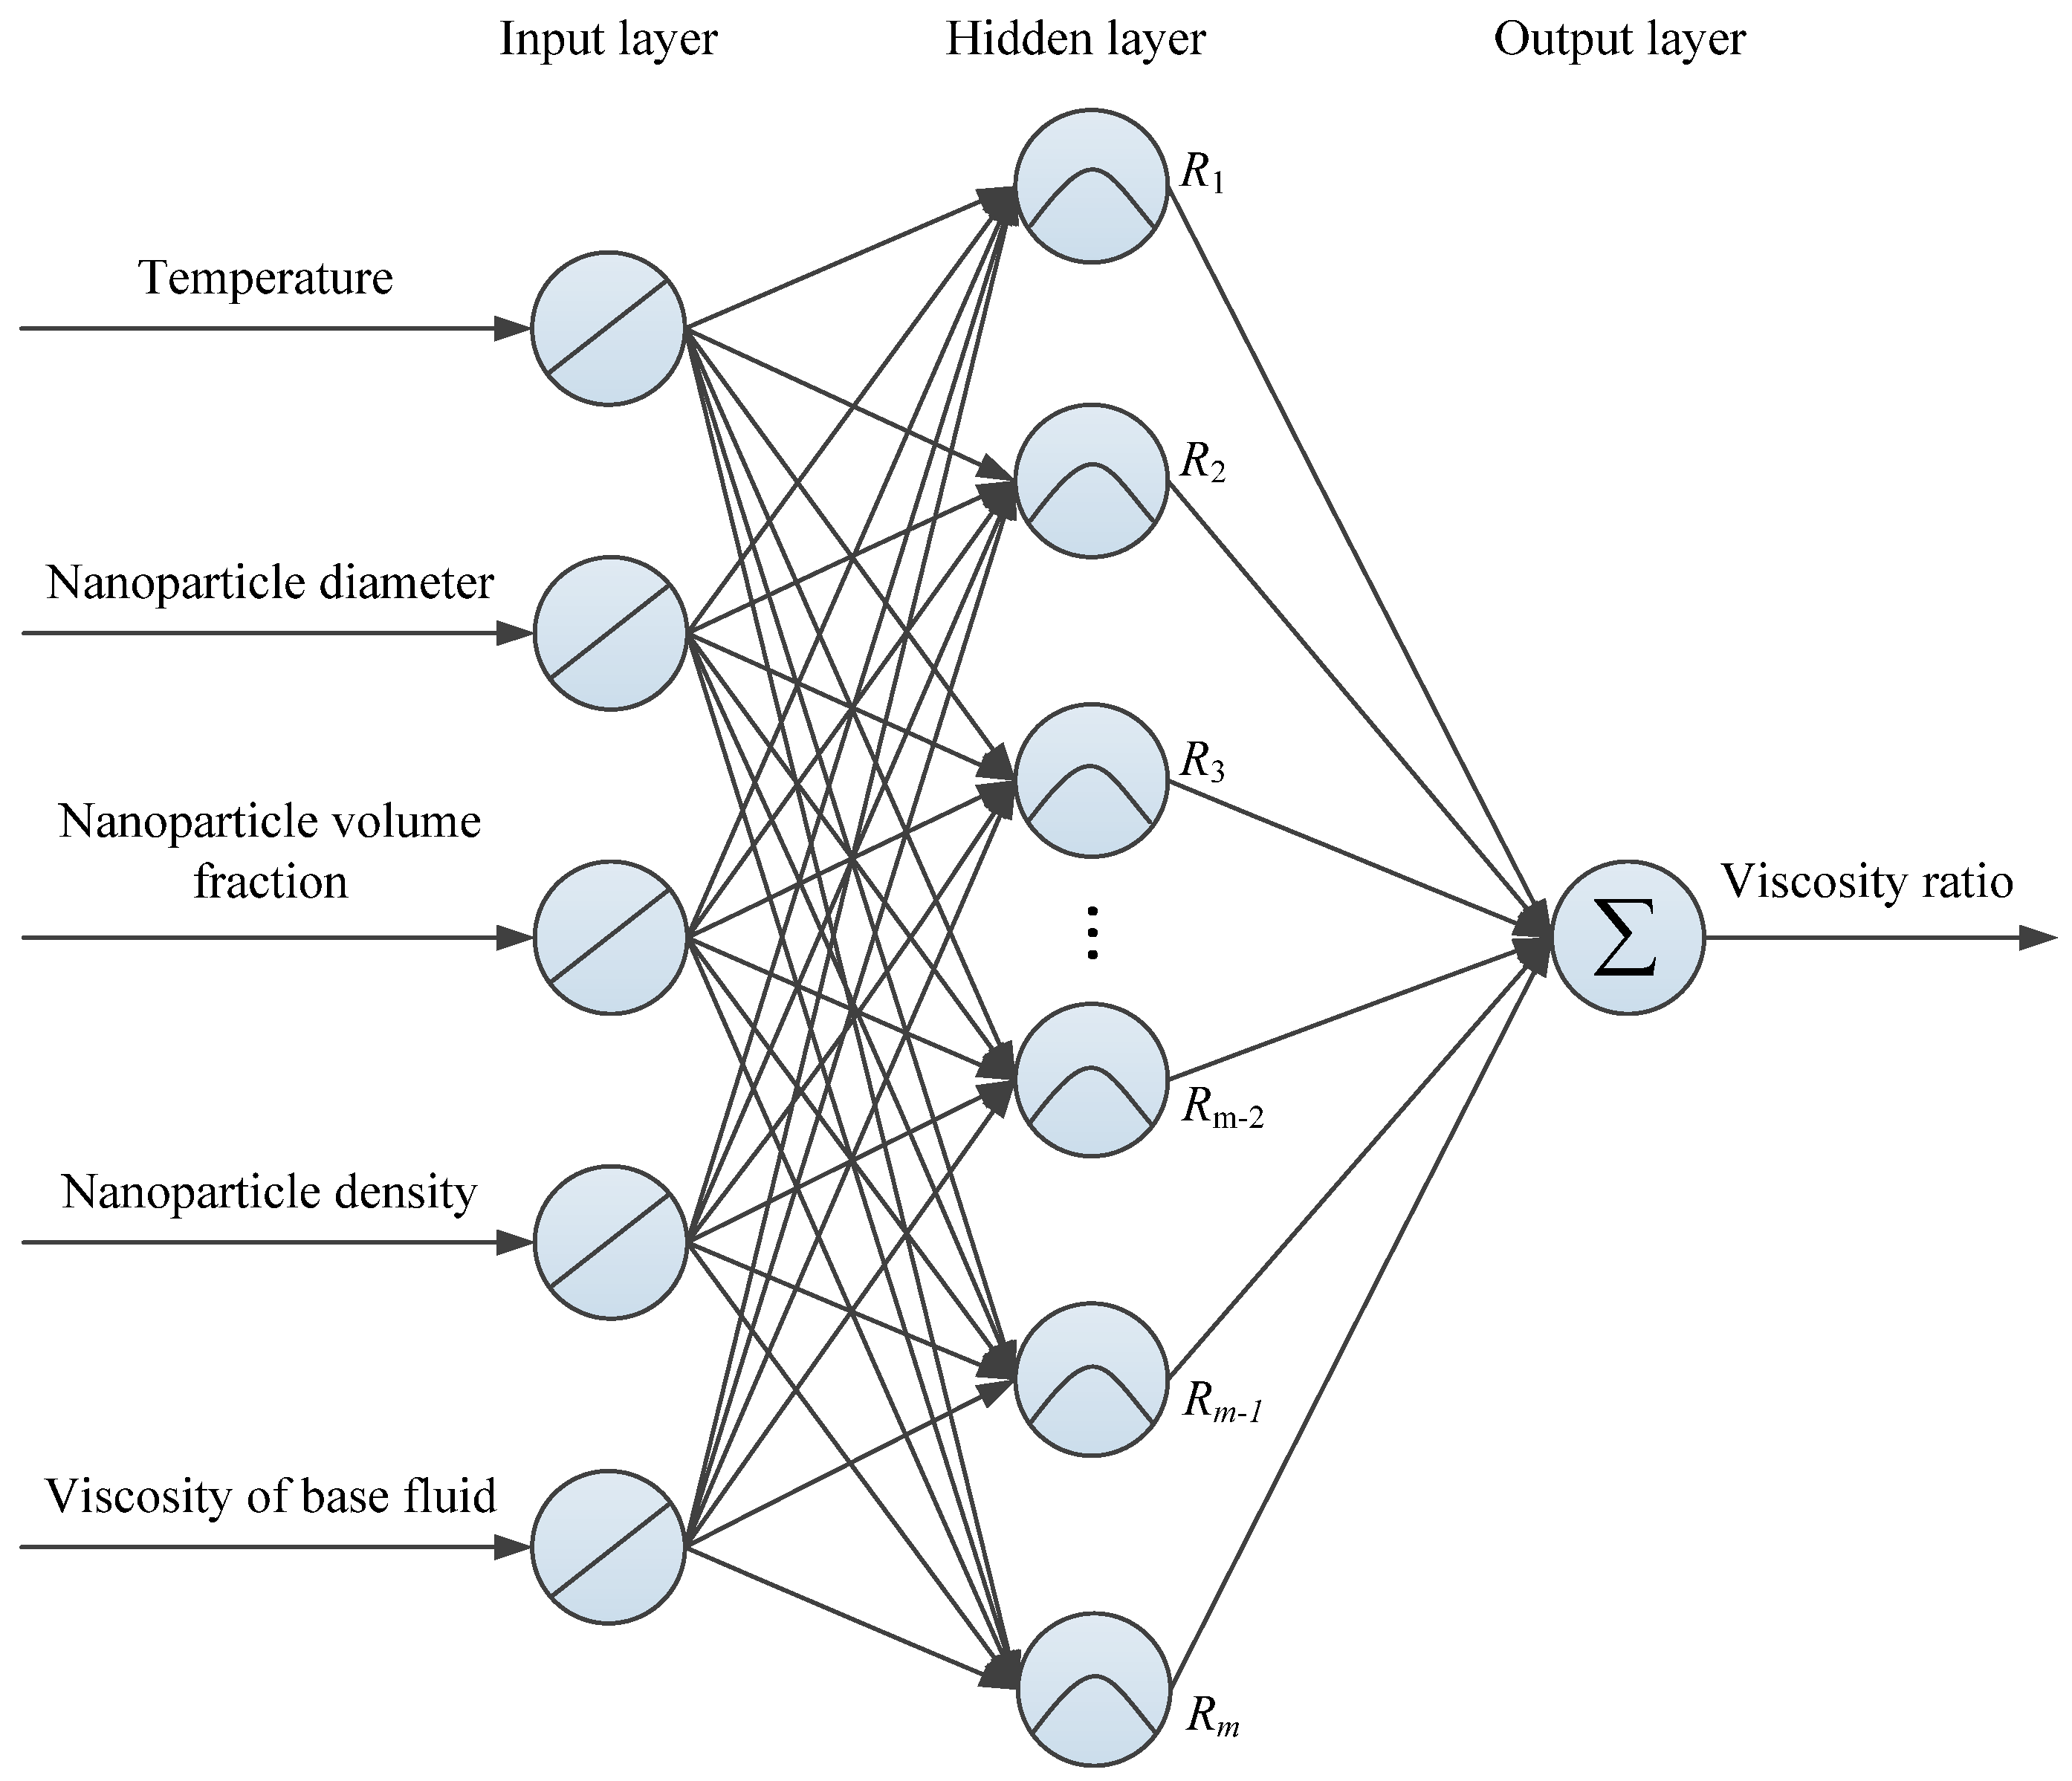
21]. Selecting five variables (temperature, nanoparticle volume fraction, nanoparticle size, viscosity of the base fluid, and relative density of the base fluid) and nanoparticles as the input, Yousefi et al. [22] developed a diffusional neural network (DNN) to predict the viscosity of six different types of nanofluids. As reported in their analysis, DNN could be used for predicting the viscosity of nanofluids with satisfactory accuracy. On this basic, Mehrabi et al. [23] analyzed the application of a Fuzzy C-Means-based Adaptive neuro-fuzzy inference system (FCM-ANFIS) for the viscosity prediction of various water based nanofluids. They found that the FCM-ANFIS predicted values agreed well with the experimental data. Attracted by the better nonlinear mapping and recognition abilities of ANN, Zhao et al. [24,25] investigated the feasibility of RBF neural networks for predicting the viscosity of two water based nanofluids containing Al2O3 and CuO nanoparticles. Their results demonstrated that ANN was an effective tool in comparison with the traditional model-based approach for describing the enhancement behavior of nanofluid viscosity. They indicated that the addition of temperature as an input variable could improve the prediction performance of the RBF neural network.
To the best of the authors’ knowledge, there are few publications that study the modeling and prediction of different ethylene glycol/water based nanofluids using ANN. Considering the advantages of RBF neural networks that are easier to design, and have faster training speed, higher training accuracy, stronger generalization ability, and stronger tolerance for input noise [26], this paper selects a RBF neural network as a competitive method for predicting the viscosity characteristics of different ethylene glycol/water based nanofluids with different influence factors. Firstly, the basis theory and modeling process of the RBF neural network are introduced briefly. On this basis, the available measurements from various published studies are obtained to establish the data sample sets and train the RBF neural network for determining the network configuration. Finally, the RBF neural networks’ predicted results are compared with the experimental data to evaluate the prediction performance of the proposed model.

2. Basic Theory of a RBF Neural Network

Benefiting from the inspiration of the human brain’s structure and activity mechanism, many different artificial neural networks have been developed for different purposes including classification and regression. In the fields of curve-fitting and nonlinear predictive modeling, the RBF neural network proposed by Broomhead and Lowe [27] can exhibit a good ability because of its high accuracy and stability [28].
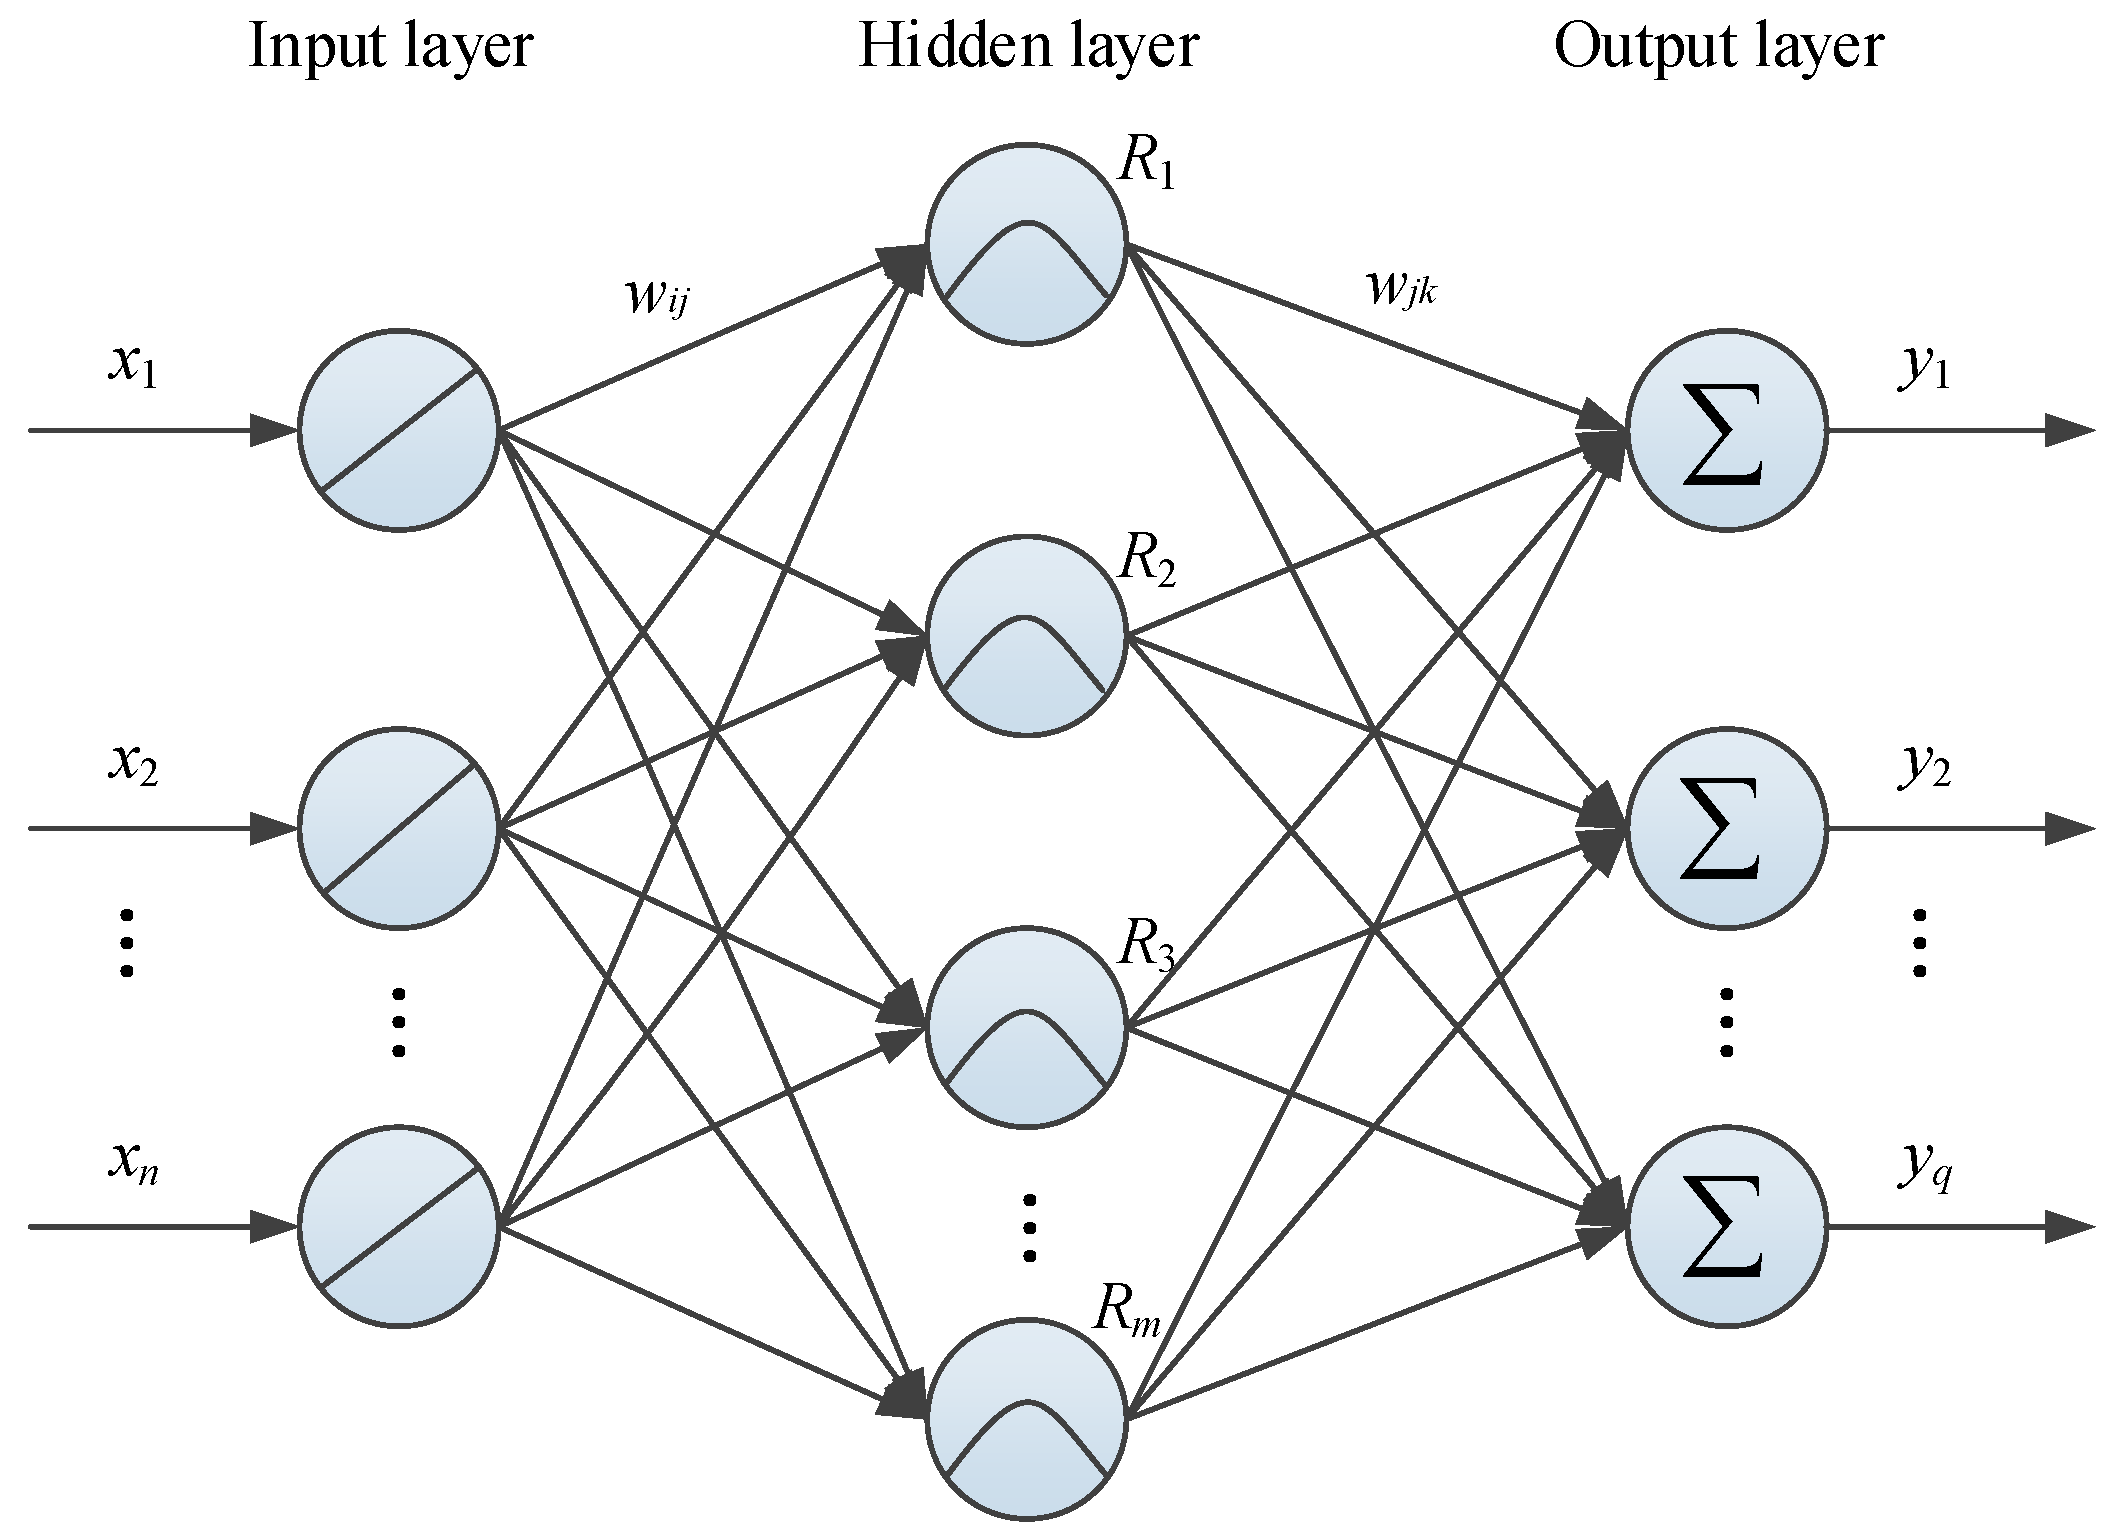
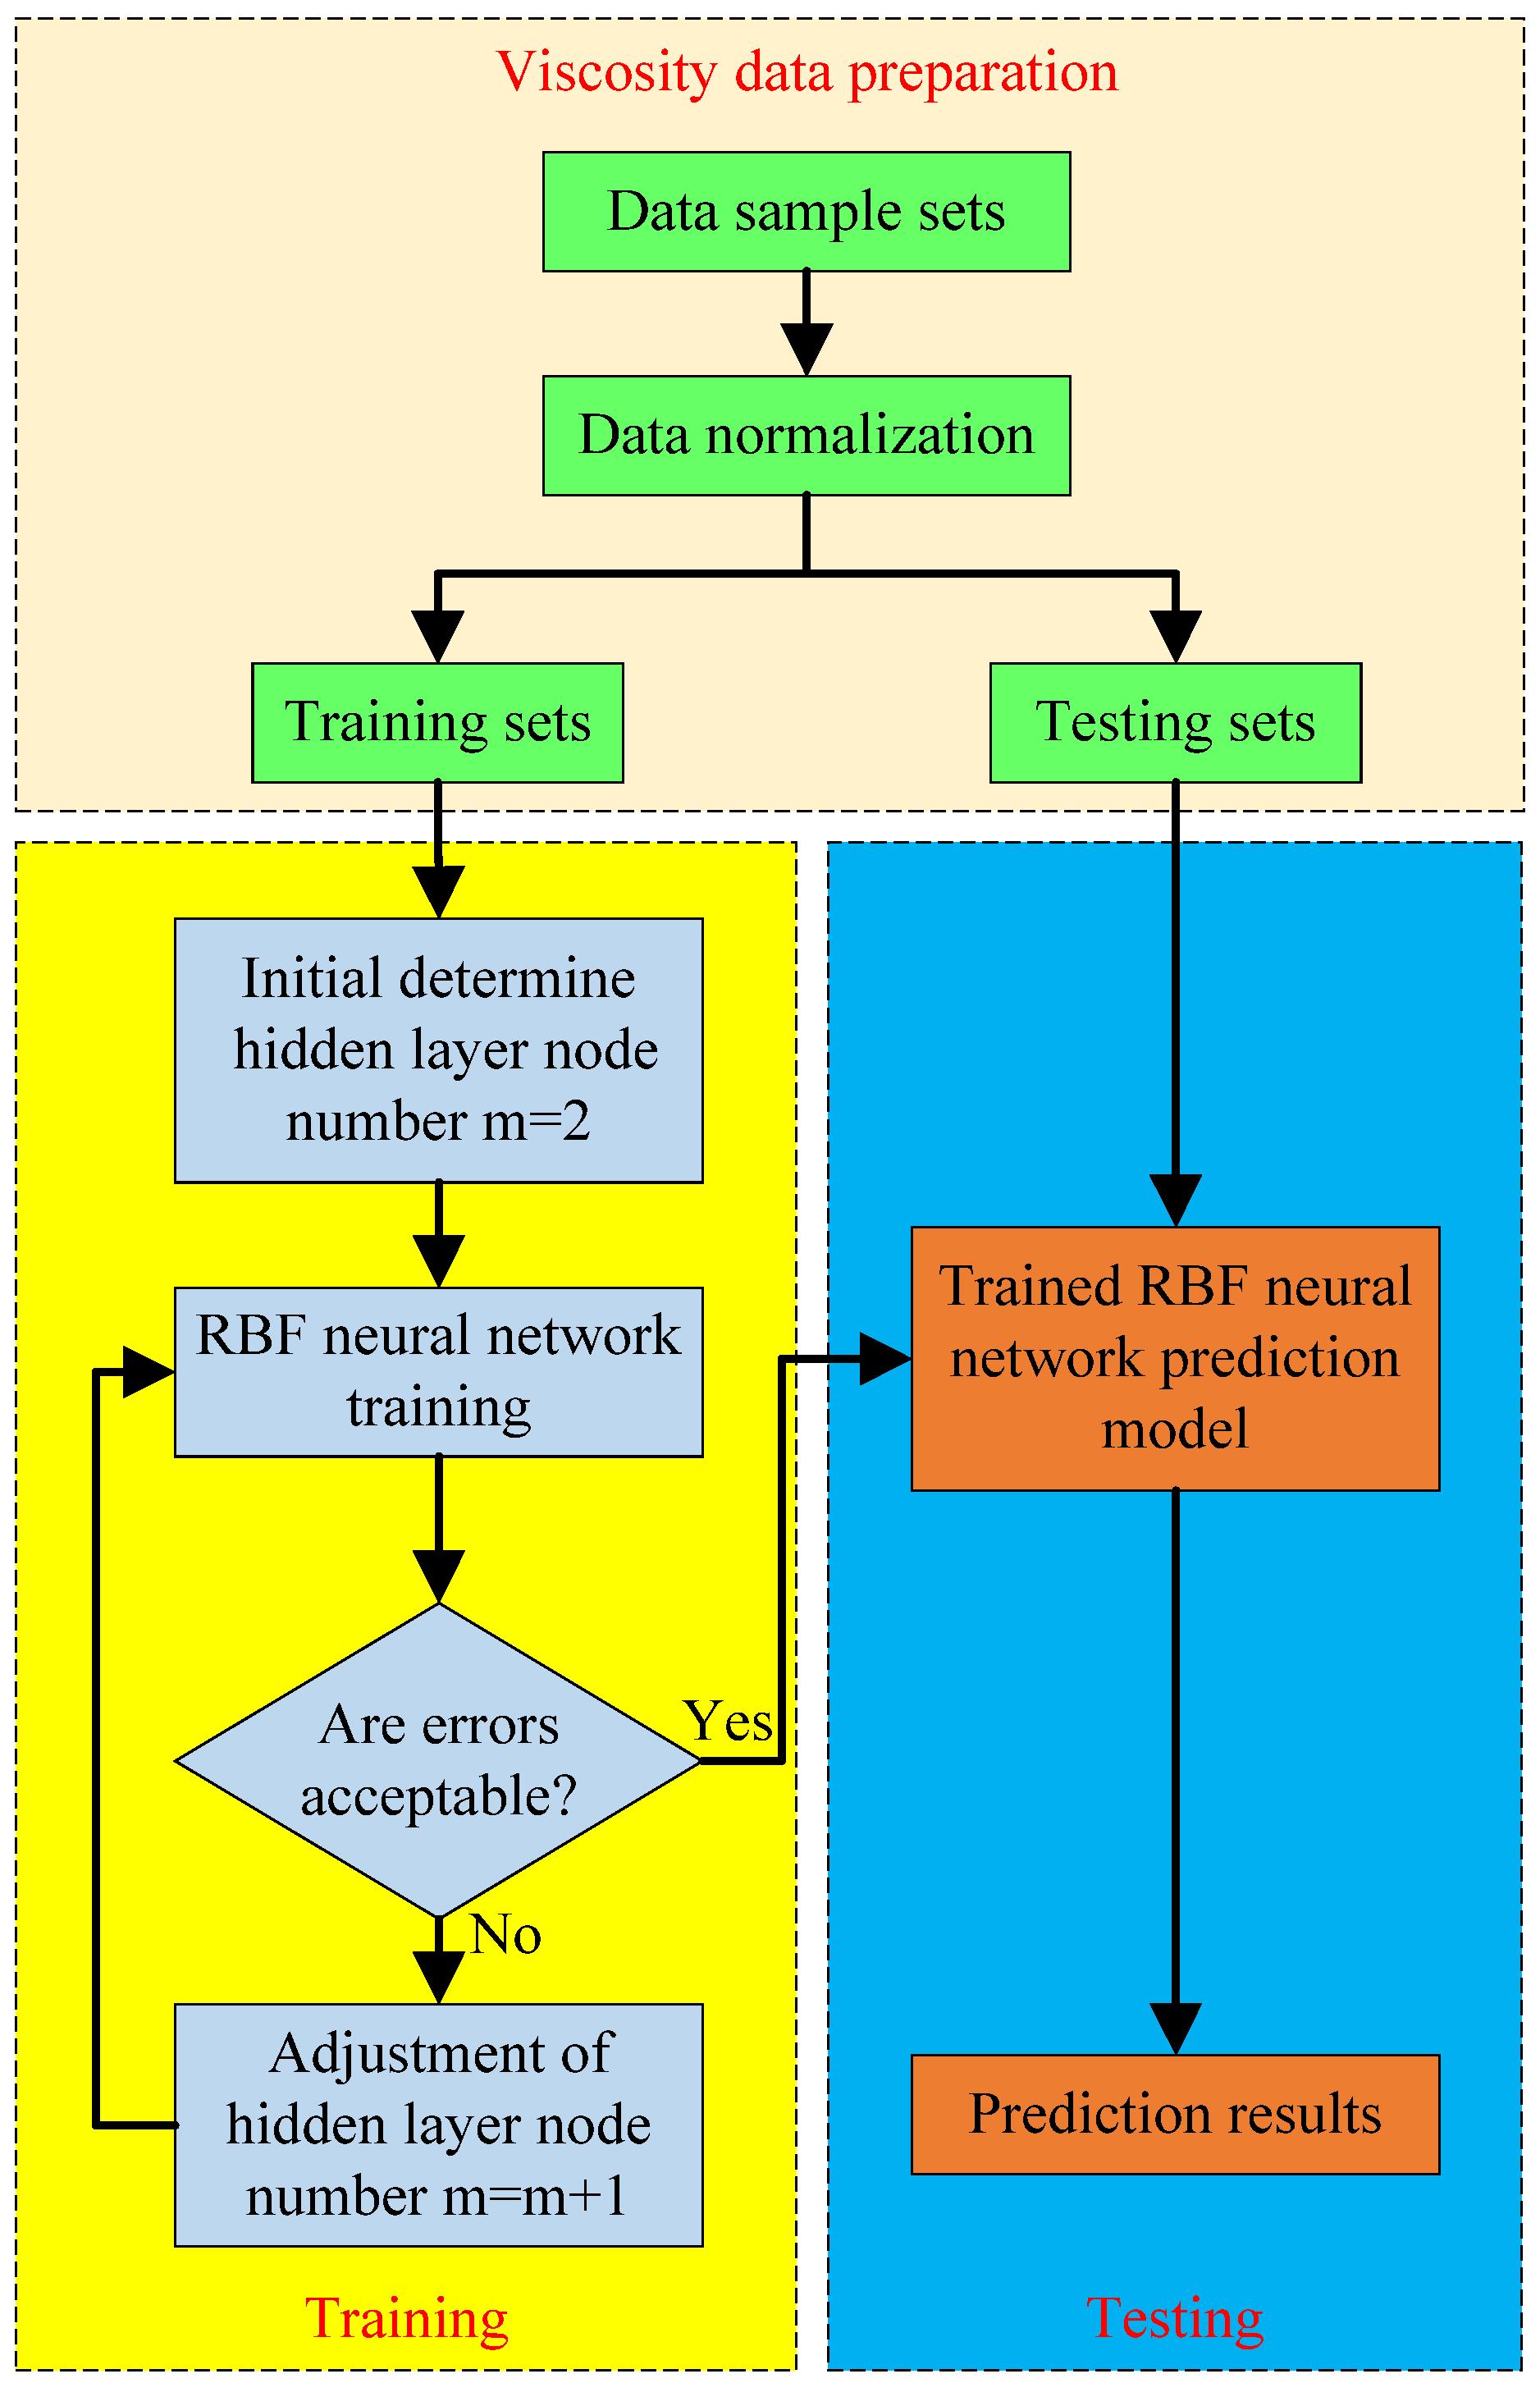
Figure 1 presents the basic structure of a typical three-layer RBF neural network. The input and output layers respectively correspond to the dendrite and synapse of biological neurons, which are used to mathematically describe the modeling object. The hidden layer, similar to the function of the cyton, plays a role of intermediation to process the input-output information and deliver it to the output layer. The connections between different layers are established through a series of artificial neurons and weights.
Theoretically, the modeling process of the RBF neural network is to solve the mapping from X n to Y q ( n , q 1 ) in Euclidean space. Assuming that the input vector of the RBF neural network is X , the response of the k th neuron in the output layer ( y k Y q ) can be obtained by using the following linear weighting function [29].
y k = j = 1 m ω j k R j ( X ) , ( k = 1 , 2 , , q )
where ω j k is the connection weight between the j th hidden layer neuron and the k th output layer neuron. m and q are the numbers of neurons in the corresponding layer, respectively.
Different from many other ANNs, the response of the RBF neural network’s j th hidden layer neuron is usually determined by the RBF. When it selects a Gaussian function, the corresponding R j ( X ) can be defined as,
R j ( X ) = exp ( X c j 2 2 σ j 2 ) , ( j = 1 , 2 , , m )
where is the Euclidean distance between the input vector X and the j th neuron center c j . σ j is the width of the j th neuron.
Analyzing Equations (1) and (2), it can be easily found that the key of RBF neural network training is how to determine ω j k , c j , and σ j . In the past few decades, different unsupervised and supervised algorithms have been developed to solve this problem [30]. In this study, the network parameters are updated by using an orthogonal least squares (OLS) approach, of which the minimizing function is shown in Equation (3). More detailed information about OLS can be found in [31].
min J = k = 1 q ( | y n k y d k | 2 )
where y n k and y d k are the network output and desired output of the k th output layer node, respectively.

3. Modeling Implementation of a RBF Neural Network

According to the above theory, the modeling process of the RBF neural network involves three main parts which are data preparation, training, and testing. Figure 2 depicts the basic applied flow chart of the RBF neural network for predicting the relative viscosity of ethylene glycol/water based nanofluids. The specific implementations are discussed in the following.

3.1. Preparation of Viscosity Data

As previously mentioned, many experimental investigations have been published to discuss the effects of different factors including temperature and nanoparticle properties (such as type, size, concentration, and shape) on the viscosity of ethylene glycol/water based nanofluids. Considering the integrity of the measuring information, a total of 216 viscosity data involving TiO2, CuO, SiO2, and SiC are obtained to establish the sample sets. The detailed information of the nanofluids regarding nanoparticle diameter ( d p ), nanoparticle volume fraction (φp), nanoparticle density ( ρ p ), temperature ( T ), and viscosity of the base fluid ( μ f ) and nanofluids ( μ n f ) are listed in Table 1. According to the modeling principle, 198 data (about 90%) are selected to train the RBF neural network, and the remaining 18 data (about 10%) are used to test the performance of the trained RBF neural network.
To improve the learning and training performances of the RBF neural network, the following equation is used to normalize the input and output variables.
x ' = x x min x max x min
where x is the original value, x’ is the normalized value, and x max and x min are the corresponding maximum and minimum of x.

3.2. Configuration of a RBF Neural Network

Considering the nonlinear characteristics of the ethylene glycol/water based nanofluid viscosity ratio with different factors, a three layer RBF neural network is developed in the present investigation. Temperature, nanoparticle diameter, nanoparticle volume fraction, nanoparticle density, and viscosity of the base fluid are selected as the input variables. The objective output of the RBF neural network is the viscosity ratio between the nanofluids and the base fluid. Therefore, the basic structure of the developed RBF neural network for predicting the viscosity ratio of ethylene glycol/water based nanofluids is 5-m-1, as illustrated in Figure 3. For the neurons, the numbers in the hidden layer (m) and other parameters are determined in the training process.

3.3. Evaluation Criteria

To effectively evaluate the training and prediction performance of the RBF neural network, the following four important parameters are used.
Root mean squared error (RMSE),
R M S E = ( 1 t l = 1 t | P l Q l | 2 ) 1 / 2
Mean absolute percentage error (MAPE),
M A P E = 100 % t l = 1 t | P l Q l P l |
Sum of squared error (SSE),
S S E = l = 1 t ( P l Q l ) 2
Statistical coefficient of multiple determination (R2),
R 2 = 1 l = 1 t ( P l Q l ) 2 l = 1 t ( P l ) 2
where P is the desired value, Q is the network output value, and t is the number of samples.

4. Results and Discussion

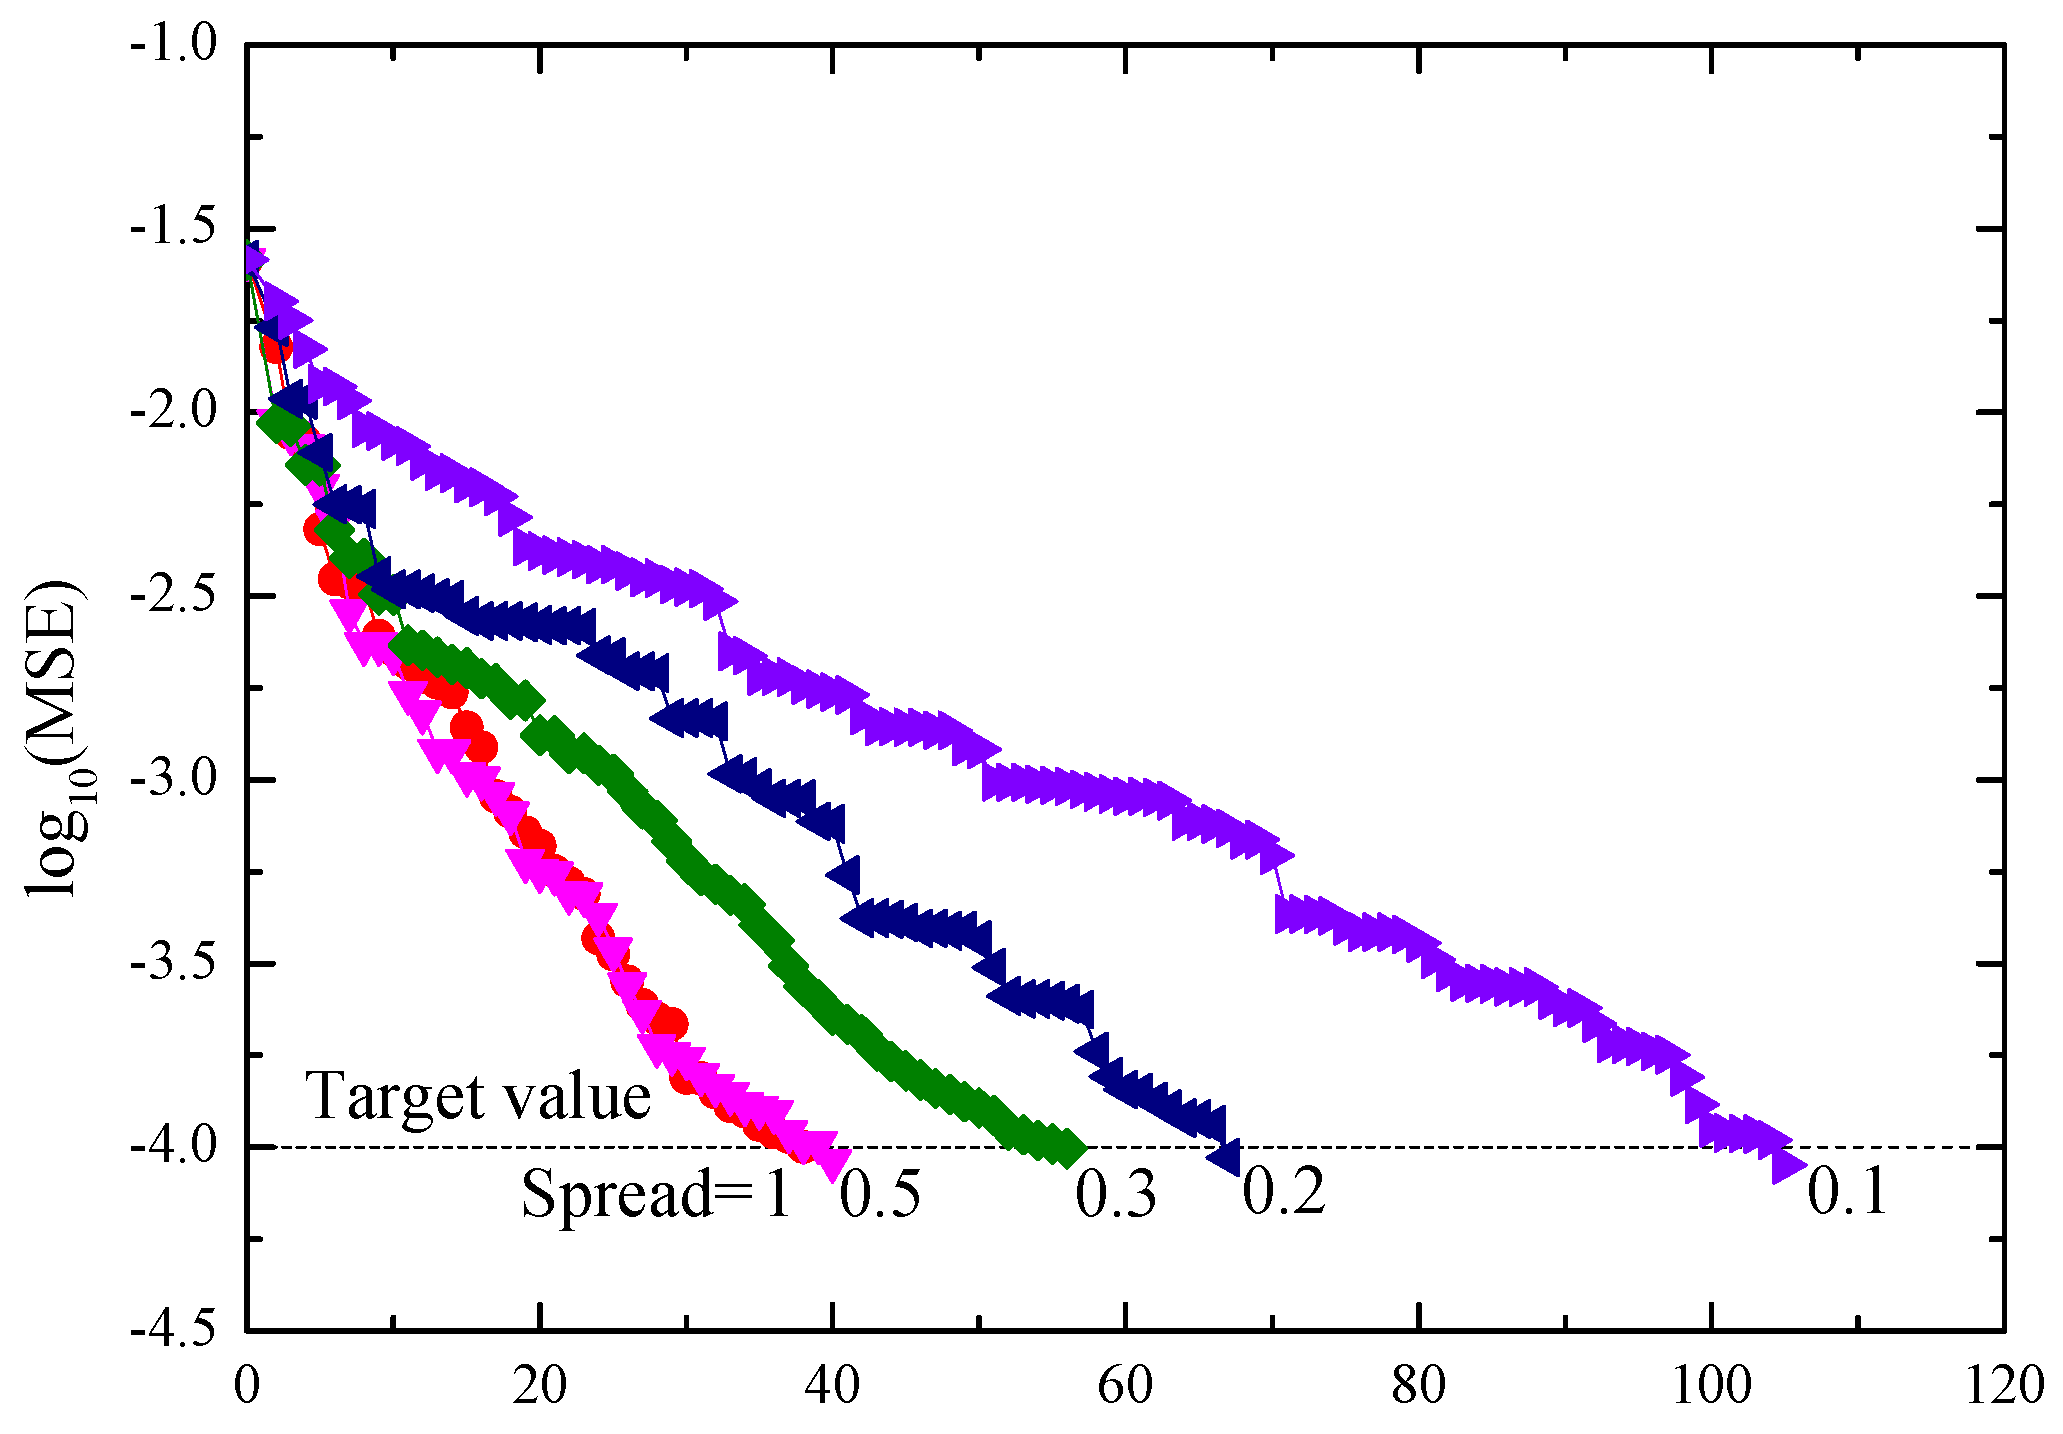
For the RBF neural network, the Spread is usually a very important factor influencing the training process. Figure 4 shows the relationships of the mean square error (MSE) and the number of hidden layer neurons with different Spreads. Analyzing the results reported in Figure 4, it is found that for the same converged target, the neuron numbers in the hidden layer need to be increased obviously with the decrease of the Spread. When the Spread varies from 1 to 0.1, the corresponding neuron configuration of the RBF neural network are 5-38-1, 5-40-1, 5-56-1, 5-67-1, and 5-105-1, respectively. With the decrease of the Spread, the CPU time for computing the RBF neural network will also increase. At a Spread of 1, 0.5, 0.3, 0.2, and 0.1, the corresponding CPU times are 6.318, 6.396, 8.798, 10.827, and 15.772 s, respectively. In addition, Table 2 lists the values of four evaluation criteria for predicting the viscosity ratio of ethylene glycol/water based nanofluids by using the RBF neural network with different Spreads. It can be seen from Table 2 that although all R 2 are within the acceptable level of 0.99, the prediction performance of the RBF neural network is still affected by the value of the Spread, especially for the testing samples. Based on the comprehensive considerations of modeling complexity, prediction accuracy, and CPU time, the RBF neural network with the neuron configuration of 5-56-1 and Spread of 0.3 is used in this study. The related weights and biases of the 5-56-1 RBF neural network can be found in Table 3.
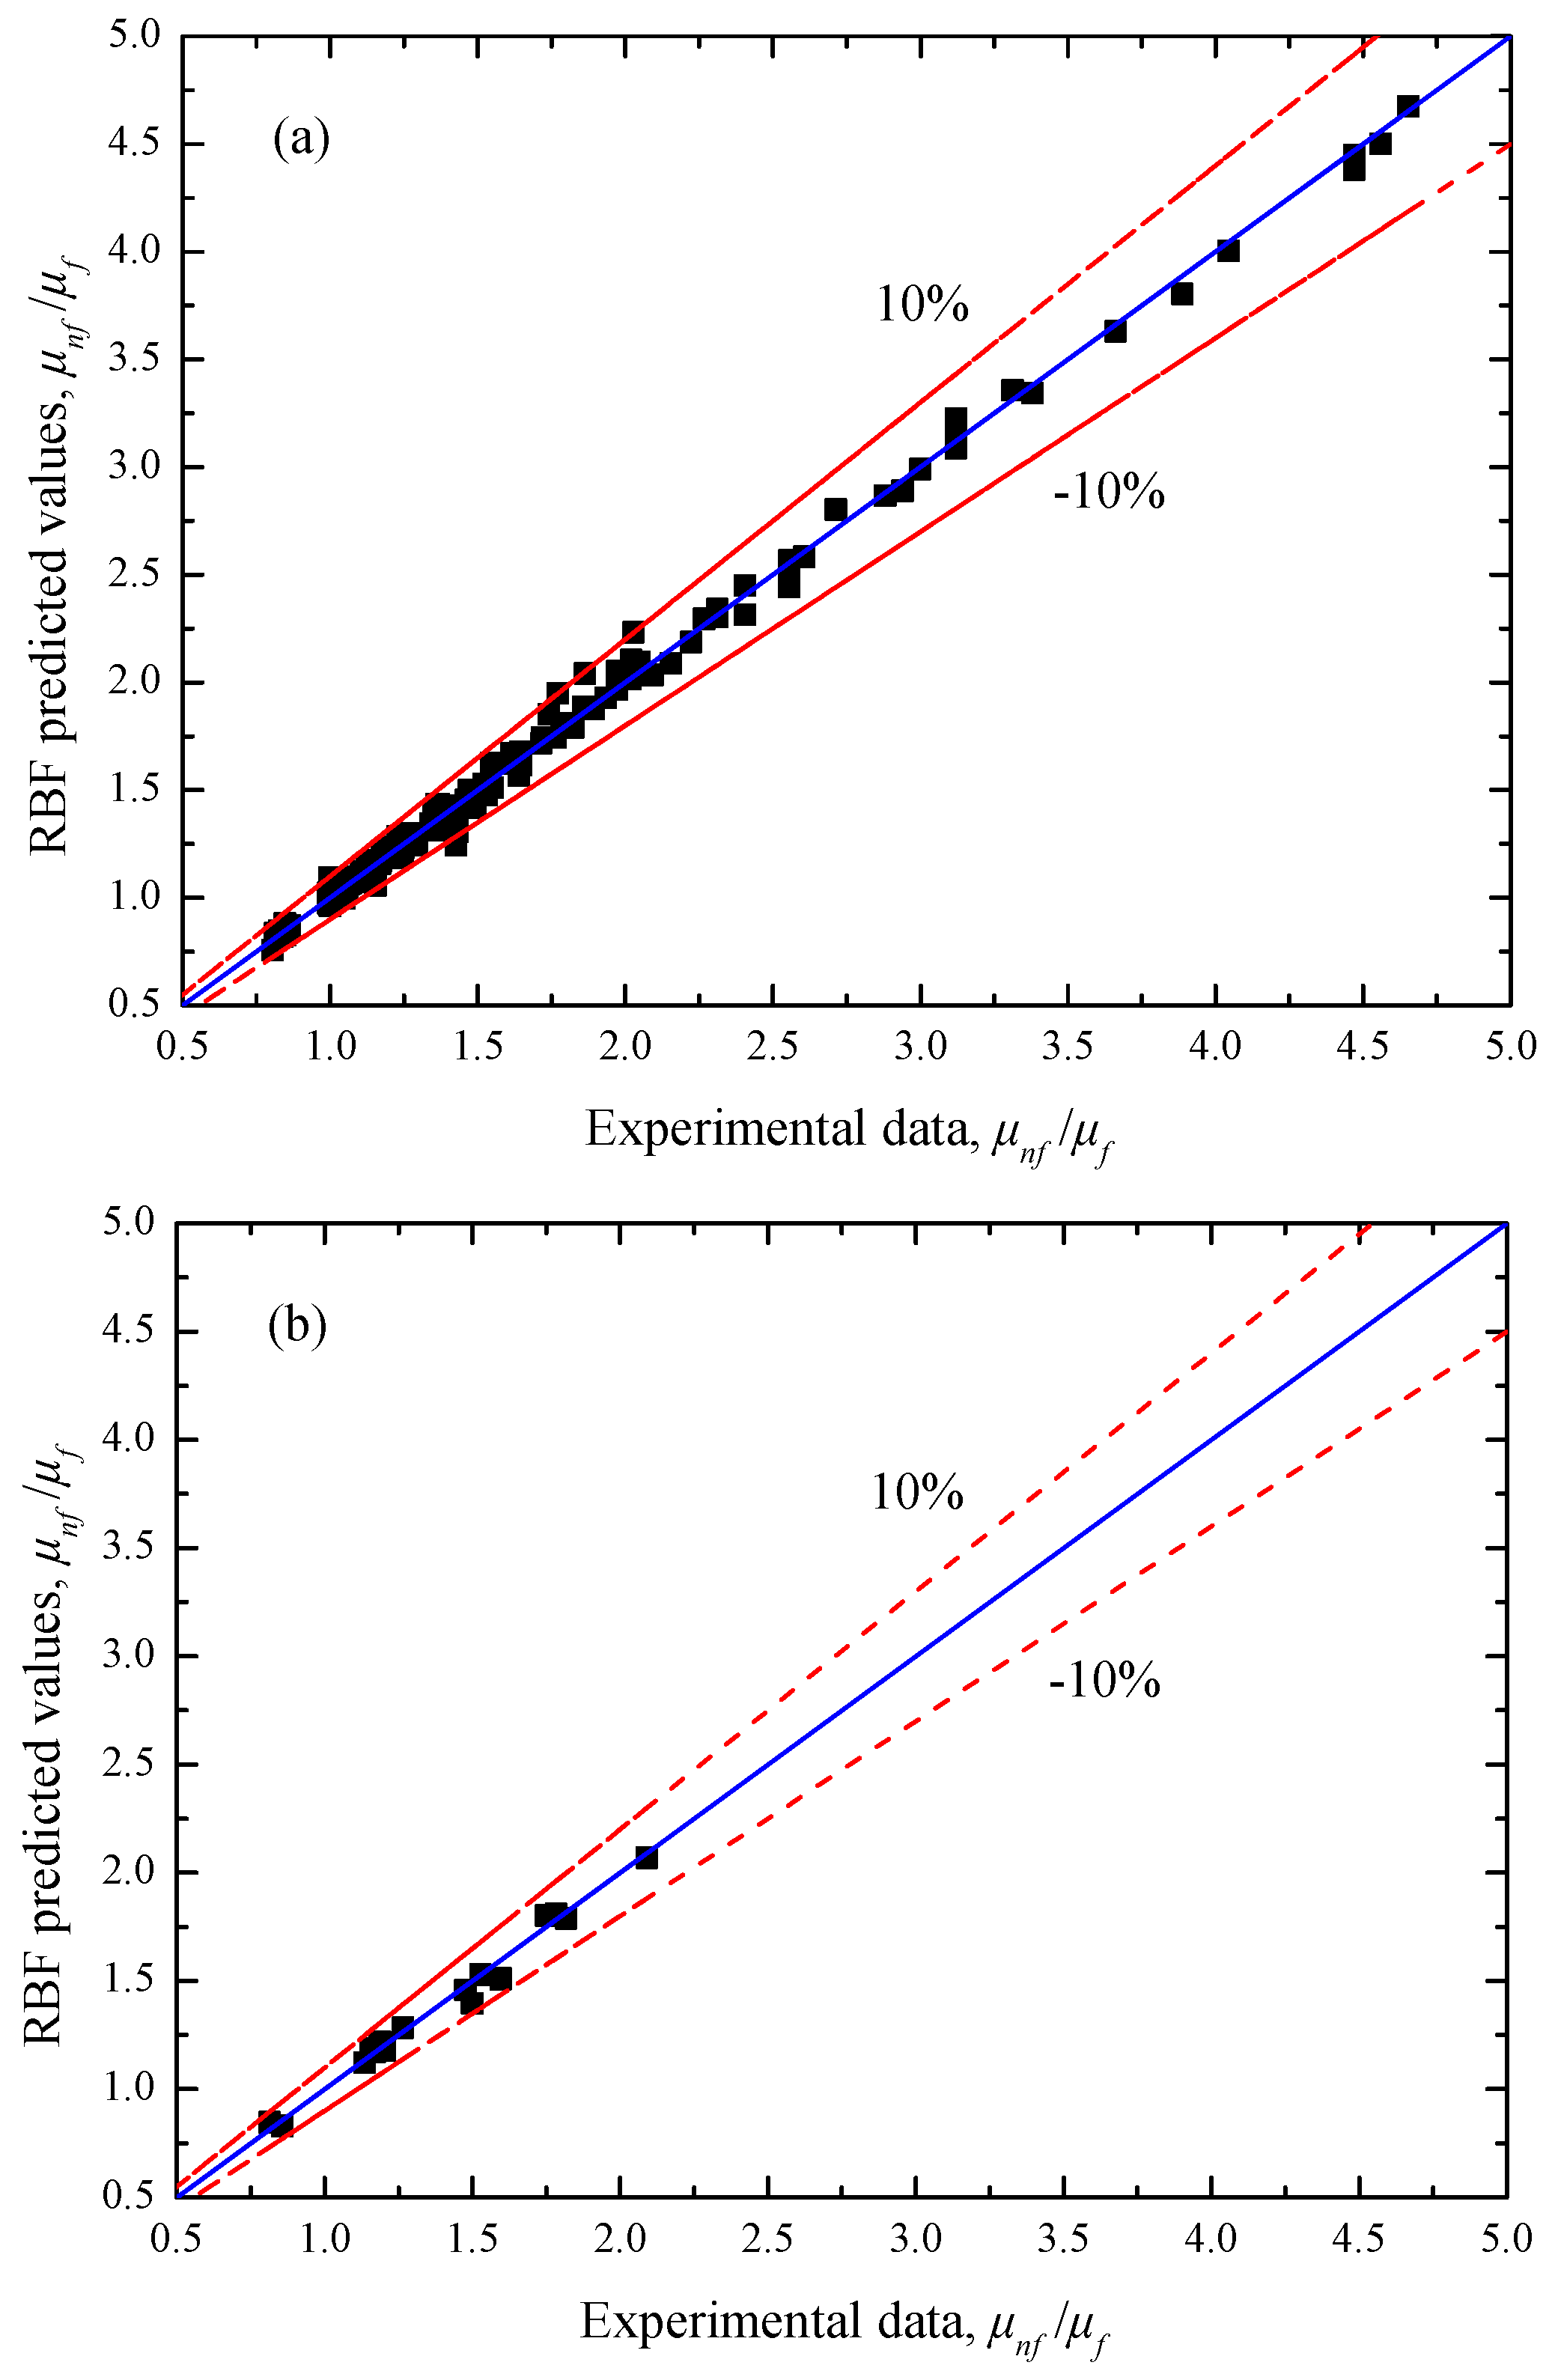
Figure 5 compares the predicted viscosity ratio of the RBF neural network and the experimental data involving the training and testing samples. It can be seen that all the prediction errors of the RBF neural network are within the ±10% error bands. As shown in Table 2, the values of the four evaluation criteria are RMSE = 0.04630, MAPE = 2.09967%, SSE = 0.42454, and R2 = 0.99927 for the training samples, and RMSE = 0.04443, MAPE = 2.43228%, SSE = 0.03553, and R2 = 0.99904 for the testing samples, which preliminarily indicates that the RBF neural network has a good ability to predict the viscosity ratio of ethylene glycol/water based nanofluids.
To further evaluate the prediction performance of the RBF neural network for nanofluid viscosity, the following typical viscosity models which consider the effects of nanoparticle Brownian motion and aggregation are selected for analysis.
Batchelor model [32]:
μ n f = ( 1 + 2.5 ϕ p + 6.25 ϕ p 2 ) μ f
Chen model [33]:
μ n f = [ 1 ϕ p 0.605 ( r a r p ) 1.2 ] 1.5125 μ f
where rp and ra are the radius of nanoparticle and nanoparticle aggregation, respectively.
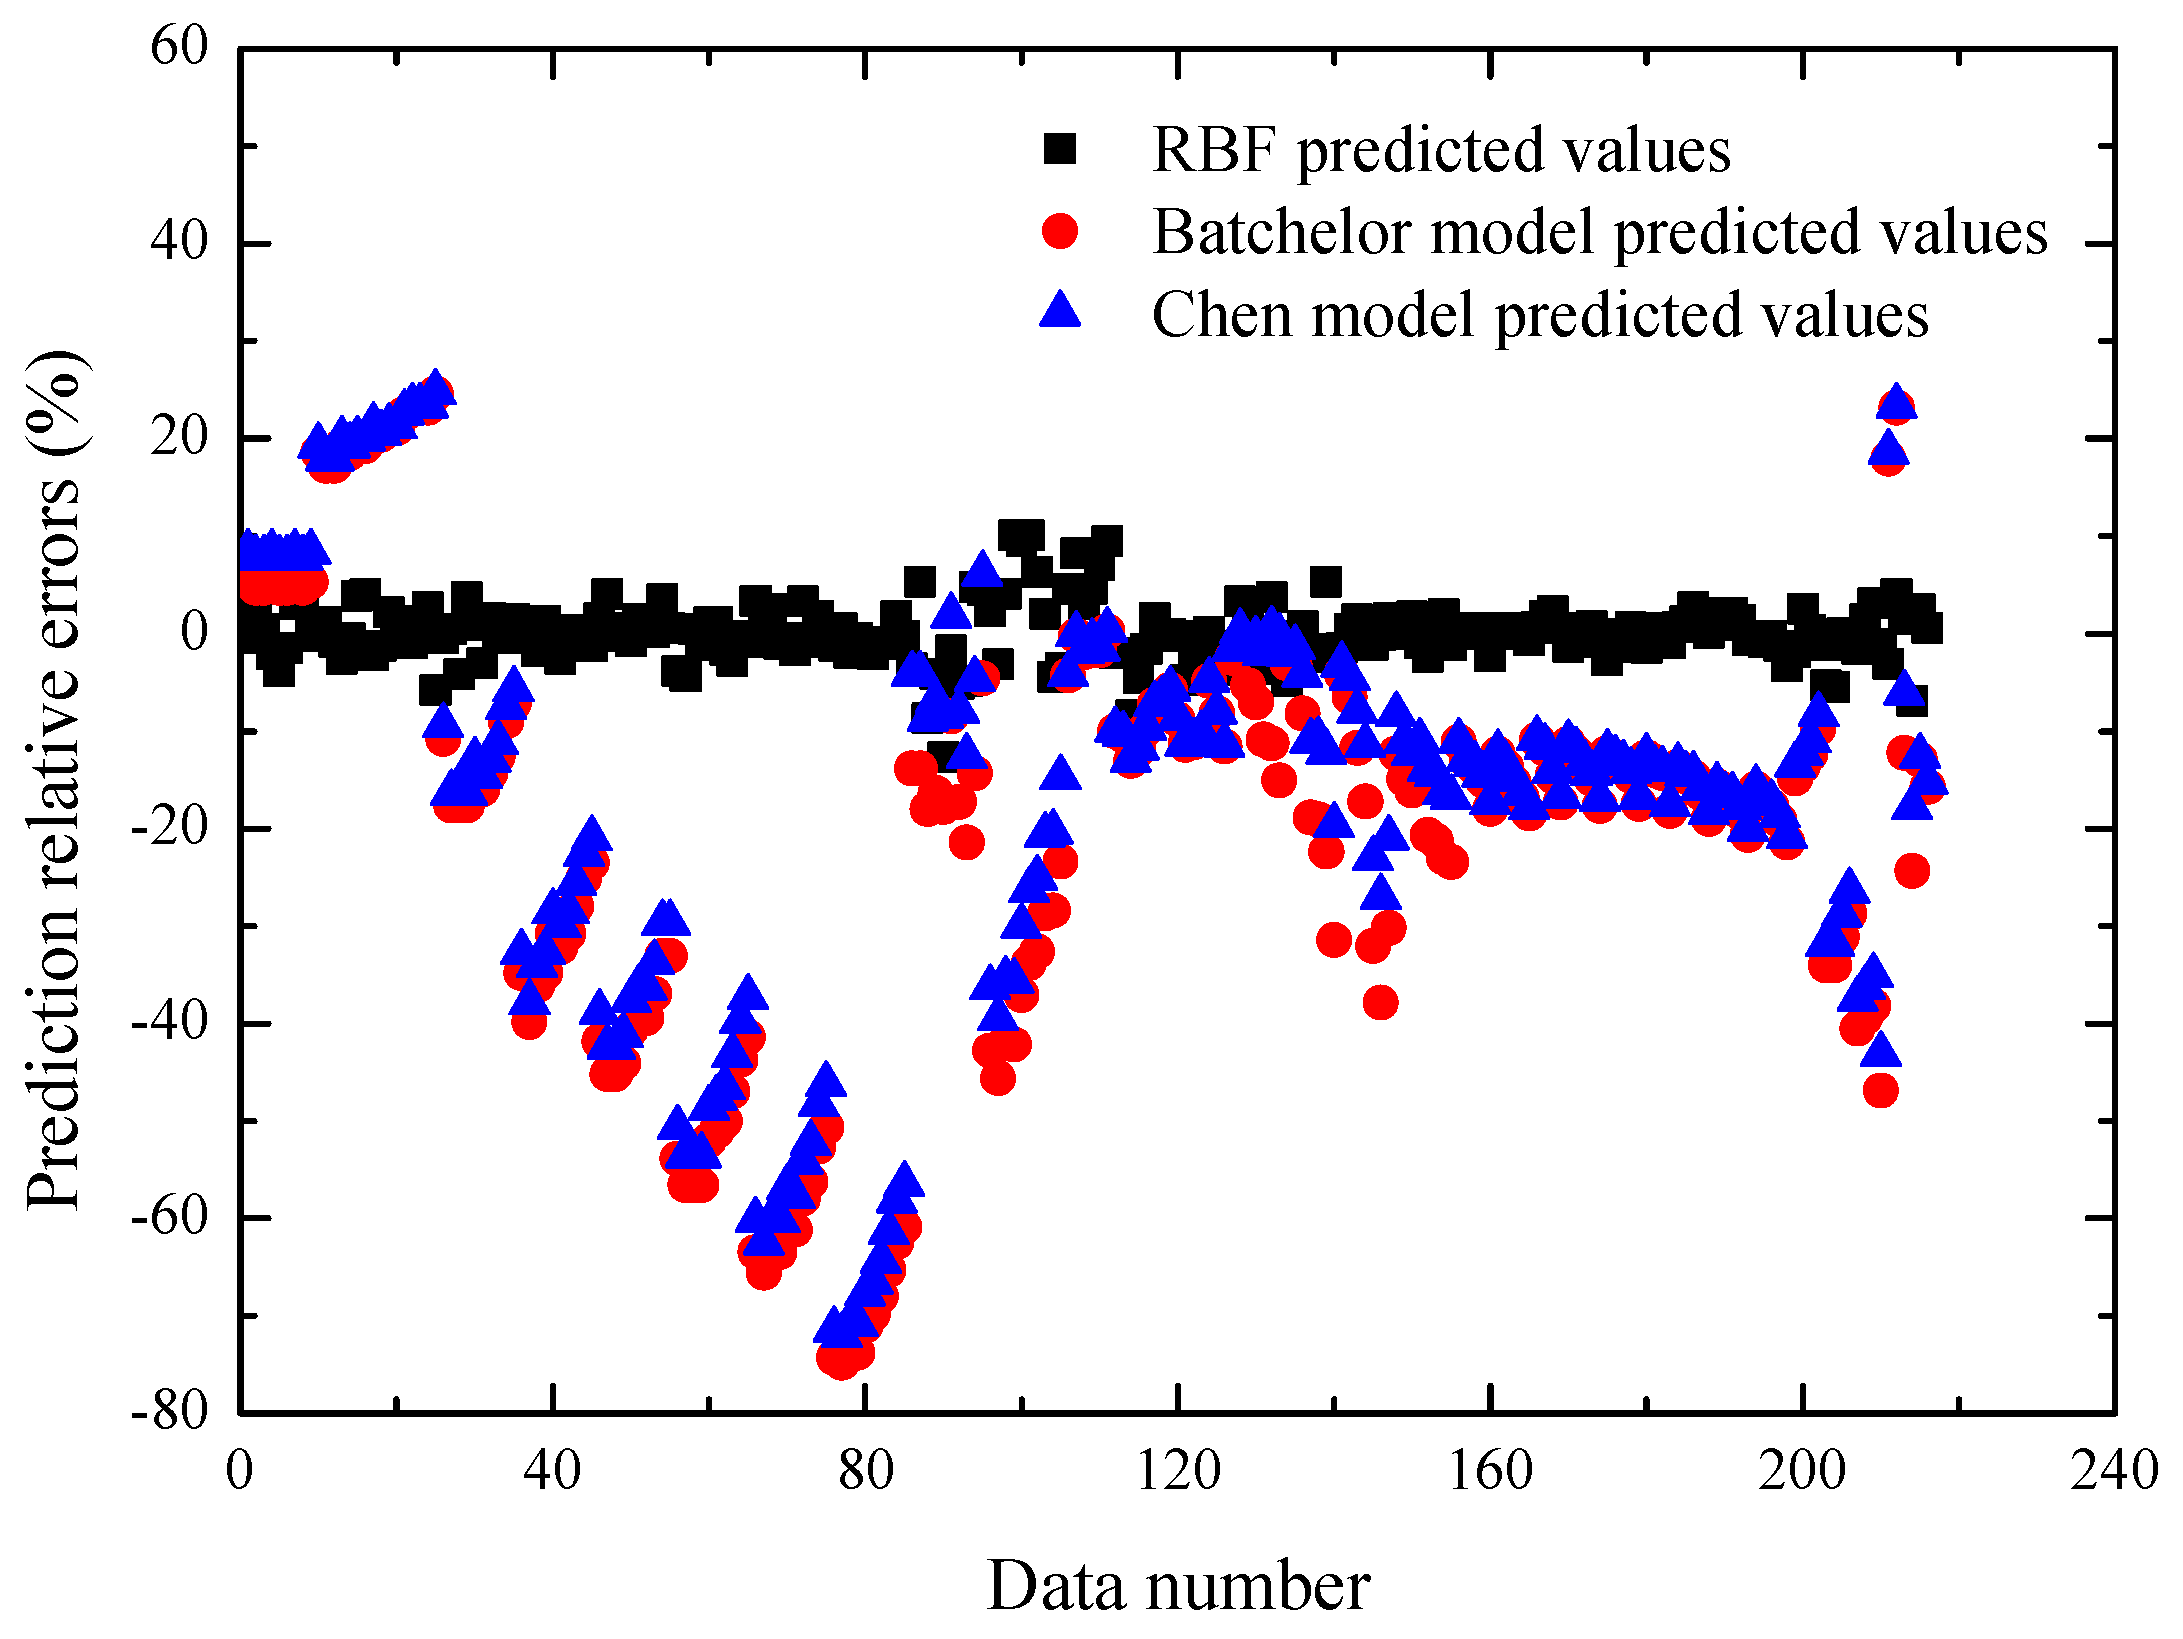
Figure 6 and Table 4 respectively compare the prediction performances of the different models for the total viscosity data. It is easily seen that the RBF neural network has a better prediction accuracy than the above two typical models. The main reason is that the Batchelor model and Chen model cannot fully quantitatively describe the relationship between the nanofluid viscosity ratio and the various factors including the nanoparticle properties, temperature, and base fluid.
Moreover, Table 5, Table 6 and Table 7 respectively present the comparisons between the predicted viscosity ratio of the RBF neural network and the corresponding experimental data of Chen et al. [12], Jamshidi et al. [13], and Namburu et al. [16]. It can be seen that there is good agreement between the RBF predicted and the experimental viscosity ratio of the different ethylene glycol/water based nanofluids. At the temperature range of 20–40 °C, the maximum and minimum prediction errors of the RBF neural network are respectively 5.788% and 0.434% for the experimental data of Chen et al. [12]. For the viscosity ratio of the SiO2-ethylene glycol/water (50:50 by volume ratio) nanofluid provided by Jamshidi et al. [13], the RBF neural network can accurately predict the viscosity ratio with an average error of 1.772% at the nanoparticle volume fraction of 0.1%. Moreover, the comparisons shown in Table 7 further illustrate that the developed RBF neural network has high accuracy (average error: 2.097%) for predicting the viscosity ratio of CuO-ethylene glycol/water (60:40 by weight ratio) nanofluids.
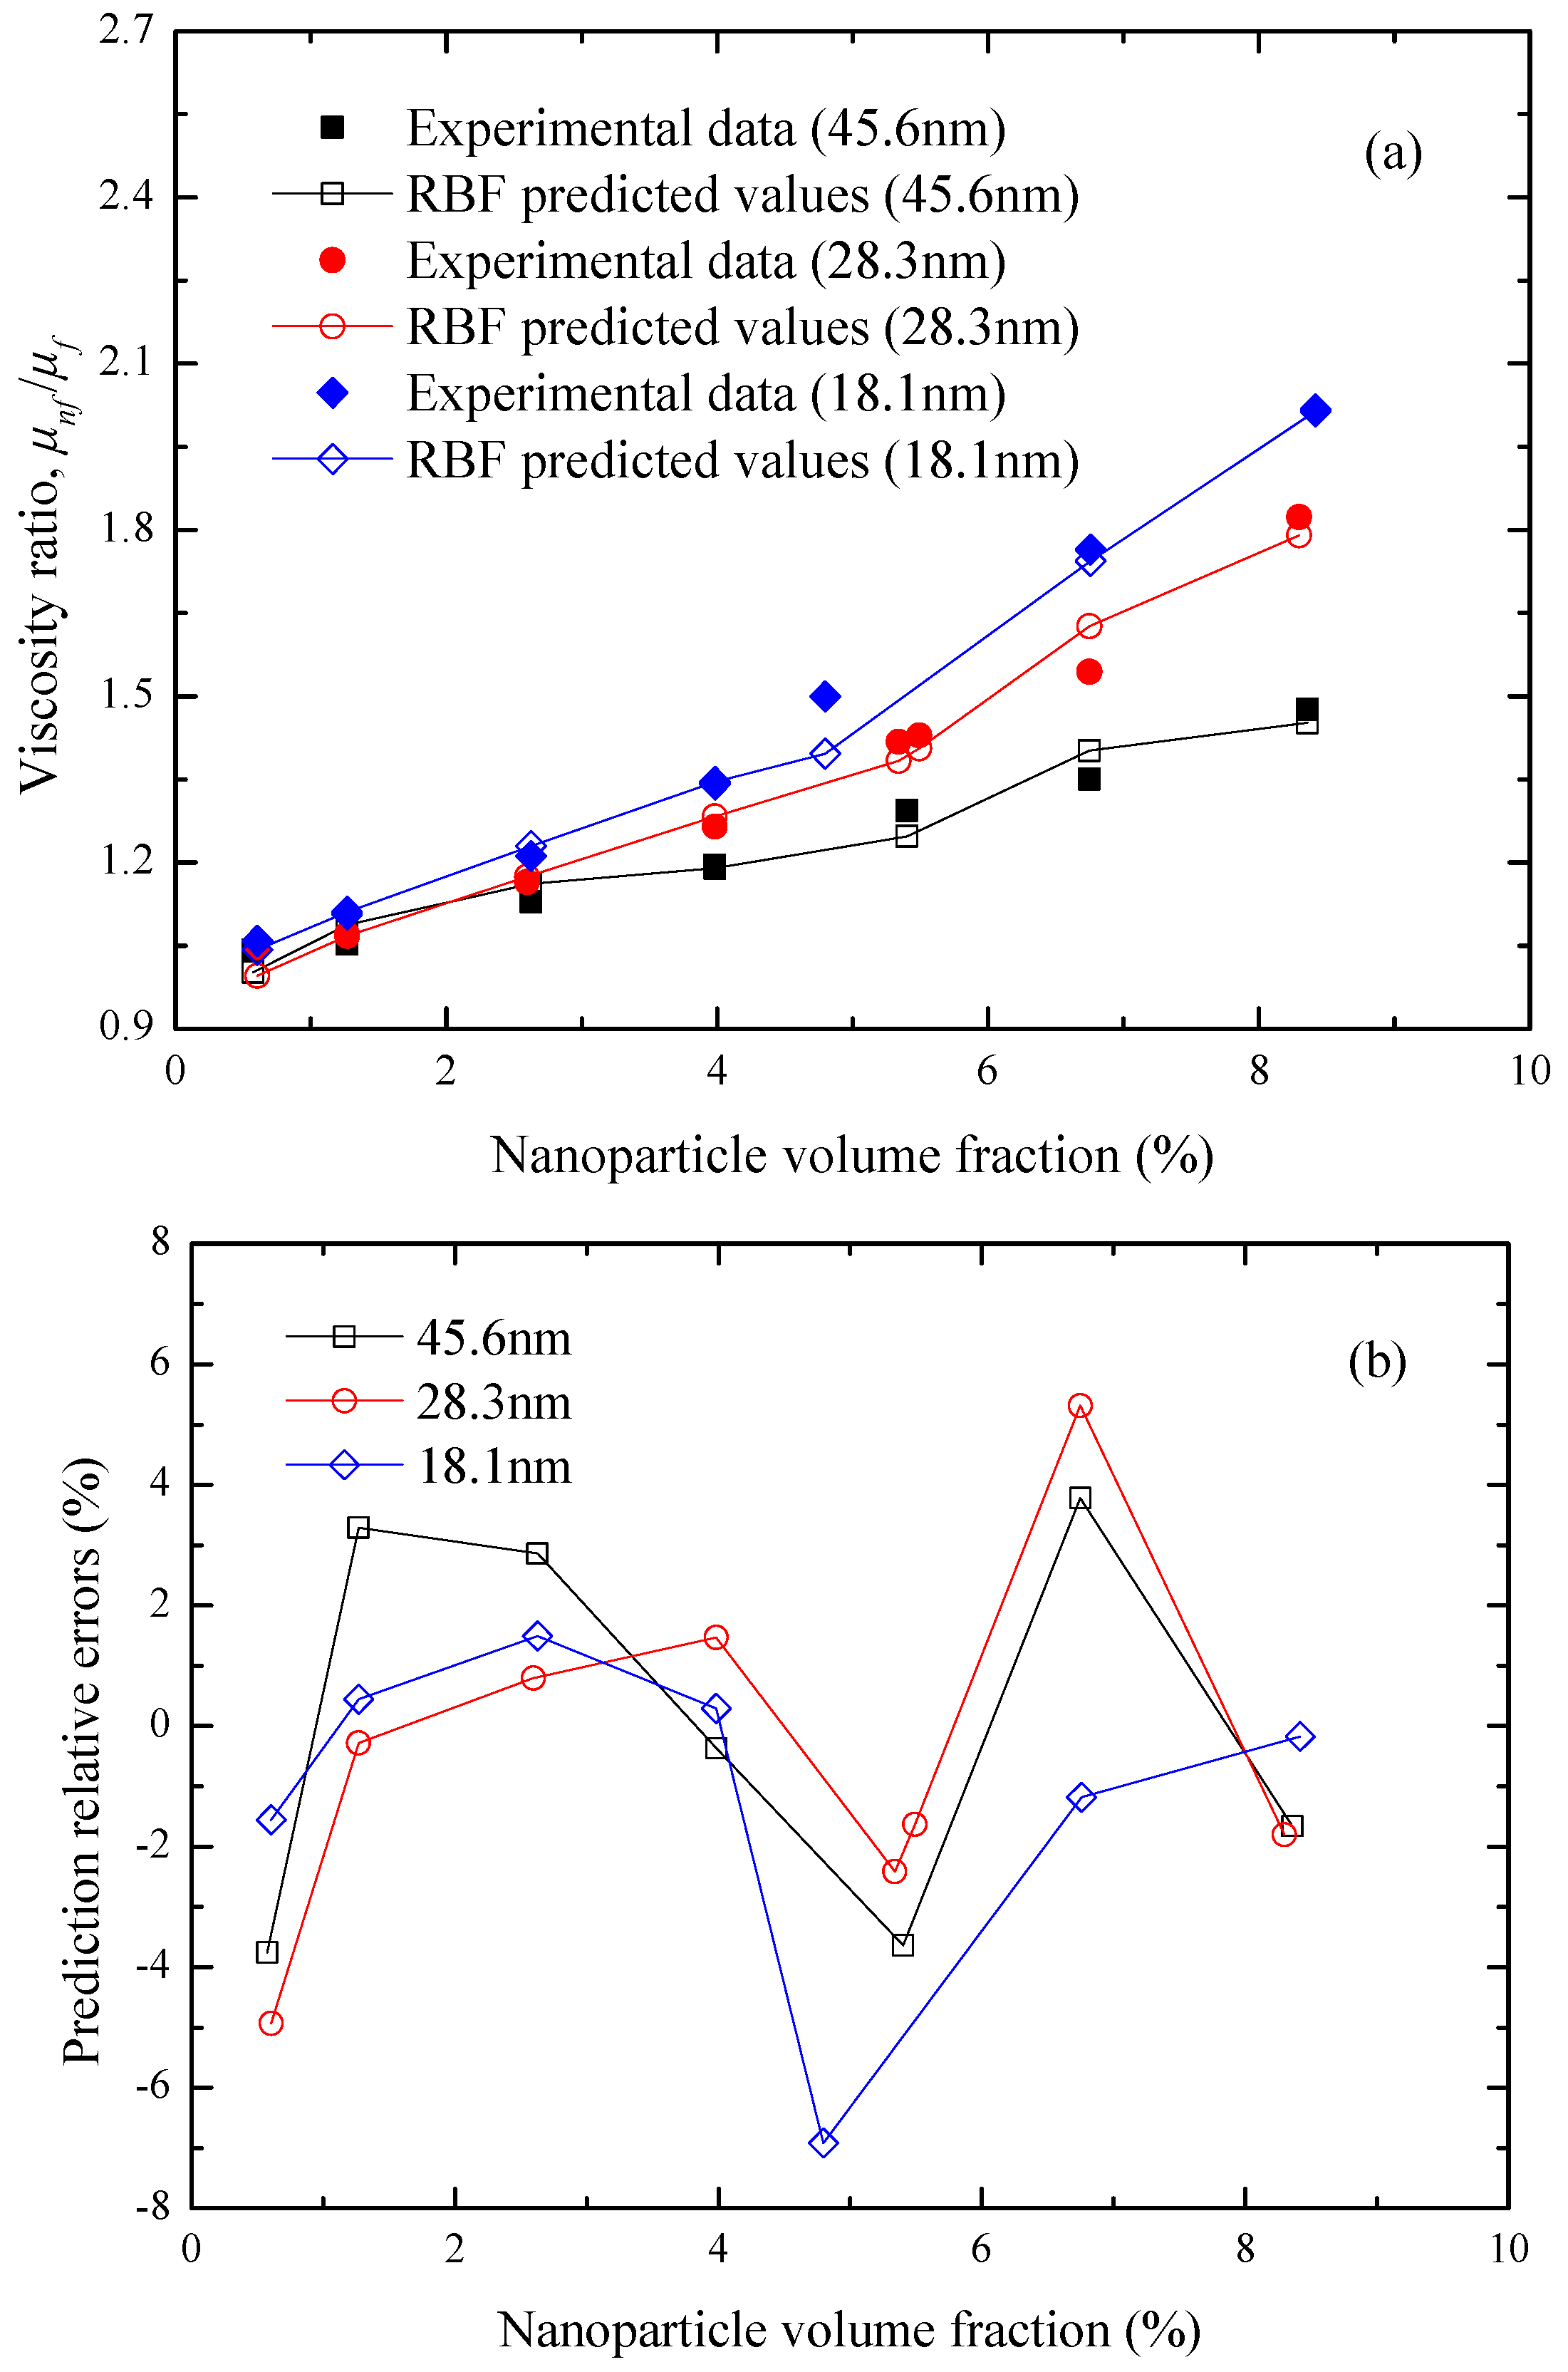
Figure 7 compares the experimental viscosity ratio of Rudyak et al. [15] with the predicted values of the RBF neural network for the SiO2-ethylene glycol nanofluids at T = 25 °C as a function of the nanoparticle volume fraction and diameter. It can be found from Figure 7a that the RBF predicted viscosity ratio of nanofluids are obviously enhanced with the increase of the SiO2 nanoparticle volume fraction and the decrease of the nanoparticle size, which are consistent with the experimental results. All the prediction relative errors are within ±8%, as shown in Figure 7b. On this basis, 
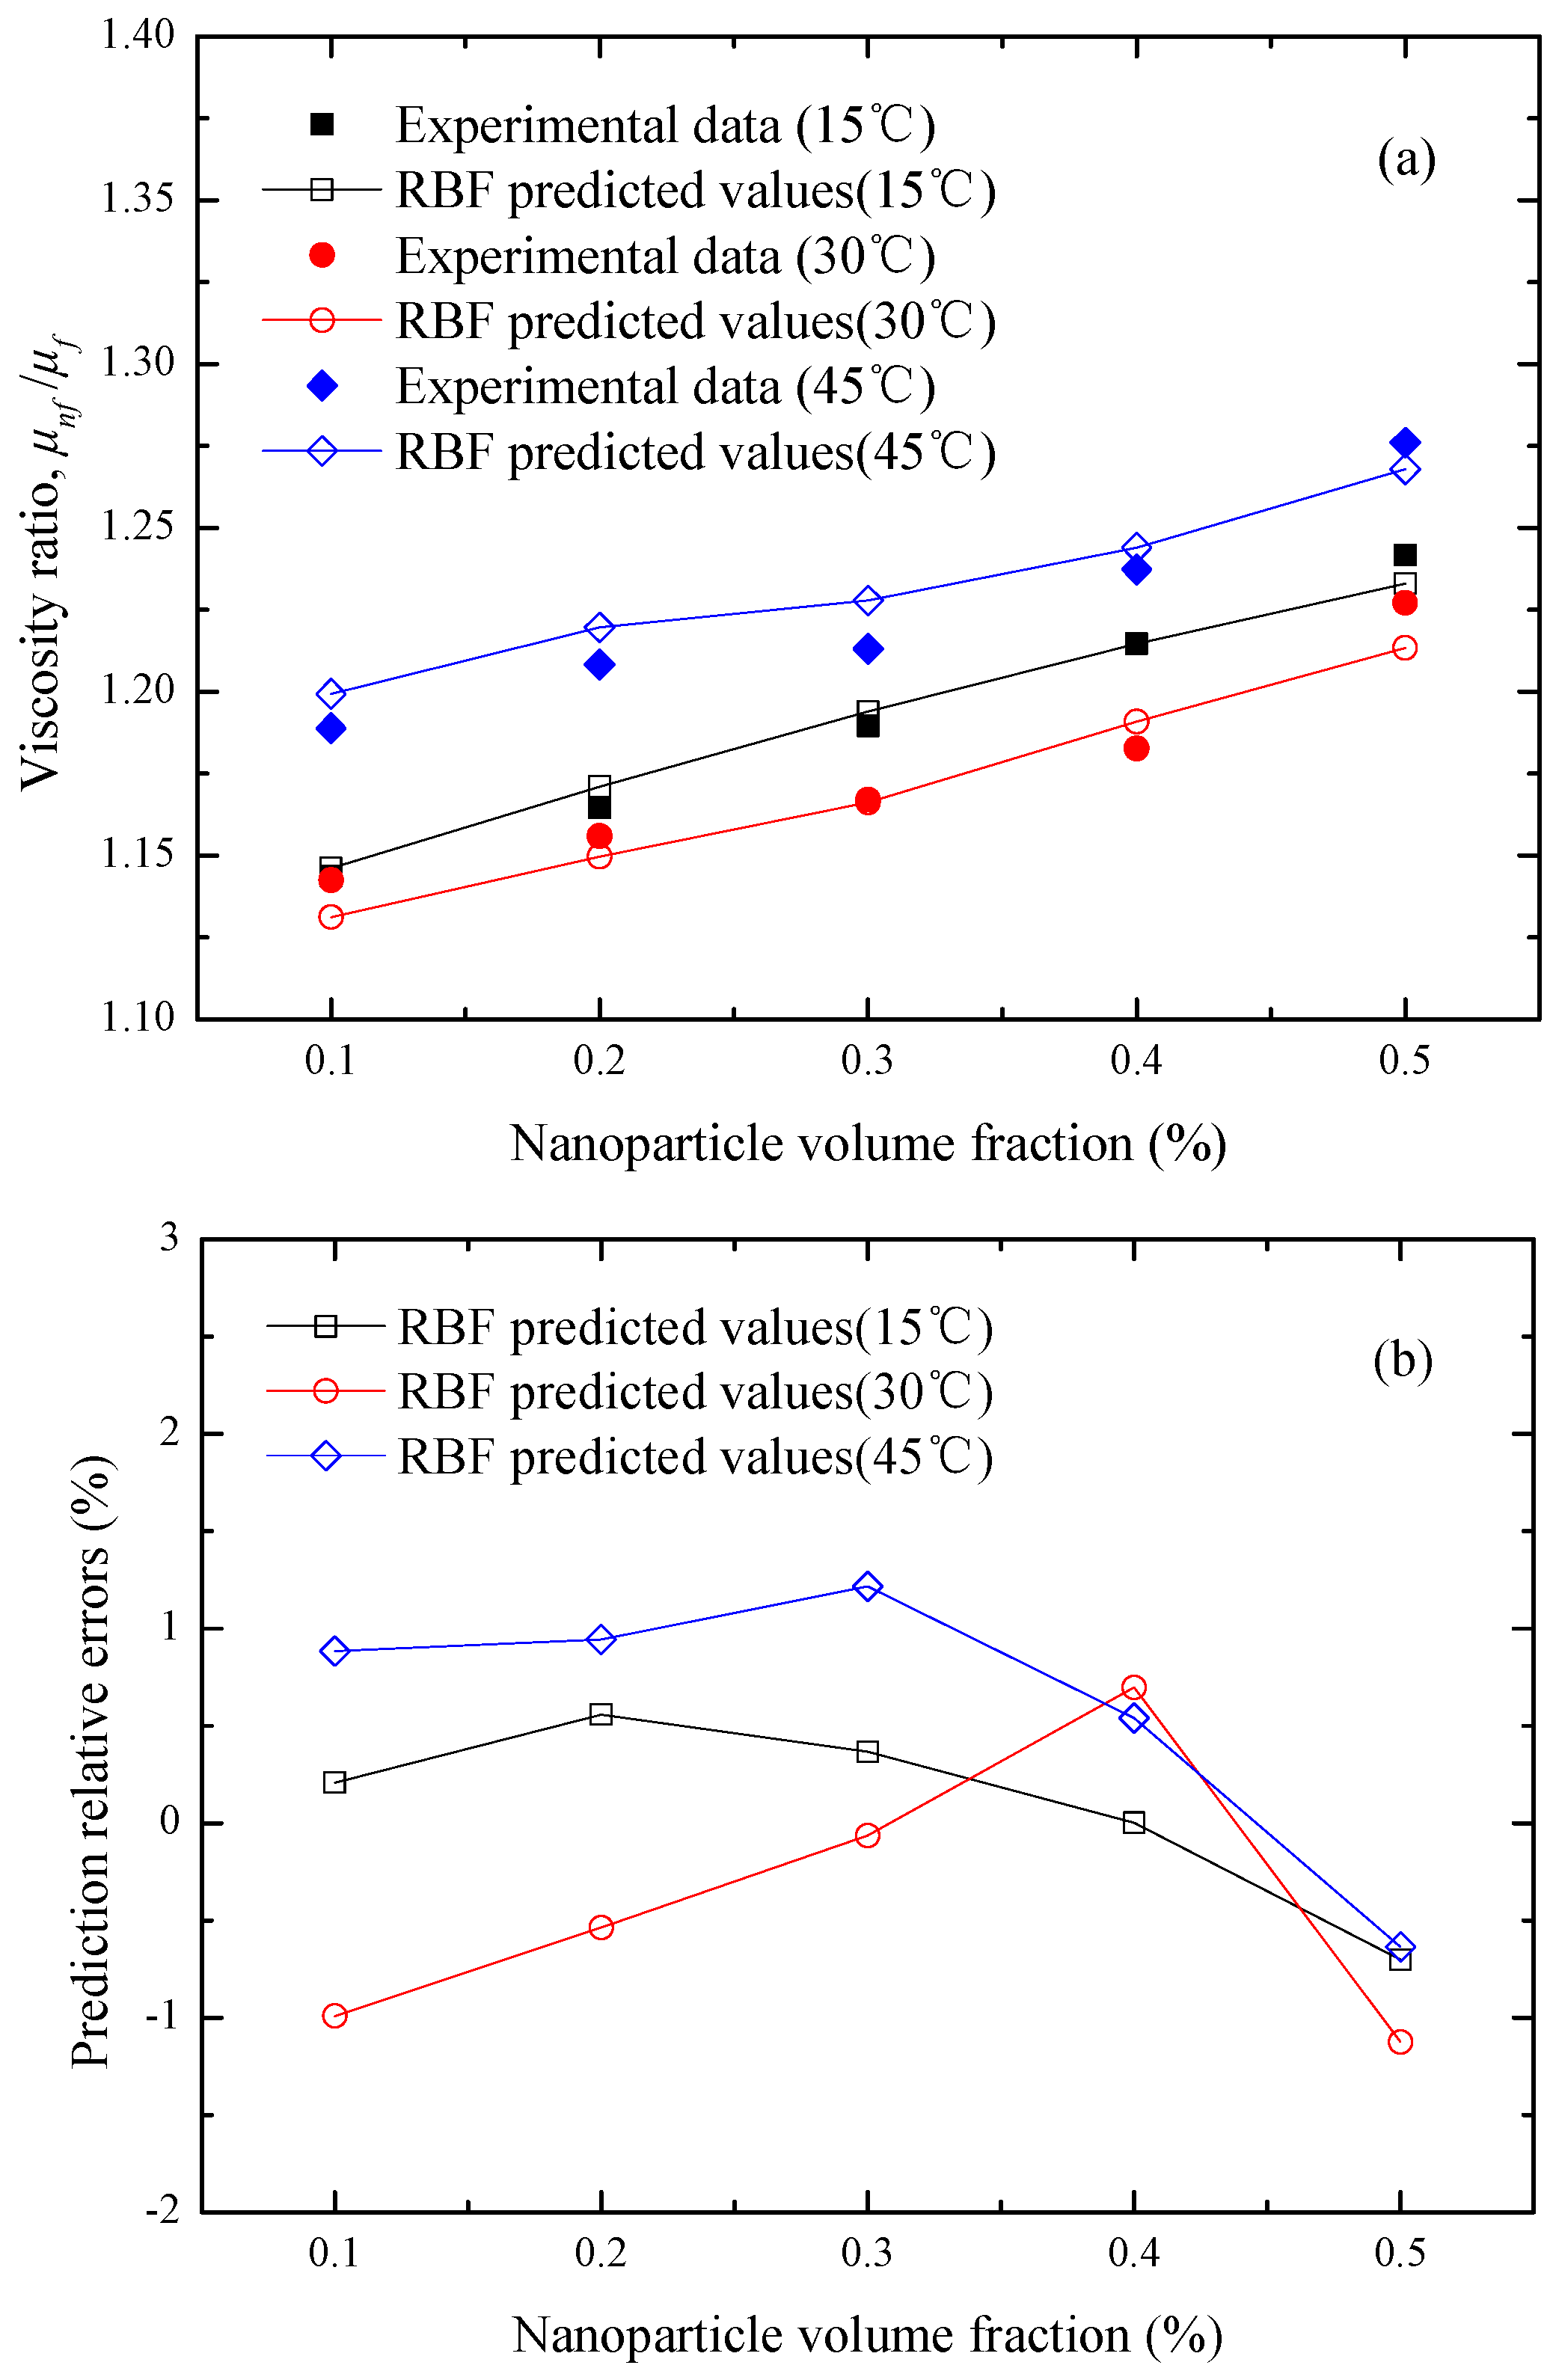
Figure 8 illustrates the comparisons between the RBF predicted values and the corresponding experimental data of Li et al. [
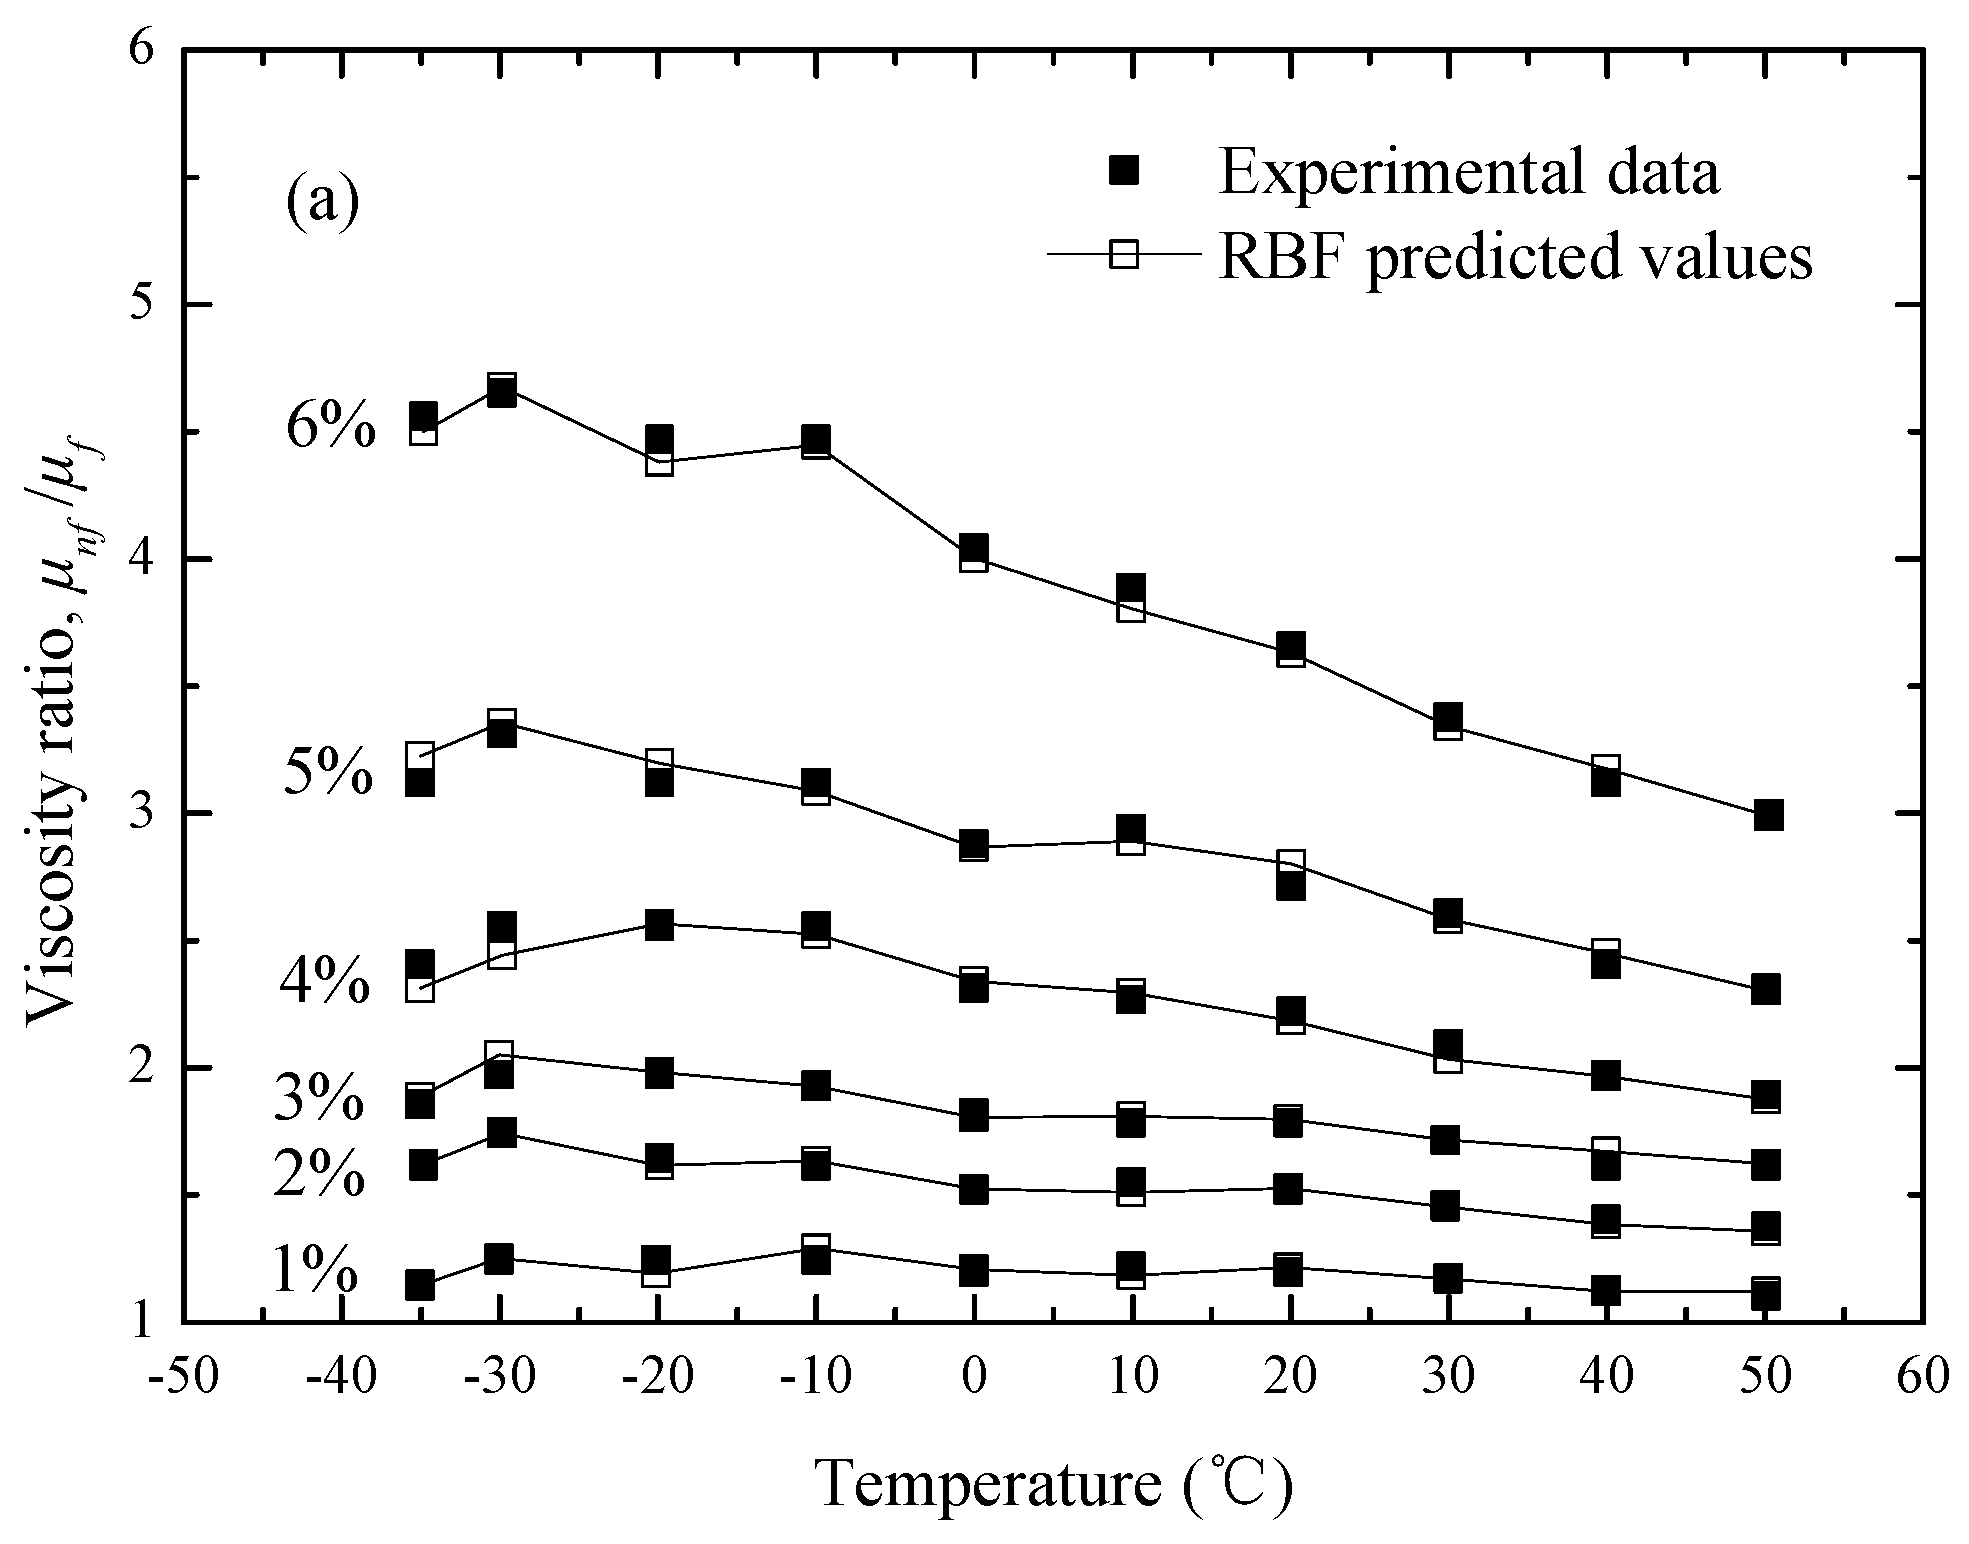
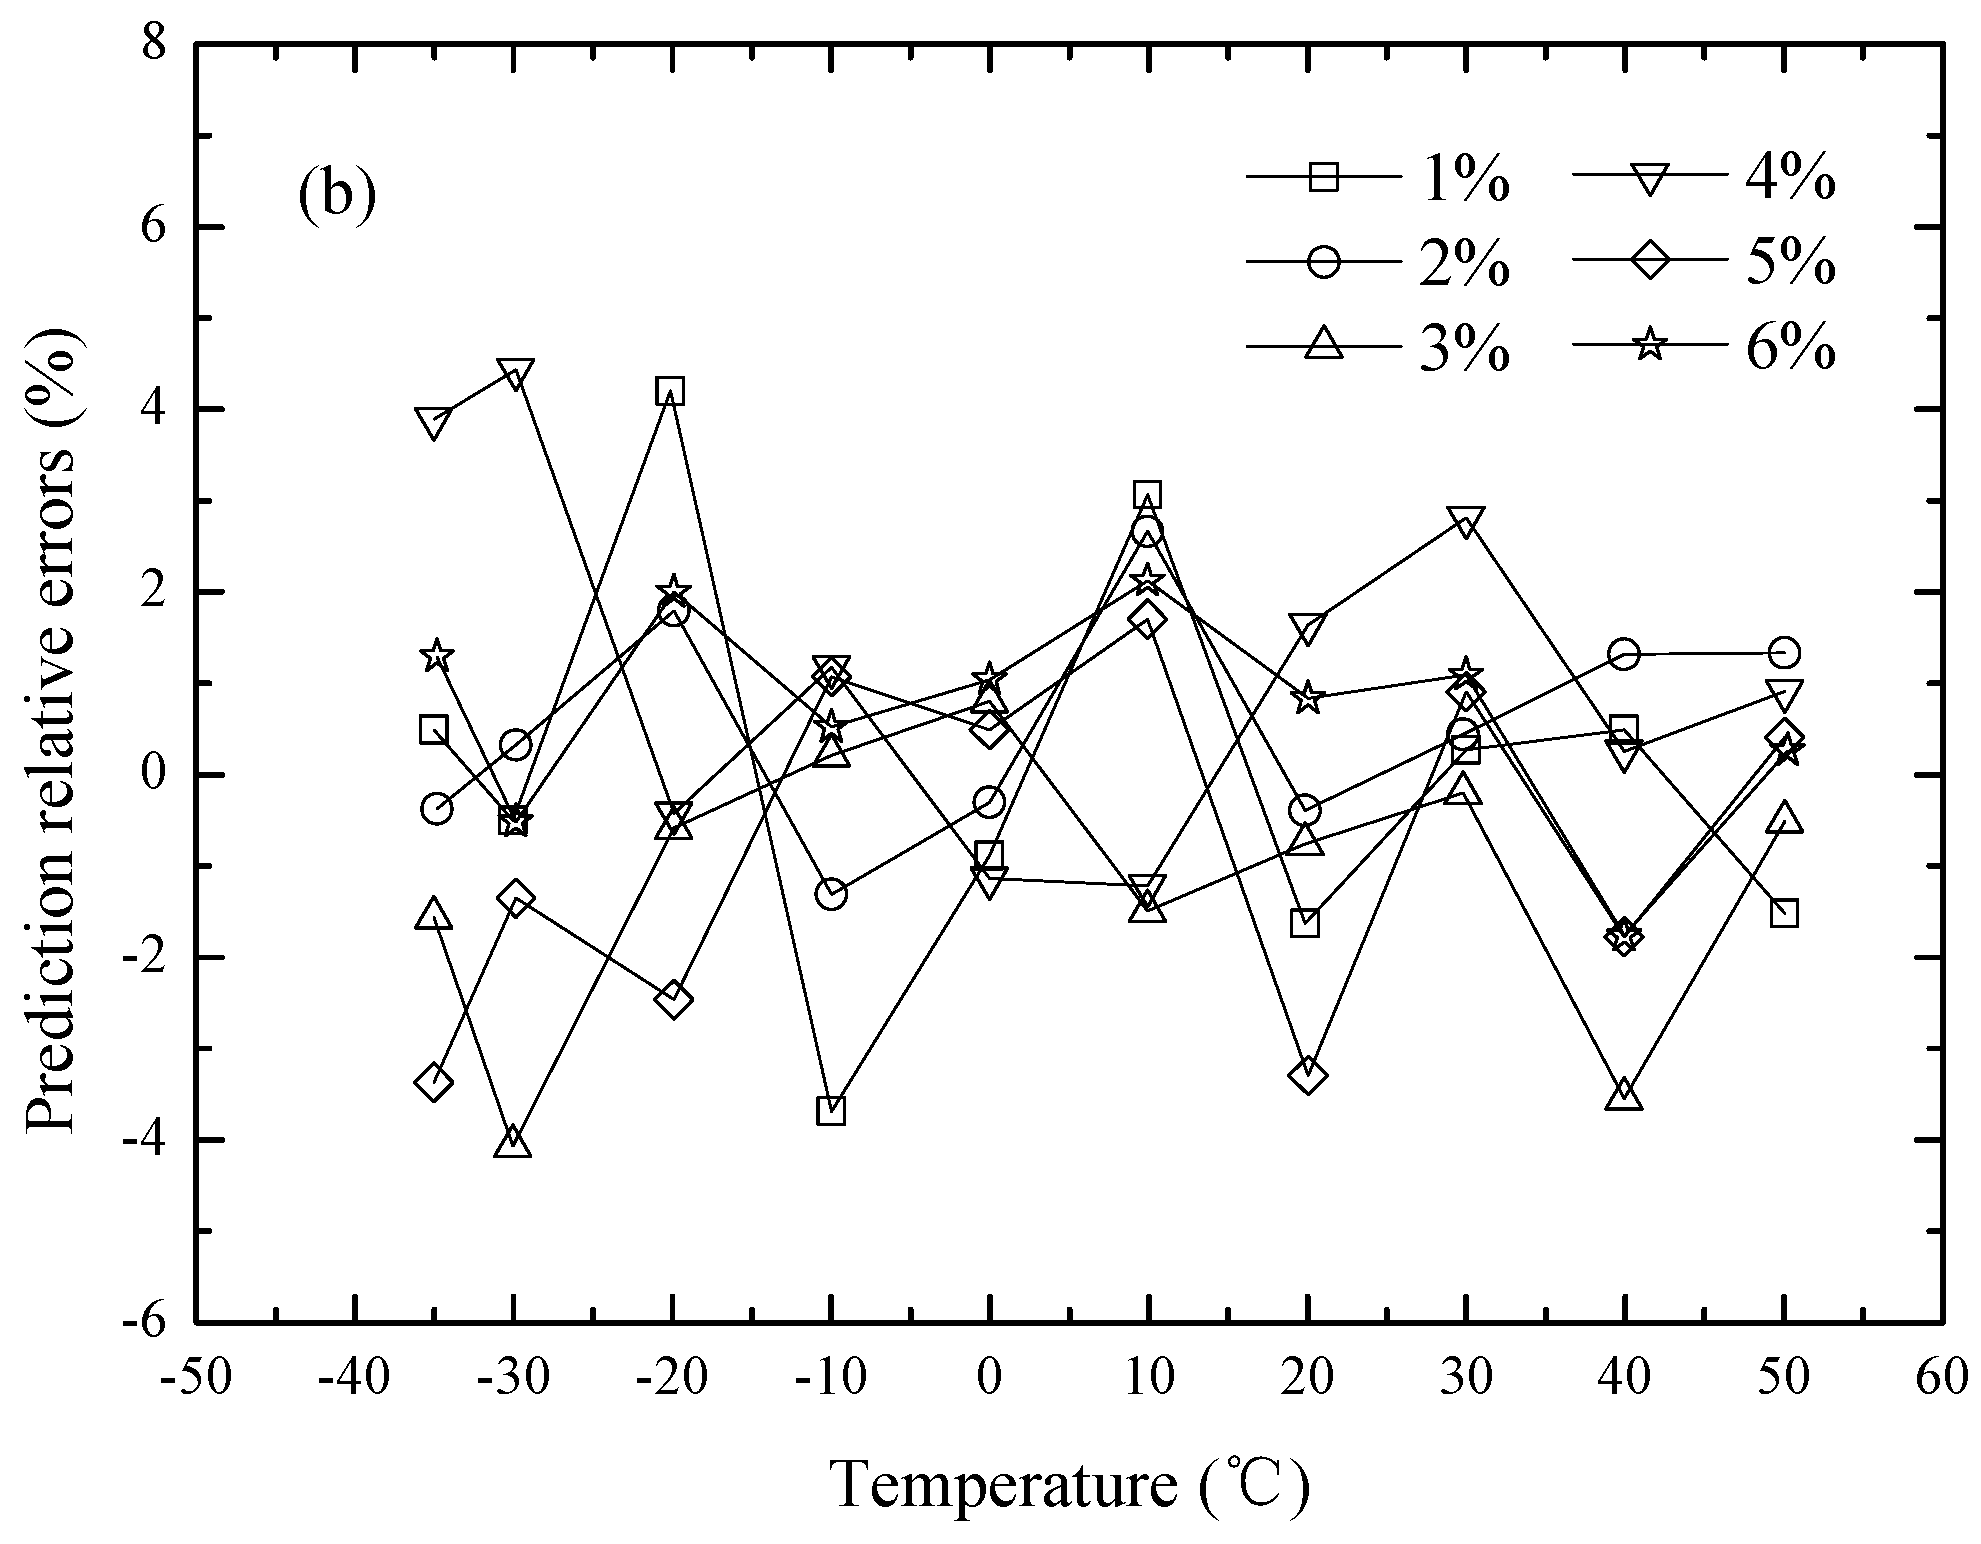
19]. The results indicate that the RBF neural network developed in this study can be applied successfully for predicting the effects of the nanoparticle volume fraction and temperature on the viscosity ratio of SiC-ethylene glycol/water (40:60 by weight ratio) nanofluids with a satisfactory accuracy. In addition, a similar analysis is performed for the CuO-ethylene glycol/water (60:40 by weight ratio) nanofluids as a function of temperature, which is presented in Figure 9. It is demonstrated that the viscosity ratio characteristics of the above nanofluids are effectively predicted by the RBF neural network in a wide range of nanoparticle volume fractions (from 1% to 6%) and temperatures (from −35 to 50 °C). The maximum prediction relative errors are only 4.2%. All the above analyses further demonstrate that the RBF neural network is one of the potential tools to quantitatively establish nonlinear relationships between inputs and outputs.
Table 8 shows the prediction performance of the RBF neural network using different viscosity data sets. It is worth noting that the data sets are selected randomly. From Table 8, we found that the size of the data set can affect the modeling and prediction of the RBF neural network significantly. With the decrease of the data set size, the prediction accuracy will decrease. This may mean that to accurately predict the viscosity of ethylene glycol/water based nanofluids using the RBF neural network, a large enough data set is necessary.

5. Conclusions

To accurately predict the viscosity ratio between ethylene glycol/water nanofluids and a base fluid, a RBF neural network based model was developed and evaluated in the present study. Based on the comparative analysis, the following conclusions were obtained.
(1)
Considering the complex effects of different factors including temperature, nanoparticle properties (such as volume fraction, density, diameter), and viscosity of the base fluid on the viscosity ratio and the effect of Spread on modeling performance of the RBF neural network, the final network structure was determined to be 5-56-1 neurons.
(2)
By comparing the RBF predictive values and the experimental data published in various studies, it was demonstrated that the RBF neural network not only exhibited good modeling accuracy (RMSE = 0.04615, MAPE = 2.12738%, SSE = 0.46007, R2 = 0.99925), but also could effectively predict the influences of temperature, nanoparticle volume fraction, and diameter on the viscosity ratio of different ethylene glycol/water based nanofluids.
(3)
Compared to the typical viscosity models, namely the Batchelor model and Chen model, the RBF neural network has a good ability to predict the viscosity ratio of different ethylene glycol/water based nanofluids. However, the prediction performance can be affected by the size of the data set.
(4)
The present investigation may play an active role for developing the modeling of nanofluid viscosity. However, how to extend the application of ANN to predict other thermo-physical properties of nanofluids is still worthy of study in the future.

Acknowledgments

The authors acknowledge the financial support by the Fundamental Research Funds for the Central Universities (No. HEUCF160307).

Author Contributions

Ningbo Zhao was responsible for the main parts of this manuscript, which includes the collection of viscosity data and the results analysis. Zhiming Li provided the program codes of RBF neural network and the conventional viscosity models, and wrote the basic theory of the RBF neural network.

Conflicts of interest

We declare that we have no conflict of interest.

References

  1. Peyghambarzadeh, S.M.; Hashemabadi, S.H.; Hoseini, S.M.; Jamnani, M.S. Experimental study of heat transfer enhancement using water/ethylene glycol based nanofluids as a new coolant for car radiators. Int. Commun. Heat Mass 2011, 38, 1283–1290. [Google Scholar] [CrossRef]
  2. Garoosi, F.; Jahanshaloo, L.; Rashidi, M.M.; Badakhsh, A.; Ali, M.E. Numerical simulation of natural convection of the nanofluid in heat exchangers using a Buongiorno model. Appl. Math. Comput. 2015, 254, 183–203. [Google Scholar] [CrossRef]
  3. Zhao, N.B.; Li, S.Y.; Yang, J.L. A review on nanofluids: Data-driven modeling of thermalphysical properties and the application in automotive radiator. Renew. Sustain. Energy Rev. 2016, 66, 596–616. [Google Scholar] [CrossRef]
  4. Hussein, A.M.; Kadirgama, K.; Noor, M.M. Nanoparticles suspended in ethylene glycol thermal properties and applications: An overview. Renew. Sust. Energy Rev. 2016, 69, 1324–1330. [Google Scholar] [CrossRef]
  5. Vajjha, R.S.; Das, D.K. Experimental determination of thermal conductivity of three nanofluids and development of new correlations. Int. J. Heat Mass Transf. 2009, 52, 4675–4682. [Google Scholar] [CrossRef]
  6. Sundar, L.S.; Singh, M.K.; Sousa, A.C.M. Thermal conductivity of ethylene glycol and water mixture based Fe3O4 nanofluid. Int. Commun. Heat Mass 2013, 49, 17–24. [Google Scholar] [CrossRef]
  7. Bég, O.A.; Rashidi, M.M.; Akbari, M.; Hosseini, A. Comparative numerical study of single-phase and two-phase models for bio-nanofluid transport phenomena. J. Mech. Med. Biol. 2014, 14, 1450011. [Google Scholar] [CrossRef]
  8. Garoosi, F.; Rohani, B.; Rashidi, M.M. Two-phase mixture modeling of mixed convection of nanofluids in a square cavity with internal and external heating. Powder Technol. 2015, 275, 304–321. [Google Scholar] [CrossRef]
  9. Sheikholeslami, M.; Rashidi, M.M.; Hayat, T.; Ganji, D.D. Free convection of magnetic nanofluid considering MFD viscosity effect. J. Mol. Liq. 2016, 218, 393–399. [Google Scholar] [CrossRef]
  10. Azmi, W.H.; Hamid, K.A.; Mamat, R.; Sharma, K.V.; Mohamad, M.S. Effects of working temperature on thermo-physical properties and forced convection heat transfer of TiO2 nanofluids in water–ethylene glycol mixture. Appl. Therm. Eng. 2016, 106, 1190–1199. [Google Scholar] [CrossRef]
  11. Sundar, L.S.; Ramana, E.V.; Singh, M.K.; de Sousa, A.C.M. Viscosity of low volume concentrations of magnetic Fe3O4 nanoparticles dispersed in ethylene glycol and water mixture. Chem. Phys. Lett. 2012, 554, 236–242. [Google Scholar] [CrossRef]
  12. Chen, H.; Ding, Y.; Tan, C. Rheological behaviour of nanofluids. New J. Phys. 2007, 9, 367. [Google Scholar] [CrossRef]
  13. Jamshidi, N.; Farhadi, M.; Ganji, D.; Sedighi, K. Experimental investigation on viscosity of nanofluids. Int. J. Eng. 2012, 25, 201–209. [Google Scholar] [CrossRef]
  14. Kulkarni, D.P.; Das, D.K.; Vajjha, R.S. Application of nanofluids in heating buildings and reducing pollution. Appl. Energy 2009, 86, 2566–2573. [Google Scholar] [CrossRef]
  15. Rudyak, V.Y.; Dimov, S.V.; Kuznetsov, V.V. On the dependence of the viscosity coefficient of nanofluids on particle size and temperature. Tech. Phys. Lett. 2013, 39, 779–782. [Google Scholar] [CrossRef]
  16. Namburu, P.K.; Kulkarni, D.P.; Misra, D.; Das, D.K. Viscosity of copper oxide nanoparticles dispersed in ethylene glycol and water mixture. Exp. Therm. Fluid Sci. 2007, 32, 397–402. [Google Scholar] [CrossRef]
  17. Lim, S.K.; Azmi, W.H.; Yusoff, A.R. Investigation of thermal conductivity and viscosity of Al2O3/water–ethylene glycol mixture nanocoolant for cooling channel of hot-press forming die application. Int. Commun. Heat Mass 2016, 78, 182–189. [Google Scholar] [CrossRef]
  18. Chiam, H.W.; Azmi, W.H.; Usri, N.A.; Mamat, R.; Adam, N.M. Thermal conductivity and viscosity of Al2O3 nanofluids for different based ratio of water and ethylene glycol mixture. Exp. Therm. Fluid Sci. 2017, 81, 420–429. [Google Scholar] [CrossRef]
  19. Li, X.; Zou, C.; Qi, A. Experimental study on the thermo-physical properties of car engine coolant (water/ethylene glycol mixture type) based SiC nanofluids. Int. Commun. Heat Mass 2016, 77, 159–164. [Google Scholar] [CrossRef]
  20. Murshed, S.S.; Estellé, P. A state of the art review on viscosity of nanofluids. Renew. Sust. Energy Rev. 2017, 76, 1134–1152. [Google Scholar] [CrossRef]
  21. Heidari, E.; Sobati, M.A.; Movahedirad, S. Accurate prediction of nanofluid viscosity using a multilayer perceptron artificial neural network (MLP-ANN). Chemom. Intell. Lab. 2016, 155, 73–85. [Google Scholar] [CrossRef]
  22. Yousefi, F.; Karimi, H.; Papari, M.M. Modeling viscosity of nanofluids using diffusional neural networks. J. Mol. Liq. 2015, 175, 85–90. [Google Scholar] [CrossRef]
  23. Mehrabi, M.; Sharifpur, M.; Meyer, J.P. Viscosity of nanofluids based on an artificial intelligence model. Int. Commun. Heat Mass 2013, 43, 16–21. [Google Scholar] [CrossRef]
  24. Zhao, N.B.; Li, S.Y.; Wang, Z.T.; Cao, Y.P. Prediction of viscosity of nanofluids using artificial neural networks. In Proceedings of the ASME 2014 International Mechanical Engineering Congress & Exposition, Montreal, QC, Canada, 14–20 November 2014. [Google Scholar]
  25. Zhao, N.B.; Wen, X.Y.; Yang, J.L.; Li, S.Y.; Wang, Z.T. Modeling and prediction of viscosity of water-based nanofluids by radial basis function neural networks. Powder Technol. 2015, 281, 173–183. [Google Scholar] [CrossRef]
  26. Yang, S.; Cao, Y.; Peng, Z.; Wen, G.; Guo, K. Distributed formation control of nonholonomic autonomous vehicle via RBF neural network. Mech. Syst. Signal Process. 2017, 87, 81–95. [Google Scholar] [CrossRef]
  27. Broomhead, D.S.; Lowe, D. Radial basis functions, multi-variable functional interpolation and adaptive networks. Complex Syst. 1988, 2, 321–355. [Google Scholar]
  28. Li, M.M.; Verma, B. Nonlinear curve fitting to stopping power data using RBF neural networks. Expert Syst. Appl. 2016, 45, 161–171. [Google Scholar] [CrossRef]
  29. Turnbull, D.; Elkan, C. Fast recognition of musical genres using RBF networks. IEEE Trans. Knowl. Data Eng. 2005, 17, 580–584. [Google Scholar] [CrossRef]
  30. Iliyas, S.A.; Elshafei, M.; Habib, M.A.; Adeniran, A.A. RBF neural network inferential sensor for process emission monitoring. Control Eng. Pract. 2013, 21, 962–970. [Google Scholar] [CrossRef]
  31. Chen, S.; Cowan, C.F.N.; Grant, P.M. Orthogonal least squares learning algorithm for radial basis function networks. IEEE Trans. Neural Netw. 1991, 2, 302–309. [Google Scholar] [CrossRef] [PubMed]
  32. Batchelor, G.K. The effect of Brownian motion on the bulk stress in a suspension of spherical particles. J. Fluid Mech. 1977, 83, 97–117. [Google Scholar] [CrossRef]
  33. Chen, H.; Ding, Y.; He, Y.; Tan, C. Rheological behaviour of ethylene glycol based titania nanofluids. Chem. Phys. Lett. 2007, 444, 333–337. [Google Scholar] [CrossRef]
Figure 1. A typical three-layer RBF neural network.
Applsci 07 00409 g001
Figure 2. Implementation process of a RBF neural network for viscosity prediction.
Applsci 07 00409 g002
Figure 3. RBF neural network developed in this study.
Applsci 07 00409 g003
Figure 4. The relationships of mean square error (MSE) and the number of hidden layer neurons with different Spreads.
Applsci 07 00409 g004
Figure 5. Scatter plots of (a) training and (b) testing μnf/μf for the RBF predicted results and experimental data.
Applsci 07 00409 g005
Figure 6. Prediction relative errors of different models for the total viscosity data.
Applsci 07 00409 g006
Figure 7. (a) Predicted comparisons and (b) relative errors of the RBF predicted μnf/μf and the experimental data [15] for SiO2-ethylene glycol nanofluids at T = 25 °C.
Applsci 07 00409 g007
Figure 8. (a) Predicted comparisons and (b) relative errors of the RBF predicted μnf/μf and the experimental data [19] for SiC-ethylene glycol/water (40:60 by weight ratio) nanofluids at dp = 30 nm.
Applsci 07 00409 g008
Figure 9. (a) Predicted comparisons and (b) relative errors of the RBF predicted μnf/μf and the experimental data [14] for CuO-ethylene glycol/water (60:40 by weight ratio) nanofluids at dp = 30 nm.
Applsci 07 00409 g009aApplsci 07 00409 g009b
Table 1. Viscosity information of ethylene glycol/water based nanofluids.
NanofluidsTiO2-EG [12]SiO2-EG/W a [13]SiO2-EG/W b [13]CuO-EG/W c [14]SiO2-EG [15]CuO-EG/W c [16]SiC-EG/W d [19]
dp (nm)25101030/45/5018.1/28.3/45.62930
φp (%)0.1–1.80.10.11–60.6–8.41–40.1–0.5
ρp (kg/m3)423026502650631026506310110
T (°C)20.1–60.228.45–5928–59−35–5025–590–4010–50
μf (mPa.s)3.87–230.98–1.681.6–3.112.33–99.54.08–18.54.35–11.59.2–11.34
μnf/μf0.81–11–1.151.05–1.131.1–4.651.04–2.021.14–2.091.13–1.29
No. of data27111080311245
a EG/W: 25:75 by volume ratio; b EG/W: 50:50 by volume ratio; c EG/W: 60:40 by weight ratio; d EG/W: 40:60 by weight ratio.
Table 2. Performance evaluation of RBF neural networks with different Spreads.
ObjectEvaluation CriteriaSpread
10.50.30.20.1
Training samplesRMSE0.046510.044600.046300.045020.04400
MAPE (%)2.33352.273212.099671.937842.00530
SSE0.428290.393830.424540.401250.38337
R20.999250.999320.999270.999300.99934
Testing samplesRMSE0.091900.070350.044430.051240.10061
MAPE (%)4.657953.900422.432282.677204.27471
SSE0.152010.089080.035530.047270.18221
R20.995900.997600.999040.998720.99508
Total samplesRMSE0.051830.047280.046150.045570.05117
MAPE (%)2.527212.408812.127381.999452.19442
SSE0.580300.482910.460070.448520.56558
R20.999060.999210.999250.999270.99908
Table 3. Weight and bias coefficients of the developed RBF neural network.
NeuronHidden LayerOutput Layer
Weights (wij) a and BiasesWeights (wij) b and Biases
TdpφpρpμfBiasesμnffBiases
10.16160.60000.59521.00000.08172.77521.50720.0163
2−0.48740.60000.71431.00000.68592.77522.5903
30.64520.56600.32140.42000.09732.77520.0601
40.82000.60000.71431.00000.02332.77523.4089
50.40800.60000.01190.01740.10532.7752−0.4782
6−0.16290.60000.71431.00000.20412.775224.6321
70.40800.56600.98810.42000.18612.7752−0.1055
80.78180.20000.01190.42000.02112.7752−0.0298
9−0.57160.60000.59521.00001.00002.7752−2.4385
100.48920.60000.11901.00000.04032.77520.0877
110.32700.60000.71431.00000.05592.77522.0103
12−0.16290.60000.11901.00000.20412.7752−16.7539
130.81590.60000.05950.01740.09252.77520.2123
140.32640.60000.05950.01740.10752.77521.5469
150.40800.91200.47620.42000.18612.77520.1479
160.96200.56600.57140.42000.04102.77520.2334
170.40800.36200.15480.42000.18612.7752−0.0212
18−0.16290.60000.59521.00000.20412.7752−75.1746
19−0.49050.60000.11901.00000.69522.7752−0.0522
20−0.48740.60000.59521.00000.68592.7752−3.3888
210.98190.50000.04760.67040.03892.77520.0377
22−0.16290.60000.47621.00000.20412.7752115.2566
230.65401.00000.71431.00000.03012.77521.0610
240.65400.90000.71431.00000.03012.7752−1.1272
25−0.32510.60000.59521.00000.35822.77520.2584
25−0.56850.60000.71431.00000.98552.77522.1391
26−0.57160.60000.47621.00001.00002.77521.2104
270.40800.36201.00000.42000.18612.77520.4979
280.40800.91201.00000.42000.18612.77520.2536
290.65620.50000.21430.67040.09452.7752−0.0974
300.32700.60000.59521.00000.05592.7752−3.6703
310.40800.91200.07140.42000.18612.77520.1275
320.40800.36200.47620.42000.18612.77520.2454
330.45530.20000.01190.42000.01722.77520.1747
341.00000.20000.01190.42000.01612.77520.1852
350.16160.60000.47621.00000.08172.7752−0.5112
360.81690.60000.11901.00000.02342.77520.4325
37−0.48740.60000.47621.00000.68592.77521.6740
38−0.16290.60000.35711.00000.20412.7752−107.8889
390.32700.60000.47621.00000.05592.77521.4652
400.16320.60000.05950.01740.11392.77520.9067
410.81690.60000.59521.00000.02342.7752−6.2589
420.81690.60000.47621.00000.02342.77525.5200
430.57390.50000.01190.67040.11822.77520.0349
440.40800.36200.80950.42000.18612.7752−0.1272
450.48920.60000.59521.00000.04032.77520.6498
46−0.16290.60000.23811.00000.20412.775261.3817
470.32830.50000.01190.67040.23122.77520.0577
480.40800.56600.30950.42000.18612.7752−0.1083
490.24480.60000.05950.01740.10962.7752−1.7397
50−0.48550.90000.71431.00000.68042.7752−0.7083
51−0.48861.00000.71431.00000.68962.77520.6218
52−0.00070.60000.71431.00000.12522.7752−0.7176
53−0.56920.90000.71431.00000.98852.7752−0.0385
540.65140.60000.23811.00000.03022.7752−0.1993
550.81690.60000.35711.00000.02342.7752−2.0841
560.16160.60000.59521.00000.08172.77521.5072
a Weight connection from the input layer to the hidden layer; b Weight connection from the hidden layer to the output layer.
Table 4. Performance evaluation of different modes for the total viscosity data.
Evaluation CriteriaRBF Neural NetworkBatchelor ModelChen Model
RMSE0.046150.822000.77129
MAPE (%)2.1273824.234921.79539
SSE0.46007145.94871128.49640
R20.999250.762440.79085
Table 5. Comparisons of the RBF predicted viscosity ratio of TiO2-ethylene glycol nanofluids with the experimental data of Chen et al. [12].
T (°C)φp (%)Experiment (P)RBF Prediction (Q) | P Q | P × 100 %
60.171.80.9940.9900.434
55.261.81.0001.0232.330
50.031.81.0001.0050.488
45.271.80.9940.9742.090
40.211.81.0000.9613.875
35.171.81.0000.9851.529
30.161.80.9941.0253.055
25.191.81.0001.0414.068
20.121.80.9940.9950.082
60.170.40.8520.8500.270
55.100.40.8620.8721.217
50.030.40.8620.8550.829
45.120.40.8570.8303.173
40.070.40.8470.8252.603
35.170.40.8520.8480.424
30.160.40.8470.8803.868
25.190.40.8470.8814.038
20.120.40.8370.8192.193
60.170.10.8330.8221.268
55.100.10.8280.8462.220
50.190.10.8280.8330.609
45.120.10.8190.8101.011
40.070.10.8140.8061.020
35.170.10.8140.8241.284
30.160.10.8140.8474.039
25.190.10.8140.8362.675
20.120.10.8050.7585.788
Table 6. Comparisons of the RBF predicted viscosity ratio of SiO2-ethylene glycol/water (50:50 by volume ratio) nanofluids with the experimental data of Jamshidi et al. [13].
T (°C)φp (%)Experiment (P)RBF Prediction (Q) | P Q | P × 100 %
28.650.11.0821.0991.549
38.180.11.0761.0730.258
47.910.11.0641.0630.067
55.810.11.1001.0980.202
61.280.11.1321.0784.746
28.450.11.1281.0982.703
36.550.11.1191.0823.323
45.070.11.0541.0560.196
50.950.11.0911.0781.243
58.850.11.1341.0953.432
Table 7. Comparisons of the RBF predicted viscosity ratio of CuO-ethylene glycol/water (60:40 by weight ratio) nanofluids with the experimental data of Namburu et al. [16].
T (°C)φp (%)Experiment (P)RBF Prediction (Q) | P Q | P × 100 %
9.9701.0001.2041.1811.940
20.3051.0001.1871.2172.547
29.8601.0001.1701.1740.308
40.1961.0001.1361.1231.195
0.0062.0001.5961.5115.307
10.1462.0001.5961.5085.504
20.2882.0001.5281.5280.019
30.0402.0001.4771.4591.216
−0.1993.0001.8171.7891.566
10.1373.0001.7831.8091.451
20.0823.0001.7491.8033.085
29.6204.0002.0892.0681.028
Table 8. Performance evaluation of the RBF neural network with different viscosity data.
Evaluation Criteria216 Data200 Data160 Data120 Data
RMSE0.046150.070170.095470.37982
MAPE (%)2.127382.889203.644708.75159
SSE0.460070.984681.4584417.31116
R20.999250.998320.995050.90323

