Abstract
Proteomics research has become one of the most important topics in the field of life science and natural science. At present, research on protein–protein interaction networks (PPIN) mainly focuses on detecting protein complexes or function modules. However, existing approaches are either ineffective or incomplete. In this paper, we investigate detection mechanisms of functional modules in PPIN, including open database, existing detection algorithms, and recent solutions. After that, we describe the proposed approach based on the simplified swarm optimization (SSO) algorithm and the knowledge of Gene Ontology (GO). The proposed solution implements the SSO algorithm for clustering proteins with similar function, and imports biological gene ontology knowledge for further identifying function complexes and improving detection accuracy. Furthermore, we use four different categories of species datasets for experiment: fruitfly, mouse, scere, and human. The testing and analysis result show that the proposed solution is feasible, efficient, and could achieve a higher accuracy of prediction than existing approaches.
1. Introduction
Proteomics is one of the most important topics in the fields of life science and natural science [1,2,3,4,5]. Considering that proteins alone rarely exhibit their biological functions in individuals, the understanding of protein–protein interactions (PPI) [6] is the basis of revealing the activity of protein and promotes the study of various diseases and development of new drugs.
In the past 10 years, substantial work was conducted to promote the research in the field of PPI, such as publications in Nature [2] and Science [3], proceedings of the National Academy of Sciences [3], and nucleic acid research [7]. Available data on PPI are greatly enriched because of the fast development of high-throughput screening [7] and data mining technologies [8]. Some widely used and most complete open datasets are also released, for instance, the Biomolecular Interaction Network Database (BIND) [9], Database of Interaction Proteins (DIP) [10], IntAct [11], Human Protein Reference Database (HPRD) [12], and Molecular Interaction Database (MINT) [13,14].
However, the existing solution is incomplete or inaccurate due to the following technical challenges. On one hand, high-throughput screening technology generates a huge amount of noisy data and higher false positive rates, while the experimental method loses lots of real interactions (false negatives) [15]. On the other hand, the existing computation approaches (described in Section 2) are inefficient, computationally complex, or lack of convincing results. In this paper, we investigate protein function module detection and propose a lightweight and efficient simplified swarm optimization-based protein function module detection with the following contributions:
- We investigate PPI datasets and existing function module detection methods and select four typical species of protein-protein interaction data from the DIP database for the experiment. A specific data crawler is developed to extract data features from these datasets.
- The proposed PPIN function module detection is described from a few aspects: system model, feature selection, mathematical description, model optimization, etc. The proposed solution implements an SSO algorithm for clustering proteins with similar function and imports biological gene ontology knowledge for further identification.
- Experiments are conducted to validate feasibility and efficiency of the proposed approaches. The evaluation of “degree of polymerization” and “similarity between classes” further proves the precision improvement and correctness of our proposed solution.
The paper is organized as follows. Section 2 introduces the existing research, including the graph theory-, machine learning-, and intelligent algorithm-based approaches. Section 3 describes our solution, including the system model, feature extraction, and SSO-based approach. The dataset and result evaluation are explained in Section 4. Finally, experiment conclusions are presented in Section 5.
2. Related Works
2.1. Protein–Protein Interaction Datasets
There are a few protein–protein interaction datasets described in the following:
BIND (Biomolecular Interaction Network Database) contains the known interactions among biological molecules, not only among proteins but also between proteins and DNA, RNA, small molecules, lipids, and carbohydrate substances. BIND is updated daily and has extensive coverage, including human, fruit flies, yeast, nematodes, and other species. DIP was created to establish a simple, easy-to-use, and highly credible PPI public database. It specializes in storing binary PPIs from the literature conf irmed by experiments, as well as the protein complexes from Protein Data Bank (PDB).
IntAct (Molecular Interaction Database) mainly records binary interactions and their experiment methods, experimental conditions, and interaction domain structures in people, yeast, fruit flies, escherichia coli, and other species. IntAct query is divided into basic query and advanced query (more accurate).
HPRD (Human Protein Reference Database) contains protein annotations, PPIs, posttranslational modifications, subcellular localizations, and other comprehensive information.
MINT (Molecular Interaction Database) mainly stores physical interaction of proteins, particularly PPIs of mammals. Besides, it also contains the PPIs of yeast, fruit flies, and viruses. Considering the deviation of definition and the promiscuity in different databases, Gene Ontology (GO), which is developed and maintained by the GO Consortium, should be introduced for the sharing and interoperability among bioinformatics data. Therefore, the retrieval results among different databases could be unified.
2.2. Existing Works
Existing works in the detection of protein function modules could be divided into three categories:
Graph theory-based approach. Similar to a computer network, the graph theory is introduced to improve the detection of protein functional modules, mainly based on three approaches: hierarchical algorithm, partitioning algorithm, and density algorithm [16]. The hierarchical algorithm (such as, modularity division-based method [17], etc.) is based on similarity of the connections between each node. For the partitioning algorithm, the most representative method is based on restricted neighborhood search clustering (RNSC) [18]. Although both hierarchical and partitioning algorithms are easy to understand and implement, the clustering number should be determined beforehand and the function modules cannot be overlapped.
Machine learning-based approaches. Considering the disadvantages (poor scalability and low clustering) of original Markov Clustering (MCL) algorithm, Lei et al. (2015) proposed an improved MCL clustering algorithm for PPIN [19] via importing two parameters: punishment and mutation factors. This approach improves convergence speed but leads to substantial computation complexity. In literature [20], Deddy proposed a rapid and lightweight hidden layer neural network prediction algorithm based on the Extreme Learning Machine (ELM) algorithm. It uses the speed advantage of the ELM algorithm and achieves better protein function module prediction results.
Intelligence algorithm-based approaches. Swarm intelligence algorithms are also implemented for PPIN function module detection. Examples of these algorithms include Ant Colony Optimization (ACO) [21], Particle Swarm Optimization (PSO) [22], and Artificial Bee Colony (ABC) [23]. Sallim applied ACO algorithm to the PPIN complex clustering problem, and further proposed the optimization strategies in protein interaction networks [24]. In 2012, Ji introduced a novel ACO-based functional module detection (NACO–FDM) [25] algorithm to improve the efficiency in searching for an optimal path. However, this algorithm easily falls into the local optimum. In literature, another ACO-MAE mechanism that combines ACO with the idea of multi-agent evolution (MAE) was developed to achieve better prediction accuracy.
Besides, some other works have demonstrated higher performance with a mixture of graph-based approach and machine learning-based approaches [26,27]. The algorithm is based on prior calculation of parameters on the protein residue networks and later machine learning. However, this approach still needs a lot of noted samples for training.
2.3. Clustering Evaluation
In this paper, the clustering evaluation indices include the degree of polymerization (cohesion) inside protein function module, and the deviation degree between modules (separation). Cohesion refers to the similarity degree of each data object in the same category. The higher the degree of polymerization, the higher the similarity. Separation refers to the dissimilarity between two different protein function modules. The higher degree of separation between two categories, the higher the distance between two cluster centers. From mathematics, the cohesion and separation functions are described as follows:
where S and D represent the values of protein nodes in the functional similarity matrix and distance matrix, respectively.
2.4. Discussion
However, there are still a few disadvantages in existing research. Graph-based approaches are far from being precise (with a highest precision rate of 46% [16]) because some clusters may be too thin due to the considerable weights between loosely connected nodes. Existing machine/deep learning-based approaches need huge amount of denoted sample for training, and this is difficult to implement in PPIN field. On the contrary, although intelligence algorithms (mainly ACO-related approaches) implemented have shown better precision rates and efficiency than graph-based solutions, more intelligent algorithms should be considered and implemented.
The detection of protein function modules is an NP hard problem [28]. Since the PSO-related solution is efficient and has been implemented in different kinds of NP hard problems, we propose the enhancement of PSO, Simplified Swarm Optimization (SSO) algorithms, for implementation in the detection of protein function modules. Theoretically, an SSO-based solution is capable of achieving better precision than the PSO algorithm and reduces computing complexity.
3. Simplified Swarm Optimization-Based Detection
In this section, we describe the proposed SSO-based solution in four steps: system model, feature extraction, mathematical description, and model optimization.
3.1. Interaction Model
Figure 1a–e illustrates the evolution process of protein function module detection. First, the PPI network is abstracted into the format of a protein distance matrix. The structure model is built by the measure of distance between each protein. Afterwards, the SSO algorithm is imported to search the shortest path between each node. Finally, the cutting and filtering strategies are defined and implemented to generate a clustering result.
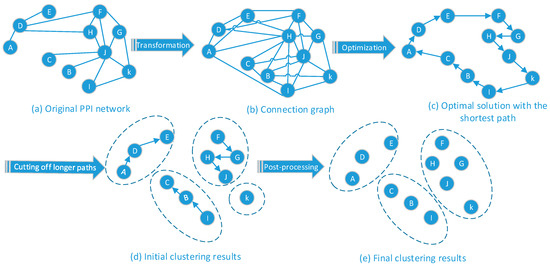
Figure 1.
Interaction Model.
3.2. Feature Extraction
After acquiring a dataset from DIP and GO databases, features can be extracted in the following steps:
- Noise Filter. Noise data refers to the existence of errors, redundant data, or abnormal data in crawled data. For example, in interaction.xml-based crawled data, the tag field “DIP-nnE” may be empty or not found. Therefore, eliminating noise and redundant data is the first step before the experiment.
- Feature Selection. Feature selection is performed through the manual respection of protein xml data. For example, in the main part of the XML file, the tag names “interactorList” and “interactionList” indicate the interaction relationship among protein nodes. Therefore, feature data are selected through the manual inspection of protein data.
- Feature Extraction and Reformat. After the feature selection, related data (e.g., protein id and interactor id) are extracted, reformatted, and stored in the structured database.
3.3. Mathematics Model
3.3.1. Model Establishment
Assume the initial particle swarm size n, the problem space dimensions m, the location , where i = 1, 2, 3, … n, is the value of i-th particle with respect to m-th dimension of feature space at time t; the particles in the search process reach the optimal location and are marked as pti; the optimal location for the group is gti. Therefore, the location of particle i in j dimension at time t is described in the following formulas:
In Equation (3), X represents the new value of the particle in every dimension randomly generated; the random number is between (0, 1); Cw, Cp, and Cg are the three predetermined positive constants with Cw < Cp < Cg.
In this study, we use the topological structure of a PPIN [29] as the basis, with the individual proteins as nodes and the interactions between proteins as lines, to construct a PPIN model (with interaction model shown in Figure 2, and adjacency matrix in Table 1). The interaction between the proteins is denoted as 1, whereas no relationship between proteins is denoted as 0.
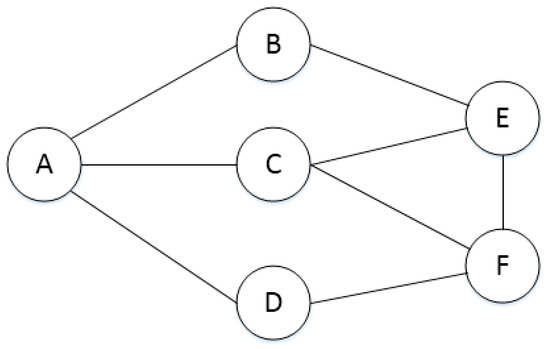
Figure 2.
Protein interaction network.

Table 1.
Adjacency matrix.
Therefore, the distance between proteins dij (difference between two proteins), can be calculated according to Equation (4):
where i and j express the two proteins. Normally, the value of dij is greater than 0; in some special cases, when proteins i and j are in completely different function modules, dij achieves the highest value 1.
3.3.2. Parameter Setting
Parameter setting plays a key important role in detecting function modules. In SSO algorithm, the initial location of a particle swarm set to be random. In addition, Cw, Cp, and Cg are set as 0.25, 0.5, and 0.75 respectively. The values of Cw, Cp, and Cg in this paper are set as 0.1, 0.55, and 0.8 to expand the search area to a global search at the beginning of the iteration. Table 2 shows the parameter setting of the SSO and PSO algorithms used in the experiments (t expresses t-th, Max_GEN expresses maximum number of iterations).

Table 2.
Parameter setting for PSO and SSO algorithm 1.
3.4. Model Optimization
Model optimization is divided into two main parts: module planning based on function information, module planning based on topology.
3.4.1. Module Planning Based on Function Information
The objective of this step is to merge the similar protein function modules (PFMs). The basic idea is to measure the similarity of two modules. When the similarity is greater than a certain threshold, two modules can be merged, based on Equation (5):
where MS and MT represent the size of the two protein function modules (including the number of proteins) respectively, and s(i, j) is characterized by the following Equation (6):
Among these paramaters, fij is the similarity function based on gene topology and is characterized by the following Equation (7) [30]:
In Equation (7), gi and gj represent the comment values of protein i and j in the Gene Ontology respectively [31]. The greater value of fij indicates higher similarity between two proteins.
3.4.2. Module Planning Based on Topology
This step measures the density of the initial protein function module and reduces the sparse protein module through filter setting. The density is calculated according to Equation (8):
where n denotes the number of current protein function module and e represents the number of interactions in the module.
4. Experiments
4.1. Dataset Description
We select four different categories of species data sets for experiment: fruitfly, mouse, scere, and human. Additionally, we use the GO (Gene Ontology) for unifying the format of four species data. Via extracting and matching, the final data statistics are illustrated in Table 3.

Table 3.
Matching statistics 1.
4.2. Evaluations
4.2.1. Complexity and Running Times
First, we compare the complexity between SSO and PSO (a typical intelligent algorithm). Assuming that the iteration number of i particles was Ni, i = 1, 2, ..., m, m is the maximum number of iteration, . Assuming that each particle in each iteration requires the computational time Tt, the total execution time of PSO algorithm for optimal operation is . As for SSO, assuming that each particle in each iteration requires the computational time Dt, the total execution time in optimal operation is , where , . Table 4 further illustrates the experimental comparison, and shows that the SSO algorithm is more efficient than the PSO algorithm.

Table 4.
The average running time comparison.
4.2.2. Results Analysis via Threshold Setting
Besides, for four species data, eight different threshold values were selected in the experiment: 0.05, 0.055, 0.06, 0.065, 0.07, 0.075, 0.08, and 0.085, with the result illustrated in Figure 3, Figure 4 and Figure 5. Results show that when the threshold value increases to a certain extent, the unnecessary protein filtration is greatly reduced (illustrated in Figure 3b), and the size of the protein function module (PFM) increases (illustrated in Figure 3a). However, the other four aspects of the effect including degree of polymerization in the module, the deviation degree between modules, and so on (corresponding to Figure 4 and Figure 5) remained nearly at the same level.
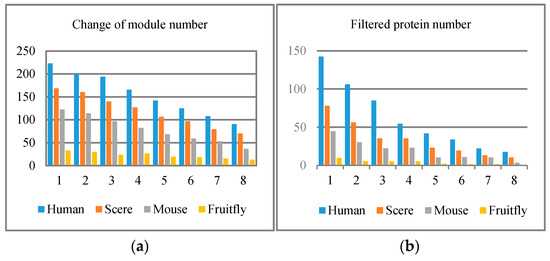
Figure 3.
Four species experimental results. Threshold value changes among 1 (0.05), 2 (0.055), 3 (0.06), 4 (0.065), 5 (0.07), 6 (0.075), 7 (0.08), 8 (0.085). (a) Change of module number; (b) filtered protein number.
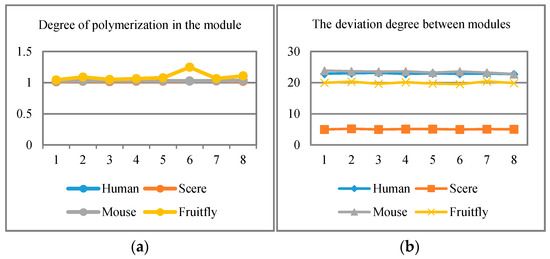
Figure 4.
(a) Degree of polymerization in the module; (b) deviation degree between modules.
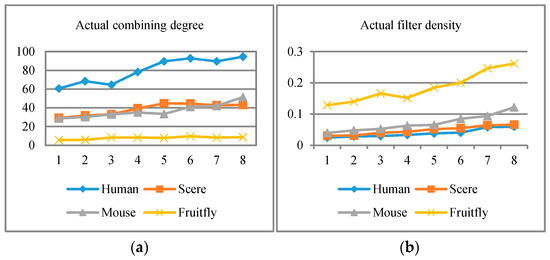
Figure 5.
(a) Actual combining degree in each threshold; (b) actual filter density during the experiment.
In order to evaluate the efficiency and feasibility of SSO algorithm for protein module detection, we take the human dataset and conduct experiments for evaluation (based on cluster indices described in Section 2.3). The reason for the selection of human species is that the number of nodes is more than other experimental data and the data integrity is better, which can better reflect the characteristics of the algorithm. Figure 6 shows the results under the detection strategy of PSO and SSO.
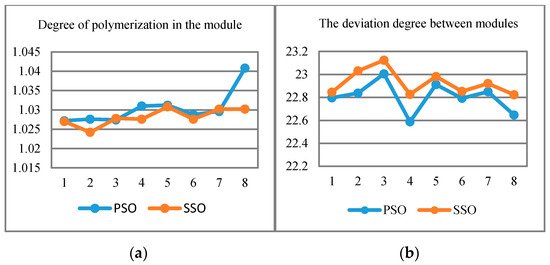
Figure 6.
(a) Degree of polymerization in the module; (b) degree of deviation between modules.
In the Figure 6, we find that the curves of PSO and SSO strategies are more or less intertwined. The difference between PSO and SSO is not obvious in the index of “cohesion”, however, the curve of SSO is more stable than PSO algorithm. This indicates that the SSO-based solution outperforms the PSO-based approach in “Separation”.
Meanwhile, Table 5 indicates that the number of function module generated by SSO algorithm is a bit lower than PSO in fruitfly species. This may be because of the small number of protein nodes in fruitfly species. Table 6 shows the filtered protein number for PSO and SSO algorithms, which indicates that SSO is significantly better than those of PSO, especially when the number of protein increases. Table 7 shows the degree of polymerization in the module for both PSO and SSO algorithms. A higher value indicates higher similarity in the module. The result also reveals that the two algorithms are relatively close, however, the SSO algorithm has better stability.

Table 5.
Change of module number for PSO and SSO algorithms.

Table 6.
Filtered protein number for PSO and SSO algorithm.

Table 7.
Degree of polymerization in the module for PSO and SSO algorithm.
5. Conclusions
In this study, we introduce relevant research on protein interaction networks conducted in recent years, including the commonly used protein databases and existing detection methods. We then describe our proposed SSO algorithm for the detection problem of protein function module (PFM) in PPIN. Simultaneously, biological gene ontology knowledge is combined to improve the prediction accuracy. The performance of SSO is compared with existing work (typically PSO algorithm) through the analysis of the experimental results. Results show the feasibility and efficiency of our proposed SSO algorithm. All the datasets and code related with this paper are available from https://github.com/wulingting/PPIN-SSO-and-PSO-algorithms.
Acknowledgments
This work is supported by the National Natural Science Foundation of China under Grant No. 61502106; Fujian Major Project of Regional Industry 2014H4015.
Author Contributions
Xianghan Zheng and Lingting Wu conceived and designed the experiments; Lingting Wu performed the experiments; Xianghan Zheng and Shaozhen Ye analyzed the data; Riqing Chen contributed reagents, materials, and analysis tools; Lingting Wu wrote the paper; Xianghan Zheng participated in paper revision and made many suggestions. All authors read and approved the final manuscript.
Conflicts of Interest
The authors declare no conflict of interest.
References
- Xu, B.; Guan, J. From function to interaction: A new paradigm for accurately predicting protein complexes based on protein-to-protein interaction networks. IEEE/ACM Trans. Comput. Biol. Bioinform. 2014, 11, 616–627. [Google Scholar] [PubMed]
- Islam, M.F.; Hoque, M.M.; Banik, R.S.; Roy, S.; Sumi, S.S.; Hassan, F.M.N.; Tomal, M.T.S.; Ullah, A.; Rahman, K.M.T. Comparative analysis of differential network modularity in tissue specific normal and cancer protein interaction networks. J. Clin. Bioinform. 2013, 3, 19. [Google Scholar] [CrossRef] [PubMed]
- Ahn, Y.Y.; Bagrow, J.P.; Lehmann, S. Link communities reveal multiscale complexity in networks. Nature 2010, 435, 761–764. [Google Scholar] [CrossRef] [PubMed]
- Kachroo, A.H.; Laurent, J.M.; Yellman, C.M.; Meyer, A.G.; Wilke, C.O.; Marcotte, E.M. Systematic humanization of yeast genes reveals conserved functions and genetic modularity. Science 2015, 348, 921–925. [Google Scholar] [CrossRef] [PubMed]
- Tanay, A.; Sharan, R.; Kupiec, M.; Shamir, R. Revealing modularity and organization in the yeast molecular network by integrated analysis of highly heterogeneous genomewide data. Proc. Natl. Acad. Sci. USA 2004, 101, 2981–2986. [Google Scholar] [CrossRef] [PubMed]
- Szklarczyk, D.; Franceschini, A.; Wyder, S.; Forslund, K.; Heller, D.; Huerta-Cepas, J.; Simonovic, M.; Roth, A.; Santos, A.; Tsafou, K.P.; et al. Protein–protein interaction networks, integrated over the tree of life. Nucleic Acids Res. 2015, 39, D561–D568. [Google Scholar]
- Ding, Y.; Tang, J.; Guo, F. Identification of Protein–Protein Interactions via a Novel Matrix-Based Sequence Representation Model with Amino Acid Contact Information. Int. J. Mol. Sci. 2016, 17, 1623. [Google Scholar] [CrossRef] [PubMed]
- Szklarczyk, D.; Franceschini, A.; Kuhn, M.; Simonovic, M.; Roth, A.; Minguez, P.; Doerks, T.; Stark, M.; Muller, J.; Bork, P.; et al. The STRING database in 2011: Functional interaction networks of proteins, globally integrated and scored. Nucleic Acids Res. 2011, 1093, D561–D568. [Google Scholar] [CrossRef] [PubMed]
- Xu, H.; Li, X.; Zhang, Z.; Song, J. Identifying Coevolution between Amino Acid Residues in Protein Families: Advances in the Improvement and Evaluation of Correlated Mutation Algorithms. Curr. Bioinform. 2013, 8, 148–160. [Google Scholar] [CrossRef]
- Li, H.; Chang, Y.; Yang, L.; Bahar, I. The Gaussian network model database for biomolecular structural dynamics. Nucleic Acids Res. 2016, 44, D415–D422. [Google Scholar] [CrossRef] [PubMed]
- Blohm, P.; Frishman, G.; Smialowski, P. A database of non-interacting proteins derived by literature mining, manual annotation and protein structure analysis. Nucleic Acids Res. 2014, 42, D396–D400. [Google Scholar] [CrossRef] [PubMed]
- Orchard, S.; Ammari, M.; Aranda, B.; Breuza, L.; Briganti, L.; Broackes-Carter, F.; Nancy, H.; Campbell, G.C.; Chen, C.; del-Toro, N. The MIntAct project—IntAct as a common curation platform for 11 molecular interaction databases. Nucleic Acids Res. 2014, 1093, D358–D363. [Google Scholar] [CrossRef] [PubMed]
- Motono, C.; Nakata, J.; Koike, R. A comprehensive database of predicted structures of all human proteins. Nucleic Acids Res. 2011, 39, D487–D493. [Google Scholar] [CrossRef] [PubMed]
- Licata, L.; Briganti, L.; Peluso, D. MINT, the molecular interaction database: 2012 update. Nucleic Acids Res. 2012, 40, D857–D861. [Google Scholar] [CrossRef] [PubMed]
- Ji, J.Z.; Jiao, L.; Yang, C.C.; Lv, J.W.; Zhang, A.D. MAE-FMD: Multi-agent evolutionary method for functional module detection in protein-protein interaction networks. BMC Bioinform. 2014, 15, 325. [Google Scholar] [CrossRef] [PubMed]
- Ester, B.M.; Kriegel, H.P.; Sander, J.; Xu, X. A Density Based algorithm for discovering clusters in large spatial databases with Noise. In Proceedings of the International Conference on Knowledge Discovery and Data Mining, Chicago, IL, USA, 11–14 August 2013. [Google Scholar]
- Newman, M.E. Fast algorithm for detecting community structure in networks. Phys. Rev. E 2004, 69, 066133. [Google Scholar] [CrossRef] [PubMed]
- Hartuv, E.; Shamir, R. A clustering algorithm based on graph connectivity. Inf. Proc. Lett. 2000, 76, 175–181. [Google Scholar] [CrossRef]
- Rujirapipat, S.; Mcgarry, K.; Nelson, D. Bioinformatic Analysis Using Complex Networks and Clustering Proteins Linked with Alzheimer’s Disease. In Advances in Computational Intelligence Systems; Springer: Cham, Germany, 2017; pp. 219–230. [Google Scholar]
- Ruan, P.; Hayashida, M.; Maruyama, O.; Akutsu, T. Prediction of heterotrimeric protein complexes by two-phase learning using neighboring kernels. BMC Bioinform. 2014, 15, S6. [Google Scholar] [CrossRef] [PubMed]
- Lei, X.J. The Information Flow Clustering Model and Algorithm Based on the Artificial Bee Colony Mechanism of PPI Network. Chin. J. Comput. 2012, 35, 134–145. [Google Scholar] [CrossRef]
- Dorigo, M. Ant Colony Optimization; MIT Press/Bradford Books: Cambridge, MA, USA, 2004. [Google Scholar]
- Kennedy, J.; Eberhart, R. Particle swarm optimization. In Proceedings of the IEEE International Conference on Neural Networks, Perth, Australia, 27 November–1 December 1995; pp. 1942–1948. [Google Scholar]
- Karaboga, D.; Basturk, B. On the performance of artificial bee colony (ABC) algorithm. Appl. Soft Comput. 2008, 8, 687–697. [Google Scholar] [CrossRef]
- Ji, J.Z.; Liu, Z.J. Ant colony optimization with multi-agent evolution for detecting functional modules in protein-protein interaction networks. In Proceedings of the 3rd International Conference on Information Computing and Applications, Chengdu, China, 14–16 September 2012; pp. 445–453. [Google Scholar]
- Rodriguez-Soca, Y.; Munteanu, C.R.; Dorado, J.; Pazos, A.; Prado-Prado, F.J.; González-Díaz, H. A web server for prediction of unique targets in trypanosome proteome by using electrostatic parameters of protein-protein interactions. J. Proteome Res. 2010, 9, 1182–1190. [Google Scholar] [CrossRef] [PubMed]
- Rodriguez-Soca, Y.; Munteanu, C.R.; Dorado, J.; Rabuñal, J.; Pazos, A.; González-Díaz, H. A web-server predicting complex biopolymer targets in plasmodium with entropy measures of protein–protein interactions. Polymer 2010, 51, 264–273. [Google Scholar] [CrossRef]
- Ji, J.; Liu, Z.; Zhang, A.; Jiao, L.; Liu, C. Improve ant colony optimization for detecting functional modules in protein-protein interaction networks. In Proceedings of the 3rd International Conference on Information Computing and Applications, Chengdu, China, 14–16 September 2012; pp. 404–413. [Google Scholar]
- Debby, D.W.; Ran, W.; Hong, Y. Fast prediction of protein-protein interaction sites based on Extreme Learning Machines. Neurocomputing 2014, 128, 258–266. [Google Scholar]
- Schlicker, A.; Albrecht, M. FunSimMat: A comprehensive functional similarity database. Nucleic Acids Res. 2008, 36, D434–D439. [Google Scholar] [CrossRef] [PubMed]
- Ashburner, M.; Ball, C.A.; Blake, J.A.; Botstein, D.; Butler, H.; Cherry, J.M.; Davis, A.P.; Dolinski, K.; Dwight, S.S.; Eppig, J.T.; et al. Gene ontology: Tool for the unification of biology. The Gene Ontology Consortium. Nat. Genet. 2000, 25, 25–29. [Google Scholar] [CrossRef] [PubMed]
© 2017 by the authors. Licensee MDPI, Basel, Switzerland. This article is an open access article distributed under the terms and conditions of the Creative Commons Attribution (CC BY) license (http://creativecommons.org/licenses/by/4.0/).