3.1. Positioning Accuracies under Different Operational Temperature Conditions
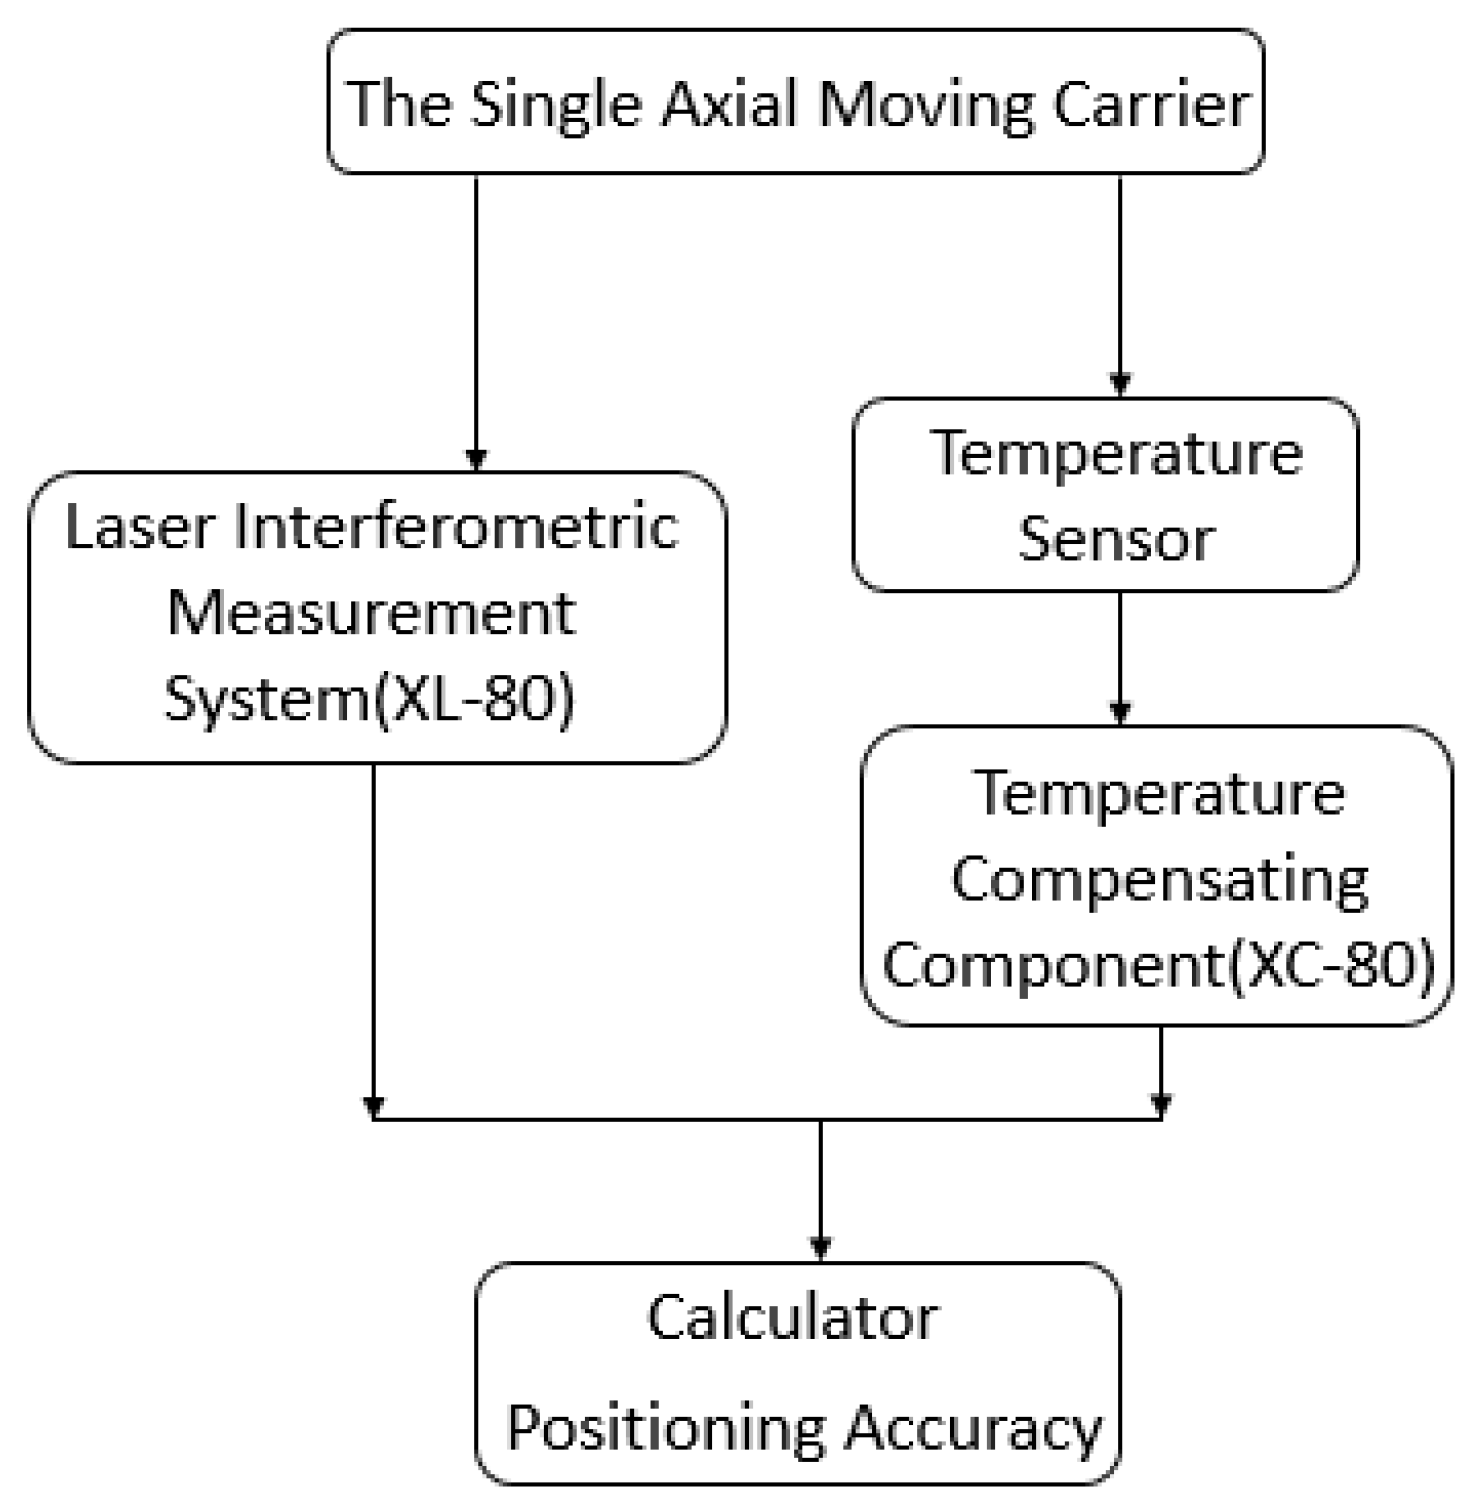
In our experiments, the moving speed and movement stroke of the single axial carrier are 8.5 mm/s and 400 mm, respectively. An air velocity of 1.18 m/s was employed. The air inlet and outlet were located on the same side of the chamber. During the measurements, one stroke of 400 mm was divided into six individual measuring points. The distance between each point was 80 mm, and the positioning accuracy of the carrier can be obtained by averaging the measured positioning accuracies of the six points. Different environmental temperatures can be created within the designed environmental chamber to investigate the ambient temperature effect on the positioning accuracy of the moving carrier.
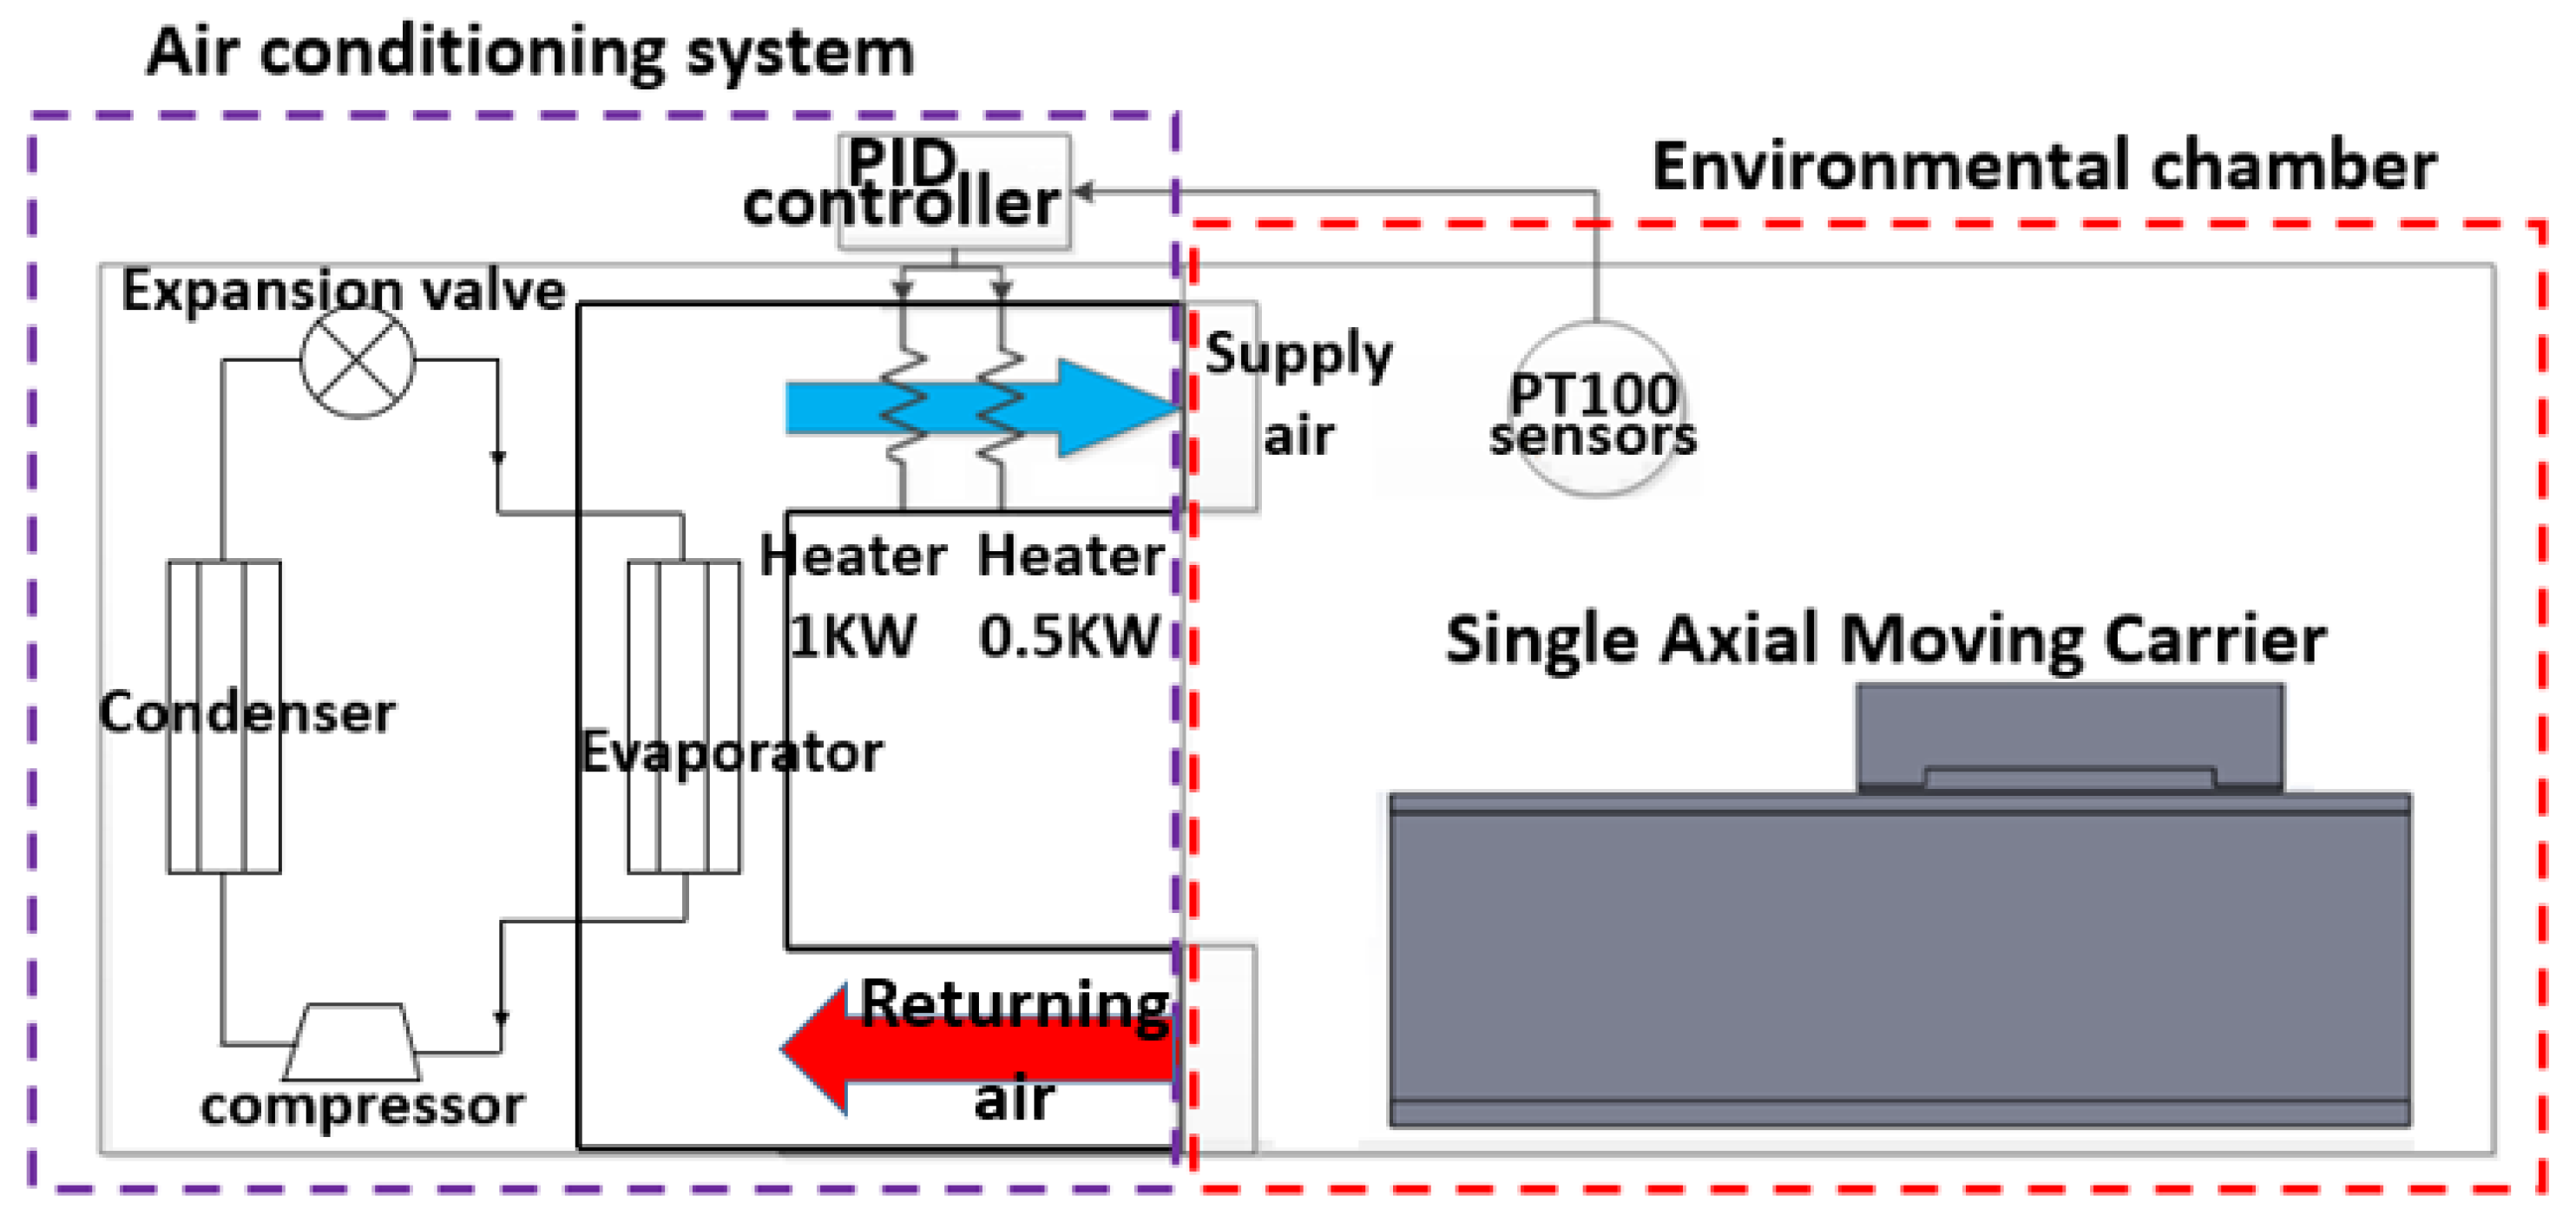
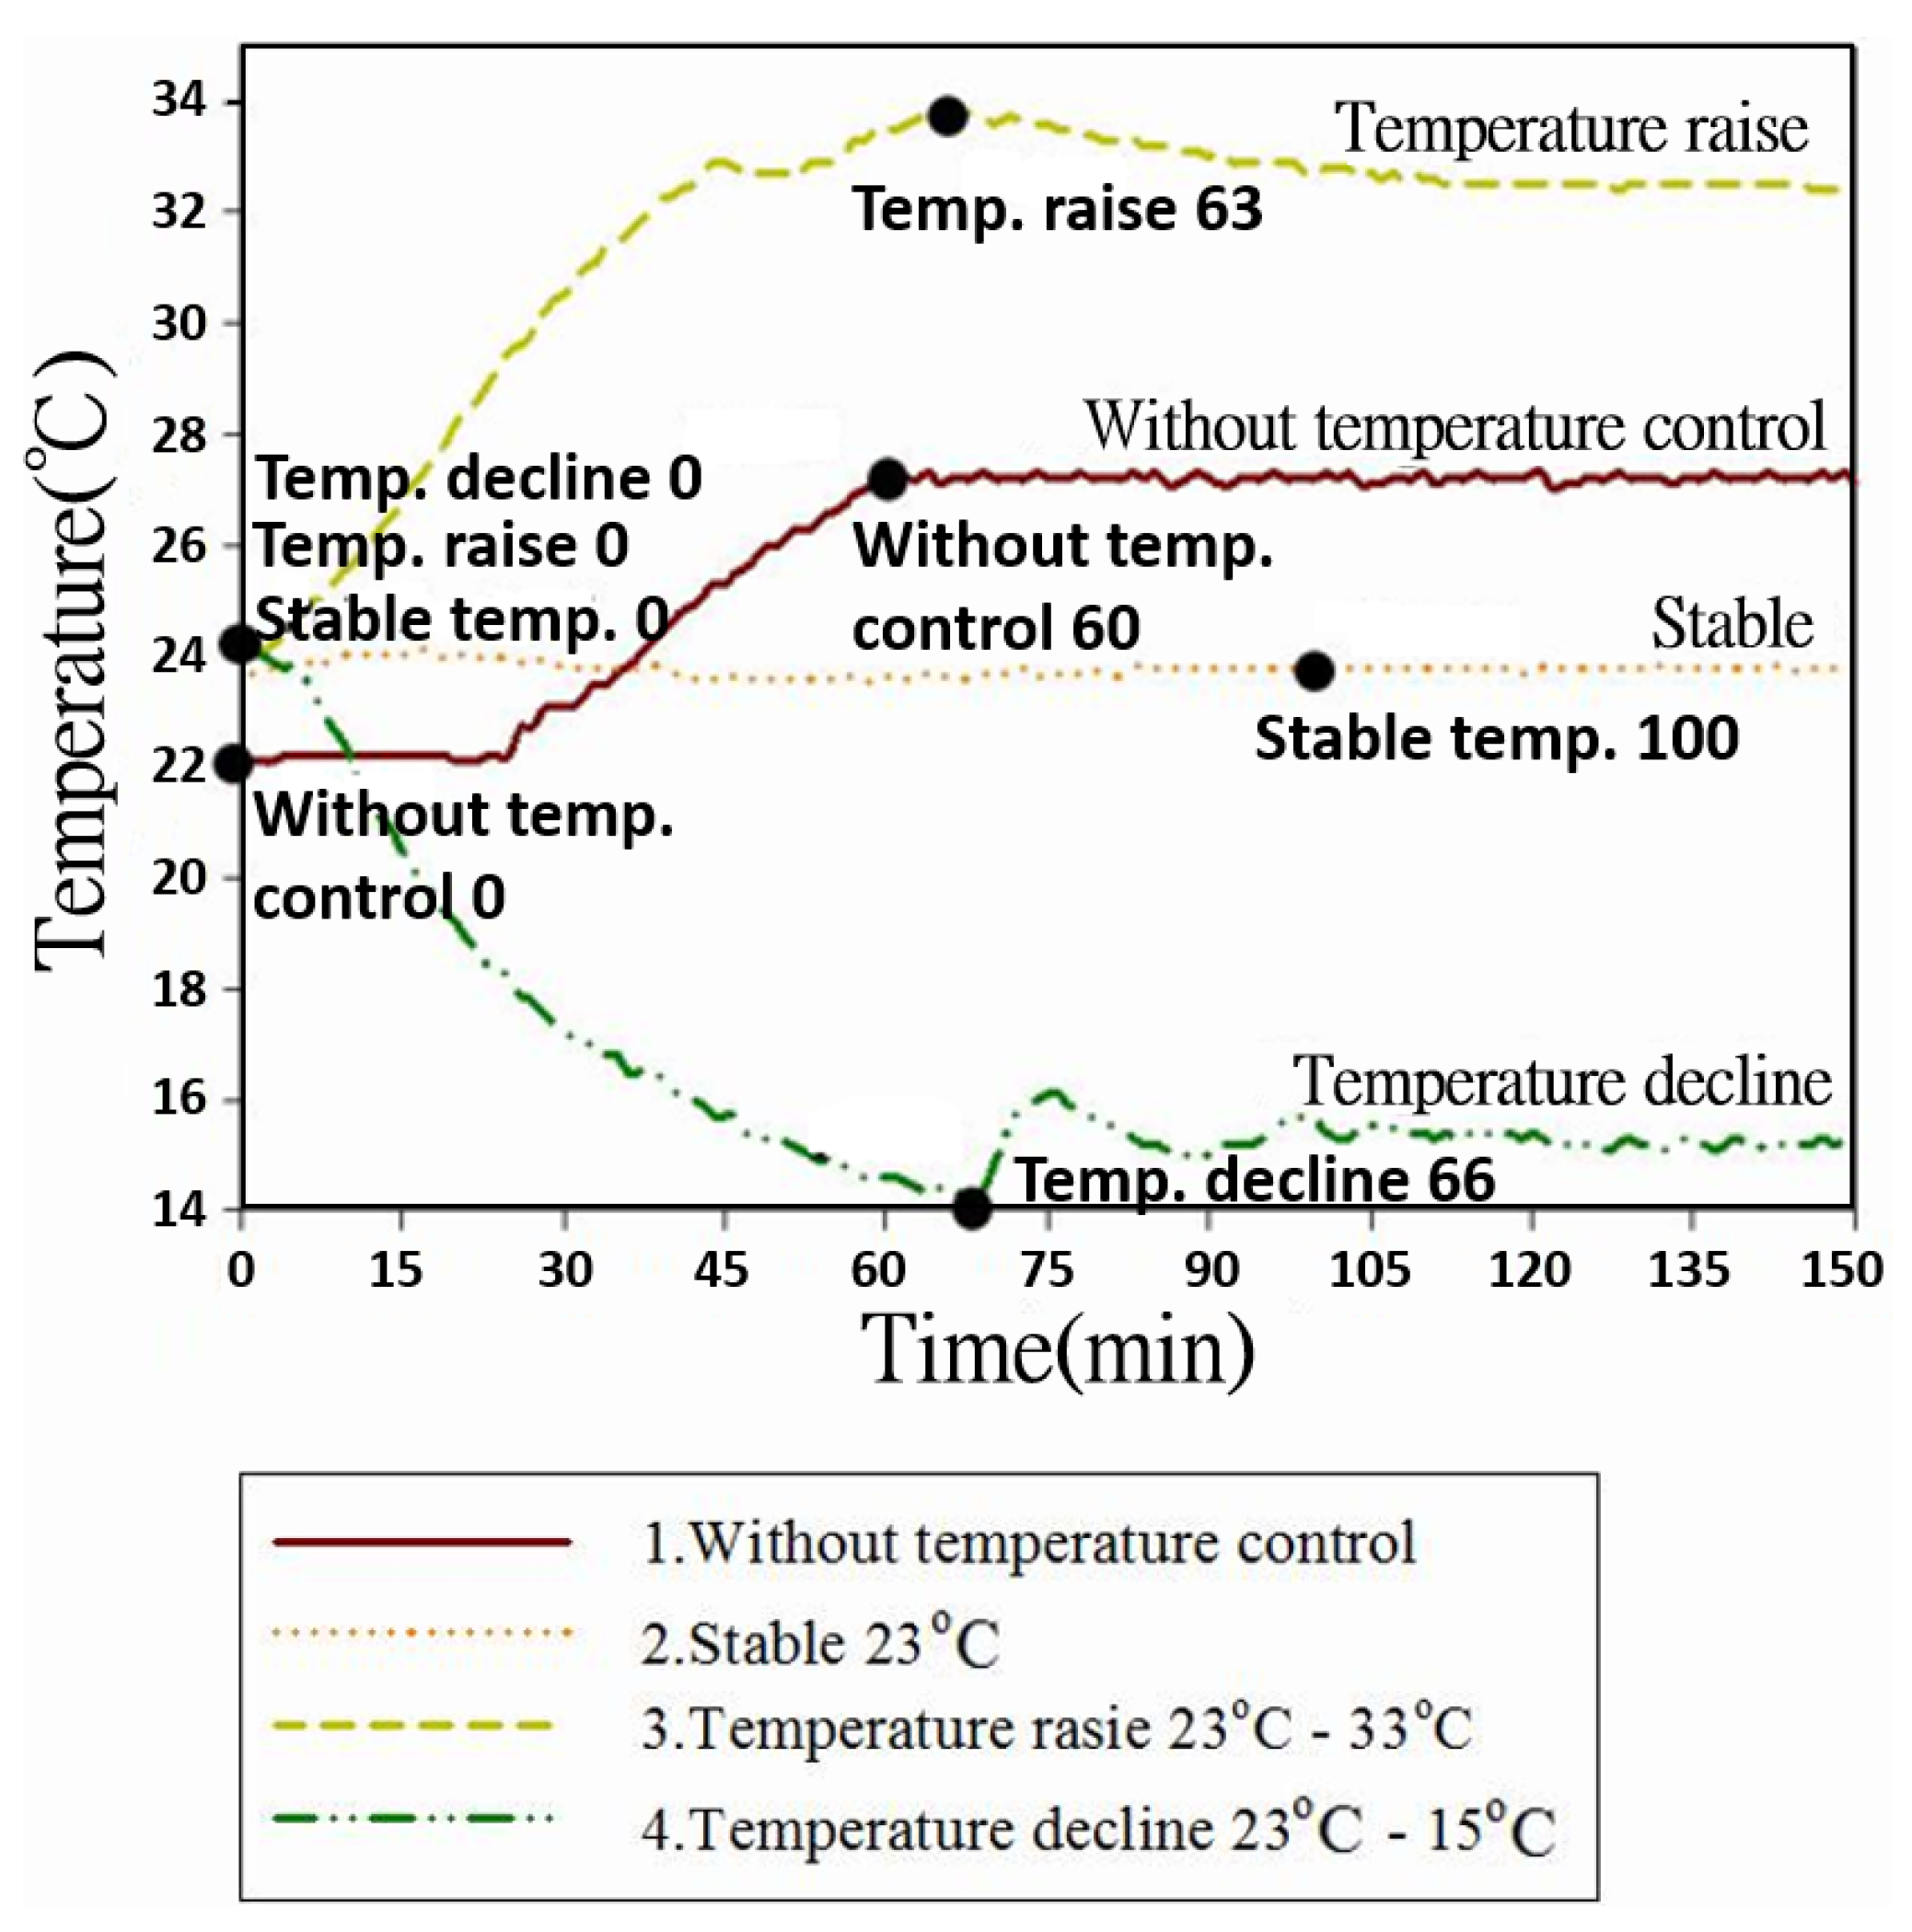
Figure 5 illustrates the distribution of the temperature rise and drop within the chamber over a period of 150 min, respectively, in which the brown line indicates the temperature distribution in the chamber without an environmental control. In Taiwan, the lowest indoor temperature in wintertime is about 15 °C, and the highest indoor temperature in summertime is about 33 °C. Thus, the two temperatures are chosen to be the limit values in the cases of temperature rise and temperature decline. In this case, the initial temperature was maintained at approximately 23 °C while the carrier was halted. When the time reached 30 min, the carrier started to move, and heat was generated from the driving linear motor and the frictional force between the carrier and the linear guideway. Thus, the temperature inside the chamber gradually increased with time and attained a value of 27 °C after 60 min. The dotted line indicates the temperature distribution in the case in which the environmental temperature was controlled to approach a value of 23 °C with a 0.5 °C variation, while the carrier periodically moved at a speed of 400 mm/s. An ambient temperature setting of 23 °C was used in a stable ambient operational condition considering the thermal expansion characteristics of the materials. In addition, the average moving speed of the carrier in real applications of machines is about 400 mm/s. To investigate the effect of a rising ambient temperature on the positioning accuracy of the moving carrier, an air conditioning system was applied to create the operational conditions of the rising temperature, as shown by the yellow dotted line in
Figure 5. As the time elapsed to 70 min, the operational temperature attained a value of 33 °C and then was controlled at approximately 32 °C with a variation of 0.5 °C. Similarly, an air conditioning system was designed to create a temperature decline in the ambient operational conditions for the moving machine to investigate the effect of an ambient temperature drop on the positioning accuracy of the moving carrier, as shown by the deep green dotted line in
Figure 5. The operational temperature declined from 23 to 14.5 °C in 66 min and then, was controlled at about 15 °C with a variation of 0.5 °C.
Table 1 indicates the corresponding positioning accuracy of the periodically-moving carrier under different operational temperature conditions. As shown in the table, the positioning accuracy of the moving carrier is approximately 18.3
in the case without an ambient temperature control, initially at time = 0 min (without temp. control 0). However, when the carrier started to move, the operational temperature gradually increased with time. At the time of 60 min (without temp. control 60), the operational temperature rose to 27.8 °C, and the corresponding positioning accuracy was improved to 17.37
. Thus, during the period of 60 min (
t = 0 min to
t = 60 min), the positioning accuracy variation was −0.93
, and the positioning accuracy variation rate, in terms of time and operational temperature difference, was −0.00304
/(min·°C). Compared to the case in which the operational temperature was controlled at a value of 23 °C with a 0.5 °C variation, the positioning accuracy improved from 17.96 to 16.14
, the positioning accuracy variation was −1.82
, and the positioning accuracy variation rate was −0.0182
/(min·°C) over a period of 100 min from stable temp. 0 to stable temp. 100. In the case with a stable operational temperature, the positioning accuracy attained an improvement of 2.16
(18.3–16.14
) in comparison to the prior case. For the case with a stable operational temperature, the accuracy variation and accuracy variation rate were greatly improved over those in the case without a temperature control. This implies that, in the case with a stable operational temperature, the positioning accuracy gradually improved with time and temperature variation.
Table 1 also indicates the corresponding positioning accuracy of the periodically-moving carrier under operational conditions for both temperature rise and decline. The table shows that in the case with an operational temperature rise, the initial operational temperature was 23.8 °C and the corresponding positioning accuracy was 16.14
. The operational temperature then gradually increased to attain a value of 33.3 °C at
t = 63 min, at which time the corresponding positioning accuracy reached 20.69
. During the period of 63 min (
t = 0 min to
t = 63 min) when the temperature rose, the positioning accuracy variation was 4.55
and the positioning accuracy variation rate was 0.0076
/(min·°C). This phenomenon indicates that with a rise in operational temperature, the positioning accuracy worsens with time and an increase in operational temperature. As indicated in the table, the initial operational temperature was 23.6 °C, and the corresponding positioning accuracy was 14.93
. In the case of an operational temperature decline, the operational temperature gradually declined to attain a value of 15.7 °C at
t = 66 min at which time the corresponding positioning accuracy reached 22.94
. During the temperature decline period of 66 min (
t = 0 min to
t = 66 min), the positioning accuracy variation was 8.01
, and the positioning accuracy variation rate was 0.01536
/(min·°C). From the positioning accuracy variations in the case of an operational temperature decline, it is found that, for the periodically-moving carrier, positioning accuracy can substantially worsen with time and operational temperature decline.
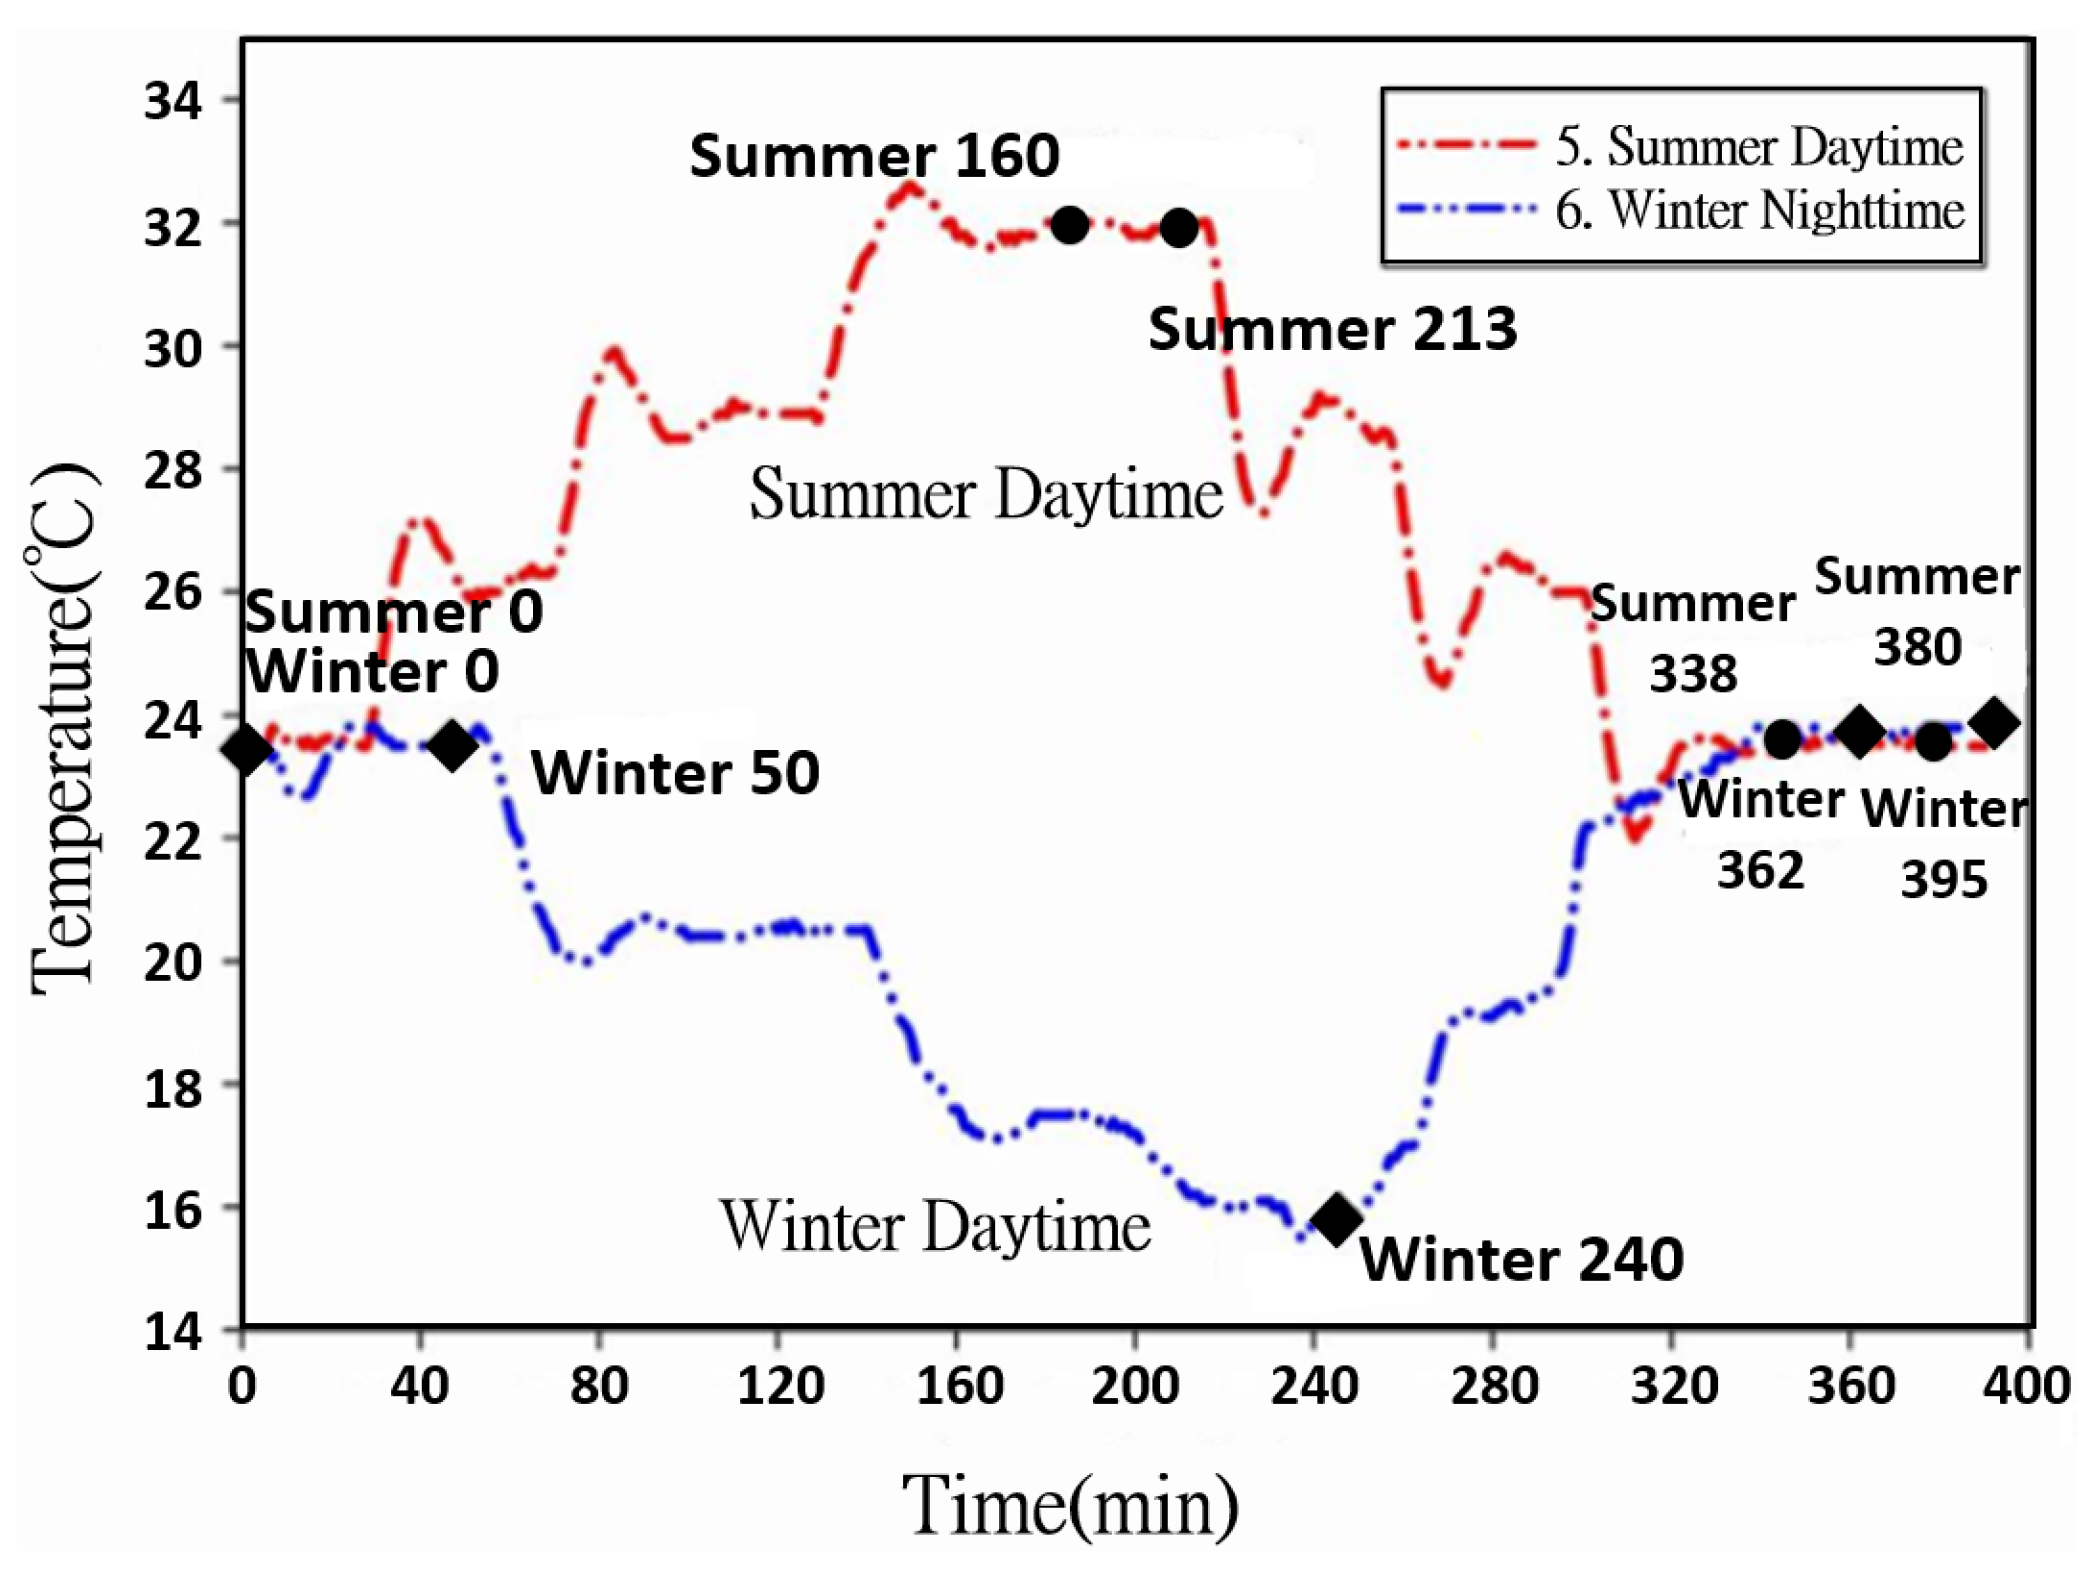
To investigate the variations in positioning accuracy for a periodically-moving machine in summertime and wintertime, an air conditioning system was designed to simulate the operational temperature distributions in the daytime in summer and in the nighttime in winter, respectively.
Figure 6 illustrates the temperature distributions within the chamber in the daytime in summer and in the nighttime in winter, which were generated by the designed air conditioning system. In the case of summer daytime hours, the initial operational temperature was approximately 23.5 °C, which gradually rose with time. At time = 160 min, the operational temperature reached a value of 31 °C. Afterward, the operational temperature gradually declined with time and gradually returned to the value of 23.5 °C at time = 338 min. However, in the case of winter nighttime hours, the initial operational temperature was approximately 23.7 °C which gradually decreased with time. At time = 249 min, the operational temperature was reduced to a value of 15.4 °C. Afterward, the operational temperature gradually rose with time. At time = 362 min, the operational temperature gradually returned to the value of 22.5 °C.
Table 2 illustrates the corresponding positioning accuracies and corresponding variations of the moving carrier operating in summer daytime and winter nighttime hours. In the case of summer daytime conditions, the positioning accuracy slowly reduced with time as the operational temperature initially rose. However, as the operational temperature gradually declined to the value of 23.5 °C from 31.8 °C, the positioning accuracy significantly worsened from 11.33 to 15.74
with a variation of 4.41
and a variation rate of 0.00425
/(min·°C). For summer daytime conditions, we found that a decline in the operational temperature (from 31.8 to 23.3 °C) caused the positioning accuracy to worsen for a periodically-moving carrier. In the case of winter nighttime conditions, while the operational temperature gradually declined from 23.7 to 15.4 °C, the positioning accuracy significantly worsened from 10.45 to 24.06
with a considerable variation of 13.61
and a variation rate of 0.00858
/(min·°C). Afterward, as the operational temperature returned to 22.7 °C, the positioning accuracy still slowly worsened to a value of 26.61
once more. In the two cases, we found that a decline in the operational temperature (from 23.7 to 15.4 °C) causes the positioning accuracy to worsen greatly for a periodically-moving carrier in comparison to the effect of an operational temperature rise.
The heat sources of a moving carrier come from the friction of the moving carrier and the driving linear motor. In the case of an environmental temperature decline, the temperature differences between the environment and the heat sources are larger than those in the case of an environmental temperature rise. The larger temperature differences in the case of an environmental temperature decline cause greater positioning accuracy variations. This is the reason why the positioning accuracies for an environmental temperature decline are greater than for environmental temperature increases, as shown in
Table 1 and
Table 2. In this study, each experiment was performed at least five times, and the uncertainties of the measured positioning accuracies and temperatures were 4.6% and 1.01%, respectively.
3.2. Theoretical Models and Numerical Results of Flow and Temperature Fields
In order to understand the effect of flow patterns on positioning accuracy within an environmental chamber, flow fields and temperature fields were simulated. To simplify the simulation, we assume that the air is in an environment containing low air velocity and is non-compressible, and the flow field is in an unsteady-state in terms of the computational domain. Navier-Stokes equations within the time average featuring the unsteady-state and three-dimensional non-compressible flow fields can be described as follows:
In the equations,
,
T, and
P represent the average velocity, average temperature, and average pressure, respectively. The Boussinesq buoyancy effect was taken into consideration, and
β refers to the coefficient of thermal expansion. With a closed turbulence model, the turbulent stress
and turbulent thermal flux
can be obtained by the following expression:
In the expression, and represent the turbulent flow viscosity and the turbulent Prandtl number, respectively. K refers to the kinetic turbulent energy, while and indicates the Kronecker delta. By solving the closed turbulence problem through the k-ε model (kinetic turbulent energy equation and turbulent dissipation equation), the turbulent stress and thermal flux can be acquired. The commercial software, ANSYS Fluent (15.0, ANSYS. Inc, Cecil, PA, USA, 2014), was adopted in the simulation of the flow field and temperature field within the processing area.
In this study, the flow fields of the internal and external environments were filled with an ordinary air flow, with its physical parameters listed in
Table 3. The carrier and linear guideway components used in this study were made of cast iron and stainless steel, respectively, with their relevant physical parameters listed in
Table 4. The heat generating rates from the heat sources of the linear guideway and linear motor were 7575 and 1000 W/m
3, respectively, and were estimated from the simulation results and measurement data. To simulate the movement of the carrier on the guideway, dynamic grids were adopted in the numerical simulation.
From the above experimental results, it was found that an operational temperature variation may cause a great increase in positioning accuracy, especially in the operational condition of a temperature decline. To maintain a stable operational environment for a moving machine, the moving machine can be operated within an environmental chamber in which the temperature distributions can be controlled by an air conditioning system.
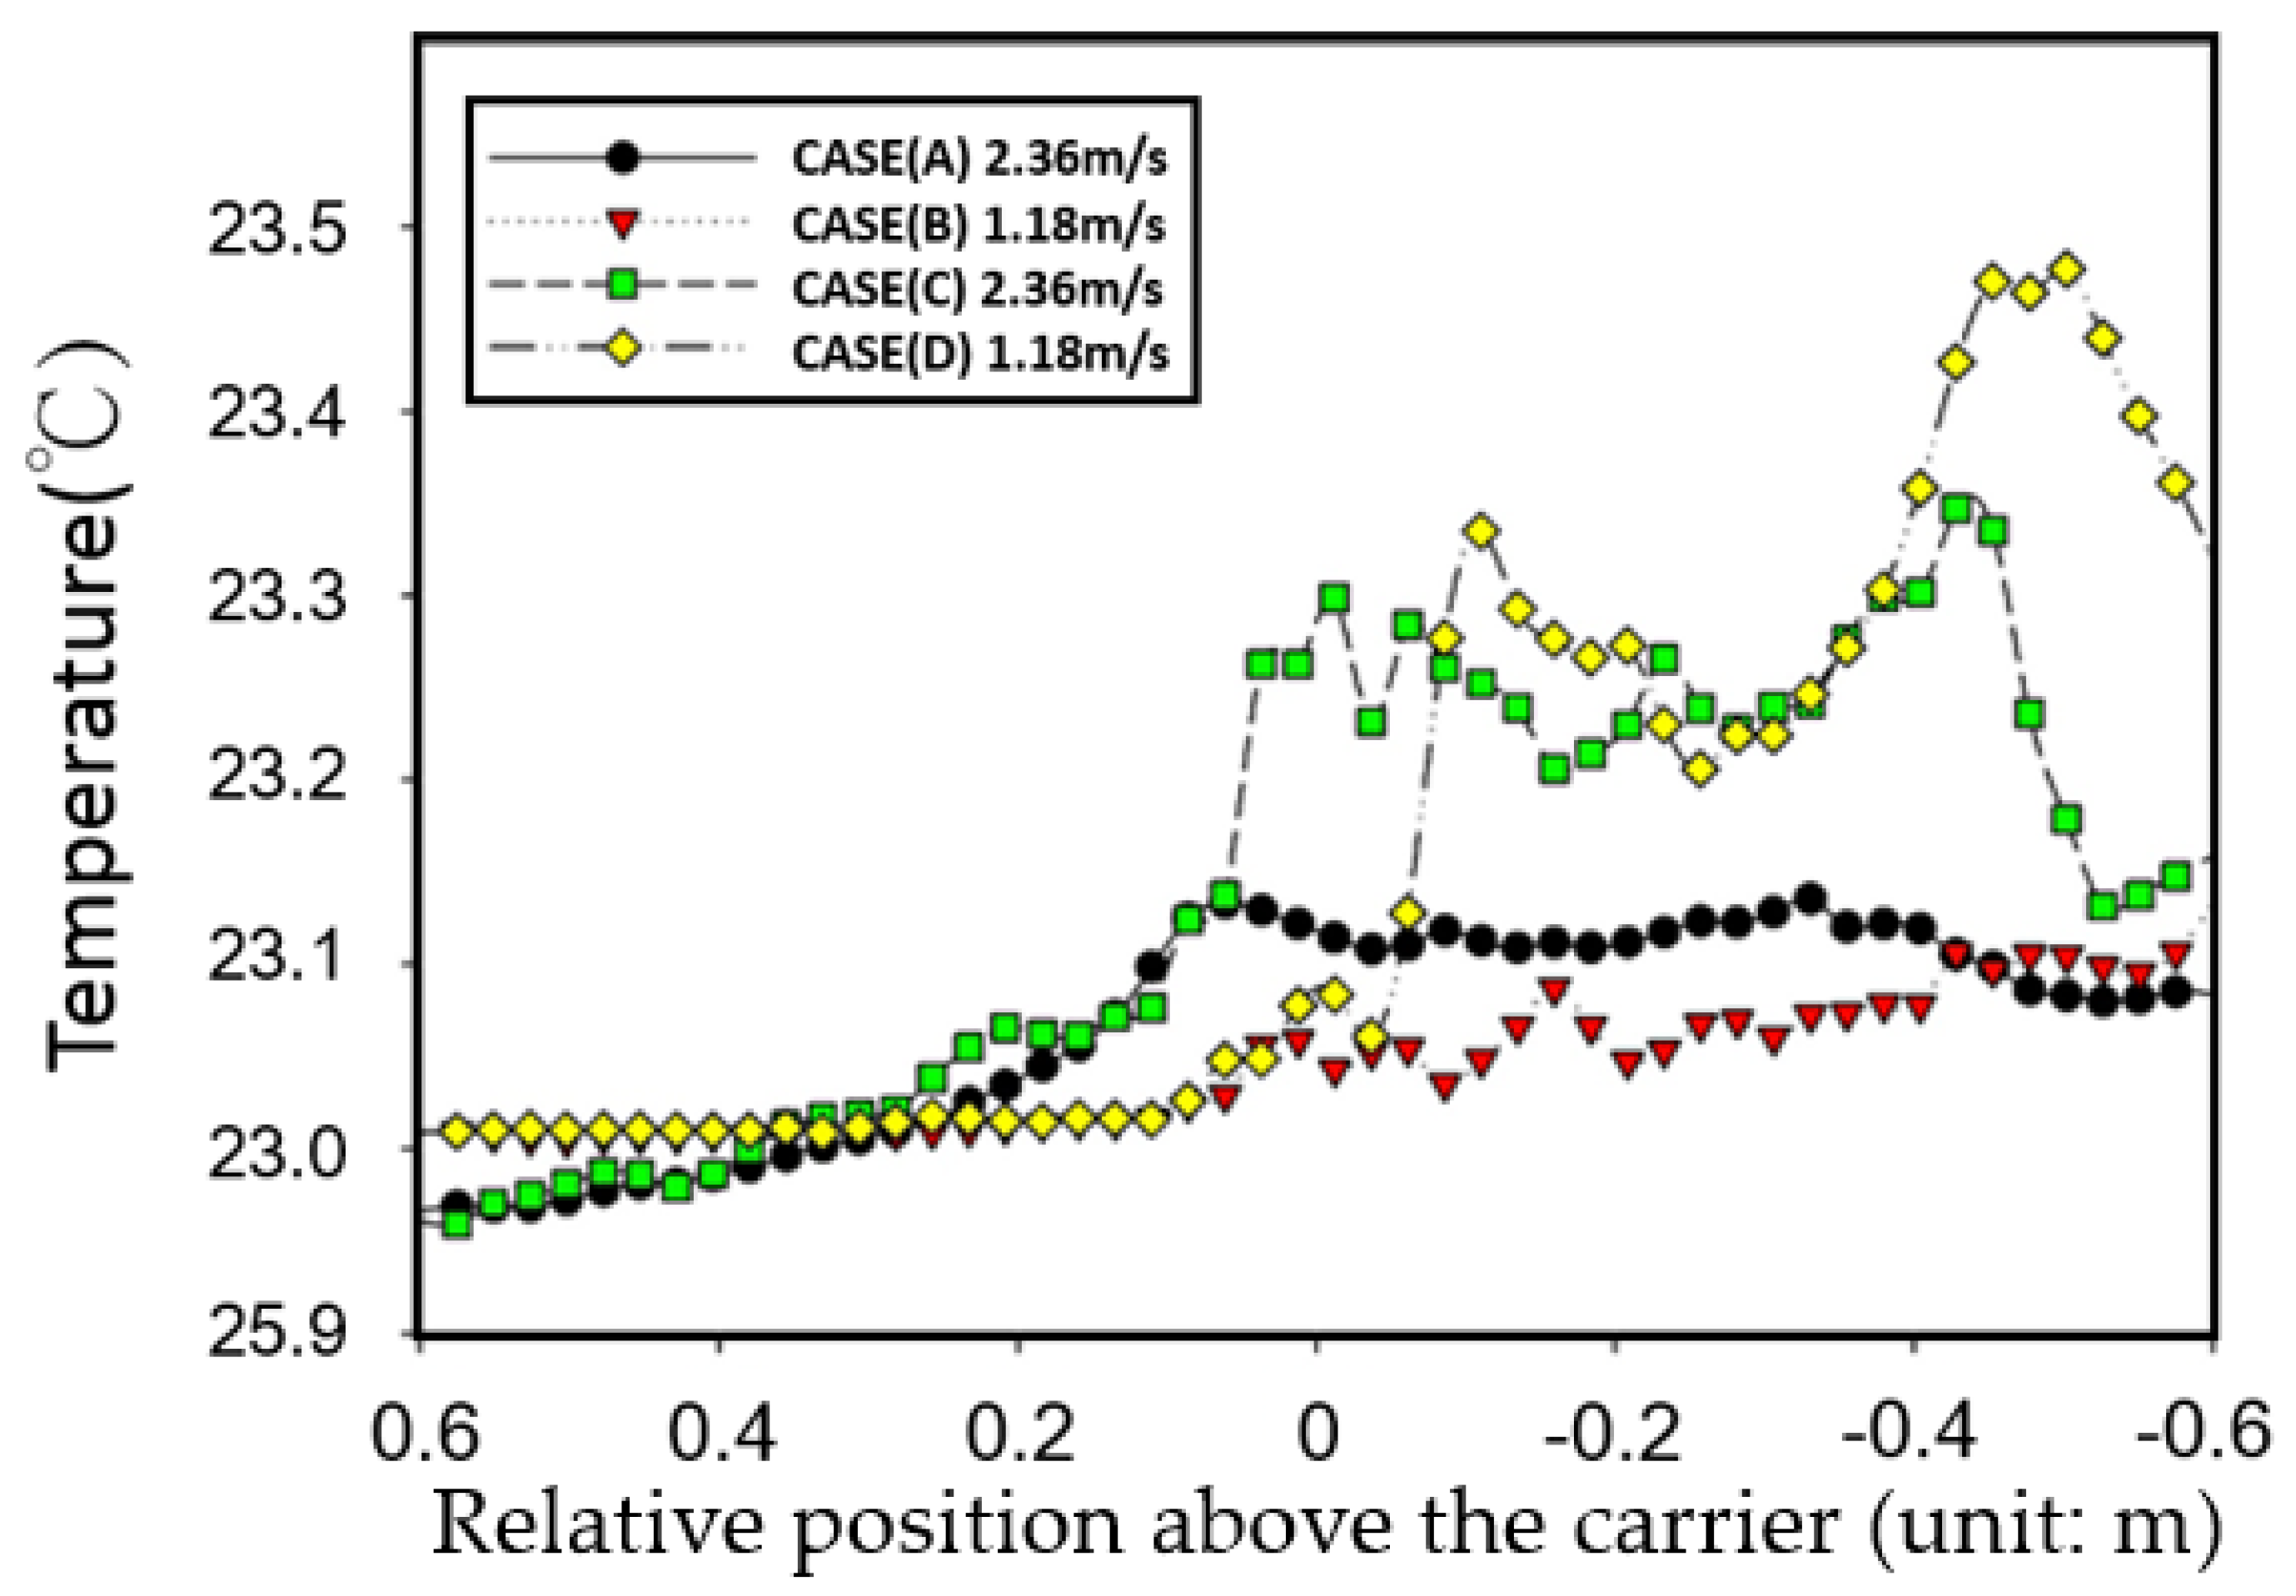
Figure 7 illustrates the numerical average temperature distributions on a two-dimensional plane above the moving carrier along the moving path of the periodically-moving carrier. In
Figure 7, each average value corresponding to the individual position above the moving carrier was calculated by averaging temperatures along the lateral direction (
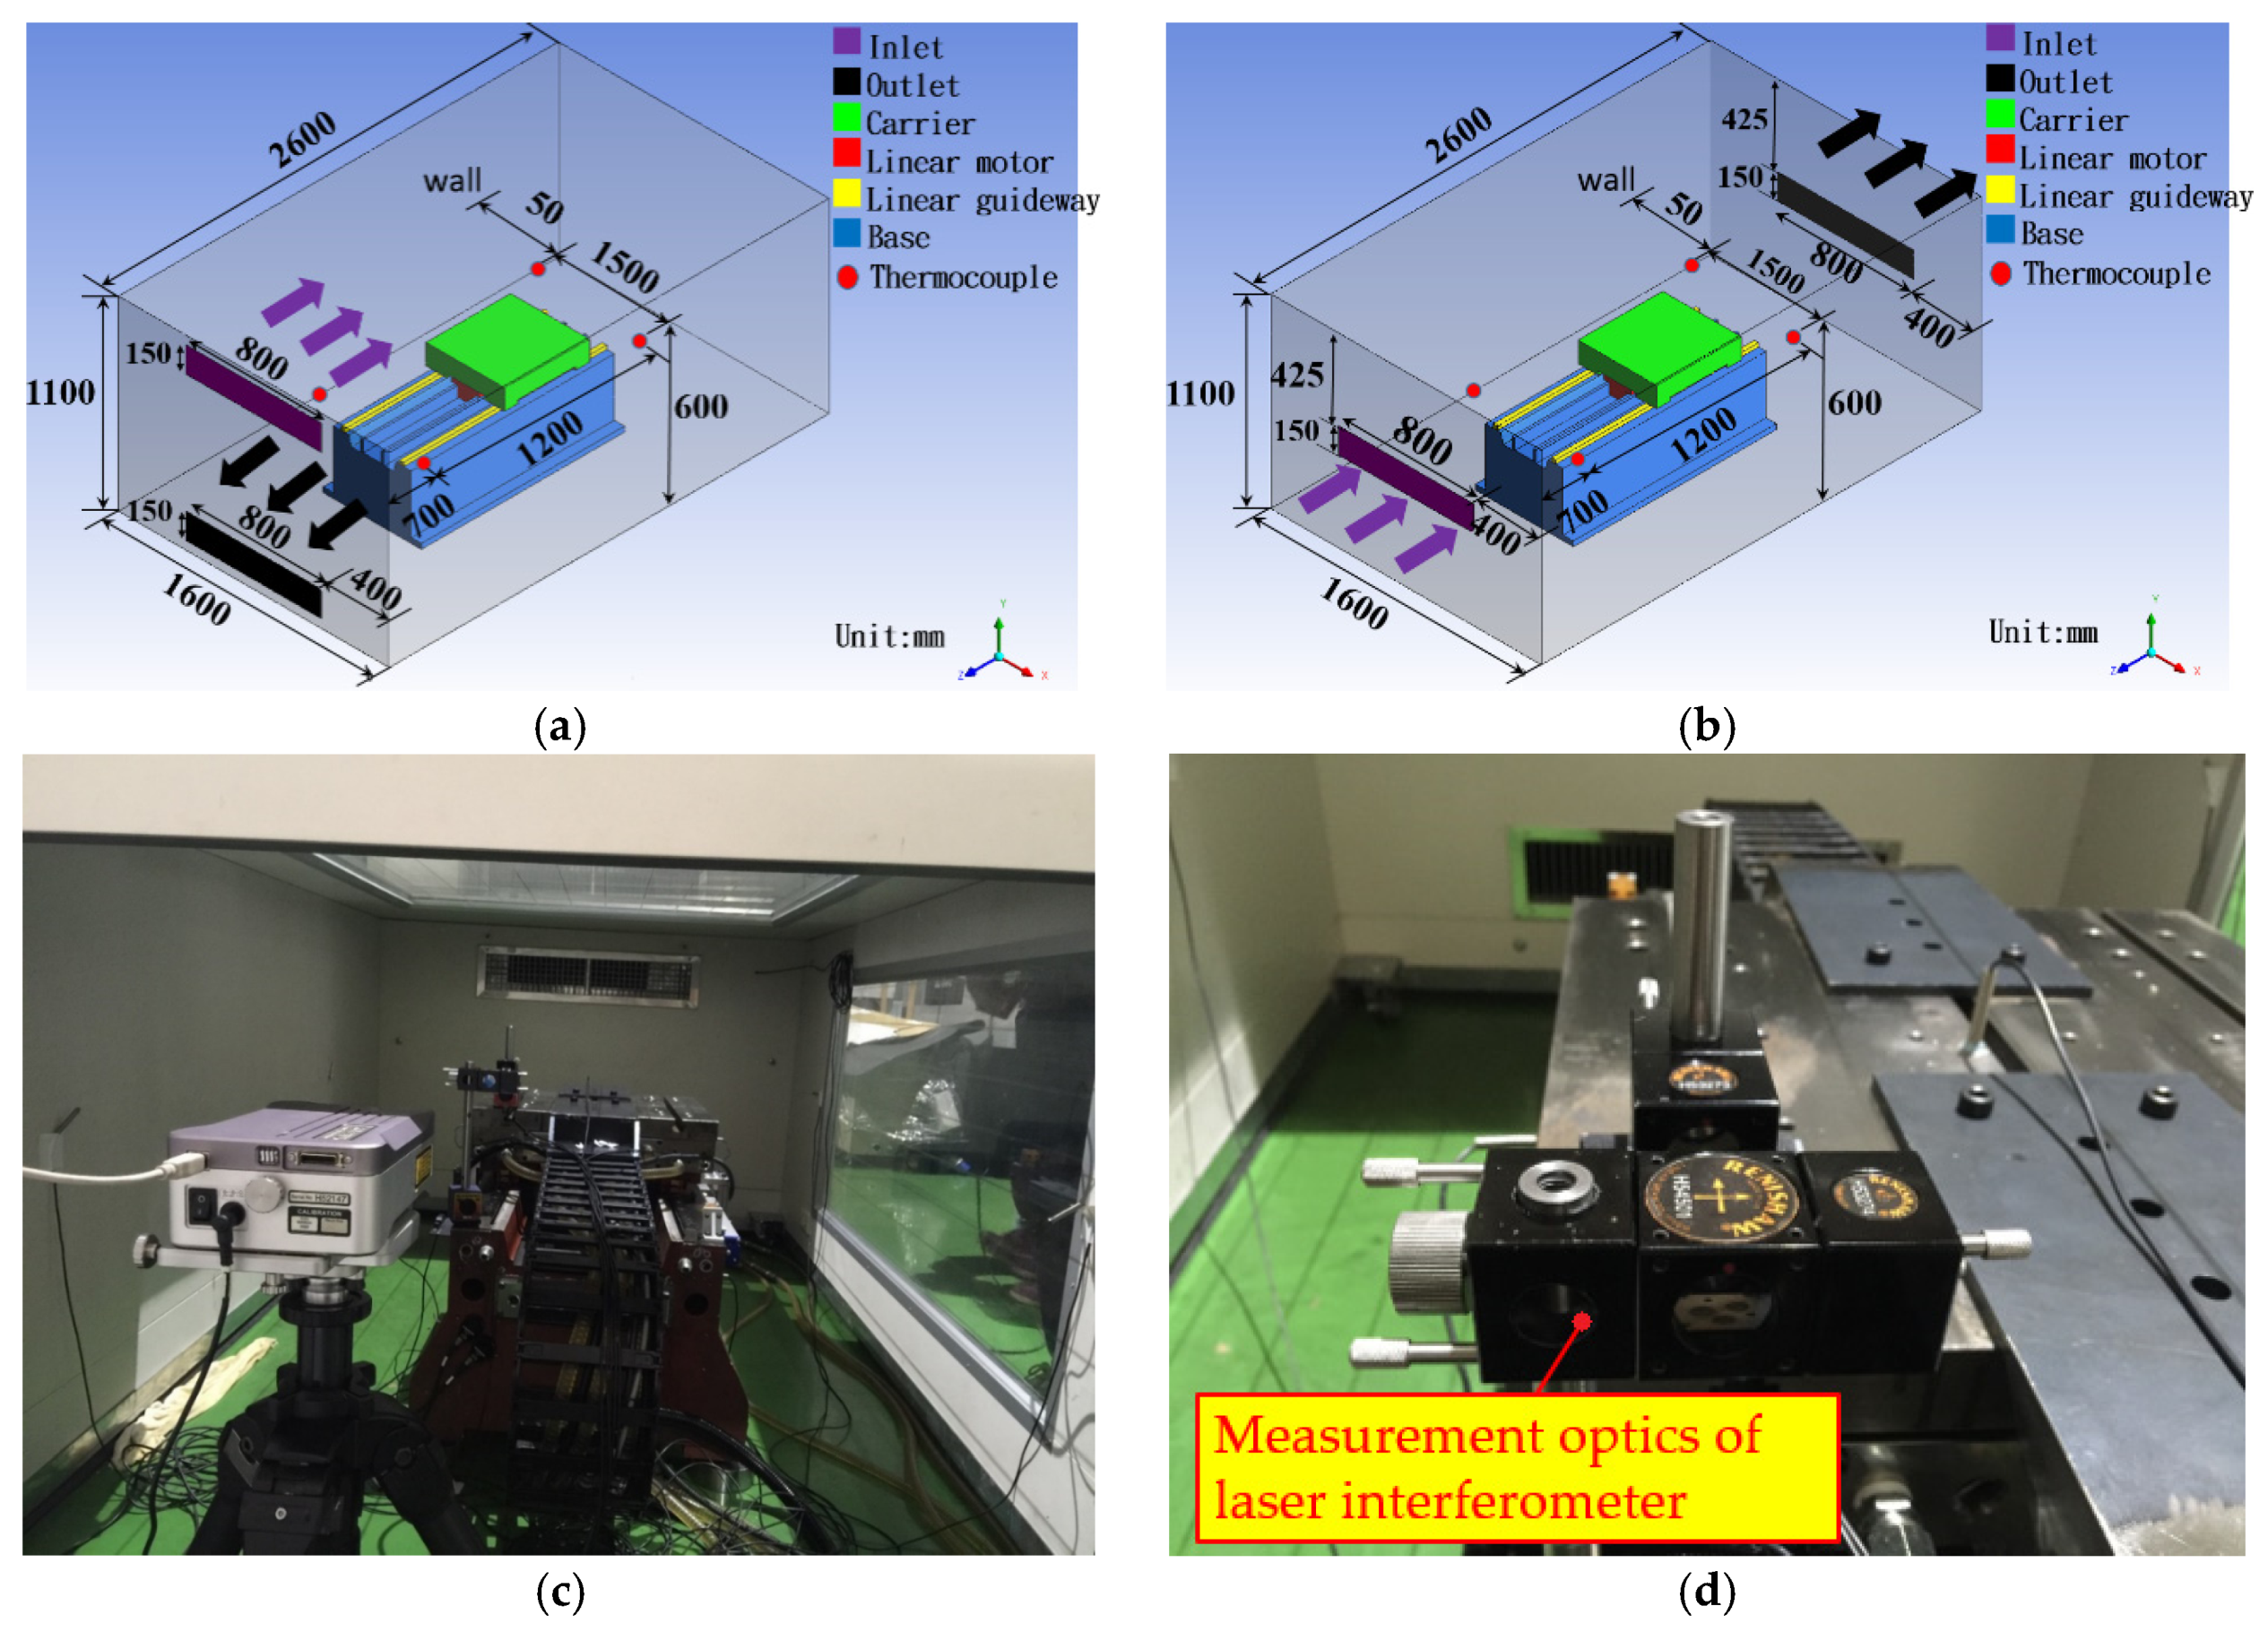
Z axis) above the carrier during a moving period. From the average temperature distributions, the temperature deviations in the cases of different inlet/outlet vent locations can be presented. As shown in the figure, the air velocity at the inlets in cases A, B, C, and D was set to 2.36, 1.18, 2.36, and 1.18 m/s, respectively. In order to maintain a stable and stratified flow field in the region near the moving machine, a laminar flow should be ensured in the corresponding region. For fluid dynamics in the internal flow, the non-dimensional parameter, the Reynolds number, should be below 2300. The definition of a Reynolds number is
Re =
ρVD/
μ, where
ρ in the density,
μ is the viscosity of the fluid,
V is the characteristic velocity and
D is the characteristic dimension. In this study, the setting inlet velocities of 1.18 and 2.36 m/s were adopted, and the characteristic velocities around the moving machine were about 0.08 and 0.12 m/s, respectively. The corresponding Reynolds numbers for both cases were 1289 and 1934, respectively, which are both less than the critical value of 2300. When the air inlet and outlet were designed on the same side of the chamber (cases C and D), the average temperature distributions above the moving carrier could be controlled at about 23 °C with a maximum variation of 0.4 °C. However, in cases A and B, in which the air inlets and outlets were located on opposite sides of the walls, it was found that the average temperature distributions along the moving path of the carrier were maintained within a deviation of 0.1 °C. In comparison to cases C and D, the flow fields in cases A and B exhibited a smooth and parallel flow pattern. Thus, the temperature deviations in those two cases were much less than those in cases C and D.
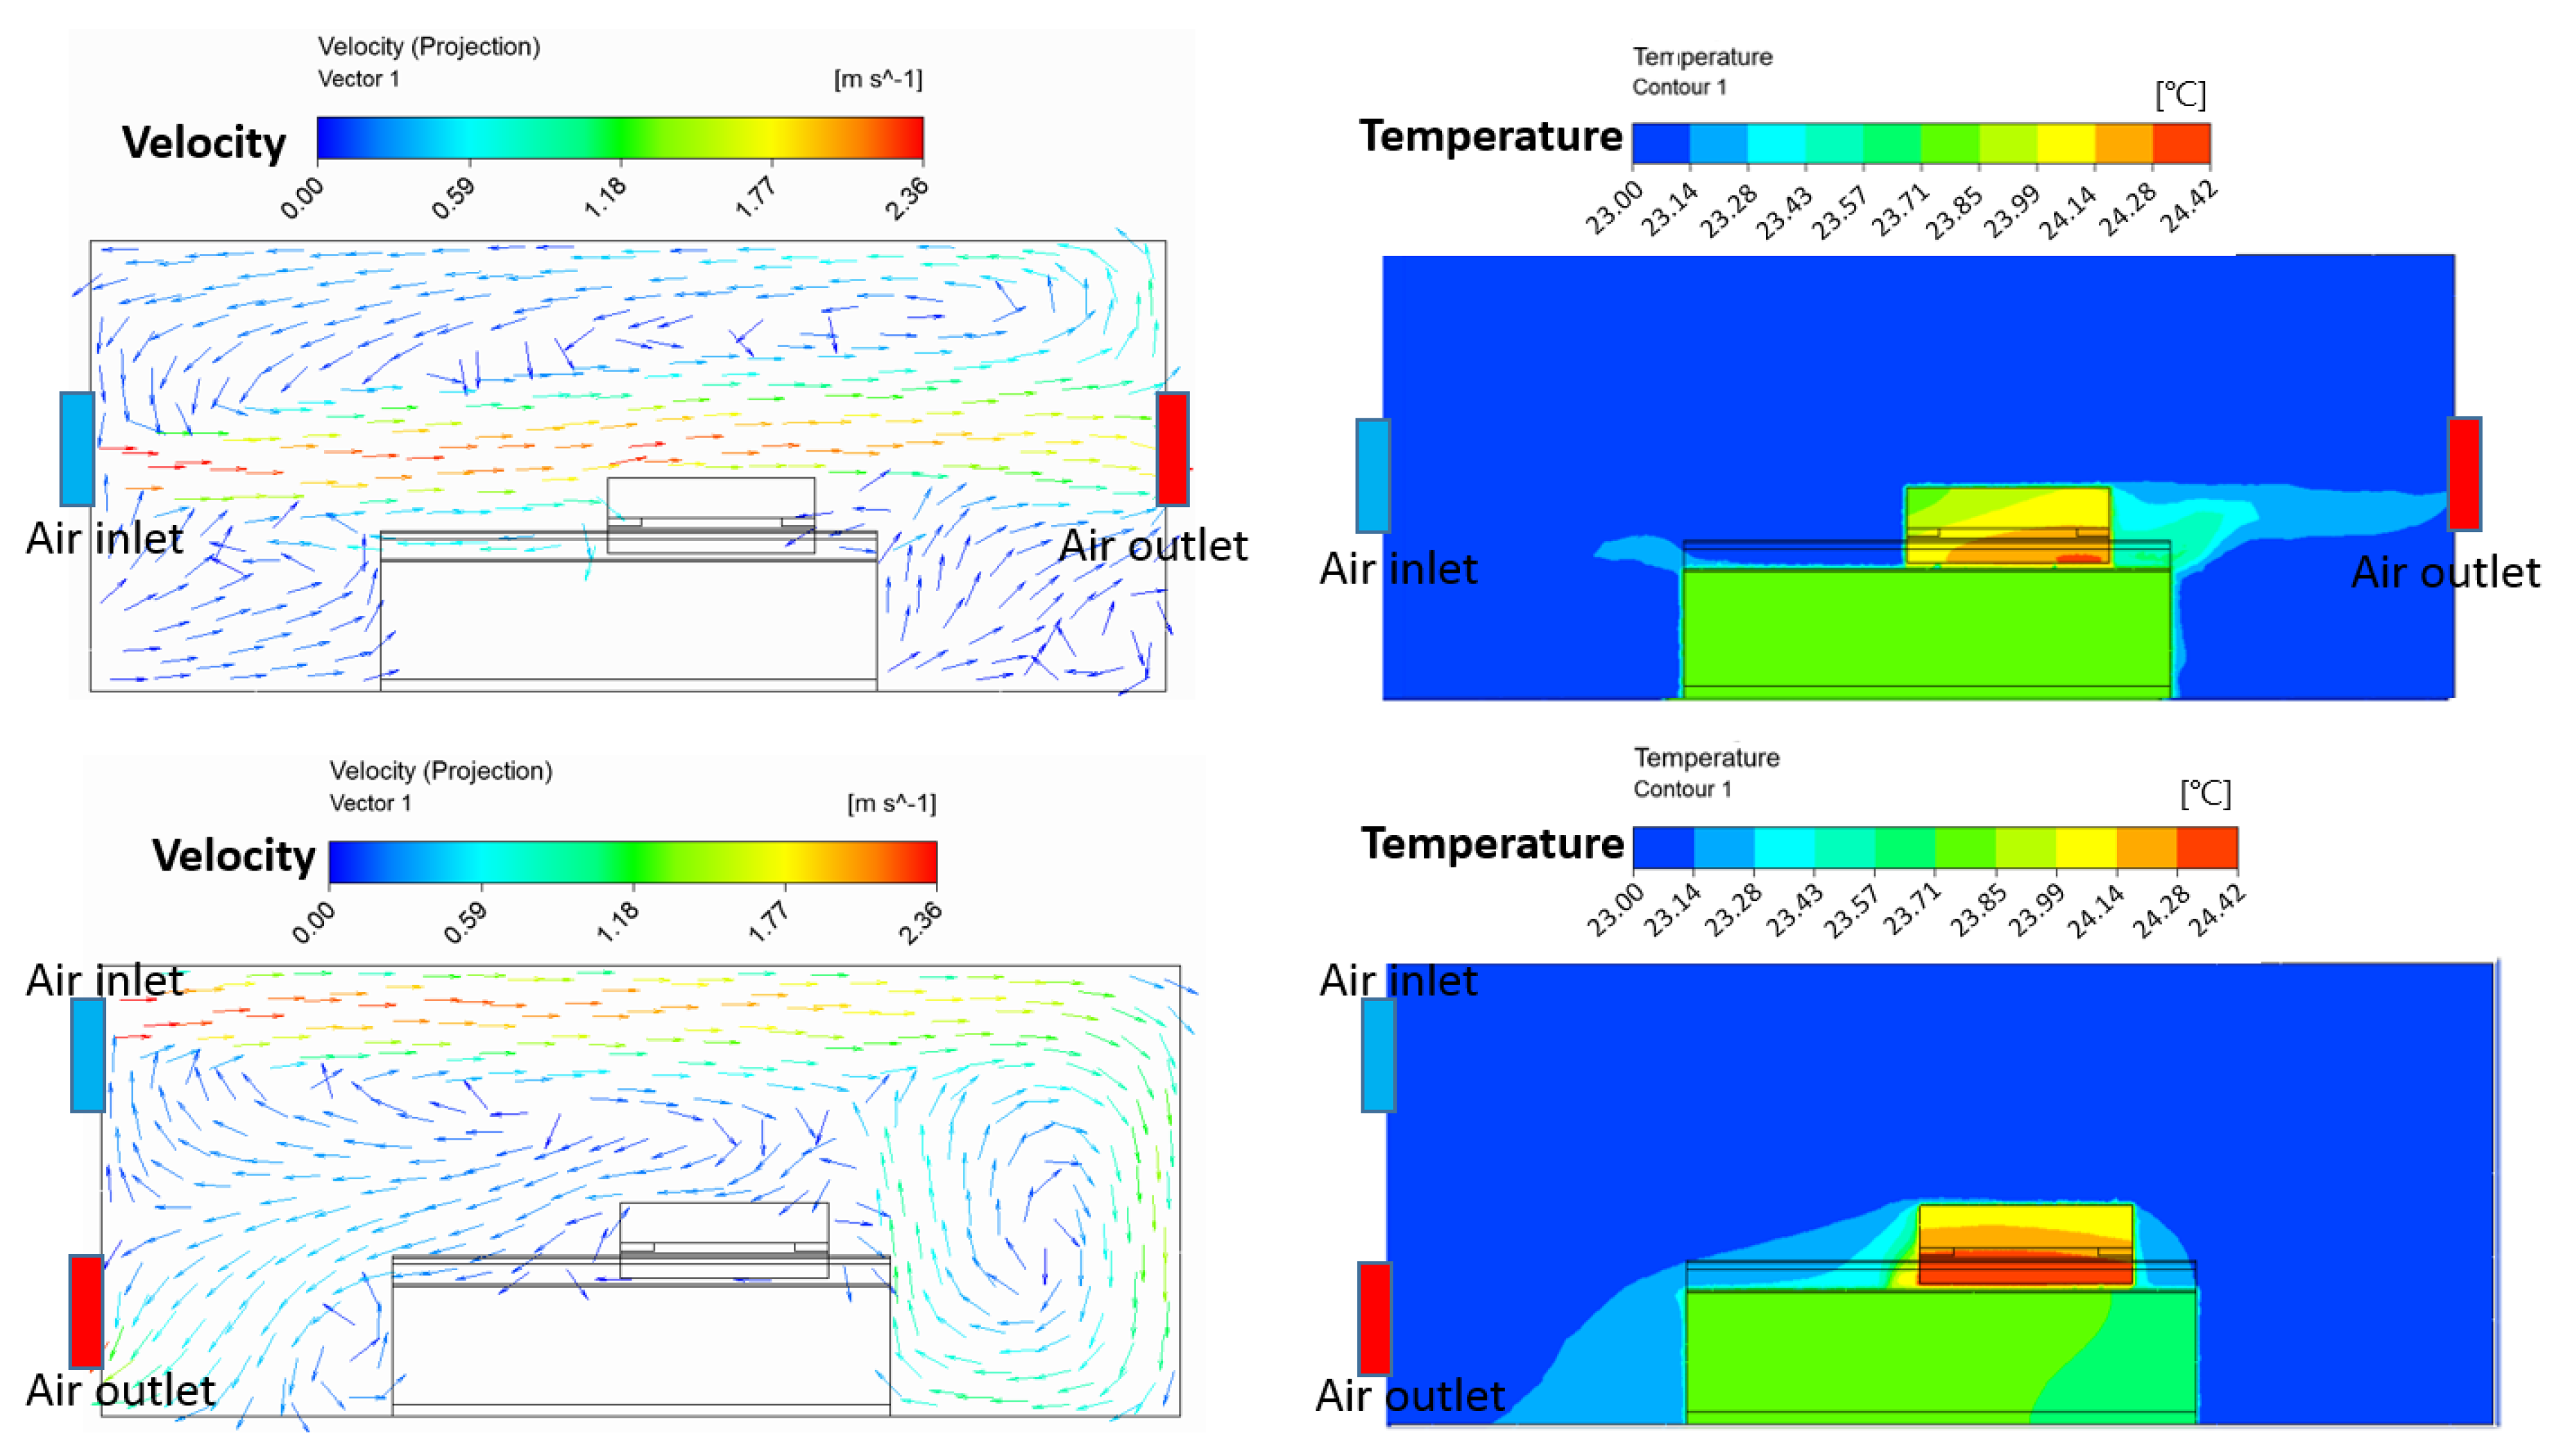
Figure 8 shows the flow fields and temperature contours in the chamber in the cases where the air inlets and outlets were located, respectively, on opposite sides and on the same side at the inlet air velocity of 2.36 m/s. The flow field in the case where the air inlets and outlets were located on opposite sides exhibited a smooth and parallel flow pattern, and the heat can be effectively dissipated by flow convection in this case. Conversely, a large flow circulation was formed in the chamber in the case where the air inlets and outlets were located at the same wall, which may hinder the heat to dissipate from the air outlet, as shown in the figure. Thus, the temperature distributions on the linear guideway are higher than the case where the air inlets and outlets were located on opposite sides.
In addition, in this study, under the same feeding speed for a moving carrier, the positioning precision of the moving carrier varied with respect to the ambient temperature. From the dimensions of a single axial moving carrier, as shown in
Figure 1, and the thermal expansion coefficients of the cast iron and stainless steel materials, as shown in
Table 4, the positioning precision variation at 23.8 °C was estimated to be 22.8 μm. In comparison to the experimental positioning precision variation at 23.8 °C, as shown at stable temp. 100 in
Table 1, the estimated value is approximately 6.6 μm larger than the experimental value. This is because the estimated value is calculated under a thermal steady-state condition. In the experiment, although the temperature was maintained for 100 min, the structural temperature of the moving carrier was still in a transitional state instead of a steady state. From the viewpoint of thermal diffusivity, the thermal diffusivity of cast iron is less than that of stainless steel, and the heat conduction speed in cast iron will be slower in the structure of a moving carrier. Thus, more time is required for the machine to reach a thermal steady-state condition in the experiment.
In the cases in which the air inlet and outlet are located on opposite sides of the walls, the deviation distributions of the average temperature along the moving path of the carrier can be maintained in 0.1 °C due to parallel and stratified flow distributions. The positioning accuracy of 14.21 μm for the carrier was experimentally measured in this case. The positioning accuracy’s experimental value is less than the positioning accuracy’s measured value of 16.14 μm, as shown for the stable temp. 100 in
Table 1, in the case in which the air inlet and outlet are located on the same side of the chamber. Thus, the air inlet and outlet locations on opposite sides of the walls are recommended in this study.


 and
and 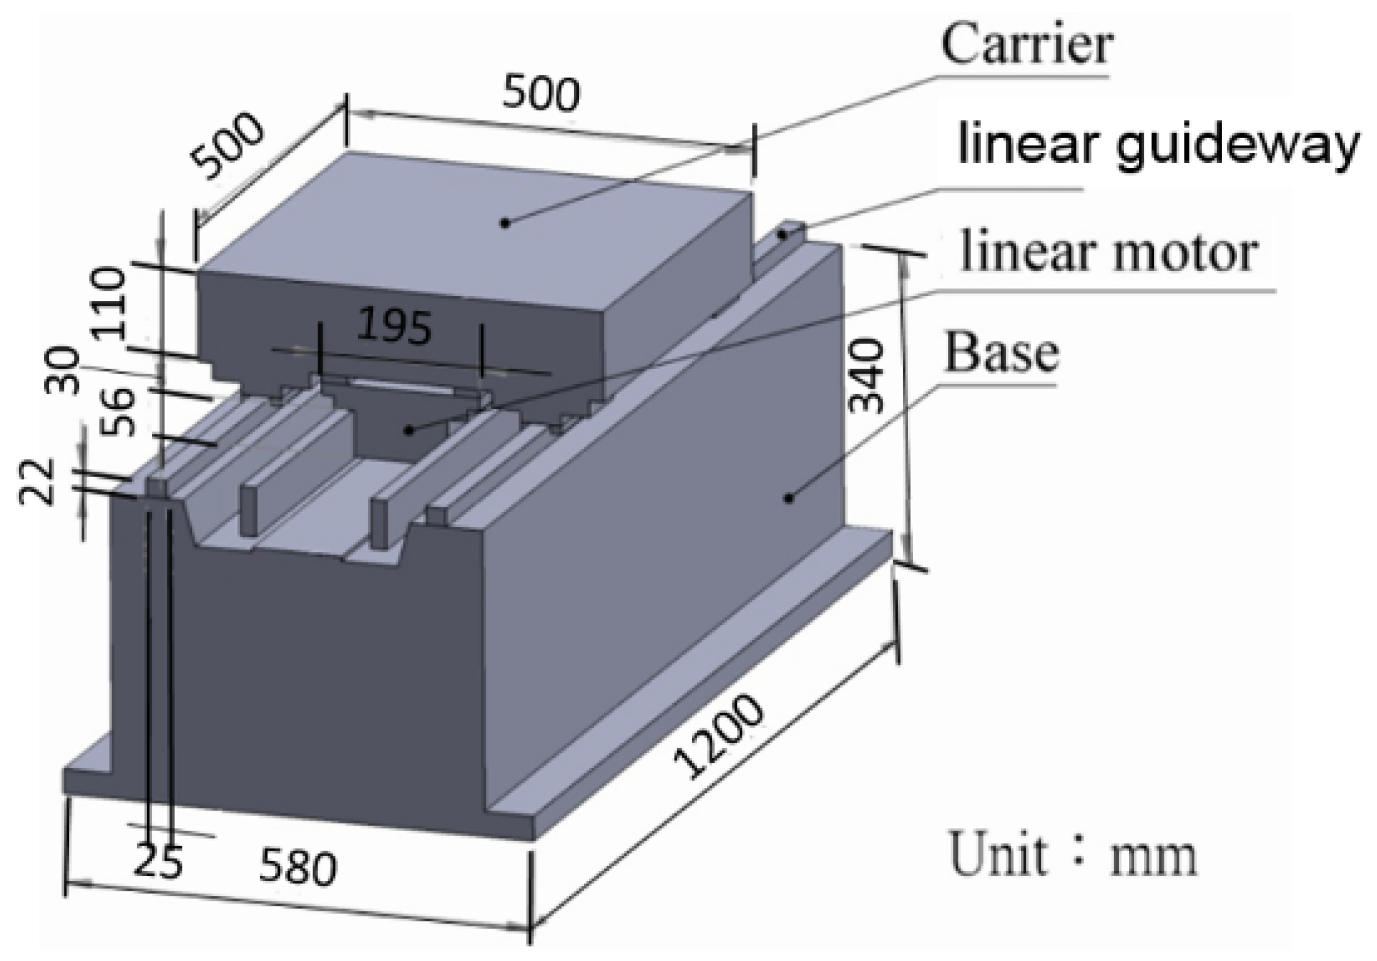


