Article

Dense Pure Tungsten Fabricated by Selective Laser Melting

1
School of Materials Science and Engineering, Tsinghua University, Beijing 100084, China
2
Department of Materials and Environmental Chemistry, Arrhenius Laboratory, Stockholm University,S‐106 91 Stockholm, Sweden
*
Authors to whom correspondence should be addressed.
Appl. Sci. 2017, 7(4), 430; https://doi.org/10.3390/app7040430
Submission received: 21 February 2017 / Revised: 16 April 2017 / Accepted: 19 April 2017 / Published: 23 April 2017
(This article belongs to the Special Issue Materials for 3D Printing)

Abstract

:
Additive manufacturing using tungsten, a brittle material, is difficult because of its high melting point, thermal conductivity, and oxidation tendency. In this study, pure tungsten parts with densities of up to 18.53 g/cm3 (i.e., 96.0% of the theoretical density) were fabricated by selective laser melting. In order to minimize balling effects, the raw polyhedral tungsten powders underwent a spheroidization process before laser consolidation. Compared with polyhedral powders, the spherical powders showed increased laser absorptivity and packing density, which helped in the formation of a continuous molten track and promoted densification.

1. Introduction

Tungsten is widely used in the electronic and aerospace industries, and in military applications because of its high melting point (3420 °C), thermal conductivity (174 W m−1 K−1 at 25 °C), hardness, and strength [1,2]. It is also recognized as the most promising plasma-facing material for use in future nuclear fusion reactors on account of its excellent radiation-shielding properties against heat and plasma flux [3,4]. Tungsten parts are commonly fabricated by powder metallurgy methods [5,6]; particularly, an automatic powder injection molding tool was successfully designed and applied to produce tungsten products [7,8]. Recently, selective laser melting (SLM) shows considerable advantages in producing metal parts with complex outer and inner structures [9] and provides a promising alternative for tungsten processing.
During the SLM process, metal powders are deposited and selectively melted by a computer-controlled laser in a layer-by-layer manner. This process has been used successfully to fabricate parts made of titanium alloys [10], stainless steel [11], CoCrMo alloys [12,13], and copper alloys [14]. In SLM, a continuous molten track needs to be formed in order to achieve densification. If the molten track breaks, balling phenomena can occur, which might reduce the final density of the manufactured parts. Yadroitsev et al. studied the stability of a single track in selective laser melting [15] and found that a good wetting condition between the molten pool and the substrate is required to stabilize the molten track.
The formation of a continuous track is especially difficult during SLM of tungsten because of its high melting point, thermal conductivity, and oxidation tendency. If the tungsten melt solidifies too quickly to spread out completely over the cool substrate, balling effects can occur. In addition, adsorption of oxygen can affect the surface tension of the molten pool and reverse the Marangoni flow direction, which enhances the balling effect. Many researchers have studied the SLM of tungsten. Ebert et al. studied tungsten formation by selective laser micro-sintering and their results showed a strong tendency for tungsten to exhibit balling phenomena and that the final density increases with increasing laser power [16]. Zhang et al. obtained tungsten bulk with 82% of the theoretical density (TD) by SLM and concluded that continuous molten tracks are essential for achieving densification [17]. Zhou et al. also obtained tungsten bulk with 82.9% of the TD by SLM from polyhedral powders and concluded that the balling tendency of tungsten is especially high because molten tungsten droplets tend to solidify before they can completely spread out over the surface of the sample [18]. In addition to these studies, a complex tungsten collimator (89.2% TD) was built by Deprez et al. [19]; however, they did not discuss the processing in detail. From the above studies, it can be concluded that improved wetting conditions are required for the SLM of tungsten. Commonly, this is achieved by optimizing the processing parameters [20], such as the laser power and scanning speed. In addition to these optimizations, Wang observed that a spheroidization process can increase the laser absorptivity of AlSi10Mg powders [21], while Panwisawas et al. observed that increased laser absorptivity increases the molten pool temperature and, thus, decreases the viscosity [22], which is beneficial to the wetting process.
This aim of this work is to study the densification process of tungsten during selective laser melting. In order to optimize powder properties, raw polyhedral powders were processed into spherical powders by induction plasma equipment. Dense tungsten parts were successfully fabricated under suitable optimized experimental parameters. In situ experiments were conducted to test the laser absorptivity of polyhedral and spherical powders, and the effect of powder spheroidization on densification was then discussed.

2. Materials and Methods

2.1. Powder Spheroidization and the Selective Laser Melting Process

The raw tungsten powders used for this work were commercially available polyhedral powders (Xiamen Tungsten Co. Ltd., Xiamen, China). These powders were processed using plasma spheroidization equipment (TekSphero-40, Tekna Co. Ltd., Sherbrooke, QC, Canada), with a maximum power of 40 kW. Argon was used as the shield gas in the spheroidization process. During the spheroidization process, the powders were carried by gas at a fixed speed and passed vertically through a hot plasma zone. Within this plasma zone, the polyhedral powders were melted and subsequently shrunken to assume a spherical shape by the effect of surface tension.
The selective laser melting experiments were conducted with a Renishaw AM 400 machine (Renishaw Plc., New Mill, UK), equipped with a 75 μm spot diameter, 400 W fiber laser. The laser was operated in pulse mode and focused at one point for a set period (ET, exposure time) at a defined power (P, power) and then immediately moved to the next point and the exposure process was repeated. The distance between the adjacent points was defined as the point distance (pd). The thickness of the deposited powder layer was set to 30 μm in this study. The laser scanning strategy operated in a zig-zag pattern, with the distance between these parallel lines defining the hatch distance (hd). In order to minimize the internal residual stress, the laser scanning direction was rotated by 67° between adjacent layers. To limit the oxidation of the tungsten, the fabrication process was conducted in a chamber that was filled with argon gas to maintain the oxygen content below 100 ppm. For our analysis, blocks of dimensions 10 mm × 10 mm × 5 mm were built for characterization, as shown in Figure 1.

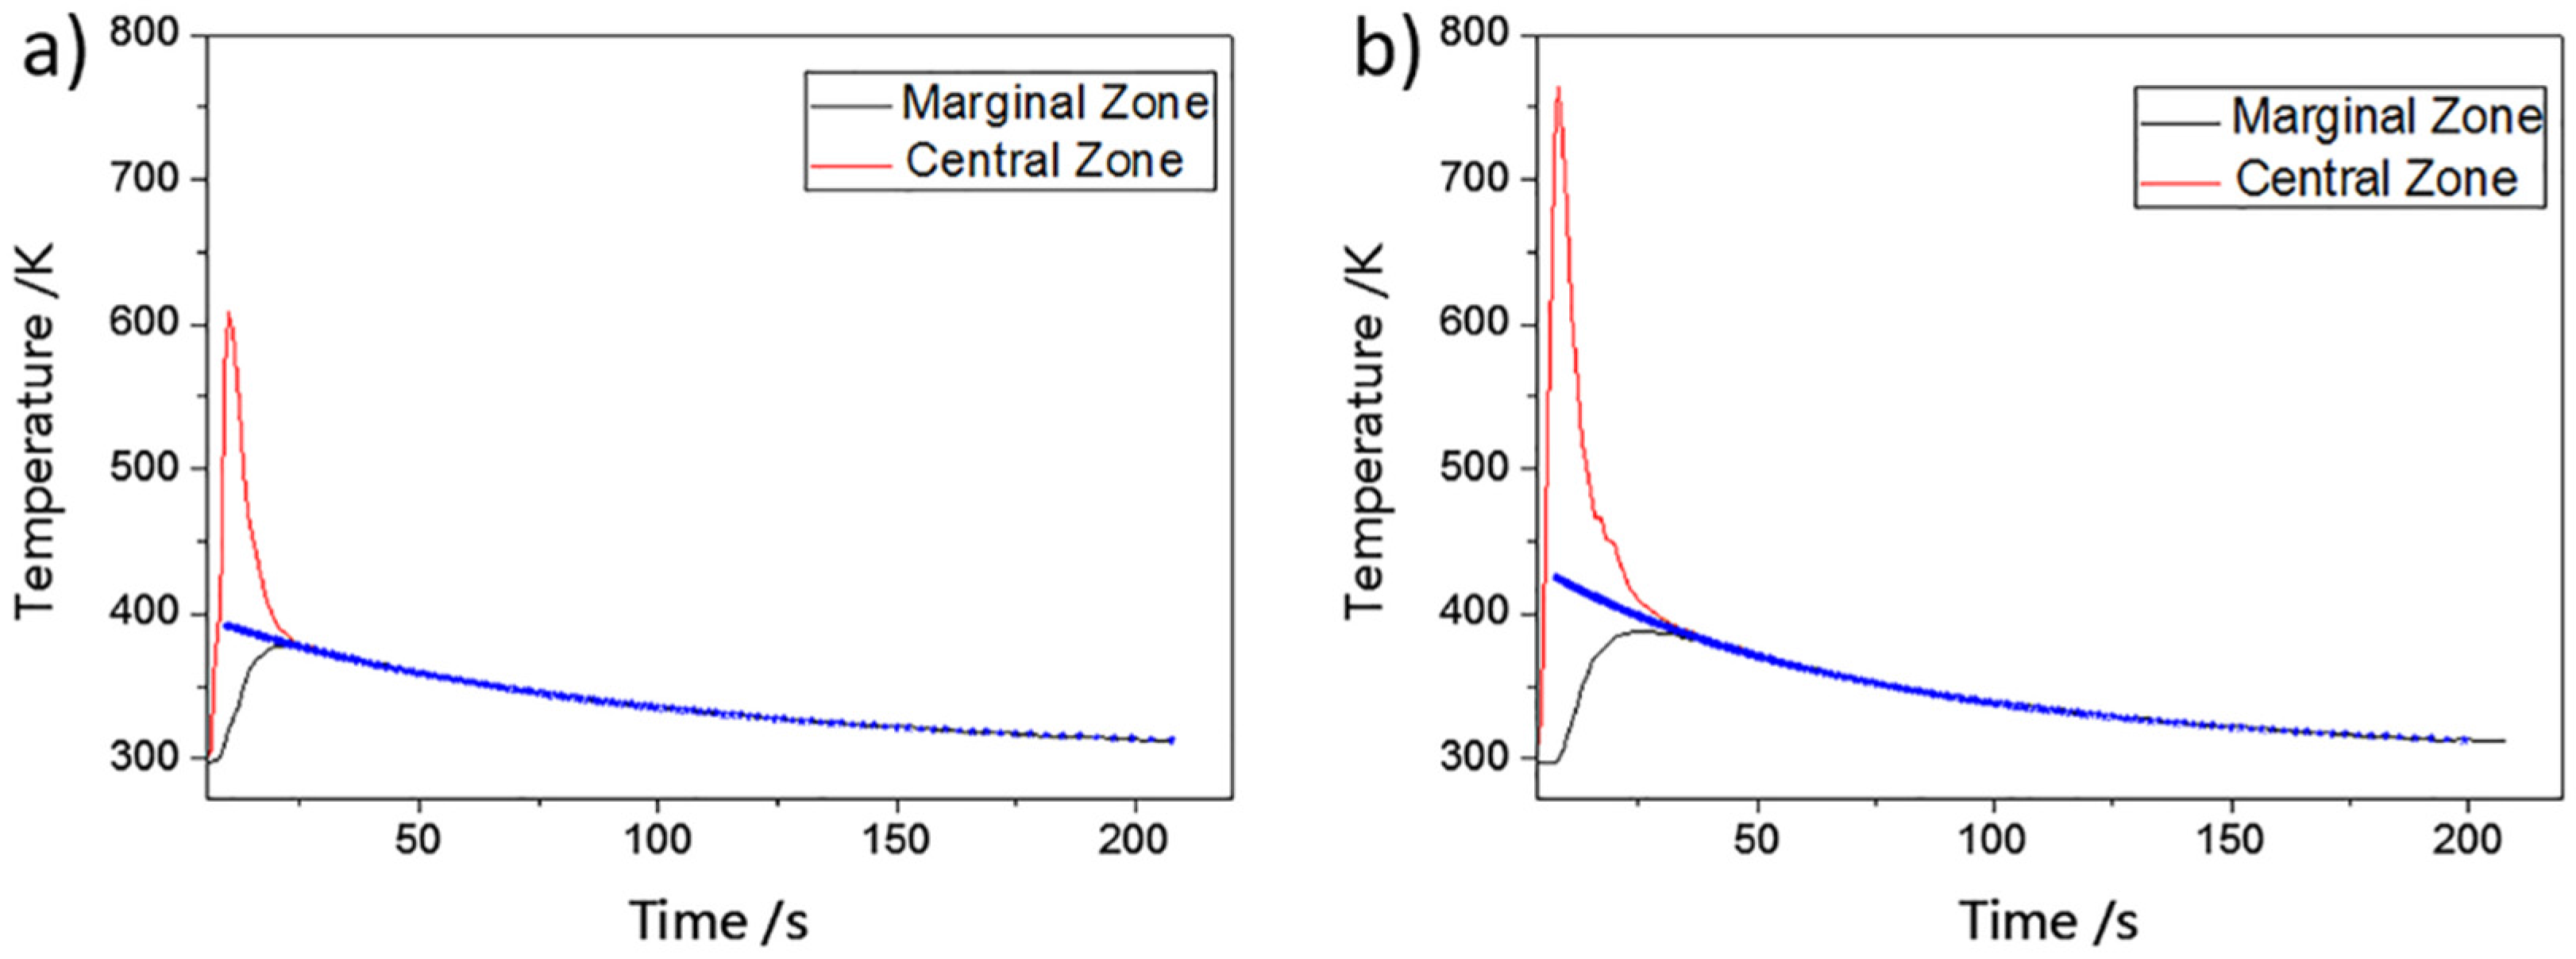
2.2. Mean Laser Absorptivity Measurement

The mean laser absorptivity was calculated by measuring the heat absorbed by the substrate via the device illustrated in Figure 2a. A steel substrate that had been pre-deposited with tungsten powders was partly scanned by the laser, and the temperature variation curves of its marginal and central zones were simultaneously recorded during the scanning and subsequent cooling processes. The absorbed energy was calculated from temperature curves (this calculation will be explained in a later section (Section 4)). During the measuring process, the laser scanned a square area and generated a total energy of 900 J in 4.5 s. The underside of the substrate was kept thermally insulated. Two K-type thermocouples whose tips were welded to the substrate were used in order to record data accurately in real-time (as shown in Figure 2b). The entire measuring apparatus was placed inside the machine chamber to monitor the SLM process.

2.3. Characterization of Specimens

The density of each fabricated part was measured according to Archimedes’ principle. The specimens were microscopically characterized by a TESCAN MIRA 3LMH scanning electron microscope (SEM, TESCAN, Brno, Czech Republic), equipped with an electron backscatter diffraction (EBSD) detector (Oxford Instruments, Oxford, UK), and an HKL Nordlys orientation imaging microscope system. The grain size was automatically detected by the Channel 5 software package, which would treat every grain as a circle of the same area and then calculate the circle diameter as the grain size. The powder fluidity was tested using a Holzer flow meter (YTN-102, Judeantai Tech. Co., Beijing, China), according to international standard ISO 4490:2001. A carbon-sulfur analyzer (CS-2008) and a nitrogen-oxygen analyzer (NO-3000) (NCS Testing Technology Co. Ltd, Beijing, China) were applied to test the impurity element contents in powders.

3. Results

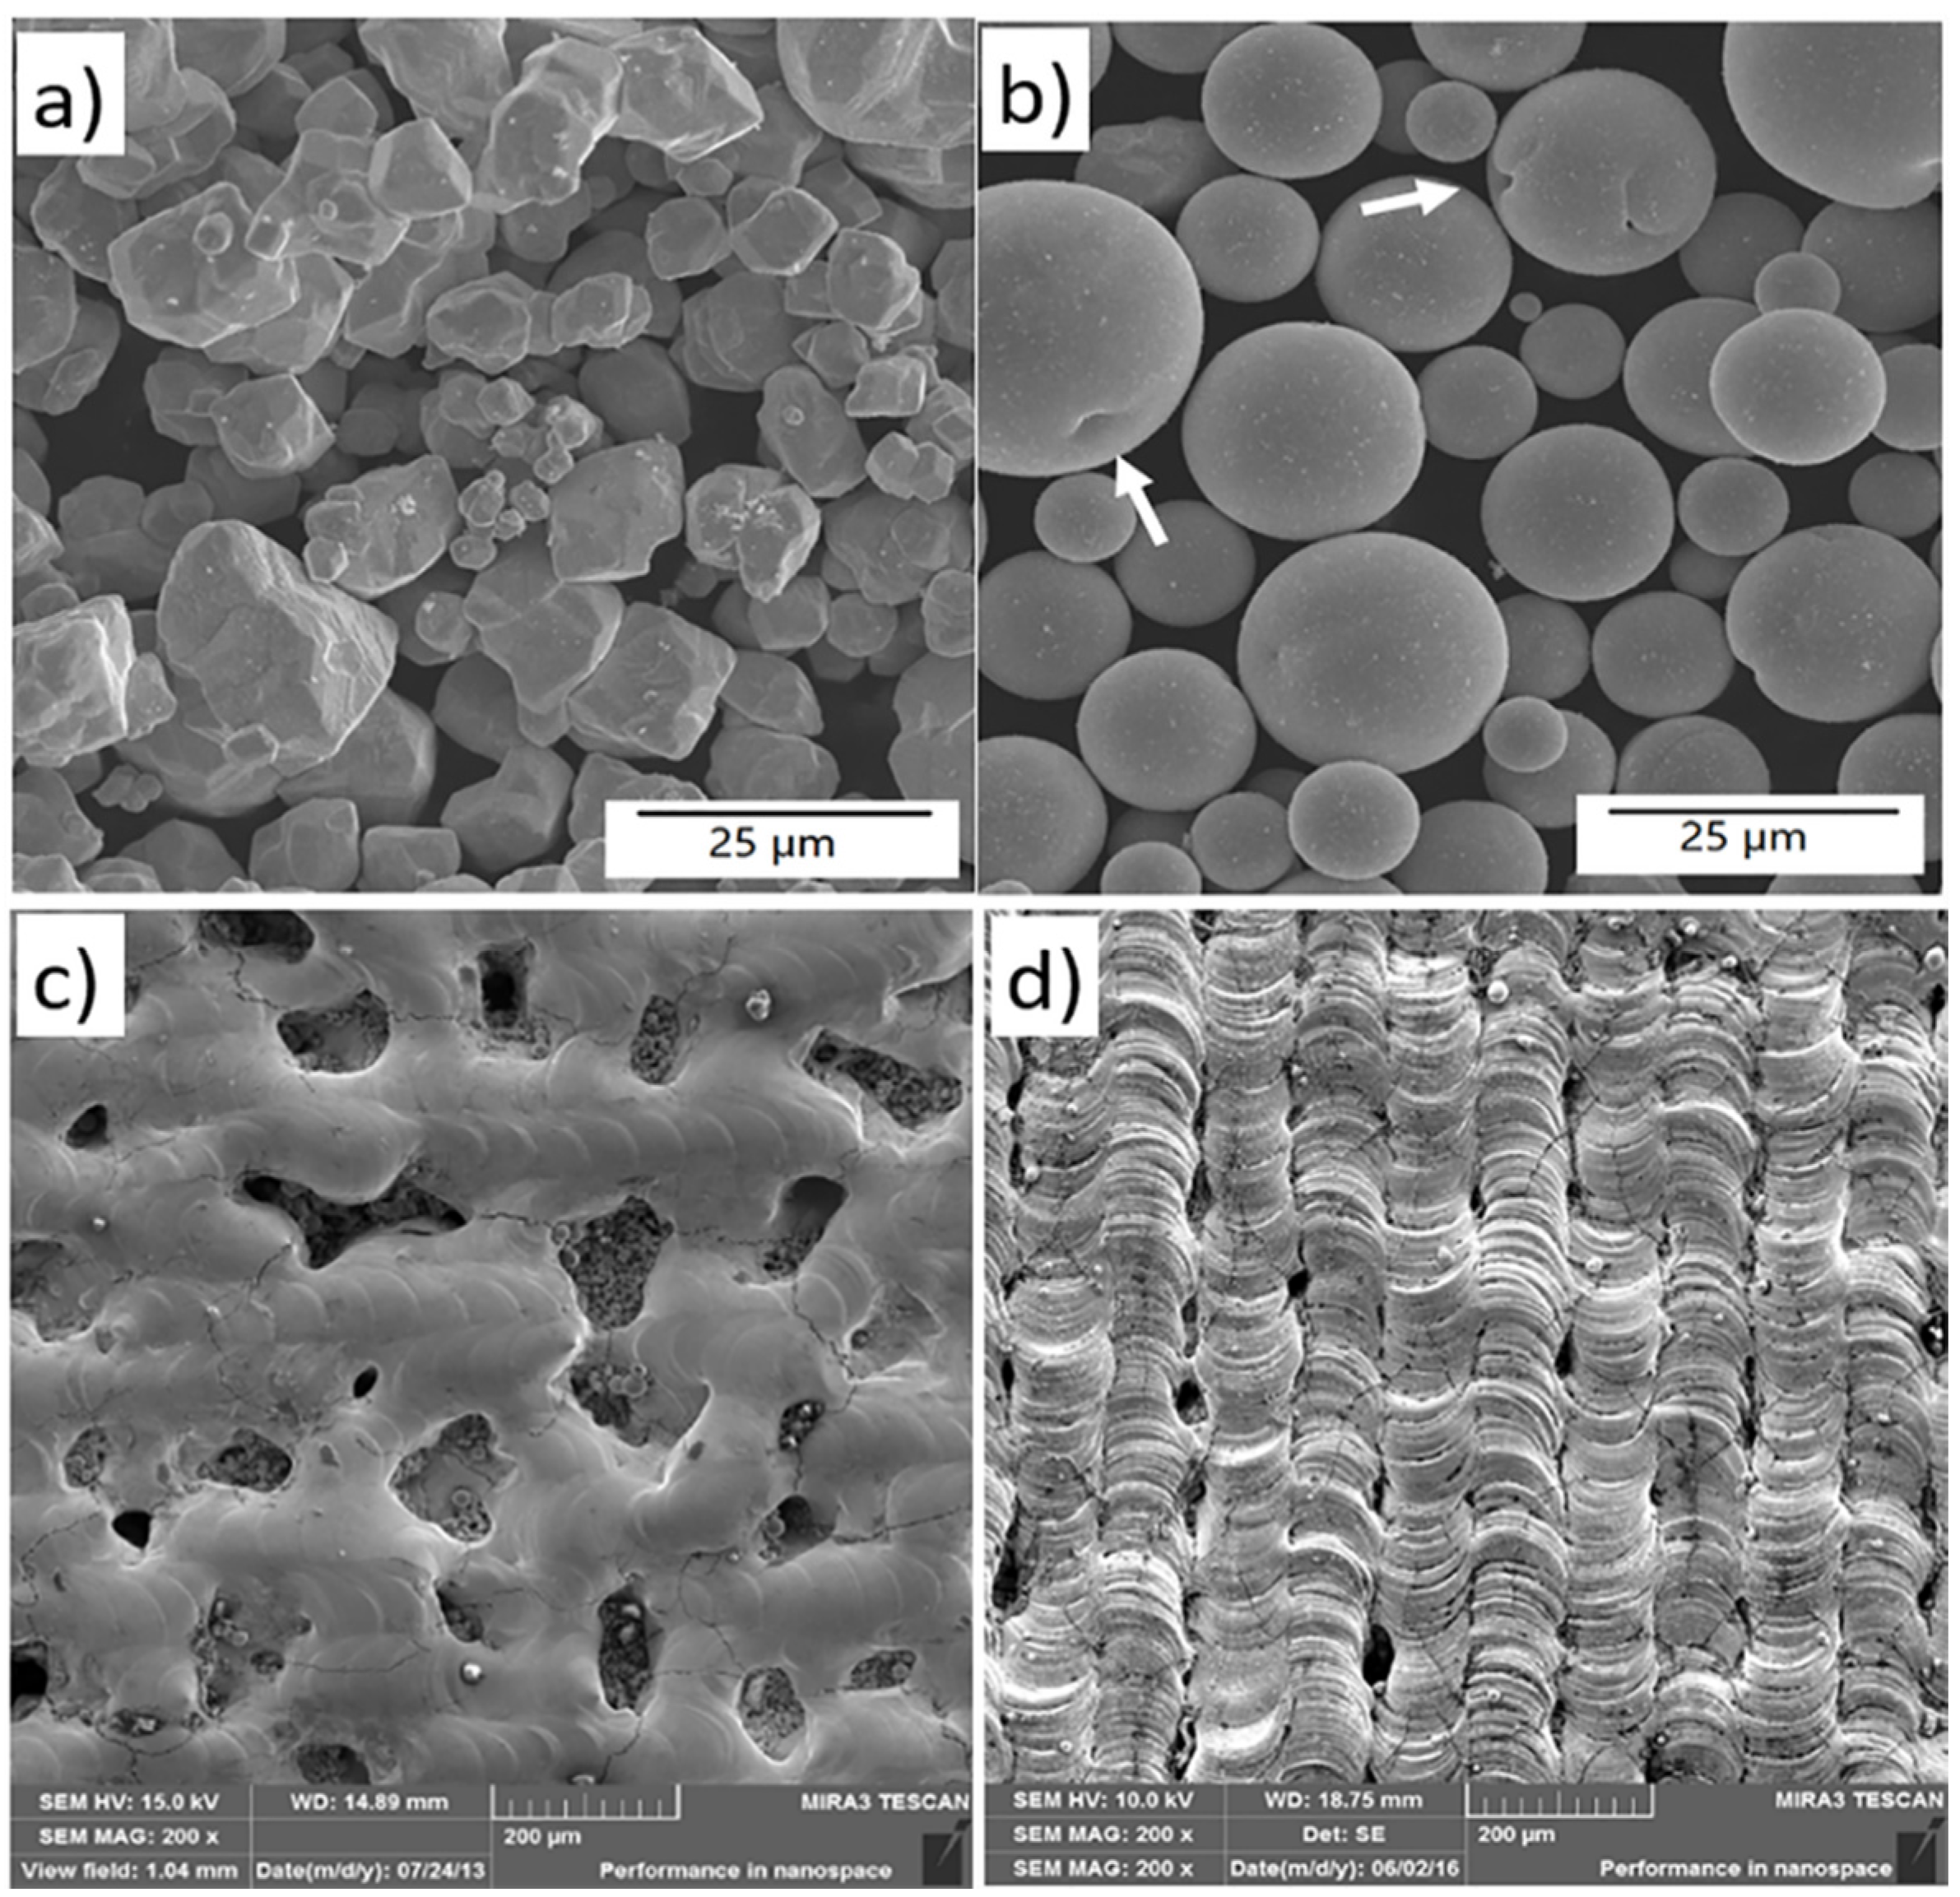
3.1. Polyhedral and Spherical Tungsten Powders

As shown in Figure 3a, the initial tungsten powders exhibited polyhedron morphologies with tetragonal and hexagonal faces, which we defined as polyhedral powders in this study. The irregular shape and agglomeration of these polyhedral powders resulted in relatively poor fluidity, with a measured flow rate of 15 s/50 g, and a packing density of 5.39 g/cm3, which is only 28% of dense tungsten. The spherical tungsten powders obtained after the spheroidization process are depicted in Figure 3b. As pointed out by the white arrows, some of the powders have pore defects which were caused by the incomplete melting during the spheroidization process. It should be noted that there is no agglomeration in spherical powders, and as a result, the packing density increases to 11.0 g/cm3, double that of the polyhedral powders. Furthermore, the fluidity increases to 6 s/50 g, which leads to a smooth and dense powder layer during the SLM process. As shown in Figure 4, the median diameter of powders decreases from 36 μm to 28 μm after the spheroidization process because of the surface shrinkage. According to the larger slope of the red line in Figure 4, it can be seen that the spherical powders have more intensive size distribution, which can be attributed to the vaporizing of fine particles in the spheroidization process. The content of the main impurities of the two powders are listed in Table 1 from which it can be seen that the spherical powders have the same impurity level as the raw powders.
These two powders demonstrate different forming properties after selective laser melting. After optimization of the SLM process, the best exposure time was determined to be 350 μs for the polyhedral powder. However, as the molten tracks broke easily for this exposure time, balling still occurred and resulted in large defects, with many pores visible in the top surface of the tungsten parts (see Figure 3c). As a result, when the next powder layer is deposited, powders trapped in these pores cause the rolled powder layer to be uneven, leading to a poor forming quality of subsequent layers. The best density achieved with optimized parameters for polyhedral powders was 84% TD. In contrast, when a laser of the same power (200 W) was applied to spherical powders, continuous tracks could be formed (as seen in Figure 3d), and an 88% TD was achieved. The best exposure time for spherical powders was determined to be 250 μs, which is shorter than that of polyhedral powders, and taken as further evidence of their better forming properties. The surface arc-shape ripple clearly indicates the laser scanning direction of every molten track. However, as may be seen in Figure 3d, the molten pool tail is shorter than those of common metal materials fabricated by SLM [12], which is caused by the relatively high viscosity of the molten pool. This high viscosity implies that the melt pool temperature after the laser exposure was insufficiently high, which contributes to balling effects. It is also observed in the same figure that the molten tracks did not overlap well, leaving some pores between adjacent tracks. The above results indicate that a 200 W laser is insufficient to achieve dense tungsten.

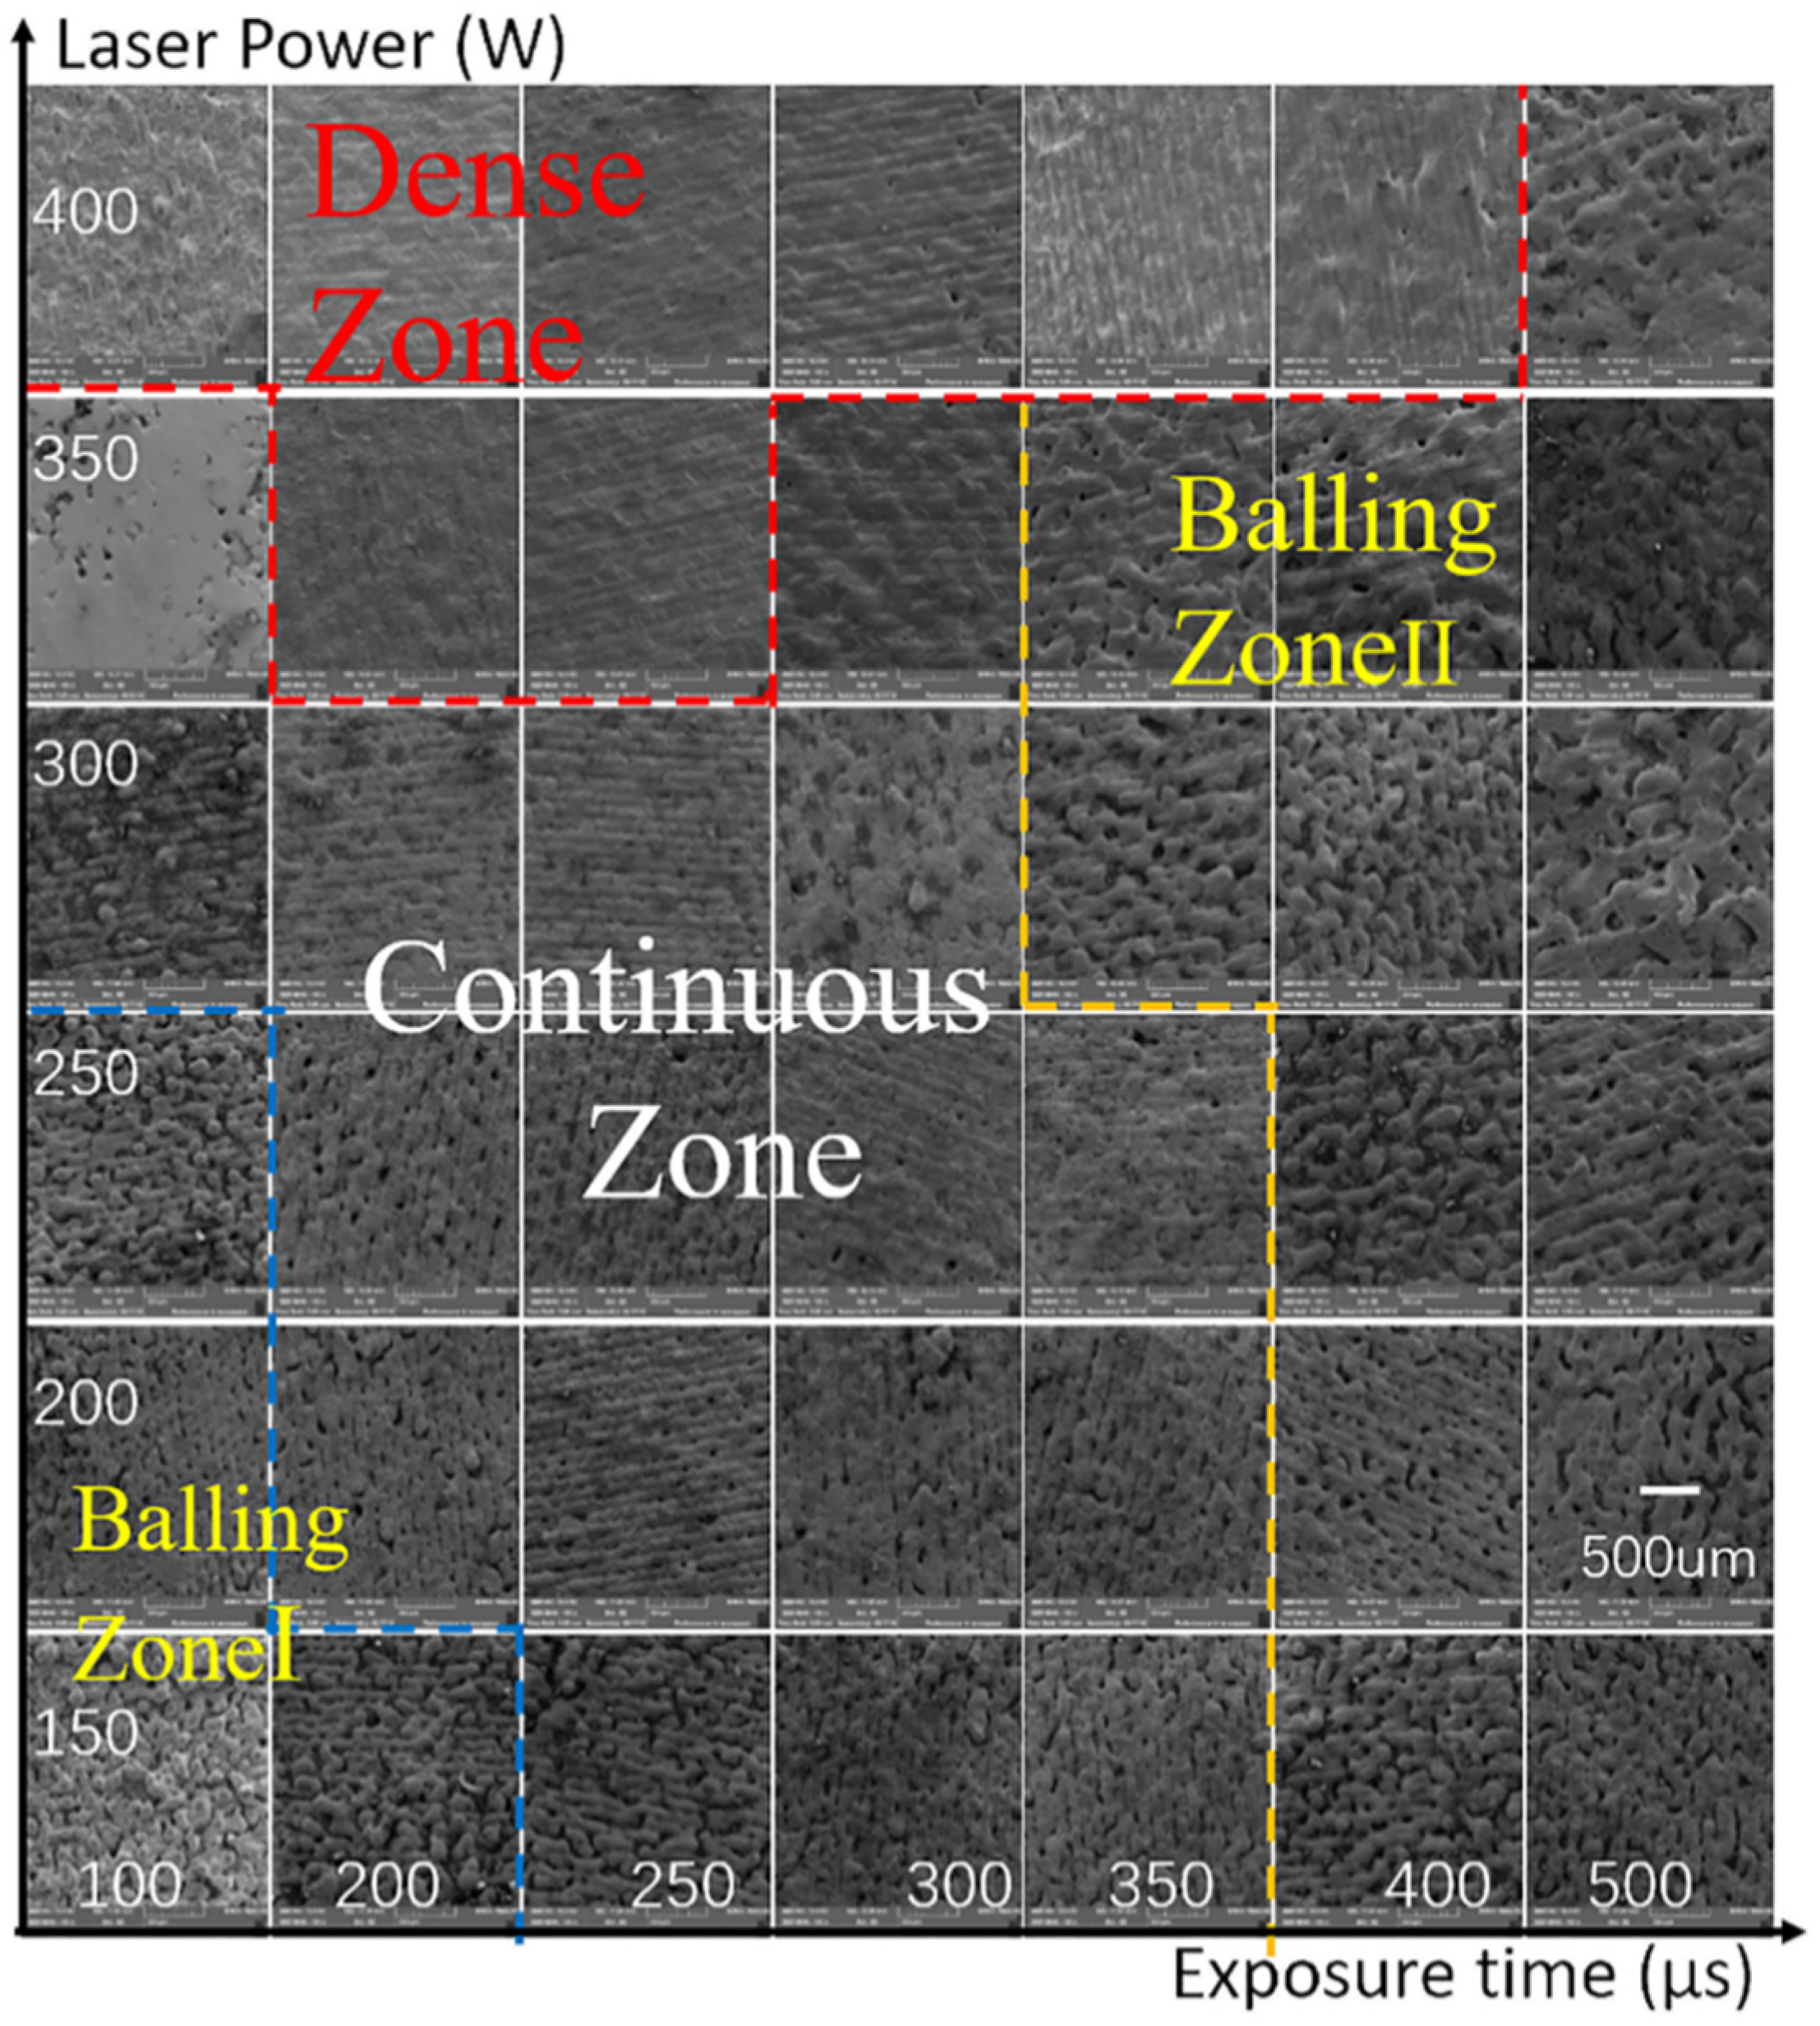
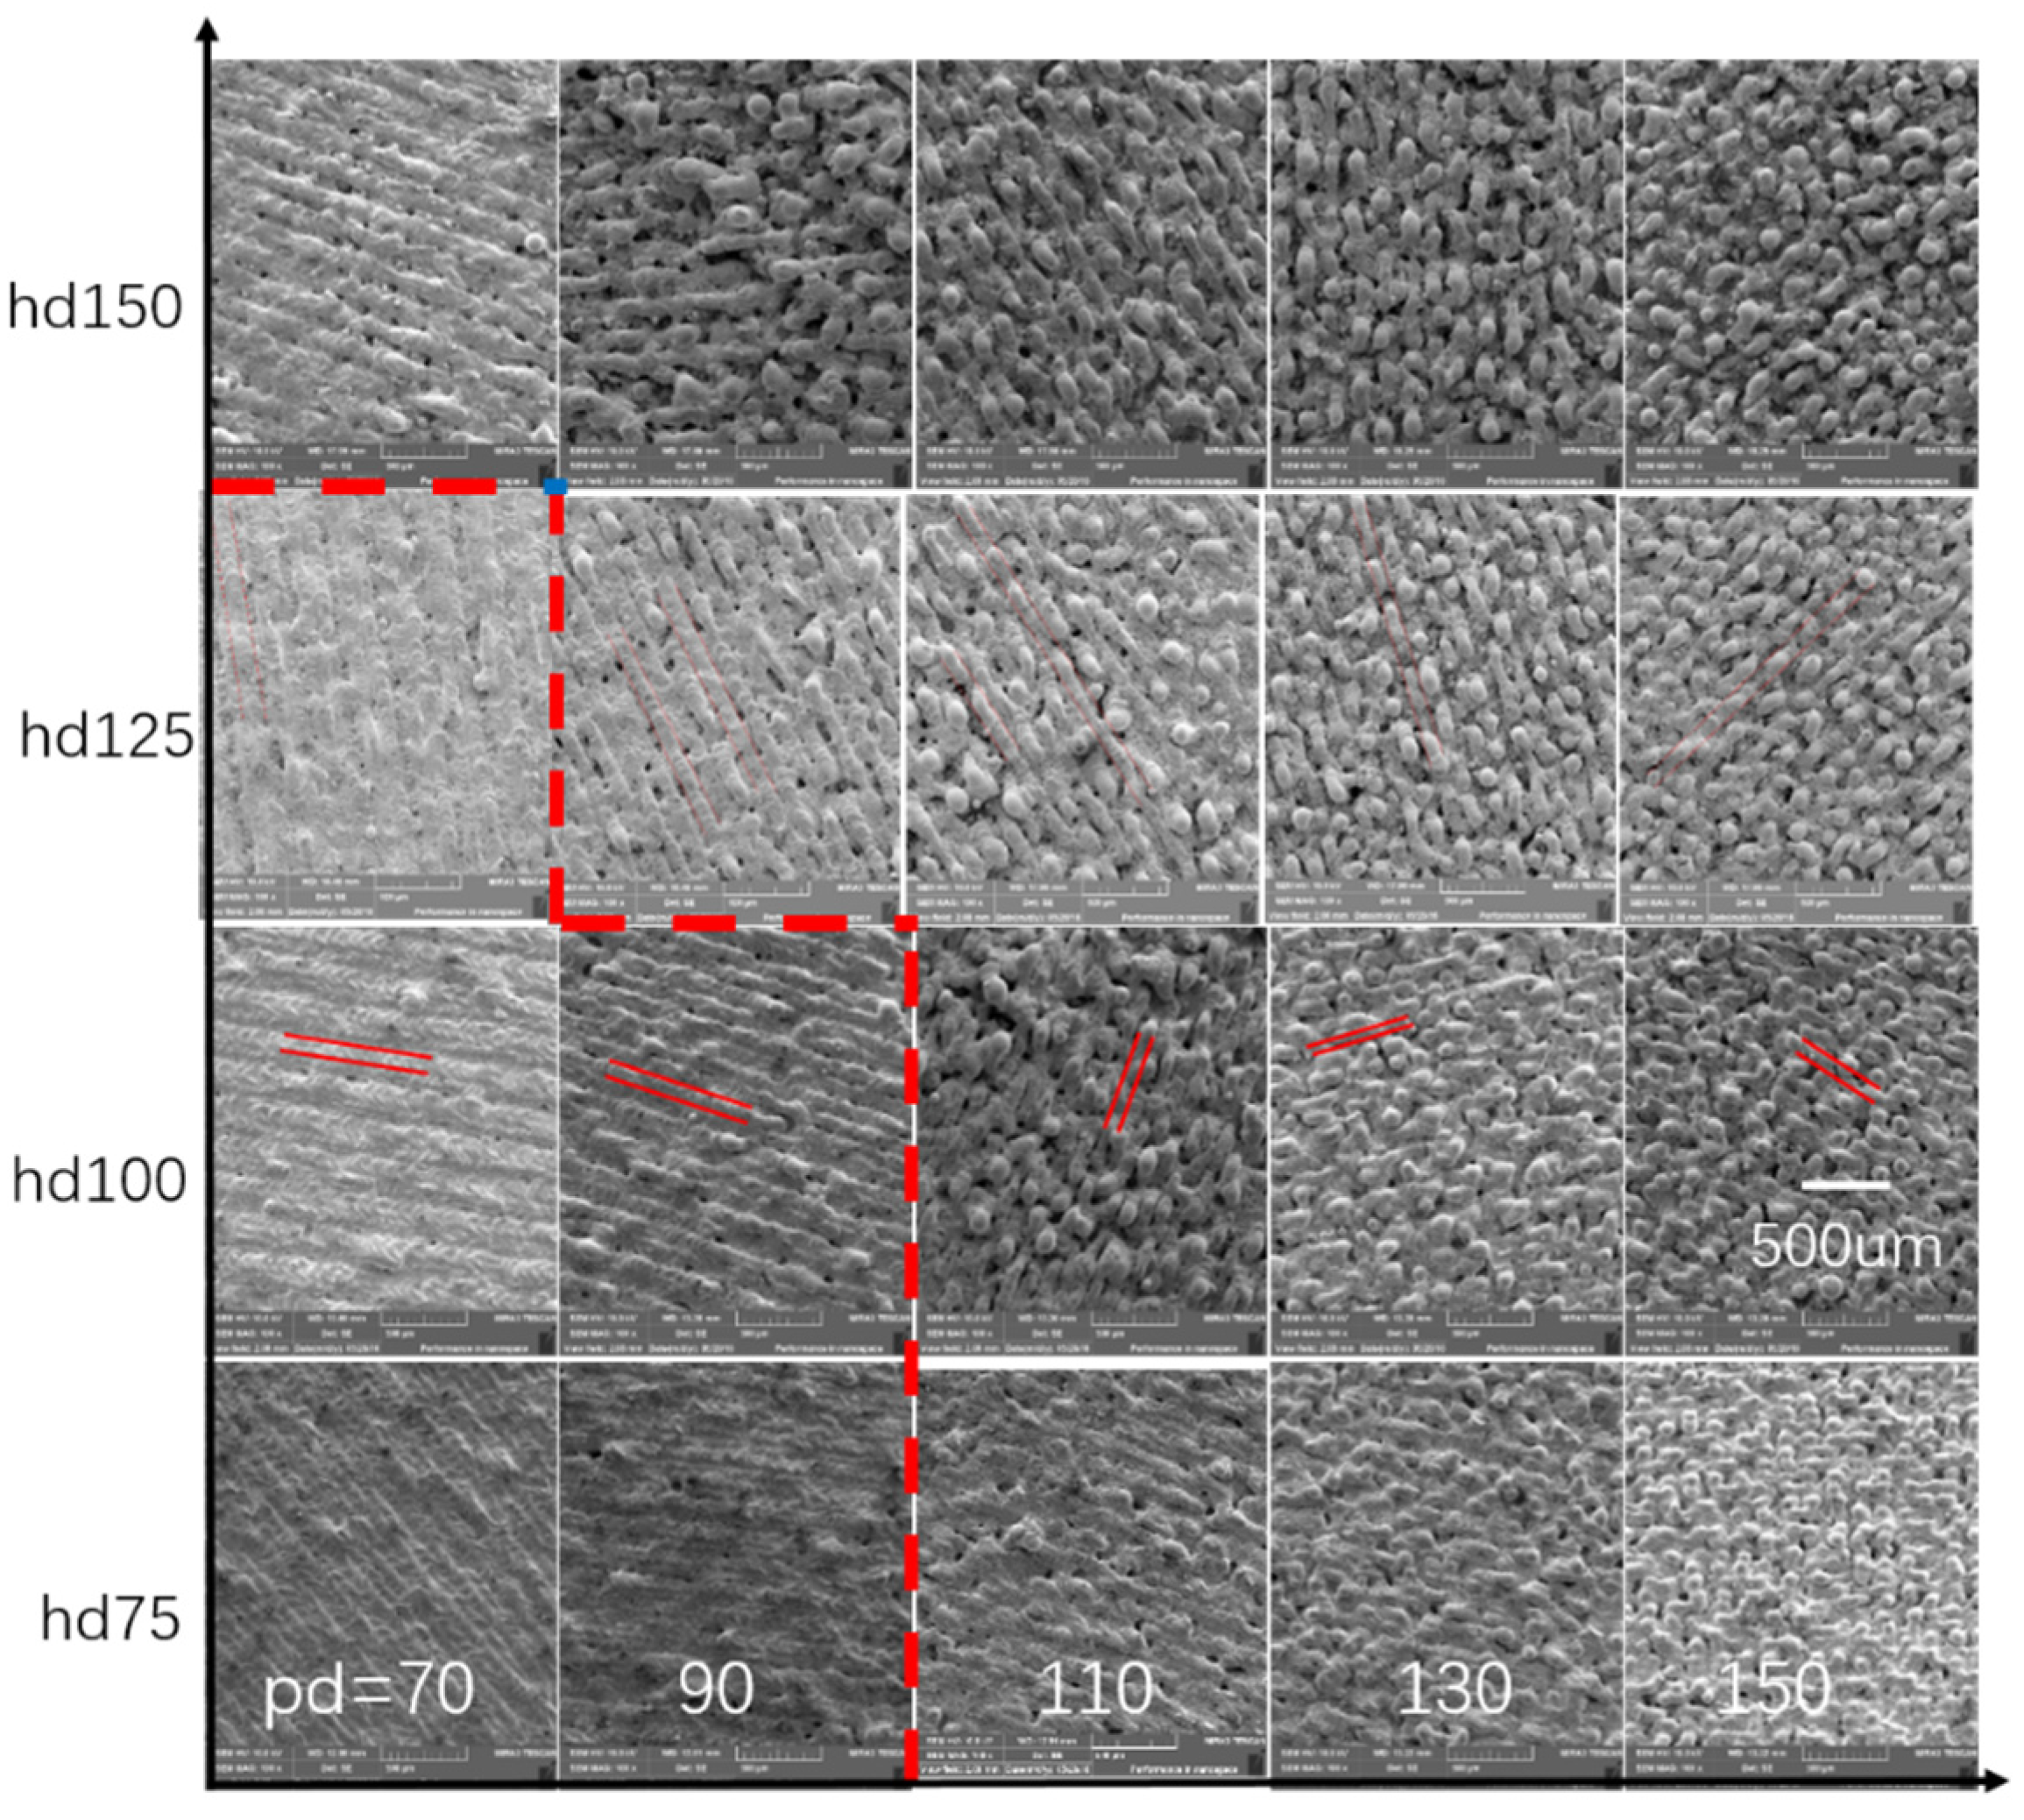
3.2. Parameters Optimization and Surface Morphologies Evolution

The surface morphologies of specimens fabricated with different laser powers and exposure times are depicted in Figure 5. Three main parameter windows can be defined according to different surface finishing; namely, the dense zone, the continuous zone, and the balling zone. The dense zone is defined as the parameter window which yields parts with a density greater than 90% TD. From Figure 5, it is seen that a laser power of at least 350 W is required to attain dense tungsten parts. The V-shape of the dense zone indicates that this processing window would become even wider with higher-powered lasers. Smooth tracks can also form in the continuous zone, but as the layers are not overlapped enough, this parameter window yields parts with lower densities than the dense zone.
The balling zone is divided into two regions (i.e., Balling Zones I and II), which indicate where balling occurs for either excessive, or insufficient, exposure times (i.e., the scanning speed is too slow/fast). The parameter window defining Balling Zone I is caused by insufficient laser energy and the additive manufacturing process can be remedied by increasing the laser power. Indeed, no balling is observed, even for very short exposure times, if the laser power is above 300 W. However, balling can also appear if the laser’s energy density is too high, which defines the Balling Zone II parameter window. As reported in [23], for excessive exposure durations, the large molten pool can “swallow” the surrounding powders, which results in larger ball defects forming than those in Balling Zone I (i.e., gaps may appear if powders lying ahead of the advancing melt are sucked into it).
Figure 6 reveals the effect of the point distance (pd) and the hatch distance (hd) on the surface morphologies. In SLM, the width of the molten track should be larger than the hd in order to achieve enough overlapping of adjacent layers. Considering that the pd influences the width of the molten track, a careful choice of both the pd and hd must be made to ensure sufficient overlapping of the neighboring tracks. For example, as shown in Figure 6, when the hd is set to 125 μm, the pd needs to be below 70 μm to achieve densification. When the hd is set to 100 μm, the measured molten track widths were 123, 109, 77, 79, and 81 μm, respectively, and in this case the pd just needs to be below 90 μm to produce overlapped tracks. It should be noted here that the molten tracks are mostly continuous, indicating the contribution of the powder spheroidization process.
The relation between the relative density (RD) and different combinations of point and hatch distances is shown in Figure 7. In general, RD decreases with increasing pd, and it is also seen that the slope of RD versus pd increases with larger hd, indicative of the expanded influence of pd on the densification process. For a smaller hd of 75 μm, the established molten track will be excessively remolten by subsequent laser scanning, which may cause balling effects, as shown in Figure 6. Consequently, the resulting densities are not high at all scanning speeds (or point distances) and, in fact, show little change with different pd. Dense samples with a density of 18.53 g/cm3 (i.e., 96.0% of the theoretical density, 19.3 g/cm3) could be achieved by setting the pd = 70 μm, and the hd = 100 μm.

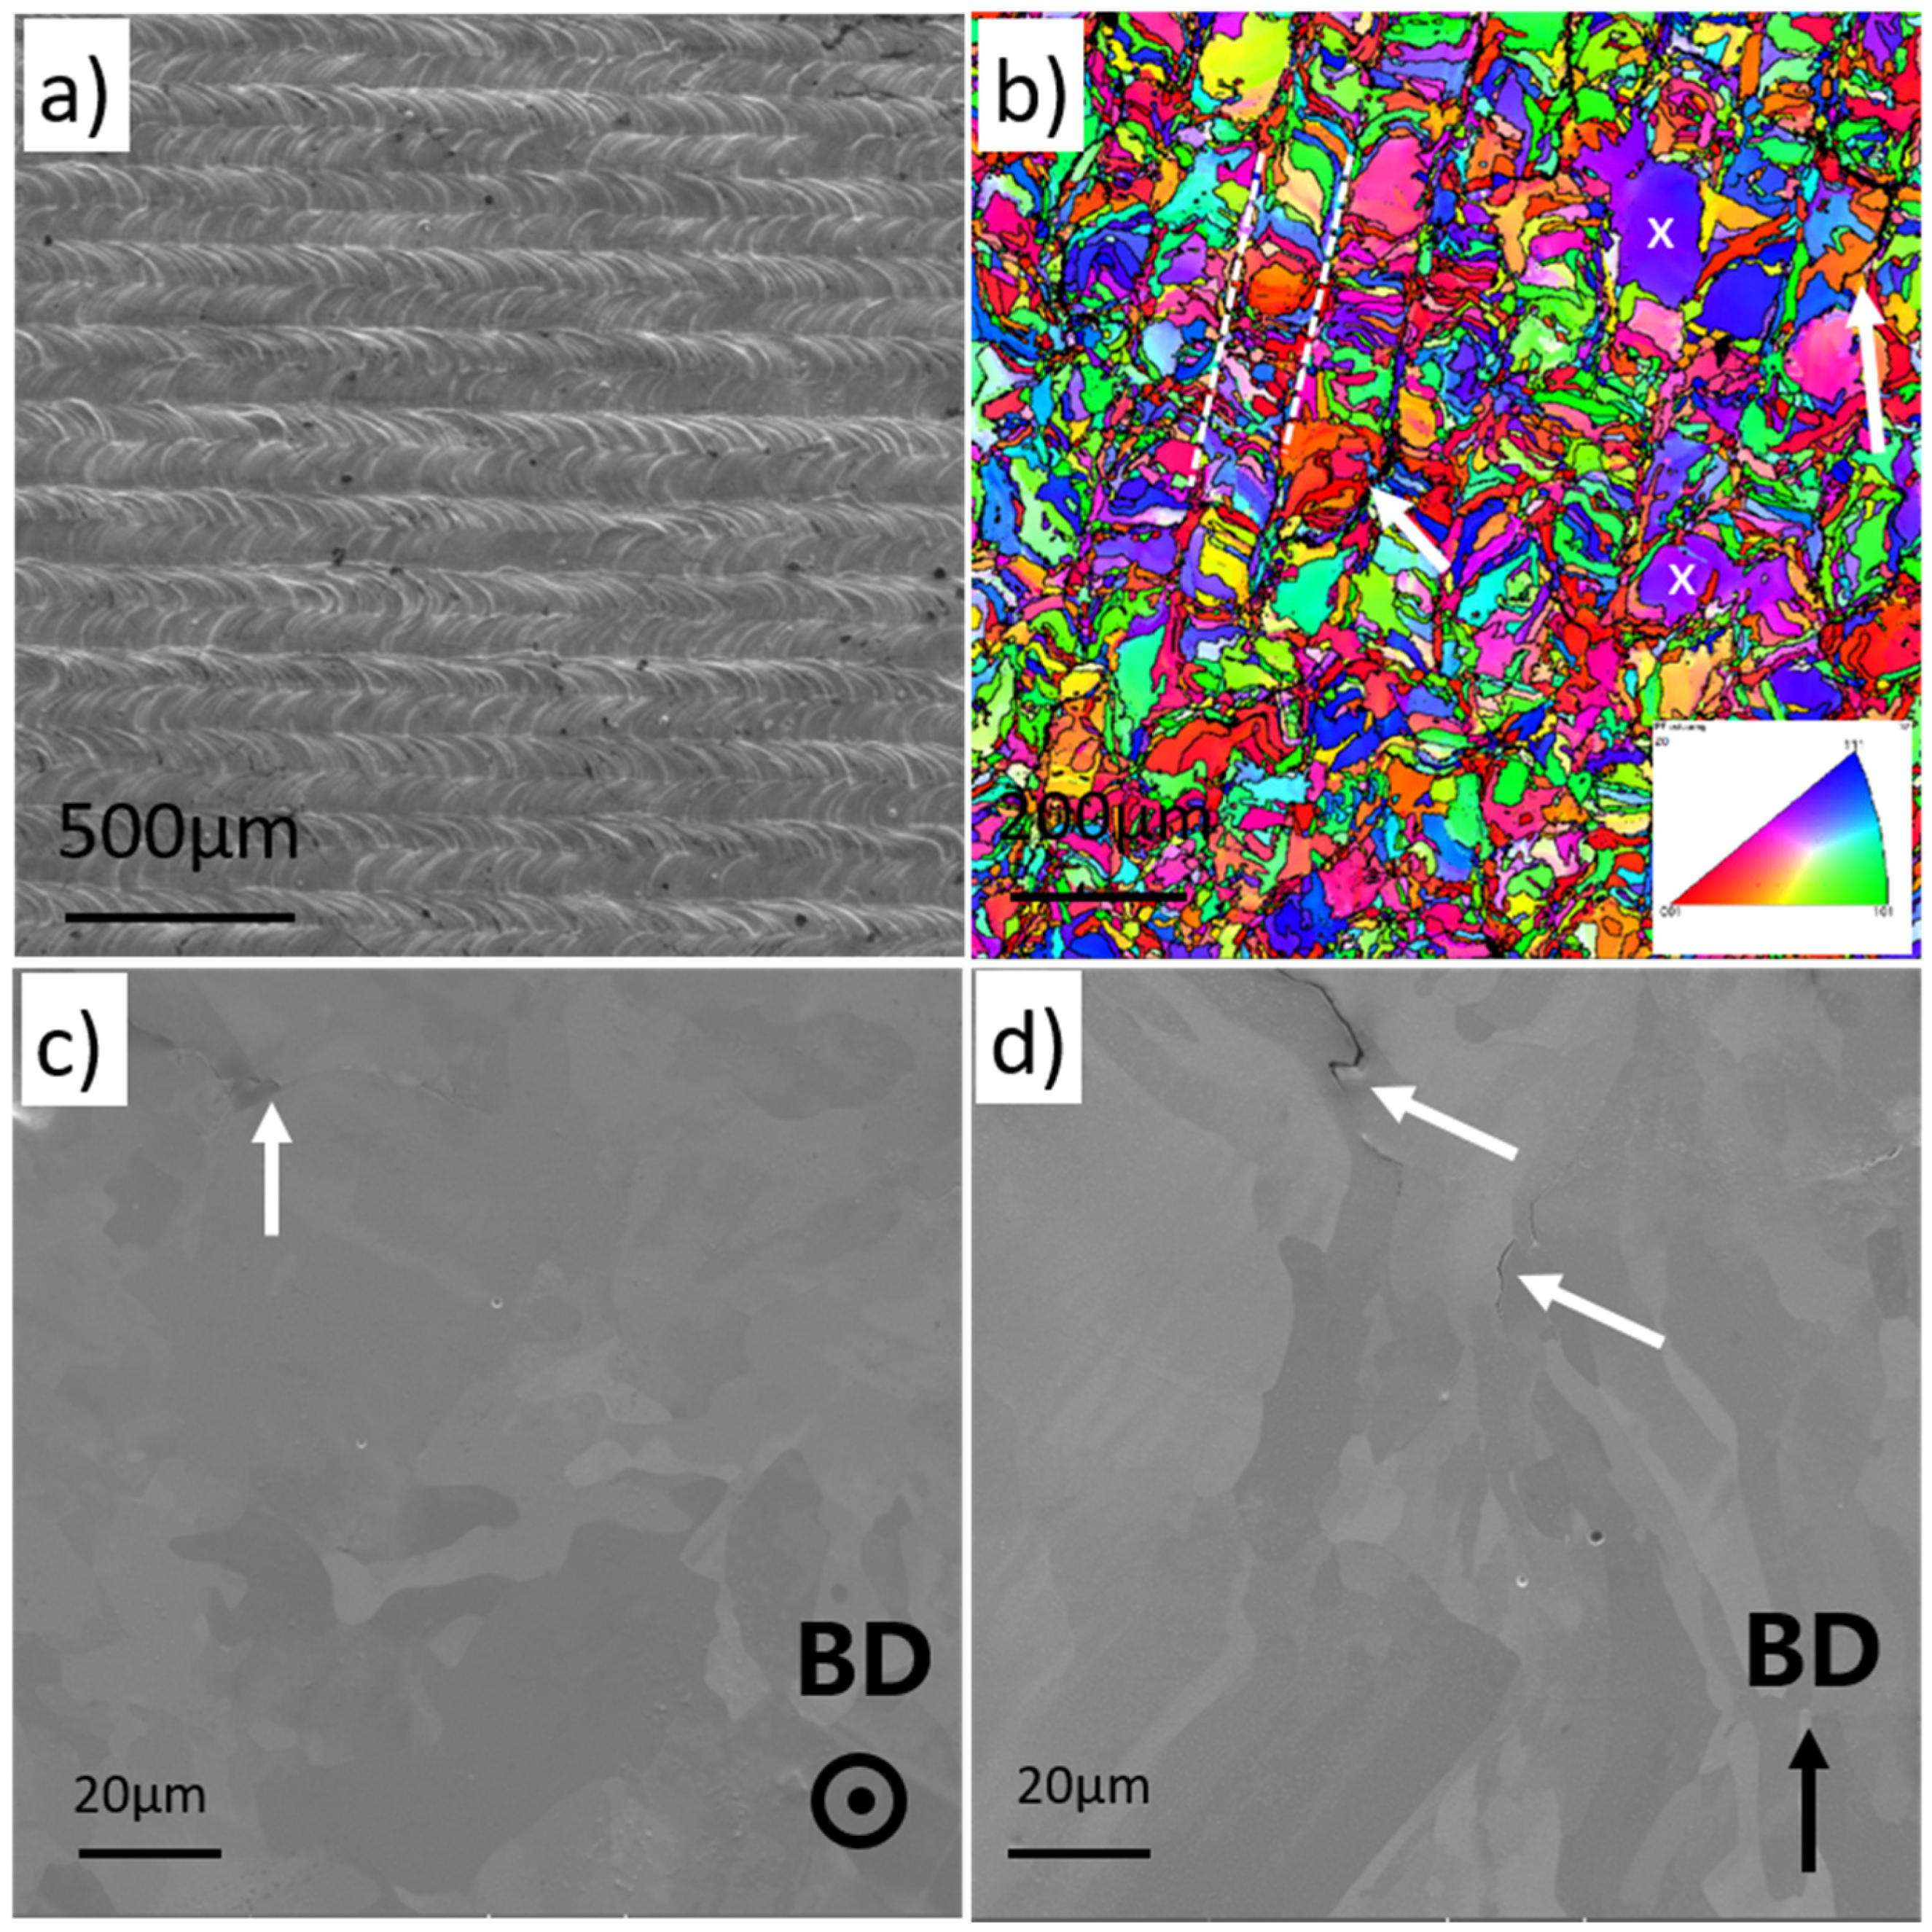
3.3. Microstructure Characterization

Dense pure tungsten blocks were successfully prepared with the following SLM parameters: P = 400 W, ET = 200 μs, pd = 75 μm, and hd = 100 μm. In Figure 8a, a SEM image of the surface of this sample shows it to be smooth with wheat-like ripples. From the top face inverse pole figure (IPF) map (Figure 8b) revealed by electron backscatter diffraction (EBSD) mapping, on the whole, and equiaxed grain morphologies, which can be ascribed to the rotated laser scanning between layers, were observed. The white dashed lines outline part of the molten track whose width is decided by the scanning hatch distance (hd). Inside the molten track, directional solidification occurs, resulting in a slender gain shape. In addition, random crystallographic orientation is observed, which may be related to the layer-by-layer rotating scanning strategy [12]. Heterogeneous grain size distribution can be observed in the IPF map of the top face. The D10, D50, and D90 data of the grain size distribution are detected as 1.81, 3.61, and 17.5 μm, respectively. The average grain size (taken as 5.12 μm), is much smaller than the laser spot diameter of 75 μm. Here, the fine grains result from the fast cooling conditions in the selective laser melting of tungsten. However, as marked by the white “x”, there are some extra-large grains (>100 μm) which may be related with local overheating around cracks.
Microstructural anisotropy is found in the top and side face of sample, as shown in Figure 8c,d. In the top face, an equiaxed grain structure is observed, while in the side face, the grains tend to grow along the building direction. During the SLM process, the maximum temperature gradient is basically along the building direction and, thus, the grains prefer to grow along the BD (building direction). Some micro-cracks are pointed out by the white arrows and need to be considered in future studies.

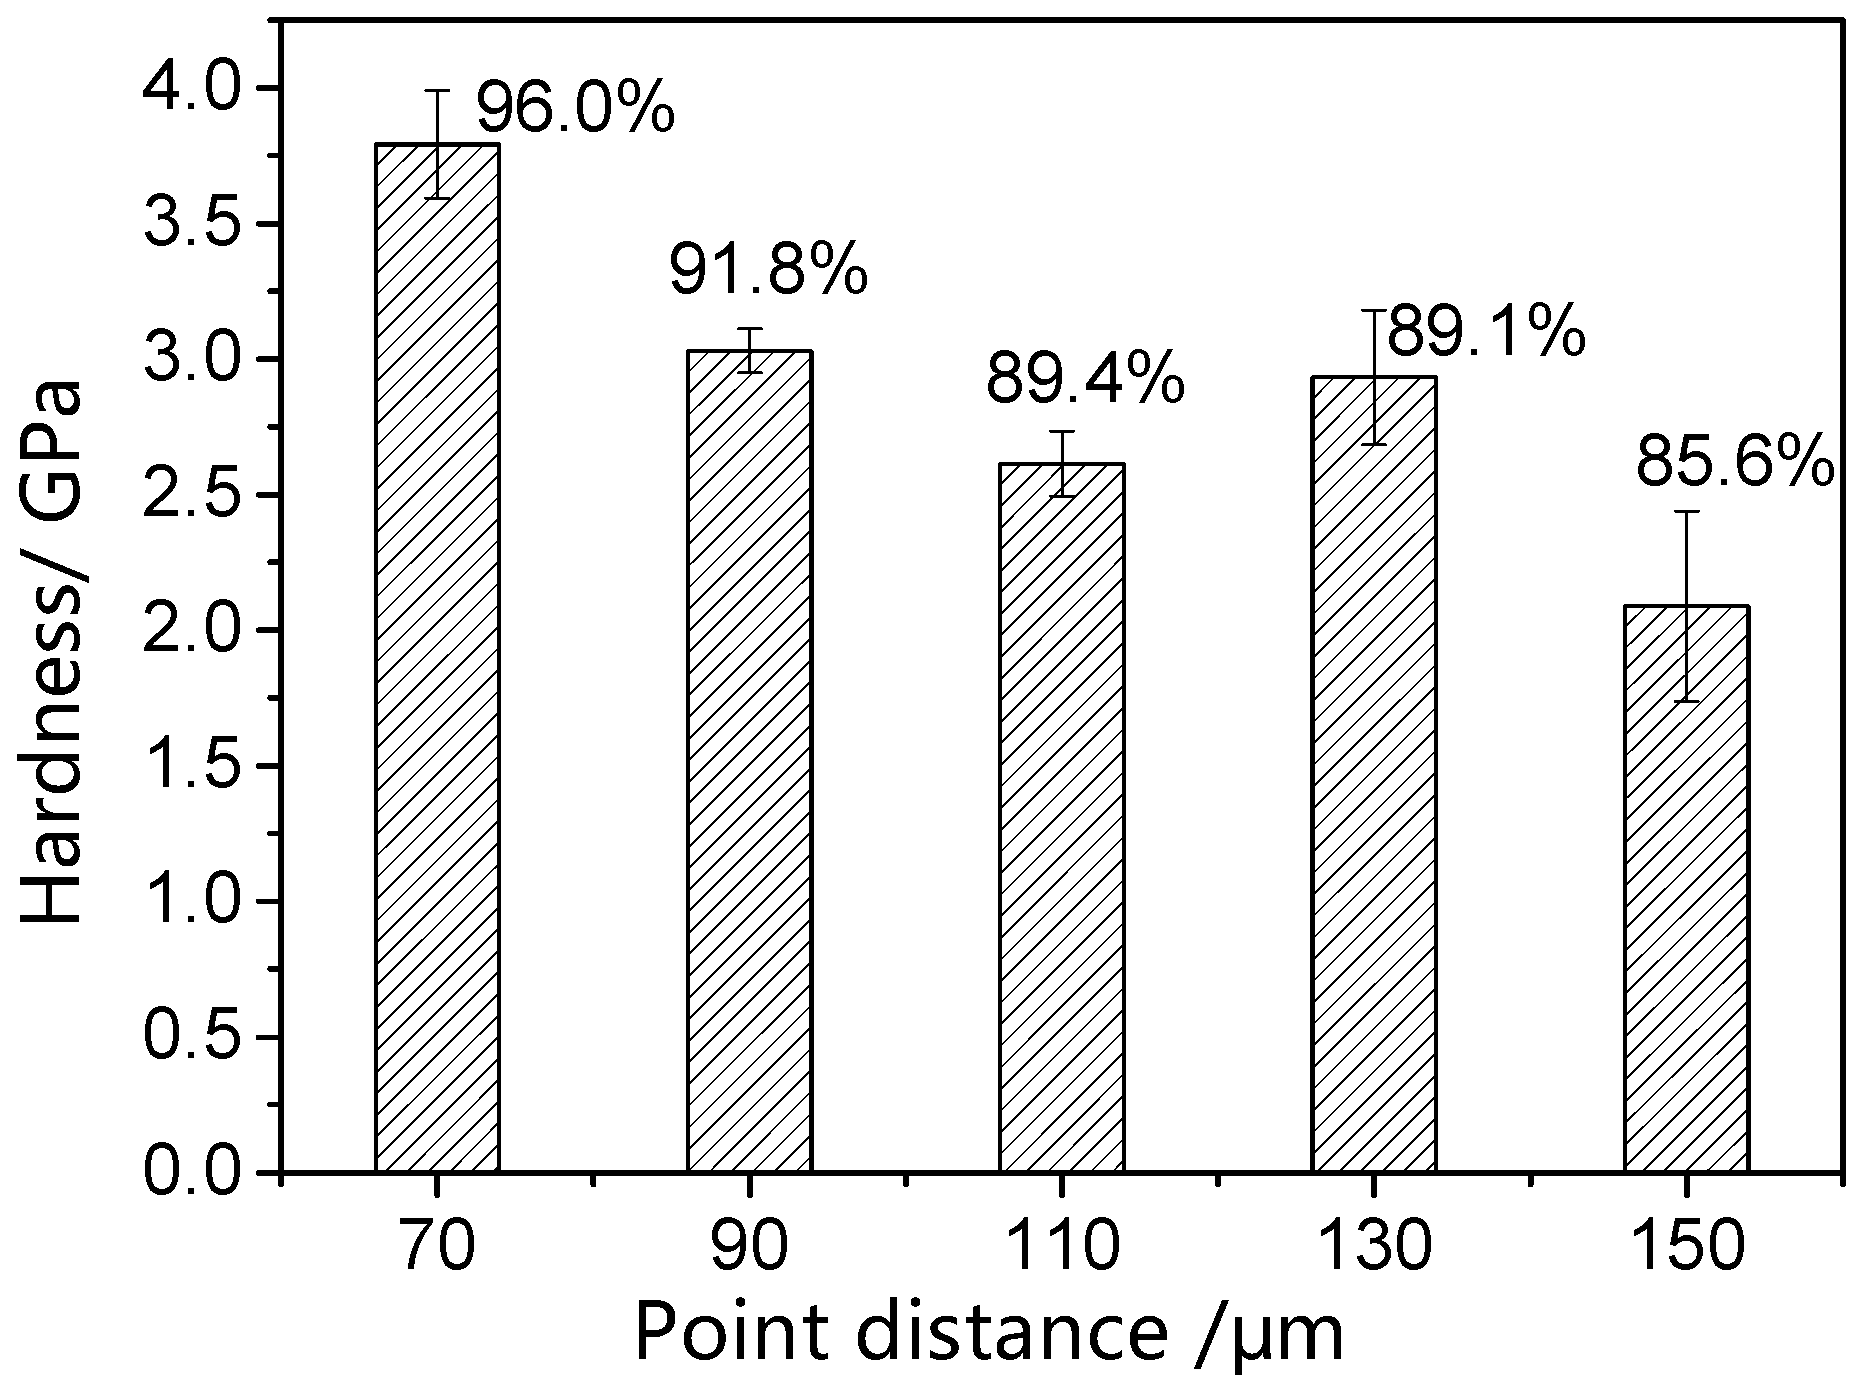
3.4. Surface Hardness

Hardness tests were carried out on specimens fabricated with different point distances, as depicted in Figure 9. In general, the hardness decreases with increasing point distance, though it should be noted that due to an increased number of defects, the hardness values are more scattered at large point distances, with larger associated error bars. The highest hardness reached was 3.79 GPa, which is close to that of tungsten fabricated by spark plasma sintering [5].

4. Discussion

Effect of Powder Spheroidization on Densification

Different forming behavior was witnessed between polyhedral and spherical powders. Under the same laser power, continuous molten tracks are formed with spherical powders, while severe balling occurs with polyhedral powders (see Figure 3). In order to better understand the mechanism, the laser absorptivity was measured for both powders by in situ methods. The temperature evolution curve of the substrate was recorded to calculate the laser absorptivity using the apparatus shown in Figure 2. After laser scanning of a substrate that was pre-deposited with powders, part of the input laser energy was absorbed by the substrate, increasing its temperature. The temperature distribution in the substrate was initially non-uniform, with the central zone being hot and the marginal zone cool, but after a period of time elapsed, this heat was conducted to the marginal zone, and the substrate reached an isothermal state. Once this isothermal state was achieved, the substrate cooled according to the convective heat transfer condition described in [24] as:
h S [ T ( t ) T a ] = m c p d T ( t ) d t
where h is the heat-transfer coefficient, S is the exchange surface area, T(t) is the temperature of the sample at time t, Ta is the ambient temperature, m is the mass of the substrate, and cp is the specific heat at constant pressure. The relation between h and T could be fitted by:
h = B ( T ( t ) T ) 1 / n
where B and n are two constants, which depend on the cooling conditions. The heat capacity of the substrate can be fitted following Parker et al. [25] by:
c p = 385 + 0.2321 T .
From the temperature evolution curve, the relation between the heat-transfer coefficient (h) versus time (t) can be fitted with Equation (1). The equivalent temperature, Tτ, of the substrate just after laser scanning, can then be determined from the fitted result, and the mean laser absorption can then be represented as:
β = m c p ( T τ T a ) P · τ
The temperature evolution curves recorded using polyhedral powders are shown in Figure 10a, from which it can be seen that the central zone of the substrate was heated immediately at t = 0 s. Indeed, throughout the laser scanning period, the temperature of the central zone kept increasing. At t = 4.5 s, the laser was switched off, and the central zone reached its peak temperature of 608 K. Subsequently, the central zone began to cool by the conduction of heat to the marginal zone and, at t = 15 s, the marginal zone reached its peak temperature. At this moment, the rate of heat lost was equal to the heat supply. At t = 20 s, the temperature difference between center and edge was less than 3 K, which was defined as an isothermal state.
The subsequent cooling process is in accordance with the law of convective heat transfer for the whole substrate, given by Equation (1). Inserting Equations (2) and (3) into this equation, the fitted cooling routine can be determined, which is plotted in Figure 10a with the blue ‘*’ symbols. The difference between experimental and computed data is less than 3 K across the whole range, which suggests that our analytic modeling is credible. The equivalent substrate temperature (Tτ) when the laser was switched off was calculated to be 395 K and, therefore, the temperature rise of the whole substrate was 95 K. According to Equation (3), the heat capacity, cp, of the substrate at Tτ is 444 J/(kg °C), and so the absorbed energy is calculated to be 452 J, leading to a laser absorptivity value for polyhedral powders of 50%, calculated according to Equation (4).
As plotted in Figure 10b, the temperature variation of spherical powders is similar to that of polyhedral powders, but there is a higher temperature rise. The peak temperature is 764 K after the laser scanning process, and more time (39 s) is taken to reach a uniform isothermal state. The equivalent substrate temperature when the laser is switched off is calculated to be 425 K, which leads to a computed value for the laser absorptivity of spherical powders of 68%.
The reasons why spherical powders possess higher laser absorptivity than polyhedral powders are as follows: (i) after spheroidization, the surface area ratio is increased and, therefore, the proportion of surface atoms, which are active for laser absorption, increases significantly; (ii) surface polygons are absent when using spherical powders and, as a result, diffuse reflection is enhanced; and (iii) with higher packing density, the multiple-scattering absorption probability between particles increases. Additionally, there are more powders to be melted in the dense spherical powder layer, meaning an elongated absorption process.
Tungsten possesses high electron and heat conductivities, resulting in a high laser reflection rate. Indeed, a large amount of the input laser energy is reflected during the tungsten SLM process. As our analysis above has shown, spherical powders can absorb more laser energy under the same operating parameters, resulting in a higher molten pool temperature. As is well known, the viscosity of tungsten is inversely proportional to the temperature [26], η = 0.108 exp ( 1.28 × 10 5 / R T ) . After spheroidization of the powders, the viscosity of the tungsten molten pool decreases, improving the wetting speed of the molten pool. It is for this reason that it can be understood why a continuous molten track can be achieved with spherical powders, but not with polyhedral powders. In addition to the effect of decreasing the molten pool’s viscosity, the spherical powder layer has a higher packing density, which implies reduced shrinkage, and a smooth surface finishing after laser consolidation. Indeed, subsequent powder layers can only be deposited evenly on a smooth, established surface. For polyhedral powders, as balling cannot be consistently controlled, this causes heritable defects in the following layers. In contrast, for spherical powders, continuous molten tracks may be formed without balling effects, and a smooth surface finishing can be achieved.

5. Conclusions

Dense pure tungsten with a density of 18.53 g/cm3 (i.e., 96.0% of the theoretical density) was manufactured by selective laser melting. The powder spheroidization process is proved to be important for the formation of continuous molten track and, thus, play a crucial role for the final density. On the one hand, the laser absorptivity of powder layer increases from 50% to 68% after spheroidization and this promotes the wetting between the melt pool and powders. On the other hand, the spherical powders have much higher packing density (11.0 g/cm3) than polyhedral powders (5.39 g/cm3), resulting in a denser and more even powder layer.
With the spherical powders, densification was achieved and the optimized laser parameters were: P = 400 W, ET = 200 μs, pd = 75 μm, and hd = 100 μm. Smooth surface morphology with wheat-like ripples was obtained after SLM, while some microcracks existed and need further research. The fabricated tungsten has fine average grain size (5.12 μm) and, thus, its hardness (3.79 GPa) is comparable to that of conventionally-fabricated tungsten. The findings in this study provide guidelines for the selective laser melting of tungsten parts.

Acknowledgments

The authors acknowledge the financial support of the National Magnetic Confinement Fusion Science Program of China under grant 2014GB117000. Bin Qian, Jie Chen, Xi Du, and Rodgers Ma at Reinshaw Plc are acknowledged for their technical support of the SLM experiments. Shaocun Liu, Haixia Chen, and Rui Chen at Longyan Zijing Innovation Research Institute are acknowledged for their assistance with the spheroidization experiments.

Author Contributions

Dianzheng Wang and Chenfan Yu conceived and designed the experiments; Dianzheng Wang, Xin Zhou, and Jing Ma analyzed the data; and Dianzheng Wang, Wei Liu, and Zhijian Shen wrote the paper.

Conflicts of Interest

The authors declare no conflict of interest.

References

  1. Huang, L.; Jiang, L.; Topping, T.D.; Dai, C.; Wang, X.; Carpenter, R.; Haines, C.; Schoenung, J.M. In situ oxide dispersion strengthened tungsten alloys with high compressive strength and high strain-to-failure. Acta Mater. 2017, 122, 19–31. [Google Scholar] [CrossRef]
  2. Wei, Q.; Jiao, T.; Ramesh, K.T.; Ma, E.; Kecskes, L.J.; Magness, L.; Dowding, R.; Kazykhanov, V.U.; Valiev, R.Z. Mechanical behavior and dynamic failure of high-strength ultrafine grained tungsten under uniaxial compression. Acta Mater. 2006, 54, 77–87. [Google Scholar] [CrossRef]
  3. Philipps, V. Tungsten as material for plasma-facing components in fusion devices. J. Nucl. Mater. 2011, 415, S2–S9. [Google Scholar] [CrossRef]
  4. Ezato, K.; Suzuki, S.; Seki, Y.; Yamada, H.; Hirayama, T.; Yokoyama, K.; Escourbiac, F.; Hirai, T. Progress of iter full tungsten divertor technology qualification in Japan: Manufacturing full-scale plasma-facing unit prototypes. Fusion Eng. Des. 2016, 109, 1256–1260. [Google Scholar] [CrossRef]
  5. Ma, J.; Zhang, J.Z.; Liu, W.; Shen, Z.J. Suppressing pore-boundary separation during spark plasma sintering of tungsten. J. Nucl. Mater. 2013, 438, 199–203. [Google Scholar] [CrossRef]
  6. Zhou, Z.J.; Pintsuk, G.; Linke, J.; Hirai, T.; Rodig, M.; Ma, Y.; Ge, C.C. Transient high heat load tests on pure ultra-fine grained tungsten fabricated by resistance sintering under ultra-high pressure. Fusion Eng. Des. 2010, 85, 115–121. [Google Scholar] [CrossRef]
  7. Antusch, S.; Norajitra, P.; Piotter, V.; Ritzhaupt-Kleissl, H.J.; Spatafora, L. Powder injection molding—An innovative manufacturing method for He-cooled demo divertor components. Fusion Eng. Des. 2011, 86, 1575–1578. [Google Scholar] [CrossRef]
  8. Antusch, S.; Commin, L.; Heneka, J.; Piotter, V.; Plewa, K.; Walter, H. A new fully automatic pim tool to replicate two component tungsten demo divertor parts. Fusion Eng. Des. 2013, 88, 2461–2465. [Google Scholar] [CrossRef]
  9. Kruth, J.P.; Froyen, L.; Van Vaerenbergh, J.; Mercelis, P.; Rombouts, M.; Lauwers, B. Selective laser melting of iron-based powder. J. Mater. Process. Technol. 2004, 149, 616–622. [Google Scholar] [CrossRef]
  10. Gu, D.D.; Meiners, W.; Wissenbach, K.; Poprawe, R. Laser additive manufacturing of metallic components: Materials, processes and mechanisms. Int. Mater. Rev. 2012, 57, 133–164. [Google Scholar] [CrossRef]
  11. Zhong, Y.; Liu, L.F.; Wikman, S.; Cui, D.Q.; Shen, Z.J. Intragranular cellular segregation network structure strengthening 316l stainless steel prepared by selective laser melting. J. Nucl. Mater. 2016, 470, 170–178. [Google Scholar] [CrossRef]
  12. Zhou, X.; Li, K.L.; Zhang, D.D.; Liu, X.H.; Ma, J.; Liu, W.; Shen, Z.J. Textures formed in a cocrmo alloy by selective laser melting. J. Alloys Compd. 2015, 631, 153–164. [Google Scholar] [CrossRef]
  13. Hong, M.H.; Min, B.K.; Kwon, T.Y. The influence of process parameters on the surface roughness of a 3d-printed co-cr dental alloy produced via selective laser melting. Appl. Sci. 2016, 6, 401. [Google Scholar] [CrossRef]
  14. Popovich, A.; Sufiiarov, V.; Polozov, I.; Borisov, E.; Masaylo, D.; Orlov, A. Microstructure and mechanical properties of additive manufactured copper alloy. Mater. Lett. 2016, 179, 38–41. [Google Scholar] [CrossRef]
  15. Yadroitsev, I.; Gusarov, A.; Yadroitsava, I.; Smurov, I. Single track formation in selective laser melting of metal powders. J. Mater. Process. Technol. 2010, 210, 1624–1631. [Google Scholar] [CrossRef]
  16. Ebert, R.; Ullmann, F.; Hildebrandt, D.; Schille, J.; Hartwig, L.; Kloetzer, S.; Streek, A.; Exner, H. Laser processing of tungsten powder with femtosecond laser radiation. J. Laser Micro Nanoeng. 2012, 7, 38–43. [Google Scholar] [CrossRef]
  17. Zhang, D.Q.; Cai, Q.Z.; Liu, J.H. Formation of nanocrystalline tungsten by selective laser melting of tungsten powder. Mater. Manuf. Process. 2012, 27, 1267–1270. [Google Scholar] [CrossRef]
  18. Zhou, X.; Liu, X.H.; Zhang, D.D.; Shen, Z.J.; Liu, W. Balling phenomena in selective laser melted tungsten. J. Mater. Process. Technol. 2015, 222, 33–42. [Google Scholar] [CrossRef]
  19. Deprez, K.; Vandenberghe, S.; Van Audenhaege, K.; Van Vaerenbergh, J.; Van Holen, R. Rapid additive manufacturing of mr compatible multipinhole collimators with selective laser melting of tungsten powder. Med. Phys. 2013, 40, 012501. [Google Scholar] [CrossRef] [PubMed]
  20. Yadroitsev, I.; Bertrand, P.; Smurov, I. Parametric analysis of the selective laser melting process. Appl. Surf. Sci. 2007, 253, 8064–8069. [Google Scholar] [CrossRef]
  21. Wang, L.Z.; Liu, Y.; Chang, S. Fabrication of spherical AlSi10Mg powders by radio frequency plasma spheroidization. Metall. Mater. Trans. A 2016, 47A, 2444–2453. [Google Scholar] [CrossRef]
  22. Panwisawas, C.; Qiu, C.L.; Sovani, Y.; Brooks, J.W.; Attallah, M.M.; Basoalto, H.C. On the role of thermal fluid dynamics into the evolution of porosity during selective laser melting. Scr. Mater. 2015, 105, 14–17. [Google Scholar] [CrossRef]
  23. Gusarov, A.V.; Yadroitsev, I.; Bertrand, P.; Smurov, I. Heat transfer modelling and stability analysis of selective laser melting. Appl. Surf. Sci. 2007, 254, 975–979. [Google Scholar] [CrossRef]
  24. Frenk, A.; Hoadley, A.F.A.; Wagniere, J.D. Insitu technique for measuring the absorption during laser surface remelting. Metall. Trans. B 1991, 22, 139–141. [Google Scholar] [CrossRef]
  25. Parker, W.J.; Jenkins, R.J.; Abbott, G.L.; Butler, C.P. Flash method of determining thermal diffusivity, heat capacity, and thermal conductivity. J. Appl. Phys. 1961, 32, 1679–1684. [Google Scholar] [CrossRef]
  26. Paradis, P.F.; Ishikawa, T.; Yoda, S. Viscosity of liquid undercooled tungsten. J. Appl. Phys. 2005, 97, 106101. [Google Scholar] [CrossRef]
Figure 1. Photograph showing the pure tungsten part fabricated by SLM (selective laser melting). The arrow BD indicates the building direction.
Applsci 07 00430 g001
Figure 2. (a) Schematic illustration of the laser absorptivity testing device; (b) two K-type thermocouples were welded to the underside of the substrate in order to record the temperature of the marginal and central zones.
Applsci 07 00430 g002
Figure 3. Scanning electron microscopy (SEM) images showing the morphologies of (a) polyhedral and (b) spherical tungsten powders; and SEM images showing the top surface of tungsten parts fabricated using (c) polyhedral and (d) spherical powders.
Applsci 07 00430 g003
Figure 4. Size distribution of polyhedral and spherical powders.
Applsci 07 00430 g004
Figure 5. The SEM images showing surface morphologies of tungsten parts under different laser powers and exposure times; the point distance and hatch distance are set as 75 μm and 100 μm, respectively.
Applsci 07 00430 g005
Figure 6. SEM images showing surface morphologies of tungsten parts for a range of point and hatch distances. Laser power and exposure time are set to 400 W and 100 μs, respectively. The dotted line plots the optimized parameter window under this condition. The red line pairs display the width of molten tracks.
Applsci 07 00430 g006
Figure 7. Relative density under a series of point distances and hatch distances.
Applsci 07 00430 g007
Figure 8. (a) SEM image of surface morphology; (b) surface inverse pole figure (IPF Z) map detected by EBSD (electron backscatter diffraction) in which misorientation above 15° is adopted to identify grain boundaries. Grain orientation of ( 001), (101), and (111) are presented by red, green and blue color, respectively; (c) SEM image of the surface microstructure; and (d) SEM image of the side face microstructure.
Applsci 07 00430 g008
Figure 9. Top face hardness of fabricated tungsten for a range of point distances, with SLM parameters P (power) = 400 W, ET (exposure time) = 100 μs, and hd = 100 μm.
Applsci 07 00430 g009
Figure 10. The recorded temperature curves for a substrate pre-deposited with (a) polyhedral and (b) spherical powders. The red and black lines represent the temperature of the central point and marginal line, respectively. The blue “*” line represents the analytic temperature curve which matches the experiment data very well.
Applsci 07 00430 g010
Table 1. Main impurity elements content in two types of powders (wt %).
Power TypeCON
Polyhedral powder0.00660.0210.0052
Spherical powder0.00830.0100.0018

