Article

A New Health Assessment Index of Tunnel Lining Based on the Digital Inspection of Surface Cracks

1
Graduate School of Engineering, Nagasaki University, Nagasaki 852-8521, Japan
2
West Nippon Expressway Engineering Kyushu Co., Ltd., Fukuoka 810-0073, Japan
3
West Nippon Expressway Co., Ltd., Nagasaki 854-0063, Japan
4
State Key Laboratory of Mining Disaster Prevention and Control Co-founded by Shandong Province and the Ministry of Science and Technology, Shandong University of Science and Technology, Qingdao 266590, China
*
Author to whom correspondence should be addressed.
Appl. Sci. 2017, 7(5), 507; https://doi.org/10.3390/app7050507
Submission received: 28 March 2017 / Revised: 26 April 2017 / Accepted: 9 May 2017 / Published: 12 May 2017

Abstract

:
The stability assessment of aged tunnel linings are mainly evaluated based on the visual inspection, and the Tunnel-lining Crack Index (TCI) is one of the most widely used tunnel lining health assessment indexes in Japan. However, the intersection and distribution of cracks, which could influence the stability of tunnel lining greatly, were not considered in TCI. A new method was proposed for the health assessment of tunnel lining, which evaluated the lining states according to the fractal dimension of cracks. Based on the machine vision-based method, the crack image could be extracted efficiently. The fractal dimension of lining cracks in one span could be obtained in a few minutes. A series of comparative tests and field tests were conducted to evaluate the validity of this new method. The comparative tests confirmed that fractal dimension was able to characterize the density, width, and distribution of cracks. The intersection of cracks, which would increase the risk of lining collapse, could also increase the fractal dimension. The fractal dimensions of tunnel lining cracks were obtained according to the digital inspection test of Hidake Tunnel in Japan for all the 65 spans. Moreover, the TCI was obtained through statistical methods. The correlation between fractal dimension and TCI of tunnel lining was studied. The significance of the new evaluation index is that it can identify the unusual spans of tunnel lining and provide a basis for further internal testing. As a complement to the conventional visual inspection method, the fractal dimension of the cracks is a promising health assessment index.

1. Introduction

A large number of tunnels have been in service for the past decades all over the world. Tunnels were mainly supported by concrete lining [1,2]. The type of concrete lining can be divided into three categories, including shotcrete, prefab and cast-in-place lining. The cast-in-place concrete lining was the most commonly used one and it was studied in this paper. The persistent ageing and seismic activity lead to many problems to the cast-in-place concrete lining, such as cracking, corrosion and leakage [3,4,5]. Damage to the tunnel lining will decrease its integrity and subsequently increase the risk of tunnel lining collapse [6]. In order to deal with this situation, there is an urgent requirement for accurate tunnel lining health assessment methods [7,8,9,10].
Generally, the stability of aged cast-in-place tunnel lining was mainly evaluated based on visual inspection [11]. However, the evaluation standard was qualitative, and the results depended on the experience of different engineers. As a solution of this problem, the Tunnel-lining Crack Index (TCI) was proposed to quantitatively evaluate the severity of tunnel lining cracks [12]. It has been widely applied for the inspecting of surface defects of tunnels in Japan. The stability assessment based on TCI is reasonable to some extent because the mechanical stability of a tunnel is greatly influenced by the severity of cracks in the lining [13]. However, the intersection and distribution of cracks, which could greatly influence the stability of tunnel lining, was not considered in TCI. The uncertainty relationship between TCI and the instability of tunnel lining called for more alternative assessment methods and health indexes.
As the distribution of cracks in tunnel lining is quite complex, it is difficult to make a precise description through conventional mathematical methods. Fortunately, fractal theory is used to analyze the distribution of complex graphics. It has been widely used in art, astronomy, geography, biology, fluid dynamics, probability theory, chaos theory, and pure mathematics in the past few decades [14,15,16,17,18,19]. In recent years, the fractal theory was used to describe the propagation of cracks in rock or concrete specimens in laboratory [20,21,22,23,24,25]. These studies confirmed that the cracks in concrete have fractal properties [21]. Therefore, it is possible to describe the distribution of cracks and evaluate the states of tunnel lining by fractal theory. Moreover, the development of machine vision-based method makes it possible to collect the images of tunnel lining and to calculate the dimensions of the cracks efficiently [26,27].
In this study, the fractal dimension of cracks in tunnel lining was taken as a new health assessment index. A series of comparative tests and field tests were conducted to evaluate the validity of this new method. In addition, the quantitative correlation between fractal dimension and TCI of cracks in tunnel lining was studied.

2. Theoretical Background

2.1. Concept of Tunnel-lining Crack Index

The conceptual diagram of TCI [12] was shown in Figure 1. One span of the tunnel shown in the left side of the figure was spread out to a flat surface as shown in the right side. The basic formula of TCI is shown in Equation (1):
F i j = 1 A k = 1 n ( t ( k ) ) α ( l ( k ) ) β cos θ i ( k ) cos θ j ( k )
where A is the total area of the lining; n is the number of cracks; t is the width of crack, k; l is the length of crack, k; θi and θj donate the angles formed by the normal vector of the crack with the xi axis and xj axis; α and β donate the weighting coefficients of crack width and length.
F11 and F22 obtained by the Equation (1) indicated the longitudinal component and the transverse components of the TCI, respectively. The crack index F0 was expressed as the sum of longitudinal and transverse components as shown in Equation (2). Associating Equation (1) with Equation (2), the crack index F0 can be derived as Equation (3).
F0 = F11 + F22
F 0 = 1 A k = 1 n ( t ( k ) ) α ( l ( k ) ) β
It is an objective evaluation method without depending on the technical force of the inspection engineer. The width, length, and direction of cracks were considered. This method has been widely used in the soundness evaluation of tunnel lining in Japan.
However, the relevance of tunnel lining stability and the cracks density in the lining was questionable. On the one hand, the intersection and distribution of cracks were not considered in TCI. On the other hand, some approximations have to be used in the calculation of crack index. For example, the creaks were always not straight lines, but they were divided into small segments and considered as straight lines to simplify the calculation. In addition, the calculation of TCI based on the statistical methods is extremely time consuming.

2.2. Concept of Fractal Dimension

The essential idea of fractional has a long history in mathematics that can be traced back to the 1600s. It was originally used to describe objects that have self-similarity features. The terms fractal and fractal dimension were coined by the mathematician Benoit Mandelbrot in 1975 [28,29]. It was used to extend the concept of theoretical fractional dimensions to geometric patterns in nature. For example, the fractal dimension of a coastline quantifies how the number of scaled measuring sticks required to measure the coastline changes with the scale applied to the stick.
In fractal geometry, the fractal dimension is a ratio providing a statistical index of complexity comparing how detail in a fractal pattern changes with the scale at which it is measured. Moreover, it has been characterized as a measure of the space-filling capacity of a pattern that tells how a fractal scales differently from the space it is embedded in.
According to the definition, the fractal dimension could describe the density and complexity of the cracks in tunnel lining. In this case, it is a promising method to estimate the stability of tunnel lining according to the fractal dimension of cracks. The fractal dimension of cracks in a plane could be explained intuitively thinking of them as an object too detailed to be one-dimensional, but too simple to be two-dimensional. Therefore its dimension might best be described not by its usual topological dimension but by its fractal dimension, which in this case is a number between one and two.

2.3. Calculation Method of Fractal Dimension

There are several formal mathematical definitions of fractal dimension that build on the basic concept of change in detail with change in scale [30]. The box-counting dimension is the most widely used one [31]. In fractal geometry, the box-counting dimension, also known as Minkowski dimension, is a way of determining the fractal dimension of a set S in a Euclidean space Rn, or more generally in a metric space (X, d).
To calculate the dimension for a fractal S, imagine this fractal lying on an evenly spaced grid, and count how many boxes are required to cover the set. The box-counting dimension is calculated by seeing how this number changes as we make the grid finer by applying a box-counting algorithm. Suppose that N(ε) is the number of boxes of side length ε required to cover the set. Then the box-counting dimension is defined as:
D = lim ε 0 log N ( ε ) log ( 1 / ε )
Roughly speaking, the fractal dimension is the slope of the fitting line obtained by fitting a set of points (log N(ε), log ε) [32]. In practical, the differential equation is used to estimate fractal dimension as shown in Equation (5). This calculation is easy to achieve through a MATLAB program.
D d log N ( ε ) d log ε
If the above limit does not exist, one may still take the limit superior and limit inferior, which respectively define the upper box dimension and lower box dimension.

3. Feasibility Analysis of Fractal Dimension as a New Health Assessment Index

To confirm the feasibility of fractal dimension as a new health assessment index, the influence factors, such as the density, the width, and the intersection of cracks, on the fractal dimension of tunnel lining cracks was studied in this part.

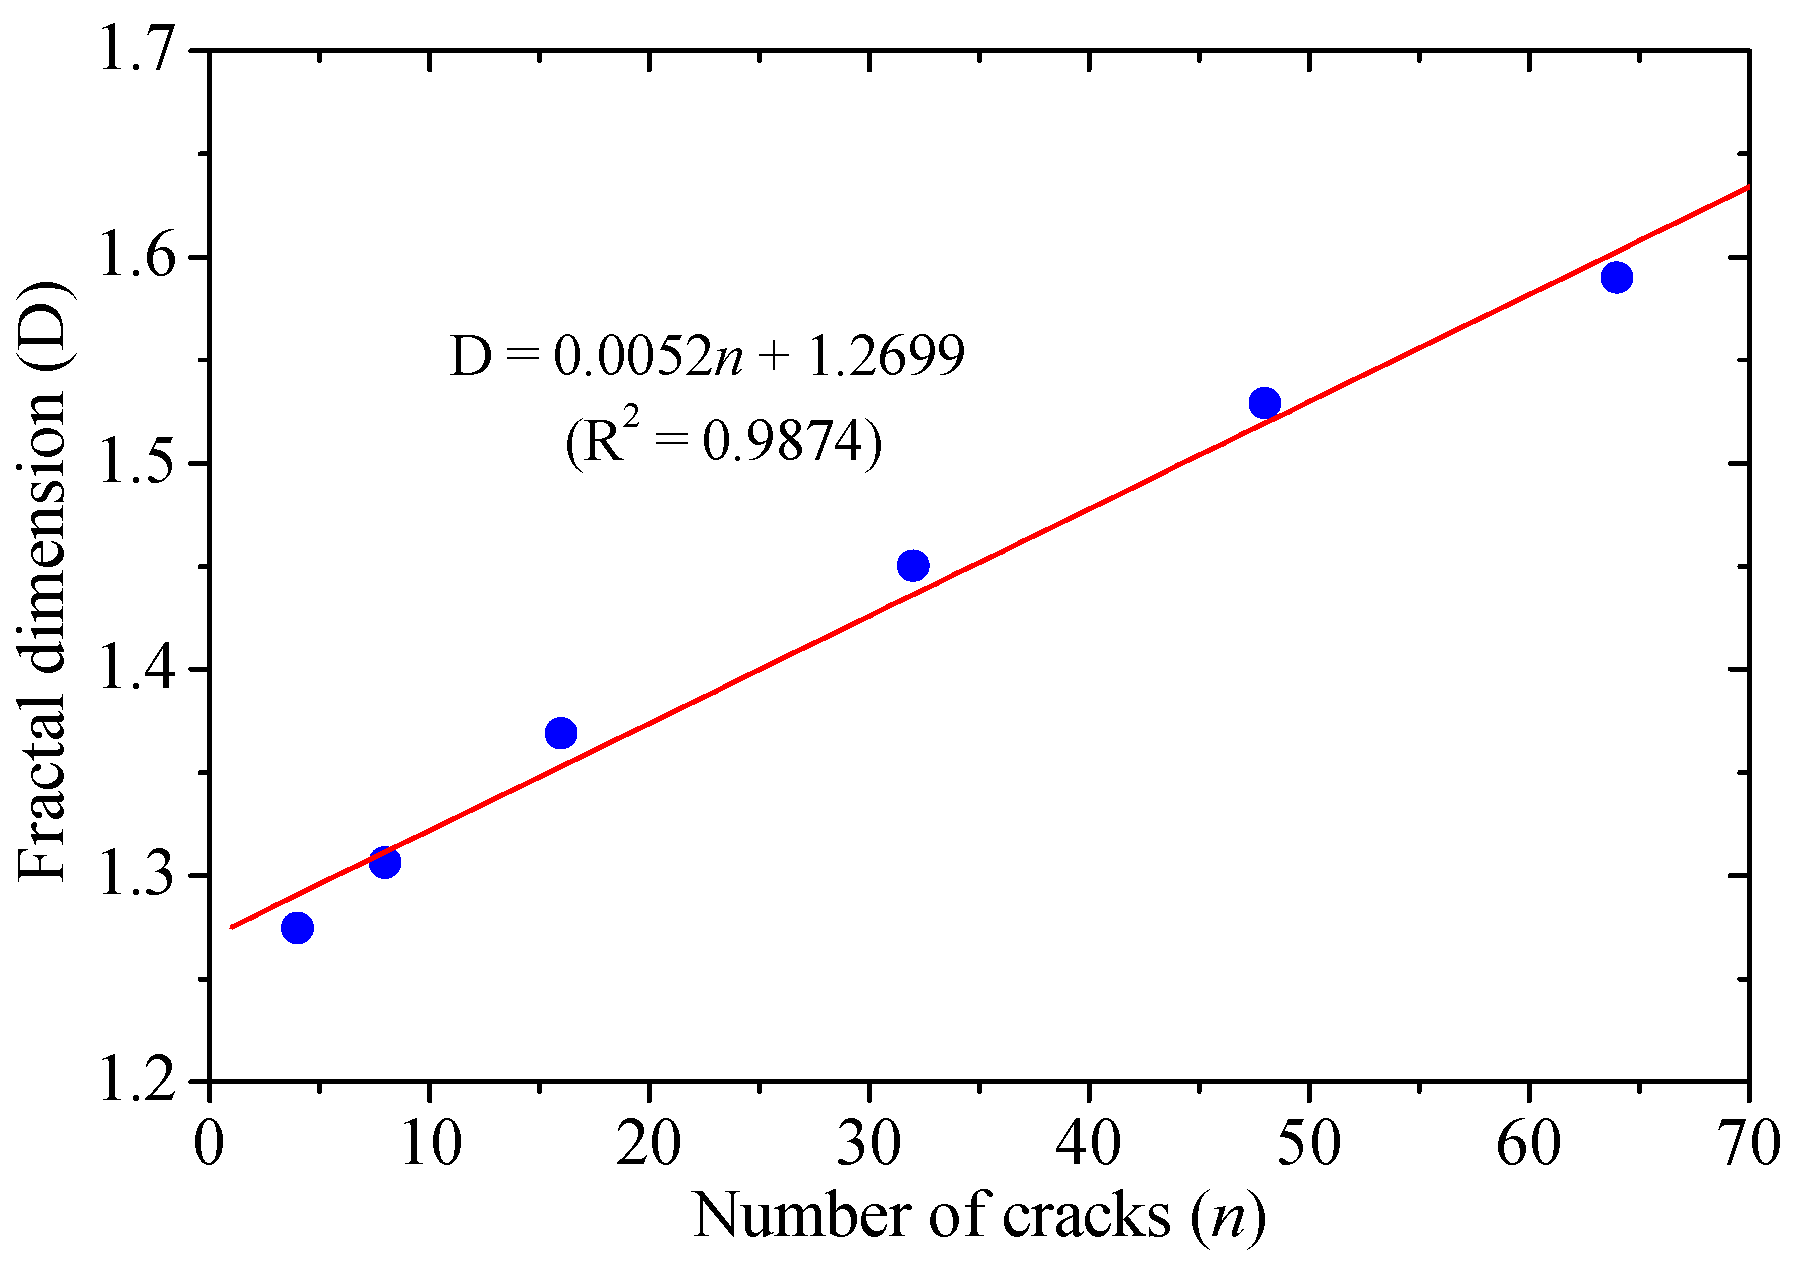
3.1. Influence of Crack Density on the Fractal Dimension

The fractal dimension of cracks shown in Figure 2 was calculated according to the method described above. In Figure 2, two cracks were extracted from a tunnel lining in the field, and the number of cracks increased by copying these two cracks. As there are usually several to dozens of cracks in one span of tunnel lining, the crack number was set to be 4, 8, 16, 32, 48, and 64 in the six figures, and their fractal dimensions were determined to be 1.2745, 1.3062, 1.3690, 1.4504, 1.5291, and 1.5899, respectively. The relationship of fractal dimension and the number of cracks was shown in Figure 3. According to the results, a linear relationship was found between fractal dimension and number of cracks. The results illustrated that the fractal dimension could characterize the density of the cracks in case of regular distributed cracks.

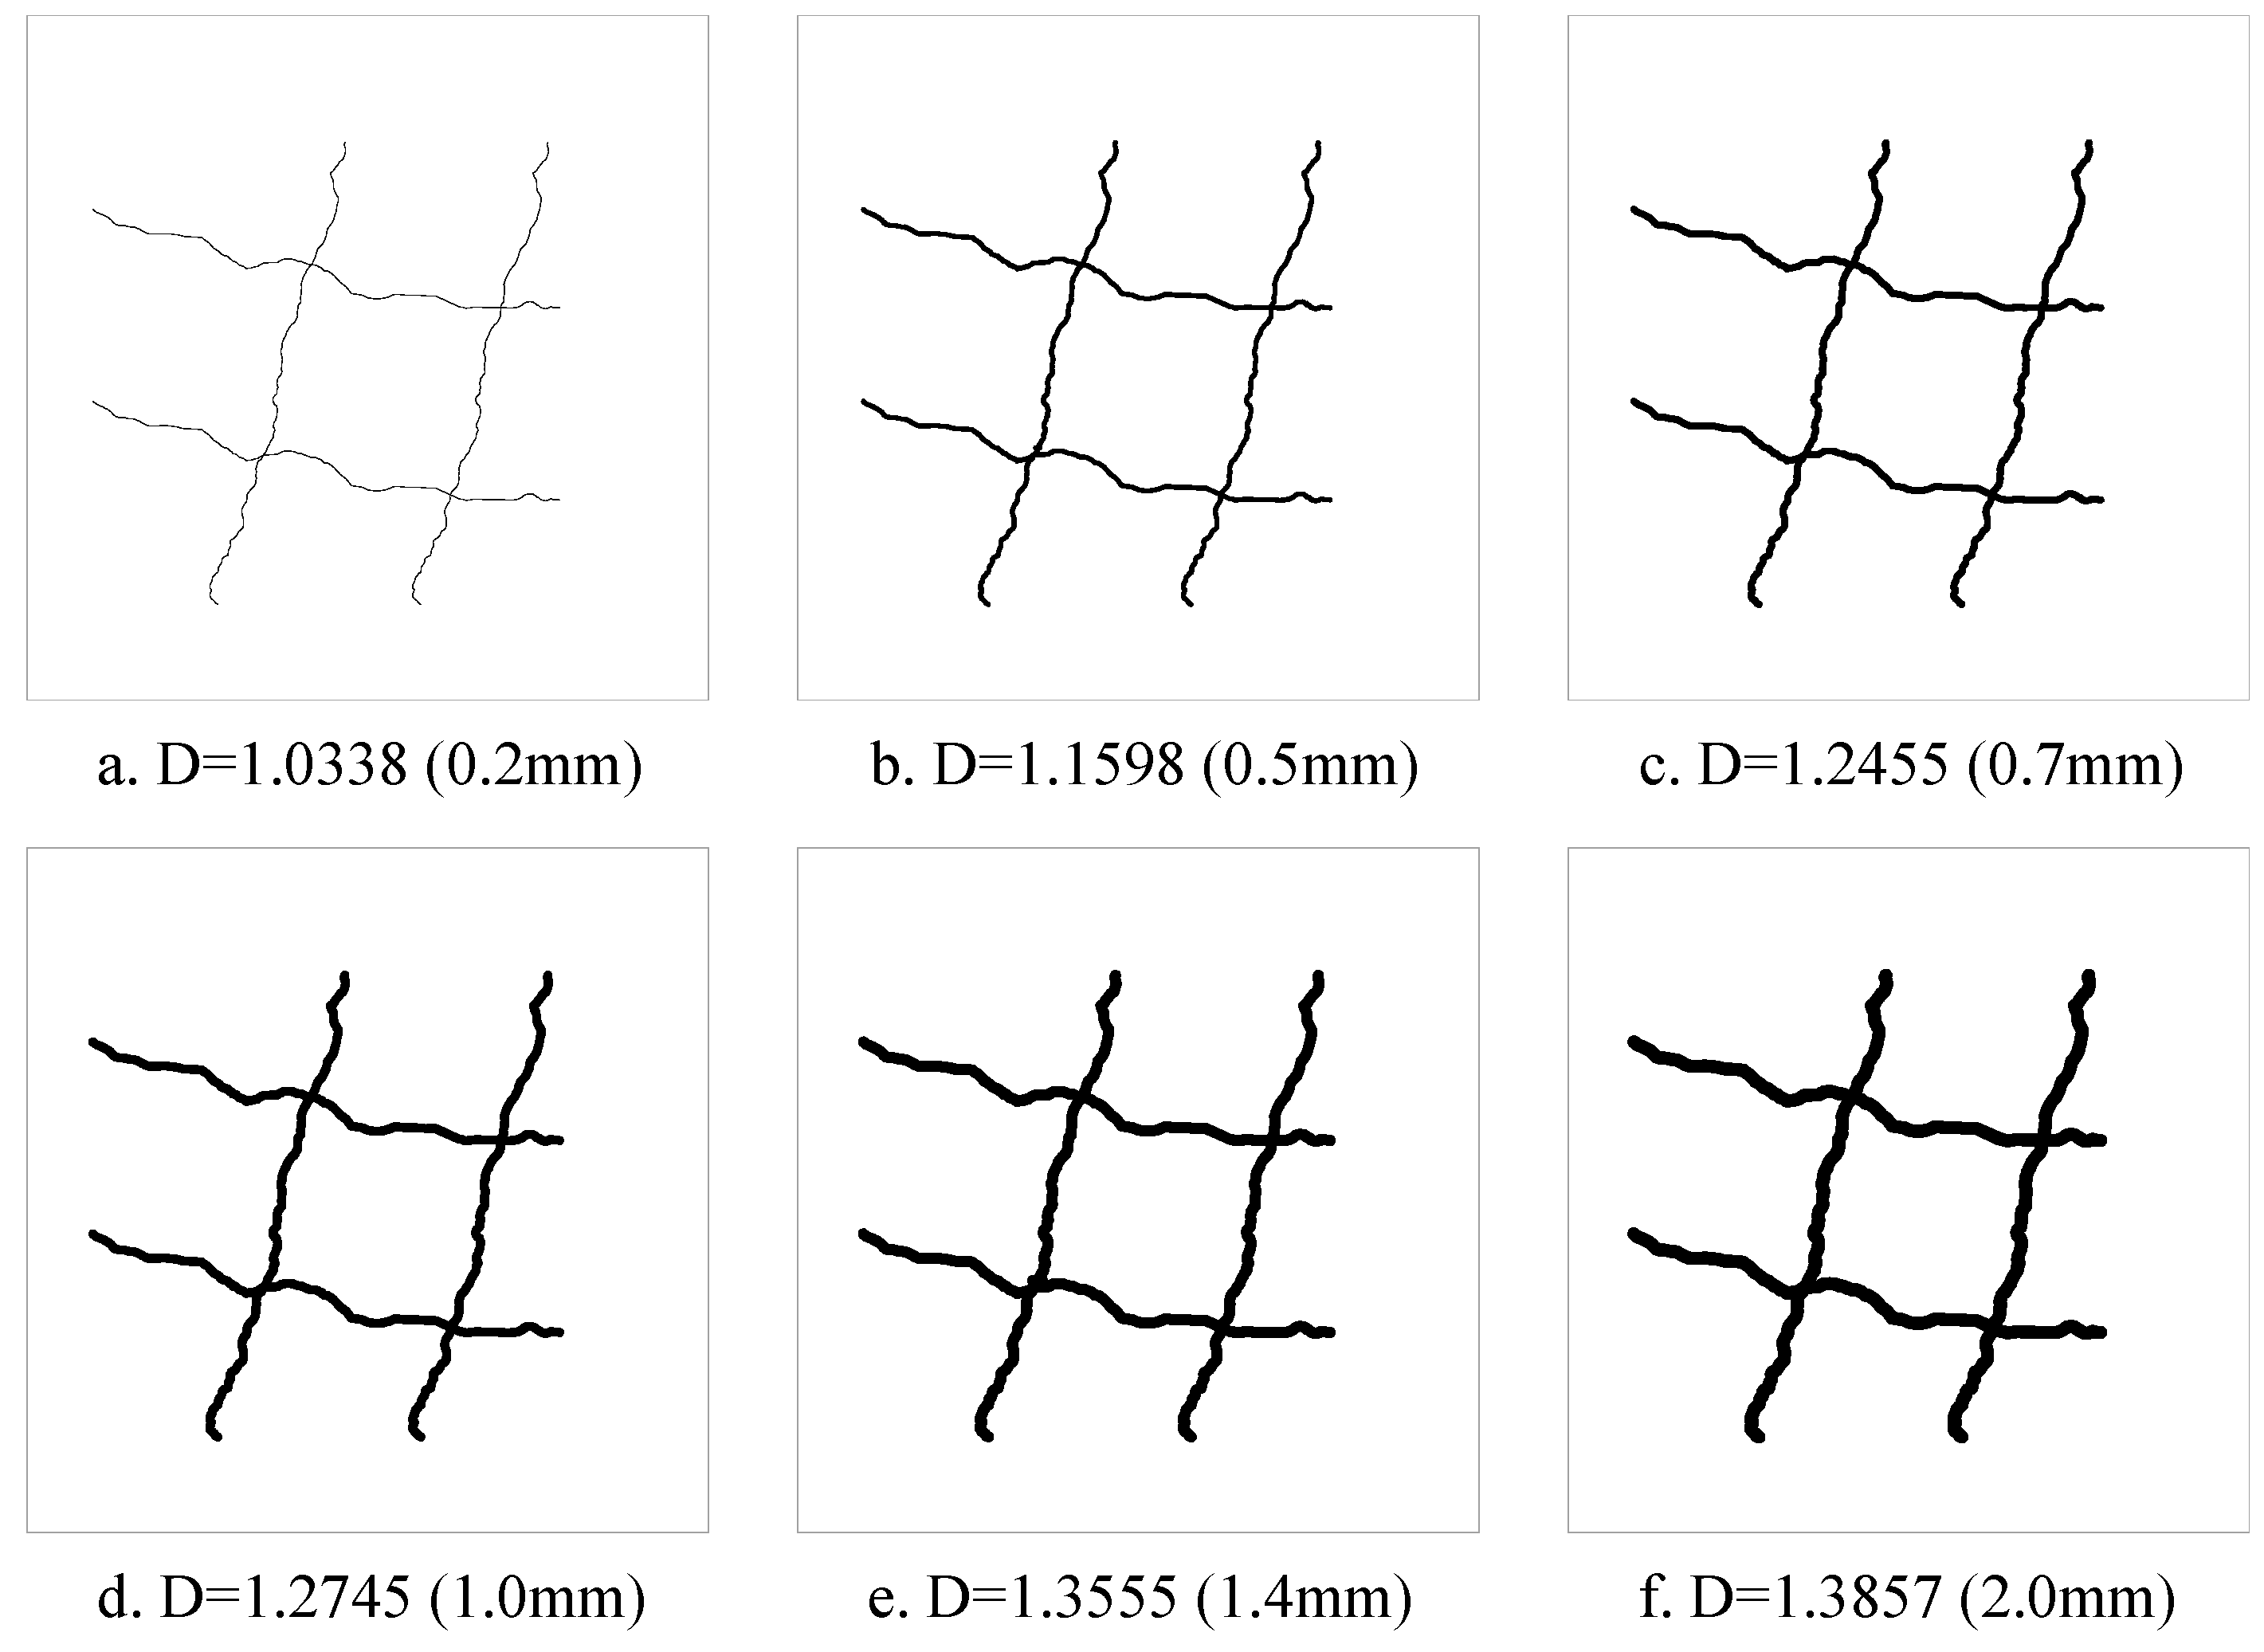
3.2. Influence of Crack Width on the Fractal Dimension

The fractal dimension of different width cracks was calculated and shown in Figure 4. As the width of most cracks in tunnel lining distributed between 0.2 mm and 2 mm, the crack width is set to be 0.2 mm, 0.5 mm, 0.7 mm, 1 mm, 1.4 mm and 2 mm, respectively. The fractal dimensions were determined to be 1.0338, 1.1598, 1.2455, 1.2745, 1.3555, and 1.3857, respectively. The relationship of fractal dimension and the width of cracks is shown in Figure 5. There was a roughly linear relationship in fractal dimension and width of cracks. The results illustrated that the fractal dimension can also characterize the width of the cracks. Moreover, it was found that the slope of the fitting curve in Figure 5 was much larger than the one in Figure 3. The results certificated that the influence of crack width is larger than the crack density.

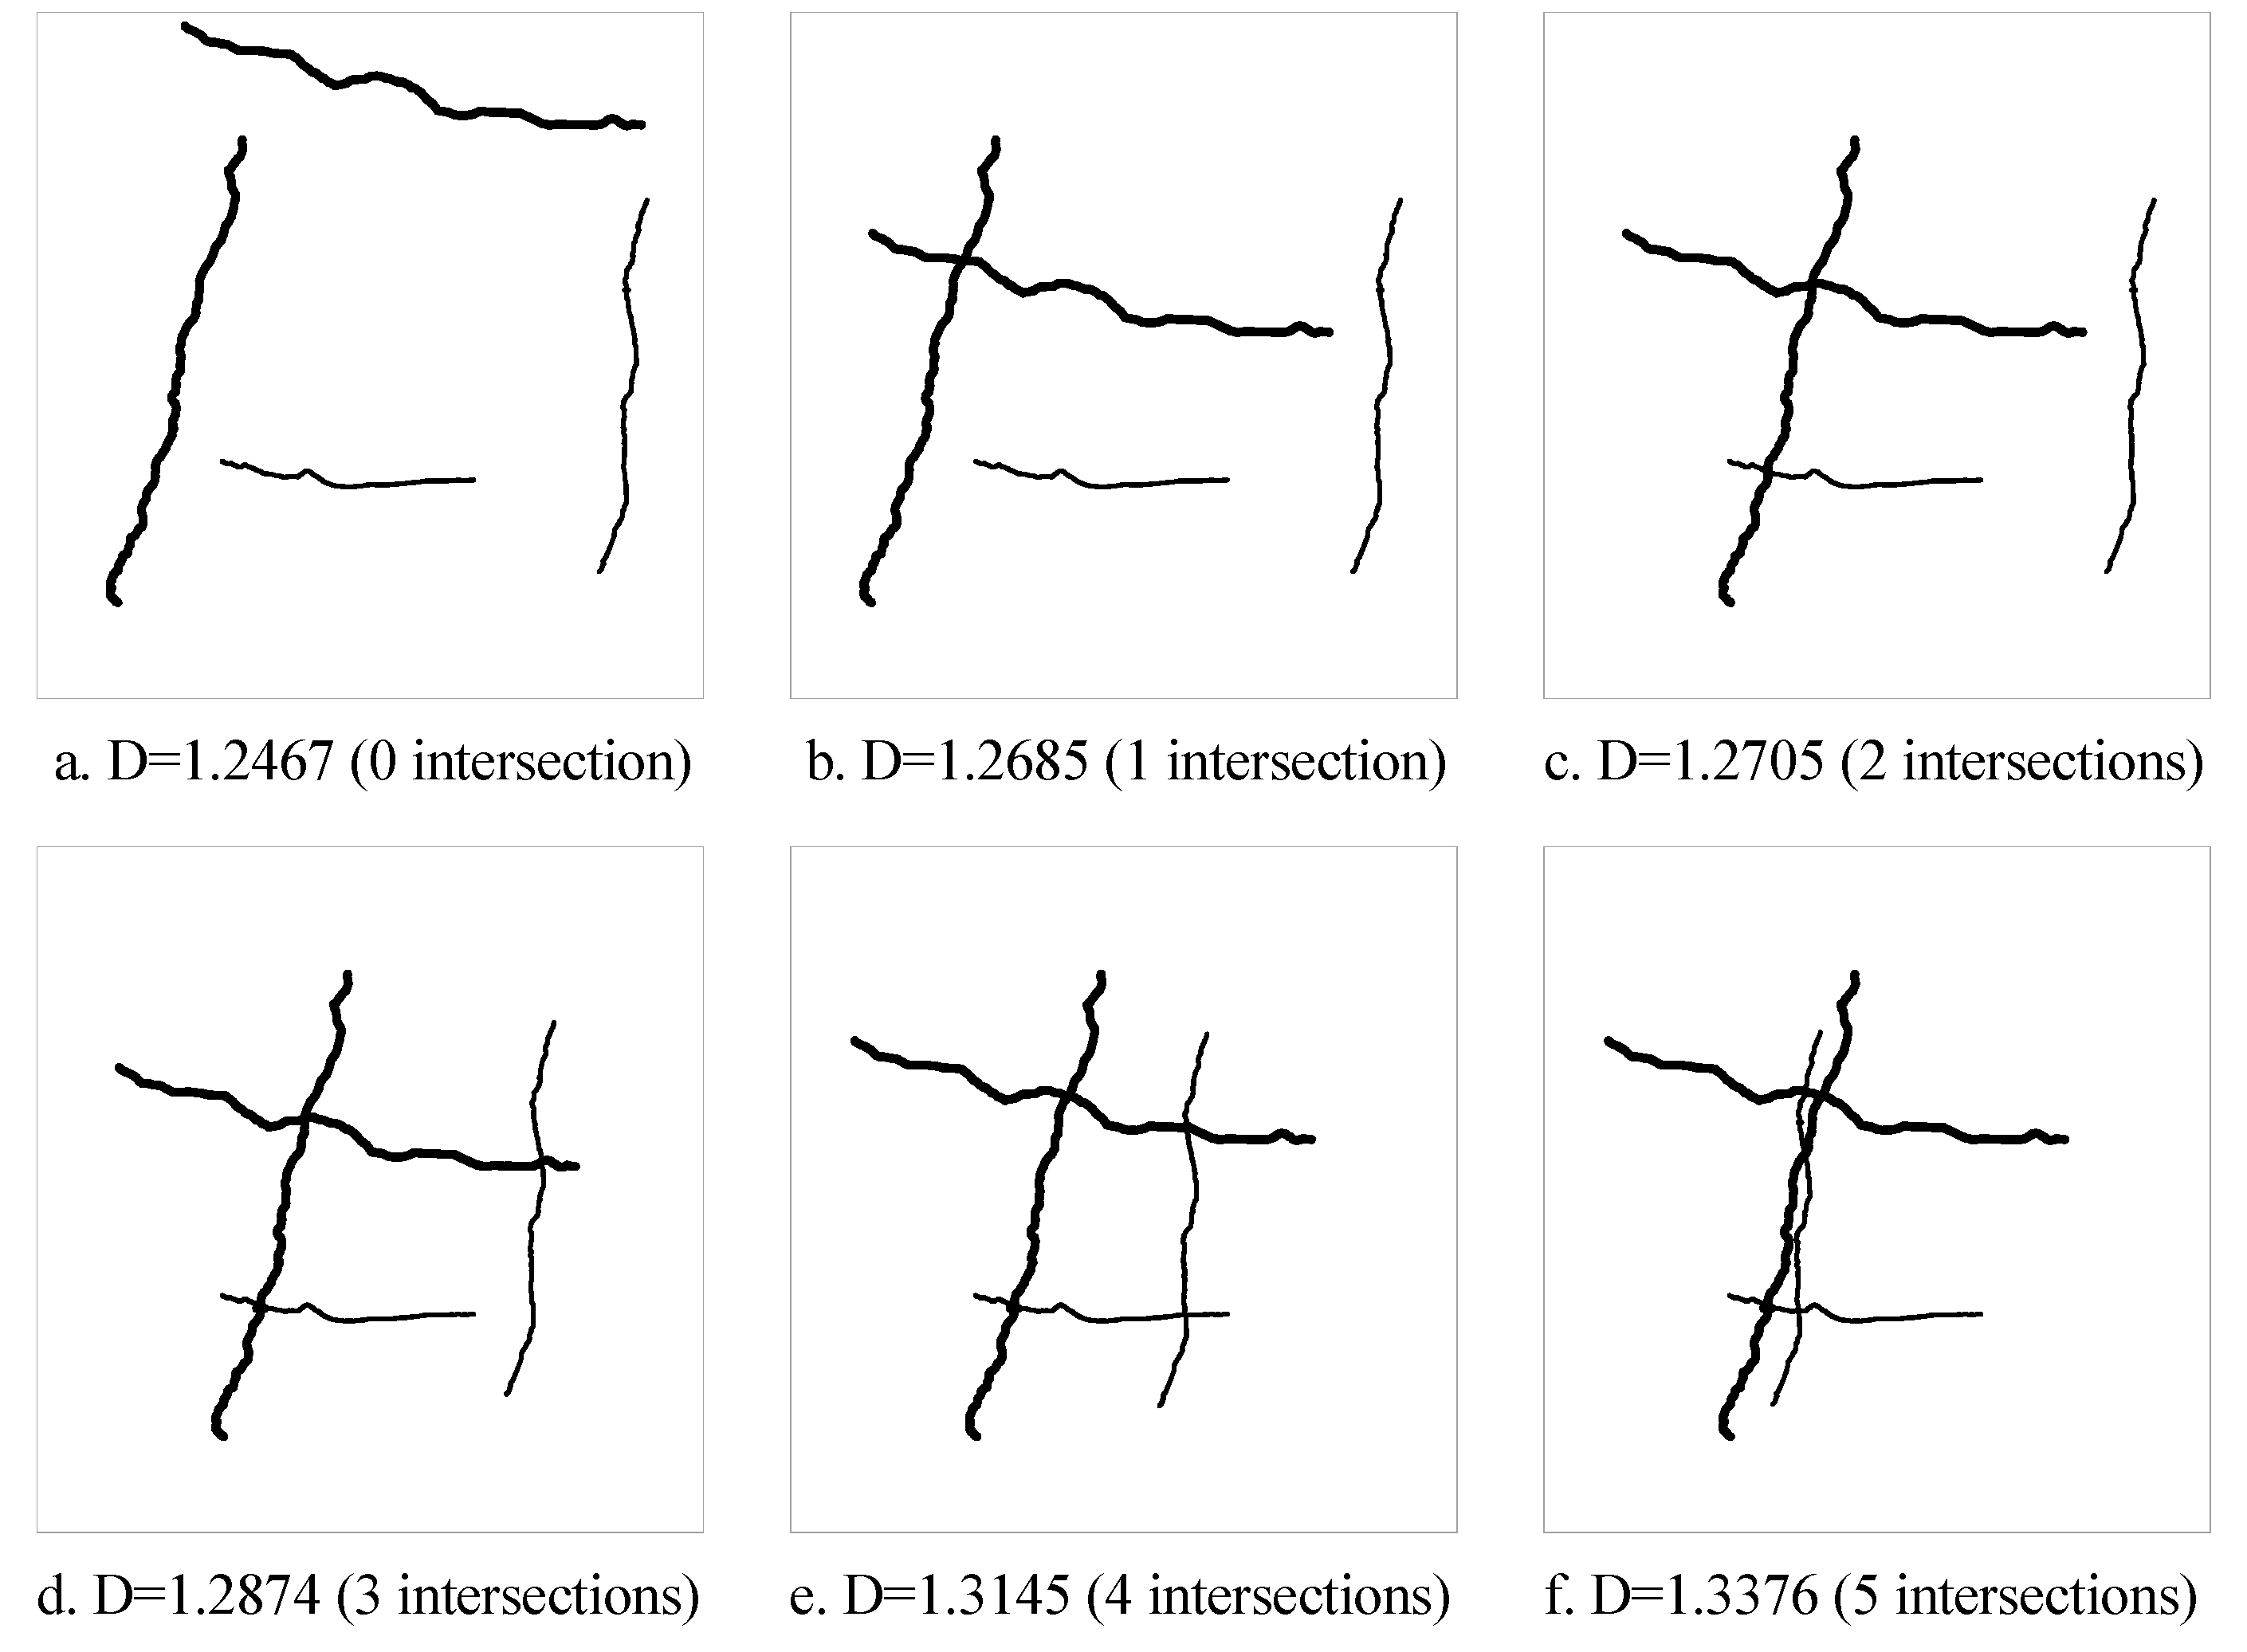
3.3. Influence of Crack Distribution on the Fractal Dimension

In this part, a comparative study was conducted to compare the advantages and disadvantages of TCI and fractal dimension. As shown in Figure 6, four cracks were extracted from the tunnel lining in the field, and their locations were redistributed. In these six figures, the number of intersection points increased gradually.
Since the area of the cracks is the same, the TCI is a constant value for all these figures. However, the risk of cracks for different distribution is completely different. Generally, the risk of independent cracks is relatively small. However, the risk of tunnel lining collapse would be increased greatly when these cracks interconnect with each other. This is obviously a severe shortcoming of TCI, as the cracks distribution cannot be taken into account.
The fractal dimensions of these six figures were determined to be 1.2467, 1.2685, 1.2705, 1.2874, 1.3145, and 1.3376, respectively. The relationship of fractal dimension and the number of intersection points was shown in Figure 7. The results illustrated that the fractal dimension increased with the number of intersection points in case of the same cracks. It is reasonable as the intersecting of different cracks makes the crack graphic more complex. The results showed that the fractal dimension can characterize the distribution of cracks, and especially identify the intersection of different cracks, which is closely related with the health condition of tunnel lining.

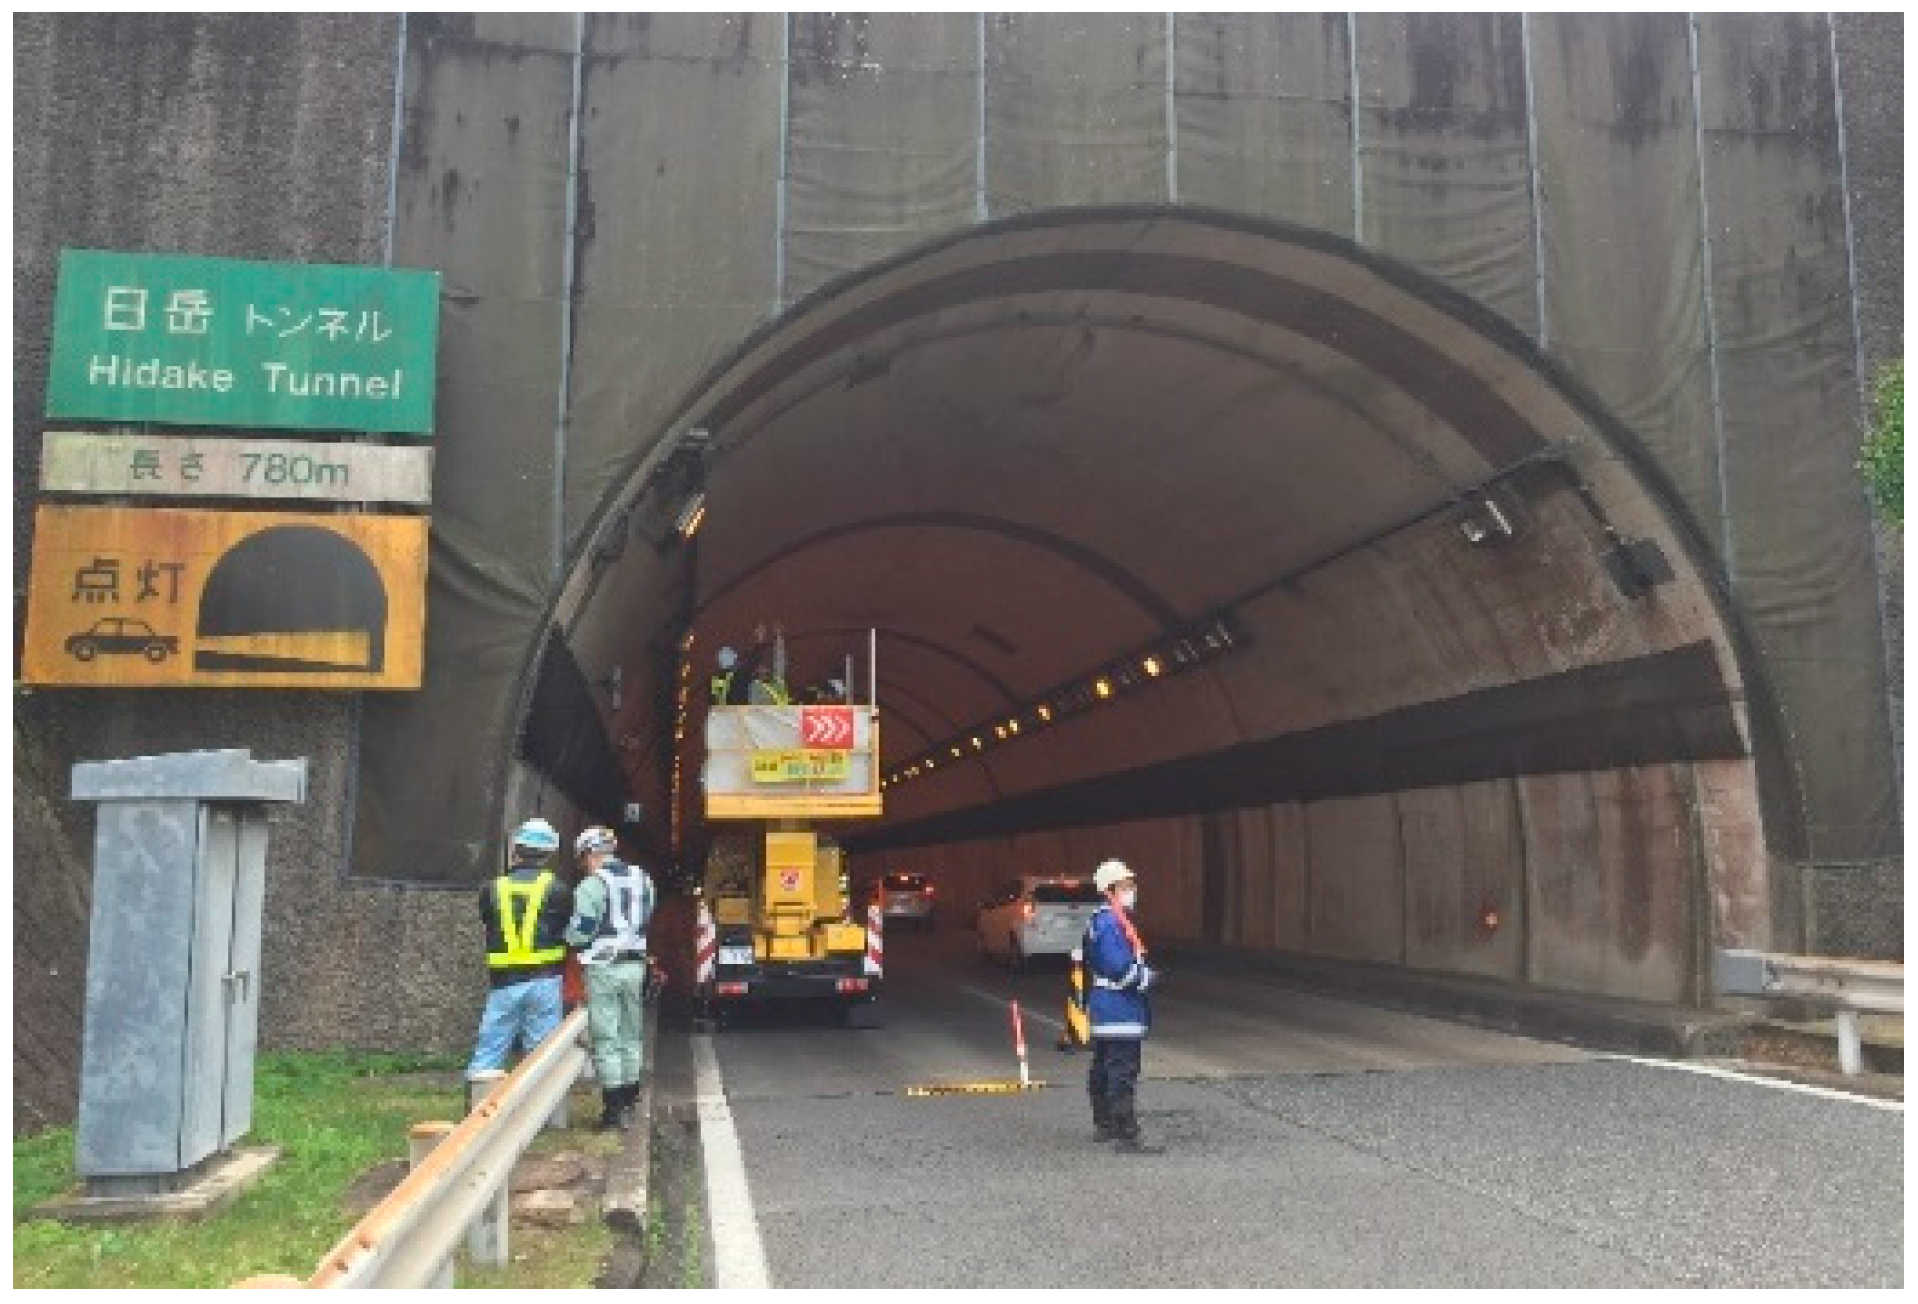
4. A Case Study of Hidake Tunnel in Japan

To evaluate the validity of this new health assessment index and to study the quantitative correlation between the fractal dimension and the TCI of lining cracks, a field test was conducted at Hidake Tunnel located in Nagasaki Prefecture, Japan.

4.1. Basic Condition of Hidake Tunnel

The Hidake tunnel (as shown in Figure 8) was constructed in 1982 with the poling-board method. The tunnel length is 780 m, with a total of 65 spans. The maximum depth is 25 m. The thickness of the concrete lining is 0.7 m at a part of the tunnel, and 0.55 m at the other part. The material of the concrete lining is C20 concrete. No surface prep was conducted on the concrete lining. No special anchorage between the tunnel and its lining was used. The surrounding rocks are sandstone, sand tuff, lapilli tuff, basalt, tuff breccia and lapilli tuff in different segments.
Due to the alteration of geological conditions and the deterioration of lining concrete, some defects such as cracks and seepages began appearing in the concrete lining after twenty years of service. The tunnel was also affected by the Kumamoto earthquakes, including a magnitude 7.0 main shock, on 16 April 2016.

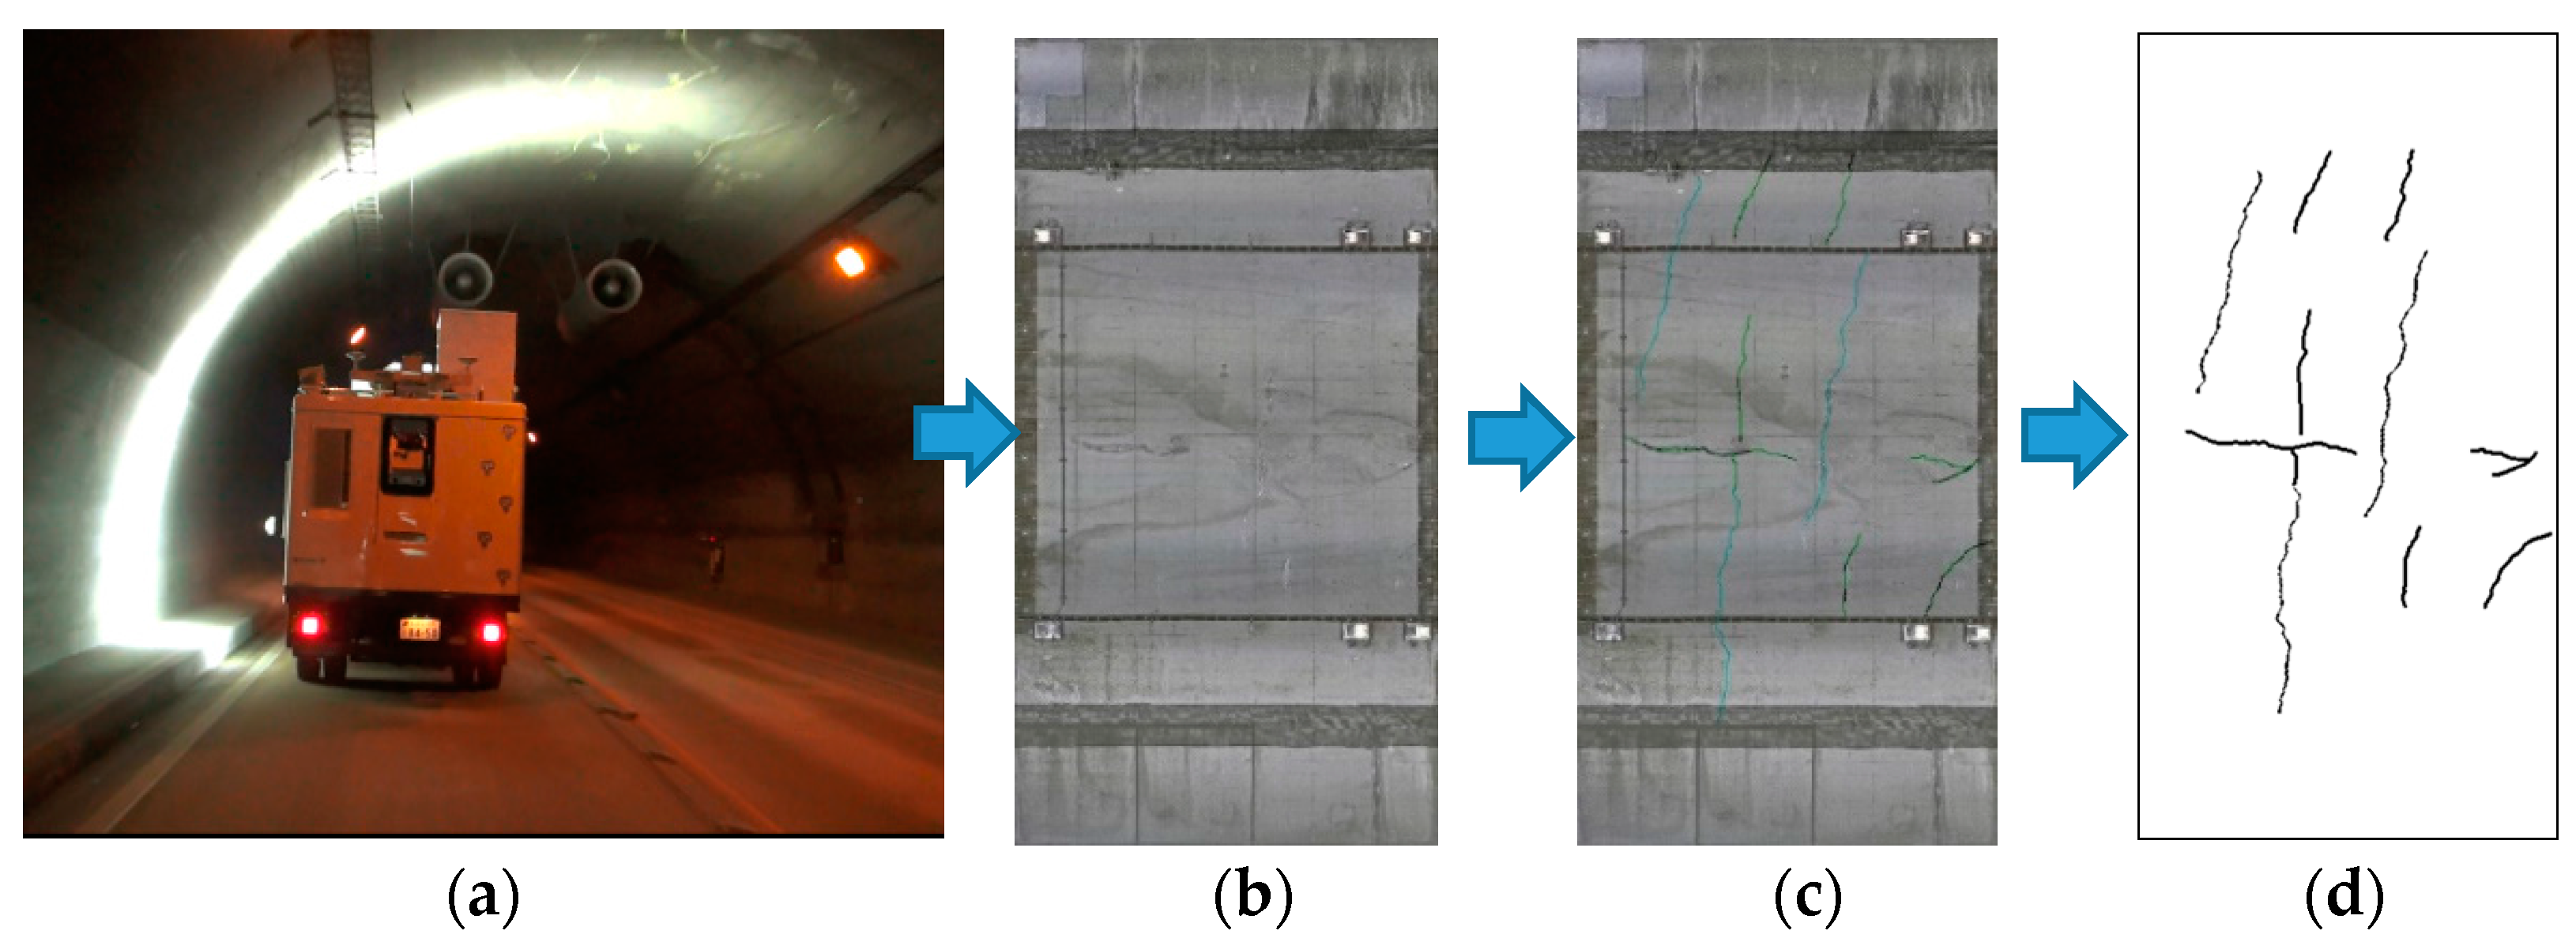
4.2. Digital Inspection Test

To prevent the possible collapse of tunnel lining, digital inspection test was conducted to assess the extent of damage in different segments of the tunnel. The tunnel lining images were obtained by a photographing vehicle equipped with line sensor cameras. It is a non-contact detection technology that can track the information of the tunnel surface in a very short time [26,27]. The process of extracting cracks was shown in Figure 9. The round surface was automatically spread out to a flat surface as shown in Figure 9a,b. The cracks were extracted from the image as shown in Figure 9c,d by a crack identification program. The cameras were fixed on a car, and it can detect cracks with 0.2-mm resolution at a speed of 70 km/h. The cracks were extracted for all the 65 spans in Hidake Tunnel, and the results of 12 typical spans were shown in Figure 10. The basic condition of the 12 typical spans is shown in Table 1.
A large number of cracks were found in spans 46, 47, 50, 53, and 57, including some wide cracks, which would increase the risk of tunnel lining collapse greatly. There were a large number of small cracks in span 65, but no wide cracks were found. Few cracks were found in spans 16 and 18, which may mean a smaller risk of lining collapse. Moderate degree of cracks were found in spans 34, 36, 42, and 63.
The causes of cracking in Hidake Tunnel include: tectonic stress, earthquakes and concrete deterioration. The tectonic stress could result in a large number of axial cracks as shown in spans 47, 50, 53, 57, and 63. The earthquake, namely the Kumamoto earthquakes in 2016, could result in ring cracks as shown in spans 46, 47, 50, 53, and 57. The small cracks in spans 18, 34, 42, and 65 were mainly caused by the deterioration of concrete. Moreover, the cracking was influenced by the surrounding rock types. All the heavily cracked spans, including spans 46, 47, 50, 53, and 57, were located in tuff breccia or lapilli tuff, which belong to soft rock. In general, the actual cracking was affected by multiple factors.

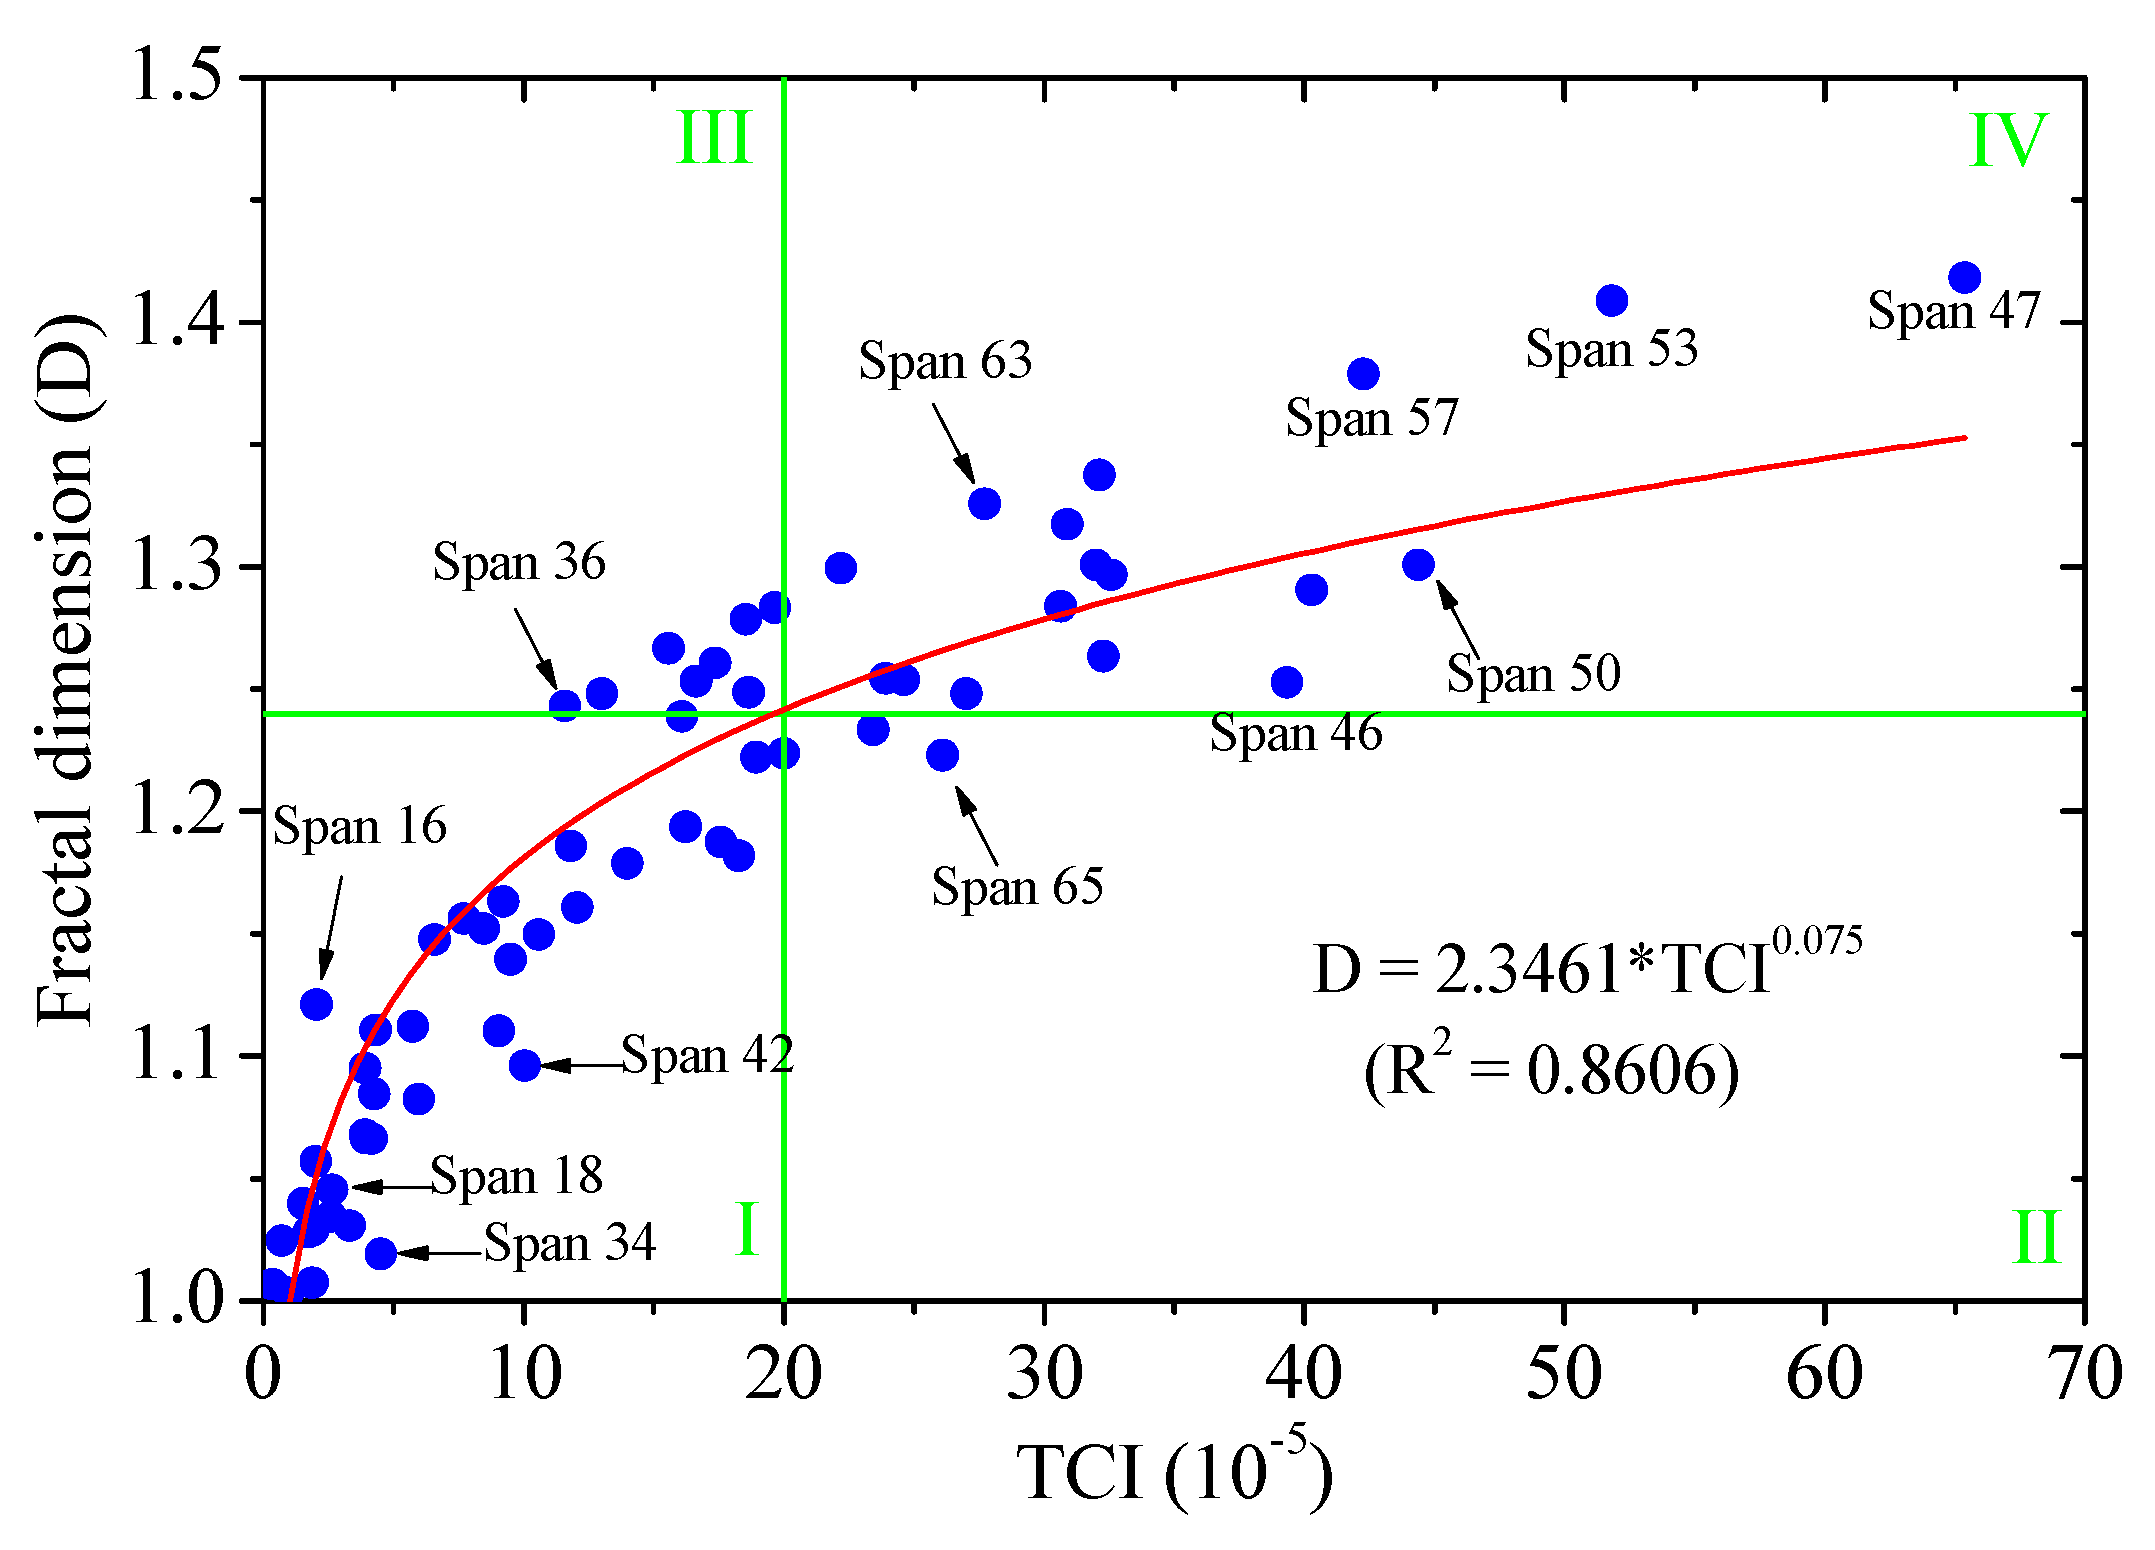
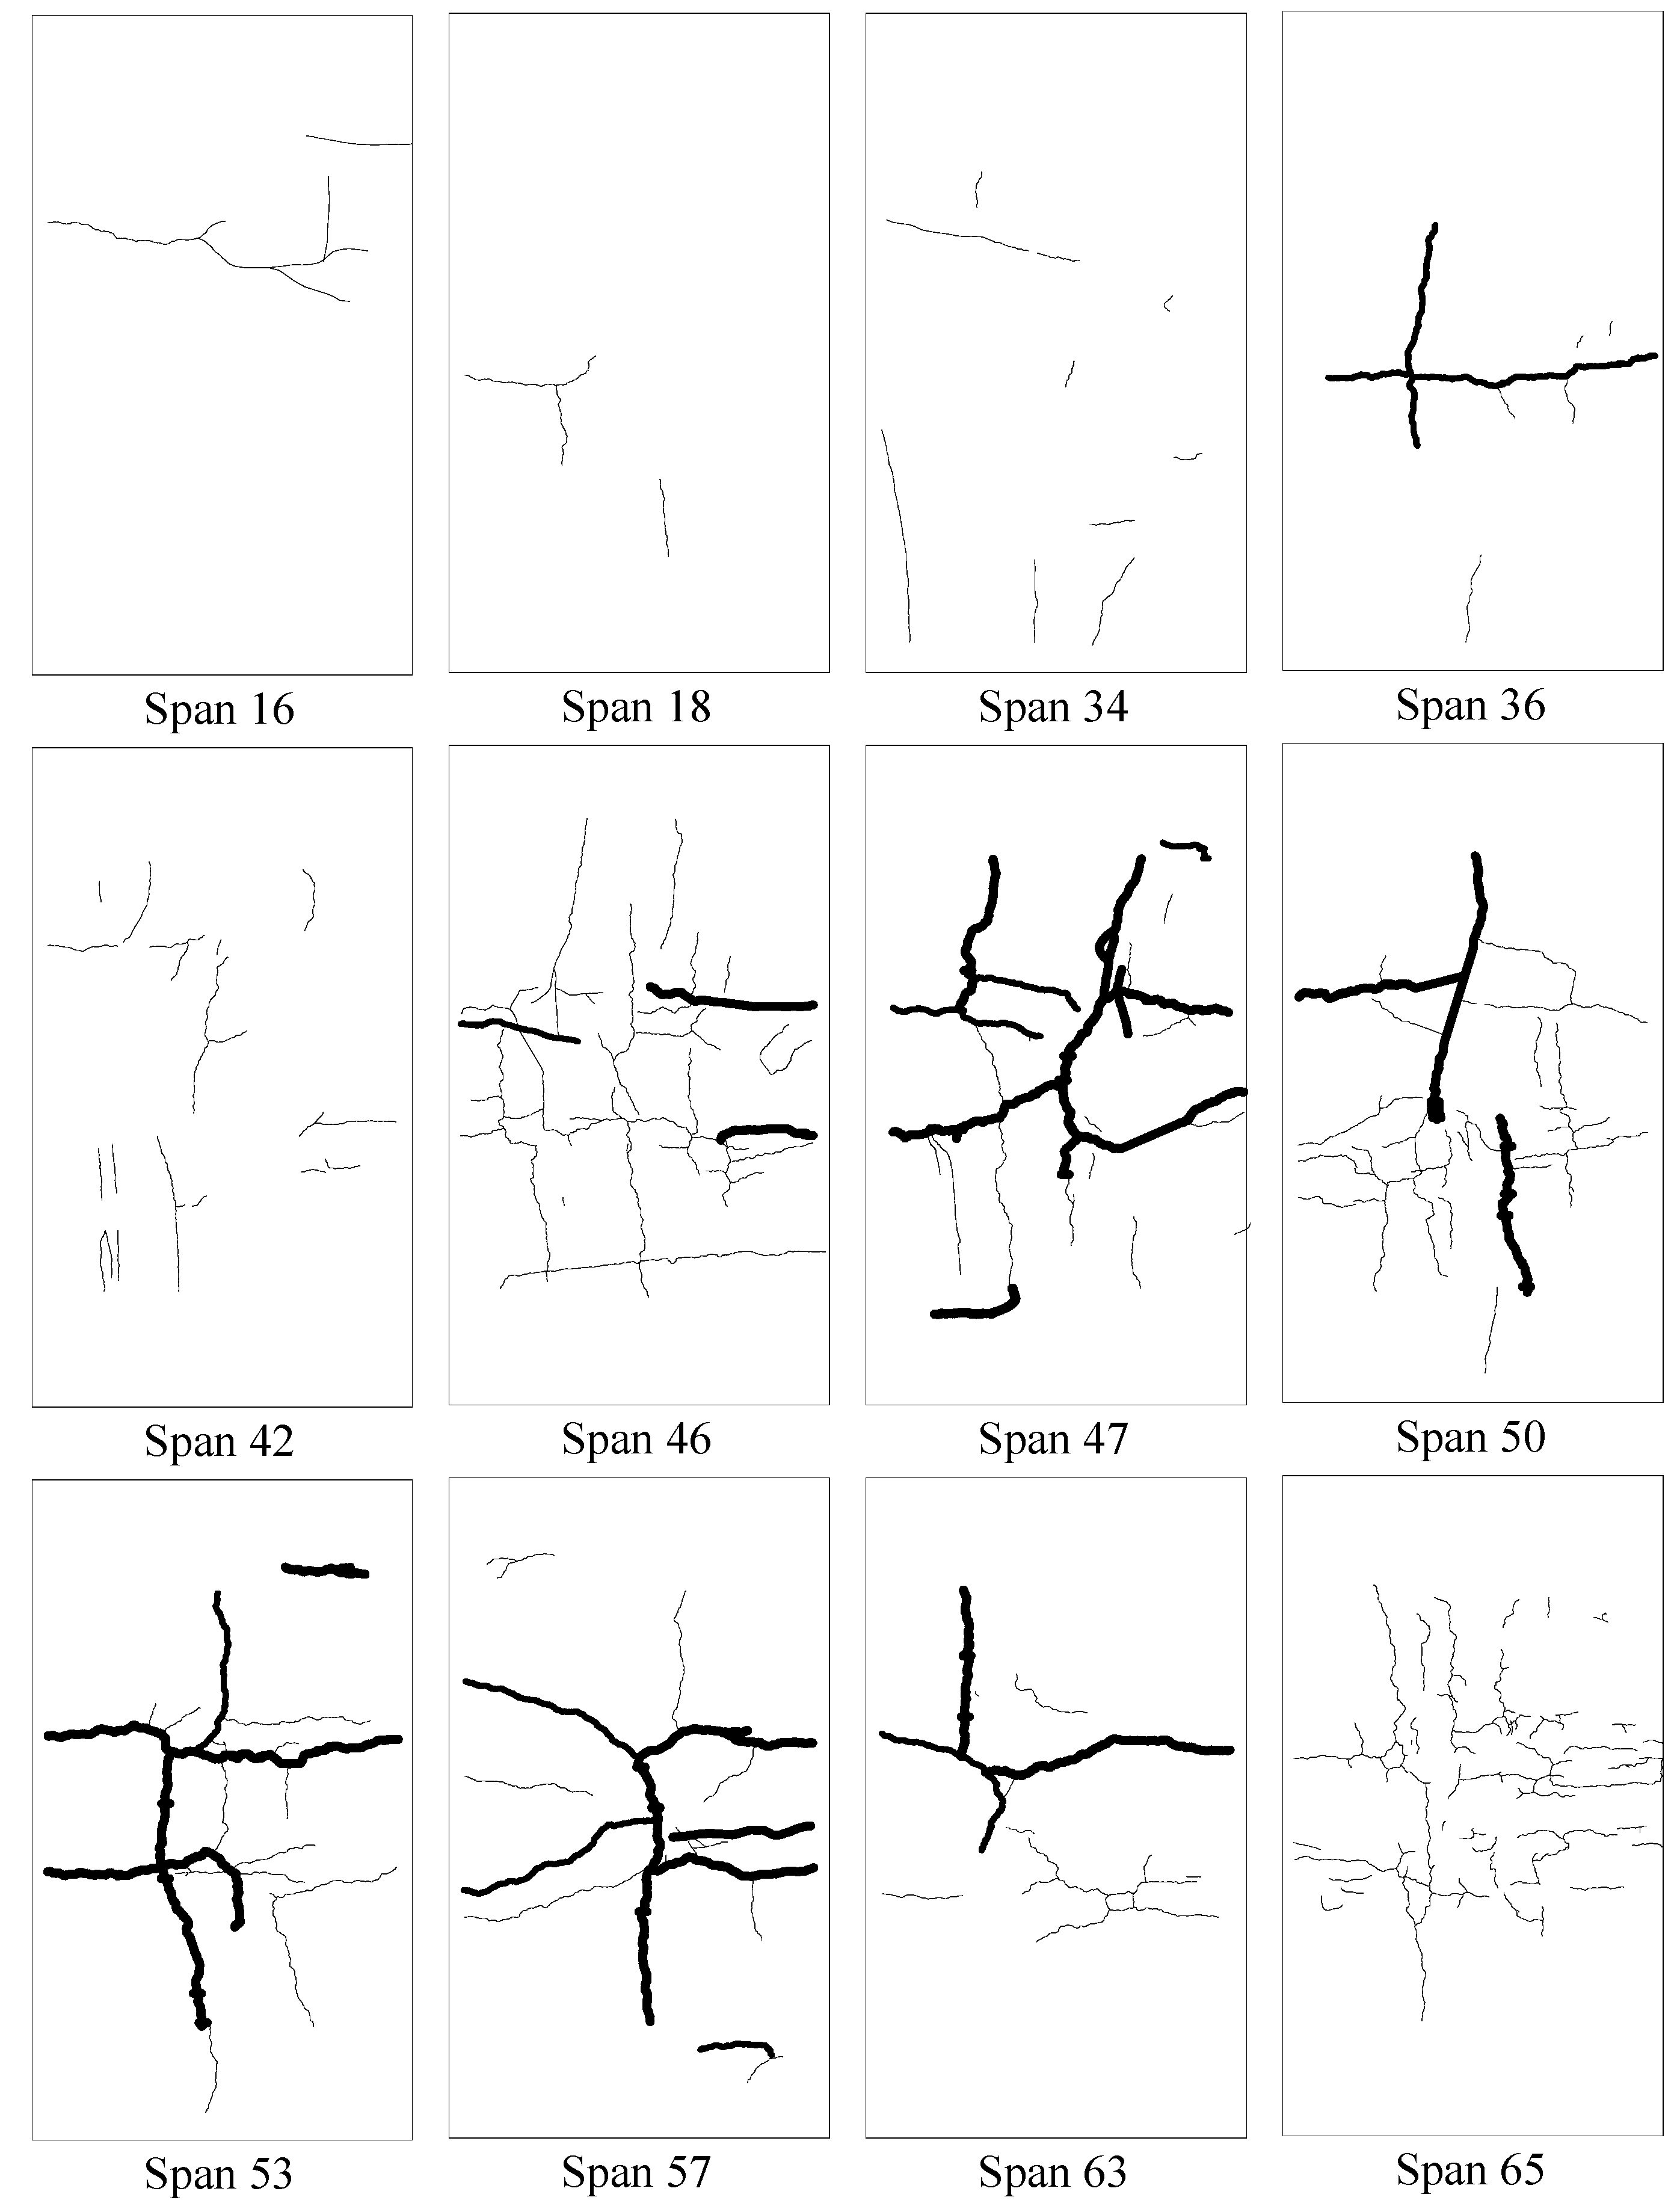
4.3. Results and Discussions

According to the methods described above, the fractal dimensions for all the 65 spans of Hidake Tunnel were calculated and shown in Table 2. The TCIs of all the 65 spans were also calculated through the statistical method. According to the fractal dimension and TCI shown in Table 2, their correlation was presented in Figure 11. In addition, the results of 12 typical spans were marked in this figure.
The results by two different methods can be fitted as a power function with a correlation coefficient of 0.8606. For most of the test spans, the results by the two different methods were consistent with each other. Obviously, there is a certain correlation between TCI and the new proposed index. However, for some points, the degree of risk is significantly different according to the two evaluation indices.
For span 18, there are only three small cracks, and both the TCI and the fractal dimension are in quite small states. Obviously, it is in a safe state. For span 16, there are several cracks and no wide crack is found. Therefore, the calculated TCI is quite small. Since these cracks have almost penetrate the entire lining, it is clear that the risk is underestimated. As the cracks are connected together, the calculated fractal dimension is significantly larger. This behavior indicated that the result by the new index is more consistent with the actual risk of the tunnel lining. Similar phenomenon is found in the results of spans 36 and 63, where the risk is also underestimated by the TCI. While, some wide cracks were found in the two spans, and their risk is relatively large by both methods.
For spans 34 and 42, the results were located below the fitting curve, which suggested that their risk was small according to the new index and large by the index of TCI. Since there are only some small and independent cracks in the two spans, the actual damage in the tunnel lining is not so serious. Therefore, the results by the new health assessment index are closer to the actual risk of the tunnel lining. For spans 46, 47, 50, 53, and 57, the risk of lining collapses is quite large by both health assessment indexes, which suggested that proper maintenance is extremely necessary.
The above results suggested that the current method, which evaluates the health status of tunnel lining only by the index of TCI, is far from perfect. It is necessary to use a different method in which the distribution of cracks can be considered. The significance of the new evaluation index is that it can identify some unusual spans of tunnel lining and provide a basis for further internal testing. In addition, the calculation of fractal dimension is very simple and takes only a few minutes for one span. Meanwhile, a lot of time and work are need to get the TCI.
In engineering practice, the purpose of visual testing is to identify the areas where there is a need for further internal testing and to monitor the development of concrete lining damage. Generally, when TCI is larger than 20 × 10−5, further internal testing is required [33]. According to the fitting formula shown in Figure 11, the corresponding fractal dimension was identified as 1.2386. The two thresholds divided Figure 11 into four parts: I, healthy according to both indexes; II, unhealthy according to TCI but healthy according to D; III, healthy according to TCI but unhealthy according to D; IV, unhealthy according to both indexes. Combining these two indexes, more damaged spans could be determined (part III), and the distribution of cracks could be considered. In particular, it is possible to find the unhealthy spans that the cracks almost penetrate the entire lining or the cracks are connected together. Moreover, if the TCI or D increased rapidly in a short period of time, further internal testing is required for these spans.
The fractal dimension of the cracks is a promising method in the health assessment of tunnel lining as shown in these tests. However, the impact factor of different elements, including the density, width, and distribution of cracks, were not fully determined. More field test data and comparative study were need to interpretation the results of the fractal dimension. Nevertheless, the new health assessment method of tunnel lining is a good complement to the conventional visual inspection method.

5. Conclusions

A new method was proposed for the health assessment of tunnel lining, which evaluates the lining states according to the fractal dimension of cracks. Based on the machine vision-based method, the crack image could be extracted efficiently. The fractal dimension of lining cracks in one span could be obtained in a few minutes, while the calculation of TCI based on the statistical methods was quite time consuming.
A series of comparative tests were conducted to evaluate the validity of this new method. The comparative tests confirmed that fractal dimension can characterize the density, width, and distribution of cracks. The results also certificated that the influence of crack width was larger than the crack density. The intersection of cracks, which will increase the risk of lining collapse, can also increase the fractal dimension, whereas the TCI keep constant.
The fractal dimensions of tunnel lining cracks were obtained according to the digital inspection test of Hidake Tunnel in Japan for all the 65 spans. In addition, the TCI was obtained through statistical methods. The correlation between the fractal dimension and the TCI of tunnel lining was studied. The significance of the new evaluation index is that it can identify some unusual spans of tunnel lining and provide a basis for further internal testing. As a complement to the conventional visual inspection method, the fractal dimension of the cracks is a promising health assessment index.

Acknowledgments

This study is funded by the National Natural Science Foundation of China (No. 51279097, No. 51479108, No. 51379117).

Author Contributions

Xuezhen Wu and Yujing Jiang conceived and designed the experiments; Xuezhen Wu, Tetsuya Taniguchi and Takahide Yamato performed the experiments; Xuezhen Wu, Jianhua Wang and Kusaba Masaya analyzed the data; Jianhua Wang contributed analysis tools; Xuezhen Wu wrote the paper.

Conflicts of Interest

The authors declare no conflict of interest.

References

  1. Yan, Q.; Zhang, C.; Lin, G.; Wang, B. Field monitoring of deformations and internal forces of surrounding rocks and lining structures in the construction of the Gangkou double-arched tunnel—A case study. Appl. Sci. 2017, 7, 169. [Google Scholar] [CrossRef]
  2. Soheyli, M.R.; Akhaveissy, A.H.; Mirhosseini, S.M. Large-Scale Experimental and Numerical Study of Blast Acceleration Created by Close-In Buried Explosion on Underground Tunnel Lining. Shock Vib. 2016, 2016, 8918050. [Google Scholar] [CrossRef]
  3. Li, W.; Xu, C.; Ho, S.C.; Wang, B.; Song, G. Monitoring Concrete Deterioration Due to Reinforcement Corrosion by Integrating Acoustic Emission and FBG Strain Measurements. Sensors 2017, 17, 657. [Google Scholar] [CrossRef] [PubMed]
  4. Malmgren, L.; Nordlund, E.; Rolund, S. Adhesion strength and shrinkage of shotcrete. Tunn. Undergr. Space Technol. 2005, 20, 33–48. [Google Scholar] [CrossRef]
  5. Aktan, A.E.; Catbas, F.N.; Grimmelsman, K.A.; Tsikos, C.J. Issues in infrastructure health monitoring for management. J. Eng. Mech. 2000, 126, 711–724. [Google Scholar] [CrossRef]
  6. Bhalla, B.S.; Yang, Y.W.; Zhao, J.; Soh, C.K. Structural health monitoring of underground facilities—Technological issues and challenges. Tunn. Undergr. Space Technol. 2005, 20, 487–500. [Google Scholar] [CrossRef]
  7. Wang, B.; Mo, C.; He, C.; Yan, Q. Fuzzy Synthetic Evaluation of the Long-Term Health of Tunnel Structures. Appl. Sci. 2017, 7, 203. [Google Scholar] [CrossRef]
  8. Gao, Y.; Jiang, Y.J.; Li, B. Voids delineation behind tunnel lining based on the vibration intensity of microtremors. Tunn. Undergr. Space Technol. 2016, 51, 338–345. [Google Scholar] [CrossRef]
  9. Gao, Y.; Jiang, Y.J.; Li, B. Estimation of effect of voids on frequency response of mountain tunnel lining based on microtremor method. Tunn. Undergr. Space Technol. 2014, 42, 184–194. [Google Scholar] [CrossRef]
  10. Jiang, Y.J.; Gao, Y.; Wu, X.Z. The nature frequency identification of tunnel lining based on the microtremor method. Undergr. Space 2016, 1, 108–113. [Google Scholar] [CrossRef]
  11. Hayashi, Y.; Imai, J.; Yoshiduka, M.; Suzuki, M.; Shigeta, Y.; Nakagawa, K. Restoration measures of tunnel experienced large deformation due to natural disaster. Doboku Gakkai Ronbunshu 2004, 756, 61–74. [Google Scholar] [CrossRef]
  12. Shigeta, Y.; Tobita, T.; Kamemura, K.; Shinji, M.; Yoshitake, I.; Nakagawa, K. Propose of tunnel crack index (TCI) as an evaluation method for lining concrete. Doboku Gakkai Ronbunshuu 2006, 62, 628–632. [Google Scholar] [CrossRef]
  13. Yamada, T.; Sano, N.; Baba, K.; Shigeta, Y.; Yoshitake, I.; Nishimura, K. Evaluation method for soundness of lining concrete by tunnel-lining crack index. Doboku Gakkai Ronbunshuu 2009, 65, 11–16. [Google Scholar] [CrossRef]
  14. Briggs, J. Fractals: The Patterns of Chaos; Thames and Hudson: London, UK, 1992; p. 148. ISBN 0-500-27693-5. [Google Scholar]
  15. Wang, J.; Ogawa, S. Analysis of dynamic changes in land cover based on landscape metrics in Nagasaki, Japan. J. Appl. Remote Sens. 2016, 11, 016022. [Google Scholar] [CrossRef]
  16. Harte, D. Multifractals; Chapman & Hall: London, UK, 2001; pp. 3–4. ISBN 978-1-58488-154-4. [Google Scholar]
  17. Wang, J.; Ogawa, S. Effects of meteorological conditions on PM2.5 concentrations in Nagasaki, Japan. Int. J. Environ. Res. Public Health 2015, 12, 9089–9101. [Google Scholar] [CrossRef] [PubMed]
  18. Bisoi, A.K.; Mishra, J. On calculation of fractal dimension of images. Pattern Recognit. Lett. 2001, 22, 631–637. [Google Scholar] [CrossRef]
  19. Bolliger, J.; Sprott, J.C.; Mladenoff, D.J. Self-organization and complexity in historical landscape patterns. Oikos 2003, 100, 541–553. [Google Scholar] [CrossRef]
  20. Yu, B.; Zhao, J.; Fang, K.; Tan, Y.; Ning, J. Rock strength evaluation during progressive failure process based on fractural characterization. Mar. Georesour. Geotechnol. 2016, 34, 759–763. [Google Scholar] [CrossRef]
  21. Tian, W.; Han, N. Evaluation of damage in concrete suffered freeze-thaw cycles by CT technique. J. Adv. Concr. Technol. 2016, 14, 679–690. [Google Scholar] [CrossRef]
  22. Xue, D.J.; Zhou, H.W.; Ren, W.G.; Zhao, B. Multi-fractal characteristics of joint geometric distribution of granite in Beishan. Rock Soil Mech. 2016, 37, 2937–2944. [Google Scholar] [CrossRef]
  23. Alves, L.M.; Chinelatto, A.L.; Grzebielucka, E.C.; Prestes, E.; Lacerda, L.A. Analytical fractal model for rugged fracture surface of brittle materials. Eng. Fract. Mech. 2016, 162, 232–255. [Google Scholar] [CrossRef]
  24. Xie, H.; Sanderson, D.J. Fractal kinematics of crack propagation in geomaterials. Eng. Fract. Mech. 1995, 50, 529–536. [Google Scholar] [CrossRef]
  25. Xie, H.; Sun, H.; Ju, Y.; Feng, Z. Study on generation of rock fracture surfaces by using fractal interpolation. Int. J. Solids Struct. 2001, 38, 5765–5787. [Google Scholar] [CrossRef]
  26. Huang, H.; Sun, Y.; Xue, Y.; Wang, F. Inspection equipment study for subway tunnel defects by grey-scale image processing. Adv. Eng. Inform. 2017, 32, 188–201. [Google Scholar] [CrossRef]
  27. Zhang, W.; Zhang, Z.; Qi, D.; Liu, Y. Automatic Crack Detection and Classification Method for Subway Tunnel Safety Monitoring. Sensors 2014, 14, 19307–19328. [Google Scholar] [CrossRef] [PubMed]
  28. Mandelbrot, B. How long is the coast of Britain? Statistical self-similarity and fractional dimension. Science 1967, 156, 636–638. [Google Scholar] [CrossRef] [PubMed]
  29. Mandelbrot, B. The Fractal Geometry of Nature; W. H. Freeman and Company: New York, NY, USA, 1983; ISBN 978-0-7167-1186-5. [Google Scholar]
  30. Falconer, K.J. Fractal Geometry: Mathematical Foundations and Applications; Wiley: Chichester, UK, 1990. [Google Scholar]
  31. Liebovitch, L.S.; Toth, T. A fast algorithm to determine fractal dimensions by box counting. Phys. Lett. A 1989, 141, 386–390. [Google Scholar] [CrossRef]
  32. Chen, Y.Q.; Lu, A.S.; Hu, H.P. Summary of image analysis method based on fractal. Comput. Eng. Des. 2005, 26, 1781–1784. [Google Scholar]
  33. Wu, X.; Jiang, Y.; Masaya, K.; Taniguchi, T.; Yamato, T. Study on the Correlation of Vibration Properties and Crack Index in the Health Assessment of Tunnel Lining. Shock Vib. 2017, 2017, 5497457. [Google Scholar] [CrossRef]
Figure 1. The conceptual diagram of Tunnel-lining Crack Index (TCI).
Applsci 07 00507 g001
Figure 2. The fractal dimension (D) of different number of cracks.
Applsci 07 00507 g002
Figure 3. The relationship of fractal dimension and the number of cracks.
Applsci 07 00507 g003
Figure 4. The fractal dimension of different width cracks.
Applsci 07 00507 g004
Figure 5. The relationship of fractal dimension and the width of cracks.
Applsci 07 00507 g005
Figure 6. The fractal dimension of different distributed cracks.
Applsci 07 00507 g006
Figure 7. Fractal dimension of different distributed cracks.
Applsci 07 00507 g007
Figure 8. The Hidake Tunnel in Japan.
Applsci 07 00507 g008
Figure 9. Extraction of cracks on tunnel lining surface: (a) field test; (b) unfolded crack image; (c) identification of cracks; (d) extraction of cracks.
Applsci 07 00507 g009
Figure 10. The distribution of cracks in tunnel lining for 12 typical spans.
Applsci 07 00507 g010
Figure 11. The correlation between the TCI and the fractal dimension in field test.
Applsci 07 00507 g011
Table 1. The basic condition of the 12 typical spans.
Span No.Lining ThicknessInverted ArchBuried DepthSurrounding Rock TypeSurface PrepConcrete TypeConstruction Method
160.55 mNo25 msand tuffNoC20cast-in-place
180.55 mNo25 msand tuffNoC20cast-in-place
340.70 mNo23 mbasaltNoC20cast-in-place
360.70 mNo23 mbasaltNoC20cast-in-place
420.55 mNo23 mbasaltNoC20cast-in-place
460.55 mNo23 mtuff brecciaNoC20cast-in-place
470.55 mNo23 mtuff brecciaNoC20cast-in-place
500.55 mNo23 mtuff brecciaNoC20cast-in-place
530.70 mNo23 mlapilli tuffNoC20cast-in-place
570.70 mNo23 mlapilli tuffNoC20cast-in-place
630.70 mNo2 mlapilli tuffNoC20cast-in-place
650.70 mYes0 mlapilli tuffNoC20cast-in-place
Table 2. The results of Tunnel-lining Crack Index (TCI)and fractal dimension for all the 65 spans of Hidake Tunnel.
Span No.TCI (10−5)DSpan No.TCI (10−5)DSpan No.TCI (10−5)D
117.35331.26082316.63571.25324518.96051.2220
210.57981.14972423.43241.23344639.331.2527
39.50221.13952518.55111.27834765.37631.4182
49.23071.16302615.56371.26654832.13221.3375
59.03641.11022718.65191.24874940.28161.2906
60.94781.00312822.19681.29945044.39111.3006
713.99021.1786293.90631.06795119.6561.2832
813.01351.2480304.31271.11045230.8871.3173
912.06861.1608314.26891.08445351.82861.4087
1016.06651.2386326.58451.14745432.27131.2633
117.71531.1560333.33521.03065532.00251.3007
123.93261.0665344.51.01915624.62881.2537
131.75051.0279351.88921.00725742.29091.3788
141.53391.03963611.58991.24315830.64161.2838
155.74241.1120373.89411.09505932.56961.2968
162.03971.1210380.71431.02446023.90071.2542
172.01511.0570392.59961.03436120.01431.2237
182.64531.0454401.90421.02866218.26041.1819
190.34021.00684117.58611.18766327.7061.3257
204.1631.06634210.04951.09616411.82131.1860
215.95991.08234316.23361.19366526.11721.2229
228.46681.15214427.00871.2482

