Article

Control of the Polymorphism of Calcium Carbonate Produced by Self-Healing in the Cracked Part of Cementitious Materials

1
Department of Civil and Environmental Engineering, Kitami Institute of Technology, Hokkaido 090-8507, Japan
2
Faculty of Environmental Technology, Muroran Institute of Technology, Hokkaido 090-8585, Japan
*
Author to whom correspondence should be addressed.
Appl. Sci. 2017, 7(6), 546; https://doi.org/10.3390/app7060546
Submission received: 14 April 2017 / Revised: 11 May 2017 / Accepted: 23 May 2017 / Published: 25 May 2017

Abstract

:
Cracking is an inherent development in reinforced concrete structures and can lead to serious damages during their service period. The repeated occurrence of such damages can enlarge the cracks, thereby allowing other deteriorating elements such as CO2 and Cl to further infiltrate the concrete, which can seriously compromise the concrete structure. This study focuses on the type of calcium carbonate (CaCO3) crystals generated by the self-healing phenomenon. Owing to polymorphism, CaCO3 has three types of crystal forms—calcite, vaterite, and aragonite—whose formation can be controlled by the temperature and pH. Vaterite has the highest density among these crystals, and it is expected to be capable of self-healing. Therefore, experiments were conducted to establish the conditions required to promote the generation of vaterite. A saturated Ca(OH)2 solution with CO2 nanobubbles (CN) was employed for effective self-healing. The temperature was controlled at 20, 40, and 60 °C, and the pH was controlled at 9.0, 10.5, and 12.0. The results showed that the self-healing of cracks occurred both on the surface and internally, and the main product of the self-healing phenomenon was vaterite in CaCO3 crystals at a pH of 9.0 and a temperature of 40 °C. Furthermore, the addition of a saturated Ca(OH)2 solution with CO2 nanobubbles (CN) resulted in the most effective self-healing of the surface and internal cracks.

1. Introduction

Concrete and cement form the basis of many important materials used in the construction of modern buildings and engineering structures. Many believe that it would be difficult to develop another building material that can completely replace concrete in the future [1]. Meanwhile, since concrete is a material whose tensile strength is lower than its compression strength, it is unavoidable for cracks to develop in a concrete structure. In Japan, guidelines have been established for evaluating cracks that are narrower than certain thresholds to ensure that they do not cause structural or durability problems [2]. Even though fine cracks do not immediately degrade the safety performance of a concrete structure, they not only allow corrosive elements such as CO2 and Cl to infiltrate concrete, but also cause an increase in water permeability, which challenges the durability [3]. Repeated infiltration of corrosive elements can accelerate concrete deterioration due to the widening of cracks [4] and irreparably damage the safety performance of a structure [5,6]. Therefore, it is important to prevent fine cracking at an early stage.
Meanwhile, the self-healing phenomenon has been confirmed to occur in concrete in an environment with a continuous supply of water, where part of a particular small crack in a structure is filled as a result of the rehydration of cement particles and precipitation of calcium carbonate (CaCO3) [7]. The products of self-healing are closely related to hydrates such as the C–S–H hydrate, ettringite, and calcium hydroxide (Ca(OH)2) [8,9], as well as the calcium carbonate that is newly generated on the crack surface. In the self-healing mechanism of concrete, a carbonate compound, CaCO3, which is not readily dissolved in water, is generated by the reaction between Ca2+ in concrete and CO32− dissolved in water [10]. The reaction is summarized by the following Equations (1)–(3) [10]:
H2O + CO2 ⇔ H2CO3 ⇔ H+ + HCO3 ⇔ 2H+ + CO32−
Ca2+ + CO32− ⇔ CaCO3 (pHwater > 8)
Ca2+ + HCO3 ⇔ CaCO3 + H+ (7.5 < pHwater < 8)
The cracked part is also restored as a result, as reported for cracks that were narrower than 0.1 mm in earlier studies [10,11,12].
Researchers have also explored various approaches to promote self-healing, such as the use of bacteria, crystalline admixtures, and superabsorbent polymers [13,14,15,16,17,18,19,20,21]. Choi et al. reported that a large amount of CaCO3 precipitate was produced in the surface layer and inside microcracks because the self-healing of cement-based composite materials generated carbon dioxide gas in micrometer-sized ultrafine bubbles, which flowed into microcracks under a continuous water supply [1,22,23]. Crystals of CaCO3 can be divided into three types: calcite, vaterite, and aragonite. The majority of the CaCO3 produced in concrete may be considered to be calcite: Ca(OH)2 is first generated among the hardened bodies of cement, which then combines with CO32− ions in water in the pores to form CaCO3 in the form of calcite [24,25]. Meanwhile, vaterite is a hexagonal crystal, whose pore-filling effect is better than that of other CaCO3 crystals because of its large volume [25,26,27,28,29]. Based on reports of pore-filling contributing to the water tightness and strength enhancement of concrete, the generation of self-healing materials with a crystal structure that is denser than that of calcite is expected to be possible [24]. The formation of the three types of crystal forms of CaCO3 is controlled by adjusting the temperature or pH [24,25]. Earlier studies showed that the formation of polymorphs can be controlled at room temperature: the formation of vaterite, aragonite, and calcite occurs at a pH of ~9.0, ~10.5, and >11, respectively [24]. Moreover, by controlling the temperature of water available to concrete for self-healing, calcite, vaterite, and aragonite can be generated at 15–20, 30–50, and >60 °C, respectively [25].
Based on the above-mentioned studies, the authors decided that the intentional generation of vaterite is possible at a temperature of 40 °C and a pH of 9.0. In the present study, attention was focused on CaCO3 crystals generated during the self-healing of cement-based composite materials, and the possibility to generate denser self-healing materials through the control of vaterite formation was evaluated. Accordingly, by supplying a flow of CO32− ions and carbon dioxide gas generated as nanometer-sized ultrafine bubbles, and controlling the temperature and pH, the self-healing performance was evaluated and the optimum self-healing conditions were investigated. Figure 1 shows the self-healing process of cement-based composite materials in the present study.

2. Materials and Methods

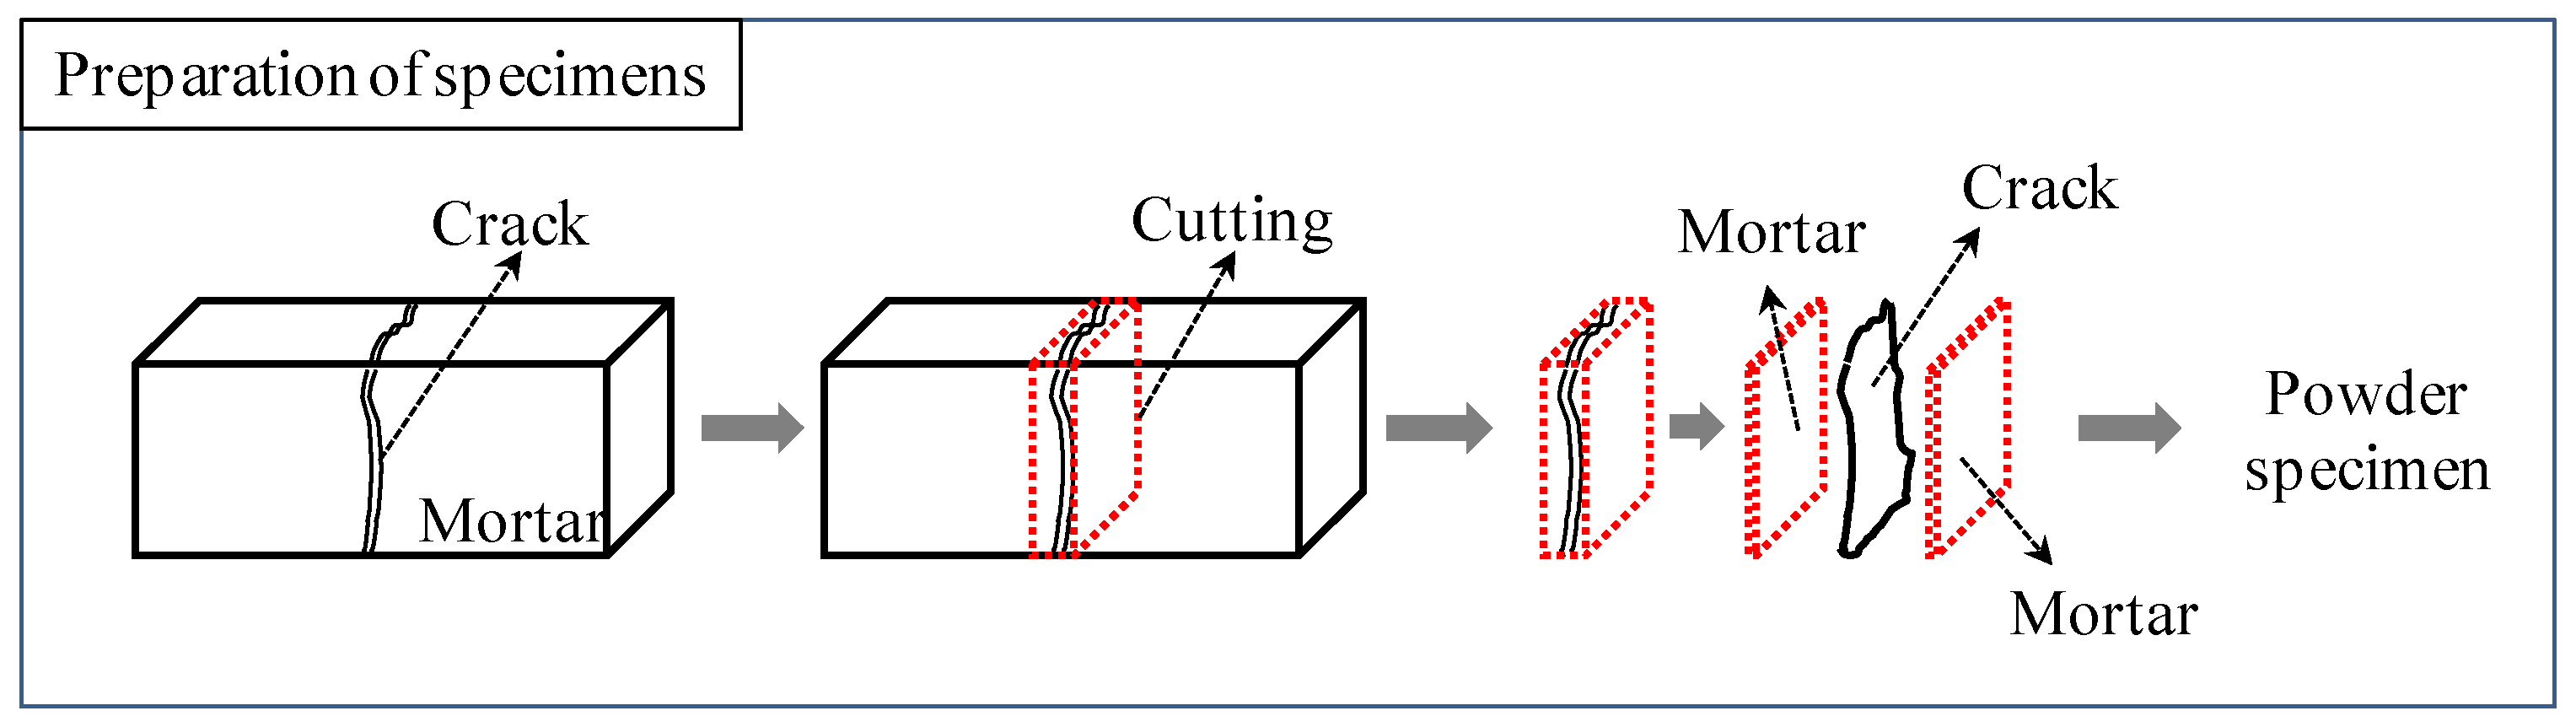
2.1. Materials and Sample Preparation

Since the major reaction materials generated during the self-healing of cement-based composite materials are controlled by the hydration reaction between cement particles and water [10], multi-faceted evaluations of the self-healing performance were conducted with test bodies made from cement paste. Figure 2 shows a schematic diagram of the preparation of test bodies and the incorporation of cracks in the present study. First, cement-paste test bodies with a water/cement ratio of 40% were produced from high-strength Portland cement (density: 3.14 g/cm3, average particle diameter: 10 µm). To prevent the dissipation of water from the test bodies, after the cement paste was dispensed into the mold (dimensions: φ50 × 100 mm) with D6 steel reinforcement (diameter: 6 mm) fixed in the center part, the part with exposed steel reinforcement was immediately seal-cured with epoxy for one day in a chamber at a constant temperature of 20 ± 1 °C and constant humidity of 60%. Next, underwater curing was conducted for seven days on the demolded test bodies in a water tank at a temperature of 20 ± 1 °C. Following this, the upper and lower parts of the test body were constrained by using a one-axis constraint apparatus, as shown in Figure 2.
Pre-cracks with an average width of about 0.15 mm were incorporated by drying for about 24 h in an oven at 105 °C, followed by constraining the shrinkage of the cement paste to conduct experiments as a test body “before self-healing.” Figure 3 shows the appearance and scale of a pre-crack measuring about 0.15 mm in the test body.

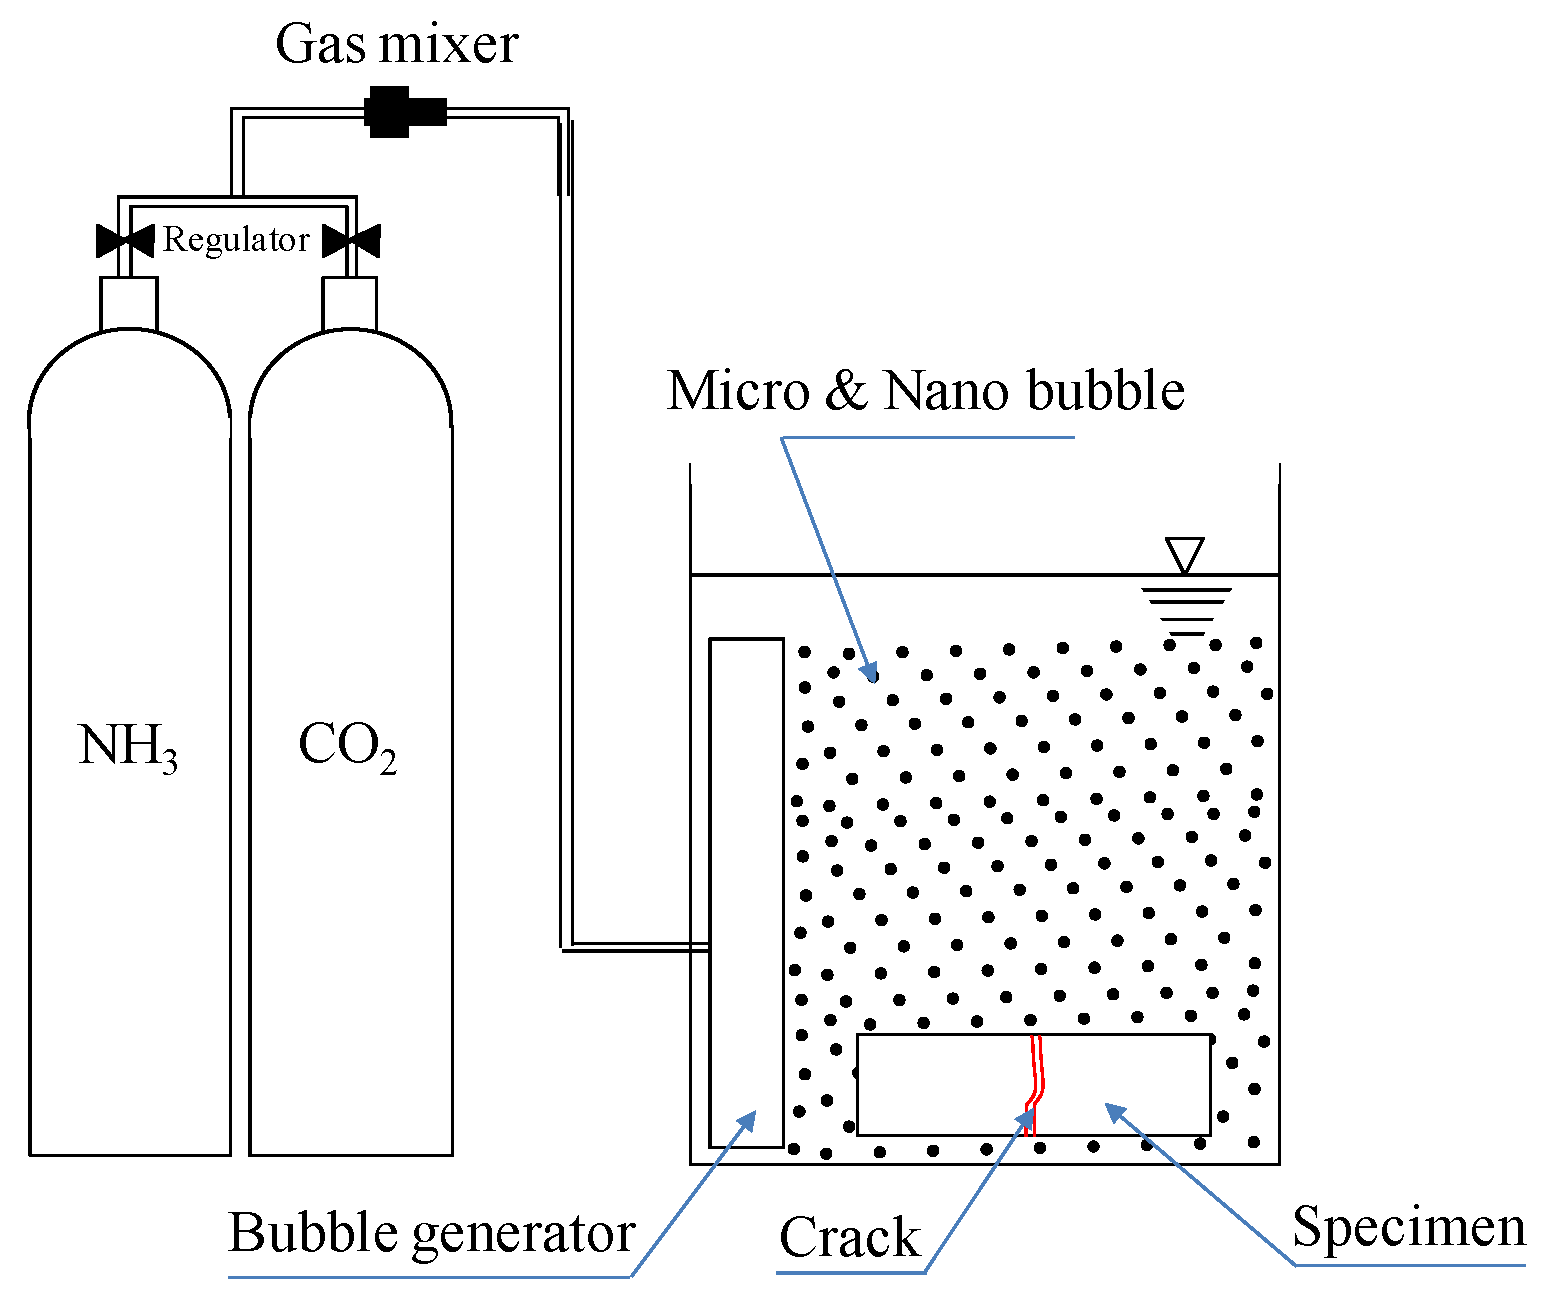
2.2. Experimental Procedure

Table 1 shows the sealing-healing factors and conditions employed in the study. The self-healing conditions (temperature and pH) that could control changes in the cement as it is hydrated and transforms from calcite to vaterite were obtained from the literature (Figure 1) [24,25]. The pH was adjusted by bubbling a gas mixture of ammonia (NH3) and carbon dioxide (CO2) into the water. Experiments were also conducted by separating the CO32− ions in the saturated Ca(OH)2 solution (solubility: 0.82 g/L) into microscale (average particle diameter: 50 µm) and nanoscale (average particle diameter: 50 nm) particles. Figure 4 shows a schematic diagram of the self-healing device used in this study, and Figure 5 shows a photograph of the experimental setup using Ca(OH)2 with microbubbles.
It is thought that the Ca2+ ions in a saturated Ca(OH)2 solution can promote self-healing, and the generation of self-healing precipitated substances can be enhanced through an increase in the quantity of CO32− supplied by CO2 microbubbles during self-healing [26,27]. Therefore, CO32− ions were supplied by ultrafine bubbles to the cracked part in the cement-paste test body to increase the production of self-healing precipitates [1].
The self-healing performance of the test bodies was evaluated as a function of individual conditions for up to seven cycles (seven days). Each cycle lasted 24 h, during which curing was conducted for 20 h after the test body was moved to the tank of saturated Ca(OH)2 solution with a controlled temperature and pH; in the last 4 h of the cycle, the test body was immersed in a tank of saturated Ca(OH)2 solution with a continuous supply of CO2 microbubbles and nanobubbles at 20 °C (Table 1).
The experimental procedure and details of the self-healing evaluation are shown in Table 2. By using test bodies with incorporated cracks wider than 0.1 mm, as shown in Figure 2, the structural changes on the crack surface and in its interior were evaluated prior to self-healing (step A) and after self-healing (step B) through microscope observations and microfocus X-ray computed tomography (CT) scans (SHIMADZU inspeXio SMX-225CT, Kyoto, Japan). Raman spectroscopic analysis (JASCO NR-1800, Sapporo, Japan) and thermogravimetric-differential thermal analysis (TG-DTA) (RIGAKU TG8121, Tokyo, Japan) were used to quantitatively evaluate the types and amounts of precipitates generated on the crack surface and its interior before and after self-healing. Finally, to determine ways to limit the formation of polymorphs to that of vaterite, which has a denser crystal structure than calcite, the major precipitate of self-healing [24,25], scanning electron microscope (SEM) analysis (JEOL JSM-6510A, Tokyo, Japan) of each test body was conducted as a function of the temperature and pH.

3. Results and Discussion

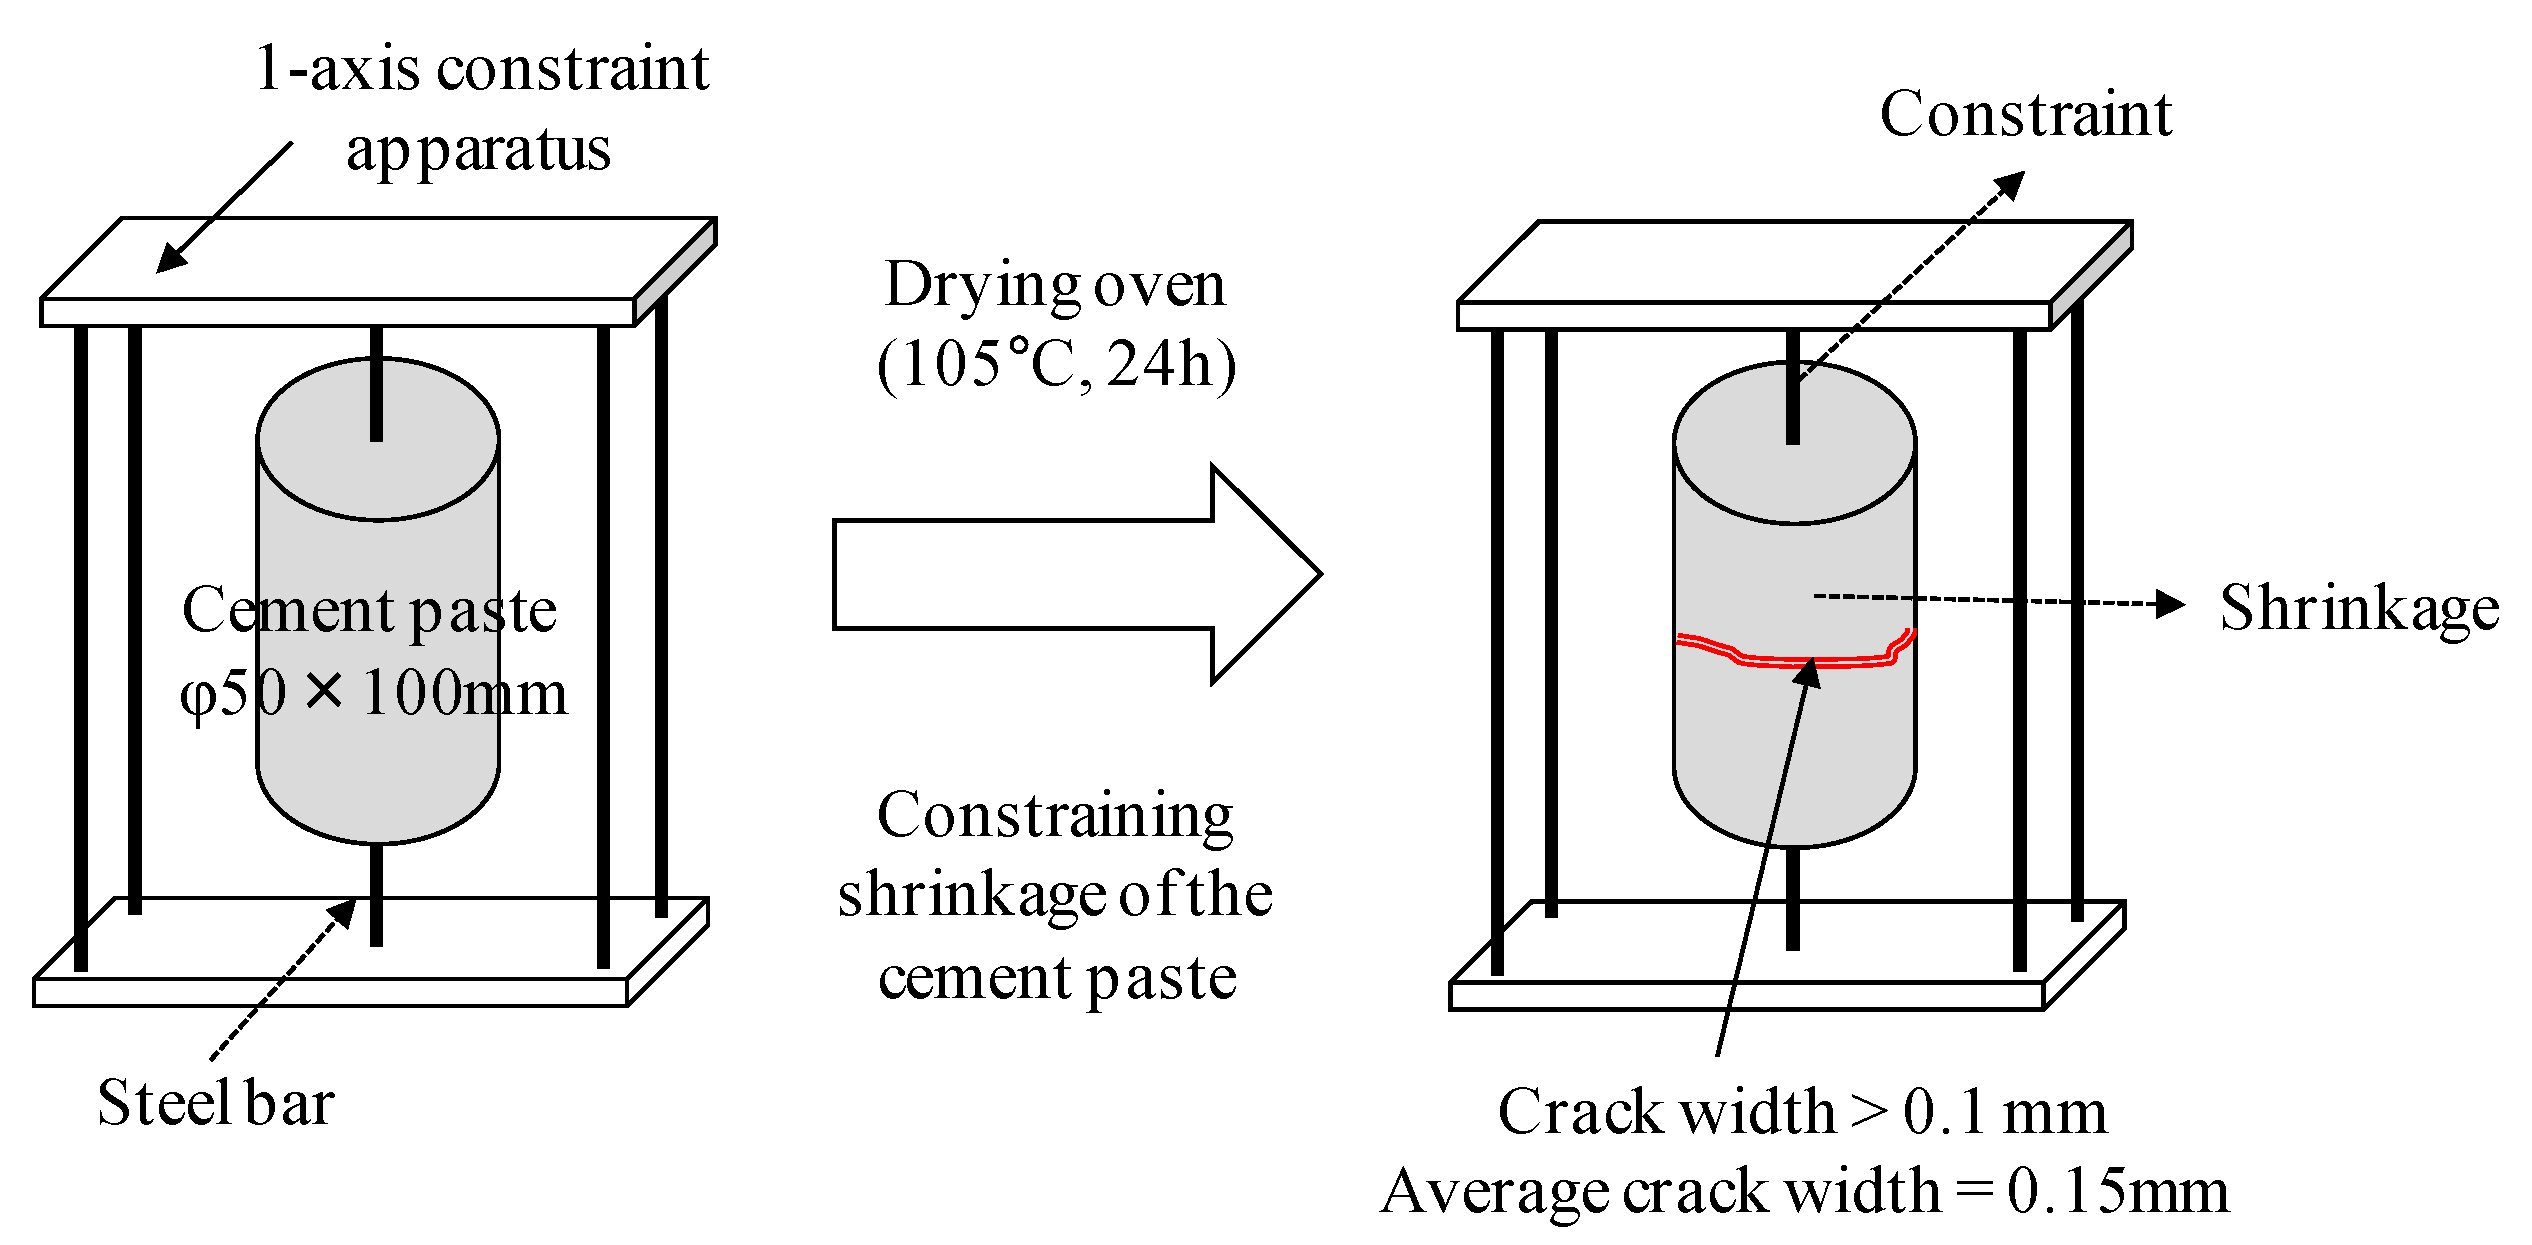
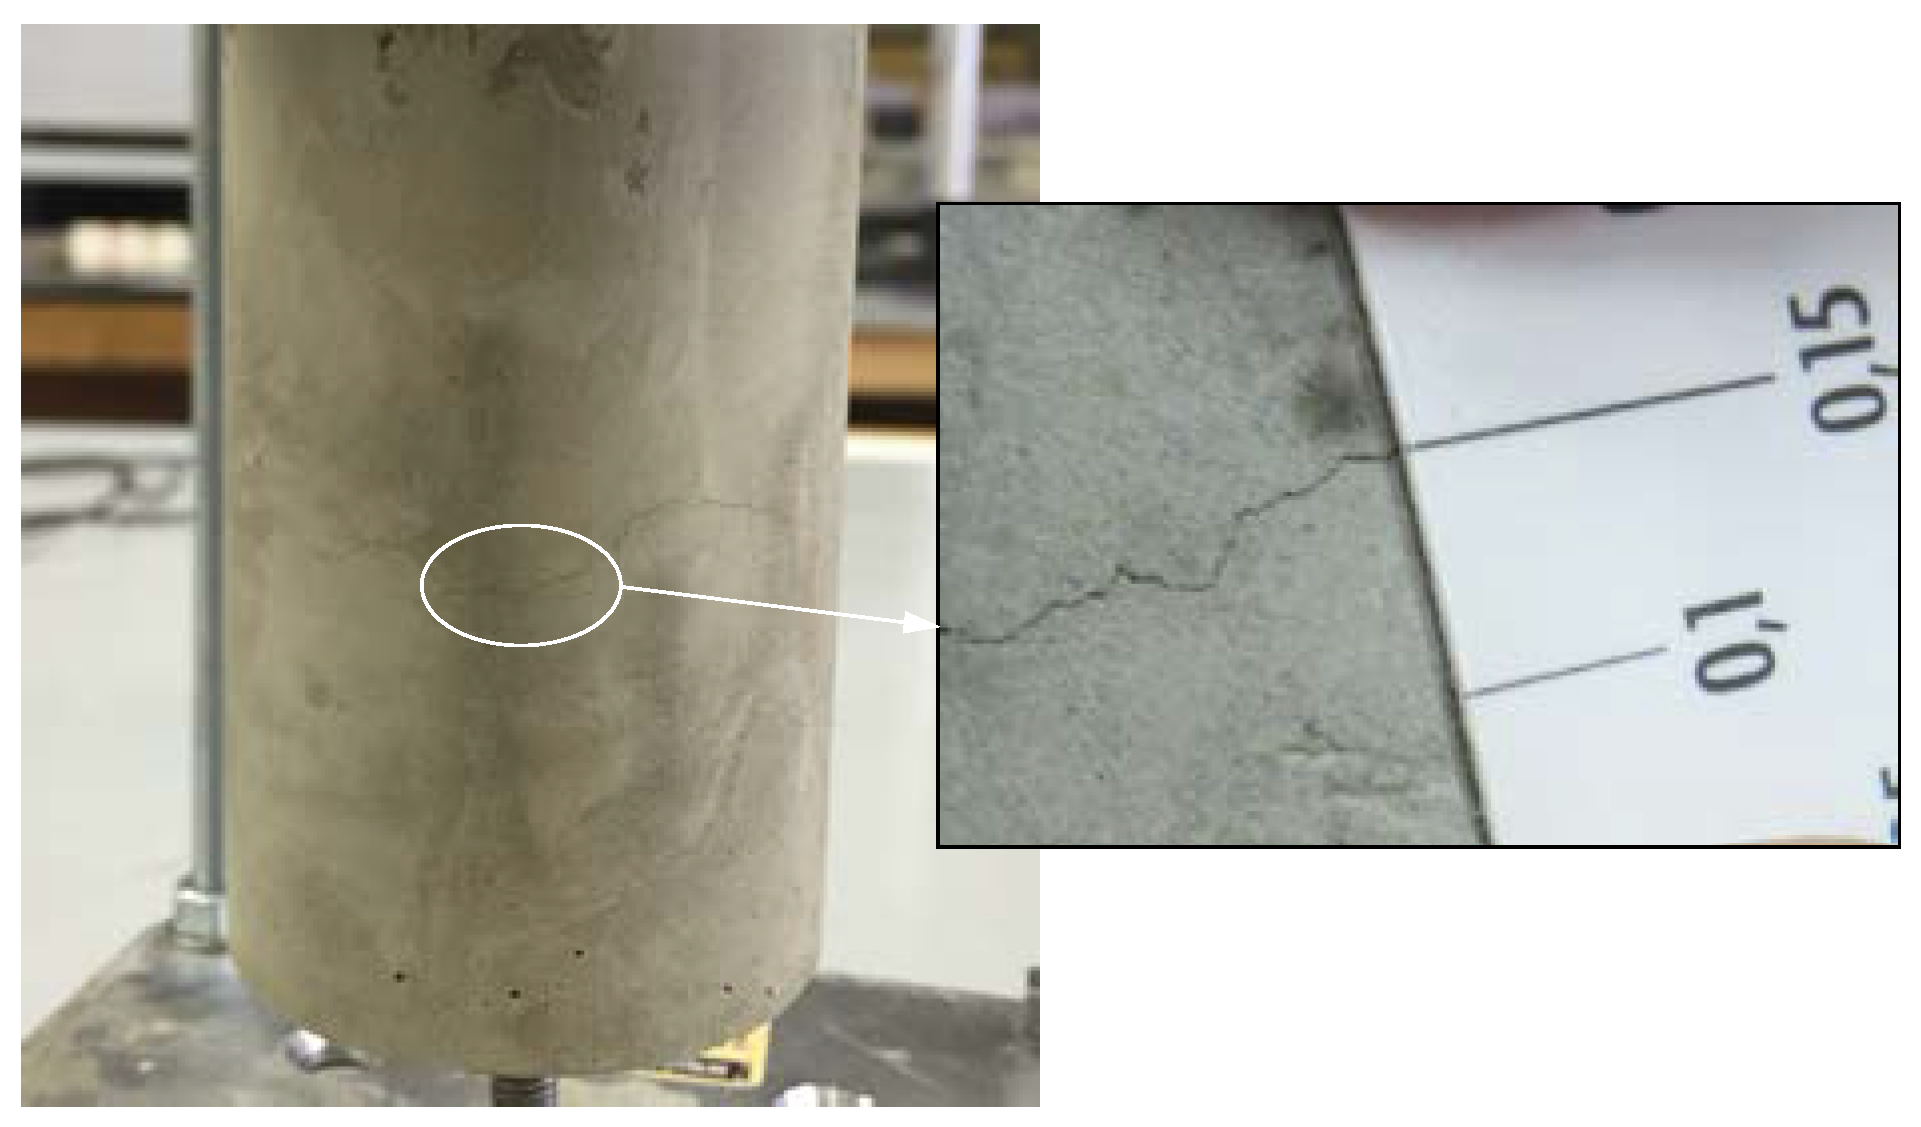
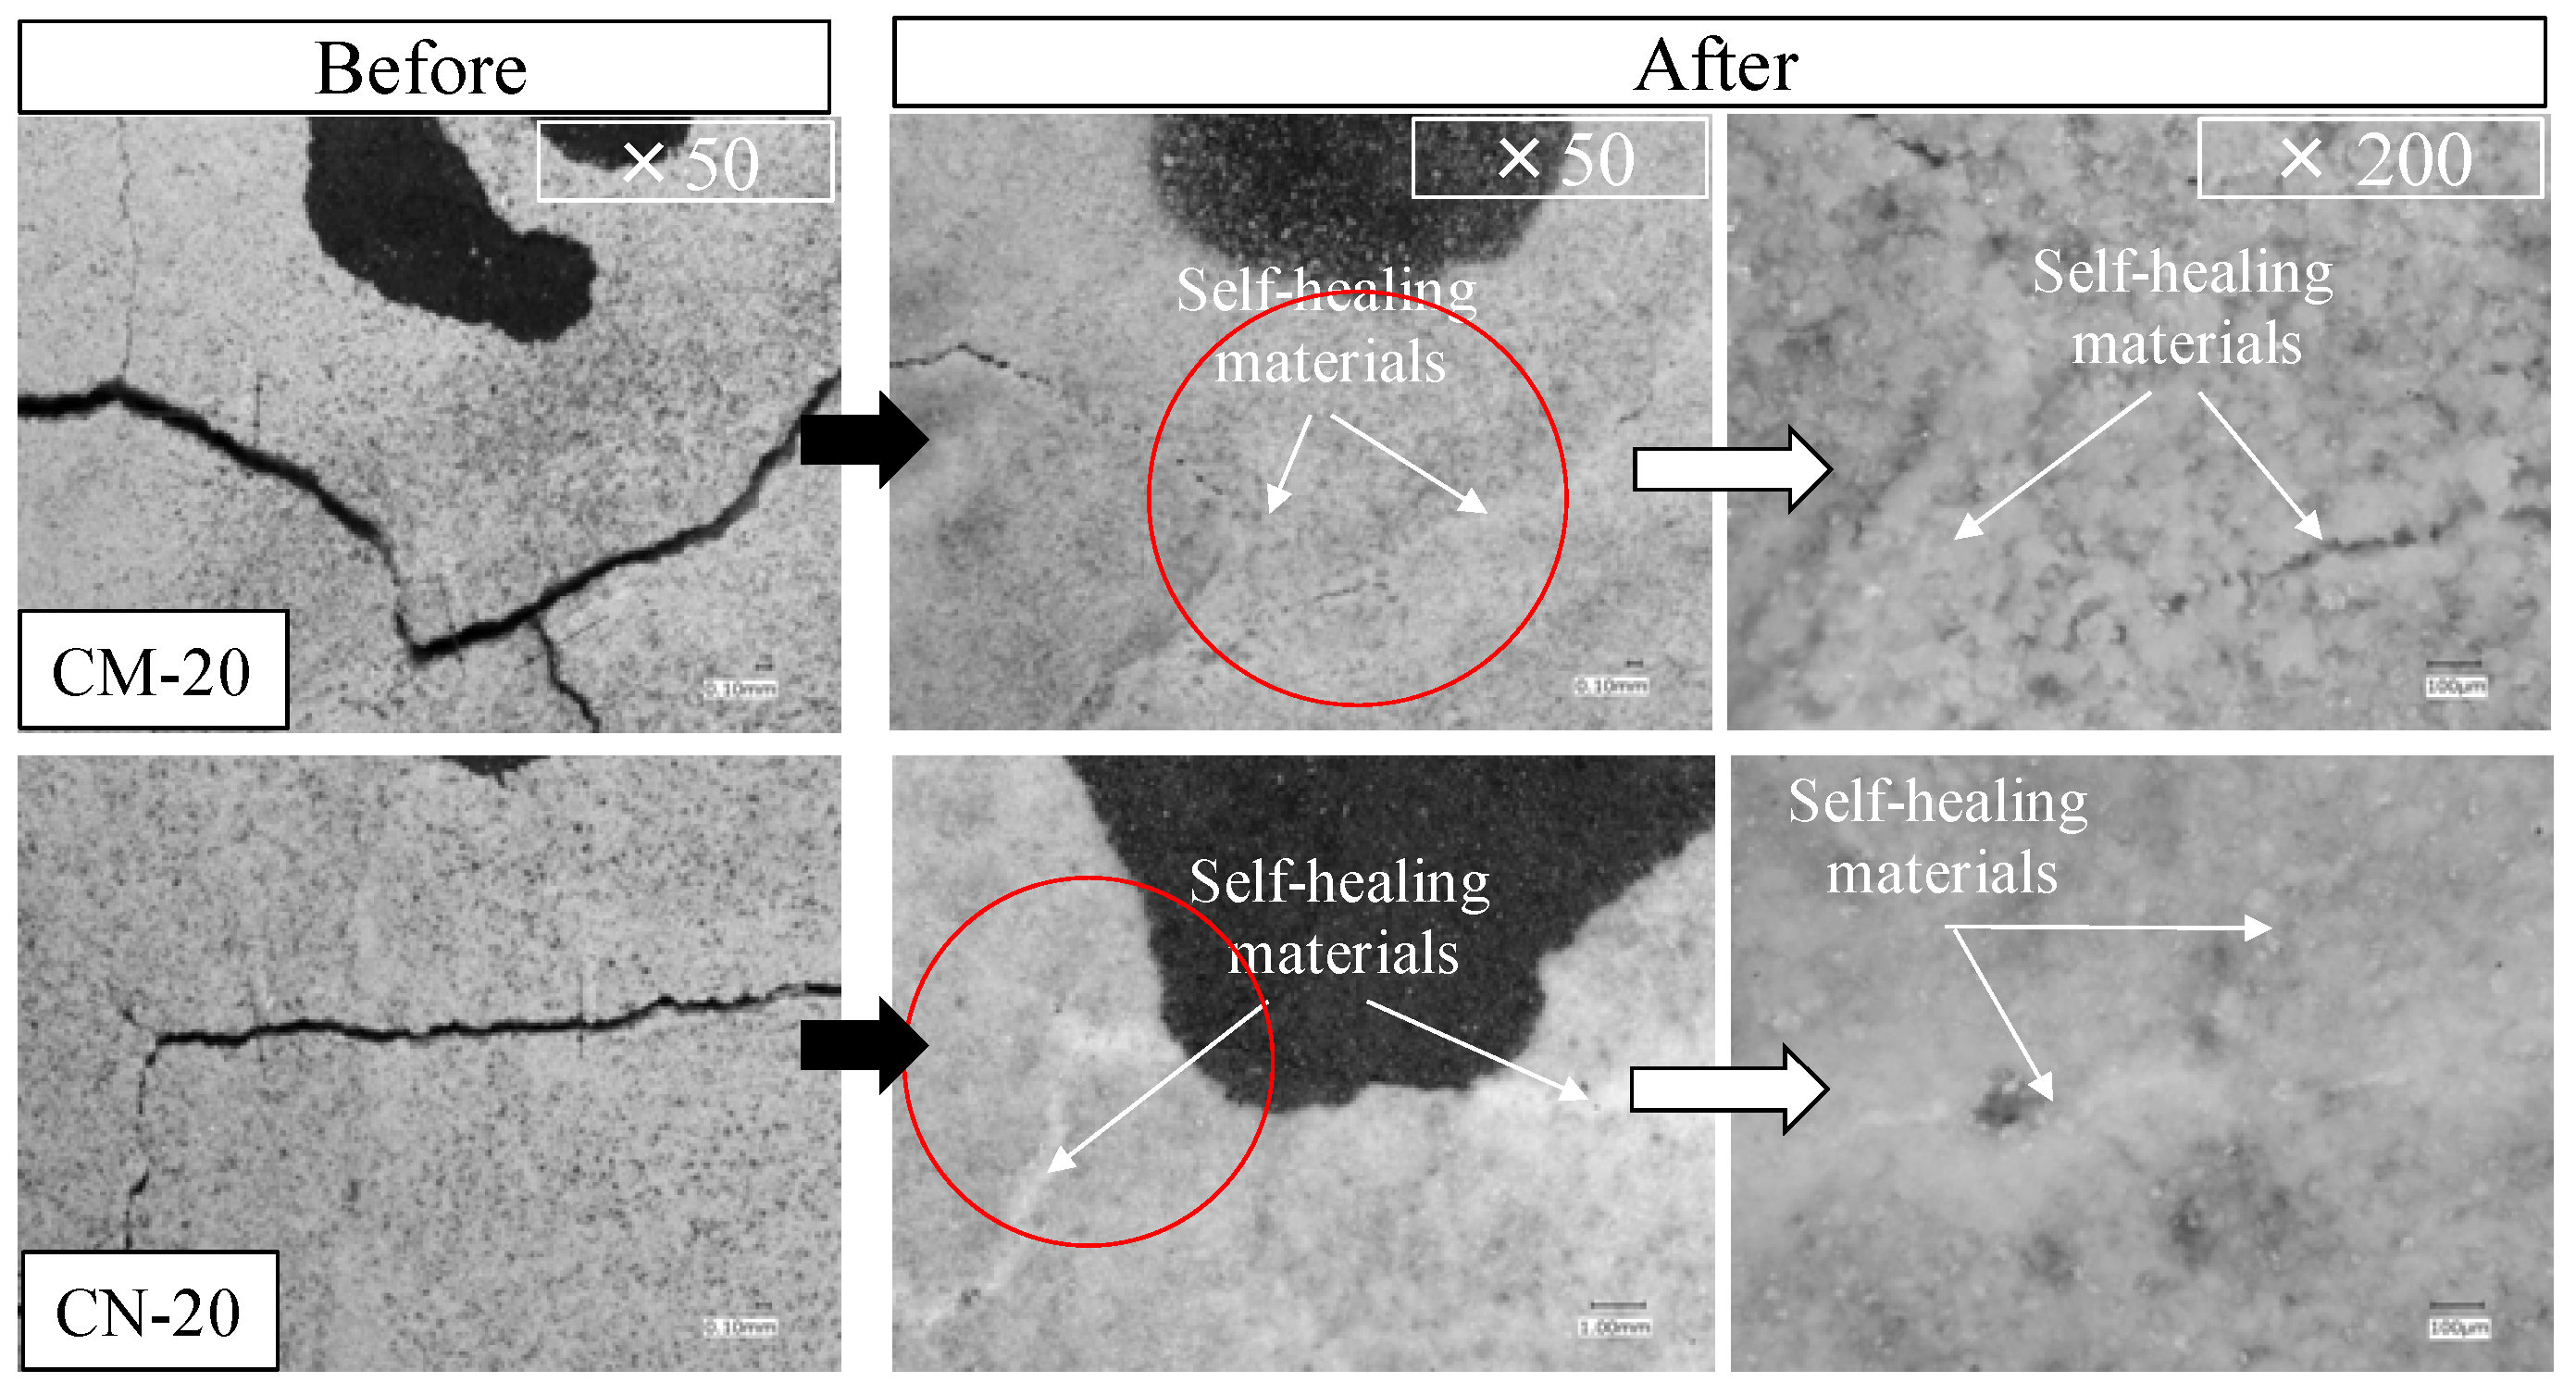
3.1. Surface Section of the Cracks

First, to thoroughly check for precipitates formed by self-healing in the surface portion of a crack, observations were made with an optical microscope. White precipitates of self-healing were visible in both the CN series (immersed in Ca(OH)2 solution with a continuous supply of nanobubbles) and CM series (immersed in Ca(OH)2 solution with a continuous supply of microbubbles) of test bodies. Figure 6 shows images of the surface of a crack in test bodies exposed to microbubbles (CM-20) and nanobubbles (CN-20) at a temperature of 20 °C and pH of 9.0. As shown in the figure, the crack surface was almost completely filled with white precipitates in both CN-20 and CM-20, making it difficult to confirm the presence of the crack itself and indicating that the crack surface was closed by the self-healing of the cement paste.
Meanwhile, to check for precipitate crystals generated by self-healing, Raman analysis was conducted by using test bodies immersed in Ca(OH)2 solutions with microbubbles (CM-20) and nanobubbles (CN-20), subjected to self-healing at 20 °C and a pH of 9.0. Figure 7a shows the experimental setup, and Figure 7b shows the Raman spectra of the specimens containing the cracked section with attached white precipitates and the non-cracked section in the test bodies. The spectra of CaCO3 and Ca(OH)2 powders are shown at the bottom of Figure 7b for comparison. The peak corresponding to CaCO3 is almost non-existent in the spectrum of the specimen containing the non-cracked section. However, the peaks corresponding to CaCO3 in the spectra of specimens containing the cracked section in CN-20 and CM-20 are almost identical, indicating that, regardless of the size of the CO2 bubbles in the Ca(OH)2 solution, most of the white precipitates produced after the self-healing of each test body were CaCO3.

3.2. Evaluation of Self-Healing Performance as a Function of Temperature and pH

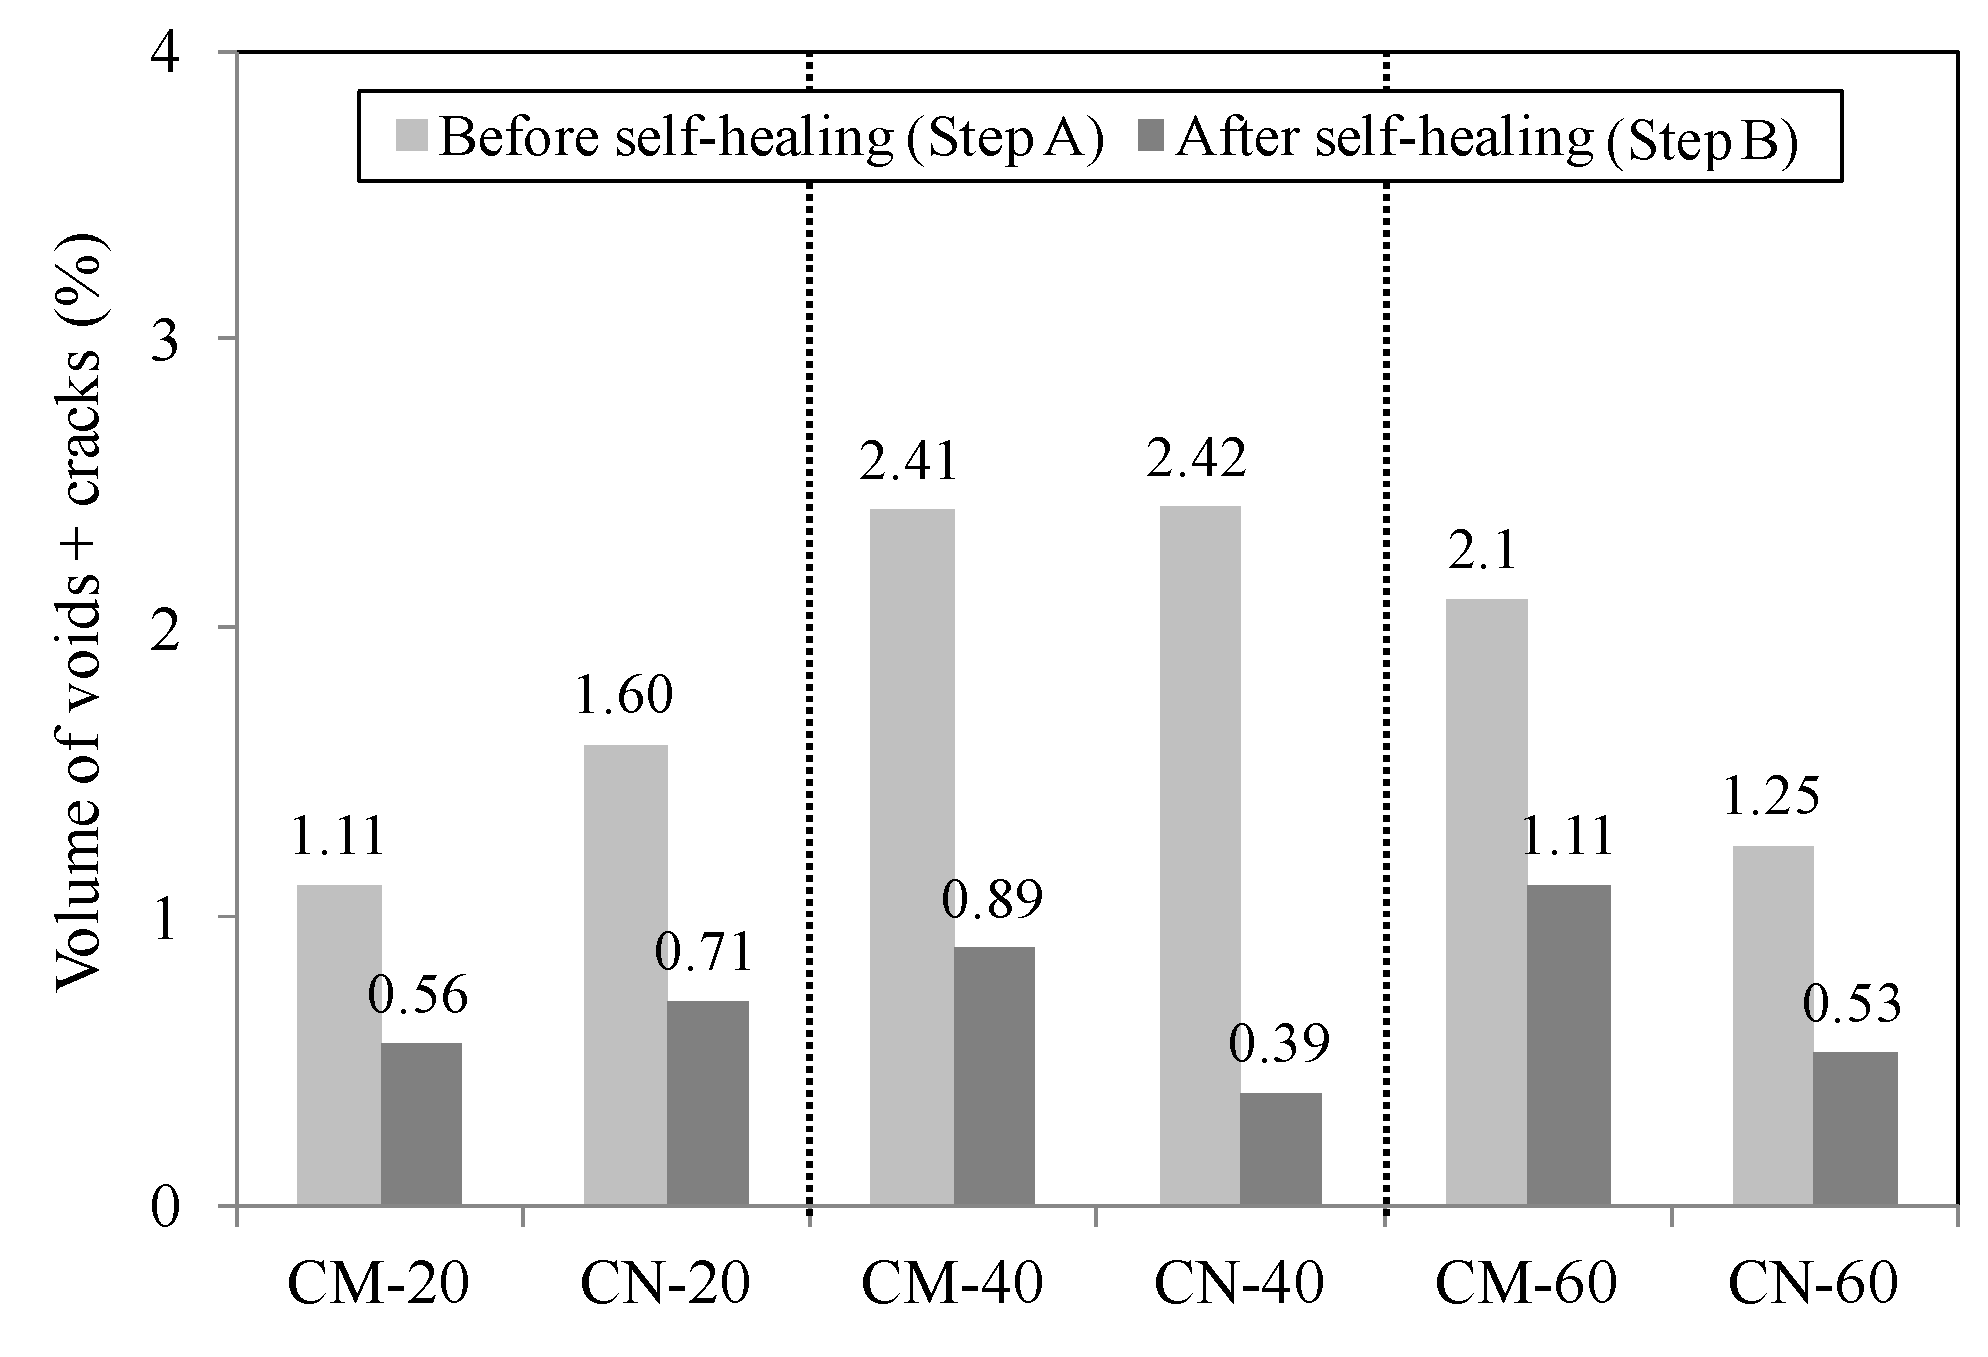
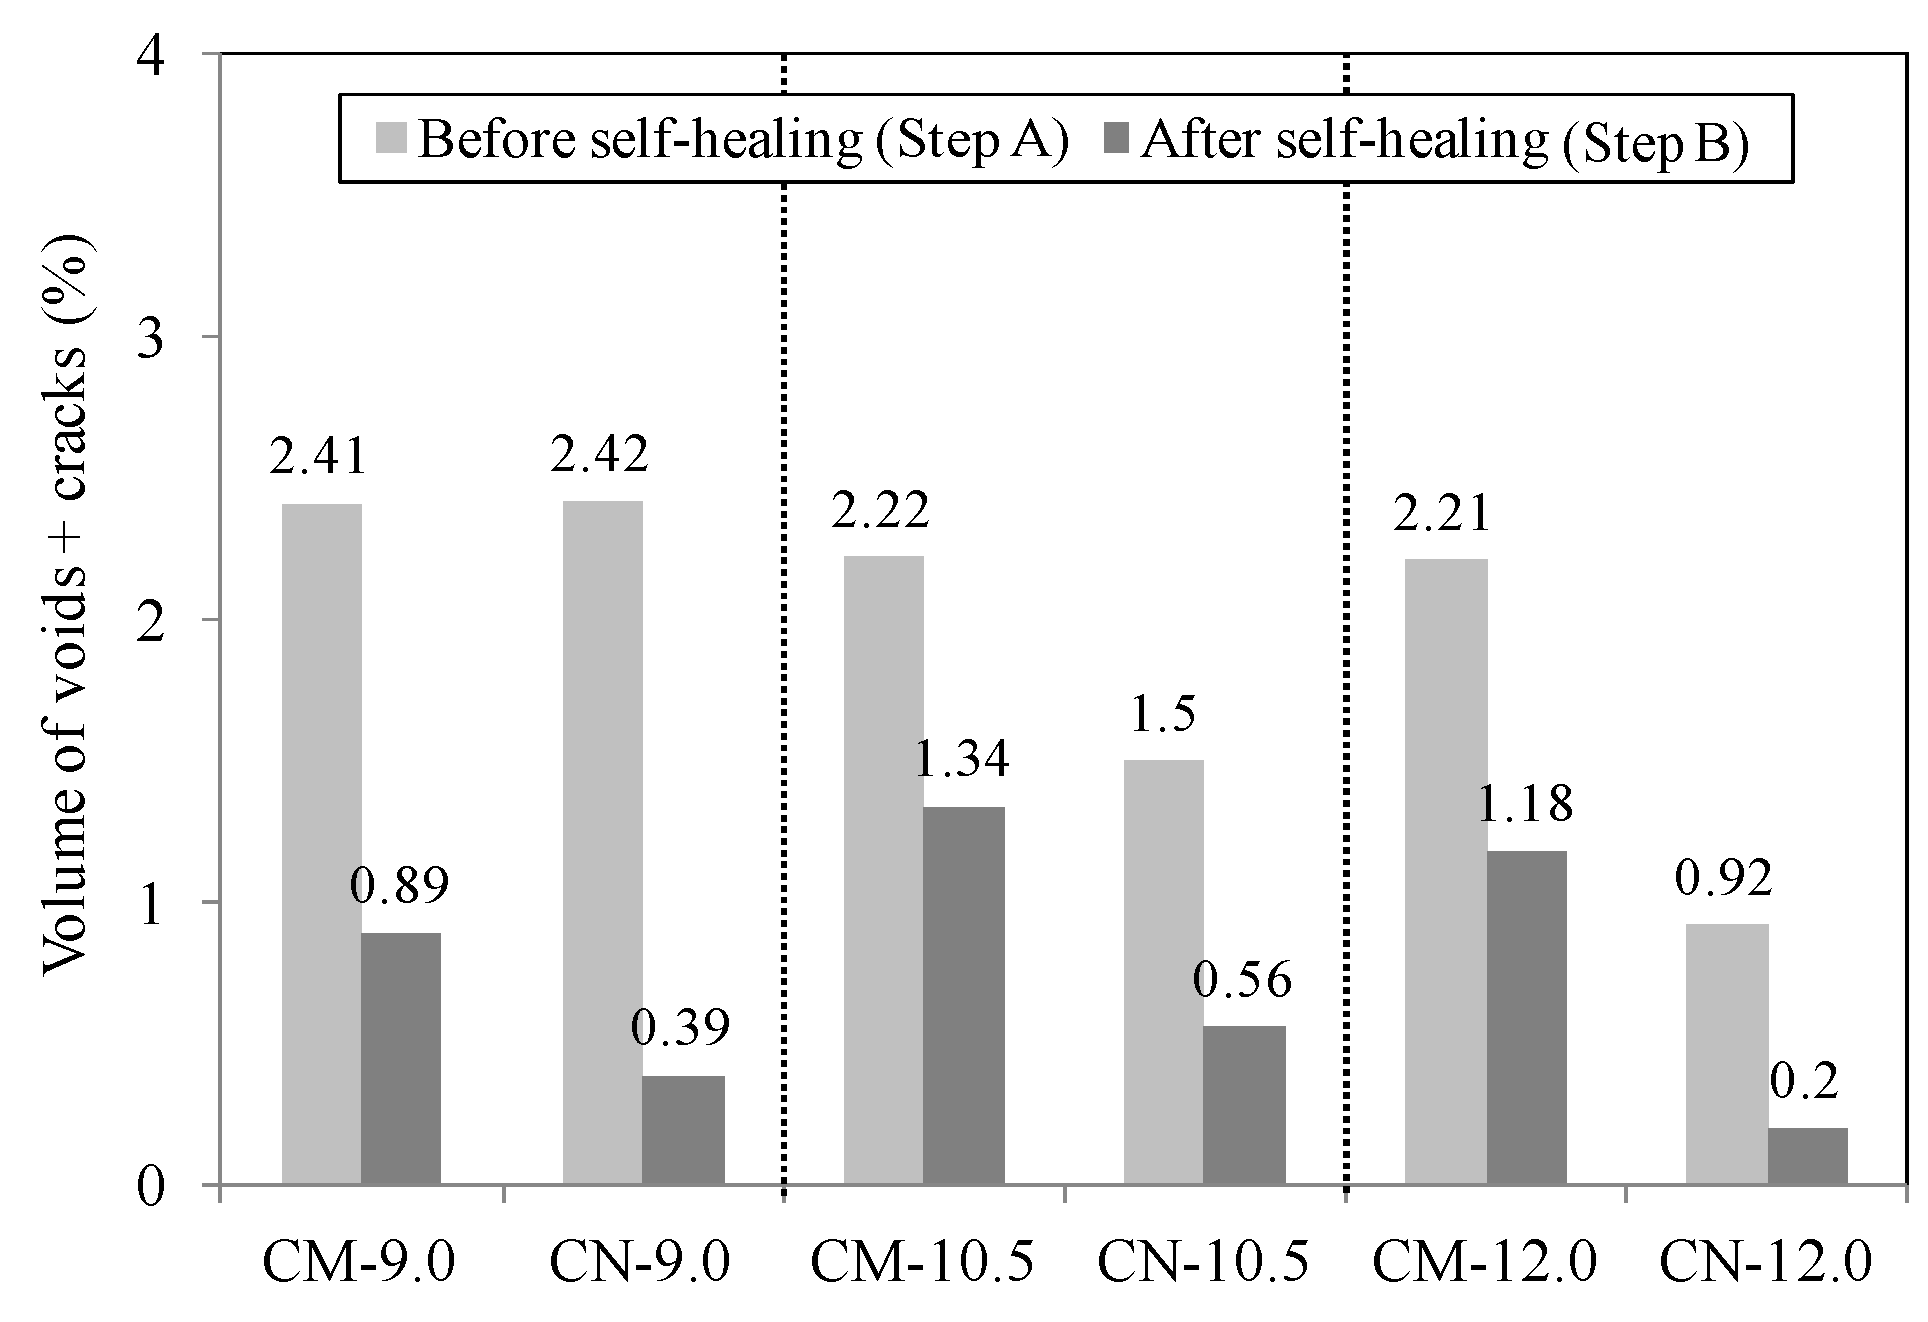
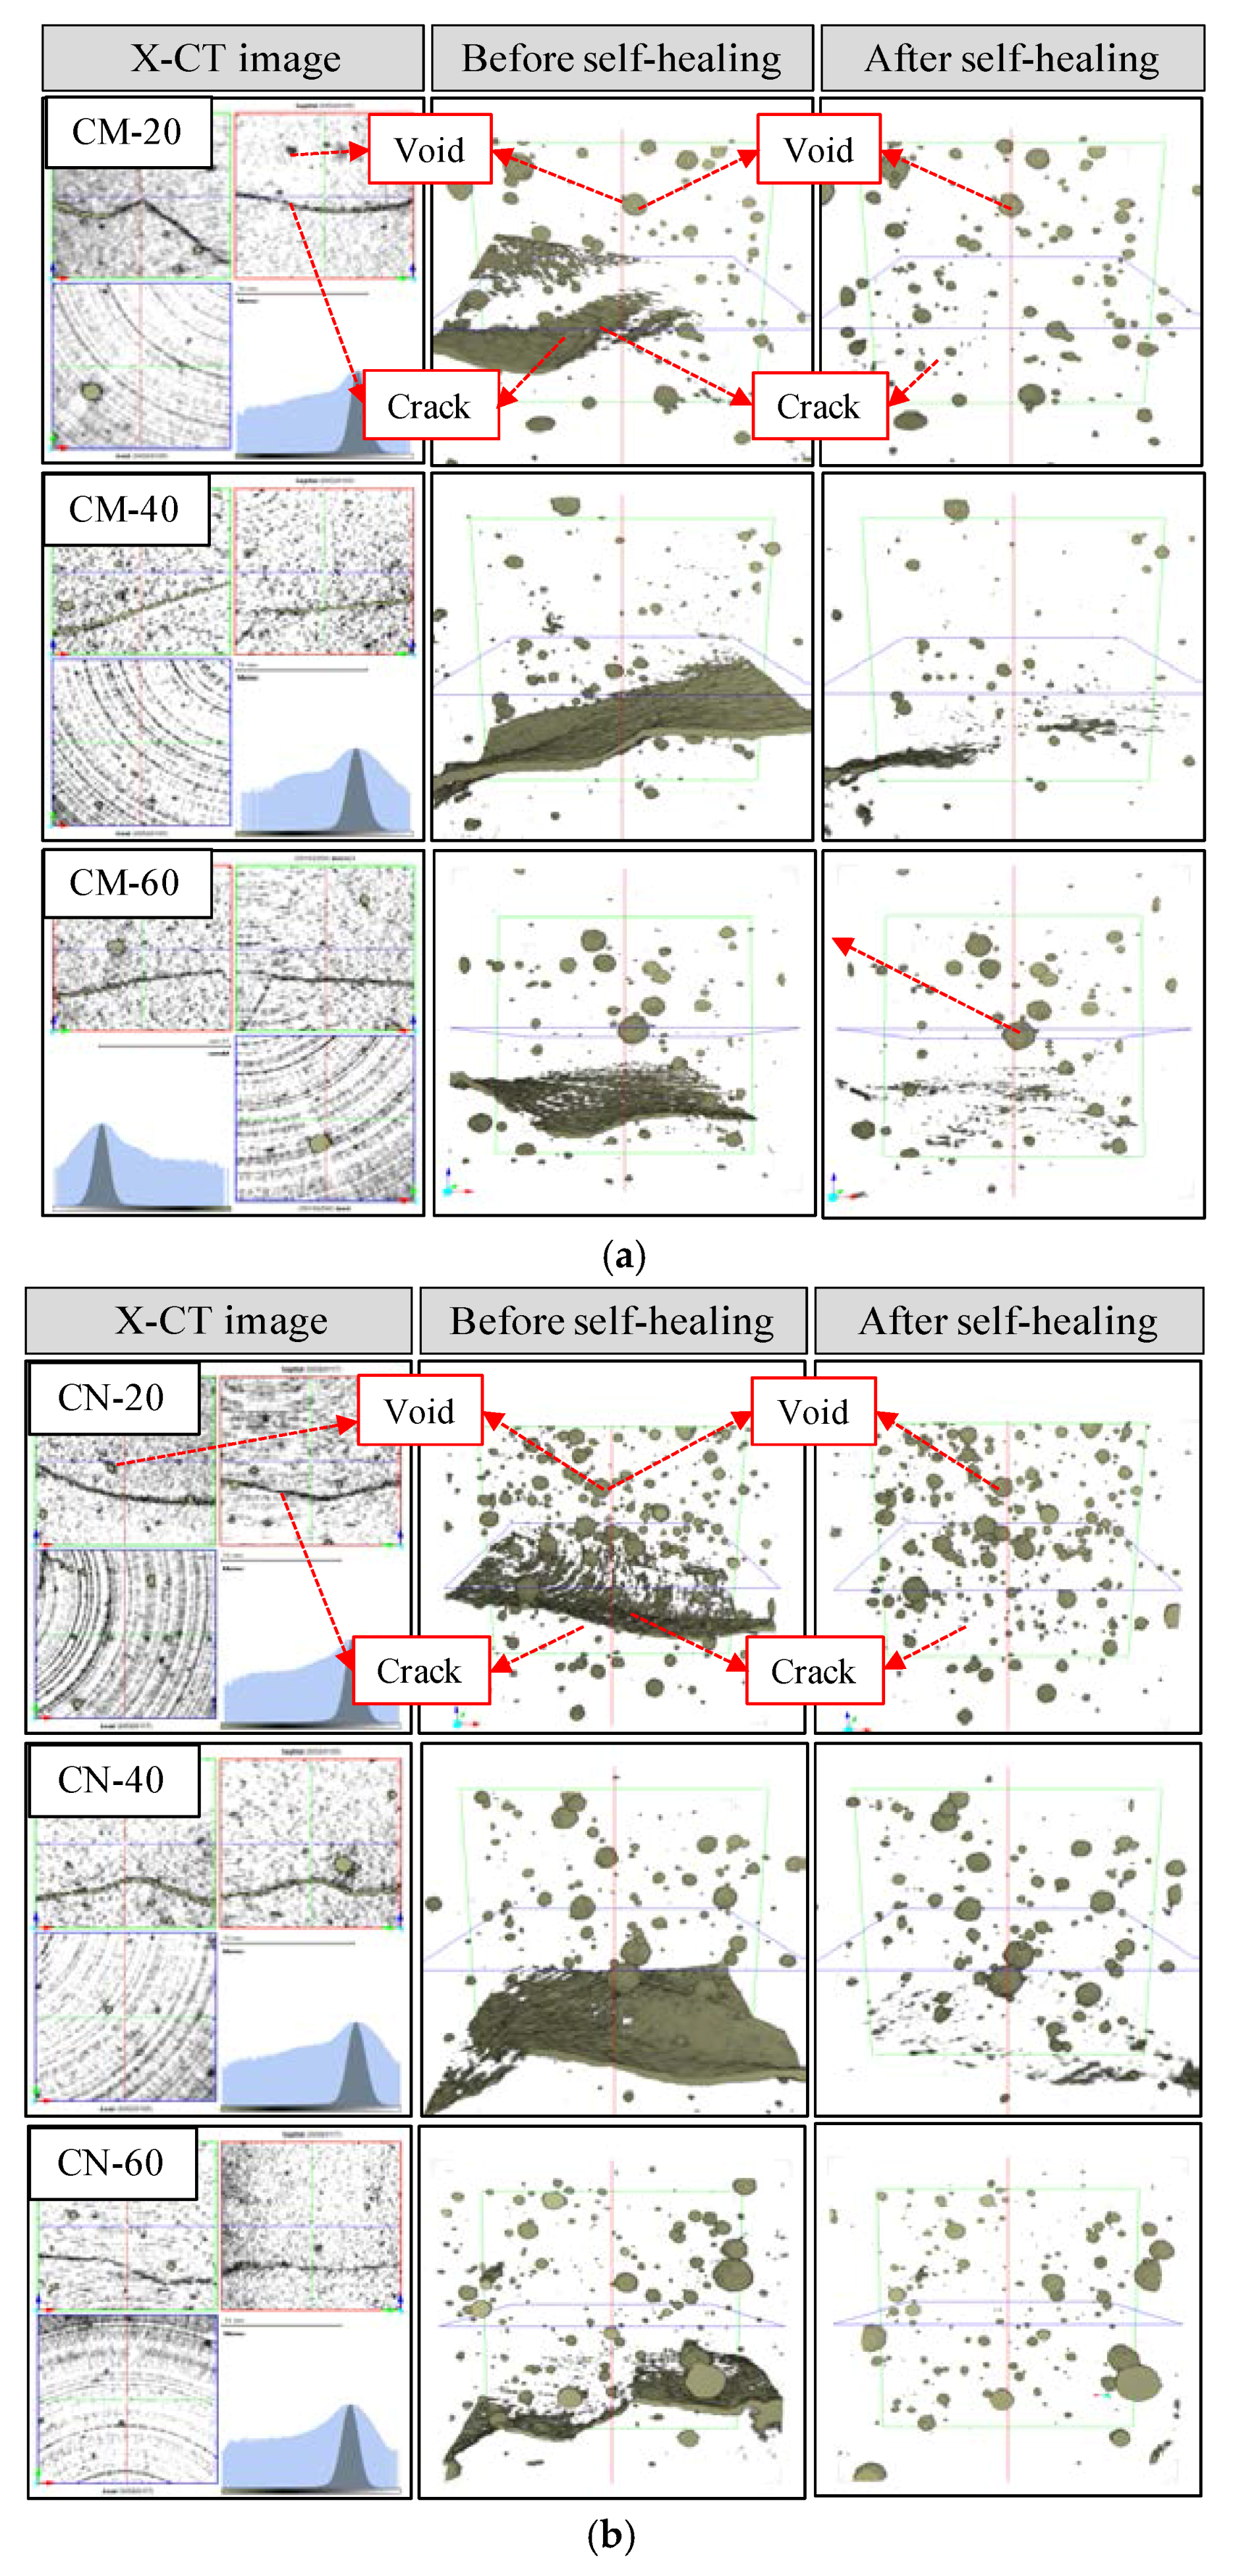
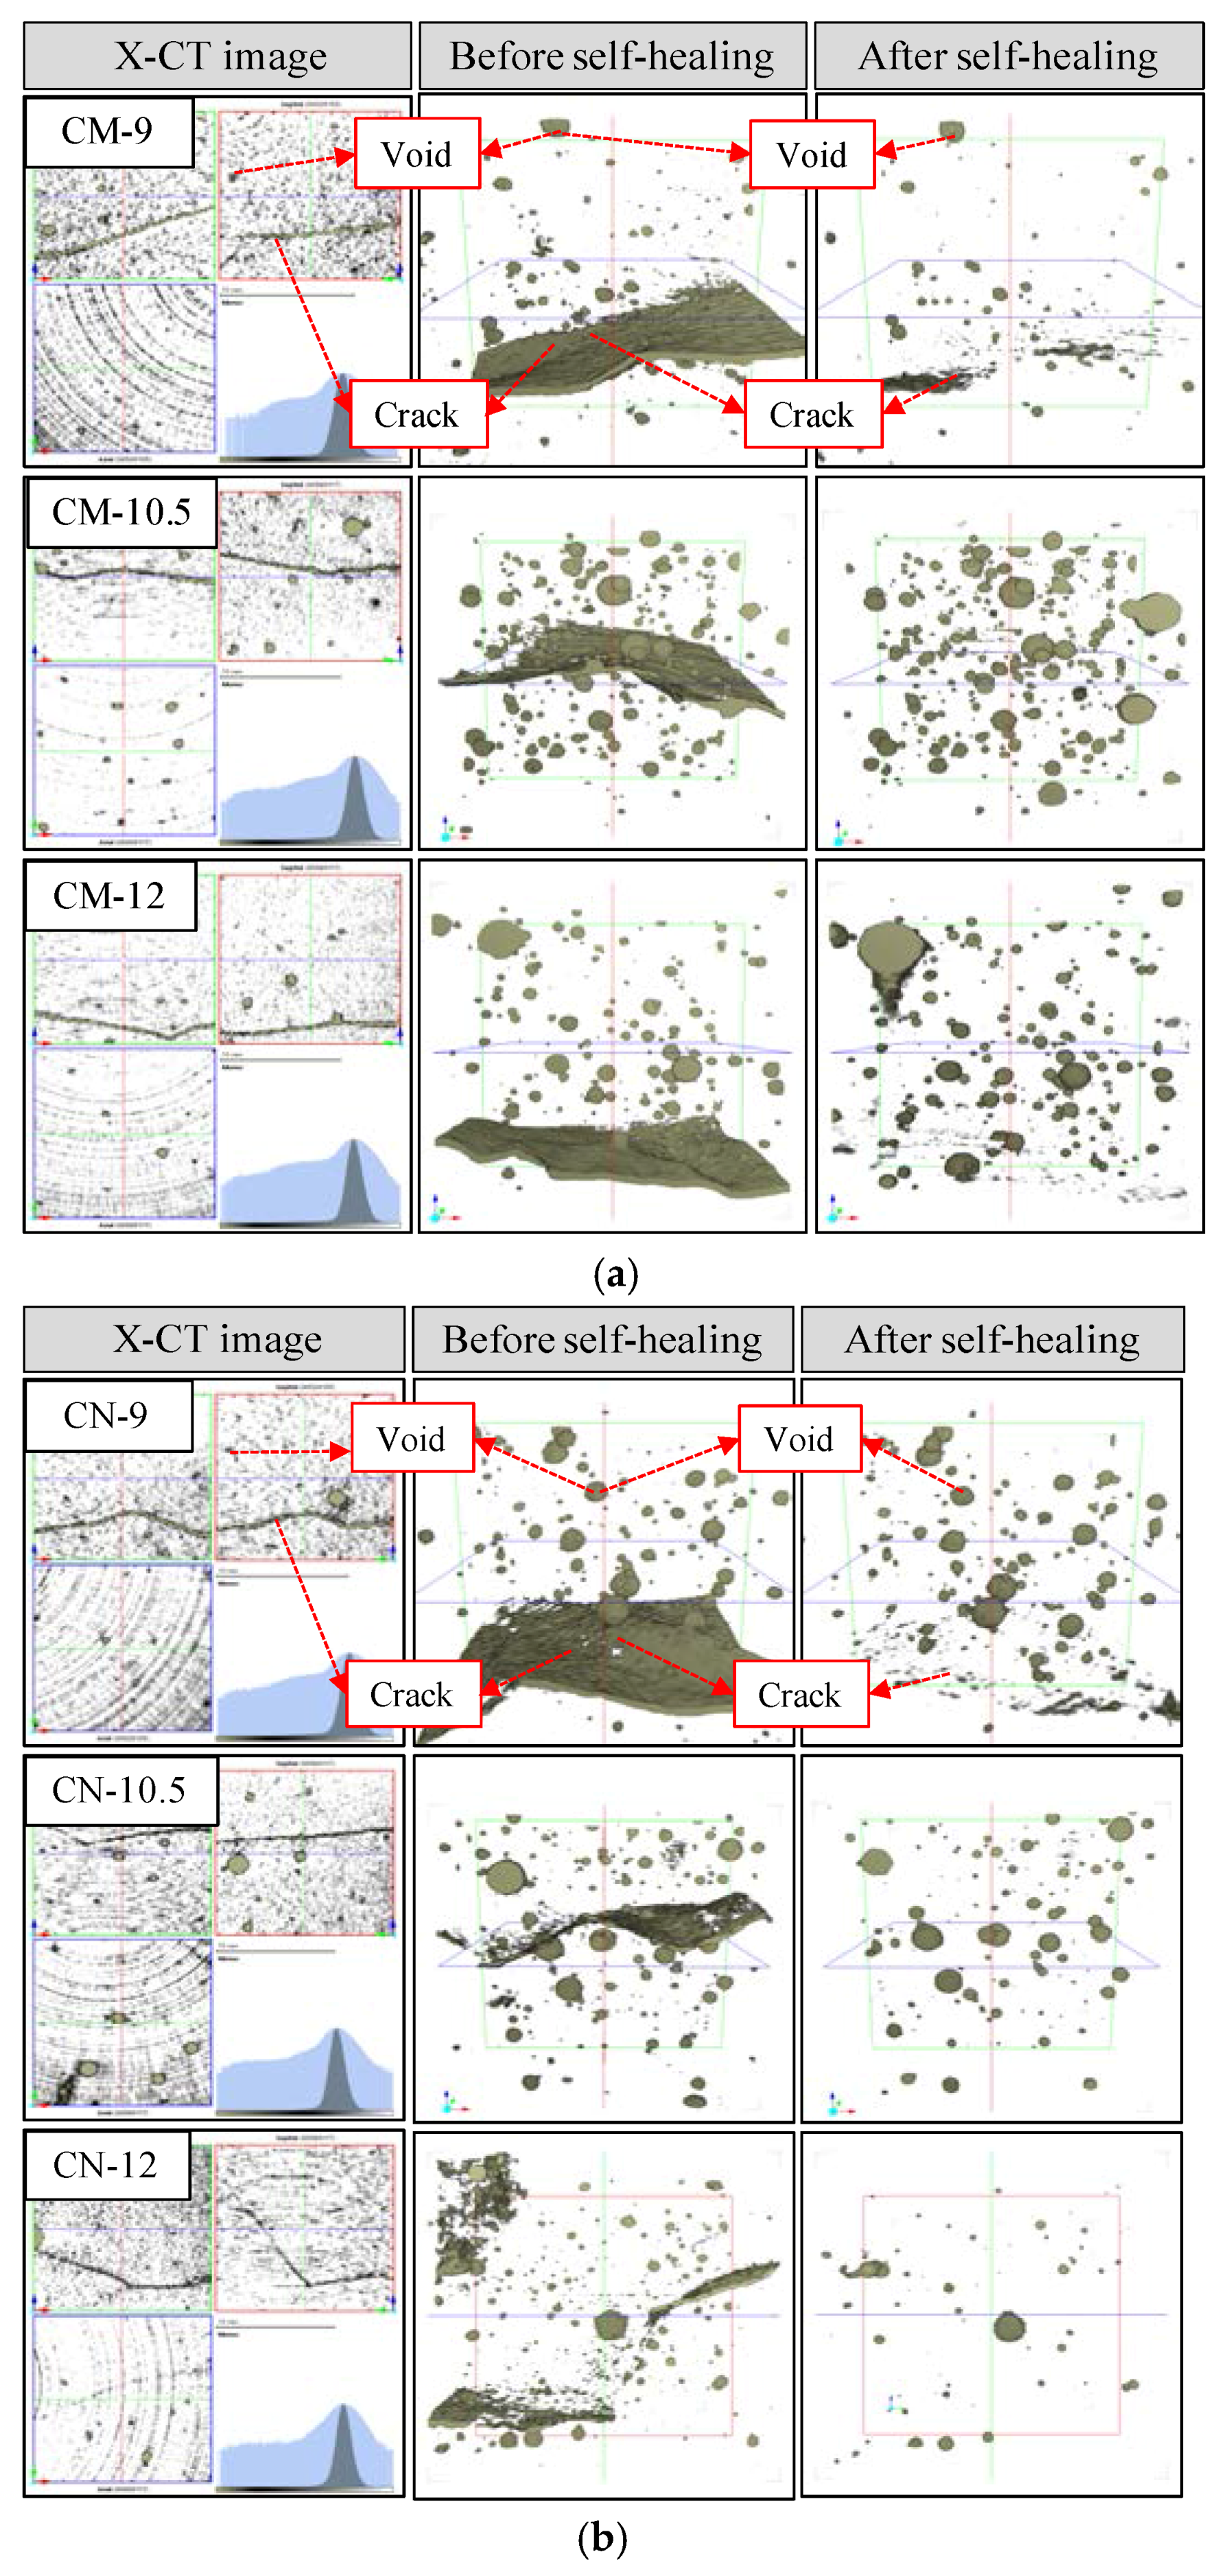
3.2.1. Volume Change in Cracked Section

To observe the progression of self-healing inside a crack, the crack interior in a test body was monitored using microfocus X-ray CT scans. An X-ray of 40 µA at 180 kV was employed, and the screen analysis domain for the X-ray CT scans was set as shown in Figure 8. The three-dimensional (3D) images obtained for each test body were composed of voxels, and the crack width and volume of the cracked section were calculated by using these voxels (Figure 8) [28] (While a pixel (short for “picture element”) is defined by a two-dimensional (2D) coordinate and the value of a data point (e.g., luminance, color) at that coordinate, a voxel (short for “volume element”) is defined by a 3D coordinate and the value of a data point (e.g., luminance, color) at that coordinate).
A conceptual histogram of the luminance and frequency of the 3D screen is shown in Figure 9, where the boundary in luminance between a void and the material (cement matrix) is clearly differentiated by the normal distribution of each peak. The total volume of the pores could be calculated because the cracked section before self-healing had the same density as that of the void. The volume changes of the voids in the cracked section before and after self-healing were compared and evaluated by calculating the difference between the density of the section with voids and that of the section filled by precipitates.
The volume change recorded in the section with voids before and after self-healing in each test body are shown in Figure 10 as a function of the self-healing temperature (20, 40, and 60 °C) at a constant pH of 9.0. A comparison of the volume after step B with the volume after step A shows that the volume of the section with voids decreased in both test bodies after self-healing at 20 °C, dropping by about 50% (from 1.11% to 0.56%) in CM-20 and by about 60% (from 1.60% to 0.71%) in CN-20. When self-healing took place at 40 °C, the section with voids also decreased in volume by about 65% (from 2.41% to 0.89%) in CM-40 and by about 85% (from 2.42% to 0.39%) in CN-40. After self-healing at 60 °C, the volume of the section with voids decreased by about 40% (from 2.1% to 1.11%) in CM-60 and by about 60% (from 1.25% to 0.53%) in CN-60. These results show that the volume of the section with voids experienced 15%–20% more reduction in the CN series than in the CM series, and the reduction rate of the volume of the section with voids decreased with a self-healing temperature in the order of 40 > 20 > 60 for all series. Therefore, the supply of nanobubbles was more advantageous for self-healing (CN series) than the supply of microbubbles (CM series), and the self-healing temperature of 40 °C was more advantageous than the temperatures of 20 and 60 °C.
Figure 11 shows the volume change in the section with voids as a function of the pH (9.0, 10.5, and 12.0) before and after self-healing at a constant temperature of 40 °C. The volume changed by about 60% (from 2.41% to 0.89%) in CM-9.0 and by about 85% (from 2.42% to 0.39%) in CN-9.0 when the pH was set at 9.0. When self-healing took place at a pH of 10.5, the volume of the section with voids decreased by about 40% (from 2.22% to 1.34%) in CM-10.5 and by about 60% (from 1.5% to 0.56%) in CN-10.5. When the pH was set at 12.0, the volume of the section with voids decreased by about 45% (from 2.21% to 1.18%) in CM-12.0 and by about 80% (from 0.92% to 0.2%) in CN-12.0. These results indicate that the void volume decreased with a pH in the order of 12.0 > 9.0 > 10.5 at a self-healing temperature of 40 °C; according to the literature, these conditions are known to be advantageous for the generation of vaterite [24]. Furthermore, the volume reduction was about 20%–25% higher in the CN series than in the CM series, indicating that the supply of nanobubbles with CO32− ions was more effective for self-healing than the supply of microbubbles.
Figure 12 and Figure 13 show X-ray CT images of cracks before and after self-healing at different temperatures and pH values. By combining the luminance of the CT images and the difference in the density of the cement-paste test bodies, the images appear dimmer: the lower the density, the darker the image [28]. The green, red, and blue colors on the left side (X-CT images) of the figure represent the front face, side face, and top face, respectively, in the image domain of the test bodies in the 2D images, while the histograms show the volume of the cement matrix and section with voids (voids + cracks) [1]. Since there were no marked changes in the void structures before and after self-healing, as revealed by the analysis of the 3D images in Figure 12 and Figure 13, most of the volume reduction in the section with voids resulted from the closing of the crack by self-healing. It was thus concluded that when ultrafine nanobubbles containing CO32− ions were supplied with nanoscale Ca2+ ions of a saturated Ca(OH)2 solution at a controlled temperature and pH, the generation and precipitation of self-healing materials was promoted not only on the surface, but also inside the crack.

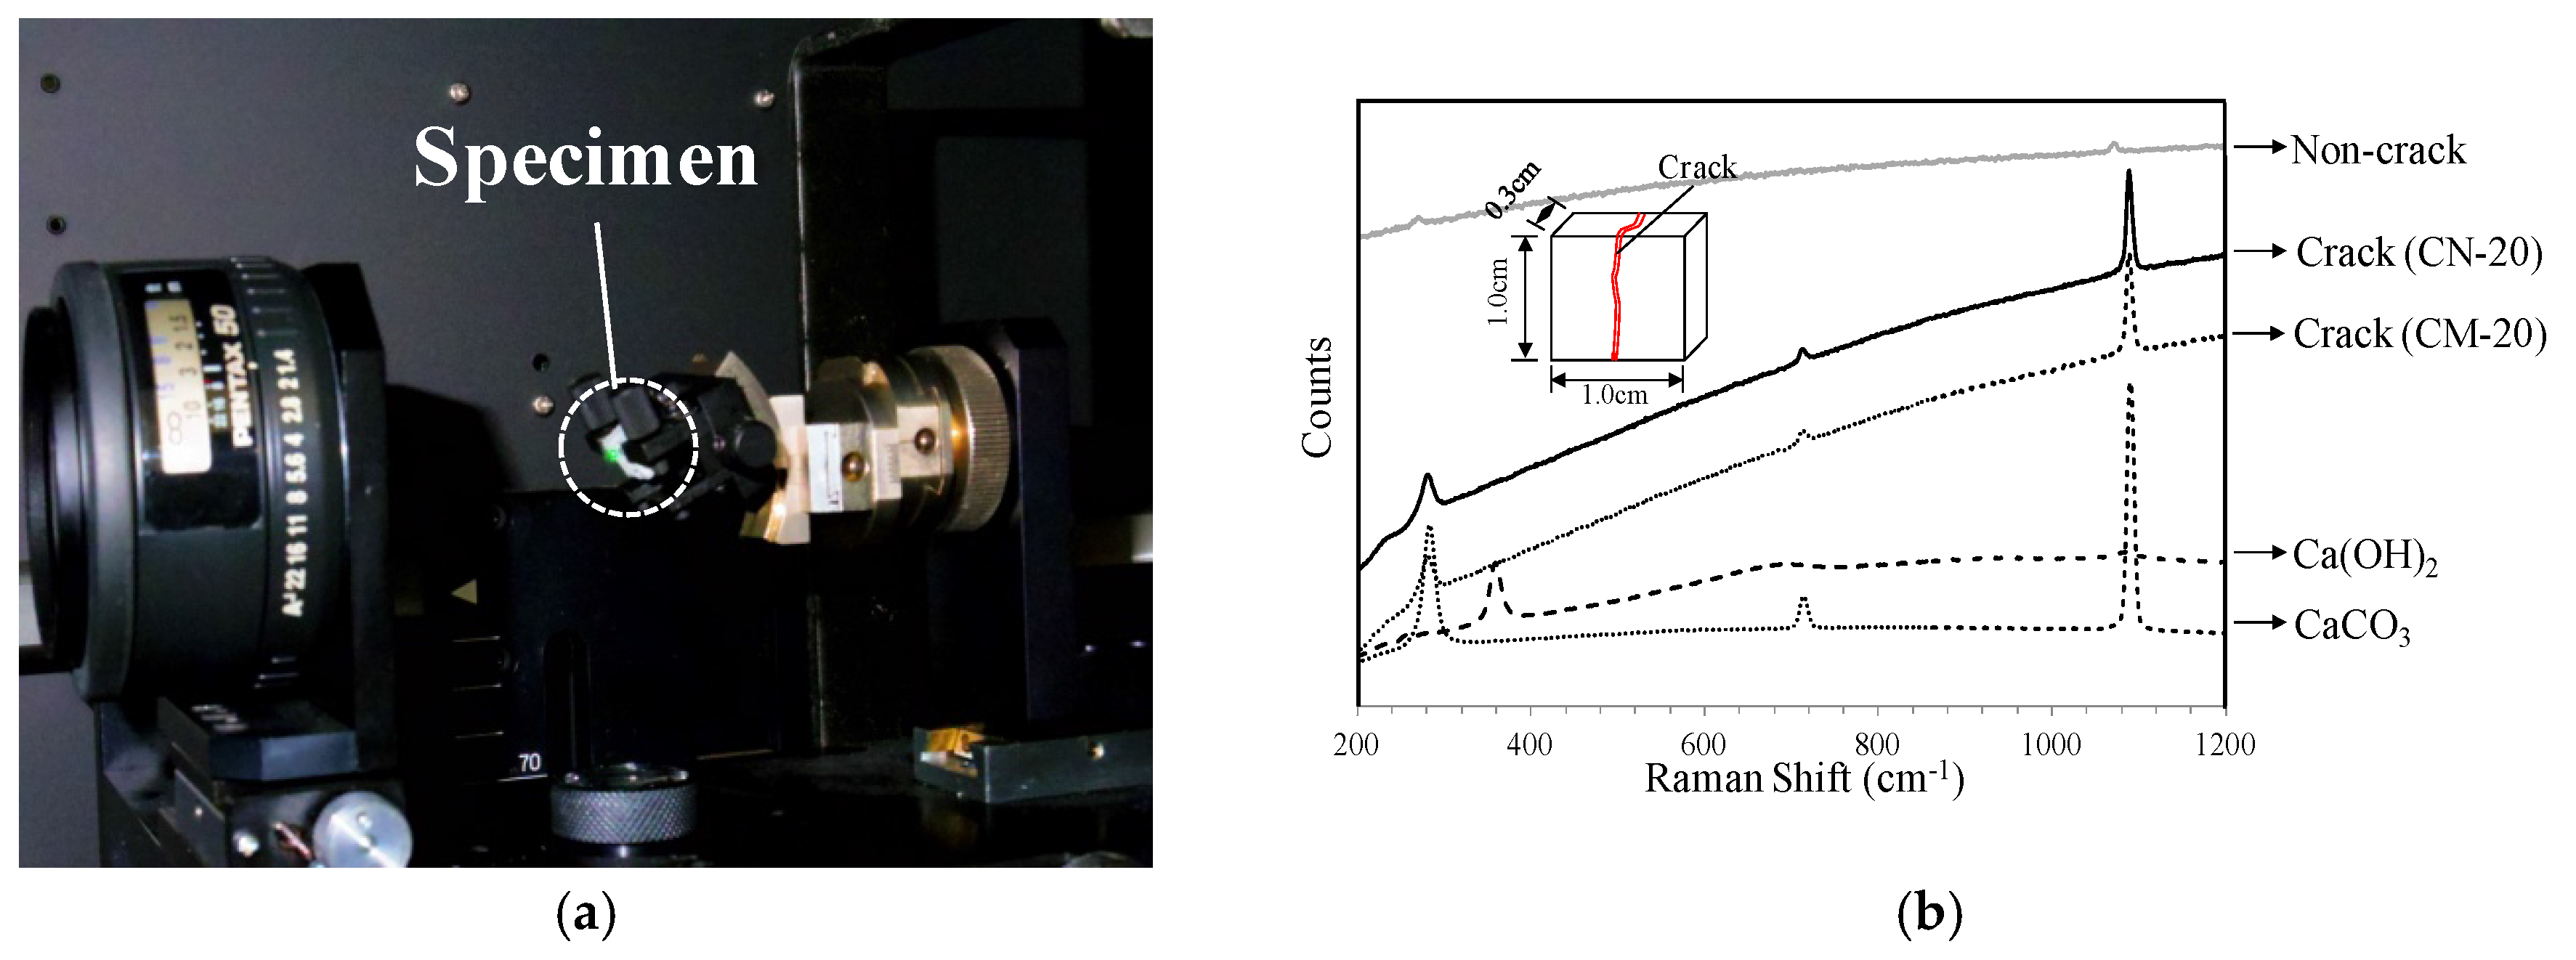
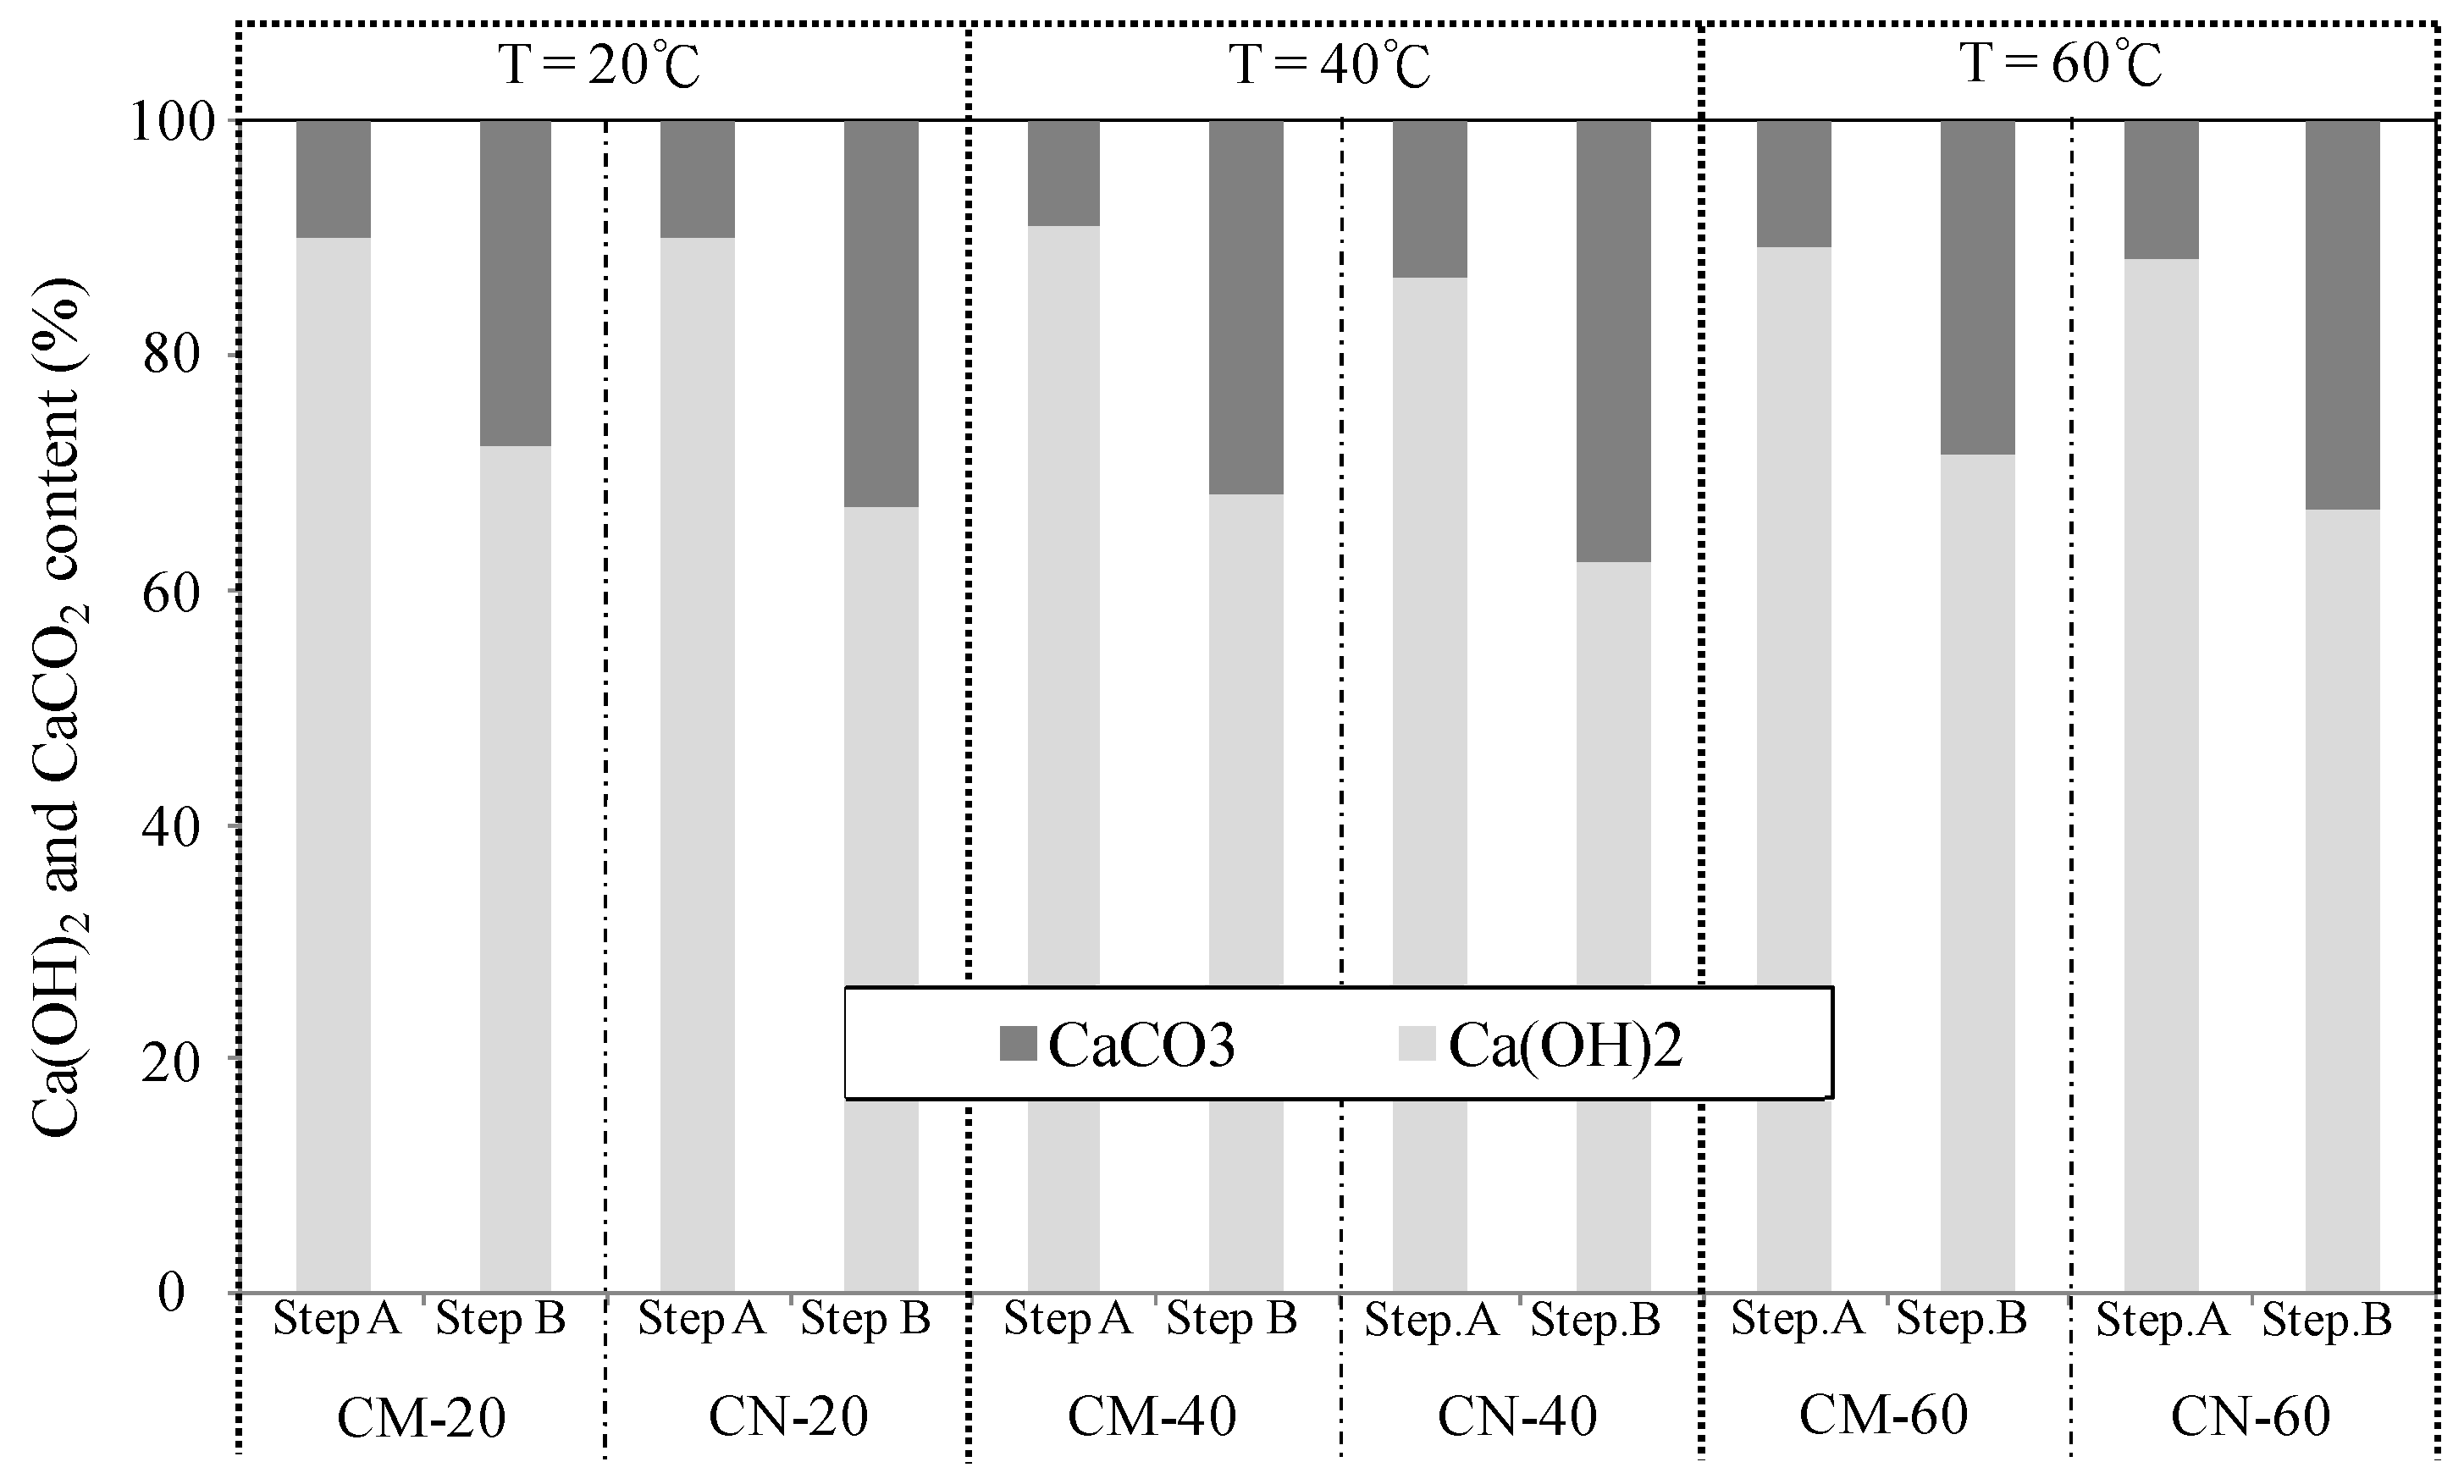
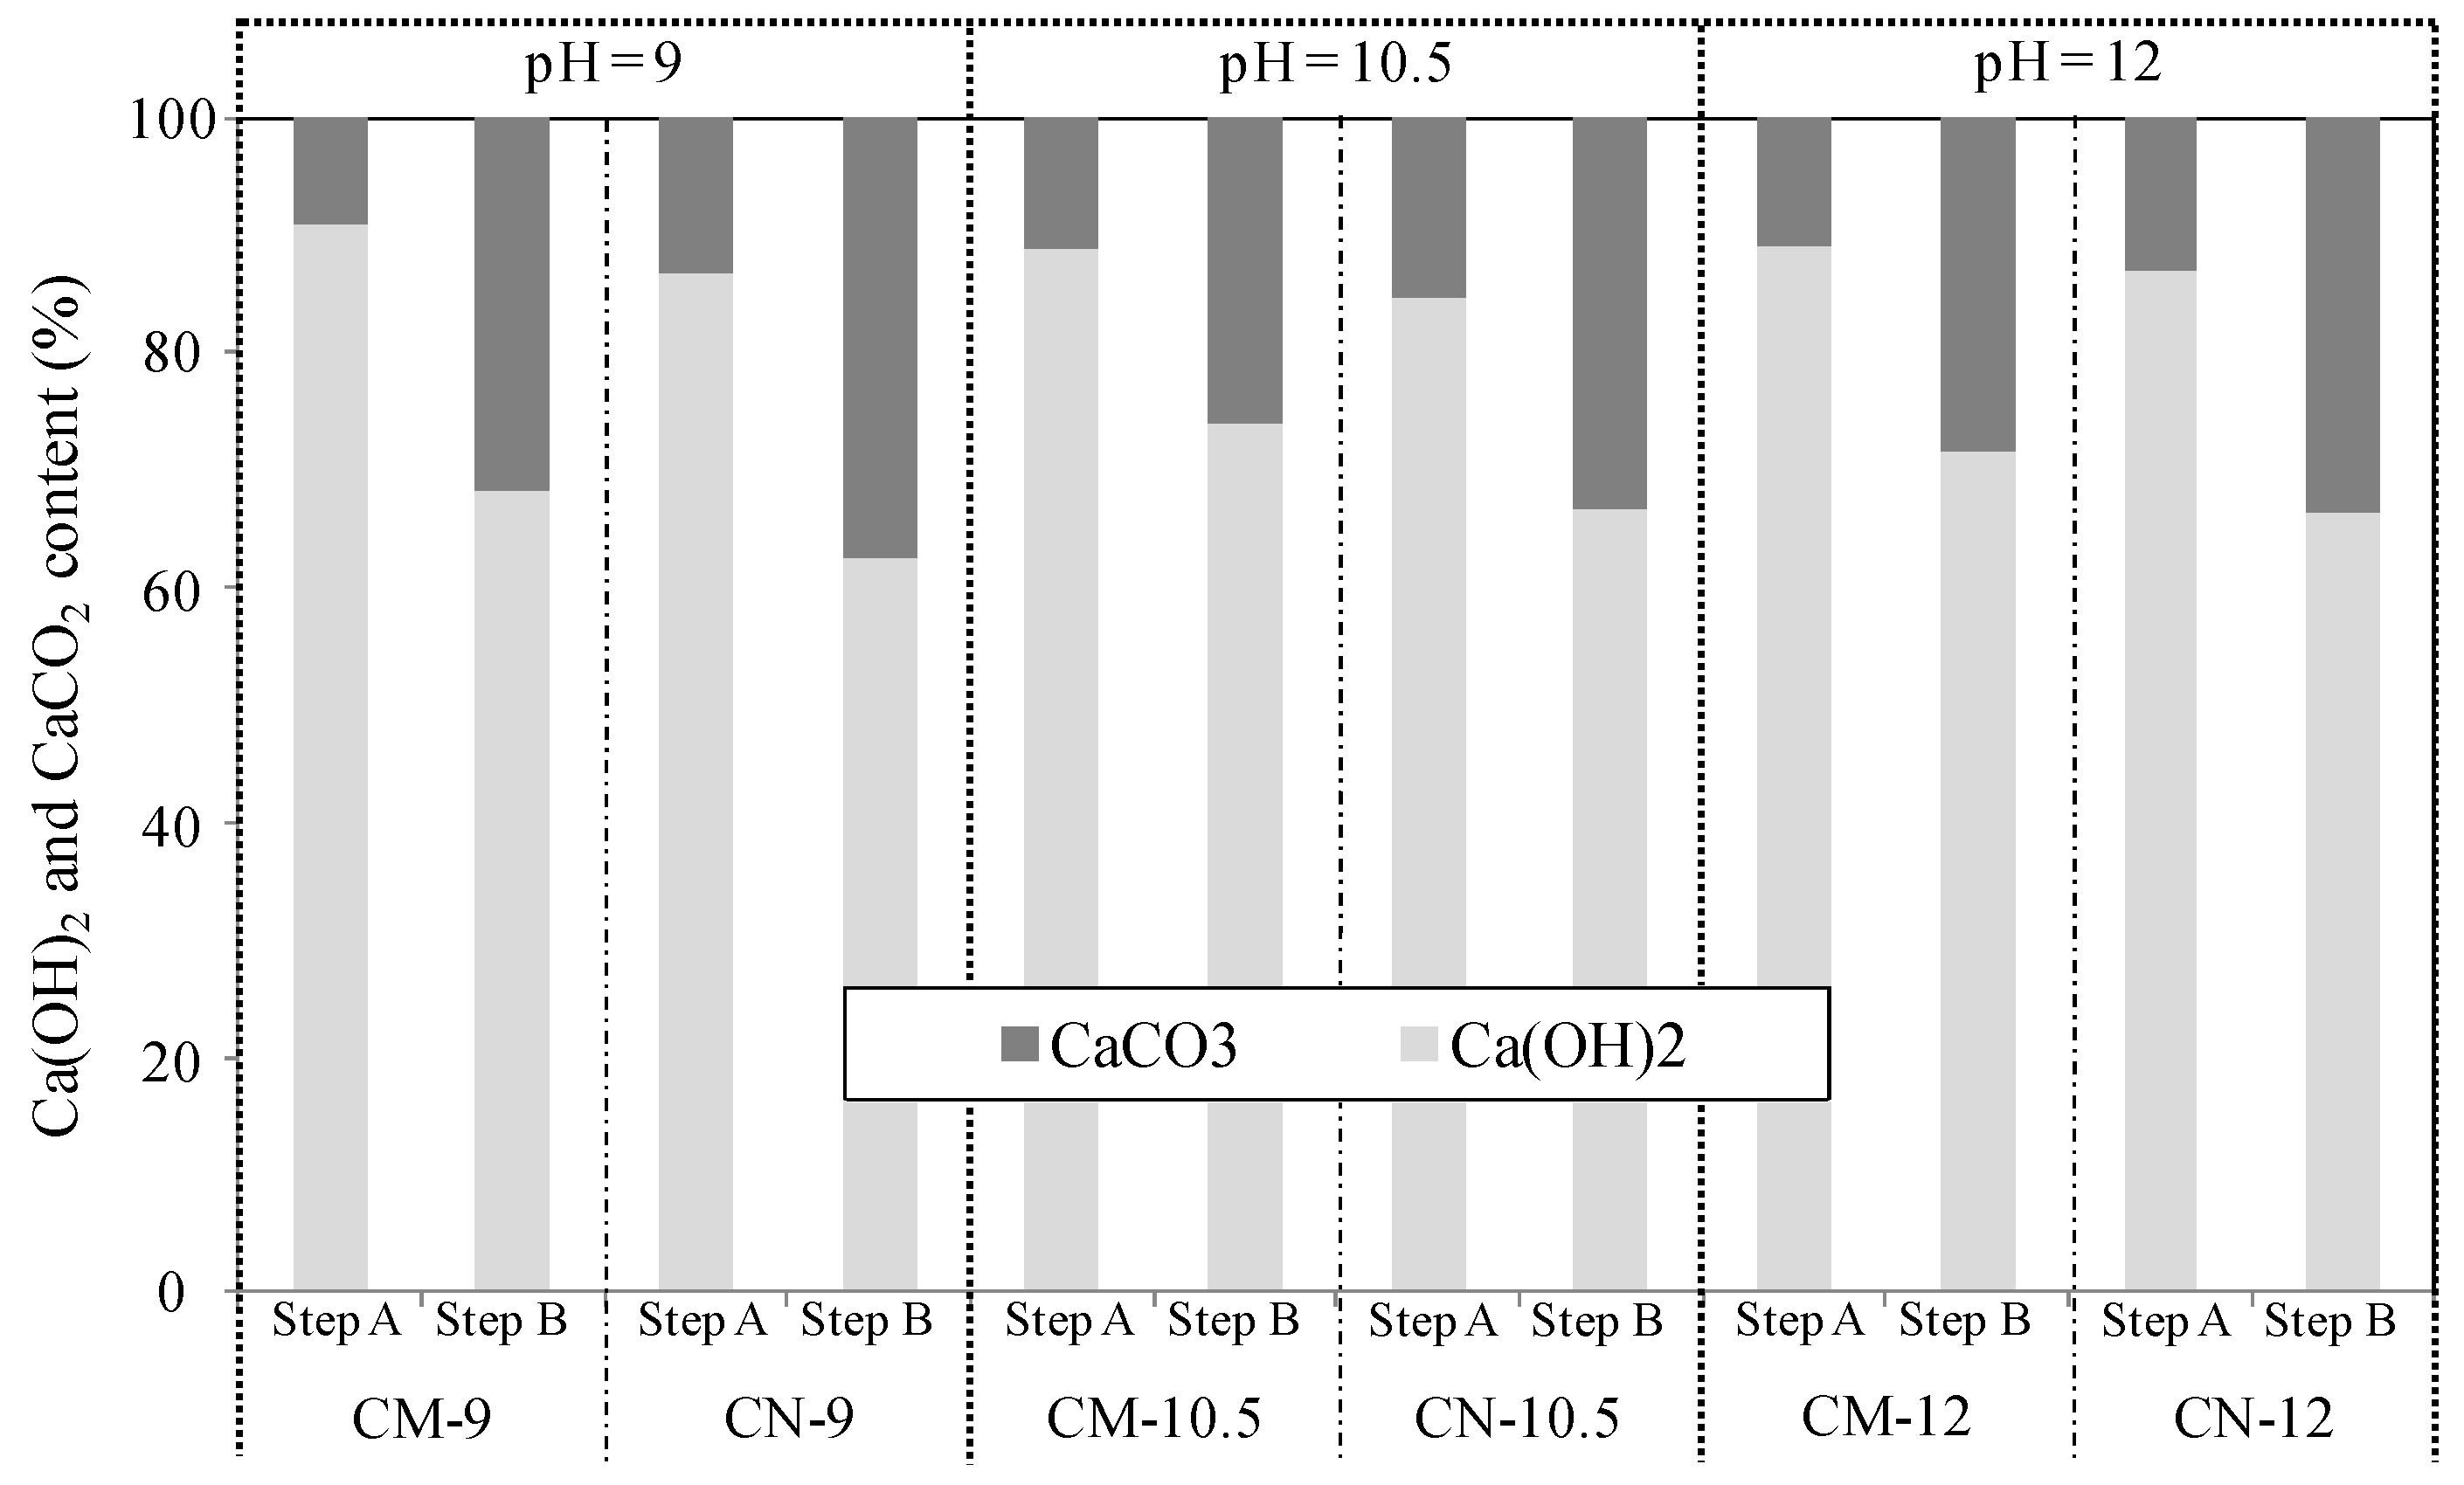
3.2.2. Chemical Evaluation of Self-Healing Precipitates

TG-DTA was carried out to quantitatively analyze the types and amounts of Ca(OH)2 and CaCO3 precipitated by self-healing on the surface and interior of cracks. The cracked section was almost severed from the cement matrix, as illustrated in Figure 14, and TG-DTA specimens were only collected from the cracked section of each test body.
Figure 15 and Figure 16 show the Ca(OH)2 and CaCO3 content in the cracked section before self-healing (step A) and after self-healing (step B) as functions of the self-healing temperature (20, 40, and 60 °C; constant pH of 9.0) and pH (9.0, 10.5, and 12.0; constant temperature of 40 °C).
As can be seen in Figure 15, when the self-healing temperature was set at 20 °C, the Ca(OH)2 and CaCO3 content changed by about 20% in CM-20 (which was immersed in a Ca(OH)2 solution with CO2 microbubbles) and by about 25% in CN-20 (which was immersed in a Ca(OH)2 solution with CO2 nanobubbles). When the self-healing temperature was set at 40 °C, the Ca(OH)2 and CaCO3 content changed by about 25% in CM-40 and by about 30% in CN-40. After self-healing at 60 °C, the Ca(OH)2 and CaCO3 content changed by about 15% in CM-60 and by about 20% in CN-60. In a parallel experiment, the pH of the Ca(OH)2 solution was varied (9.0, 10.5, and 12.0), while the temperature was kept constant at 40 °C. As shown in Figure 16, the Ca(OH)2 and CaCO3 content changed by about 25% in CM-9.0 (which was immersed in a Ca(OH)2 solution with CO2 microbubbles) and by about 30% in CN-9.0 (which was immersed in a Ca(OH)2 solution with CO2 nanobubbles) when self-healing took place at a pH of 9.0. When the self-healing pH was set at 10.5, the Ca(OH)2 and CaCO3 content changed by about 15% in CM-10.5 and by about 20% in CN-10.5. After self-healing took place at a pH of 12.0, the Ca(OH)2 and CaCO3 content changed by about 20% in CM-12.0 and by about 25% in CN-12.0. Overall, the amount of Ca(OH)2 after self-healing (step B) was lower than that before self-healing (step A), whereas the amount of CaCO3 increased, regardless of the temperature and pH of the Ca(OH)2 solution that supplied the CO32− ions for self-healing. This suggests that the Ca2+ ions from Ca(OH)2 accumulated not only on the surface of the cement paste, but also in the cracked section, and reacted with CO32− ions to produce a large amount of CaCO3 via self-healing [1]. In addition, the CN series of test bodies had a somewhat higher CaCO3 content than that in the CM series. When the pH was adjusted to remain constant at 9.0, the amount of CaCO3 generated decreased with a temperature in the order of 40 > 20 > 60 °C; when the temperature was adjusted to remain constant at 40 °C, the amount of CaCO3 generated decreased with a pH in the order of 9.0 > 12.0 > 10.5. This means that the filling rate of self-healing precipitates was the highest, i.e., self-healing was the most effective at 40 °C and a pH of 9.0 [24,25].

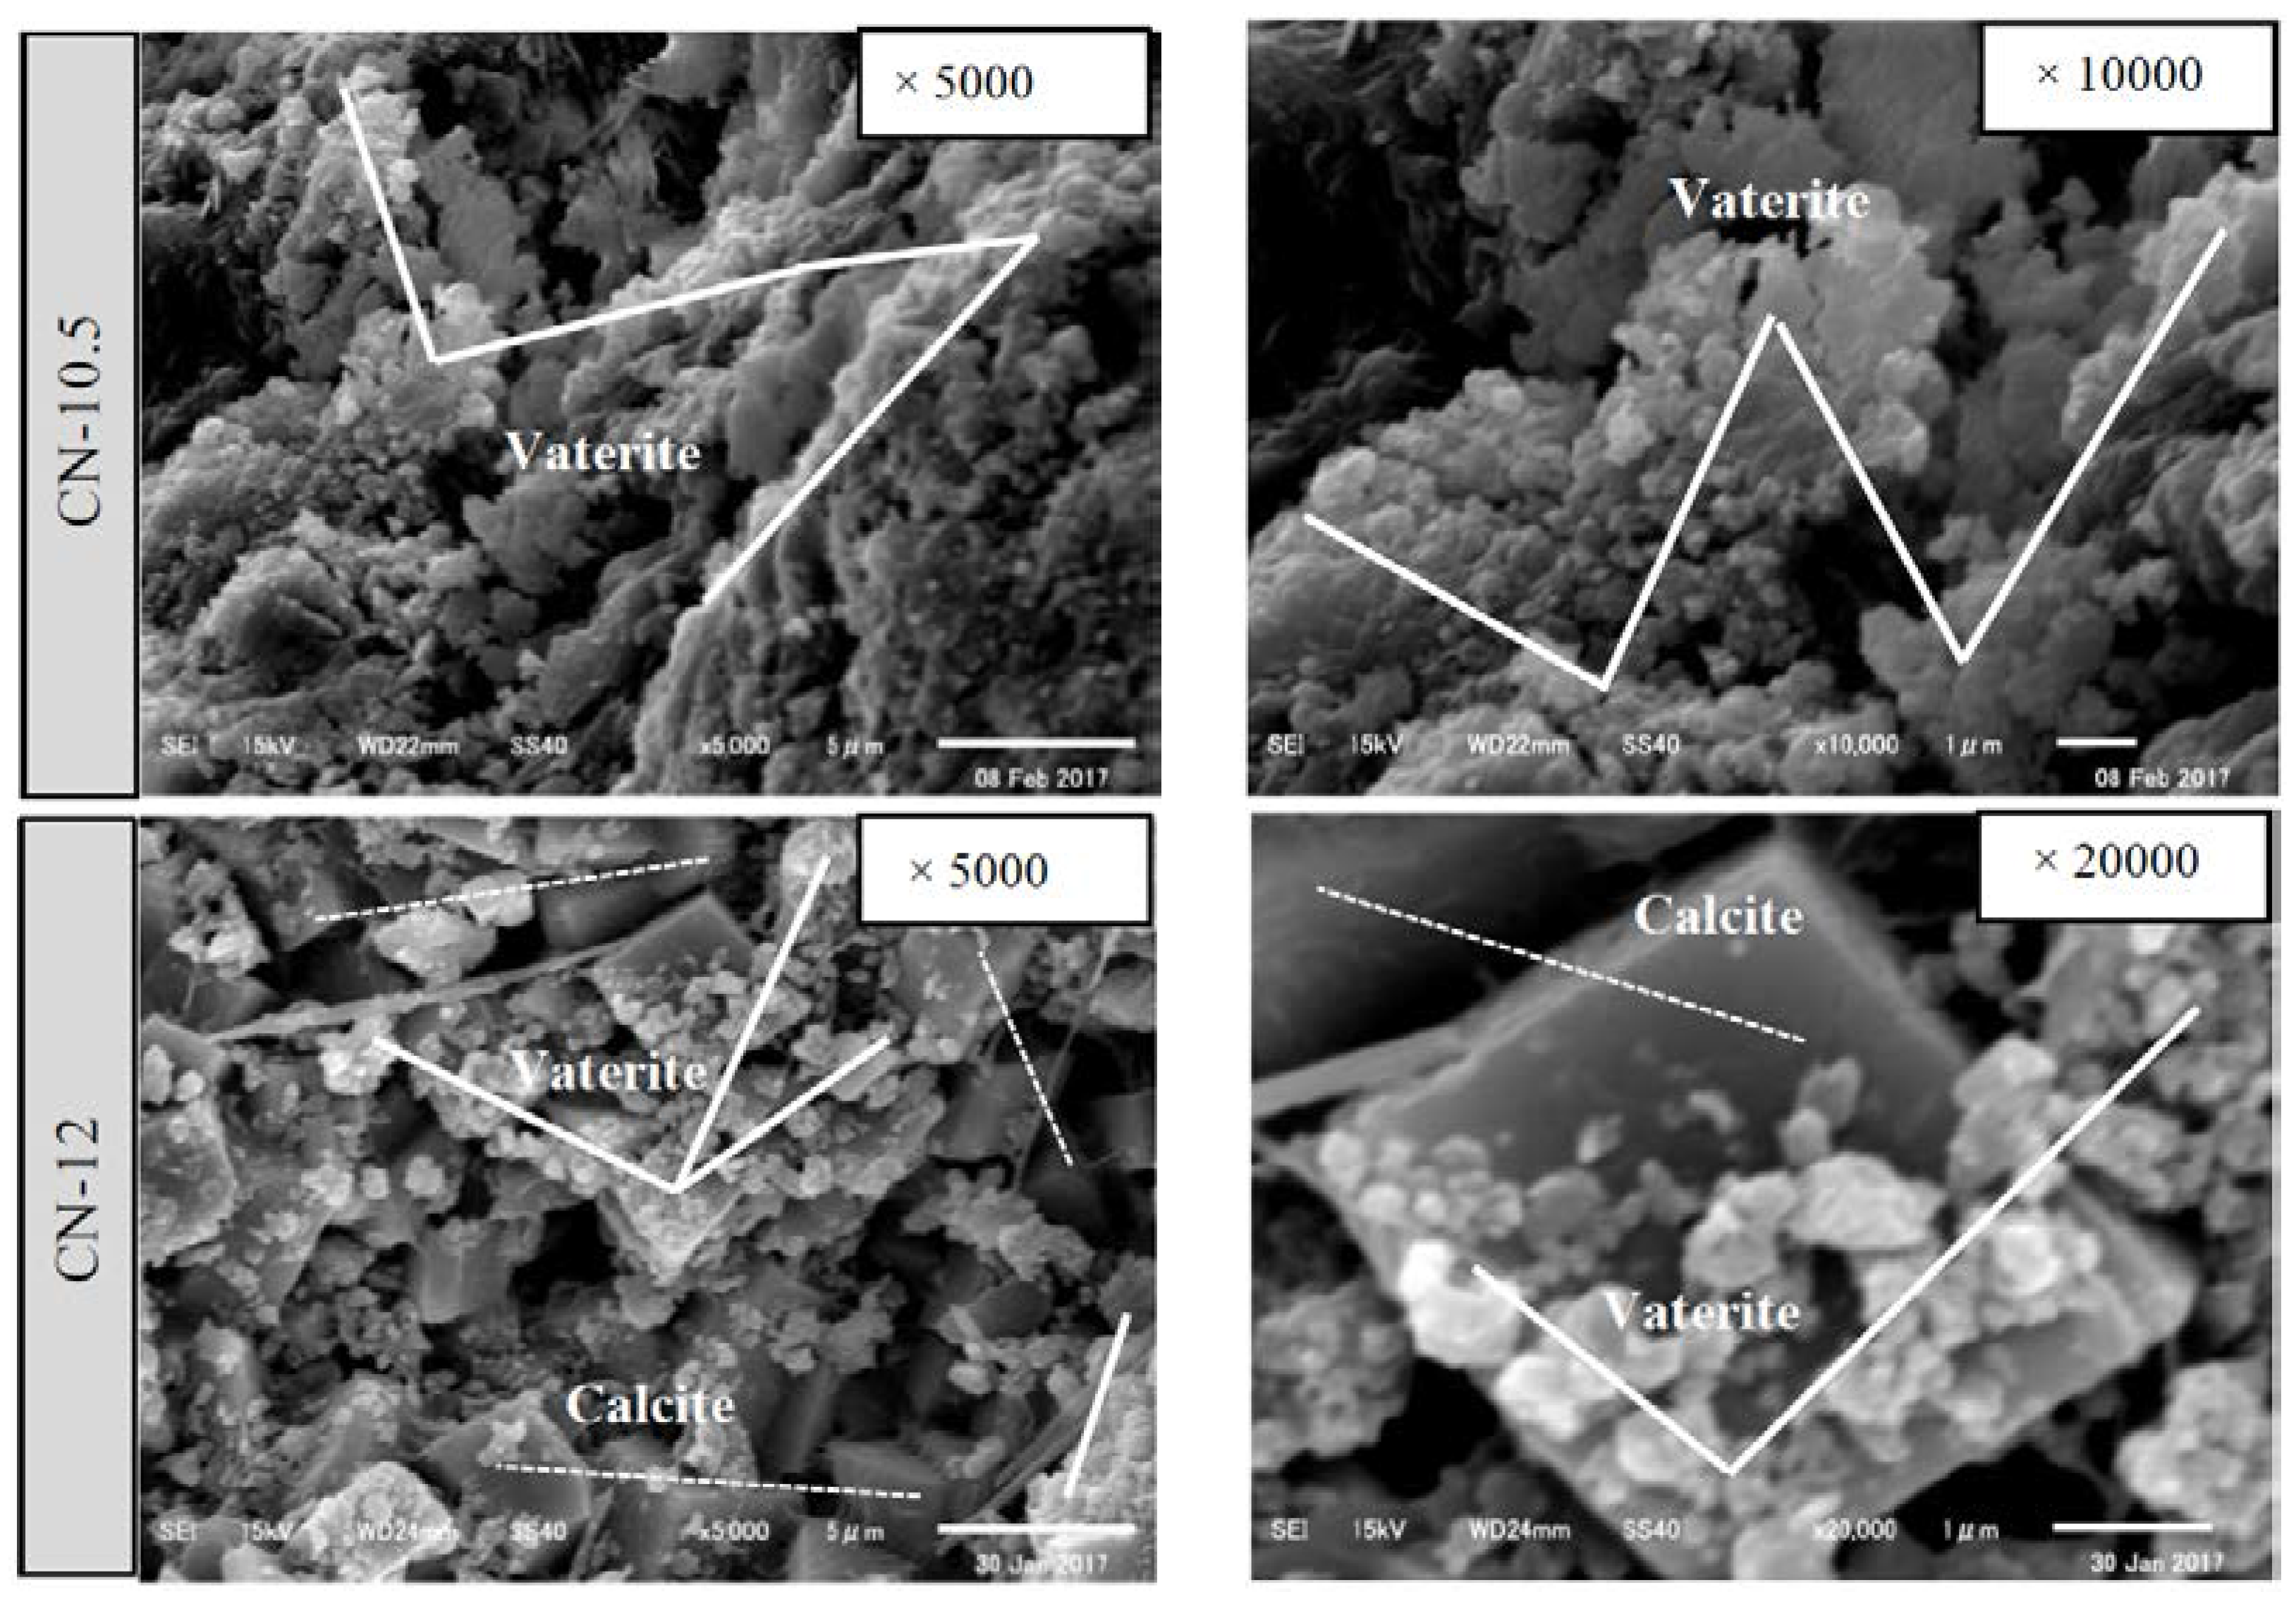
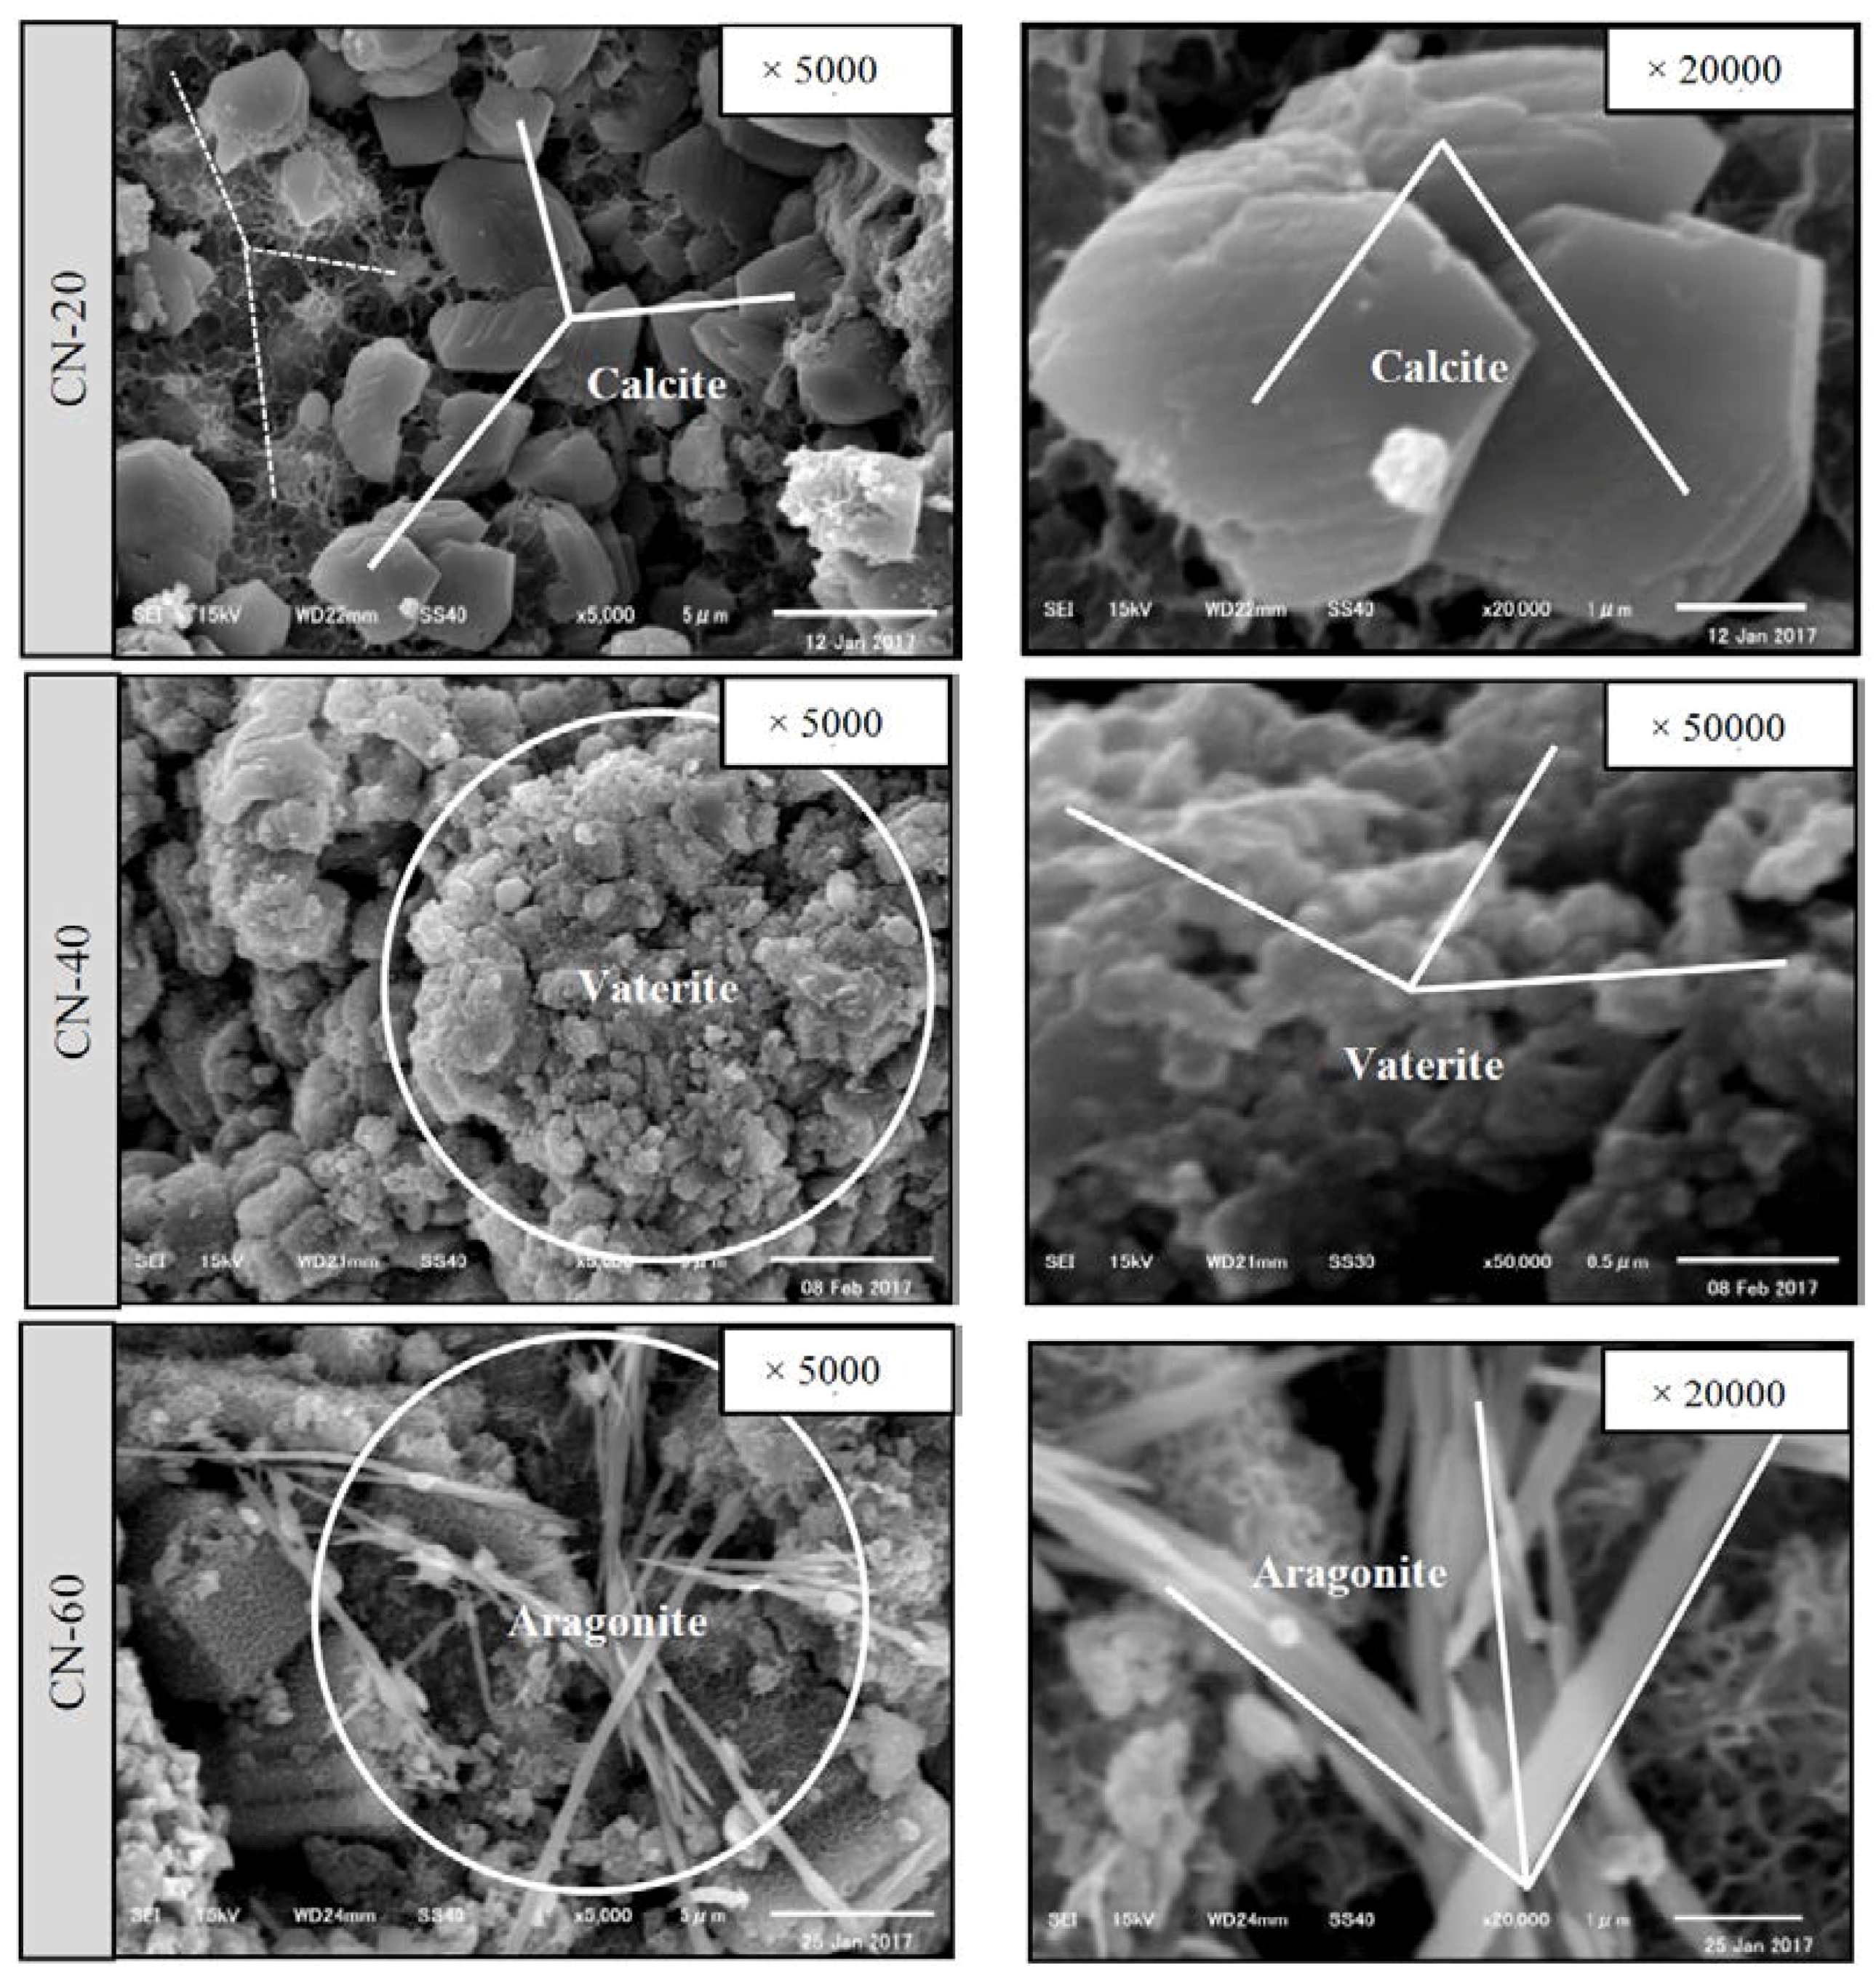
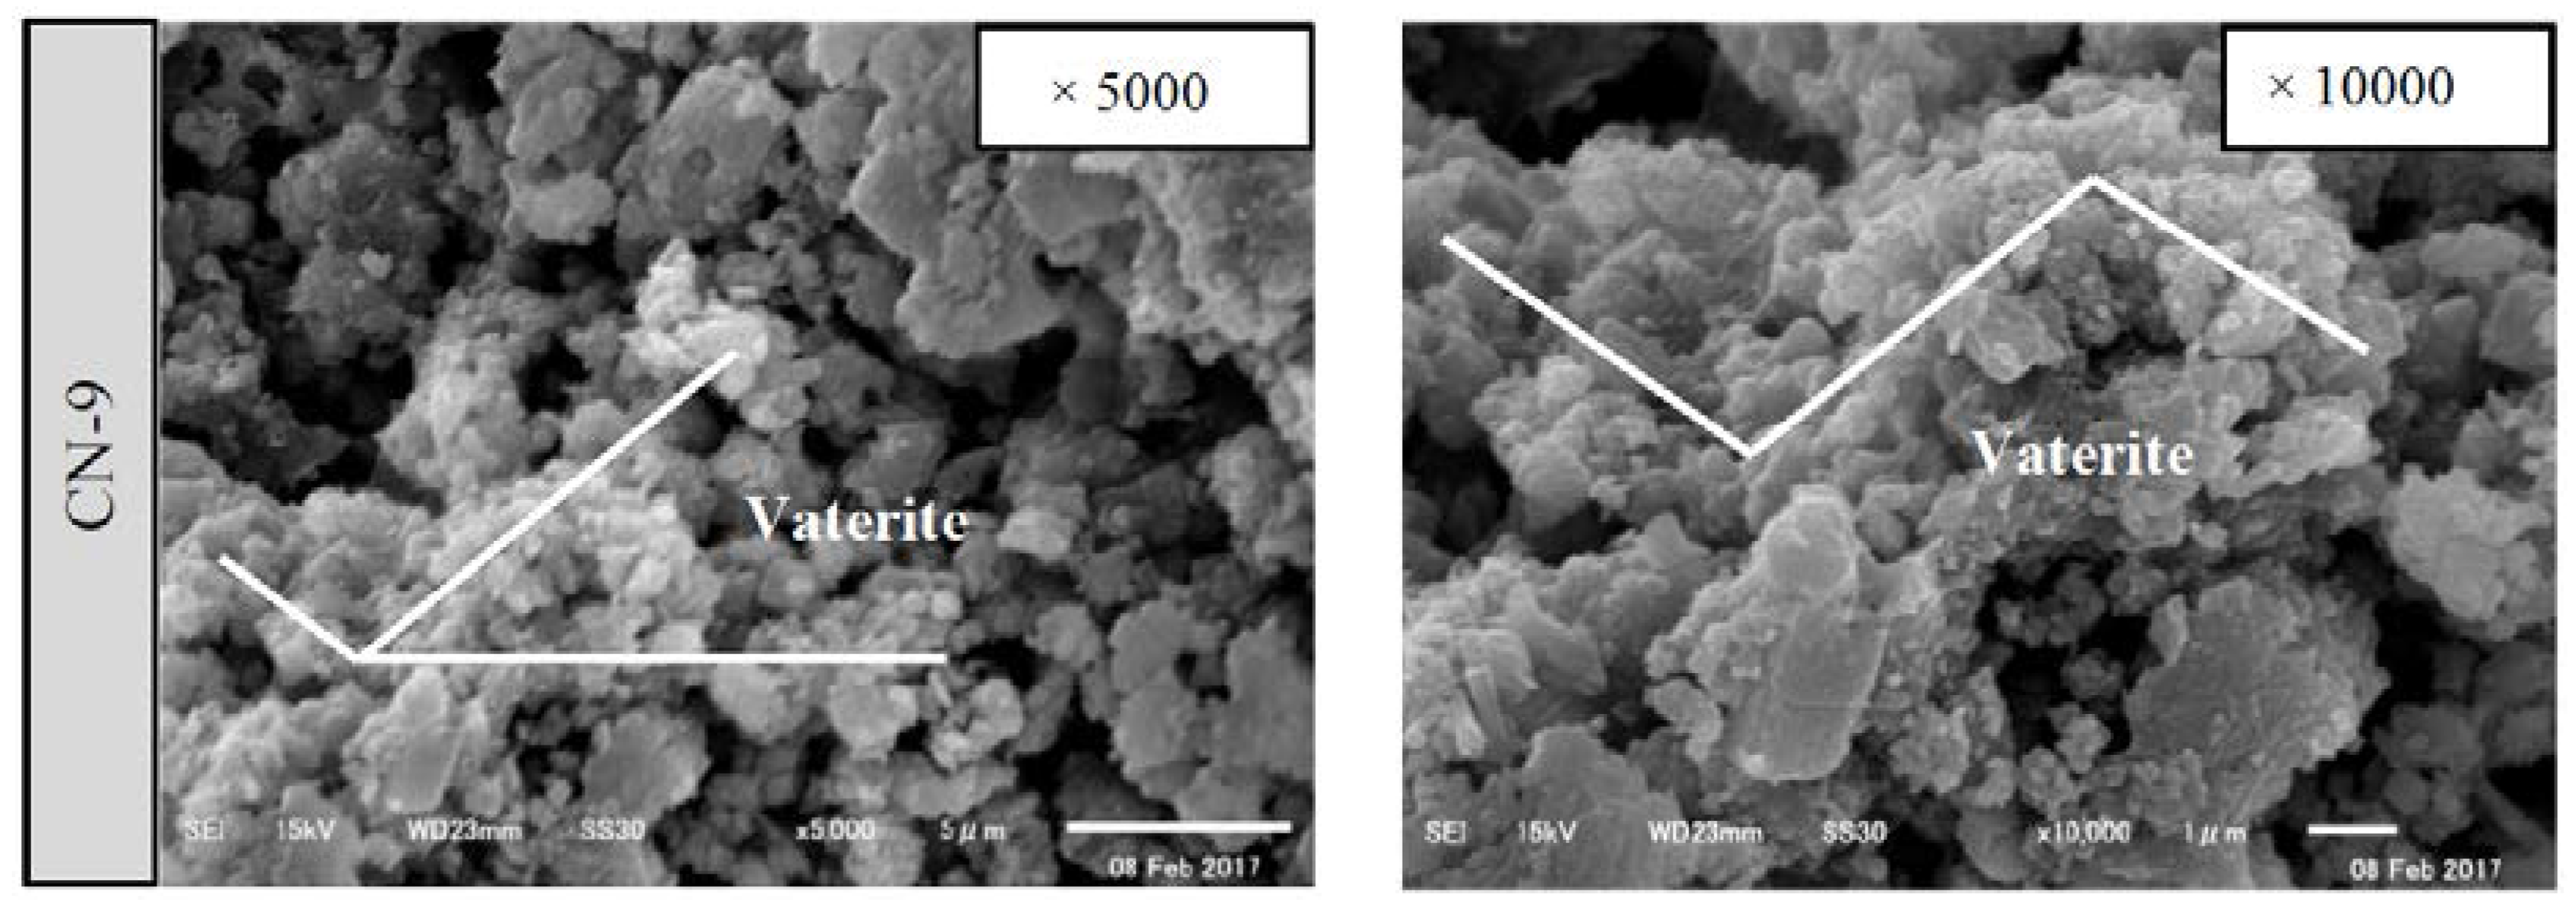
3.2.3. Crystallographic Change in Calcium Carbonate Compound (CaCO3)

To check for the possibility of generating vaterite as a denser calcium carbonate crystal and controlling its formation by regulating the temperature or pH, SEM analysis was conducted on the CN series of test bodies under each self-healing condition. The SEM with a probe diameter of 0.5–5 µm was operated at an accelerating voltage of 15 kV. Figure 17 and Figure 18 show SEM images of self-healing precipitates generated at different temperatures (20, 40, and 60 °C) and pH values (9.0, 10.5, and 12.0). The images suggest that calcite was formed at 20 °C, vaterite was formed at 40 °C, and aragonite was formed at 60 °C when the pH was set at 9.0 (Figure 17) [24,25,29]. These values represent the optimum temperature for generating a large amount of vaterite; they also suggest that the type of CaCO3 crystals can be controlled by changing the self-healing temperature. Although the generation of vaterite was affirmed in all cases, the pH value is believed to have some effect on the CaCO3 crystals when the self-healing temperature was kept constant at 40 °C (Figure 18) [24,29]. The current experimental results suggest that temperature had a greater effect than pH on the type of CaCO3 crystals generated during self-healing. In particular, for the sample CN-40-9.0 (immersed in Ca(OH)2 solution with a temperature of 40 °C and pH of 9.0), Ca(OH)2 was not observed among the hydrated products, and the amount of generated vaterite attached to the surface was the largest, along with a large amount of C–S–H gel. Hence, based on the findings of reported studies, the controlled generation of vaterite as a denser crystal was possible by setting the temperature to 40 °C and the pH to 9.0 [24,25].

4. Conclusions

This study investigated the possibility of generating and controlling denser self-healing materials through the control of the polymorph formation in cement-based composite materials. The study focused on crystals of CaCO3 generated in the self-healing process of cement-paste test bodies; CO32− ions and nanoscale ultrafine CO2 bubbles flowed from a Ca(OH)2 solution into the cracks in hardened cement paste as the temperature and pH of the solution were controlled. The results of the investigation into more effective self-healing and optimum self-healing conditions are summarized as follows:
(1) Under the self-healing conditions provided by a saturated Ca(OH)2 solution with a supply of CO2 microbubbles and nanobubbles, the additional supply of Ca2+ ions and CO32− ions to the cracked section of hardened cement paste is believed to have further promoted the reaction that generated CaCO3. The use of the cement material alone was confirmed to enable more effective self-healing inside and outside relatively large cracks with widths above 0.1 mm.
(2) According to the TG-DTA and SEM analysis results, the temperature had a bigger impact than the pH on the change from calcite to vaterite among the CaCO3 crystals.
(3) By controlling the water temperature at 40 °C and the pH at 9.0, as well as suppling ultrafine nanoscale bubbles (average particle diameter of 50 nm) together with CO32− ions in a saturated Ca(OH)2 solution, it was possible to generate vaterite, thus enabling densification of the cement matrix as the voids were filled. These optimized self-healing conditions also allowed the control of the formation of vaterite.

Acknowledgments

This research was supported by the young researcher program through the LIXIL 2016 of Japan funded by LIXIL.

Author Contributions

Heesup Choi and Hyeonggil Choi conceived and designed the experiments; Heesup Choi, Masumi Inou, Hyeonggil Choi, and Risa Sengoku performed the experiments; Heesup Choi, Masumi Inou, Hyeonggil Choi, and Risa Sengoku analyzed the data. All authors contributed in manuscript preparation and participated in revising the article critically for important intellectual content.

Conflicts of Interest

The authors declare no conflict of interest.

References

  1. Choi, H.S.; Inoue, M.; Kwon, S.M.; Choi, H.G.; Lim, M.K. Effective crack control of concrete by self-healing of cementitious composites using synthetic fiber. J. Mater. 2016, 9, 1–14. [Google Scholar] [CrossRef]
  2. Japan Concrete Institute. Practical Guideline for Investigation, Repair and Strengthening of Cracked Concrete Structure; Japan Concrete Institute: Tokyo, Japan, 2013. (In Japanese) [Google Scholar]
  3. Jacobson, S. Effect of cracking and healing on chloride transport in OPC concrete. Cem. Concr. Res. 1996, 26, 869–881. [Google Scholar] [CrossRef]
  4. Romildo, D.; Filho, T. Free, restrained and drying shrinkage of cement mortar composites reinforced with vegetable fibers. Cem. Concr. Compos. 2005, 27, 537–546. [Google Scholar]
  5. Wang, K.; Jansen, D.C.; Shah, S.P. Permeability study of cracked concrete. Cem. Concr. Res. 1997, 27, 381–393. [Google Scholar] [CrossRef]
  6. Khatri, R.P.; Sirivivatnanon, V. Role of permeability in sulfate attack. Cem. Concr. Res. 1997, 27, 1179–1189. [Google Scholar] [CrossRef]
  7. Neville, A.M. Properties of Concrete; Person Education Limited: London, UK, 1995; p. 328. [Google Scholar]
  8. Sanjun, M.A. Effectiveness of crack control at early age on the corrosion of steel bars in low modulus sisal and coconut fiber-reinforced mortars. Cem. Concr. Res. 1998, 28, 555–565. [Google Scholar] [CrossRef]
  9. Jacobsen, S. SEM Observations of the microstructure of frost deteriorated and self-healed concrete. Cem. Concr. Res. 1995, 25, 1781–1790. [Google Scholar] [CrossRef]
  10. Edvardsen, C. Water permeability and autogenous healing of cracks in concrete. ACI Mater. J. 1999, 96, 448–454. [Google Scholar]
  11. Nishiwaki, T.; Koda, M.; Yamada, M.; Mihashi, H.; Kikuta, T. Experimental study on self-healing capability of FRCC using different types of synthetic fibers. J. Adv. Concr. Technol. 2012, 10, 195–206. [Google Scholar] [CrossRef]
  12. Homma, D.; Mihashi, H.; Nishiwaki, T. Self-healing capability of fiber reinforced cementitious composites. J. Adv. Concr. Technol. 2009, 7, 217–228. [Google Scholar] [CrossRef]
  13. Gruyaert, E.; Van Tittelboom, K.; Sucaet, J.; Anrijs, J.; Van Vlierberghe, S.; Dubruel, P.; De Geest, B.G.; Remon, J.P.; De Belie, N. Capsules with evolving brittleness to resist the preparation of self-healing concrete. J. Mater. Const. 2016, 66, 1–13. [Google Scholar]
  14. Hilloulin, B.; Van Tittelboom, K.; Gruyaert, E.; De Belie, N.; Loukili, A. Design of polymeric capsules for self-healing concrete. Cem. Concr. Compos. 2015, 55, 298–307. [Google Scholar] [CrossRef]
  15. Jonkers, H.M. Bacteria-based self-healing concrete. Heron 2011, 56, 1–12. [Google Scholar]
  16. Fukuda, D.; Nara, Y.; Kobayashi, Y.; Maruyama, M.; Koketsu, M.; Hayashi, D.; Ogawa, H.; Kaneko, K. Investigation of self-sealing in high-strength and ultra-low-permeability concrete in water using micro-focus X-ray CT. Cem. Concr. Res. 2012, 42, 1494–1500. [Google Scholar] [CrossRef]
  17. Benoit, H.; Jean-Baptiste, L.; Elisabeth, L.; Odile, A.; Ahmed, L.; Frédéric, G.; Olivier, D.; Vincent, T. Monitoring of autogenous crack healing in cementitious materials by the nonlinear modulation of ultrasonic coda waves, 3D microscopy and X-ray microtomography. Constr. Build. Mater. 2016, 123, 143–152. [Google Scholar]
  18. Kishi, T.; Ahn, T.-H.; Hosoda, A.; Suzuki, S.; Takaoka, H. Self-healing behaviour by cementitious recrystallization of cracked concrete incorporating expansive agent. In Proceedings of the First International Conference on Self-Healing Materials, Noordwijk aan Zee, The Netherlands, 18–20 April 2007; pp. 1–10. [Google Scholar]
  19. Snoeck, D.; de Belie, N. Repeated autogenous healing in strain-hardening cementitious composites by using superabsorbent polymers. J. Mater. Civil Eng. 2015, 28, 1–11. [Google Scholar] [CrossRef]
  20. Snoeck, D.; Dewanckele, J.; Cnudde, V.; de Belie, N. X-ray computed microtomography to study autogenous healing of cementitious materials promoted by superabsorbent polymers. Cem. Concr. Compos. 2016, 65, 83–93. [Google Scholar] [CrossRef]
  21. Yang, Y.; Lepech, M.D.; Yang, E.-H.; Li, V.C. Autogenous healing of engineered cementitious composites under wet-dry cycles. Cem. Concr. Res. 2009, 39, 382–390. [Google Scholar] [CrossRef]
  22. Choi, H.-S.; Inoue, M.; Choi, H.-G.; Lim, M.-K.; Nishiwaki, T.; Kawajiri, S. The fundamental study of the crack control by self-healing of PVA fiber reinforced cementitious composites. J. Civil Eng. Archit. Res. 2016, 9(3), 1680–1688. [Google Scholar]
  23. Choi, H.-S.; Inoue, M.; Kamada, M.; Iwasawa, M. Microcrack control of cementitious materials by self-healing. In Proceedings of the 7th International Conference of Asian Concrete Federation 2016, Hanoi, Vietnam, 30 October–2 November 2016; pp. 1–8. [Google Scholar]
  24. Matsumoto, M. Polymorph control of calcium carbonate by reactive crystallization using microbubble technique. Chem. Eng. Res. Des. 2010, 88, 1624–1630. [Google Scholar] [CrossRef]
  25. Kojima, Y. Controls of polymorphism and morphology of calcium carbonate compounds formed by crystallizing amorphous calcium carbonate hydrate. J. Ceram. Soc. Jpn. 1994, 12, 1128–1136. (In Japanese) [Google Scholar] [CrossRef]
  26. Huang, H.; Ye, G. Self-healing of cracks in cement paste affected by additional Ca2+ ions in the healing agent. J. Intell. Mater. Sys. Struct. 2014, 27, 1–12. [Google Scholar] [CrossRef]
  27. Kim, H.-S. Fundamental study on recycling of low-quality recycled fine aggregate using carbonated nanobubble water. In Proceedings of the First International Conference on Concrete Sustainability, Tokyo, Japan, 27–29 May 2013. [Google Scholar]
  28. Taniguchi, S.; Otani, J.; Nishizaki, I. A study on the new evaluation method for asphalt pavement materials using X-ray CT scanner. Jpn. Soc. Civil Eng. J. Pavement Eng. 2010, 15, 41–48. (In Japanese) [Google Scholar]
  29. Wada, N.; Takao, U. Effect of cation (Sr, Pb and Ba) on calcium carbonate polymorphs under diffusional conditions. Gypsum Lime 1993, 245, 211–219. (In Japanese) [Google Scholar]
Figure 1. Process of self-healing in cement-based composite materials.
Applsci 07 00546 g001
Figure 2. Schematic diagram of the preparation of cement samples and incorporation of cracks.
Applsci 07 00546 g002
Figure 3. Sample after crack incorporation.
Applsci 07 00546 g003
Figure 4. Schematic diagram of the self-healing device.
Applsci 07 00546 g004
Figure 5. Experimental setup.
Applsci 07 00546 g005
Figure 6. Cracked surface after self-healing. Note: CM: Ca(OH)2 + microbubbles; CN: Ca(OH)2 + nanobubbles; 20: Temperature of self-healing (°C).
Applsci 07 00546 g006
Figure 7. Raman spectroscopy analysis: (a) experimental setup; (b) Raman spectra of self-healing substances generated in test bodies (CM-20, CN-20).
Applsci 07 00546 g007
Figure 8. Scanning area and calculation of crack width, as presented in [28].
Applsci 07 00546 g008
Figure 9. Conceptual diagram of the frequencies of CT-values.
Applsci 07 00546 g009
Figure 10. Volume change as a function of self-healing temperature (pH = 9.0). Note: CM: Ca(OH)2 + microbubbles; CN: Ca(OH)2 + nanobubbles; 20, 40, 60: Temperature of self-healing (°C).
Applsci 07 00546 g010
Figure 11. Volume change as a function of pH (temp. = 40 °C). Note: CM: Ca(OH)2 + microbubbles; CN: Ca(OH)2 + nanobubbles; 9.0, 10.5, 12.0: pH of self-healing.
Applsci 07 00546 g011
Figure 12. X-ray CT images of cracks before and after self-healing at different temperatures and a fixed pH of 9.0: (a) CM series; (b) CN series.
Applsci 07 00546 g012
Figure 13. X-ray CT images of cracks before and after self-healing at different pH values and a constant temperature of 40 °C: (a) CM series; (b) CN series.
Applsci 07 00546 g013
Figure 14. Preparation of specimens for thermogravimetric-differential thermal analysis (TG-DTA).
Applsci 07 00546 g014
Figure 15. Ca(OH)2 and CaCO3 content after self-healing at different temperatures (T = 20, 40, 60 °C) and a constant pH of 9.0.
Applsci 07 00546 g015
Figure 16. Ca(OH)2 and CaCO3 content after self-healing at different pH values (pH = 9.0, 10.5, 12.0) and a constant temperature of 40 °C.
Applsci 07 00546 g016
Figure 17. SEM images of self-healing precipitates generated at different temperatures (20, 40, and 60 °C) and a constant pH of 9.0.
Applsci 07 00546 g017
Figure 18. SEM images of self-healing precipitates generated at different pH values (9.0, 10.5, and 12.0) and a constant temperature of 40 °C.
Applsci 07 00546 g018aApplsci 07 00546 g018b
Table 1. Experimental factors and conditions. Note: CM: Ca(OH)2 + microbubbles; CN: Ca(OH)2 + nanobubbles.
Sample: Hardened cement paste (water/cement ratio: 40%)
Crack: Fine cracks generated by drying (105 °C, 24 h)
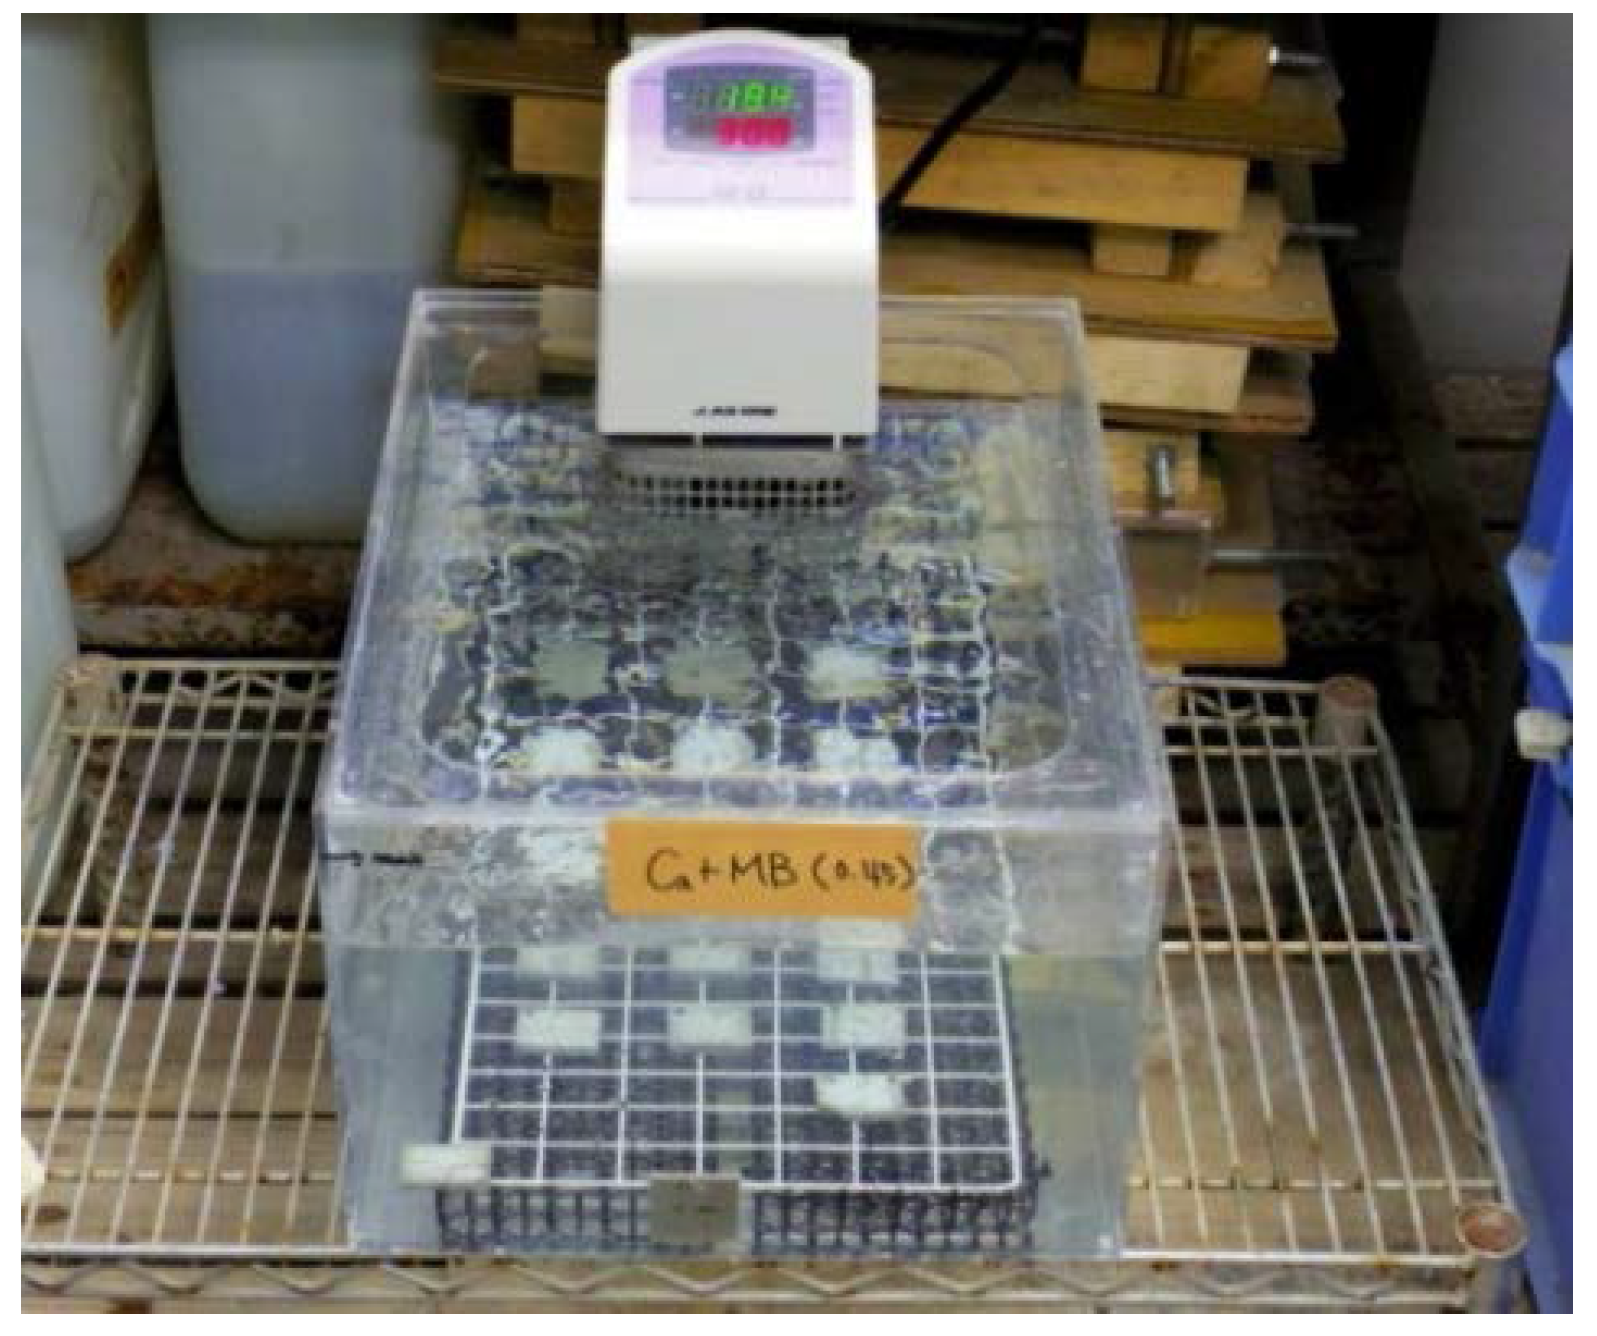
Self-healing conditions [24,25]Temperature: 20, 40, and 60 °C (constant pH of 9.0)Ca(OH)2 + microbubbles (CM)
Ca(OH)2 + nanobubbles (CN)
pH: 9.0, 10.5, and 12.0 (constant temperature of 40 °C)
Self-healing period: 7 cycles (7 days)
 (1 cycle: Bubbles supplied for 4 h+soaking in saturated Ca(OH)2 solution for 20 h)
Table 2. Experimental procedure and evaluation of self-healing performance.
StepExperimental SequenceSubject and Method of Evaluation
Surface and Internal Sections of CracksSelf-Healing Substances
APrior to self-healingMicroscope, X-ray CTRaman spectroscopic analysis, TG-DTA, SEM analysis
BAfter self-healing

