1. Introduction
Dental ceramic materials are essential in producing prostheses to replace missing teeth or damaged dental structures. Ceramics are inorganic, non-metallic materials manufactured by heating raw minerals at high temperatures [
1]. The issue is that materials like ceramics and glasses are brittle: they display a high compressive strength but a low tensile strength; therefore, they may be fractured under a low strain of only 0.1 to 0.2% [
2,
3]. As restorative materials, dental ceramics present disadvantages due mostly to their inability to withstand the functional (especially mastication) forces that are present in the oral cavity [
3].
While all dental ceramics display low fracture toughness when compared with other dental materials (such as metals), metal ceramic dental prostheses combine both the exceptional esthetic properties of ceramics and the good mechanical properties of metals. Their technology is mature, and advanced materials are used in such constructs [
2,
3,
4]. However, fractures of the metal ceramic prostheses may occur occasionally [
4,
5]. Chippings of prosthetic constructs are hard to fix, especially when they are already cemented in the oral cavity.
One of the major causes of the defects that cause cracks and chippings in prosthetic constructs is related to the loss of calibration of the ceramic oven used to fabricate them. Thus, in time (over two or three years [
6], and also from our own experience), the ceramic oven may display a different temperature than the real internal temperature. The oven thermal regime is usually adjusted by the dental technician, taking into account the quality of the prostheses produced. Experienced ceramists are guided by the translucency and texture of the ceramic of a fabricated sample using the clearest porcelain powder. However, such a method is performed visually, and therefore relies entirely on the subjective judgment of the operator and it needs a supplemental sample. Quantitative assessments based on Scanning Electron Microscopy are destructive, as they require samples to be cut. Additionally, the very process of cutting the sample introduces artefacts.
The most modern computerized ceramic ovens run a self-diagnostic process to check the quality of the electronics, muffle, and vacuum. Some of the VITA ovens (VITA North America, USA) auto-calibrate themselves every time they are turned on [
7]. In general, when a difference in the porcelain is noticed, manufacturers of dental ovens recommend double-checking their calibration by using a tab of clear or window-type porcelain to determine the firing temperature. The ceramists are also advised by the manufacturers to perform the calibration at least once every six months [
6]. The problem is that a possible loss of calibration of the oven could happen totally unexpectedly, leading to an improper thermal regime that results in thermal stress inside the ceramic structure. This determines failure of the dental prosthetic treatment [
8]. As ovens may process tenths or even hundreds of prostheses each day, such an unexpected and undesired loss of calibration may impact numerous patients negatively. The problem may lay undetected for a certain period of time.
The aim of this paper is to evaluate the utility of an established biomedical imaging technique, optical coherence tomography (OCT), in establishing the correct settings used by ovens. OCT is based on low coherence interferometry [
9]. Interferometry confers the method with better depth penetration than conventional microscopy while its low coherence leads to micrometer axial resolution [
10,
11]. In comparison to other investigation methods for teeth and dental constructs, such as radiography and Cone Beam Computer Tomography, using optical waves of low power, OCT is totally non-invasive. Additionally, OCT exhibits better resolution capability than these methods, essential in the investigation of material granulation [
12]. For the present study, the swept source (SS) OCT method is chosen for its superior acquisition speed and sensitivity [
13,
14]. In order to produce quick images with
en-face orientation (similar to microscopy), the Master Slave (MS) OCT method for processing the electrical signal is employed [
15].
Non-invasiveness and high resolution have promoted OCT towards a wide range of applications, such as biomedical diagnosis (in ophthalmology [
9,
10,
11], dermatology [
16], dentistry [
17,
18,
19,
20], and endoscopy [
21]) and non-biomedical testing (of glass, plastic, and semiconductors [
22,
23], as well as of profiles of metallic surfaces [
24]). The advantages, as well as the limitations/complementarities of OCT in relationship to other investigation methods have been reported in respect to imaging teeth [
25,
26,
27] or different types of dental constructs [
28,
29,
30,
31,
32,
33]. Relevant to non- destructive testing, targeted here, the impact of the OCT light source, of its central wavelength, as well as of specular reflection, have already been considered [
23].
In this study, we demonstrate that MS/SS-OCT can be used to identify, more frequently than at standardized periods, possible undesired variations of the oven temperature. The application of the MS/SS-OCT is simple, fast and non-invasive, based on the imaging of ceramic constructs only, which are simply produced each day. The aim is to achieve this operation independently to other calibrating procedure recommended by the manufacturer.
With such a method, the technician may immediately infer that a temperature calibration is mandatory.
2. Materials and Methods
For this study, Duceram Kiss ceramics (DeguDent GmbH (a Dentsply Sirona Company), Hanau-Wolfgang, Germany) have been selected for evaluation. This choice has been based on the fact that the composition of each Duceram Kiss ceramic is adapted to meet the needs of its particular fabrication process and framework, with specific parameters to be observed, such as its coefficient of thermal expansion (CTE) [
3]. Stress cracks and fractures are thus avoided and strength parameters such as bonding, adhesion and retention are assured. This ceramic material has the following characteristics: CTE Dentine 13.0 µm/m·K; dental ceramics, type 1, classes 2–8 according to DIN EN ISO 6872; metal-ceramic bond characterization, flexural strength and chemical solubility according to DIN EN ISO 9693. The optimization of the number of pigments is also a major part of the solution to the problem of metamerism, which refers to the display of a certain color shade of the dental prostheses depending on the source of light utilized, for example typical indoor lighting or outdoor daylight. In classical high-fusing veneering ceramics, the opalescent effect vanishes after a number of firing cycles [
34]. By contrast, in Duceram Kiss, this effect will visibly persist. These superior characteristics simplify our study, as the temperature variations in the sintering oven are likely to be the only source of error/liability of these materials in the manufacturing process of the prostheses. On the other hand, a double check of the technician’s work and his supervision during the procedure phases—to assure complying with the manufacturer’s requirements—provide a minimization of human errors.
A number of 50 Duceram Kiss metal ceramic crowns were used in the study, split into five groups, with 10 each. They were sintered at different temperatures and then investigated by using the MS/SS-OCT system.
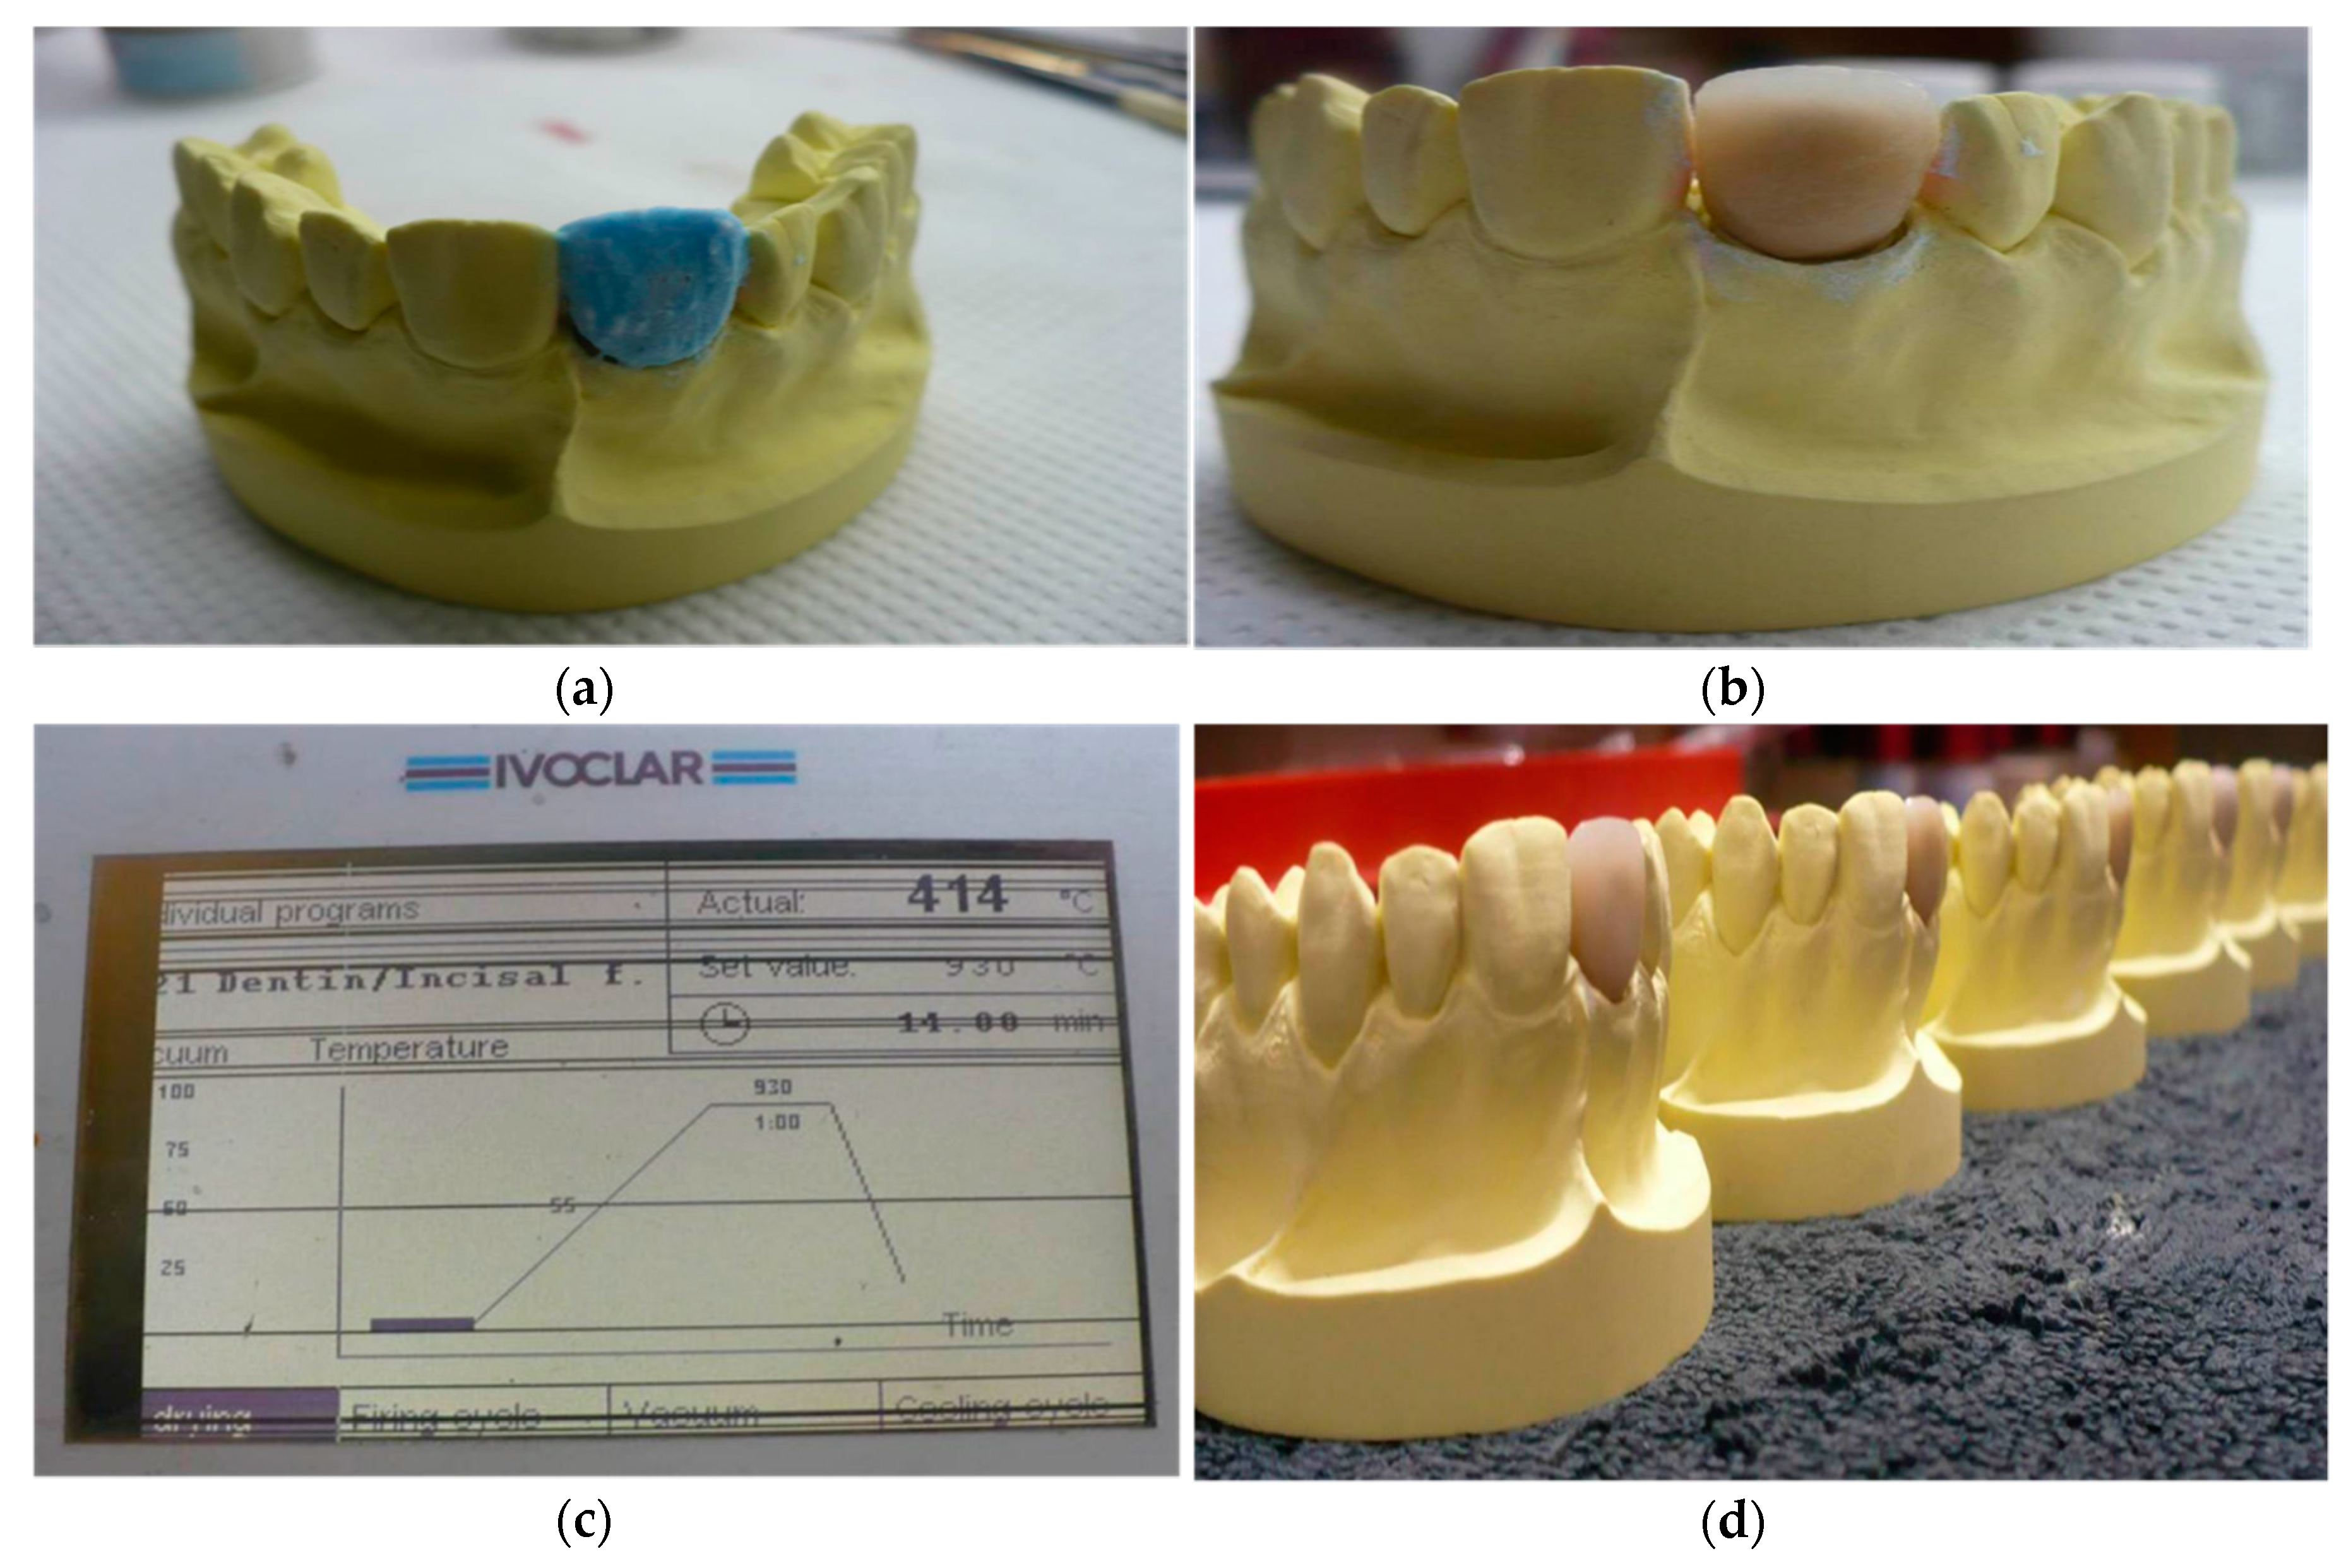
Fifty similar metal copings corresponding to the first maxillary incisor were obtained (
Figure 1). The choice of these specific prostheses for the study is justified by how often they are needed by patients in dental practice. From these samples, five groups were considered:
Group N, for which the ceramic layers were sintered according to the manufacturer’s indications (i.e., at 930 °C);
Group L30, for which the ceramic layers were sintered at 30 °C below the recommended temperature (i.e., at 900 °C);
Group L100, for which the ceramic layers were sintered at 100 °C under the recommended temperature (i.e., at 830 °C);
Group H30, with ceramic layers sintered at 30 °C above the recommended temperature (i.e., at 960 °C);
Group H50, with ceramic layers sintered at 50 °C above the recommended temperature (i.e., at 980 °C). The samples were stored in special boxes, properly marked and prepared for imaging.
Each of these temperature variations were meant to simulate a certain degree of loss of calibration in the ceramic oven in order to evaluate the possibility of detecting it by using MS/SS-OCT.
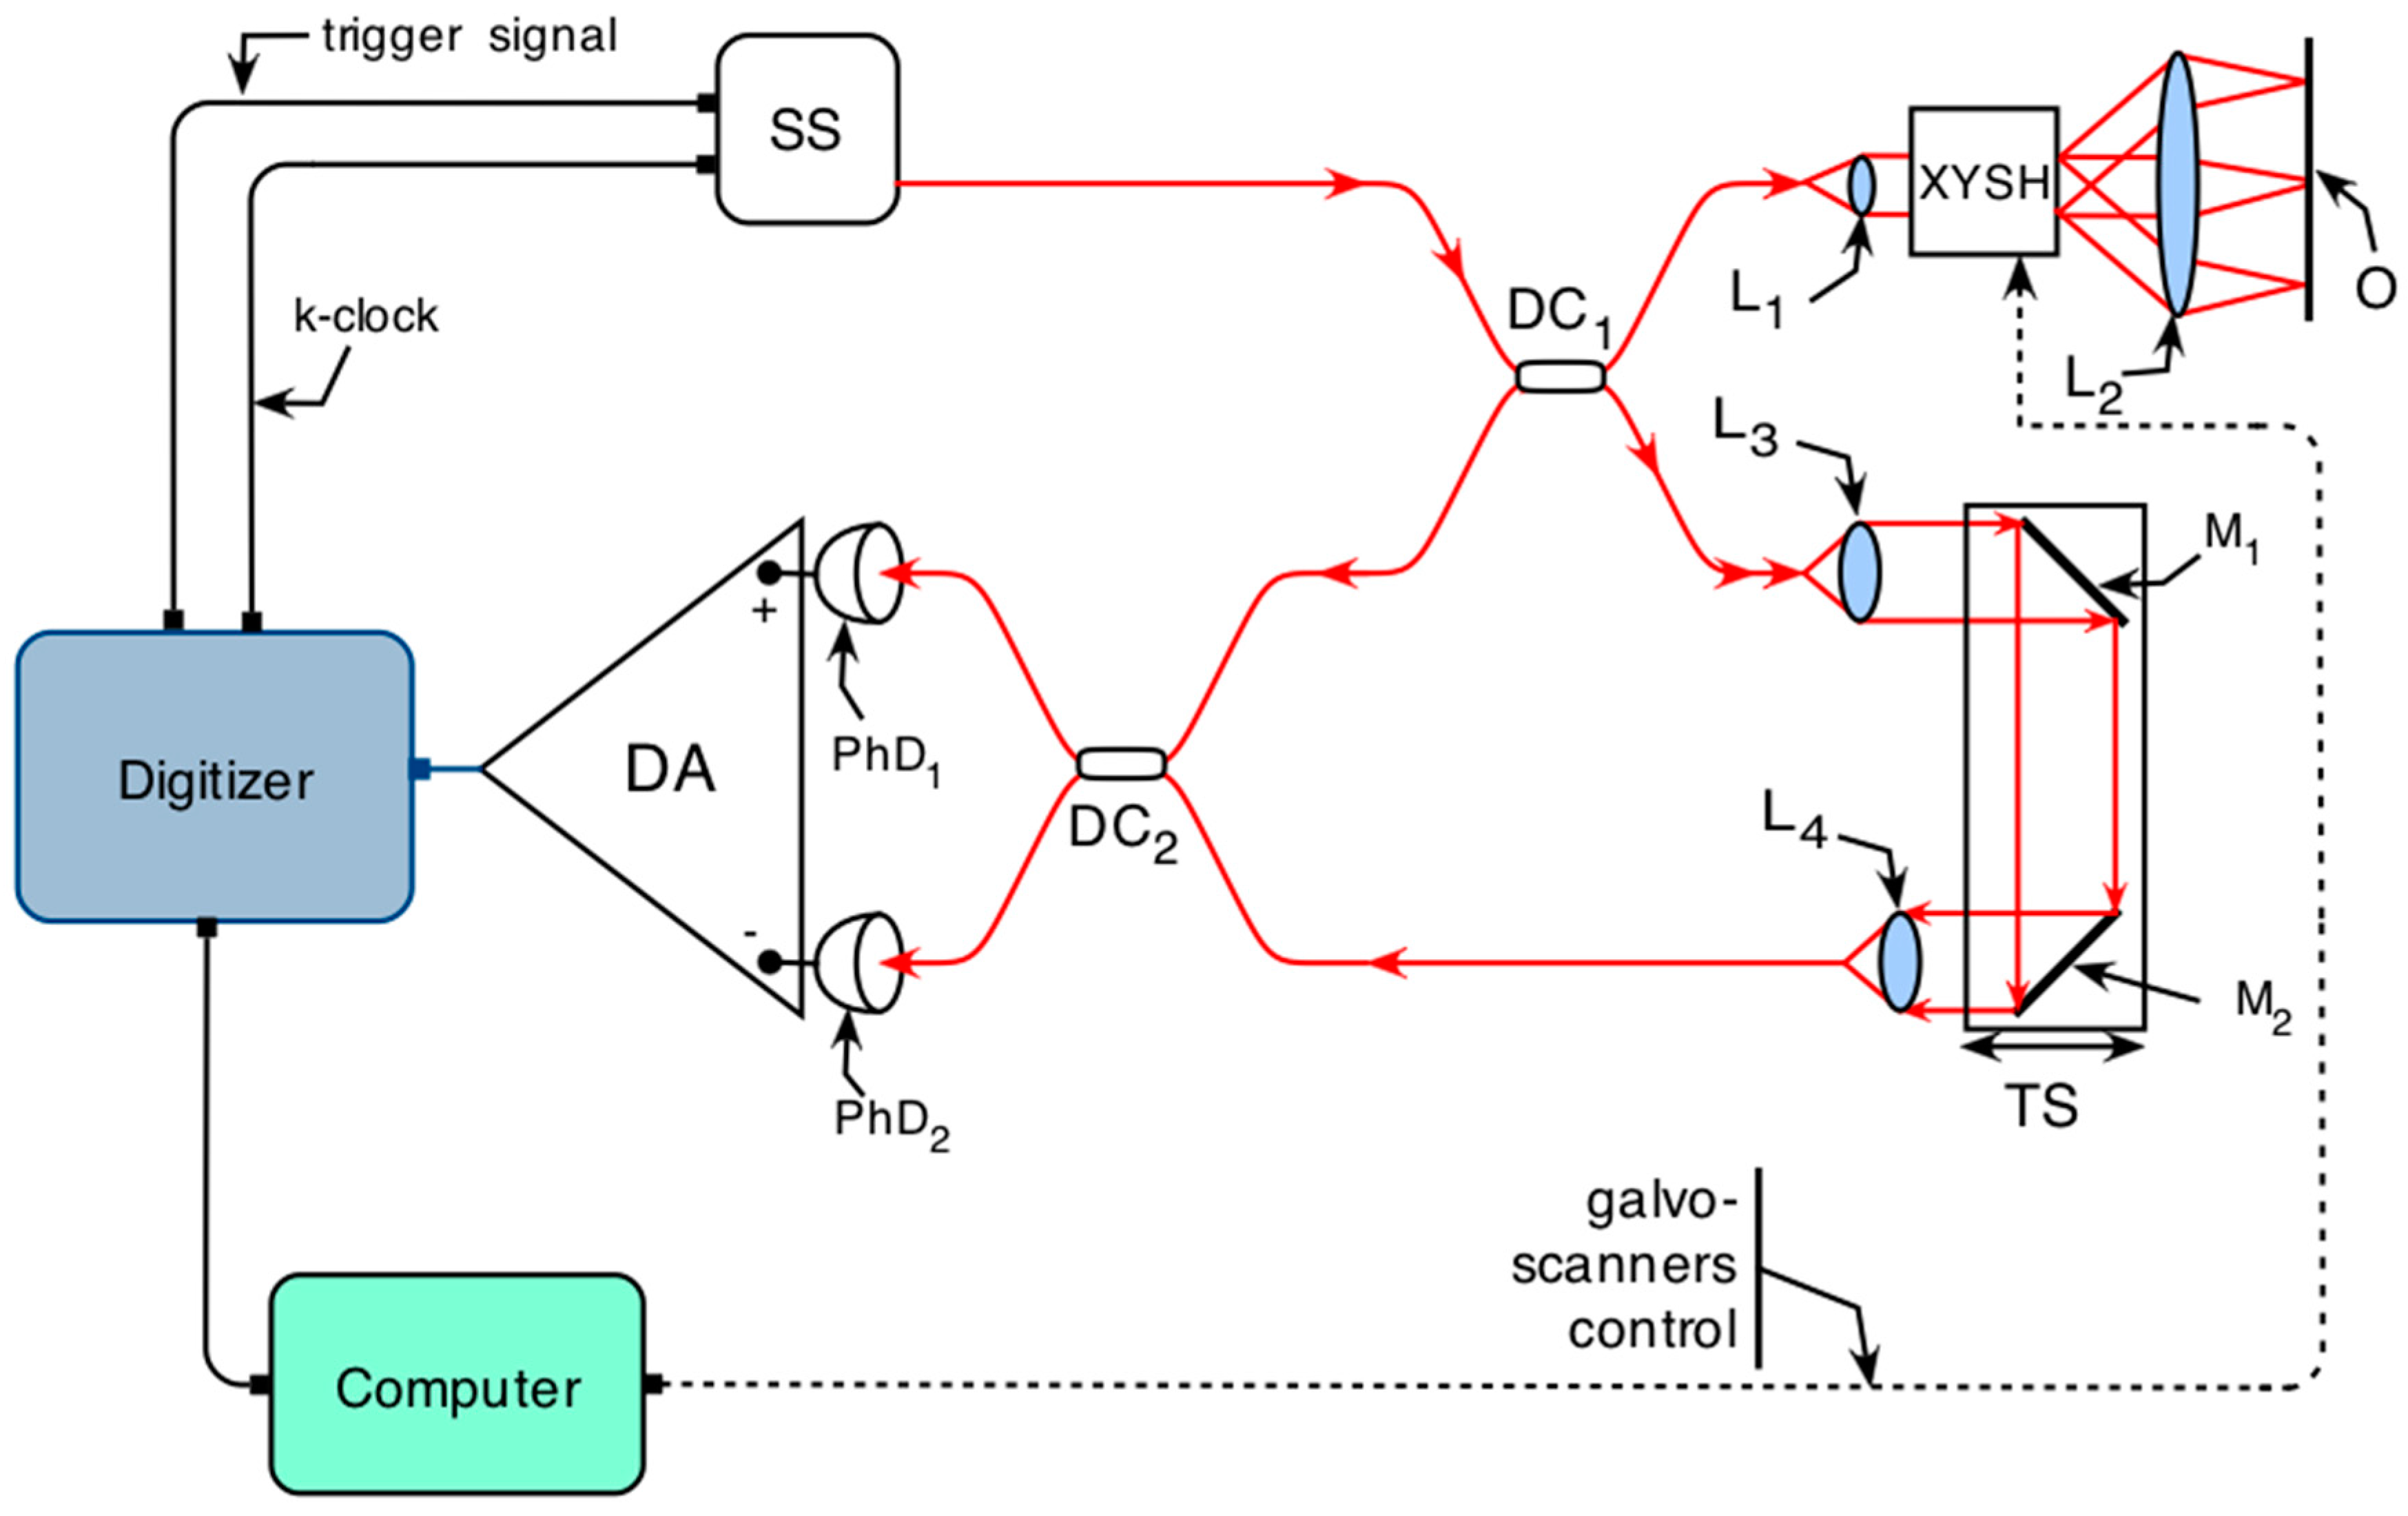
Figure 2 presents a schematic diagram of the SS-OCT imaging system used in the study. As an optical source, an SS (Axsun Technologies, Billerica, MA, USA), central wavelength 1060 nm, sweeping range 106 nm (quoted at 10 dB), and 100 kHz line rate is used. The use of an optical source emitting at around 1060 nm cannot offer a depth penetration as good as at 1300 nm; however, it offers a better axial resolution, which, in our case, was 10 µm (resolution measured in air by using a mirror as sample and measuring the Full Width Half Maximum (FWHM) of the A-scan peak). Using the procedure of measuring sensitivity described in [
35], a sensitivity superior to 95 dB was obtained. This determines the minimum reflectivity measurable within any image.
The interferometer configuration employs two single mode directional couplers, DC
1 and DC
2. DC
1 has a ratio of 20:80 and DC
2 is a balanced splitter, 50:50. DC
2 feeds a balance detection receiver from (Thorlabs, Newton, NJ, USA, model PDB460C), using two photo-detectors, PD
1 and PD
2 and a differential amplifier DA. Twenty percent from the SS power is launched towards the object arm via lens L
1 (focal length 15 mm), which collimates the beam towards a pair of galvoscanners XYSH, (Cambridge Technology, Bedford, MA, USA, model 6115) followed by a scanning lens, L
2, (25 mm focal length), which focuses the light on the sample. The optical fibers used, as well as the lenses L
1 and L
2, determine a lateral resolution of ~10 µm. The power to the object O is 2.2 mW. At the other output of DC1, 80% from the SS power is directed along the reference path via two flat mirrors, M
1 and M
2, both placed on a translation stage, TS to adjust the optical path difference (
OPD) in the interferometer. Collimating lenses L
3 and L
4 are similar to L
1. The signal from the differential amplifier, DA, is sent to one of the two inputs of a dual input digitizer (Alazartech, Quebec, QC, Canada, model ATS9350, 500 MB/s). The acquired channeled spectra are manipulated via a program implemented in LabVIEW 2013 (National Instruments Corporation, Austin, TX, USA), 64 bit, deployed on a PC equipped with an Intel Xeon processing unit (Santa Clara, CA, USA), model E5646 (clock speed 2.4 GHz, 6 cores). The same program is also used to drive the two galvoscanners via a data acquisition board (model PCI 6110, National Instruments Corporation, Austin, TX, USA). Each B-scan image was built of 500 A-scans; hence, with 100 kHz sweeping speed, 10 ms were required to acquire data for a B-scan (the fast galvoscanner was driven with a triangular wave-form [
35]). As a consequence, 500 × 500 channeled spectra to build an entire 3D volume and also deliver the
en-face images were acquired in 5 s. Once the full dataset was acquired,
en-face images were produced using the MS protocol by comparing the signal delivered by the DA with the signal delivered by the DA when a mirror was used as a sample, for an optical path difference in the interferometer adjusted to
zen-face, i.e., to 0.75 mm.
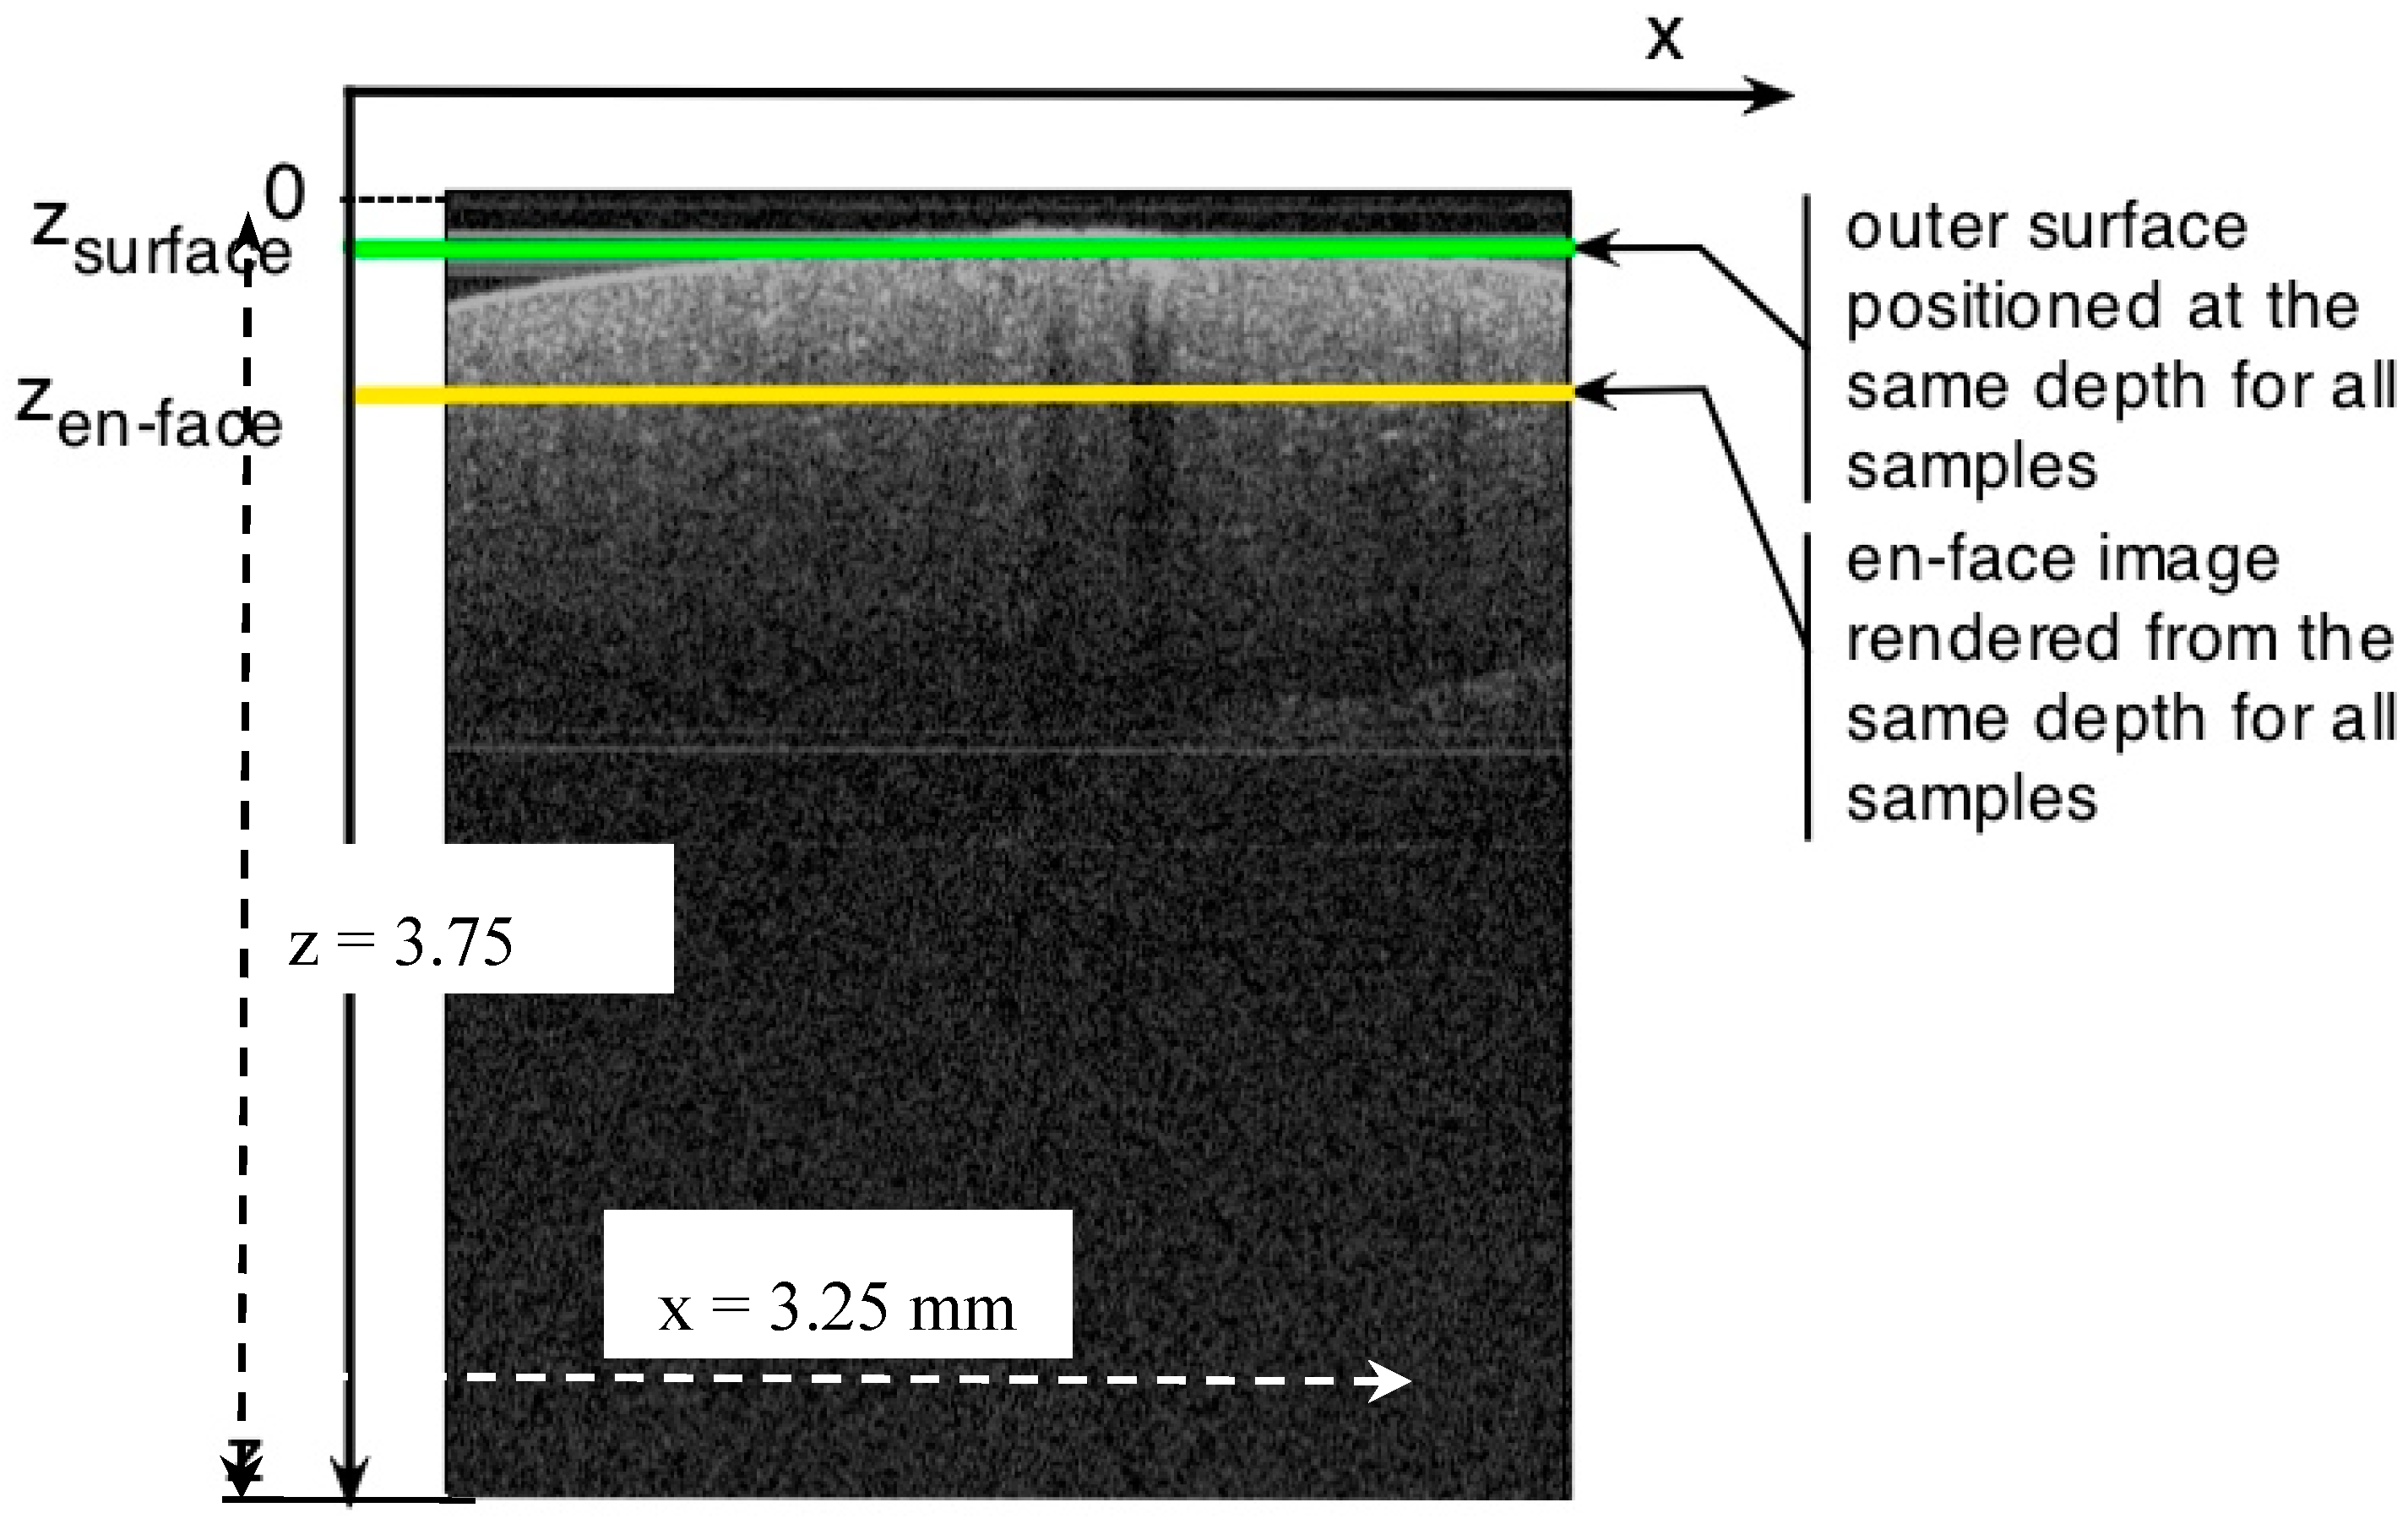
All samples were subject to imaging after they have completely cooled down. For their investigations, C-scan/en-face OCT images were obtained from a similar depth in all of the samples. The control of the depth was made possible by analyzing the B-scan OCT image of each sample. This depth was chosen at approximately zen-face = 0.375 mm (distance measured in air) from the position corresponding to an optical path difference (OPD) of 0 mm considered at the top of each sample in the B-scan image. In all cases, the vestibular surface of the sample was imaged. The system was switched from either real time en-face (C-scan) imaging regime to cross section (B-scan) imaging regime, based on its Master Slave procedure.
The lateral size of the
en-face images was calibrated (size of the image versus voltage applied to the galvoscanners XY) using a high resolution test target. The scale bars in
Figure 3,
Figure 4 and
Figure 5 were thus
x =
y = 3.25 mm on each of the two directions considered for
en-face images. Along the
z-axis (in-depth, perpendicular on the vestibular surface), the maximum axial range offered by the instrument employed for the study, measured in air is
z = 3.75 mm. By considering an estimative
n = 1.5 refractive index for the inspected material, Duceram Kiss ceramics, for the central wavelength of the SS used, the axial range along the vertical in
Figure 3 becomes
z/
n = 2.5 mm measured inside the material.
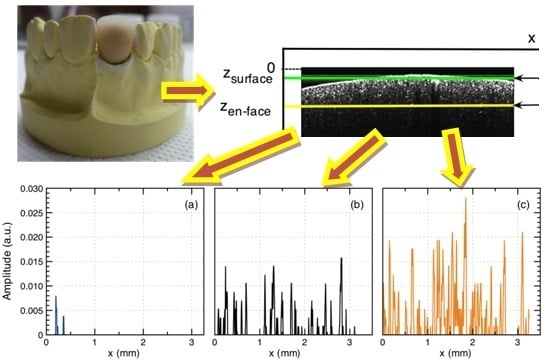
The outer surface of all the samples was positioned at a similar depth (zsurface) measured from the plane corresponding to a zero OPD; then, all en-face images were acquired from a similar depth position (zen-face). This depth of ~0.375 mm was selected in order to provide as good as possible a reflectivity signal to characterize the granulation in the en-face OCT image acquired from inside the material. In this way, as the reference and sample optical power levels were kept constant throughout all measurements, we ensured that changes in the brightness of the images are only due to changes in the optical properties of the samples. Moreover, by placing the samples as explained before, at a similar distance from L2, we ensure similar lateral resolutions in all of the en-face images.
An immediate difficulty when the sample presents a curved input surface, for collecting an en-face image from a fixed depth, as determined by the OPD of the coherence gate applied, is that the en-face slice does not cut a plane surface, but a curved surface from inside the sample. Therefore, the interpretation of what is being seen has to consider the curvature of the sample top surface. Therefore, maintaining the exact depth in all samples of the en-face slices collected is somewhat difficult.
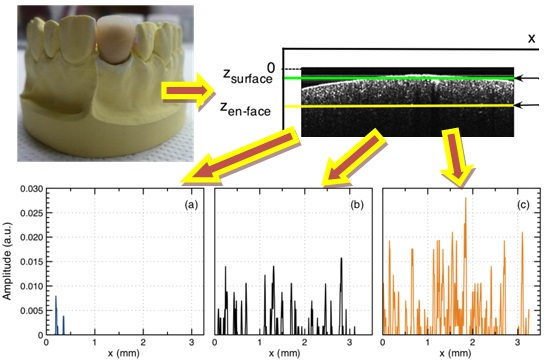
Figure 3 depicts the depth selection where the
en-face images are acquired from. They are not rendered from the volumetric dataset, as performed by conventional OCT technology based on A-scans. They are generated in real time, directly, using a comparison method of optical spectra at the OCT interferometer output. We thus demonstrate that a single OCT
en-face image, at a suitably selected depth, can provide all of the necessary information for the evaluation of correct values chosen for the temperature settings of the oven.
In order to better emphasize the effect of the temperature change, once the
en-face images are produced, the 500 horizontal lines on the
y-axis in each image were averaged and the result was displayed as a function of the reflectivity with regard to the position on the
x-axis. To quantify the effect of the change in temperature on the granulation in the
en-face images, a simple method was used: (i) each
en-face image was converted into a binary image and processed (the binary image replaces all pixels in the original gray-scaled image with the value 1 (white) if the gray-scale value is above a threshold (127 has been used on all our images) and replaces all other pixels with the value 0 (black); (ii) To quantify the granulation, the features identified in the binary image are counted and their size is estimated. This fulfills the aim of this study, different from that of imaging, oriented towards providing a simple, fast, and practical assessment of deviations of ovens from their best settings. As a remark, one may consider in such an investigation a bidirectional imaging modality in order to investigate the sample from both sides [
36]. However, for the proposed simplicity of the method developed, we have made the investigation strictly for the vestibular surface of the sample, as similar results are expected to be obtained on all the sides of the sintered prostheses; in addition, the depth of the investigation would not be enhanced by a bidirectional imaging.
3. Results
The investigations revealed specific aspects for each of the groups considered. The acquired OCT data was evaluated in the en-face imaging plane as well as in the B-scan imaging plane, which was important in order to control the depth of the investigations, as explained before.
The following aspects were determined for the groups of samples studied:
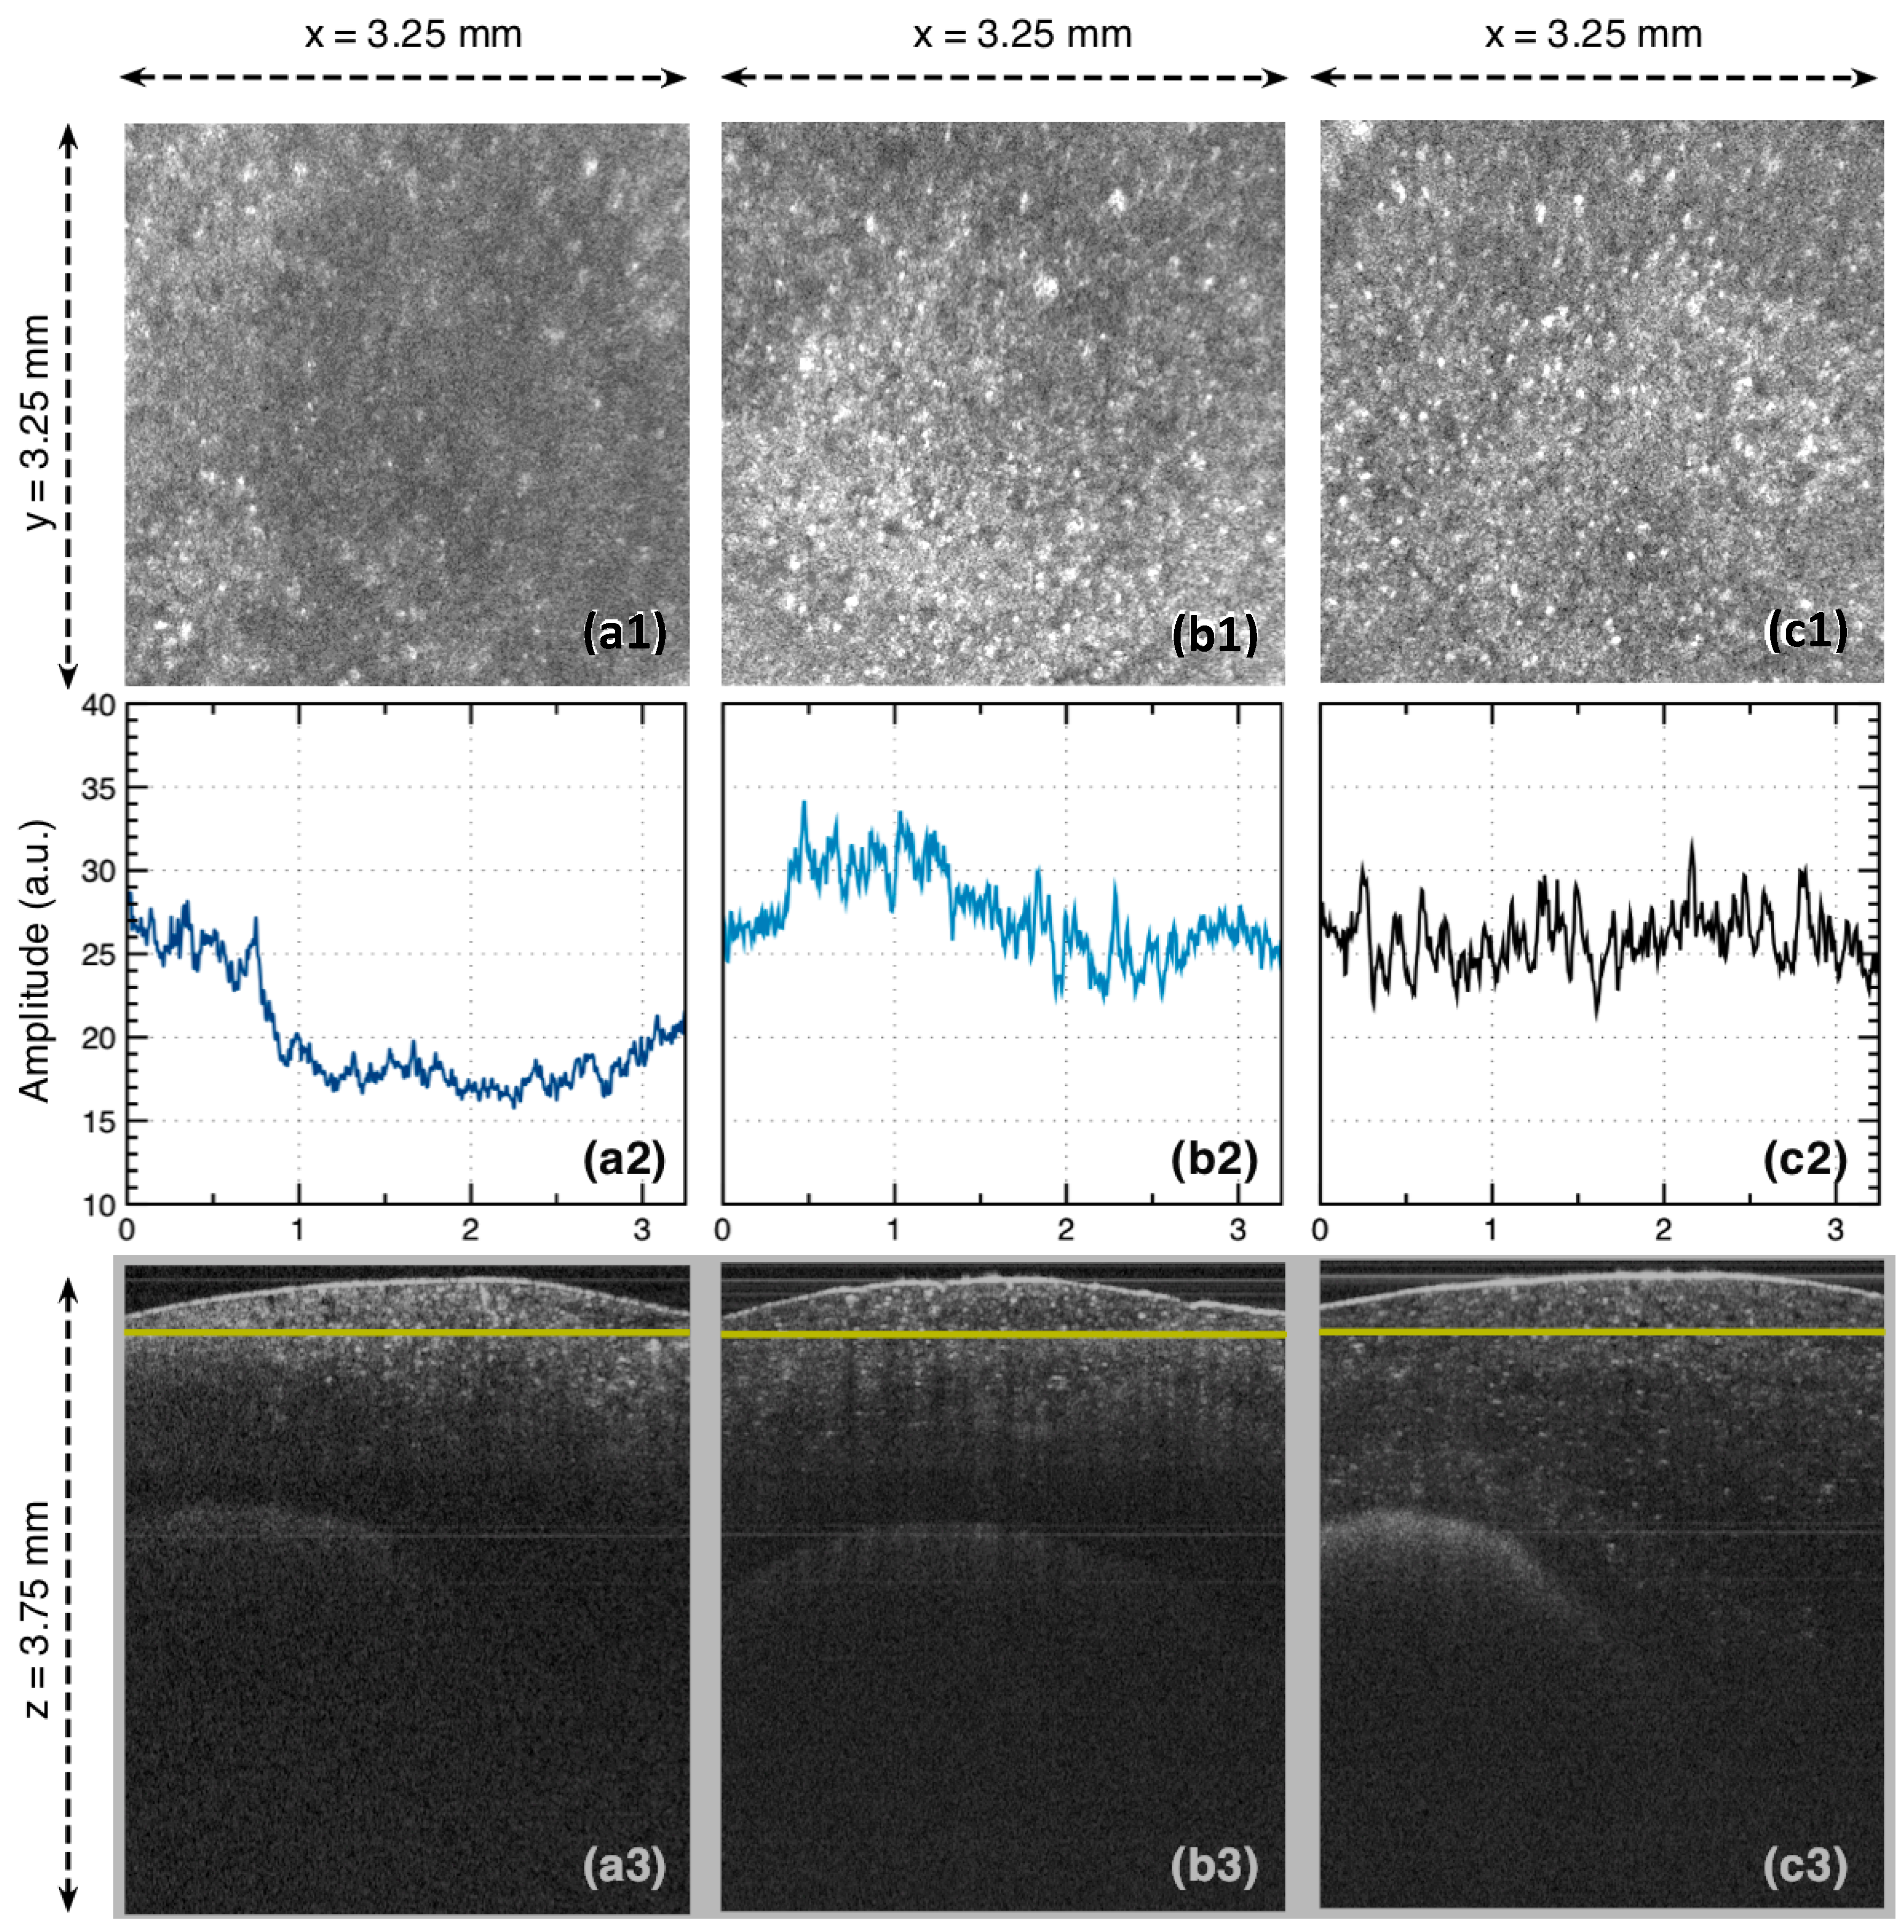
Group N (ceramic layers of the samples sintered at the temperatures indicated by the manufacturers, i.e., 930 °C): a normal distribution of the reflectivity could be noticed (
Figure 4(c1)). This can also be seen in the MATLAB (Natick, MA, USA) image processed after obtaining a mean value of the OCT investigation (
Figure 4(c2)), obtained from the reflectivity values on the
y-axis for each
x-position, as explained in the final part of the previous section. B-scan images of the samples from this group have not been relevant with regard to the influence of the temperature variations (
Figure 4(c3)); neither are A-scans, i.e., reflectivity profiles on the
z-axis. In fact, our study has demonstrated that
en-face OCT images, and only them, are capable of performing the proposed assessment.
Group L30 (samples sintered at 30 °C below the recommended temperature, i.e., at 900 °C): a decrease of the reflectivity could be seen; an alternation between reflective and less reflective areas (of band-like shapes) is noticed (
Figure 4(b1)). These findings could be easily processed and highlighted on images that were processed using MATLAB (
Figure 4(b2)).
Group L100 (samples sintered at 100 °C below the recommended temperature, i.e., at 830 °C): the
en-face OCT image of the investigation revealed a significant decrease of the reflectivity (
Figure 4(a1)). The alternation between the reflective and less reflective bands is still visible in the image. However, the non-reflective area spreads much more in comparison with the more reflective area (
Figure 4(a2)). A further degradation, in comparison with Group L30, can thus be concluded.
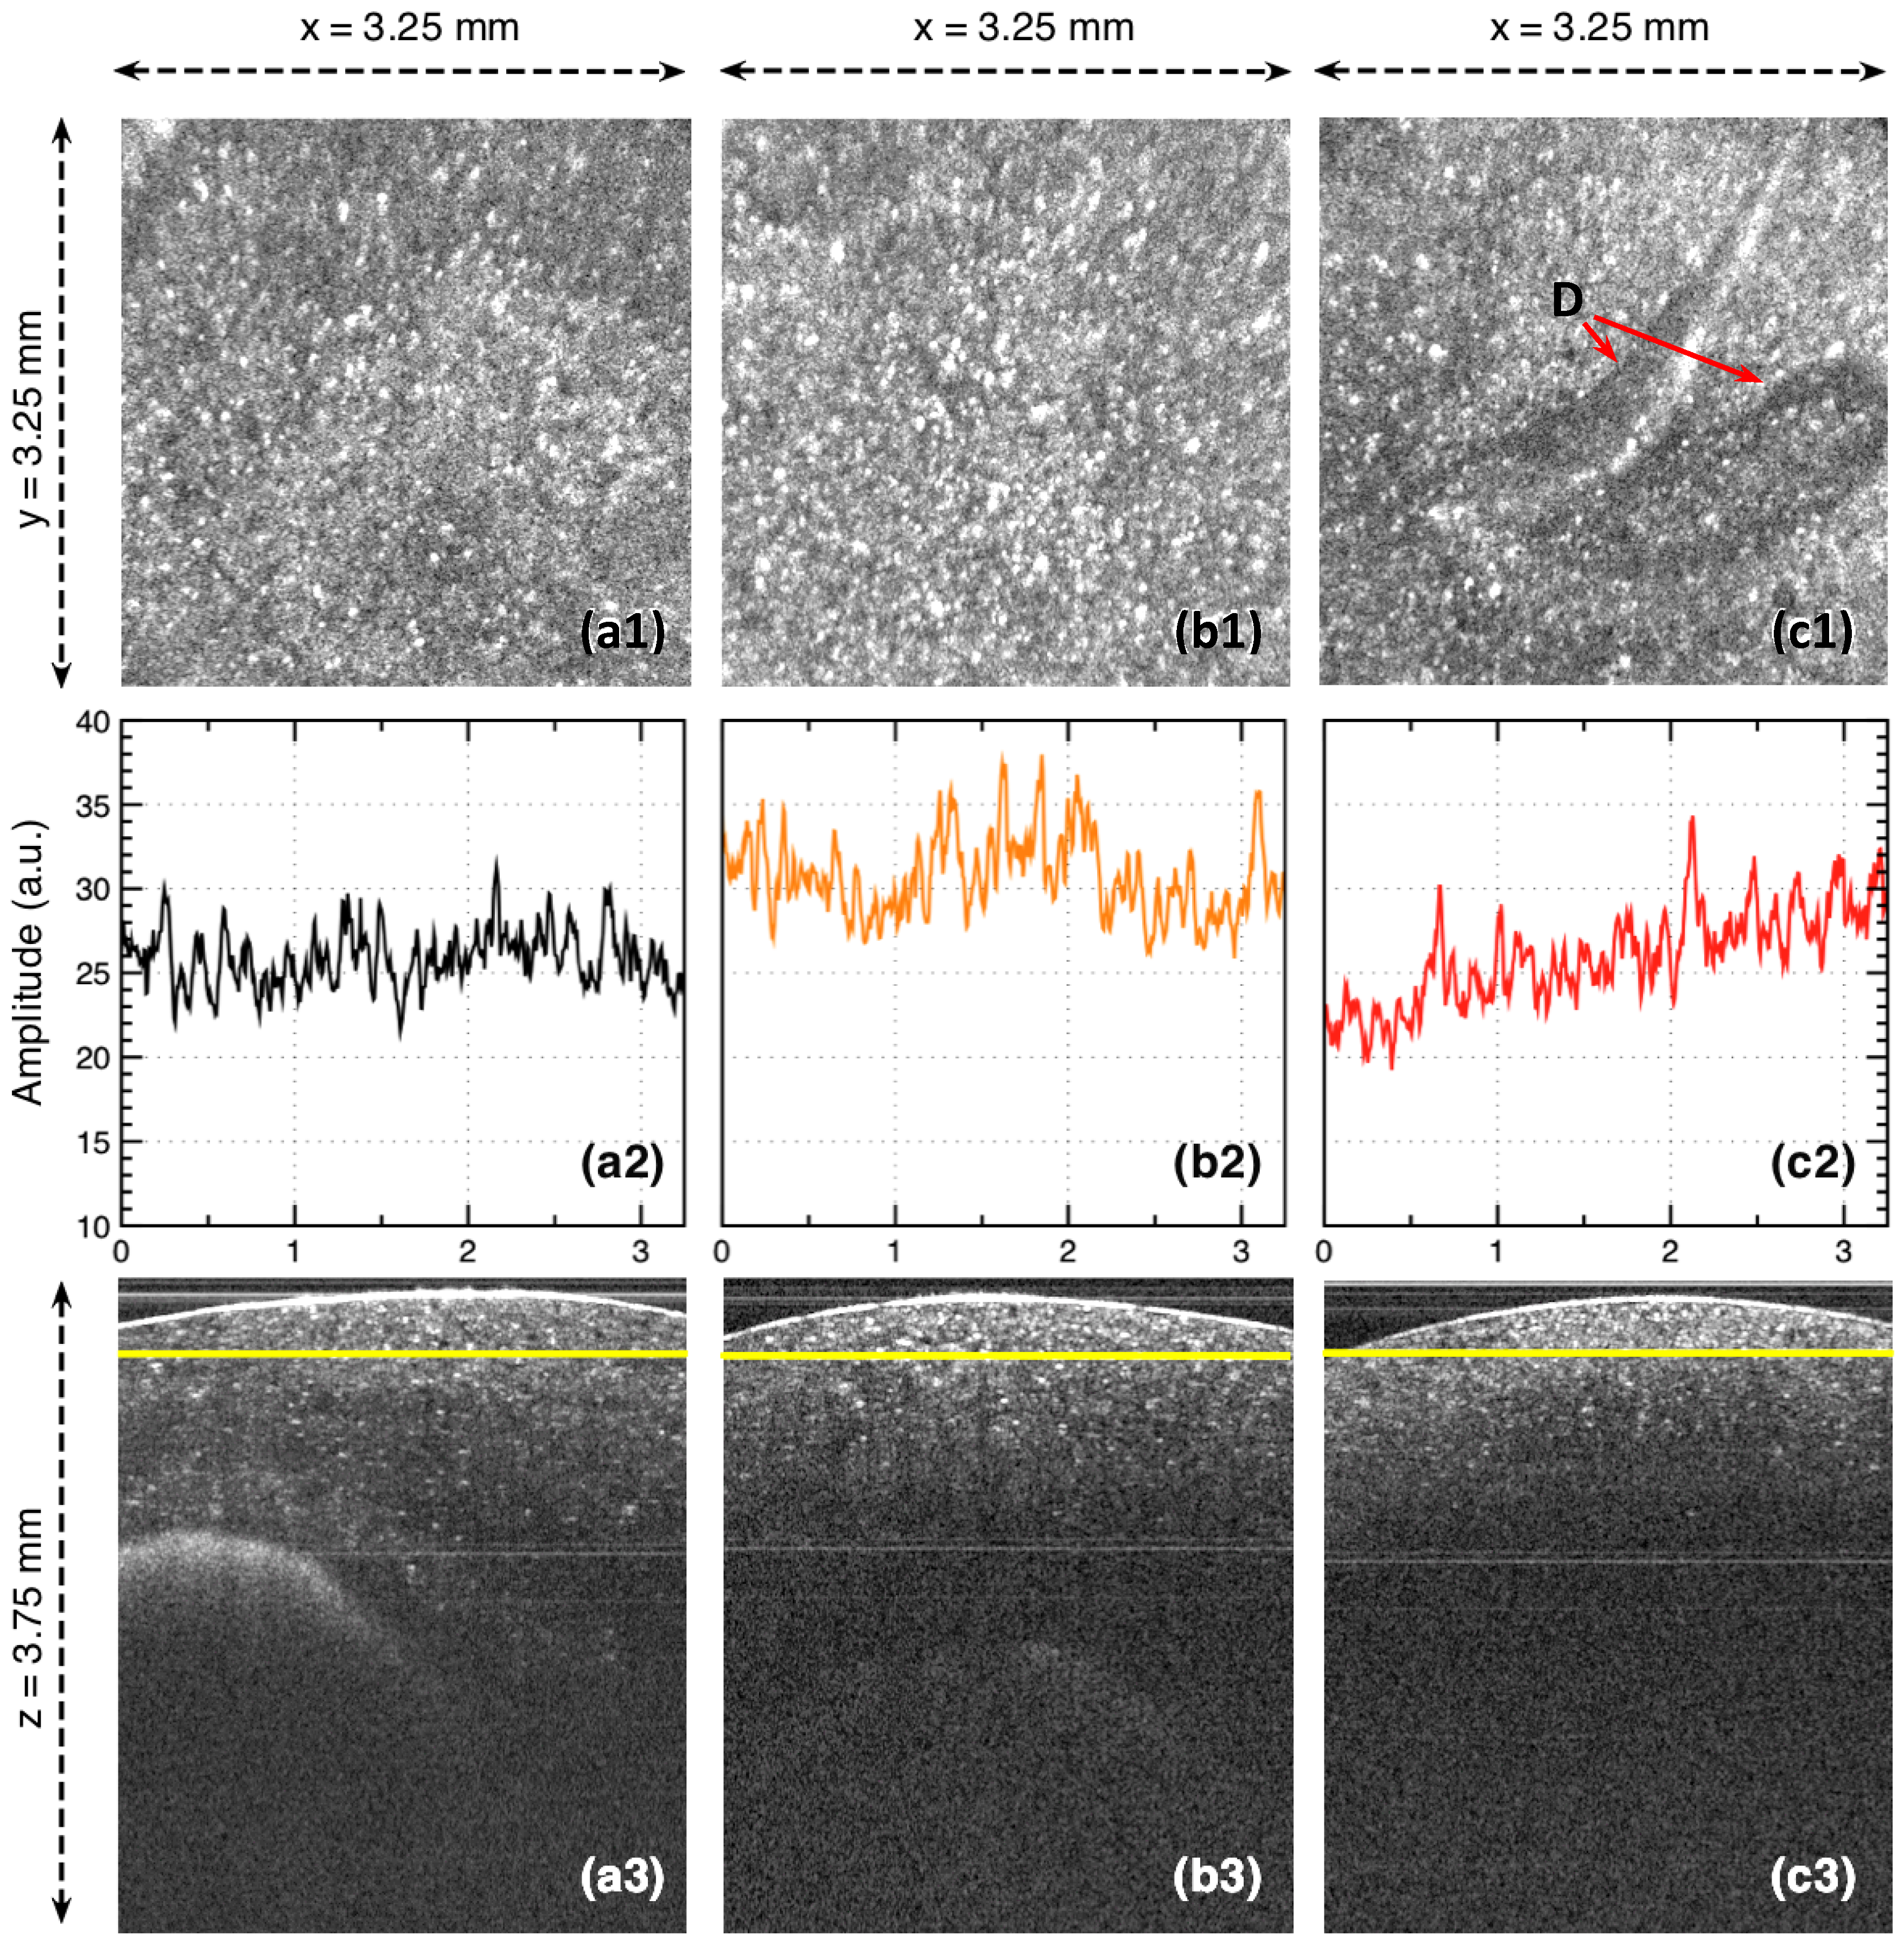
Group H30 (samples sintered 30 °C above the recommended temperature, i.e., at 960 °C): an overall increase of the reflectivity was noticed by comparing the mean value in the normal sample, Group N (
Figure 5(a2)) with the mean value corresponding to the Group H30 (
Figure 5(b2)). The alternation between the reflective and non-reflective areas disappears and a normal granular dispersion is identified (
Figure 5(b2)).
Group H50 (samples sintered 50 °C above the recommended temperature, i.e., at 980 °C): fractures in the ceramic material can be identified in both the
en-face (
Figure 5(c1)) and B-scan (
Figure 5(c3)) images. The general aspect of the
en-face images also shows a significant gradient with an increasing slope in reflectivity (
Figure 5(c2)). An important aspect should be pointed out by inspecting the images for Group H30: an approximately 40% increase in the reflectivity (concluded from the images processed in MATLAB, by comparing Group N and Group H30, i.e.,
Figure 5(a2,b2) have pointed out to a temperature increase of 30 °C inside the oven. Continuing to increase the temperature even more could result in thermal stress that leads to air accumulation inside the ceramic layer or even to fractures at those levels (see the defect D,
Figure 5(c1)).
4. Discussion
Observations correlate well with the typical features characterizing the sintering process. Such processes are commonly divided into three stages [
37]. In an initial first stage, a network of particles starts to form, marked by neck formation. The individual powder particles are still distinguishable. In this stage, the relative density of the material increases by roughly 3%.
Most of the densification, as well as the most significant micro-structural changes, occur in what is termed as the intermediate, second stage, where voids form continuously pore channels along three-grain junctions. The pore channels are formed when the individual powder grains become well-bonded during the initial stage. After that, the pore channels tend to shrink due to the diffusion of the atomic vacancies away from them; however, the grain growth occurring at the same time leads to a reduction in the total number of pores and tends to increase their average diameter and length as a consequence of coalescence.
The process continues until the network of pores undergoes the so-called Rayleigh breakup [
37,
38], first into progressively fewer interconnected elongated pores on the grain edges and finally into isolated pores at the grain corners; at this point, the final, third stage of sintering begins. When the density of a material exceeds 90–94% of the final (theoretical) density, the isolated pores are formed and the densification is slowed down. These can be seen in
Figure 4(a1,b1) for Groups L100 and L30, respectively, as the grain density is less than in
Figure 4(c1), where the material has been brought to its final, prescribed temperature, for Group N. In the former figures, the process was interrupted, while, in the latter, it has been completed, and a uniform distribution of grains was achieved; this is demonstrated by a more uniform reflectivity in
Figure 4(c2) in comparison to the non-uniform reflectivity in
Figure 4(a2,b2).
In this third stage of sintering, the isolated pores are eliminated by the transport of mass from the grain boundary to the pore. The densification is pinned by pores and a considerable amount of energy is necessary for further densification. In this stage, the grain growth dominates the sintering process. Therefore, as the temperature is increased above the value prescribed by the manufacturer, as for Groups H30 and H50, the growth of the grains induces mechanic stress inside the material. The worst results are cracks, as seen in
Figure 5(c1)—obtained for the highest temperature used for sintering (Group H50). Even for temperatures in the oven that are not so dramatically different from the normal temperature prescribed, a further increase of the grains in size results in a noticeable increase in the reflectivity in the
en-face image in
Figure 5(b2) for Group H30.
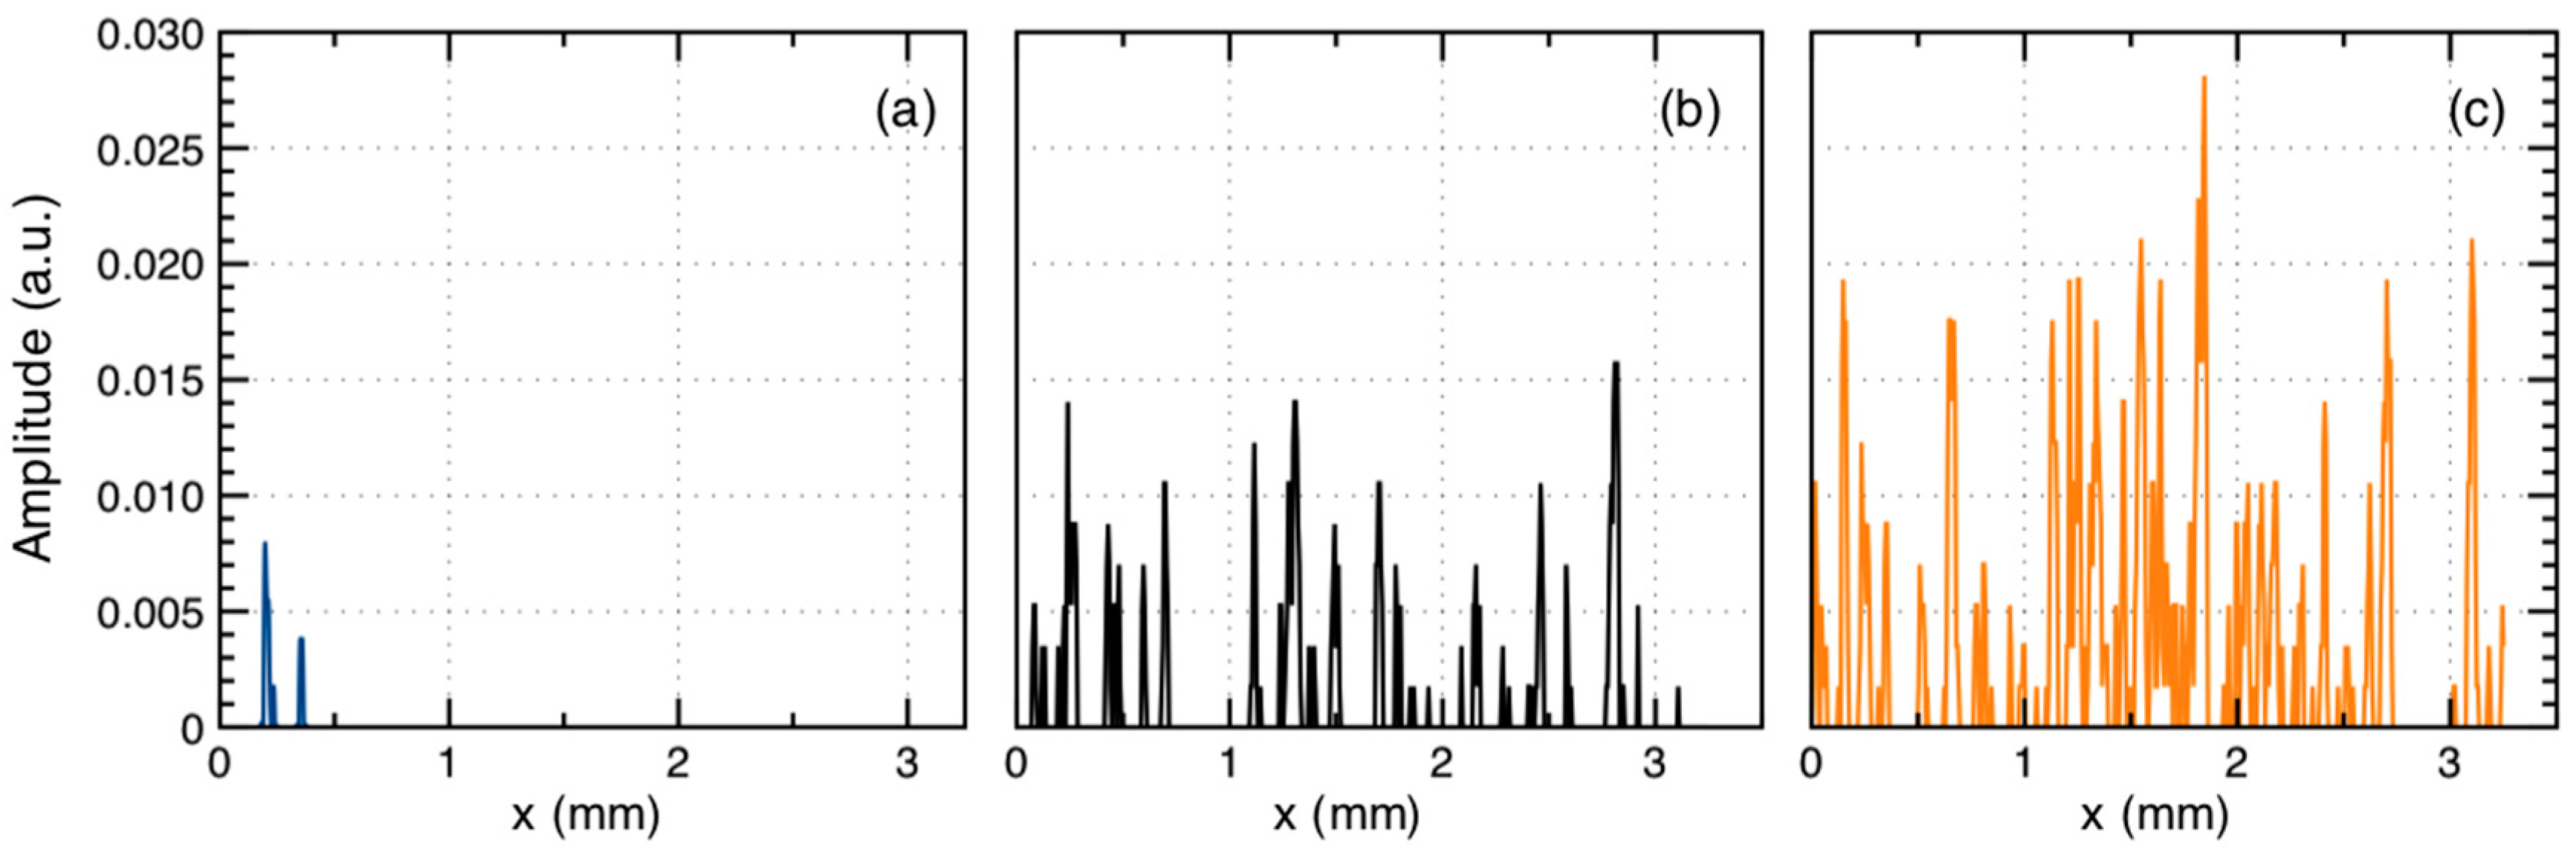
In terms of granular dispersion, the
en-face images were processed further in MATLAB. The result is
Figure 6, which is obtained after removing the noise, so after the image is converted into a binary one; in contrast, the graphs in
Figure 4 and
Figure 5 have been obtained using raw data. The results confirm the reflectivity increase, which is a consequence of the significant increase in the granulation from Group L100 (sintered at 830 °C) towards Group N (sintered at 930 °C, the normal temperature) and Group H50 (sintered at 960 °C). The number of peaks in each plot (
Figure 6), as well as their amplitude increase indicates an increase in both the number of the grains in each
en-face image and in their size, respectively.
Rules-of-thumb can be extracted from these results, in order to allow for the monitoring of the temperature inside the ceramic oven by OCT imaging of the prostheses sintered:
- (i)
A relative uniform reflectivity characterizes the recommended temperature of the oven (Group N,
Figure 4(c2)).
- (ii)
The normal temperature regime is also correlated with the good uniformity of the grains, which have been fully developed in this case (
Figure 4(c1) and
Figure 6b).
- (iii)
A non-uniform reflectivity without a clear pattern (i.e., with ups and downs) characterizes an oven temperature lower than normal (
Figure 4(a2,b2)).
- (iv)
The lower the oven temperature, the lower the values that the reflectivity reaches, according to
Figure 4(a2) in comparison with
Figure 4(b2); a similar trend can be seen as well in
Figure 6a in comparison with
Figure 6b.
- (v)
The aspects in the two points above can also be seen directly from the
en-face image (
Figure 4(a1,b1)), although such an evaluation is less certain, because higher temperatures of the oven may also produce such non-uniformity. Such non-uniformities of the grain distribution (and thus of the reflectivity) for lower temperatures, proportional to the deviation of temperature from normal is correlated with the incomplete development of the grains, as discussed above for the sintering process.
- (vi)
A global increase in the reflectivity characterizes samples sintered at oven temperatures higher than normal, as shown in
Figure 5(b2) and
Figure 6c.
- (vii)
Too high temperatures can also be concluded by comparing an
en-face image as the one in
Figure 5(b1) with an
en-face image as the one shown in
Figure 5(a1). This aspect is correlated with the excessive growth of the grains in the sintering process, as it can be seen from the difference in peak amplitudes in
Figure 6c in comparison with
Figure 6b.
- (viii)
A deviation of the oven temperature to even higher values with regard to the prescribed one (as for Group H50) can also be characterized by a positive and constant slope of the reflectivity (
Figure 5(c2)).
- (ix)
The previous aspect is also the easier and most direct to see on an
en-face image (
Figure 5(c1)), as it produces significant defects (D) that lead to cracks in short periods of time.
- (x)
One should not wait for such totally undesired effects to occur. Instead, a re-calibration should be performed immediately as the reflectivity extracted from the
en-face image increases. Such an increase, of approximately 40%, already corresponds to a 30 °C higher temperature in the oven with regard to normal, as it was concluded in
Figure 5(b2) from the
en-face image in
Figure 5(b1).
It should be appreciated that oven temperatures higher than normal are more dangerous for the outcome of the prostheses than oven temperatures that are lower than the normal value. This can be clearly seen from the fact that samples sintered at 50 °C over the normal oven temperature exhibited defects (D,
Figure 5(c1)), while samples sintered at oven temperatures with even 100 °C below normal displayed no such defects (
Figure 4(a1)).
However, this lack of defects at oven temperatures lower than normal must not be taken lightly or less serious than the loss of calibrations towards oven temperatures that are higher than normal. In the former case, ceramics are not burned properly, the sintering process is incomplete, and therefore the mechanical (and also the esthetic) properties of the prostheses would also be affected, as is well known.
A general overview of the concluded properties of the five groups of samples is made in
Table 1.


 ,
, 


