1. Introduction
Multi-story structure is one of the major structural systems in many countries. From past earthquakes it has been suggested that this structure type is relevant to a large proportion of seismic damage and collapse, e.g., the 1994 Ms 6.6 Northridge earthquake in the US [
1], the 1995 Ms 7.3 Kobe earthquake in Japan [
2],the 2008 Ms 8.0 Wenchuan earthquake, and the 2010 Ms 7.1 Yushu earthquake in China [
3,
4,
5], as well as earthquakes in New Zealand (2010 Ms = 7.0 and 2011 Ms = 6.1) [
6], and Italy (2012 Ms = 5.9) [
7,
8,
9]. For multi-story buildings, reinforced concrete (RC) frames and masonry structures are the two main structural systems. In traditional understanding, RC frames have a better seismic performance than the masonry buildings. However, the investigation of two epicenters of the Wenchuan earthquake, i.e., the towns of Beichuan and Yingxiu, shows the collapse ratio of RC frames (63%) is higher than that of masonry buildings (48%) [
10]. Huge loss of life was caused due to the collapse of RC frames. Furthermore, the failure modes observed during the Wenchuan earthquake were inconsistent with the seismic design desire. Mechanisms of ‘weak story collapse’ and ‘strong beam-weak column’ were observed in abundance [
11]. Lessons learned from the past earthquakes highlighted that the seismic collapse resistance of RC frames needs to be improved urgently.
Numerous studies have been conducted in two fields: collapse mechanisms and collapse resistance measures for RC frames. In the former aspect, the conducted experimental work, including static and shake table tests, could be classified into three levels: the component level [
12,
13,
14], the structural level [
15,
16,
17] and the level of overall structure with non-structural elements, such as infill, panel, etc. [
18,
19]. As the collapse is a global behavior containing an incessant force redistribution during the collapse process, tests of the overall structures are generally regarded as the most reliable research method. Actually, the structural members and nonstructural members both influence the collapse mechanism of the RC frames. As the infill-frame interaction in RC buildings is varied, masonry infills, always present in RC frames, change the structural collapse mechanisms [
20]. Meanwhile, research to date also indicates that numerical simulation has also become an effective way to study structural collapse mechanisms [
21,
22,
23,
24,
25]. The advanced component models for structural members and the calibration test are the key issues to obtaining reasonable simulation results. Similarly, it is more persuasive for the experimental work to have an actual damaged building in the earthquake as a comparison. Meanwhile, methods to improve the seismic collapse resistance of RC frames including theoretical design methods [
26] and practical retrofit measures [
27,
28] were also conducted by many researchers.
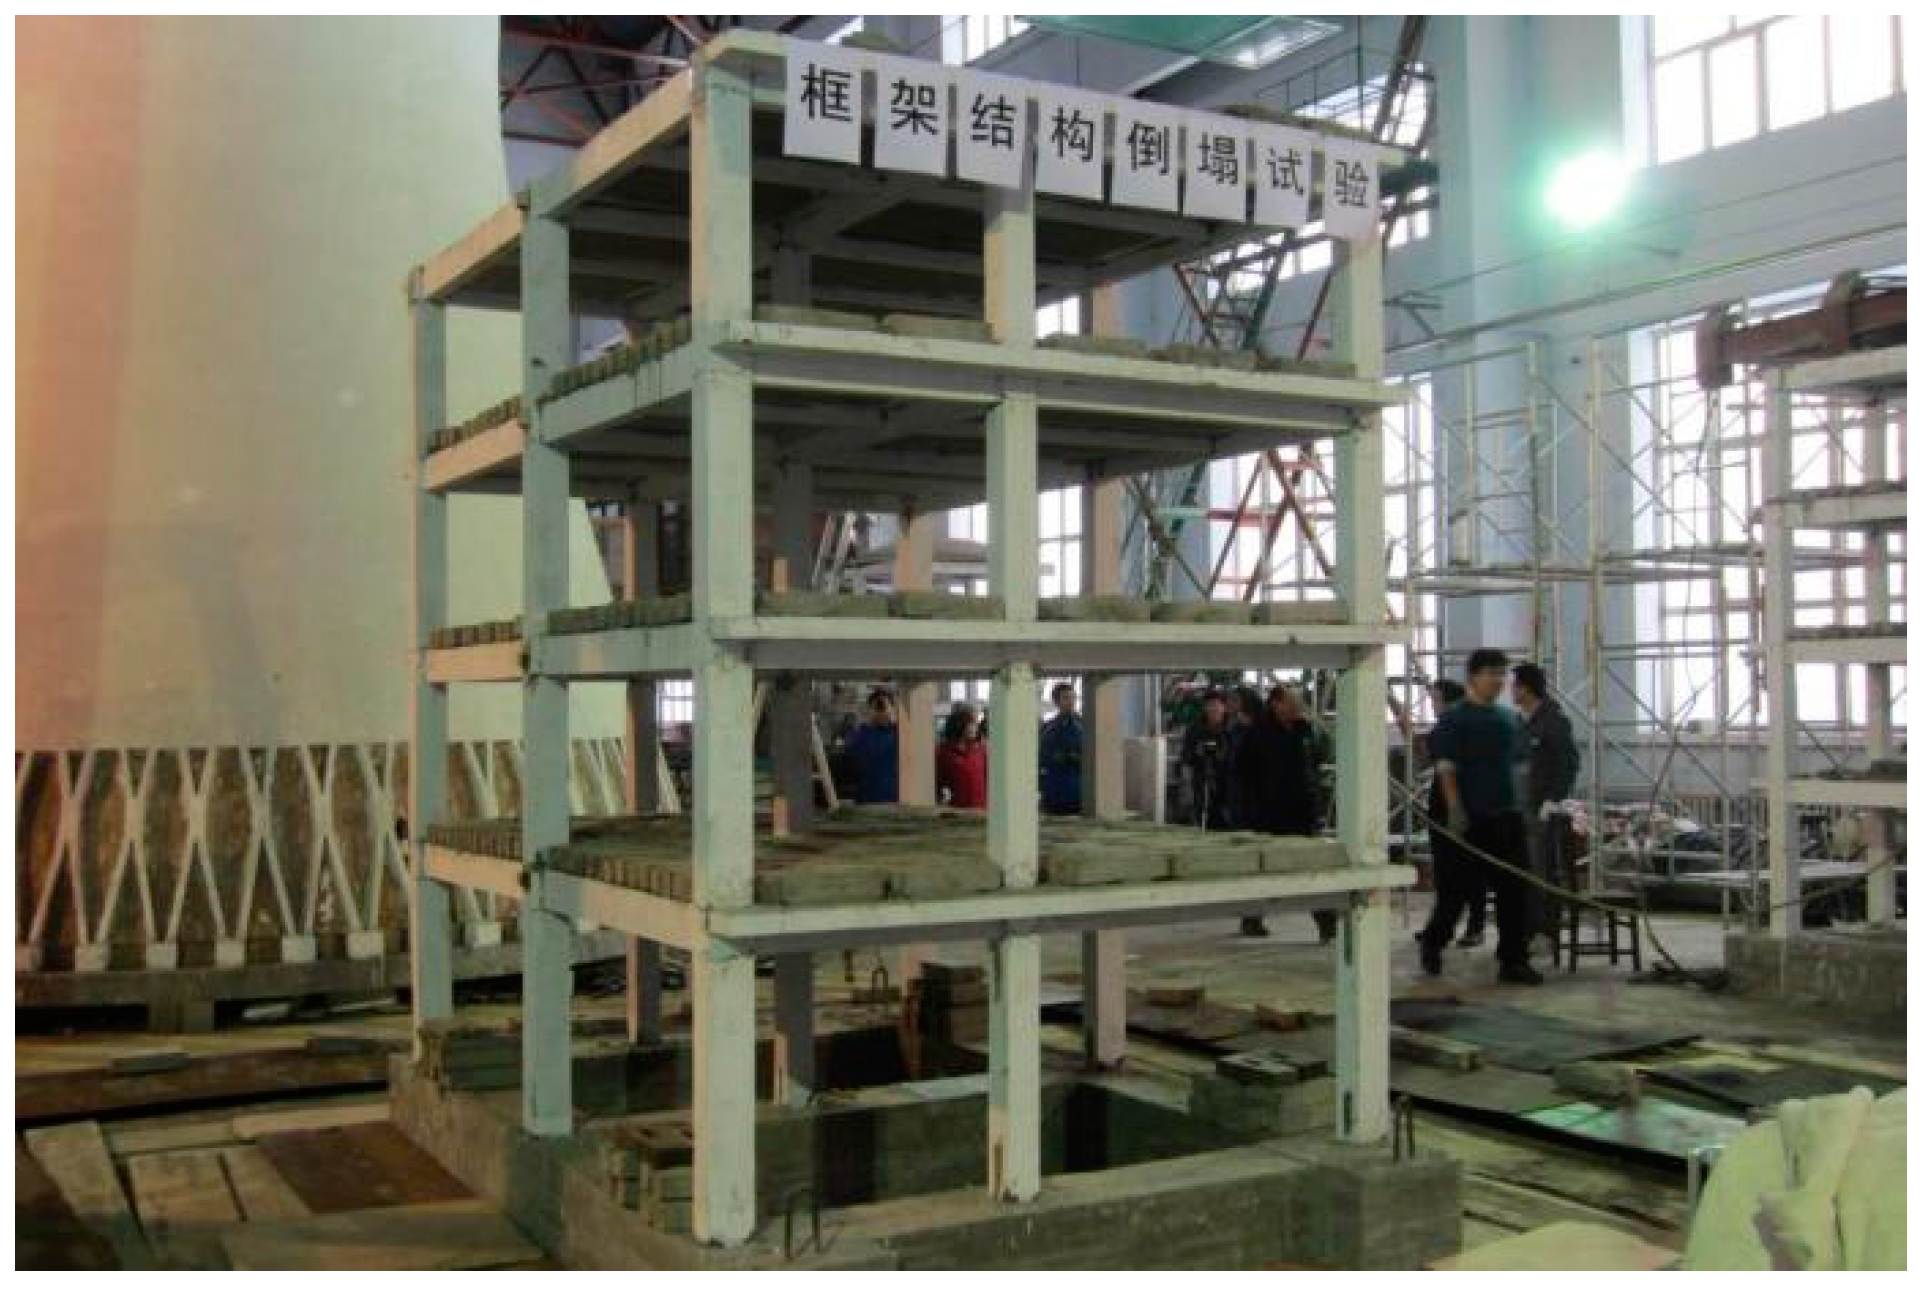
This study thus performed a shake table collapse test of a typical multi-story RC frame, and the prototype building almost collapsed in the 2010 Ms 7.1 Yushu earthquake in China. The structural collapse mode and mechanism were analyzed, and the corresponding remedy measures were also discussed. The research outcome of this study provides some understanding of the inherent collapse mechanisms of similar RC frames during strong earthquakes, and also offers a practical design method to improve the seismic collapse resistance of RC frames.
2. Seismic Damage of the Prototype Structure
The prototype building was located in the epicenter of 2010 Ms 7.1 Yushu earthquake in China and the seismic intensity of the location is 9. According to the Chinese seismic intensity scale [
29], the peak ground acceleration (
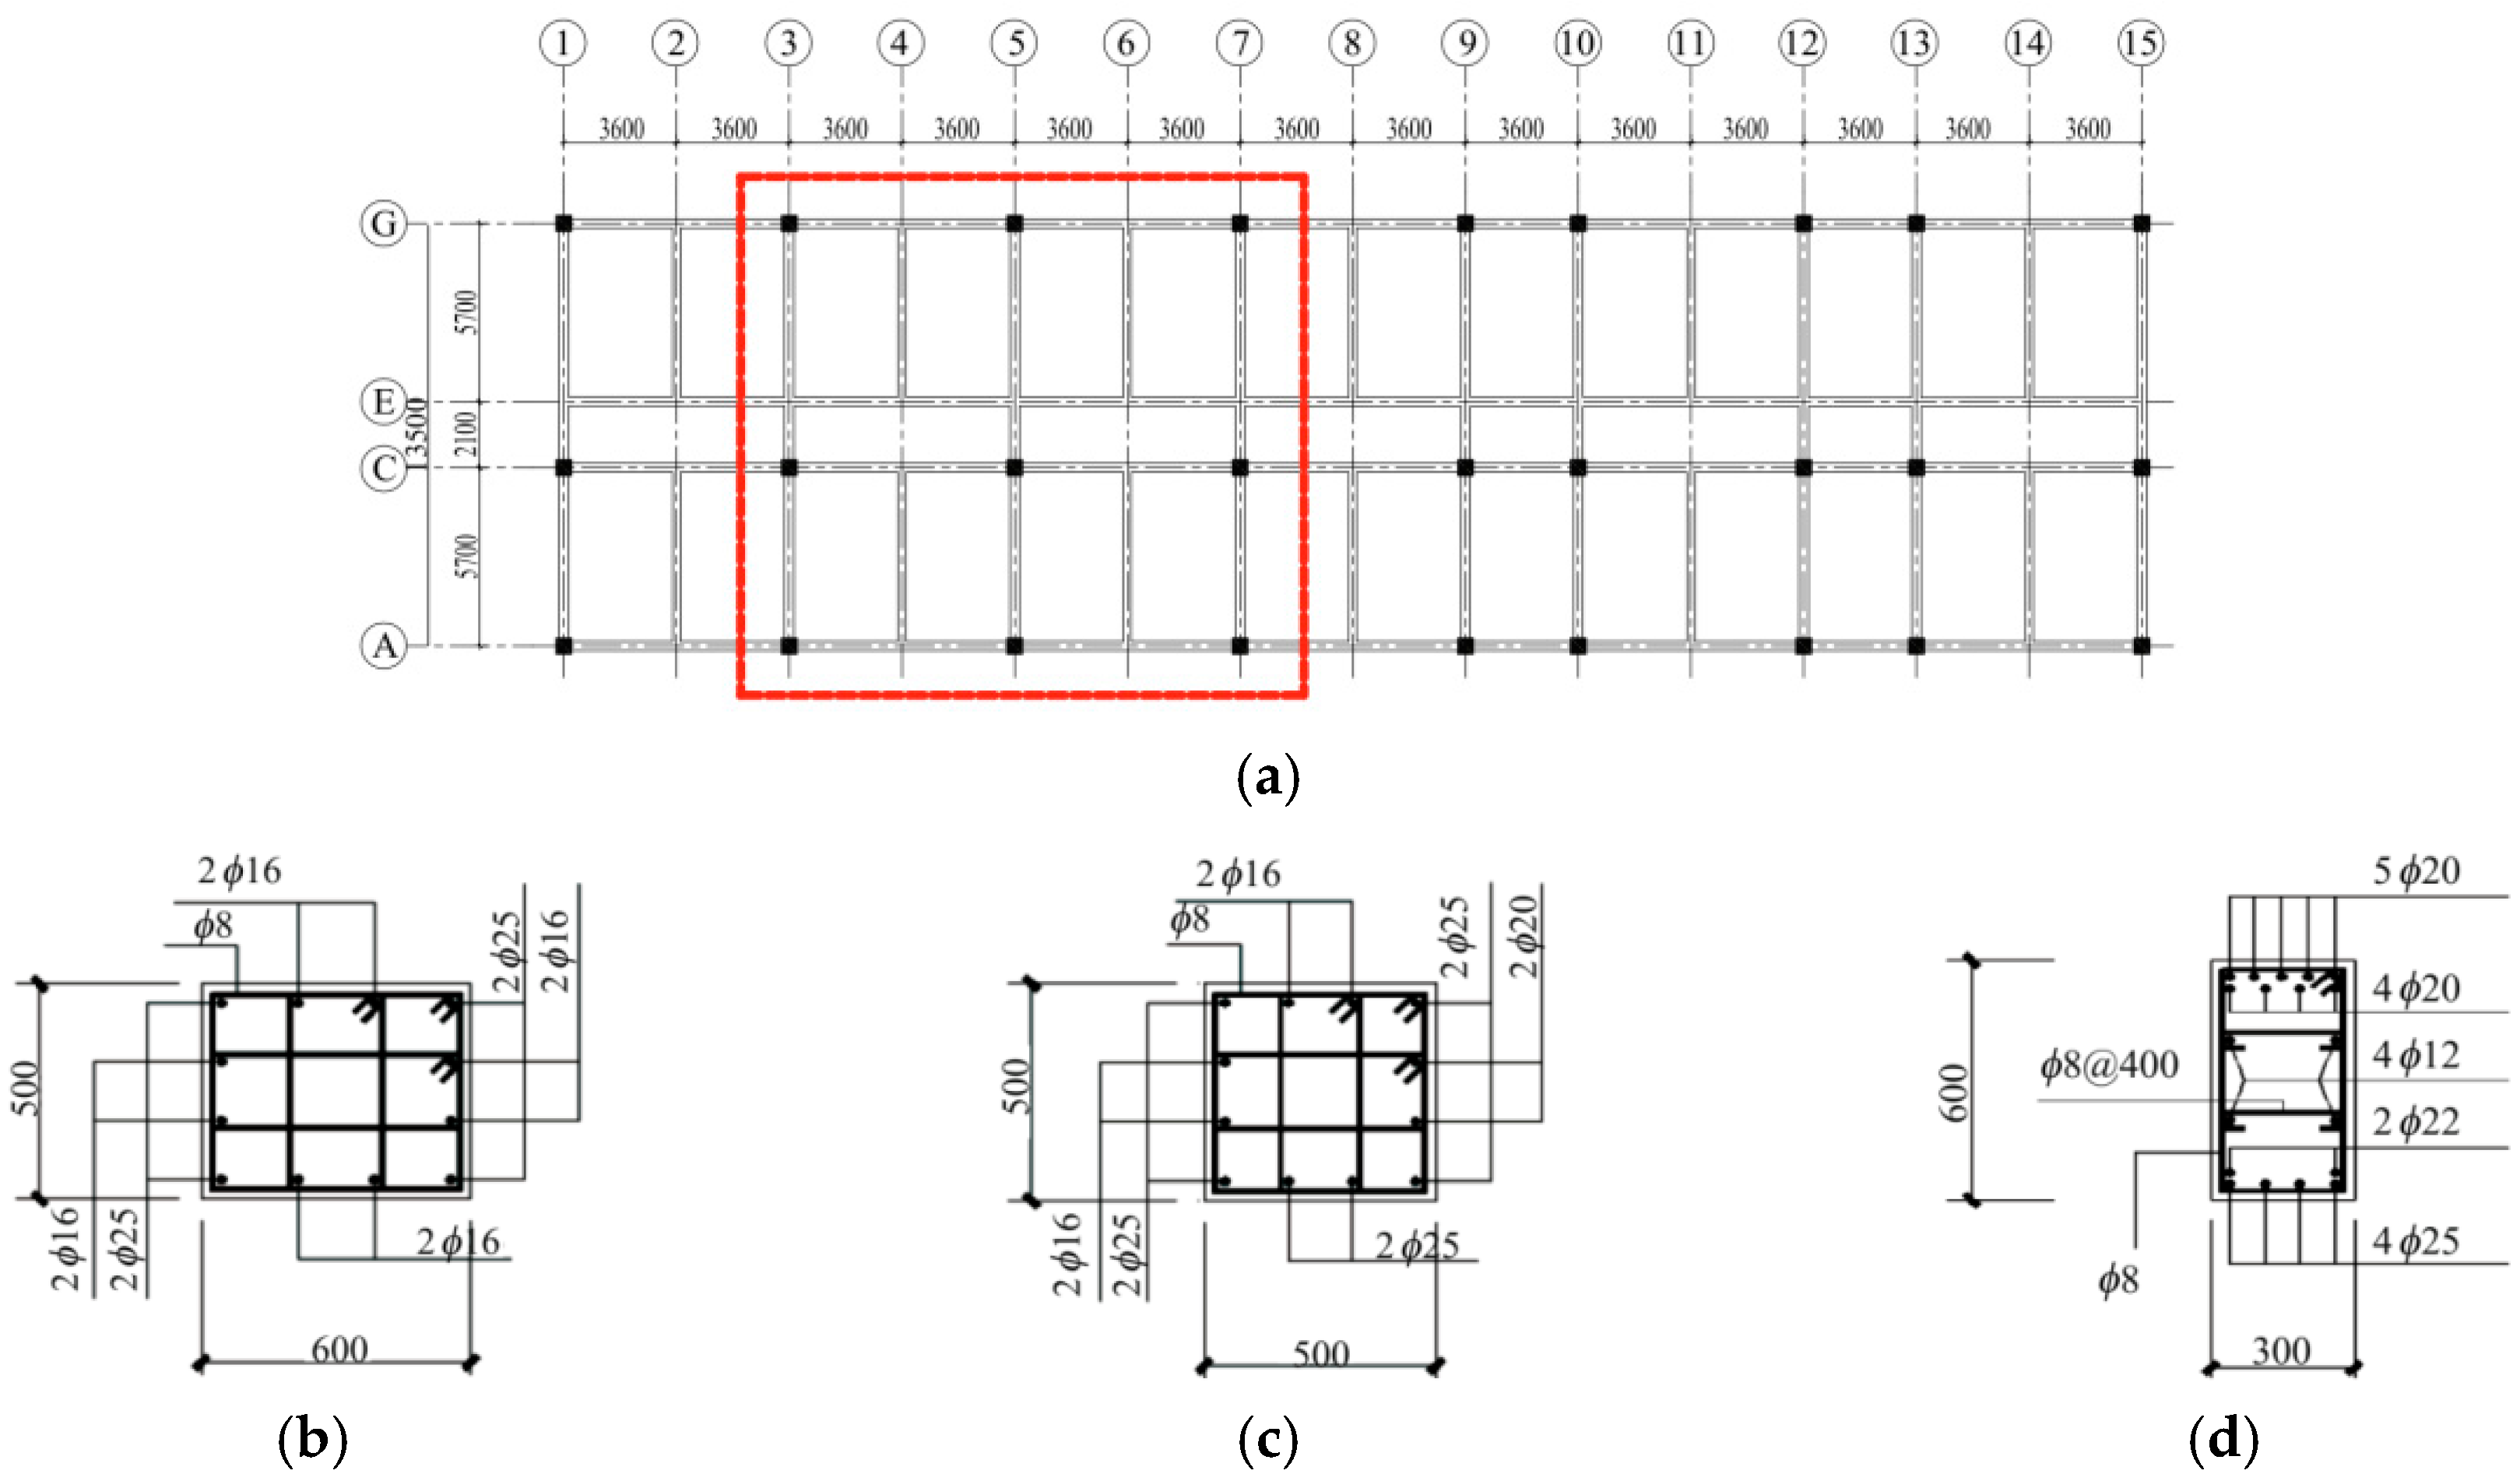
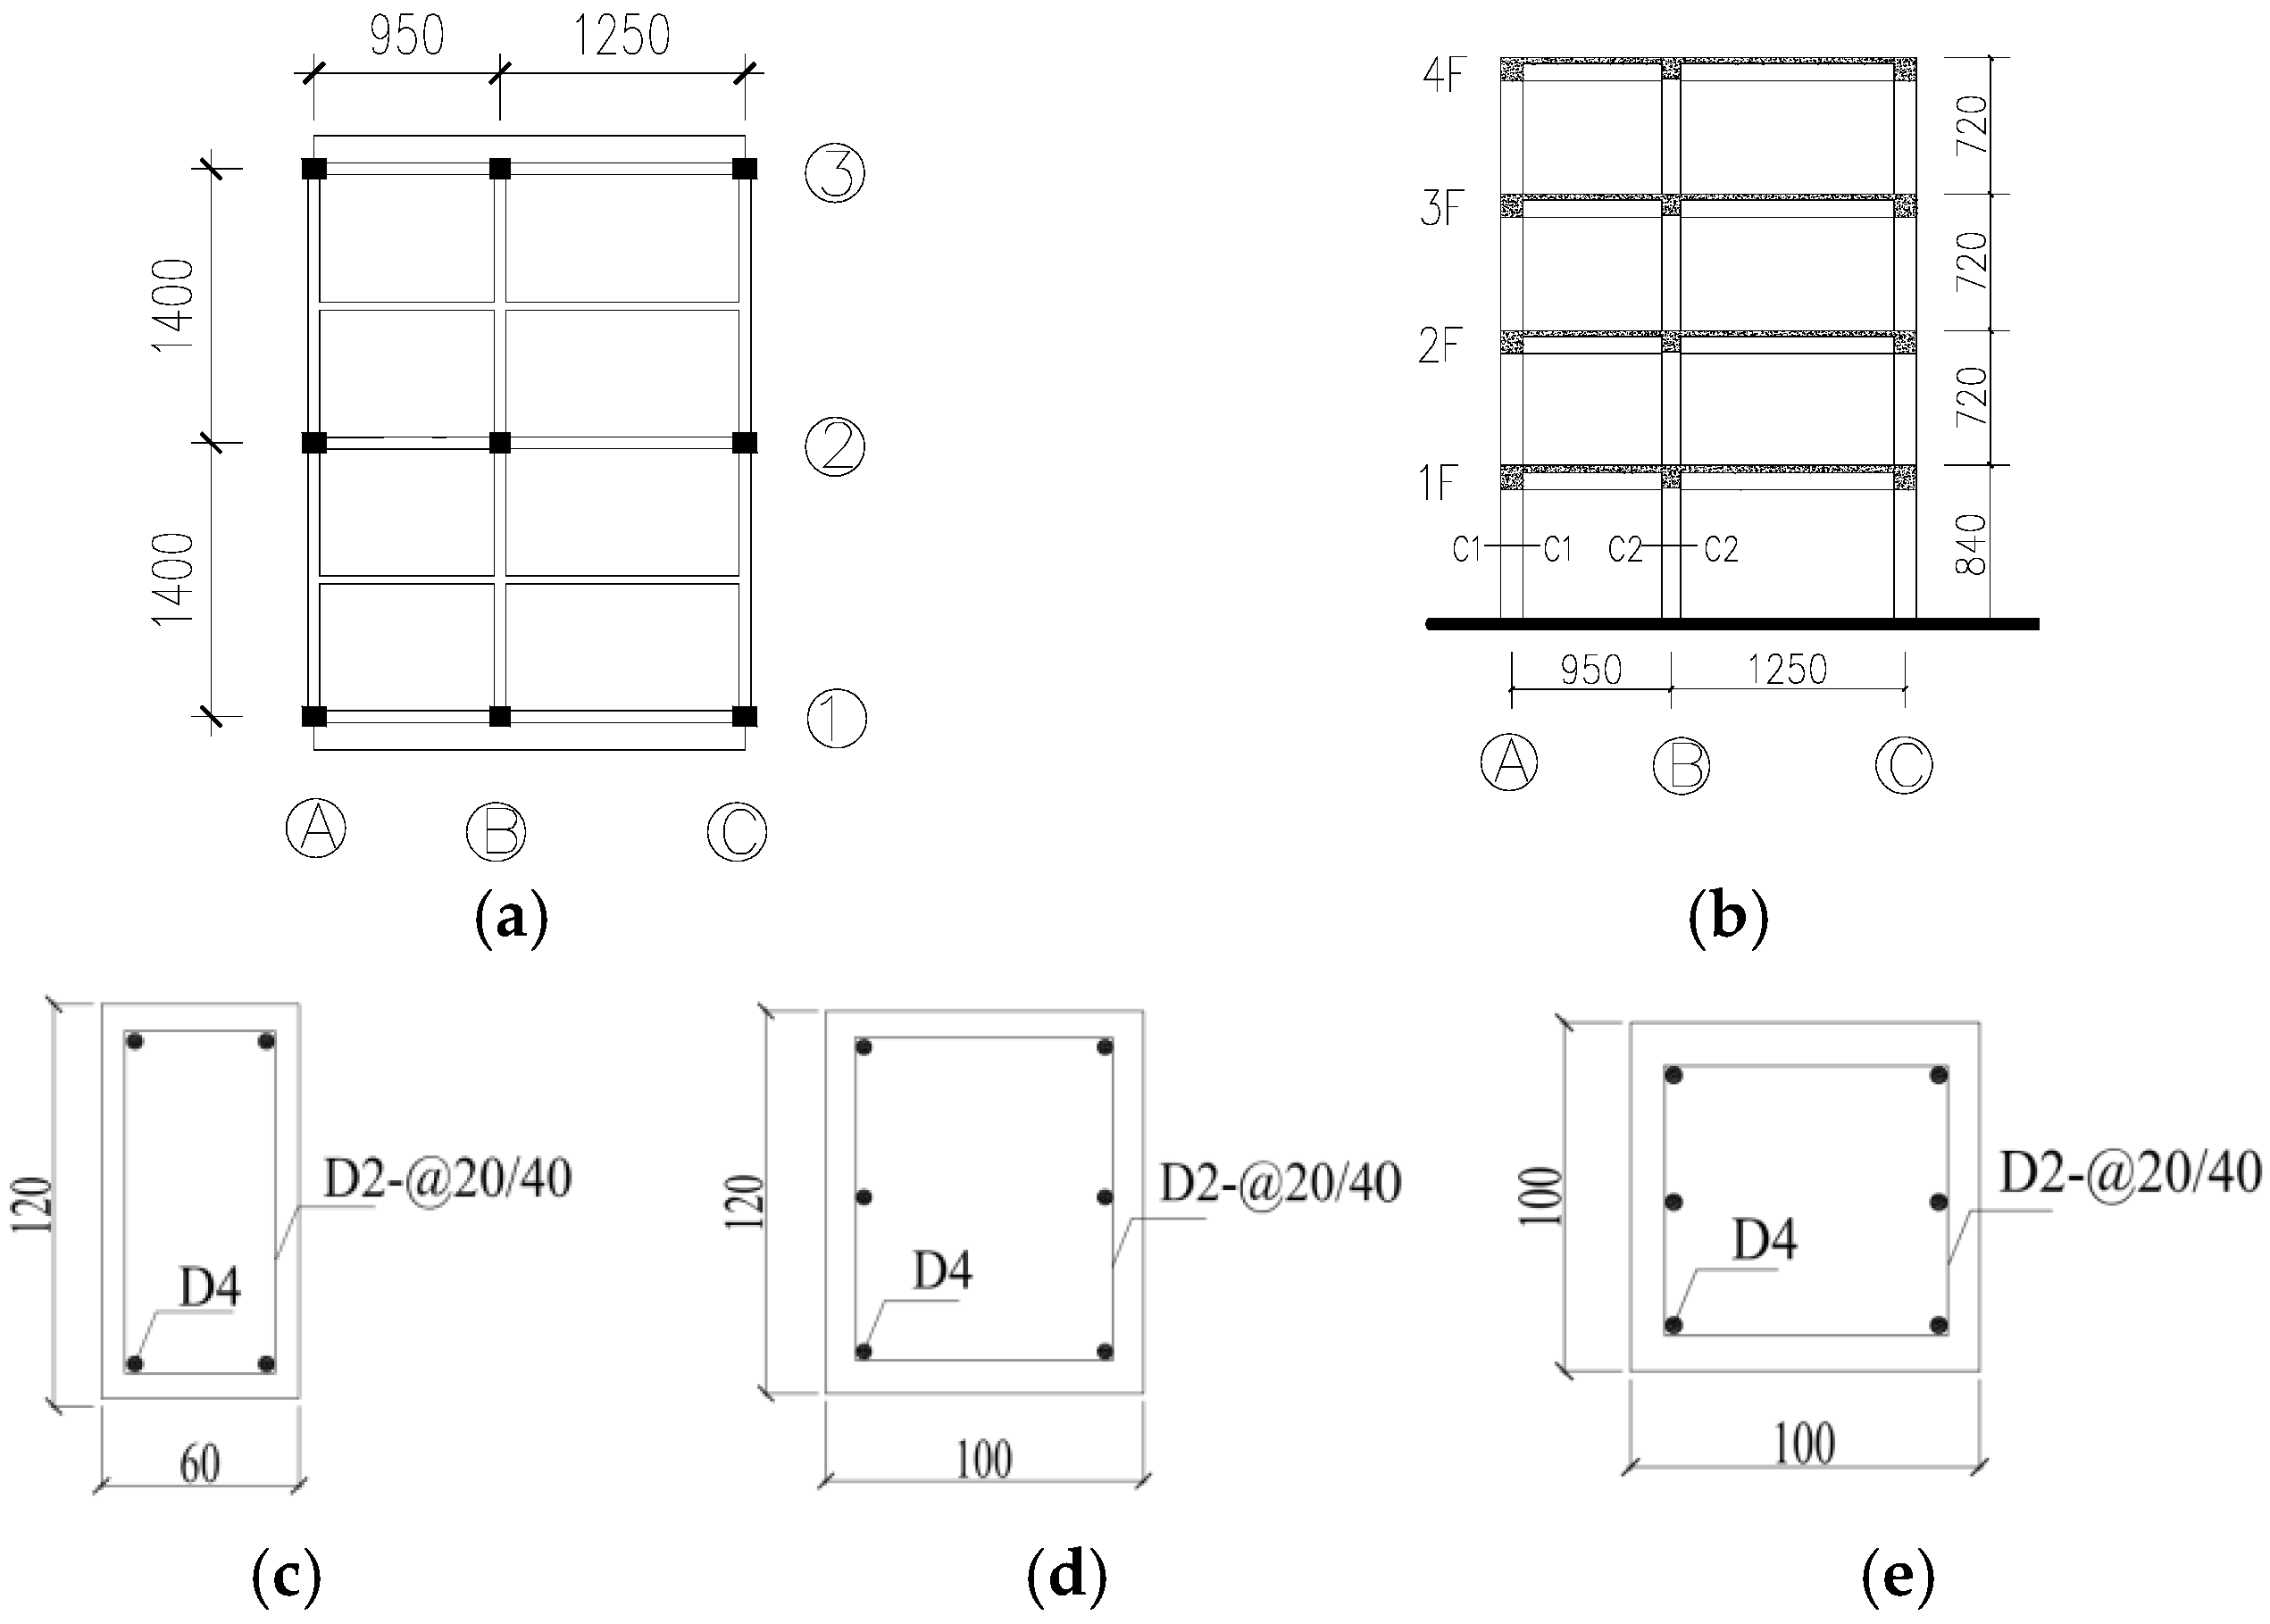
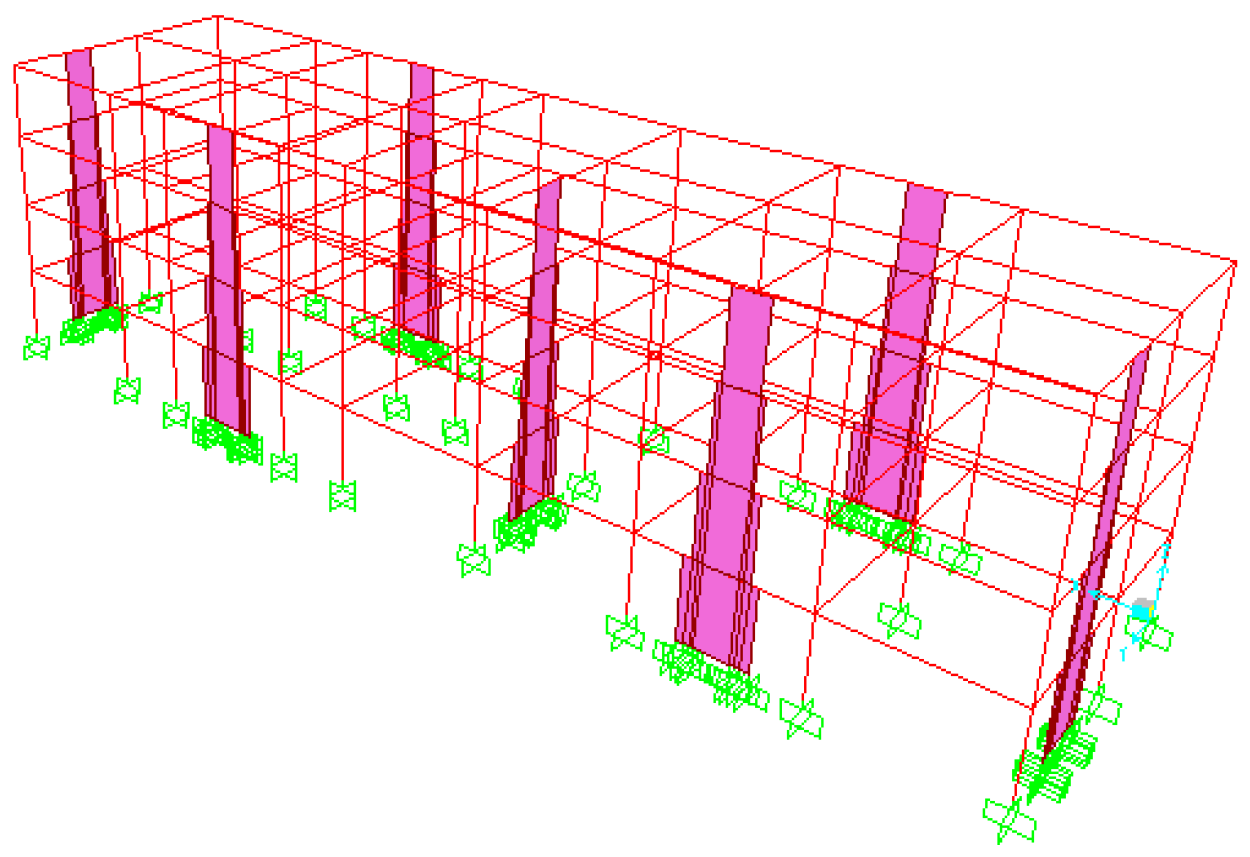
PGA) of the area with seismic intensity 9 is about 0.353 g to 0.707 g. This building has a four-story RC frame constructed in 2009, using C35 concrete. The fortification intensity of the region is seven degrees, with fortification peak ground acceleration of 0.15 g. The total length is 50.4 m, total width is 13.5 m, and the story height is 3.6 m. The structural information is shown in
Figure 1.
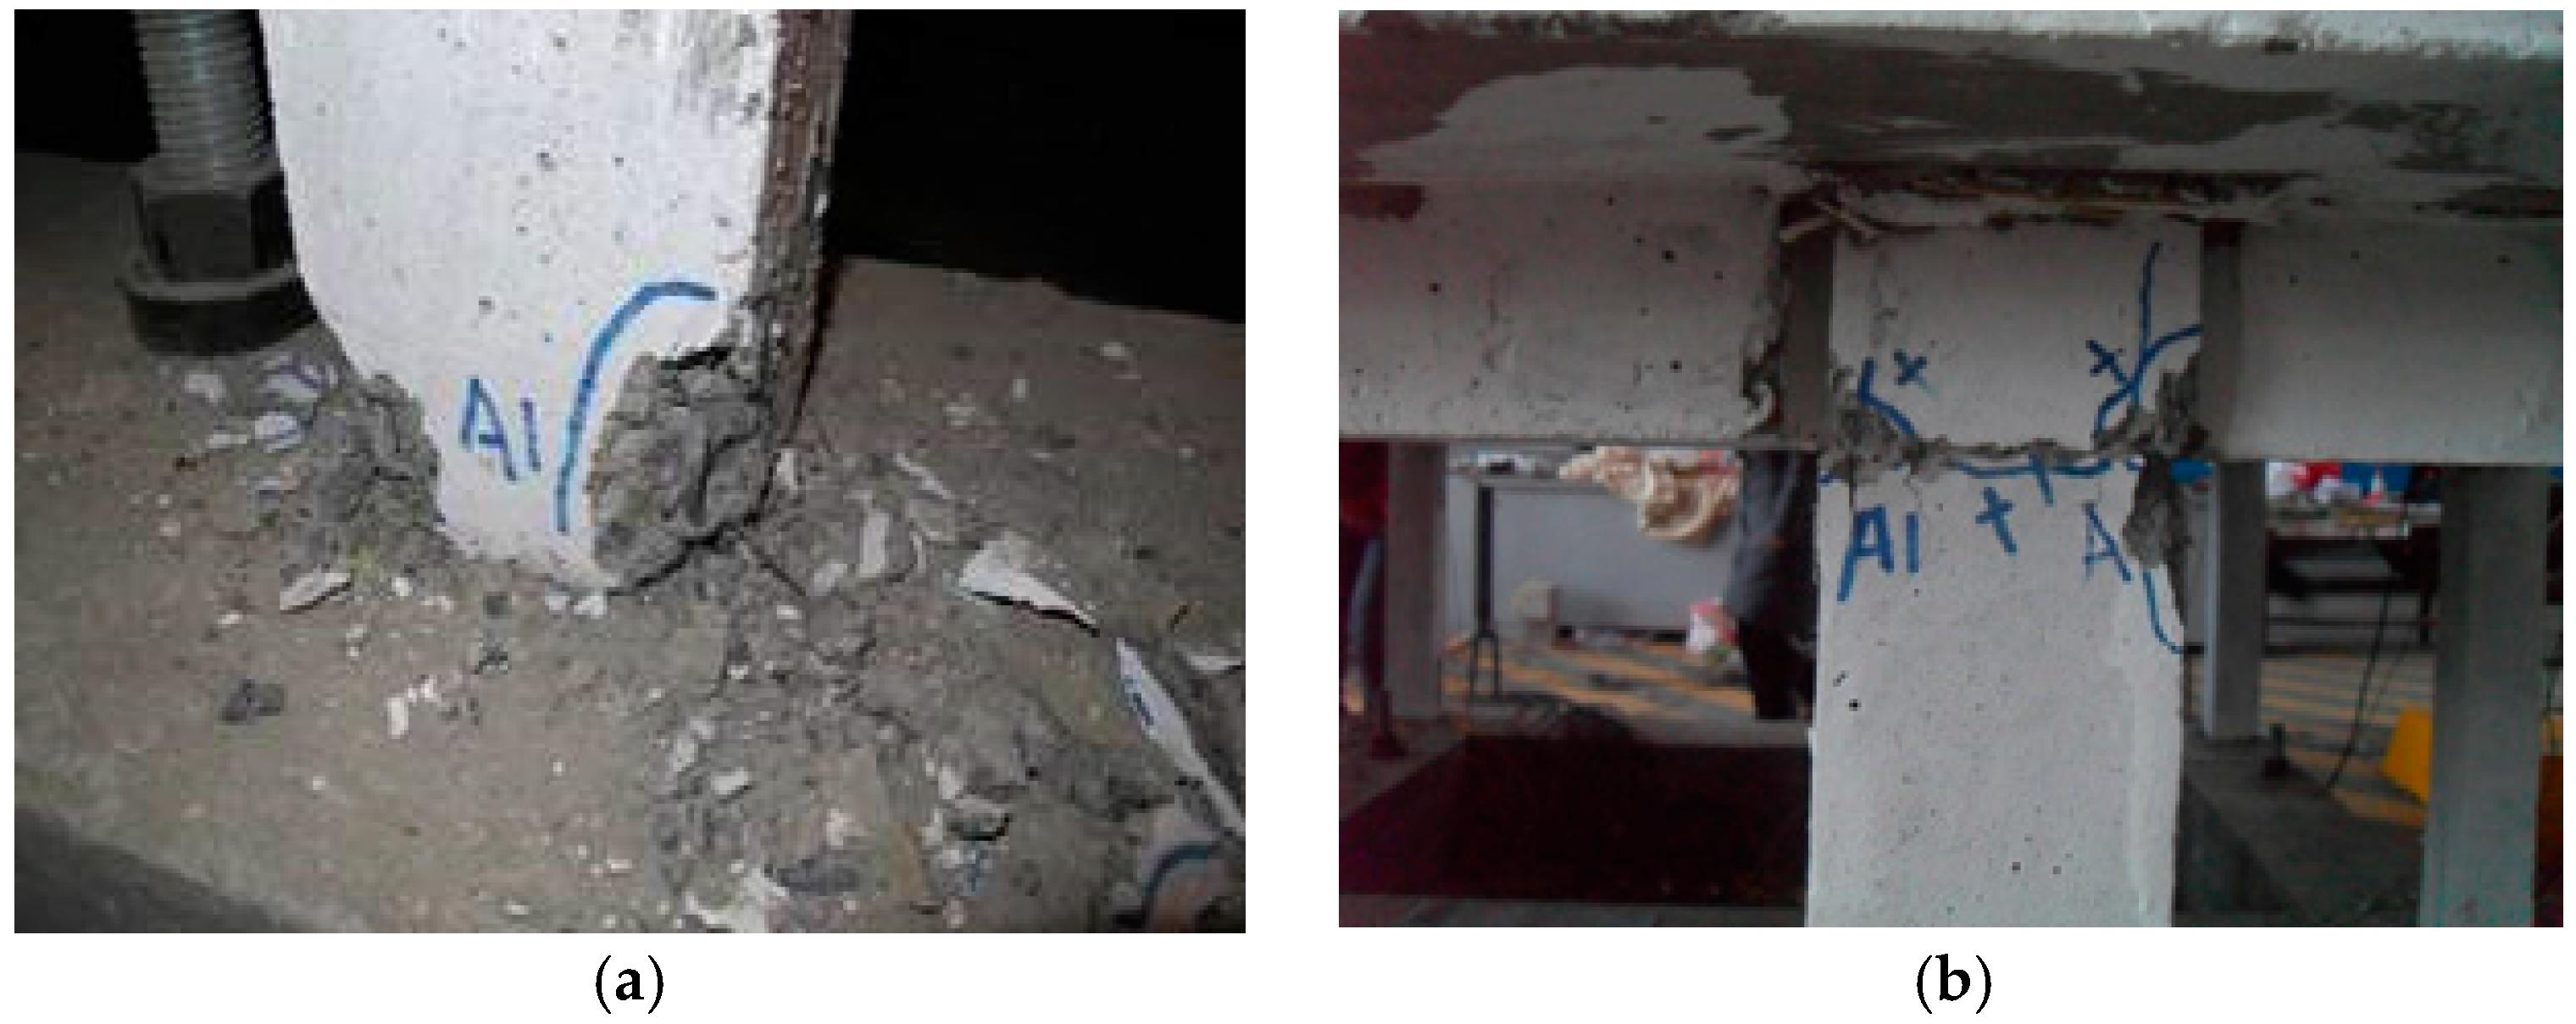
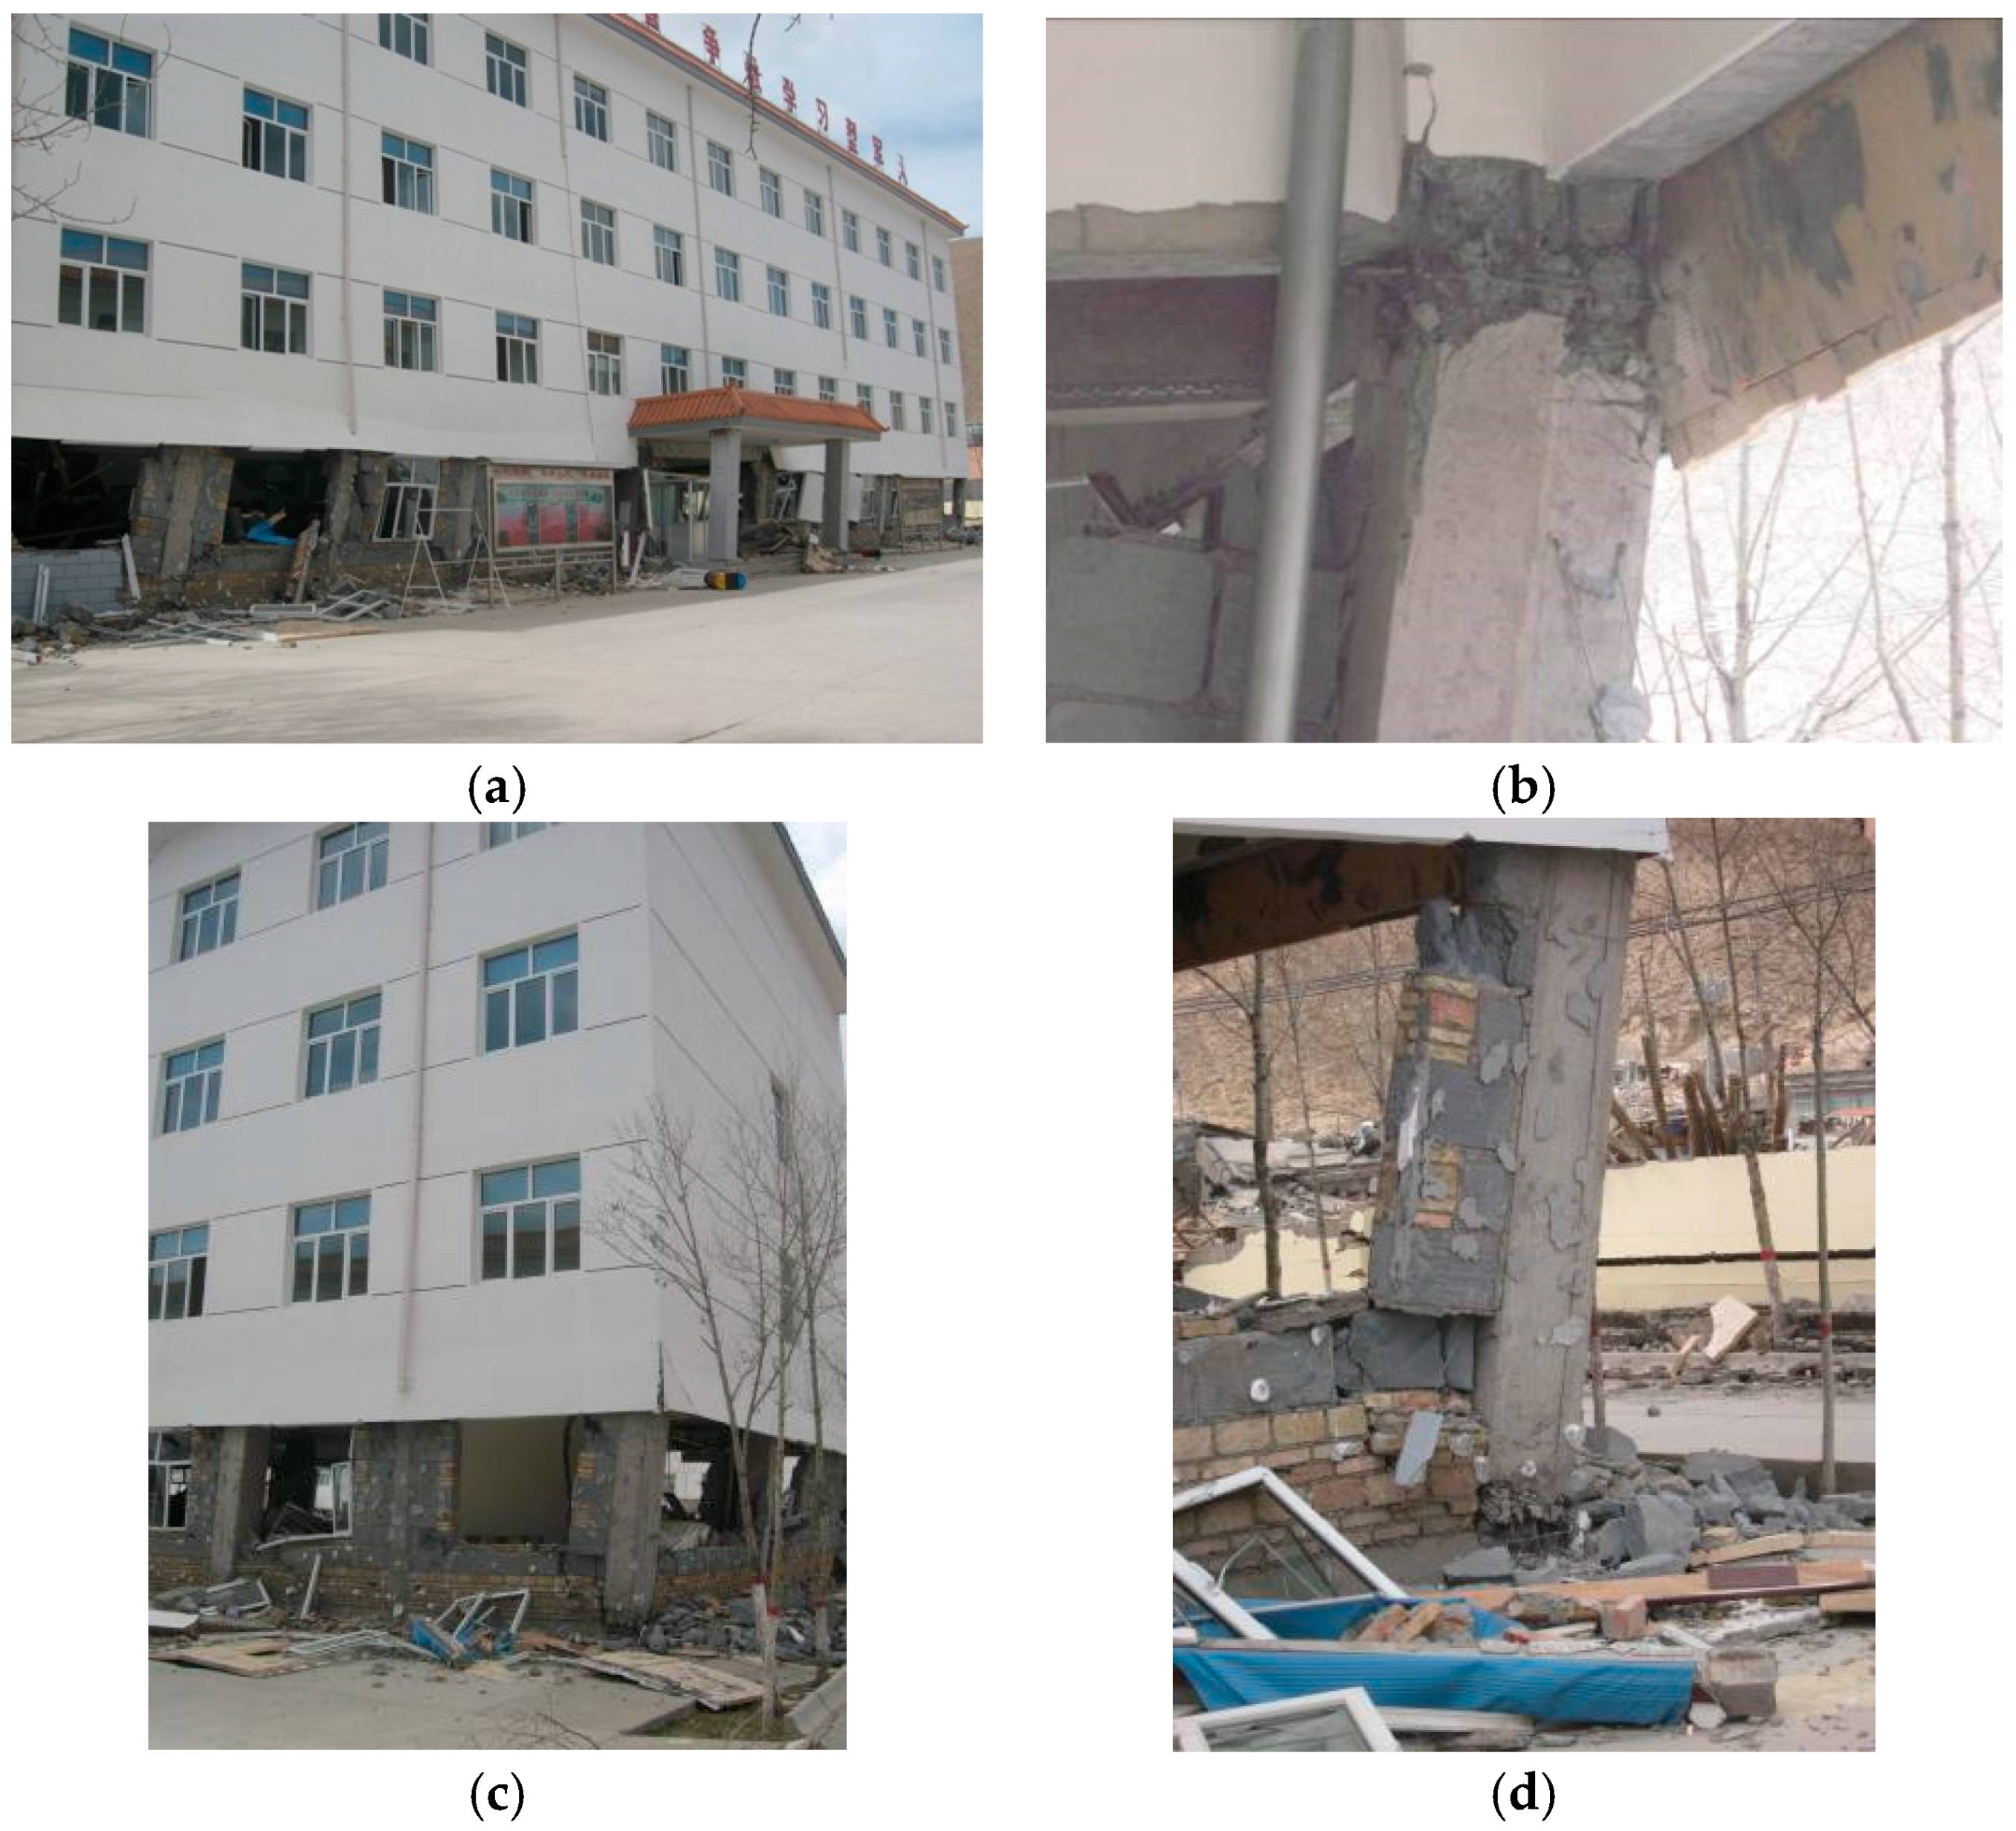
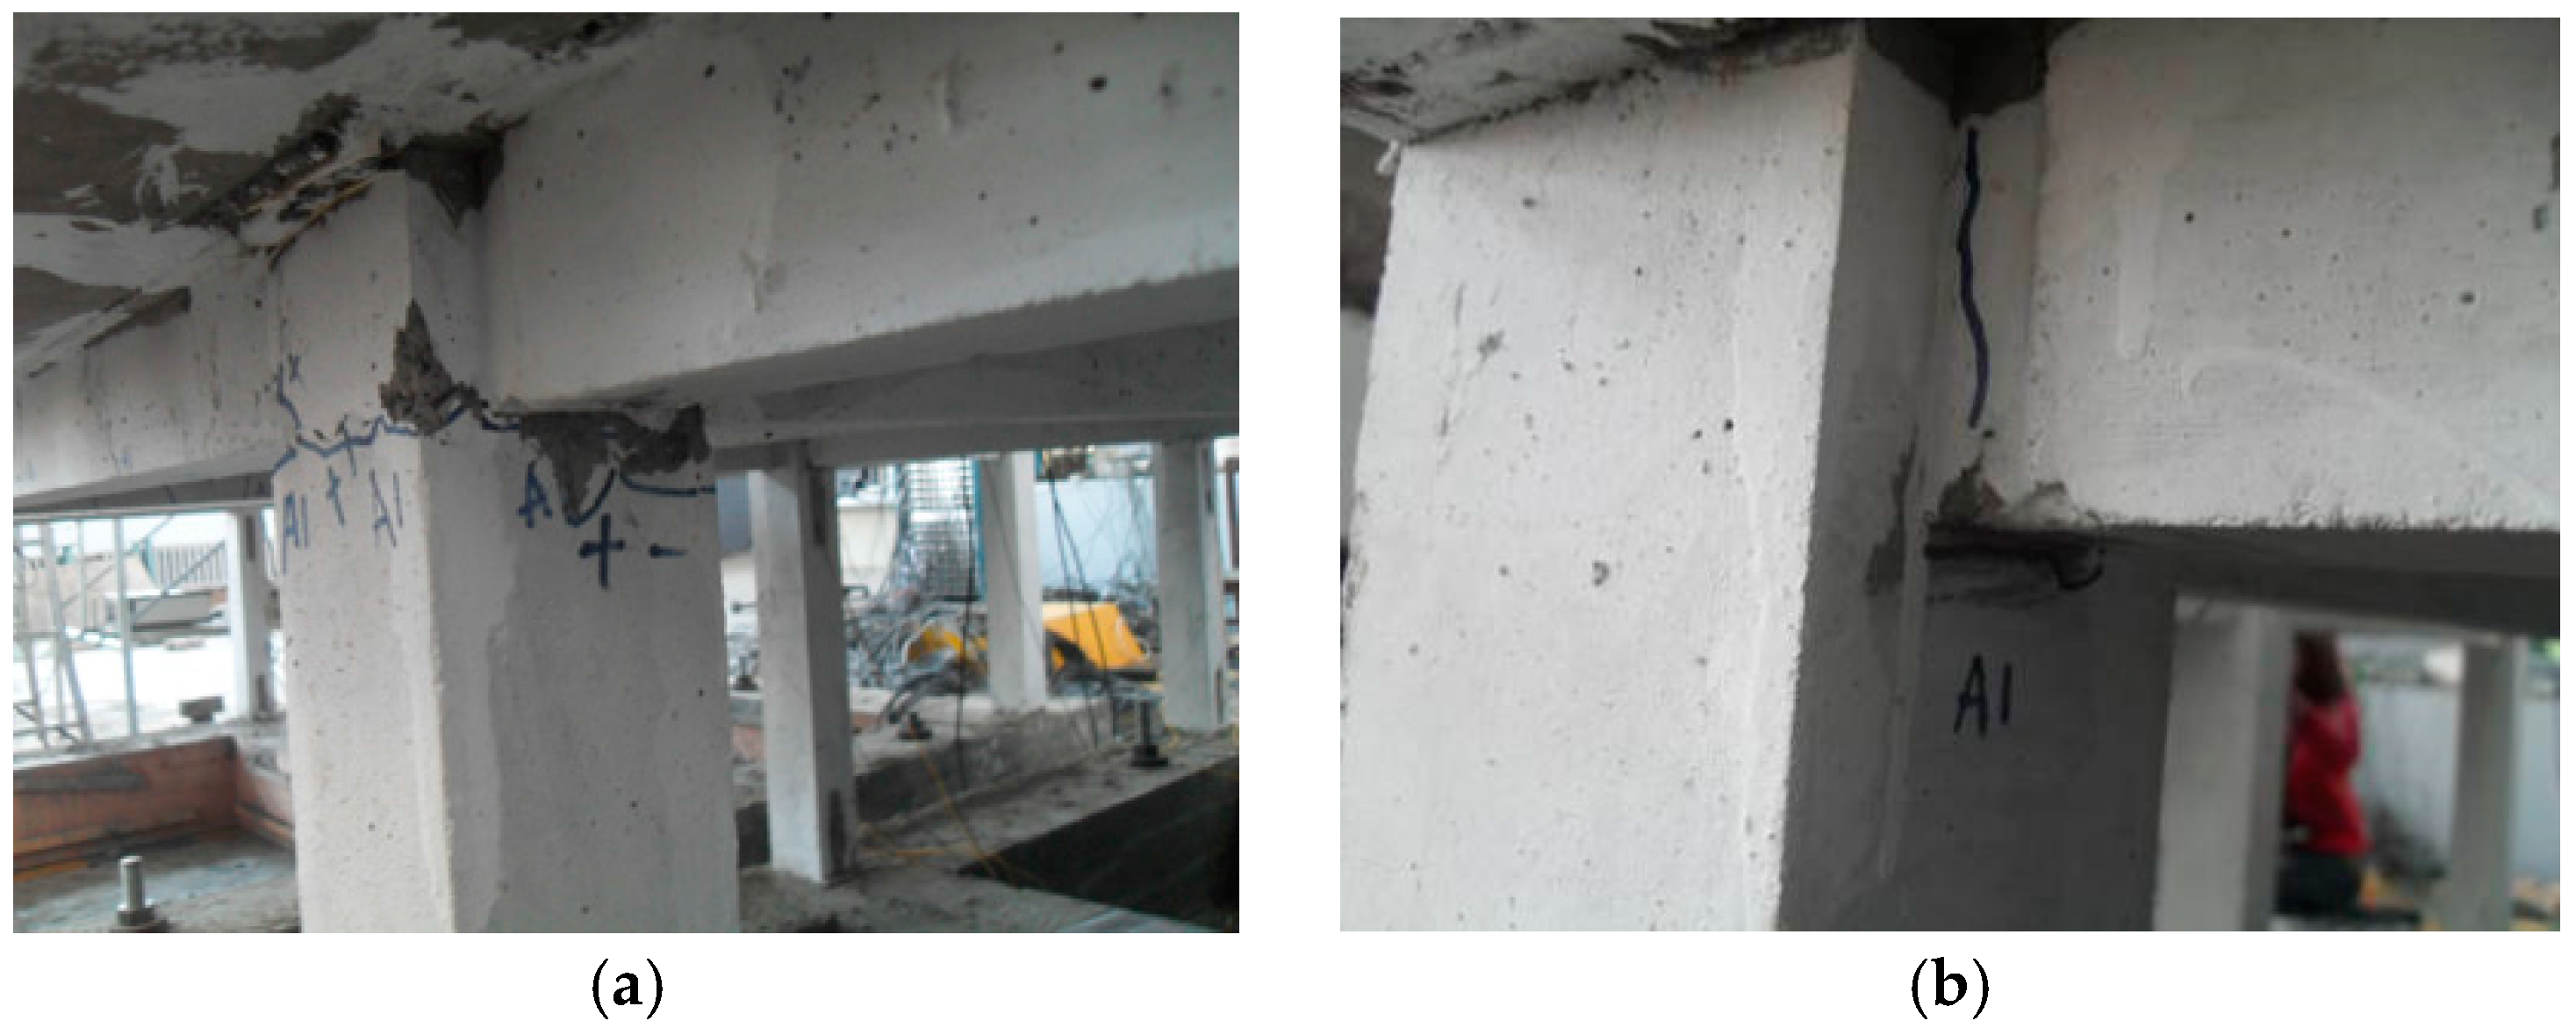
Massive concrete spalling and reinforcement buckling were observed at most column ends in the bottom story after the earthquake. The infilled wall in the bottom story was completely destroyed. Large residual deformation occurred in the bottom story, and the structure was nearly collapsed. As the bottom story absorbed most of the input seismic energy, the upper three stories were damaged slightly. The damage investigation after the earthquake is shown in
Figure 2. The shown damage mechanisms of bottom weak story and ‘strong beam–weak column’ were widely observed in the past earthquakes in China, e.g., the 2008 Ms 8.0 Wenchuan earthquake and the 2013 Ms 7.0 Lushan earthquake.
Although the ‘strong column–weak beam’ mechanism is desired in the seismic design, the past earthquakes have proved that it is difficult to achieve this preferable damage mode. This phenomenon may be attributed to many reasons, such as the influence of floor slabs, additional flexural strength in beams due to “beam growth” [
30,
31], and flexural deformation of beams limited by the overhead infills. Although the prototype was designed with column moment amplification factor, the desired mechanism was not achieved.
4. Discussion of the Corresponding Remedy Measures
4.1. Objective
The performed test and earthquake field investigation shows that columns are the key issues for the structural collapse in the traditional multi-story RC frames. In the test, the seismic shear force, gravity and additional axial force generated by overturning moment were all carried by the columns in the frames, which always caused plastic hinges to be formed at the ends of columns. Although codes for seismic design in most countries employed the moment augment factor of columns, it is difficult to change this situation. The enhancing effect by the cast-in-situ slabs promoted the mechanisms of ‘strong beam–weak column’, then the ‘weak story collapse’ occurred. Besides, inertia force accumulated from the top to the bottom of the building leads to maximal seismic shear force in the bottom story, and the distribution characteristic of lateral drift in low-rise RC frames is that the top is smaller than the bottom. These reasons all led to the bottom story becoming the weak story, and then the structure collapsed.
Past earthquakes have proven that it is difficult to solve the above problems by measures in component level. Therefore, dual systems, i.e., systems combining frames and additional members that mainly carry seismic loading become a common choice for multi-story RC buildings. They could be used both in the new construction buildings and in the retrofit for the existing structures. For these dual systems, if the uniform distributed mode of inter-story drifts could be realized, the overall damage mechanism would be achieved and the weak story mechanism would be avoided. Then, the seismic collapse resistance of RC frames would be significantly improved.
For this purpose, a practical stiffness iteration design method based on the nonlinear static analysis to obtain the optimal stiffness demand of the lateral load resisting members in each story is proposed, which aims to control the deformation pattern along the height. The nonlinear effect could be considered and the target deformation value could be set artificially in this method which fulfills the idea of performance-based structural seismic design theory.
4.2. Procedure
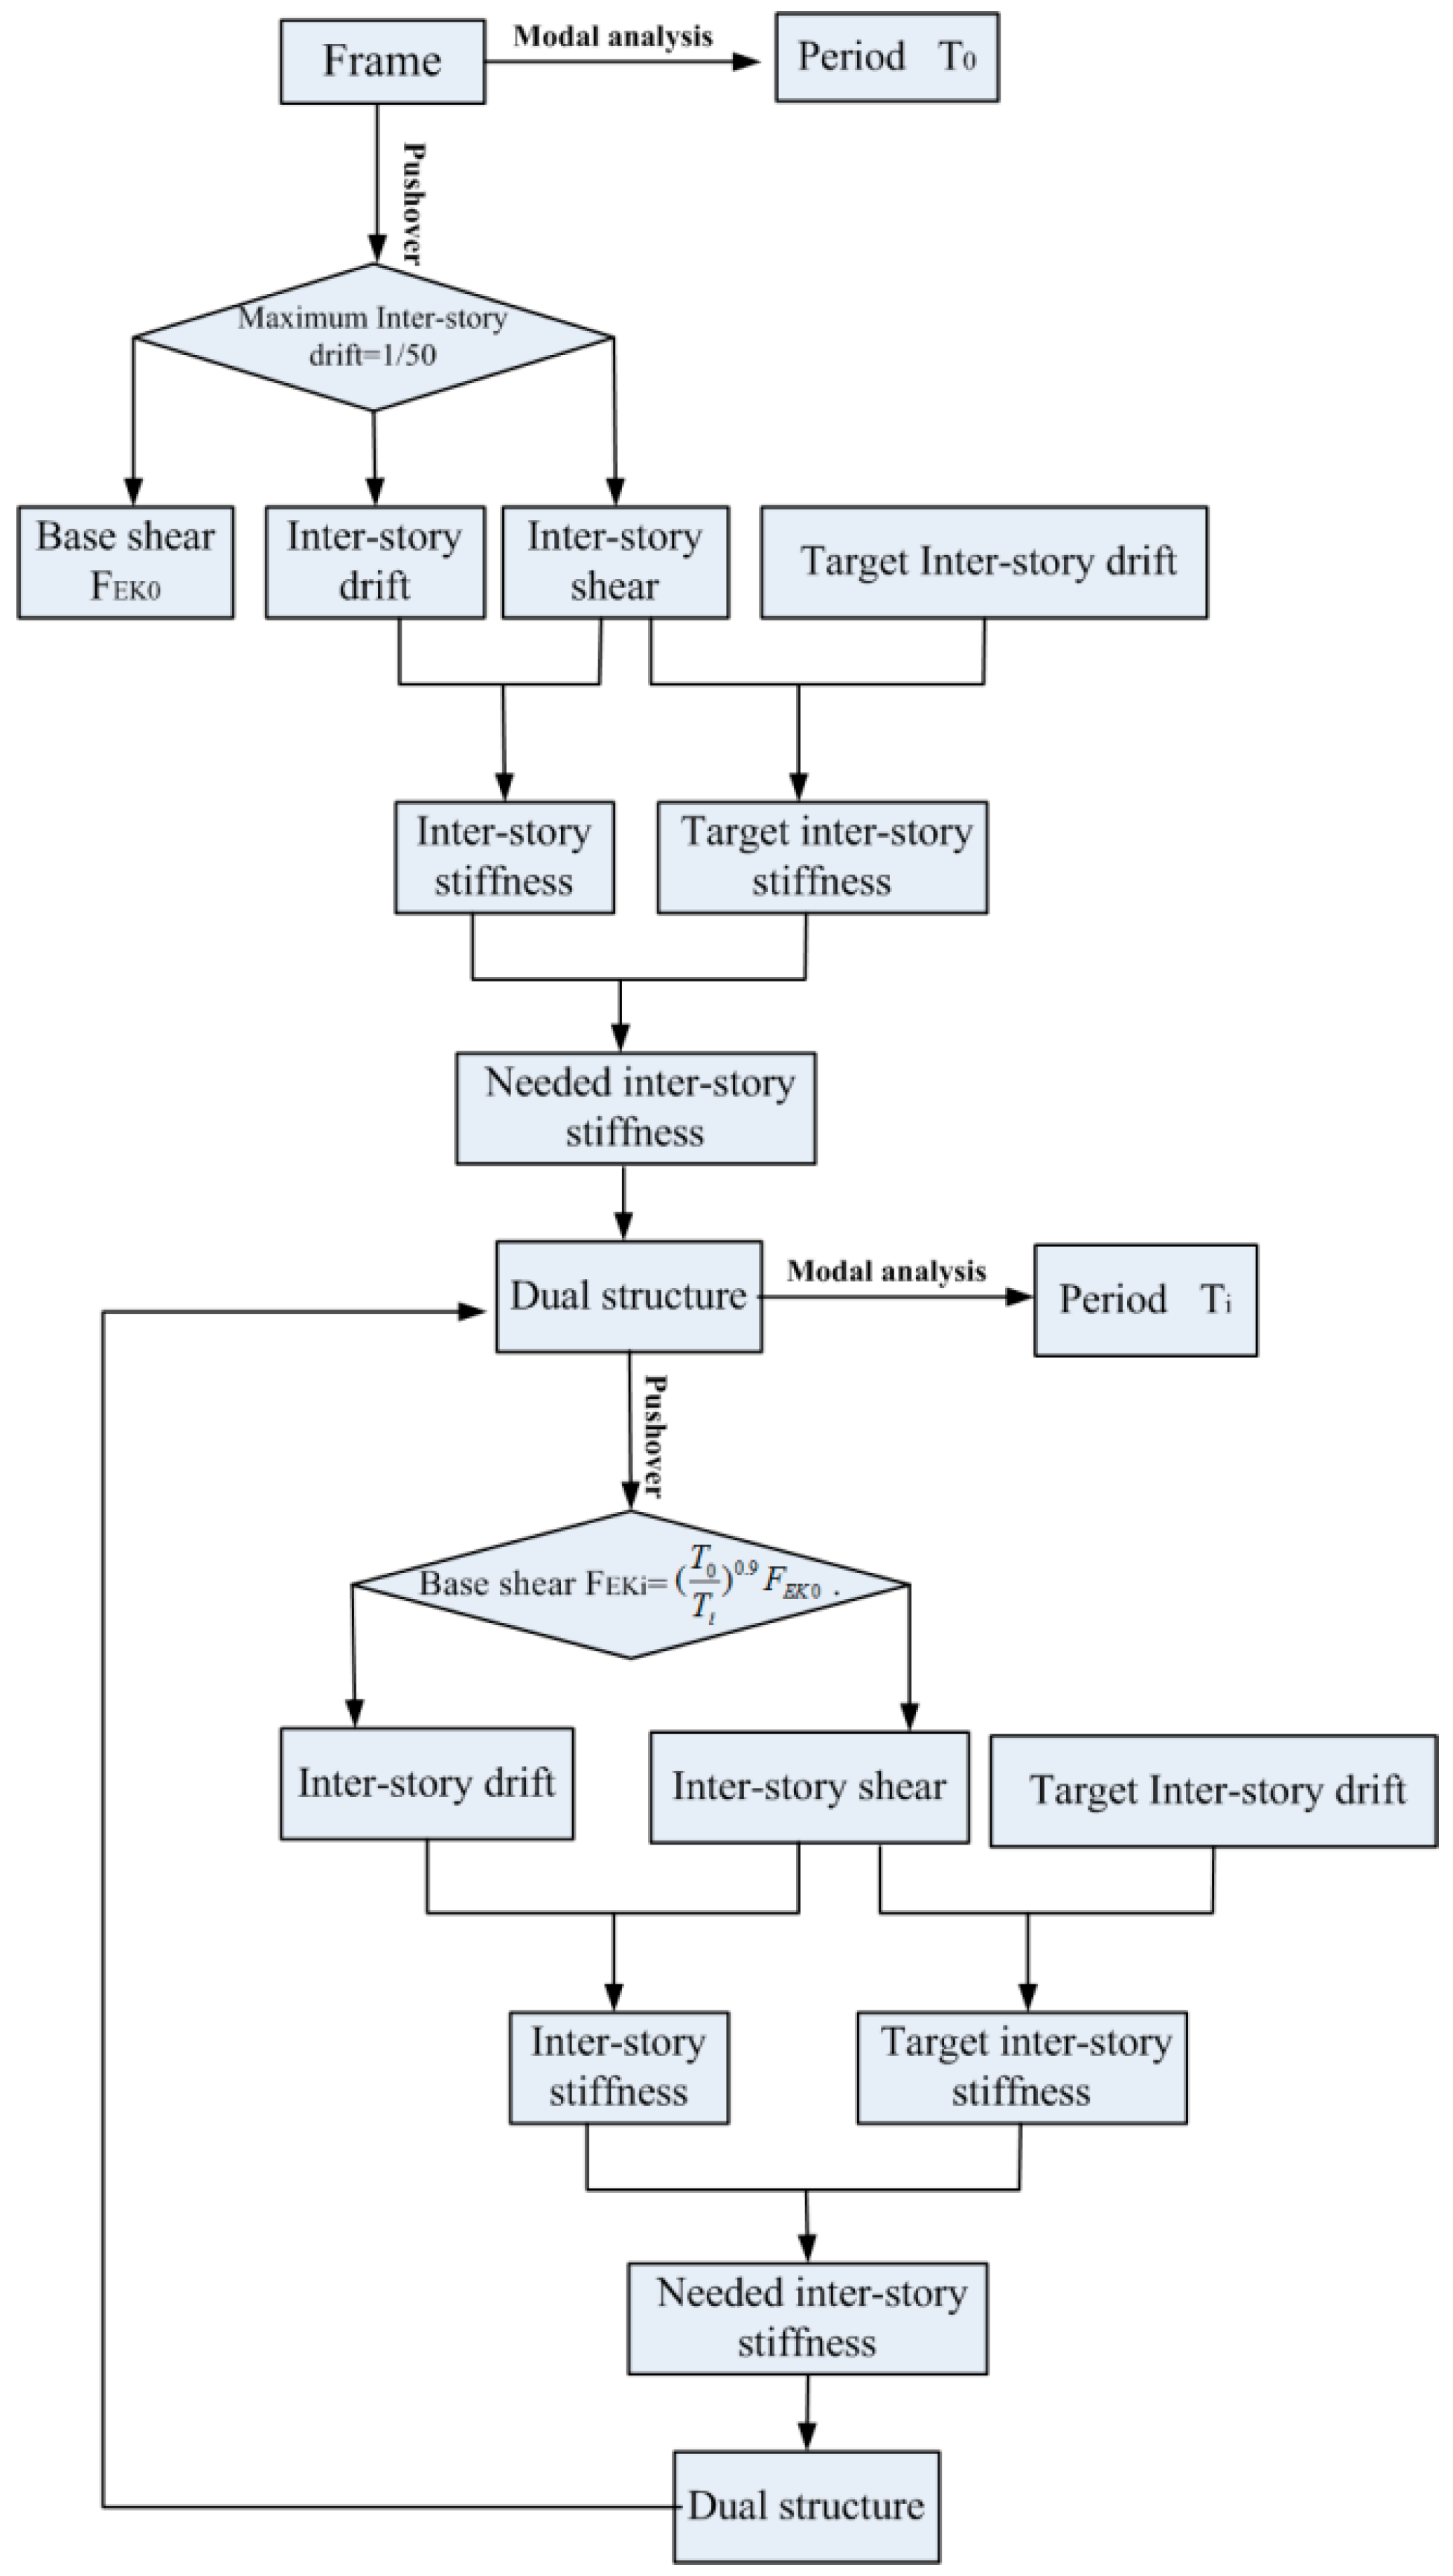
Nonlinear static analysis is used to consider the nonlinear effect, and
Figure 15 shows the design procedure of the dual structural system. First, pushover of the initial frame structure is carried out. The inter-story shear and drift when the maximum inter-story drift reaches 1:50, which is the drift limit to prevent structural collapse according to the Chinese seismic design code, could be obtained. Thus, the inter-story stiffness could be easily calculated. Then, a target maximum inter-story drift of the dual structural system needs to be set manually. The target inter-story stiffness could be obtained by dividing the inter-story shear force by the target maximum inter-story drift. Then, the needed lateral stiffness could be obtained by the target inter-story stiffness minus existing inter-story stiffness. The dimensions of lateral force-resisting members could be designed by the needed lateral stiffness, which means a new dual structure is designed. The only issue to note here is that the used inter-story shear force when we calculated the target inter-story stiffness is from the previous frame structure, not from the present dual structure, so some error is inevitable. Thus, repeated iterative design of the new dual structure is needed until all the inter-story drifts of the designed structure are close to the set target inter-story drift.
The inter-story drifts of improved structure is expected to be close to the target inter-story drift under the seismic intensity when the maximum inter-story drift of the initial RC frame reaches 1:50. Therefore, an important issue is how to determine this corresponding seismic intensity. Response method in the code for seismic design of buildings in China is used in this paper (
Figure 16). In the general case, the natural period of multi-story RC frames is in the stage of
Tg–5
Tg in the seismic effect coefficient curve. The seismic effect coefficient could be calculated based on Equation (4).
where
α represents the seismic effect coefficient,
αmax is the maximum seismic effect coefficient,
Tg denotes the characteristic period of site,
T is the structural natural period,
ζ represents the structural damping ratio and could be calculated as 0.05 for reinforced concrete structures.
The structural base shear force
FEK =
αGeq, where
Geq denotes the representative value of gravity load. The base shear force when the maximum inter-story drift of the initial frame reaches 1:50 could be got in the first pushover analysis. The structural natural period changed as lateral force-resisting members were added, and the seismic effect coefficient and base shear force changed accordingly. The relationship of base shear in the two structures could be calculated based on Equation (7), thus the expected base shear under the according seismic intensity is obtained. Only the inter-story drift of the improved dual structure needs to be checked with the target value under this base shear in the design procedure.
where
FEK0 denotes the base shear when the maximum inter-story drift of the initial frame reaches 1:50,
FEKi denotes the base shear when the
ith pushover analysis is terminated,
T0 is the natural period of the initial frame structure, and
Ti is the natural period of the dual structure designed after the
ith pushover analysis.
4.3. Example
The prototype in
Figure 1 was promoted to a dual structural system based on the above methodology. Structural walls with different widths were added in each story to provide optimum lateral stiffness. The determination of target inter-story drift fulfills the concept of performance-based earthquake engineering, and a key issue is the contradiction between cost and benefit. Therefore, a reasonable seismic fortification goal considering demand and seismic hazard needs be determined by the investors. Xu et al. performed a comparative shake table test on a dual structure and an ordinary frame structure [
37].The studies showed that the maximum inter-story drift ratio of the dual structure with added wall area ratio of 0.32% and ordinary frame structure is 1:87,and 1:50 under the same ground excitation. In this study, the target inter-story drift ratio is also set as 1:87. The thickness of the added walls is 200 mm;
Table 6 shows the calculation procedures. The calculation result of the width of added walls in each story is 2957 mm for the first story, 2308 mm for the second story, 1842 mm for the third story and 0 mm for the fourth story. The final design scheme is 3000 mm for the first story, 2300 mm for the second story, 1800 mm for the third story and 1500 mm for the fourth story after modification for the dynamic effect and continuity demand of vertical members, as shown in
Figure 17.
Nonlinear time history analysis on both structures was performed by IDARC to assess the improvement of the seismic performance. The seismic fortification intensity of the initial frame structure is VII, and the fortification peak ground acceleration is 0.15 g. So, seismic intensity of
PGA = 0.31 g and 0.51 g was performed to simulate the rare and very rare earthquake action. In total, strong motion recordings were chosen as the input, as shown in
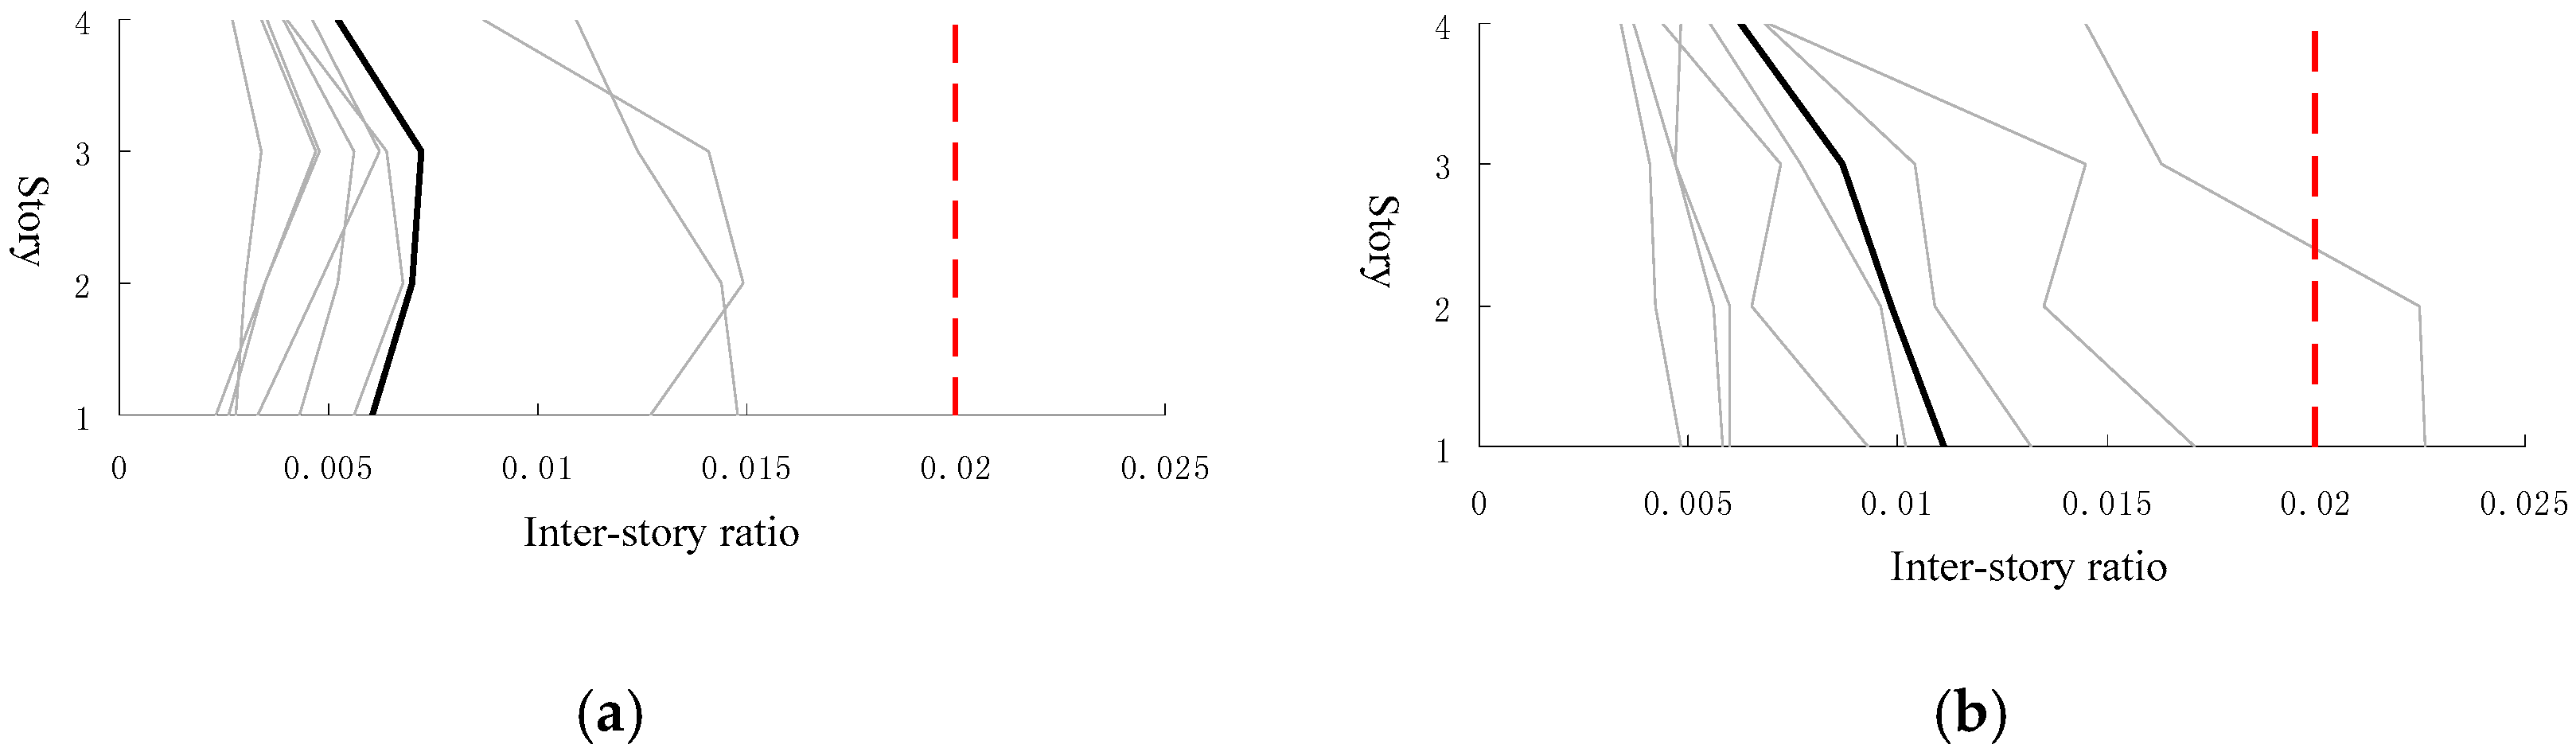
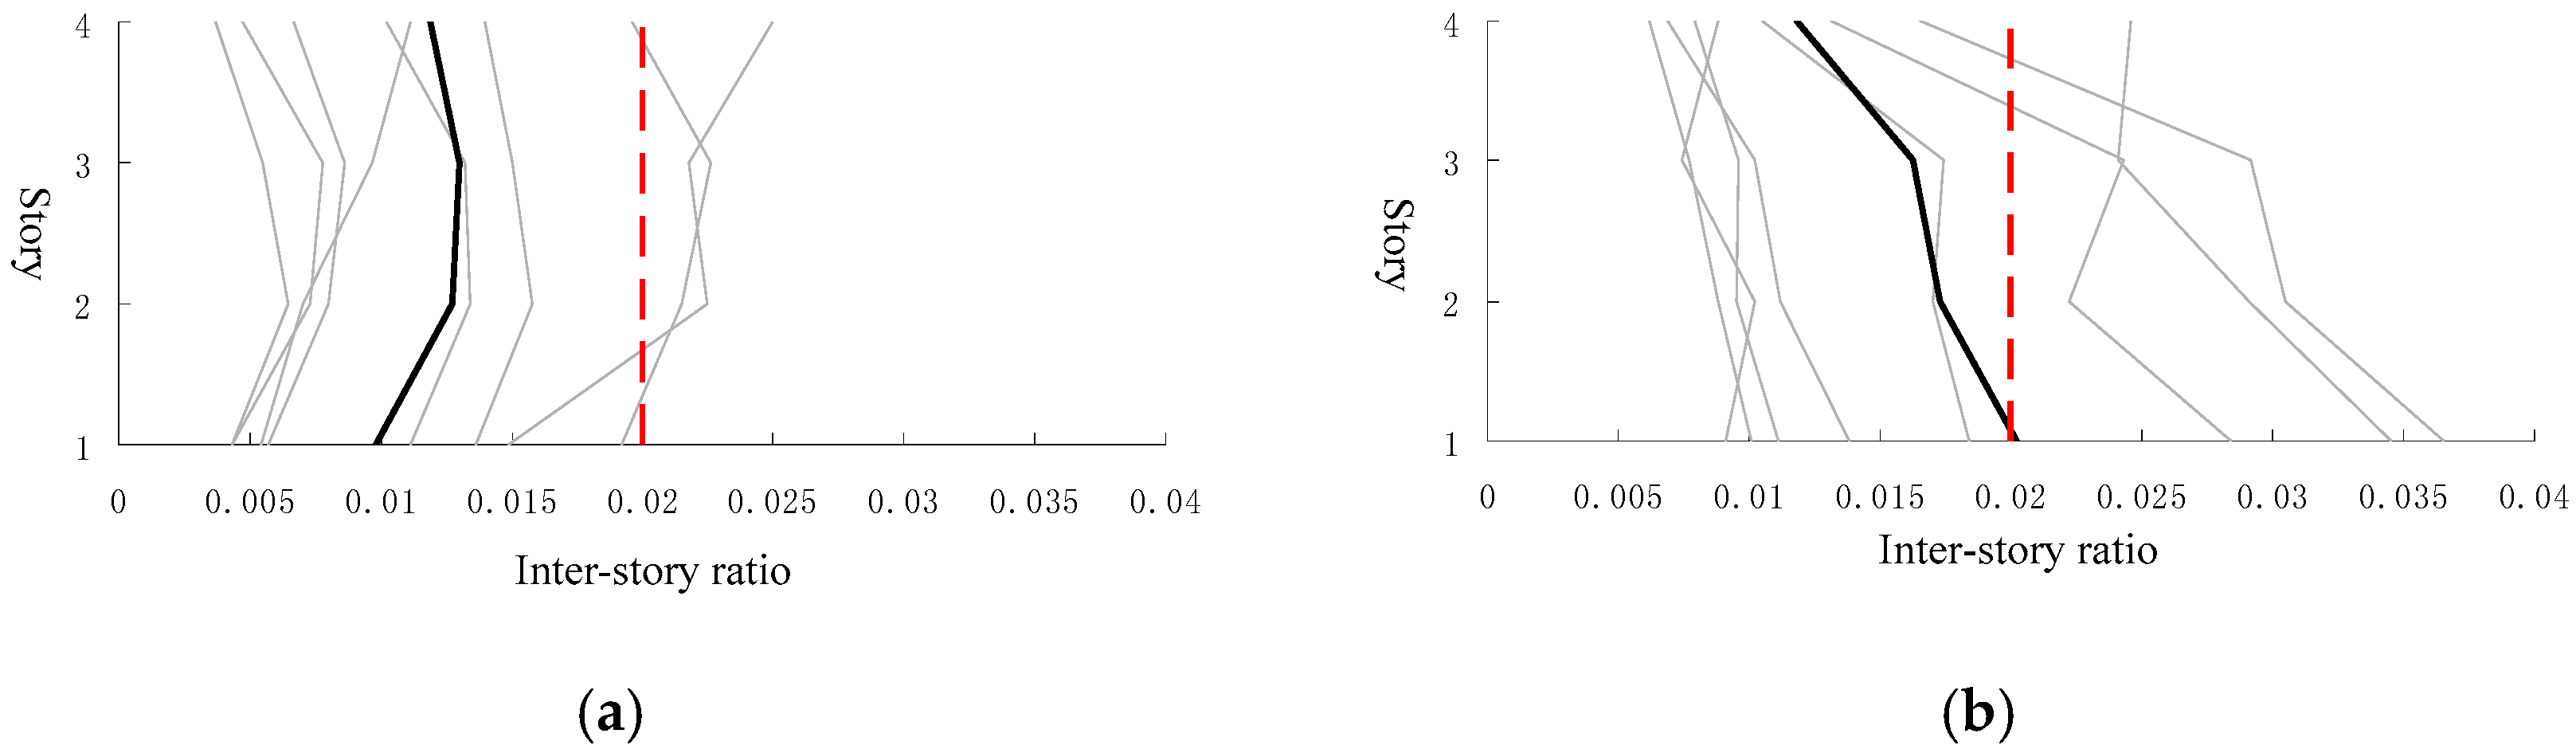
Table 7. The displacement responses of both structures are shown in
Figure 18 and
Figure 19.
The results show that the maximum inter-story drift of the bare frame occurred in the bottom story, which agreed with the performed shake table test. The inter-story drift of the dual structure is significantly smaller than that of the bare frame and becomes more uniform along the stories. The maximum inter-story drifts of the dual structure are all less than 0.02 with mean value of 0.007, while that of the bare frame structure exceeded 0.02 in one input with a mean value of 0.011 under the excitation of PGA = 0.31 g. The maximum inter-story drifts of the dual structure exceeded 0.02 in two inputs with mean value of 0.013, while that of bare frame structure exceeded 0.02 in three inputs with mean value of 0.02 under the excitation of PGA = 0.51 g.
5. Conclusions
In this work, shake table collapse test of a typical four-story RC frame building model was performed. The structural collapse mode and mechanism were analyzed. The corresponding remedy measures were also discussed. The following primary conclusions can be achieved:
The test and earthquake field investigation show that severe damage mainly occurs at the column ends. This further confirms that the expected damage pattern of ‘strong-column–weak-beam’ is difficult to be realized in the context of current structural seismic design approach. For multi-story RC frame structures, the bottom story is always prone to being the weak story. The pancake collapse mode starting from the bottom story was observed during the test, which was especially commonly observed in many past earthquakes in China. Besides, the experimental data in this study could be used as a reference for further numerical study.
Dual structural systems could be a better way to solve the unexpected damage mechanism of RC frames. For this purpose, a practical stiffness iteration design method based on nonlinear static analysis to obtain the optimal stiffness demand of the lateral load resisting members in each story is proposed in this paper, which aims to control the deformation pattern along the height. It could be applied in the design of multi-story structural wall-frame structures, brace frame structures, etc.


