
Measurement of the Resonant Magneto-Optical Kerr Effect Using a Free Electron Laser

Institute for Solid State Physics, The University of Tokyo, Kashiwa, Chiba 277-8581, Japan
*
Author to whom correspondence should be addressed.
Appl. Sci. 2017, 7(7), 662; https://doi.org/10.3390/app7070662
Submission received: 1 June 2017
/
Revised: 20 June 2017
/
Accepted: 21 June 2017
/
Published: 27 June 2017
(This article belongs to the Special Issue X-Ray Free-Electron Laser)
Abstract
:We present a new experimental magneto-optical system that uses soft X-rays and describe its extension to time-resolved measurements using a free electron laser (FEL). In measurements of the magneto-optical Kerr effect (MOKE), we tune the photon energy to the material absorption edge and thus induce the resonance effect required for the resonant MOKE (RMOKE). The method has the characteristics of element specificity, large Kerr rotation angle values when compared with the conventional MOKE using visible light, feasibility for M-edge, as well as L-edge measurements for 3d transition metals, the use of the linearly-polarized light and the capability for tracing magnetization dynamics in the subpicosecond timescale by the use of the FEL. The time-resolved (TR)-RMOKE with polarization analysis using FEL is compared with various experimental techniques for tracing magnetization dynamics. The method described here is promising for use in femtomagnetism research and for the development of ultrafast spintronics.
1. Introduction
Femtomagnetism, which refers to magnetization dynamics on a femtosecond timescale, has been attracting research attention for more than two decades because of its fundamental physics and its potential for use in the development of novel spintronic devices [1]. The ultrafast dynamics of femtomagnetism can be accessed using ultrashort laser pulses to perturb magnetic materials via thermal and nonthermal effects. This produces a system of strongly-nonequilibrium states [2]. Immediately after a sudden disturbance, magnetic systems show demagnetization due to a transition from ferro-/ferri-magnetism to paramagnetism that is caused by impulsive heating. Additionally, in certain magnetic compounds, such as ferromagnetic alloys and ferrimagnets composed of rare-earth and transition metals, the magnetization is reversed on a femtosecond timescale [3]. Laser-induced phase transitions from antiferromagnetic to ferromagnetic phases [4] and optical control of the spin precession have also been reported [5]. These ultrafast demagnetization and magnetization reversal phenomena, and particularly the mechanism of spin-flips, have been interpreted from various phenomenological viewpoints [1,6,7]. Interactions between the electron, spins, lattices and photon fields have been incorporated in some models. In addition, superdiffusive spin transport [8] and interactions with collective excitations such as phonons and magnons [9] have also been considered in other models.
While the magnetization dynamics, especially on the femtosecond timescale, remain controversial from the microscopic perspective, a number of experimental techniques for probing of the transient characteristics have emerged to meet the demand for probing methods that are suitable for a wide variety of magnetic materials. One of these techniques is the magneto-optical Kerr effect (MOKE) method, which has been applied to investigations of static bulk/surface magnetism, spin transport and magnetization dynamics using linearly-polarized light [10]. These experiments have mainly been conducted in the visible range. In previous studies, MOKE in the soft X-ray range, which involves tuning of the photon energy to the absorption edge of a target magnetic element, has been investigated, and we call this method resonant MOKE (RMOKE) (see Equation (1)) in this review [11,12]. However, when it comes to the static magnetization measurements, the usefulness of RMOKE has not been focused on until now by the availability of other convenient soft X-ray magneto-optical measurement methods, such as X-ray magnetic circular dichroism (XMCD) spectroscopy [13,14]. Following the development of femtosecond light sources such as synchrotron radiation (SR) sources using a laser slicing technique, the free electron laser (FEL) and the high harmonic generation (HHG) laser, the RMOKE technique used in combination with these state-of-the-art light sources is becoming increasingly important, particularly for temporal domain measurements in the subpicosecond timescale. We first demonstrated time-resolved RMOKE (TR-RMOKE) measurements using the FEL in 2015 [15]. In this review, we clarify the importance of the RMOKE technique when using an extreme ultraviolet (EUV) FEL from the methodological view point and demonstrate time-resolved RMOKE measurements using a seeded FEL at FERMI@Elettra (FERMI-I is generally called X-ray ultraviolet (XUV) FEL).
In the next section, the MOKE is introduced in terms of two of its aspects: rotation and ellipticity. The experimental geometry of the MOKE is explained with respect to the magnetization components that can be detected when using each configuration. In Section 3, we give an overview of the magnetic probing techniques, including the MOKE, that have been used to investigate static magnetism and laser-induced magnetization dynamics in previous research. In this section, the characteristics of the TR-RMOKE technique are clarified. In Section 4, methods used to perform MOKE measurements in the visible and soft X-ray ranges are explained. In Section 5, the results of RMOKE measurements based on rotating analyzer ellipsometry are shown for the ferrimagnetic alloy GdFeCo. In Section 6, the TR-RMOKE measurement method is demonstrated using a soft X-ray FEL. In the final section, we summarize this review.
2. MOKE Phenomena
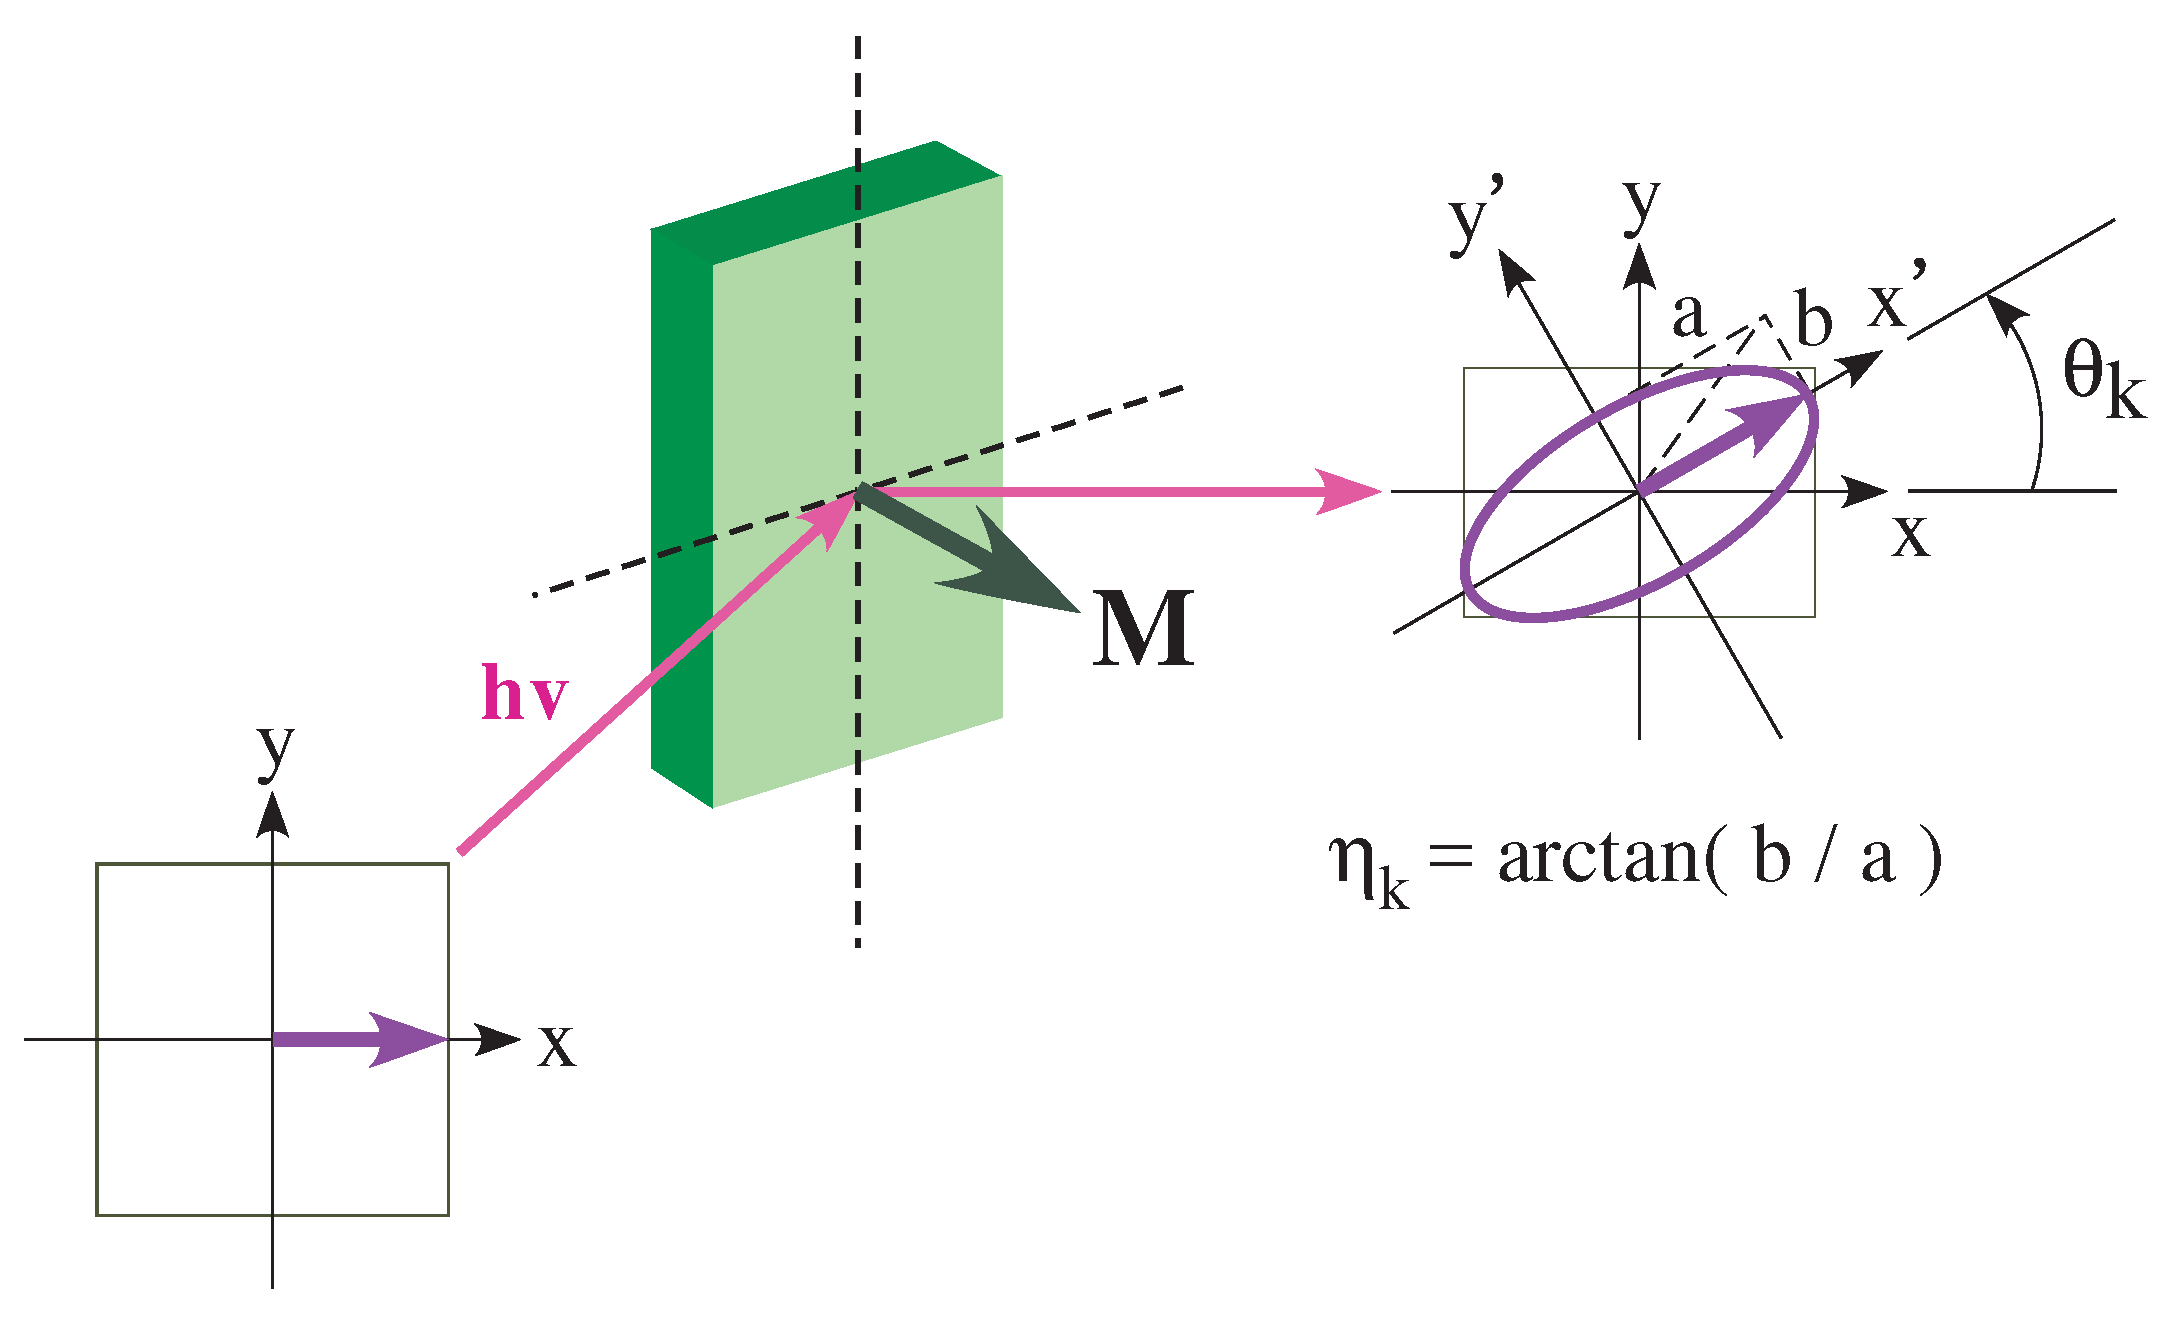
The MOKE can be characterized based on its rotation and ellipticity properties. Linearly-polarized light can be decomposed into left and right circularly-polarized components. Each of these components has the same phase velocity and amplitude. When linearly-polarized light interacts with magnetized materials, the polarization state of the light will change in two ways. The first way involves the rotation of the polarization axis, and the second is a change from linearly-polarized to elliptically-polarized light that is characterized by the ellipticity . Figure 1 shows an example of the (polar) MOKE measurement. The phase (amplitude) variations between the right and left circularly-polarized light components is responsible for the rotation, denoted by (ellipticity, ).
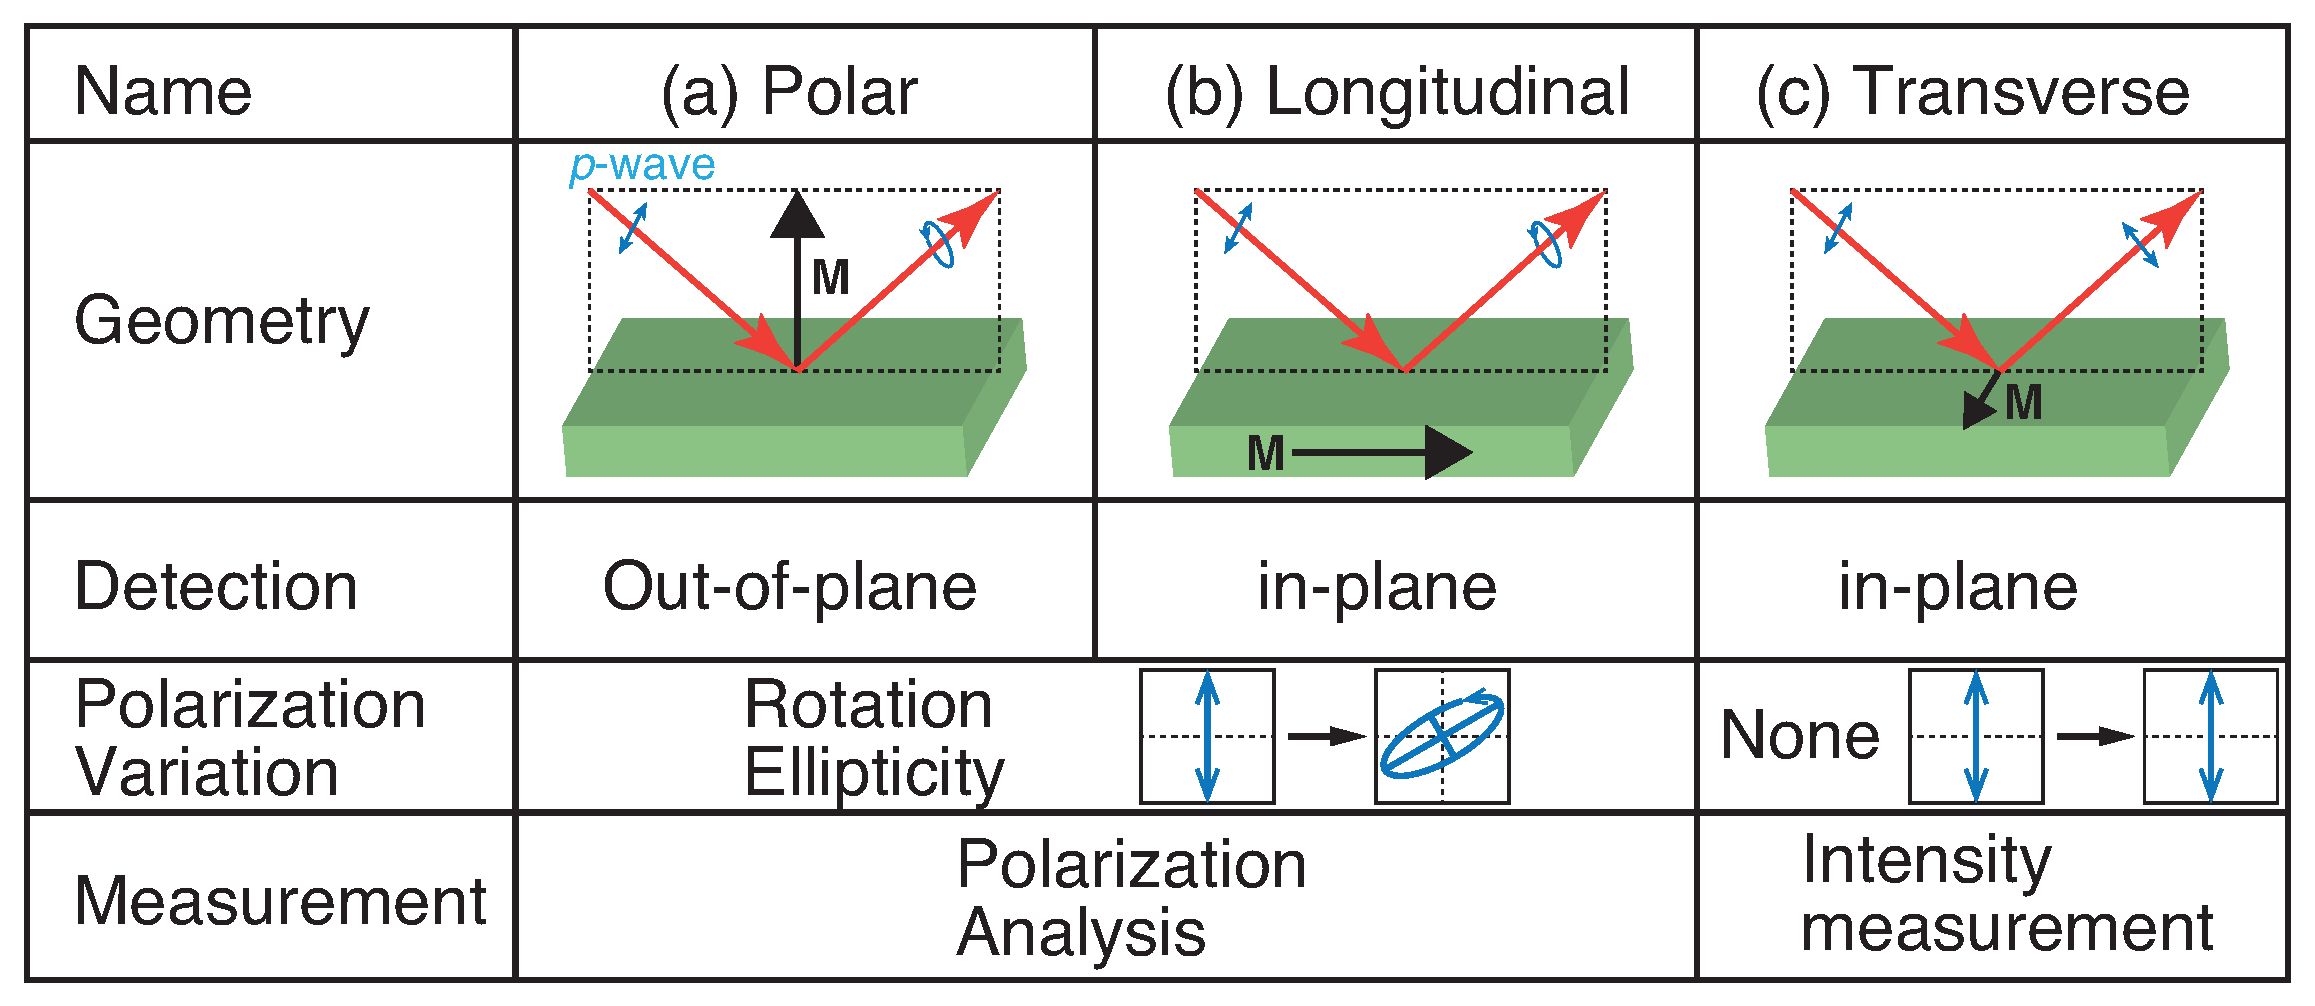
The measurement geometry is shown in Figure 2. There are two main schemes that are used for MOKE measurements. One scheme is based on polarization analysis, because the polarization of the reflected light rotates, and its ellipticity changes (see Figure 2a,b). The other scheme involves intensity measurements and is based on the fact that the polarization states of the reflected light do not change from the corresponding states of the incident light (see Figure 2c) This is called the transverse MOKE, or T-MOKE. Schemes in the first group are classified based on the magnetization direction . When is perpendicular to the sample surface, the method is called polar MOKE (P-MOKE; see Figure 2a). If is parallel to the sample surface and the reflection plane defined by the incident and reflected light beams, it is called longitudinal MOKE (L-MOKE; see Figure 2b). Historically, the schemes shown in Figure 2a,b are recognized separately, but the MOKE signals that involve polarization analysis in the cases of Figure 2a,b both originate from , and there is thus no intrinsic difference between the two geometries. These measurement geometries correspond to the measurement under applying a magnetic field to a specific direction with respect to the incident plane as shown in Figure 2. In the case of the arbitrary direction of the external magnetic field, magneto-optical effects observed in the reflected light are contributed from any of the three MO geometries. The phenomenological and analytical expressions in such cases can be found in the preceding studies [16,17]. and are defined with Fresnel coefficients, which depend on the frequency of incident light () as follows [16].
corresponds to an absorption edge of the target magnetic element. () and () are the Kerr rotation angle (ellipticity) for s- and p-polarized incident light, respectively. i and j in the are the electric-field component of the reflected and of the incident light, respectively. The tilde shows that the quantity is complex. The specific derivatives depends on the MOKE configurations, which are found in the earlier study [16].
3. Techniques for Magnetization Dynamics Capture
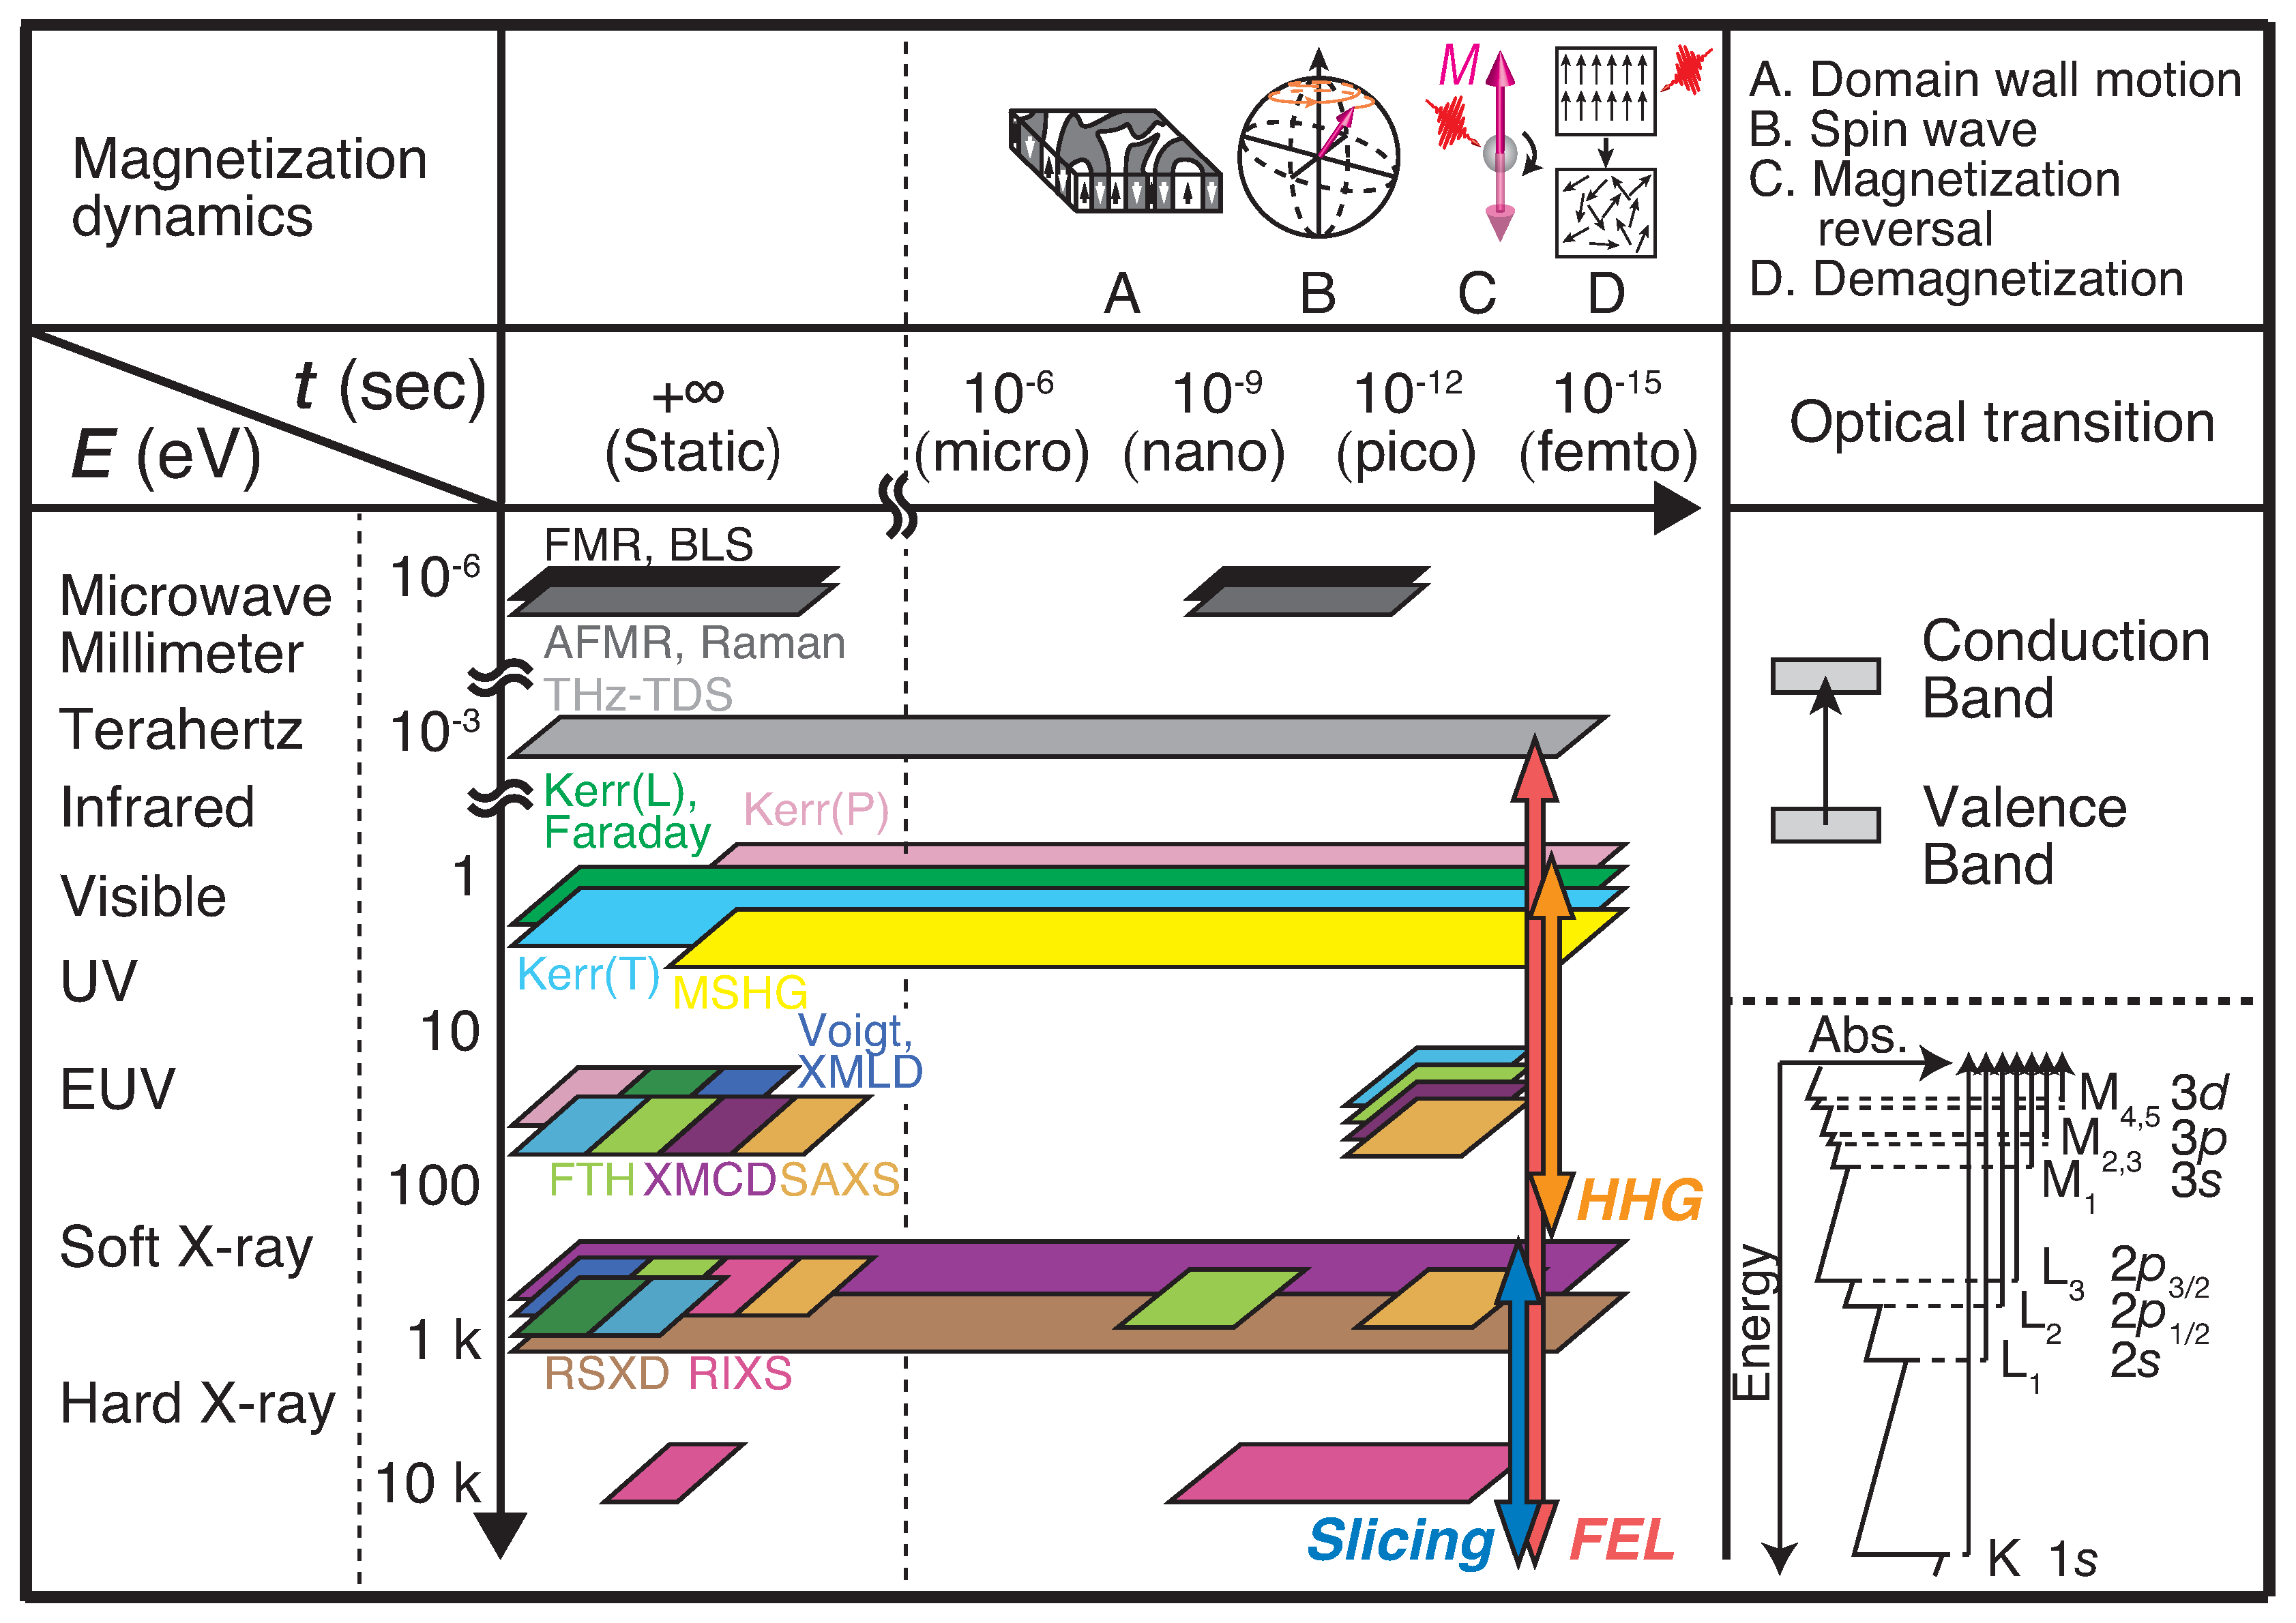
Figure 3 presents the various experimental methods that have been used to trace magnetization dynamics in previous studies, including MOKE. Each method is shown with respect to the energy required and the timescale of the operation, together with the relevant optical transitions and magnetization dynamics phenomena. The optical transitions are classified into two regimes: one from the perspective of the valence bands for energies of a few eV and the other from the perspective of the core levels for energies higher than those of the EUV range. Three light sources with sub-picosecond pulses, comprising the FEL, the HHG laser and the laser slicing source, are shown based on the energy ranges in which each source can emit.
In the microwave and millimeter-wave range, magnetic resonance, such as ferromagnetic resonance (FMR) [18] and antiferromagnetic resonance (AFMR) [19], has been used to investigate the precession frequency and the magnetic collective excitation or magnon. Inelastic light scattering, for example Brillouin (BLS) and Raman light scattering methods, is also employed for exploring the nature of collective spin excitation modes. These occur on a timescale of hundreds of picoseconds. Terahertz time-domain spectroscopy (THz-TDS) can directly visualize the electric field waveforms of ultrashort pulses [20]. Additionally, in time-resolved measurements, THz pulses can excite the system without being absorbed by the target materials, which means that heating effects can be avoided during the analysis of the magnetization dynamics [21]. In the energy range from the infrared to the ultraviolet, the magneto-optical effects in both reflection (Kerr) and transmission (Faraday) regimes have been used. In some magnetic compounds composed of rare-earths and transition-metals, element-specific measurements were reported by probing different wavelength for each magnetic element [22]. Furthermore, a nonlinear magneto-optical effect, magnetization-induced second harmonic generation (MSHG), has also been used to detect magnetic systems without inversion symmetry, such as systems involving surface and interface magnetism [23,24]. While these methods can be used easily with laboratory-based lasers, most of them lack elemental selectivity because they are involved with the optical transitions that occur between delocalized states.
Above the EUV range, magnetic probe measurements are generally performed by tuning the photon energy to a specific absorption edge, which then enables element-specific measurements. In static measurements, the Kerr and Faraday effects in the EUV and soft X-ray ranges were particularly investigated from the late 1990s until the mid-2000s. Magneto-optical effects that are sensitive to <M> are also used, including the Voigt effect [25] and X-ray magnetic linear dichroism (XMLD) [26]. These methods can probe both the ferromagnetic and antiferromagnetic orders. However, these magneto-optical effects, which are proportional to <M> are much smaller than those proportional to <M> [25,27]. Additionally, in XMLD measurements, it is difficult to separate the magnetic and nonmagnetic contributions [28]. XMCD is the most commonly-used technique for probing of ferro-/ferri-magnets, particularly in the soft X-ray range, and uses circularly-polarized light. This method can extract the spin and the orbital magnetic moment separately using magneto-optical sum-rules. While the XMCD signals in the EUV range are quite small when compared with the signal in the soft X-ray range, M-edge XMCD for 3d transition metals has also been demonstrated using a circularly-polarized HHG laser. The resonant inelastic X-ray scattering (RIXS) method is relatively new when compared with the other magnetic probing techniques and is complementary to the inelastic neutron scattering method [29,30,31,32]. This method could become more easily available as a result of the increasing brilliance of third generation SR sources and the advent of the FEL. Furthermore, through its enhancement of the energy resolution, RIXS has an advantage in that it can be used to detect collective magnetic excitations. Unlike similar techniques, RIXS can also detect momentum-resolved information. Small-angle X-ray scattering (SAXS) is similar to resonant X-ray scattering and can be used to determine magnetic structures on the nanometer scale [33,34]. Recently, this method has been used to investigate the topological spin textures of the skyrmion. Fourier transform holography (FTH) in the EUV and soft X-ray ranges has been measured using coherent light sources such as HHG lasers and FELs [35,36]. Conventional magnetic imaging has been performed by magnetic transmission X-ray microscopy using zone plates. The FTH scheme of holography measurements can be achieved without a lens, such as zone plate. In SAXS, the average correlation length can be extracted, while the FTH reveals the element-selective real-space magnetic distribution. The resonant soft X-ray diffraction (RSXD) technique has been used to investigate the charge, spin, orbital order and structural information of specific elements, particularly in strongly-correlated systems, such as transition metal oxides. This technique can determine the magnetic structures of antiferromagnets and helimagnets. Resonant X-ray diffraction is also measured in the hard X-ray range for detection of charges and orbital orders; however, the magnetic scattering cross-section is extremely small in the hard X-ray range when compared with that in the soft X-ray range [30,37]. Additionally, because the 3d states can be accessed directly in the soft X-ray range, resonant magnetic scattering is mainly used in the soft X-ray range. The following must be kept in mind for RSXD measurements: (1) the target ordering structure is limited, with a typically long periodic length of >10 Å, because the wavelength of the soft X-ray is longer than that in the hard X-ray range; (2) the attenuation length is smaller (∼100–200 nm) than that in the hard X-ray and neutron scattering ranges.
When transient magnetization measurements have been performed above the EUV range, HHG lasers, FELs and laser slicing light sources have been combined with the experimental methods described above. Transverse RMOKE (T-RMOKE) has recently been combined with an HHG laser to reveal in-plane magnetization dynamics on a femtosecond timescale [8,38,39]. When a grating is used, the time-resolved T-RMOKE spectrum can be measured using an HHG laser that covers the energy range around the M-edge of the 3d transition metals. Only recently, a time-resolved T-RMOKE technique has been combined with FEL at FERMI@Elettra [40]. Time-resolved XMCD (TR-XMCD) measurements have mainly been performed in the soft X-ray range, particularly for the L-edges of 3d transition metals when using a laser slicing light source [3,41]. Recently, TR-XMCD measurements of the M-edge of a 3d transition metal have been demonstrated using an HHG laser [42] and an FEL [43]. These time-resolved reflectivity measurements using circular (XMCD) and linear polarization (T-RMOKE) have had an importance in tracing in-plane magnetization dynamics in the previous studies. A time-resolved RIXS (TR-RIXS) method with a femtosecond timescale has also been demonstrated using an FEL [9]. This enables tracing of the magnetic correlation with nanometer-scale momentum resolution, which provides information with regard to magnetic melting on various length scales. A time-resolved SAXS (TR-SAXS) method has been used to reveal the magnetic spatial response on a nanometer scale during demagnetization or magnetization reversal processes using FELs or HHG lasers [44,45,46]. Time-resolved FTH (TR-FTH) has been performed using both SR sources [47,48] and an FEL [49]. Because of the higher brilliance and shorter pulse durations of FELs when compared with those of SR sources, holographic images can be obtained in much shorter times when the FEL is used. Time-resolved RSXD (TR-RSXD) for tracing of magnetic orders with q ≠ 0 (where q is the wave number) has been implemented using a laser slicing source [50] and FELs [51,52].
In Figure 3, we focused only on photon-in and photon-out schemes. In these regimes, the measurement system is not influenced by the existence of an external field. This scheme is crucial for measurement of magnetic systems under operando conditions, such as application of an electric field and a magnetic field for both insulators and metals. Direct spin detection schemes such as time-resolved spin-polarized photoemission and scanning tunneling microscopy are also considered to be important experimental options, although these are not photon-out techniques.
Characteristics of the TR-RMOKE Technique
Below the UV energy range, magnetization probing techniques detect the average information of target materials, whereas element selectivity is added in techniques that are involved with the core levels of target materials. We extract the features of the (TR-)RMOKE technique with polarization analysis, such as the features for polar and longitudinal geometries, through comparison with the other element-selective methods that are described in Figure 3. Comparisons are made with the following notable techniques: TR-RMOKE in a transverse geometry, TR-XMCD, TR-RIXS, TR-SAXS, TR-FTH and TR-RSXD. The comparisons with TR-RMOKE in the transverse geometry and TR-XMCD are described in Features (1)–(3), which are presented in the next paragraph. TR-RIXS has only recently been used in combination with TR-RSXD. This technique focuses on tracing of the magnetic low-energy excitation mode. Therefore, if one is interested in the possibility that a demagnetization or magnetization reversal is affected by the magnetic correlated modes, this technique provides a deeper insight than the other methods. However, the laser-induced macroscopic magnetization dynamics, which are revealed by elastic scattering (including reflection), should be measured using other techniques, including TR-XMCD, TR-RMOKE for ferro-/ferrimagnetic orders and TR-RSXD for antiferromagnetic orders, along with TR-RIXS. TR-SAXS and TR-FTH are powerful tools for determination of the magnetic structure on the nanometer scale. However, these techniques are mainly used in transmission geometries. During sample preparation, when trying to arrange a transmission-type experiment, the target magnetic system must be thin enough for a sizable transmission to be obtained. TR-RSXD is mainly used for materials with long-range magnetic orders with q ≠ 0, such as antiferromagnets. In the cases where ferro-/ferri-magnets are targeted, TR-XMCD and TR-RMOKE techniques are preferred.
The TR-RMOKE technique with polarization analysis using an FEL offers the following characteristics: (1) M-edge measurement feasibility, (2) measurements of both rotation and ellipticity, (3) use of linearly-polarized pulses, (4) giant Kerr rotation when compared with that of conventional visible MOKE and (5) element selectivity. We explain (1)–(3) in detail here. Characteristic (4) is discussed in Section 5.
(1) M-edge measurement feasibility:
In TR-RMOKE measurements performed in the soft X-ray range, the M-edge region is preferred to the L-edge region when the target materials contain 3d transition metals and when one is interested in the out-of-plane magnetization dynamics. In the L-edge range (100 ∼ a few keV), the experimental setup in the reflection geometry is limited because the light in this energy range is strongly absorbed by the materials. To detect the out-of-plane component of the magnetization, it is important to ensure that the angle of incidence is as close to the sample surface normal as possible. However, the reflectivity drops off dramatically with decreasing angle of incidence (with respect to the sample normal) and at [53]. To use the reflection setup in the L-edge region, grazing incidence is required to enhance the reflectivity, and this reduces the magnetic contrast in the out-of-plane magnetization components. TR-XMCD is usually used in the L-edge range and is detected using a reflection geometry with grazing incidence [54]. There is also the possibility that out-of-plane magnetization dynamics may be detected using TR-XMCD in the L-edge range via transmission [3] and total fluorescence yield (TFY) [55] modes. However, for the transmission measurements, the sample thickness must be thin enough to allow high transmission, and the detection system for the TFY measurements must be carefully constructed to prevent the pump laser from entering the detectors and collecting a low photon flux. In contrast, around the M absorption edge (50∼70 eV), the light is less absorbed by the materials than it is in the L-edge range. Therefore, sizable reflectivity can be obtained at all angles of incidence. In the polar MOKE geometry, which is used to detect out-of-plane magnetization, the effect is maximized at normal incidence. However, even under this condition, there is a detectable reflectance that ensures that a better signal-to-noise ratio is obtained in the M-edge range than in the L-edge range. These facts mean that the freedom of the experimental setup is greater in the M-edge range than in the L-edge range for the detection of out-of-plane magnetization dynamics on a sub-picosecond timescale. When these advantages are used, it is expected that it will be possible to measure the depth-dependent RMOKE signal by varying the angle of incidence. In addition to the high degree of measurement freedom, the magnitude of the RMOKE for the M-edge is of the same order as that for the L-edge that was reported in earlier studies [56,57], whereas the magnitude of the M-edge XMCD is much smaller than that of the L-edge XMCD. In addition, the M-edge XMCD lacks the advantage that exists in the L-edge range, in which the spin and the orbital magnetic moment can be extracted using the sum-rule. Because the spin-orbit splitting in the M-edge range is smaller than that in the L-edge range, the assumption made for formalization of the sum-rule is not fully met in the M-edge range. This causes a discrepancy between the spin/orbital magnetic moments that were extracted from the M-edge and L-edge XMCD measurements [58].
(2) Measurement of both rotation and ellipticity:
In principle, it is possible to measure both rotation and ellipticity in MOKE measurements, whereas XMCD measures only the ellipticity. Through simple calculations, the non-diagonal component of the permittivity tensor can be determined based on the rotation and the ellipticity [10]. In earlier studies, the determination of the permittivity over the EUV to soft X-ray energy range was conducted indirectly with a certain number of errors. However, by performing RMOKE measurements in this energy range, it is possible to determine the permittivity component that carries magnetic information directly.
There is another advantage to be obtained from measuring both the rotation and the ellipticity. In the femtomagnetism field, the magnetic response in transient magneto-optical signals is not trivial, and this has led to controversial discussions in earlier studies. There are both optical and magnetic contributions to the magneto-optical response. A recent theoretical study suggested that analysis of time-dependent magneto-optical signals in terms of both their rotation and ellipticity is important for the extraction of the intrinsic magnetization dynamics on a sub-picosecond timescale [59]. In TR-RMOKE techniques for use in a transverse geometry, the transient reflected intensity is measured. However, two physical quantities, i.e., the rotation and the ellipticity, can be extracted in TR-RMOKE with polarization analysis, as in the cases of polar and longitudinal geometries.
(3) Use of linearly-polarized pulses:
In TR-RMOKE measurements, linearly-polarized light in the EUV ∼ soft X-ray range is used. The polarization state is analyzed through ellipsometry in the polar RMOKE (P-RMOKE) and the longitudinal RMOKE (L-RMOKE). In contrast, TR-XMCD measurements use circularly-polarized light. Most of the TR-XMCD measurements on the femtosecond timescale are conducted using a laser slicing source with circular polarization. However, these measurements suffer from extremely low photon flux when compared with those using SR and FEL sources [60]. Among the FEL facilities that are currently in operation, circularly-polarized light can be obtained in the EUV to soft X-ray range at the FERMI@Elettra and Linac Coherent Light Source (LCLS) [61,62,63] facilities. However, to extract the magnetization dynamics, accurate preliminary determination of the degree of circular polarization, which is dependent on the energy, is required. In this sense, measurements using linearly-polarized light are straightforward for use in analysis of the magnetic response from the transient magneto-optical signals. In HHG lasers, circularly-polarized EUV light has recently been produced using various techniques, including use of a phase-shifter and production of two circularly- or linearly-polarized light beams at slightly different wavelengths [64,65]. However, HHG lasers have smaller output intensities when compared with FELs, and thus, an FEL source is preferred when attempting to detect the dynamics of weak magnetic signals.
The combination of the RMOKE with an FEL provides another possibility for nonlinear RMOKE signal detection, while the nonlinear regime of XMCD is not expected to be useful. In the visible range, MSHG is often used, as shown in Figure 3. Through a polarization analysis of the SHG signal, a large-scale rotation was observed in the visible range [66]. Because second-order nonlinear signals only appear from systems without inversion symmetry, the nonlinear RMOKE technique can provide element-selective and surface/interface-selective measurements, which is important for investigation of spintronic materials, such as magnetoresistive, spin-valve and magnetic topological insulator systems.
4. MOKE Measurement Scheme
4.1. Visible MOKE
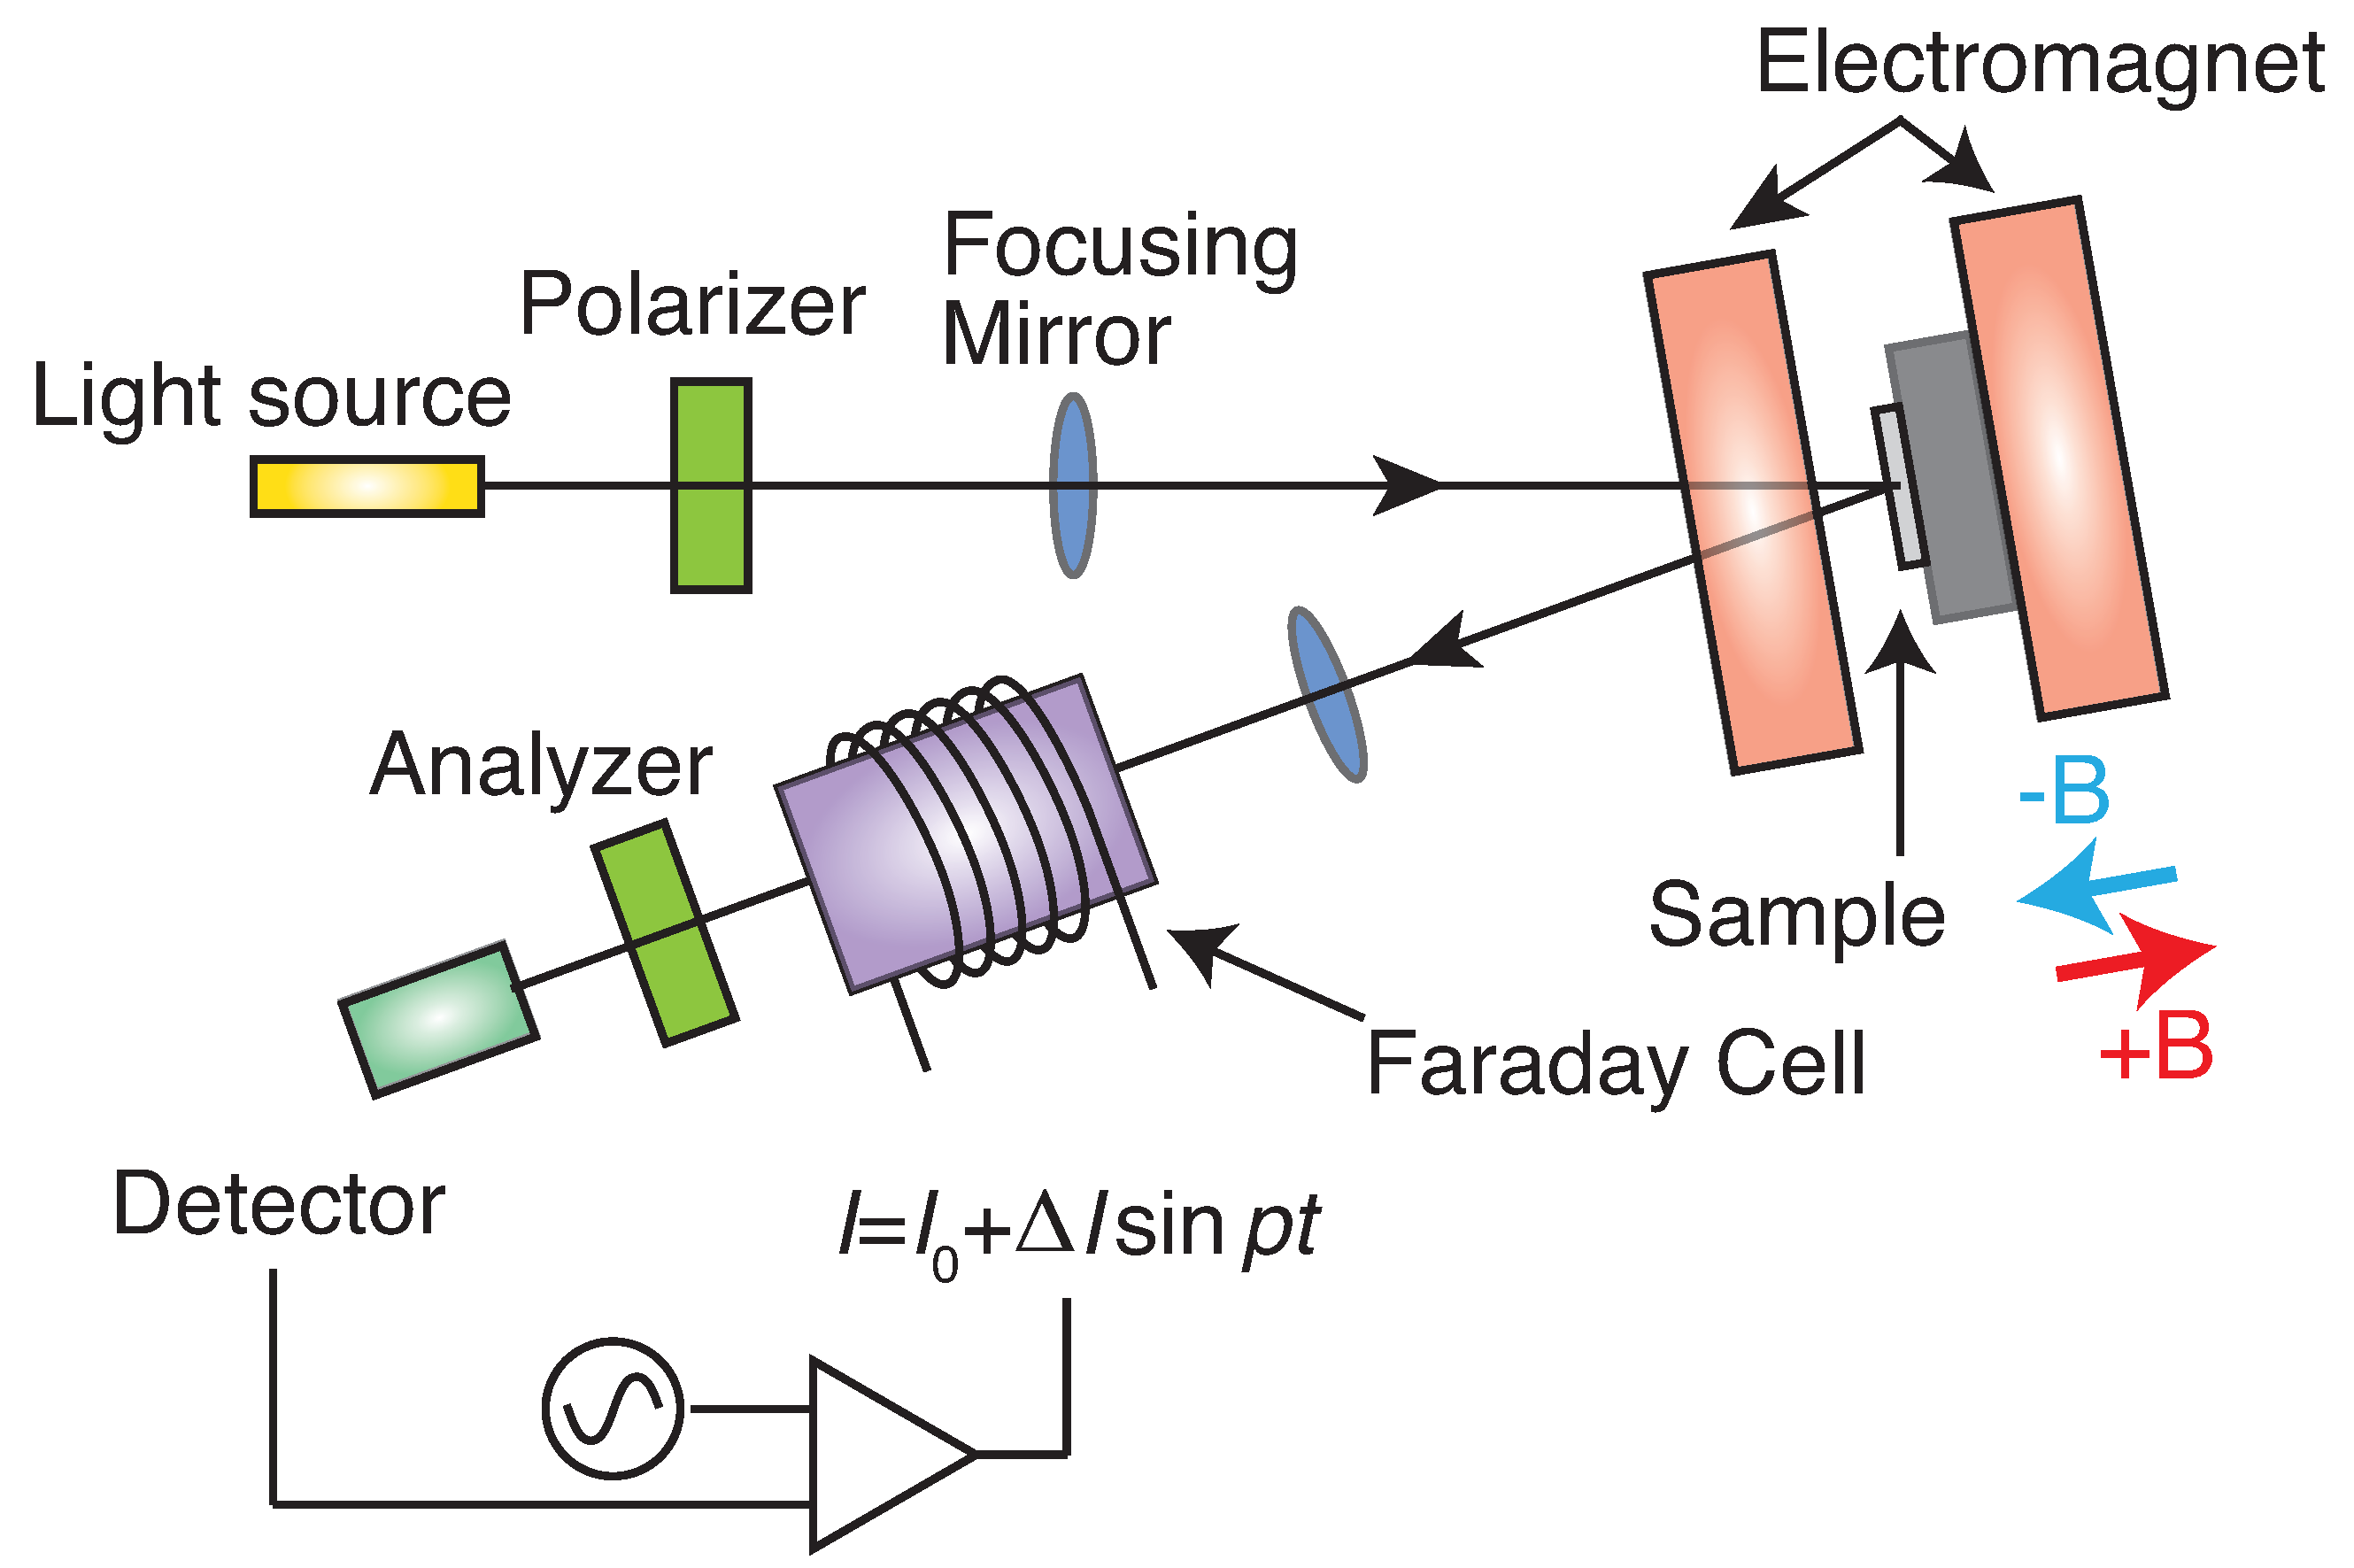
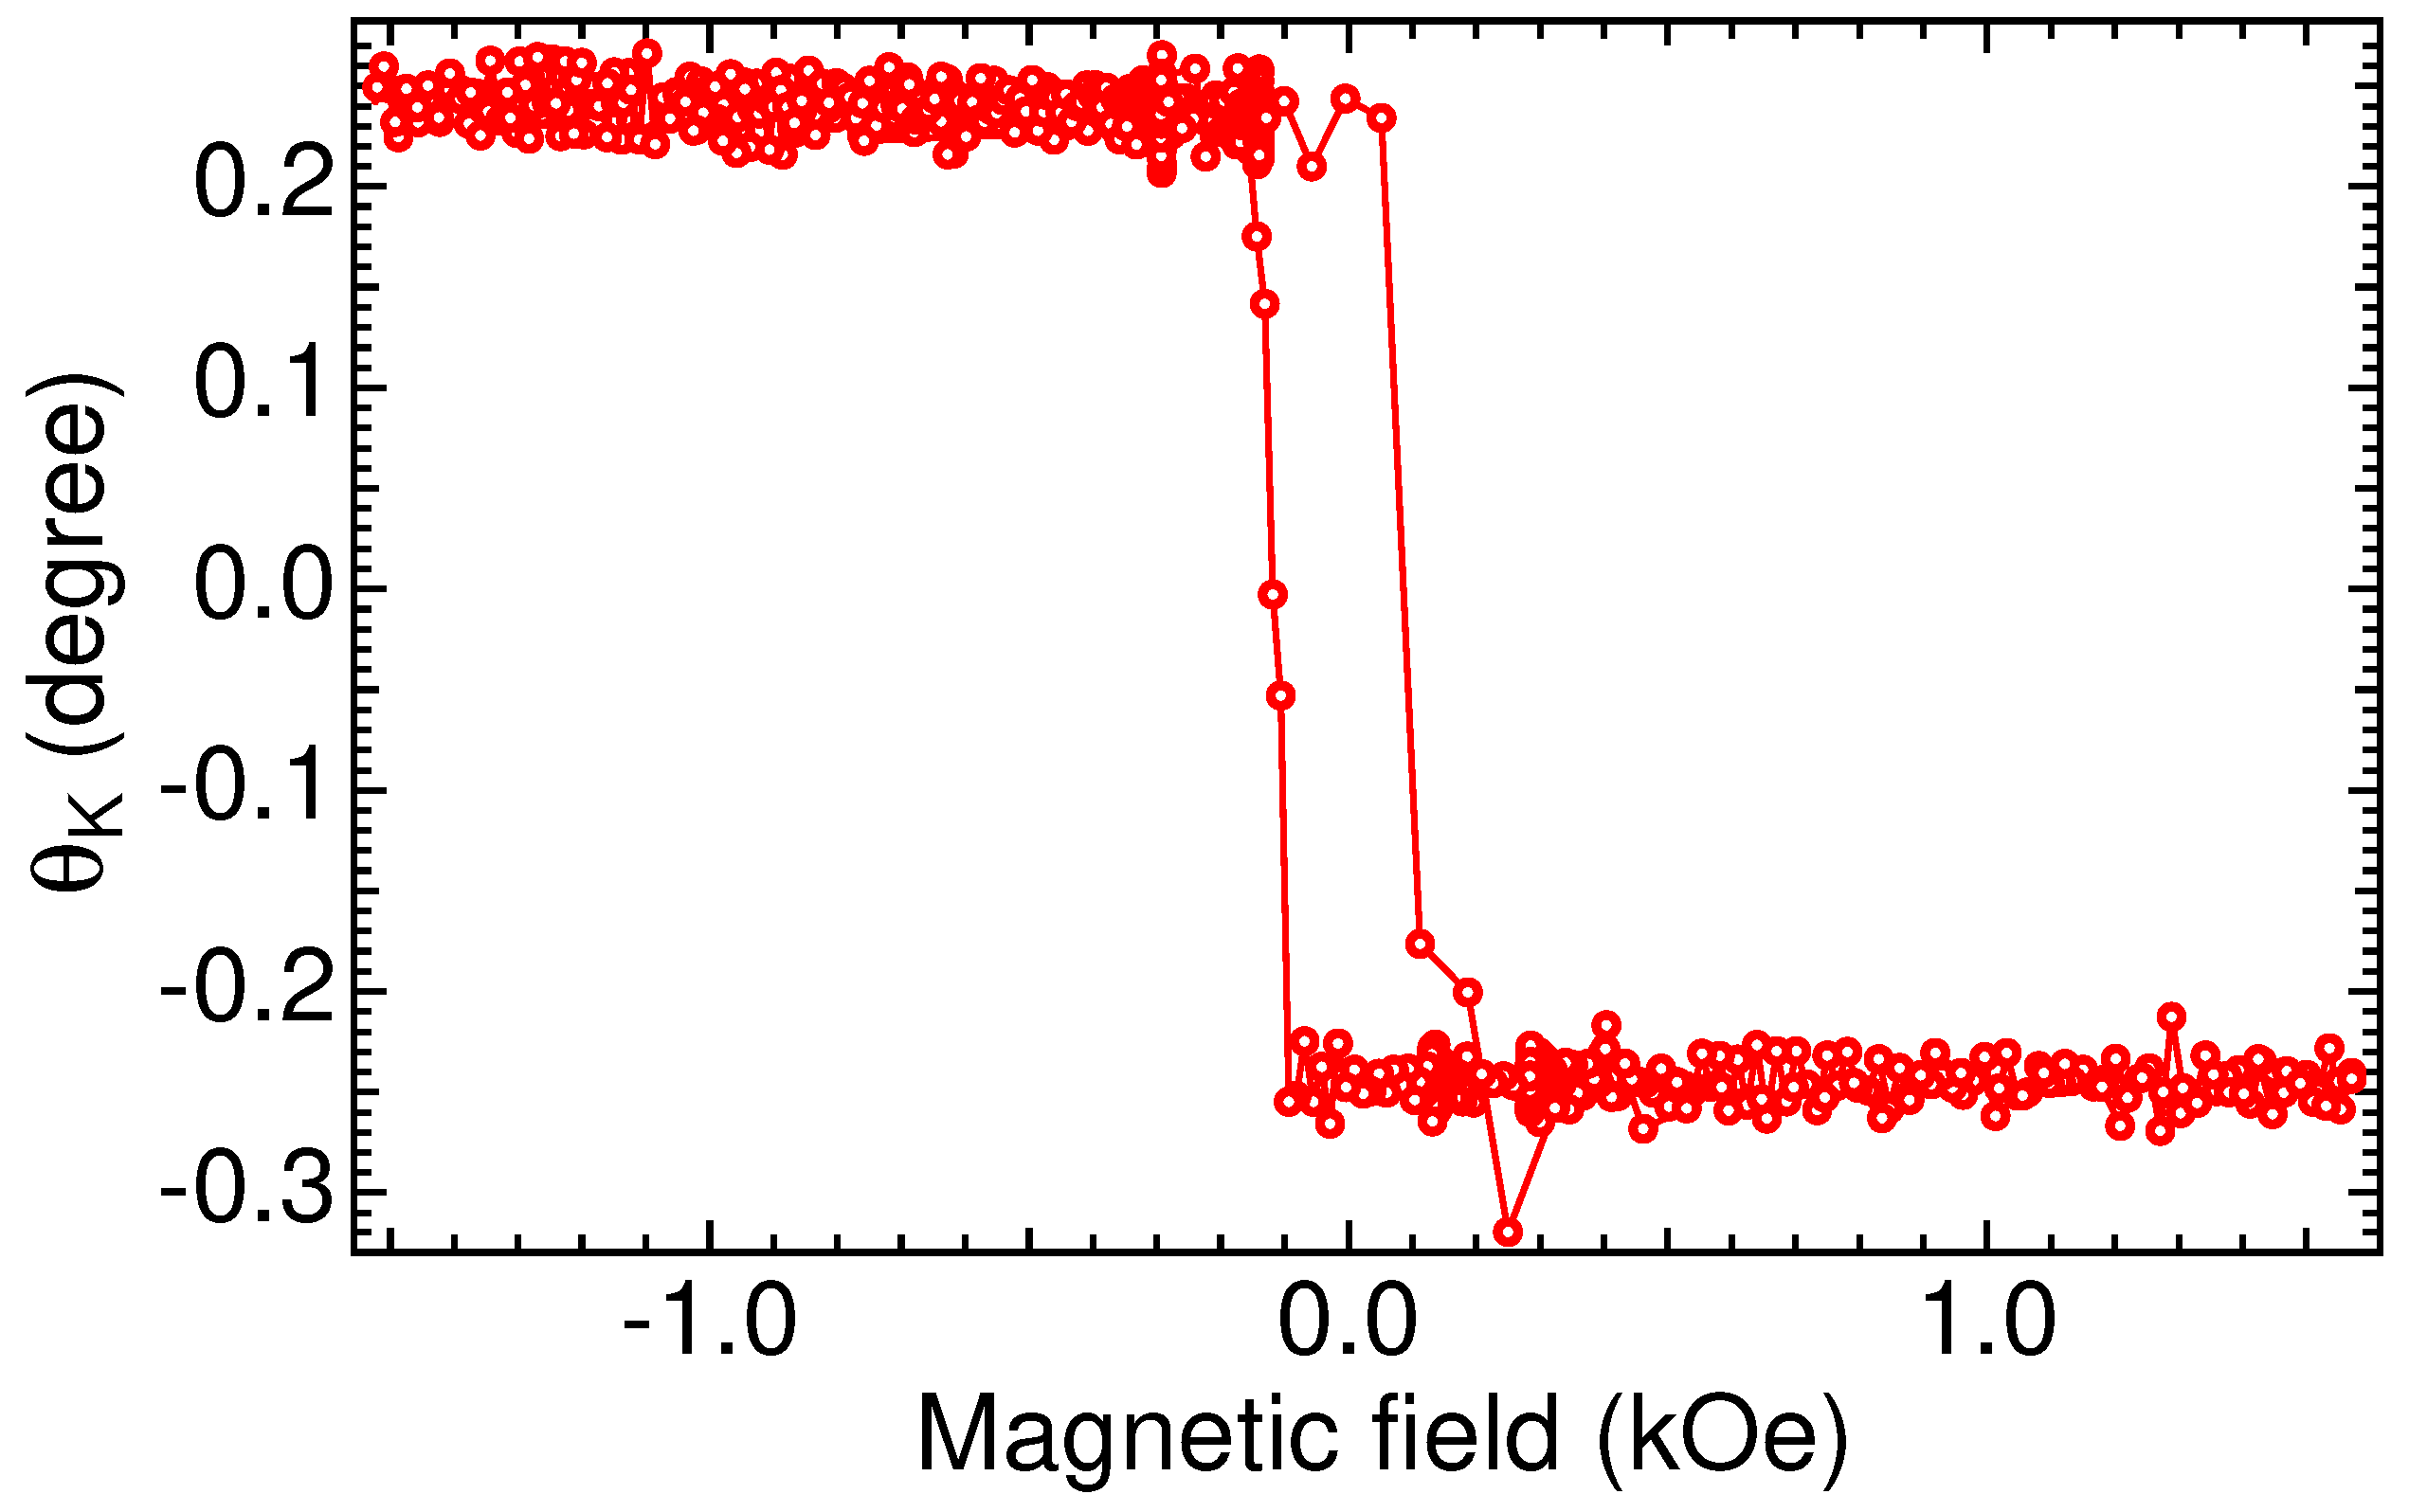
In the visible region, the MOKE is typically measured using the polarization plane modulation technique shown in Figure 4. A Faraday cell set between a polarizer and an analyzer compensates for the rotation of the polarization plane due to the Kerr effect in the sample. In the magneto-optic measurement field, the polarizer that is positioned after the sample is called the “analyzer”. To enhance the sensitivity to the Kerr rotation angle, an AC current for modulation is added to the DC current, and the output signal from a detector is input to a lock-in amplifier; its output signal is then given as feedback to the current for the Faraday cell. Anisotropic materials such as LiF and MgF can be used for the polarizer because they either show birefringence or dichroism [67,68]. Figure 5 shows an experimental example of the Ta (2 nm)/Gd(FeCo) (20 nm)/Ta (10 nm)/SiO sample. The material is ferrimagnetic; its magnetization saturates at ±0.1 kOe (0.01 T), and the magneto-optical Kerr rotation angle reaches ±0.24. Data from the sample are used as examples throughout this article, and the sample is described in detail in the next section.
4.2. RMOKE
In the soft X-ray region, the method described above cannot be applied because of a lack of appropriate optical components, such as Faraday cells and transmission-type polarizers. This is because of the extremely low transmission or the high extinction coefficient k of the optical constant in this photon energy range. Additionally, the refractive index n of the optical constant of a soft X-ray is nearly one, and is thus close to that of air, which means that the intensity of the reflected beam is also very low. Under these severe experimental conditions, researchers have tended to choose reflection-type optical components because there are very few candidates for the transparent materials for soft X-ray light.
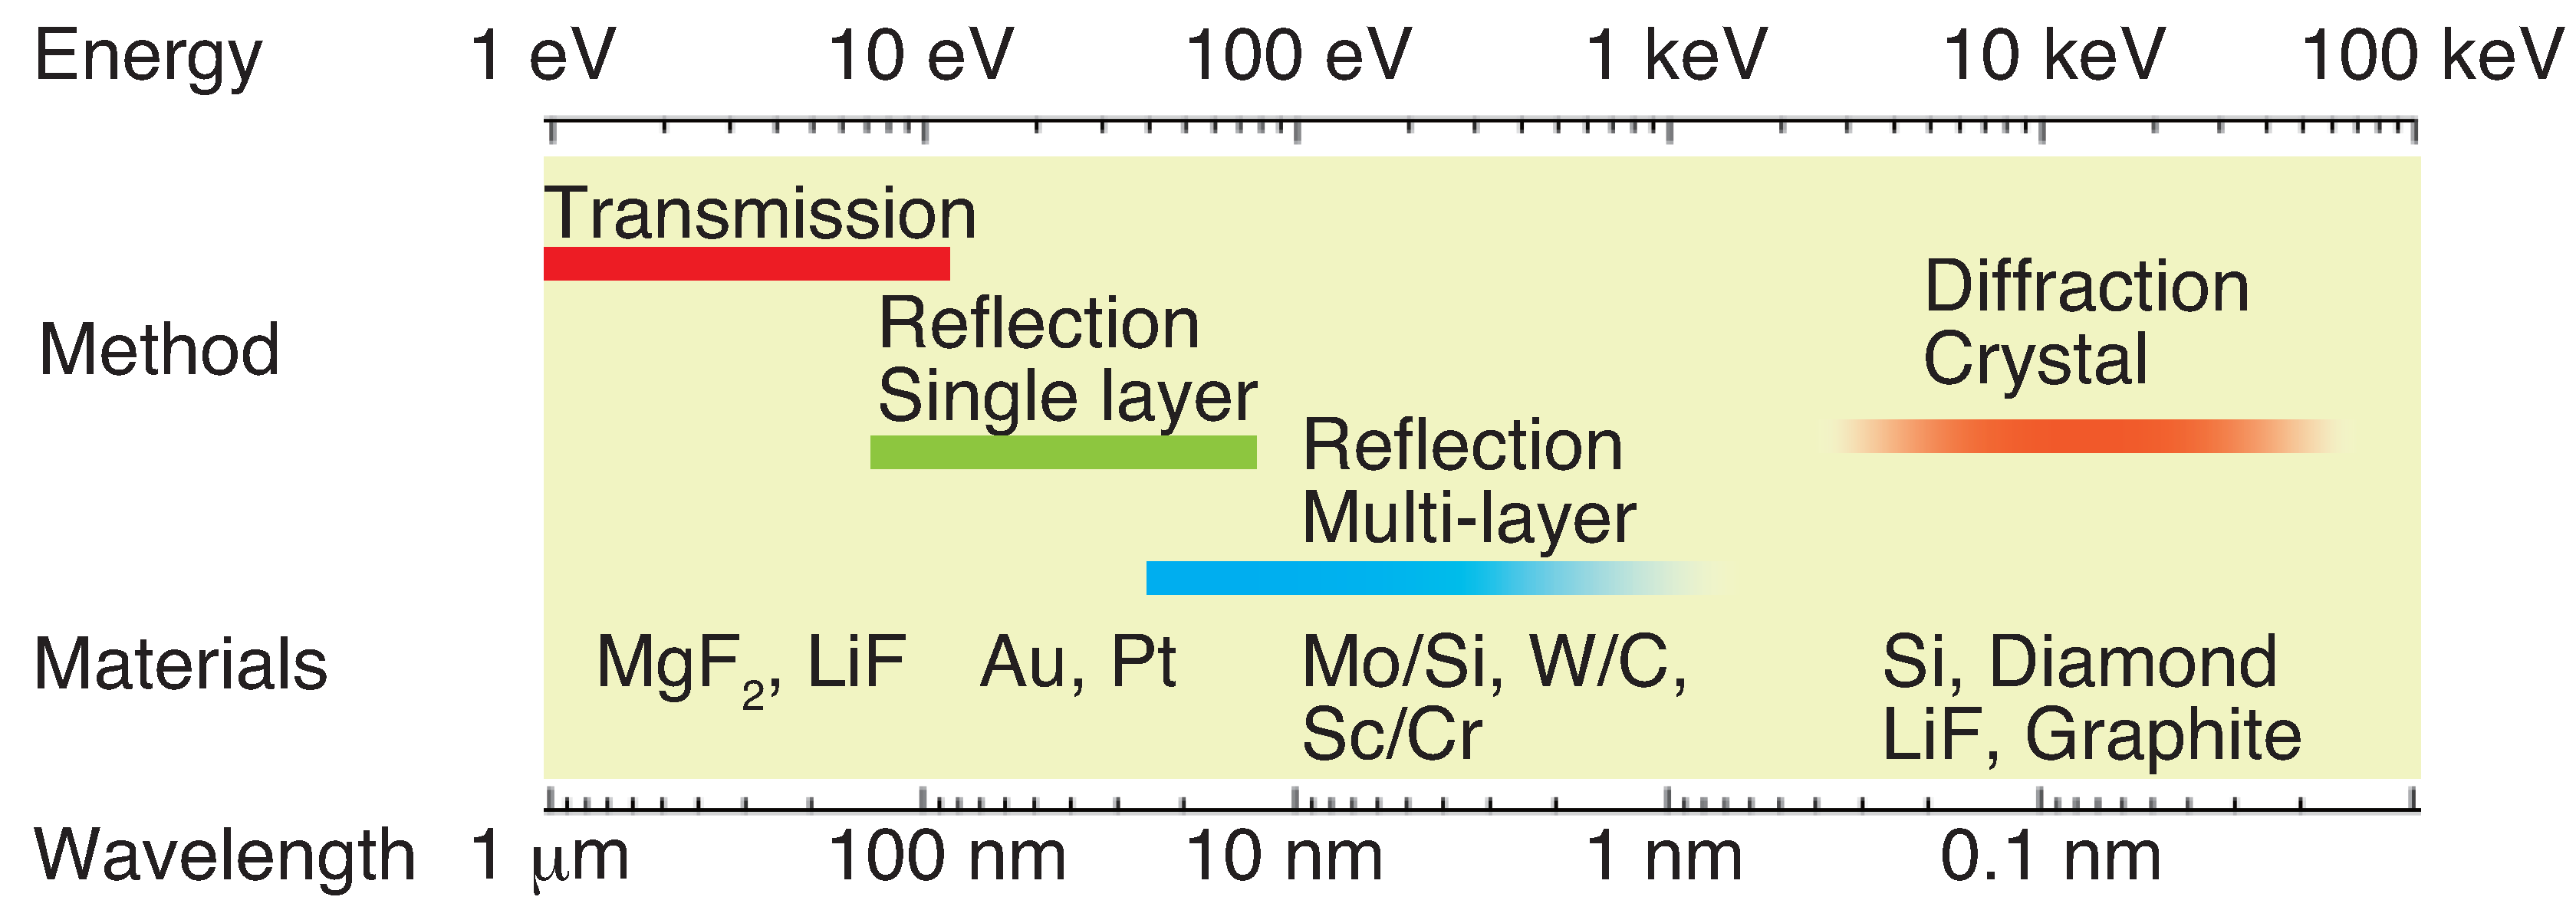
To improve the reflectivity of these components, the constructive interference effects from multilayer structures have been useful in guaranteeing sizable reflectivity in the soft X-ray range. Multilayer mirrors can reflect light within a specific energy range that is roughly defined by Bragg’s law ( = 2dsin, where d is the thickness of a single period of the layer and is the angle of incidence with respect to the surface normal). The constituents of the multilayer structures are materials with low k values and large differences in n. In the soft X-ray region, the first material is selected to have an absorption edge at a higher energy than a specific target energy, and a counterpart material with low k and n in the energy region is then chosen. If light is incident on the multilayer mirror at the Brewster angle, which is defined by the angle where the p-component of the reflected light is suppressed when compared with the s-component, the multilayer mirror can then be used as a polarizer. In the L-edge region, the value of n is almost one, which means that the Brewster angle is approximately 45. On the other hand, in the M-edge region, n deviates from one, so that the Brewster angle is not around 45. In this case, the polarizance, which is defined as the ratio between the s- and p-reflected intensities /, under 45 incident angle is of the order of 10–100 using Mo/Si multilayer mirrors. In the L-edge range, the polarizance is around 1000–100,000 with the same reflection geometry, although the multilayer combination is different (e.g., W (tungsten)/BC (boron carbide), W/C (carbon)). Figure 6 shows a collection of polarizers for photons at wavelengths ranging from visible light to hard X-rays [69]. Even with the order of the polarizance in the EUV range, it is able to determine a principal axis of reflected polarization for extracting Kerr angles.
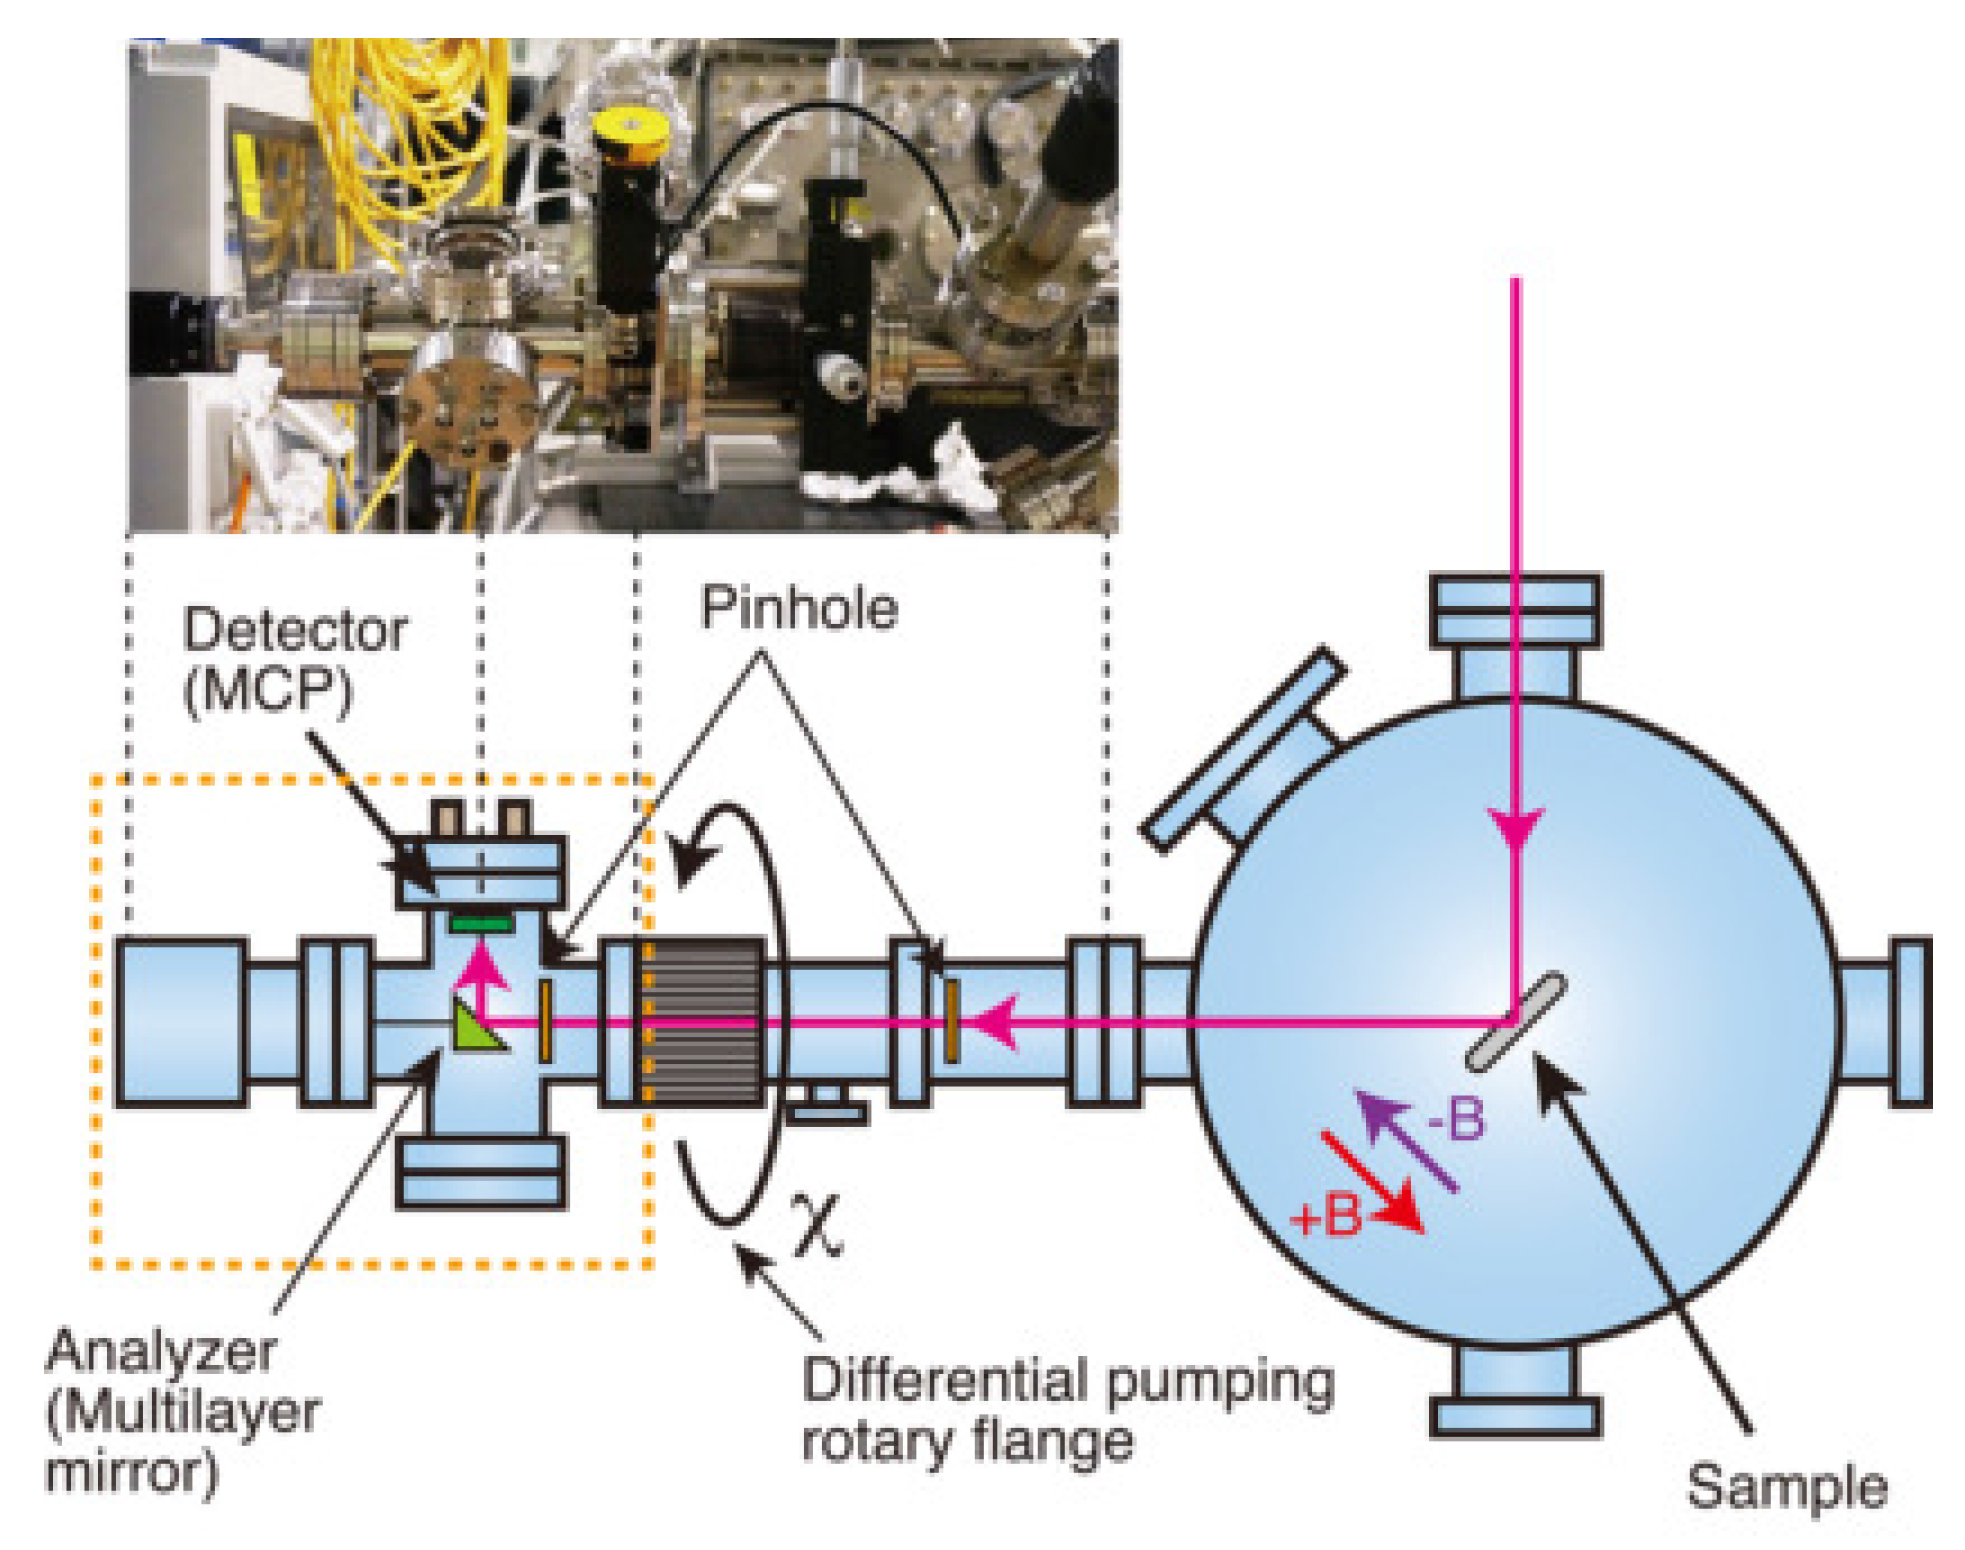
When the multilayer mirror described above is used, the Kerr rotation angle and the Kerr ellipticity can be determined experimentally using the rotating analyzer ellipsometry (RAE) technique, which is shown in Figure 7. In RMOKE measurements using this setup, the intensity of the light that is reflected by the analyzer is monitored at the detector as a function of , as shown in Figure 7. The incident light impinges on the sample, and the reflected light is then transferred to the ellipsometry unit, which is used to determine the Kerr rotation angles. After passing through two pinholes that are positioned to ensure accurate alignment of the reflected light, the light reaches an analyzer with an angle of incidence that is roughly equal to the Brewster angle. The reflected light from the analyzer is then detected by a detector represented by the microchannel plate (MCP). The MCP is used in current detection mode. During extraction of the Kerr rotation angle, the section that is indicated by the rectangle of broken yellow lines in Figure 7 is rotated with respect to the axis of the light reflected from the sample using a rotary flange. The reflected light intensity from the magnetic sample is dependent on the ellipticity angle and the azimuthal angle of the major axis of the polarization ellipse of the beam. It should be noted that the RMOKE measurement system does not require the lock-in amplification that was adopted in the visible MOKE setup shown in Figure 4.
We describe the resulting intensity that is obtained by rotating the ellipsometry unit indicated by the yellow dashed rectangle in Figure 7 using a Mueller formalism [70,71], in which the polarization states are expressed using the Stokes vector. The Stokes vector consists of four elements, , , and , which express the sum of the vertical and horizontal components of the polarization (= total intensity), the difference between the vertical and horizontal components, the difference between the /4 and /4 components and the difference between the right-handed and left-handed components, respectively. It is given by:
The degree of polarization, V, can be expressed as follows:
The absolute intensity is less important than the polarization state in most real cases, so it is convenient to define the normalized Stokes parameter that is divided by , which means that = 1. The resulting normalized Stokes parameters can then be expressed as follows.
In the Mueller scheme, the optical components are expressed by the Mueller matrix. Using , which is the analyzer, and , which is the coordinate rotation, the Stokes vector of the light that is reflected by the analyzer and reaches the detector is a function of . It is expressed using the Mueller matrices as:
where is the Stokes vector of the light that reaches the detector after reflection from the analyzer.
The intensity I() of the reflected light that reaches the detector is derived from Equation (8):
where is the ratio of the reflectance amplitudes, , for the s- and p-components.
Using the relationship between the Stokes vector and V, , and (from Equation (7)), the intensity can be written as:
The phase-shift in corresponds to . The value of V is unity if the light is perfectly polarized. The dependence of the cosine square function on is Malus’ law [72,73]. If we assume that V = 1, the intensity can simply be expressed using a cosine function with and as:
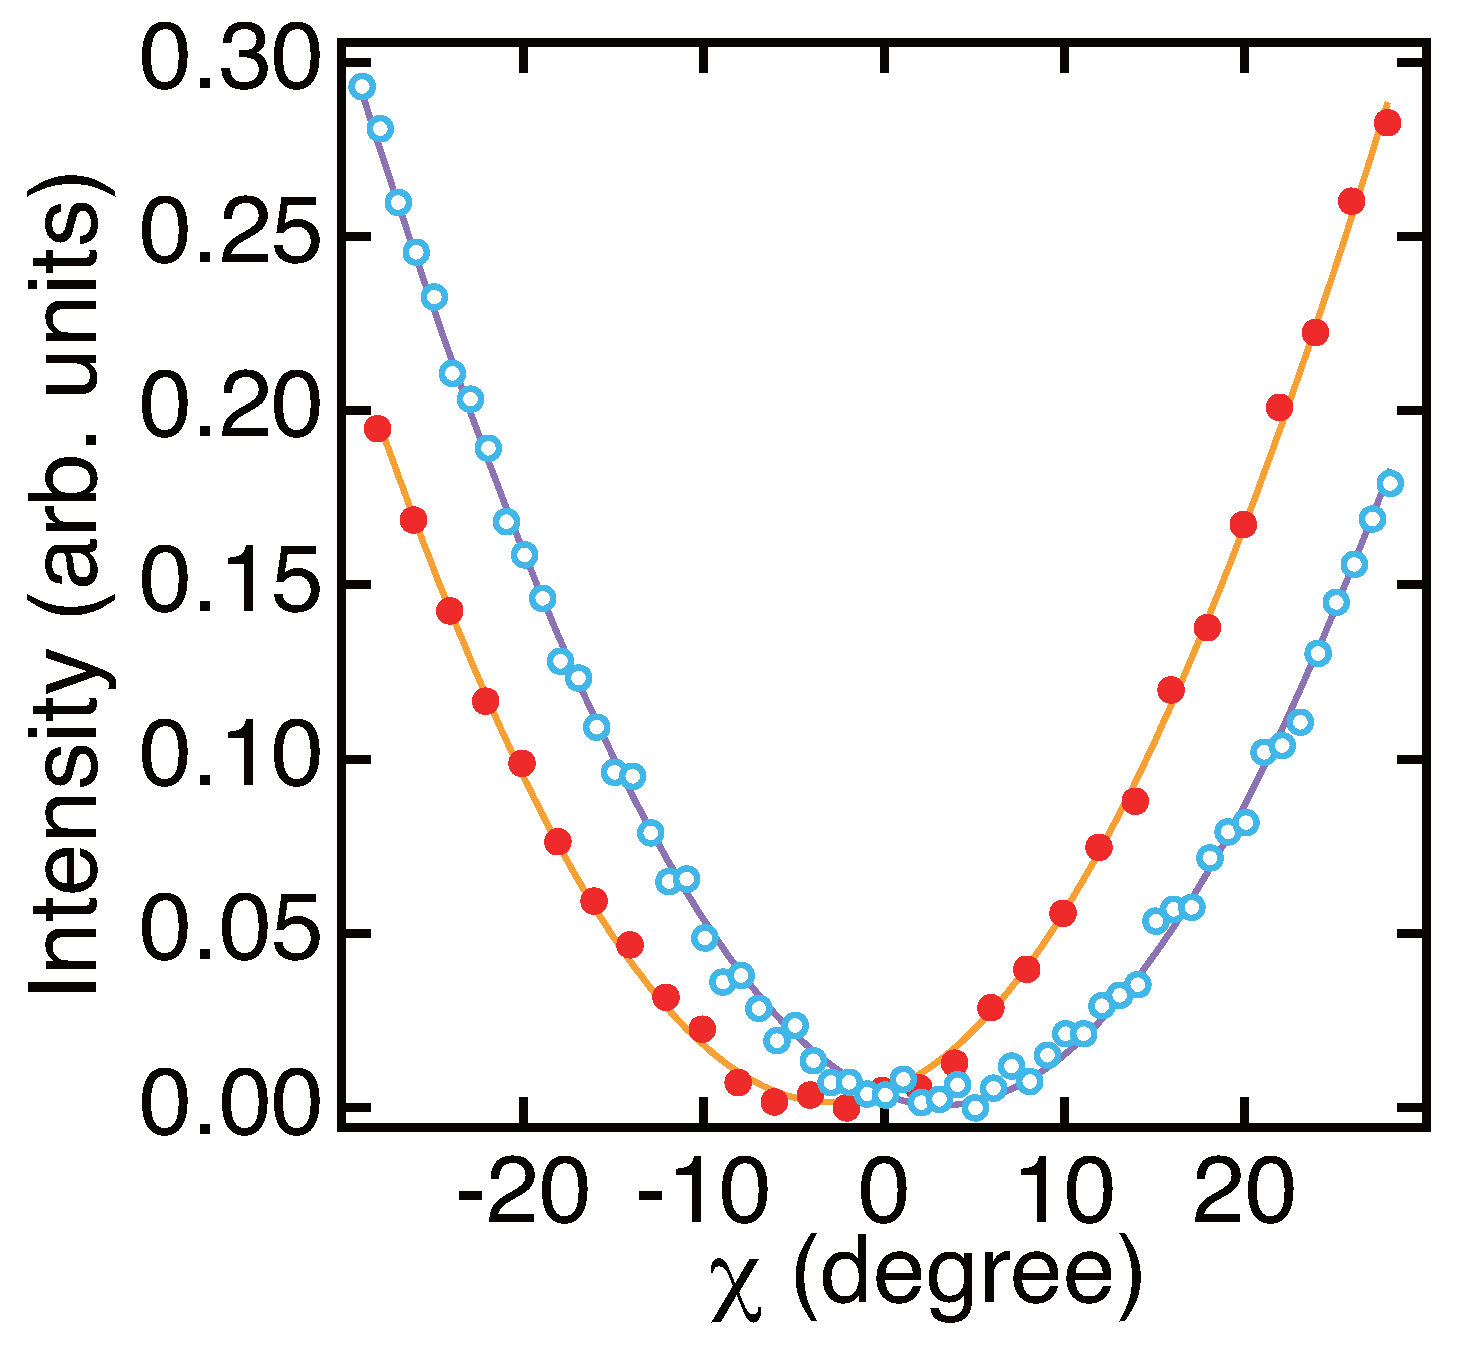
where the values of and determine . Figure 8 shows an example of the experimental results using SR. The vertical axis shows the signals detected at MCP as shown in Figure 7. The Kerr rotation angle can be determined using this RAE technique. For example, the phase difference that appeared in curves that were measured under the application of +B and −B fields corresponds to double the Kerr rotation angle, i.e., 2. It should be noted that in the RAE technique, V affects the value of the ellipticity. If the light is not completely polarized and unpolarized components are included, there is then a reduction in the amplitude that leads to a decrease in in Equation (11). Unpolarized or fully-circularly-polarized light gives no intensity variations in the RAE measurement. The degree of polarization is dependent on the energy and the optical components in the SR beamline. The polarizance of an analyzer is also taken into account for extraction of the ellipticity from the RAE technique. In the remainder of this review paper, we focus solely on for revealing the first demonstration of TR-RMOKE with FEL. is independent of V, and we thus take .
5. Static RMOKE Measurement
In the visible region, the MOKE measurements essentially probe the average magnetizations of target samples. In contrast, in the shorter wavelength range around the soft X-ray region, light interacts with the electronic states in the core levels of matter, such as the 2p or 3p absorption edges for 3d transition metals. These core level states are relatively localized to each of the element atoms when compared with the states near the Fermi level for magnetic metals, and there is a resonant effect in the MOKE data. Therefore, the RMOKE measurements detect the magnetization of materials with element selectivity. In this section, we review the research on the various types of RMOKE, including transverse RMOKE (T-RMOKE), longitudinal RMOKE (L-RMOKE) and polar RMOKE (P-RMOKE).
In the soft X-ray region, T-RMOKE has been used earlier and adopted more widely than the other RMOKE geometries. This seems to be because T-RMOKE requires only intensity measurements, as shown in Figure 2, and it is more technically feasible than the polarization analysis. The T-RMOKE measurements were initiated by measurement of a Ni sample at the Ni K-edge that led to observation of 0.2% as a peak-to-peak value of the asymmetry [74]. The research itself was motivated by the study of an interference effect between X-ray magnetic Bragg scattering and the electric scattering in the X-ray diffraction measurements [75]. Tuning of the photon energy at the K-edge means that the 1 s → 4p dipole transition occurs and the magnetic signal, then mainly originates from p-d hybridization [76], which was similar to the visible MOKE case [77]. Subsequently, T-RMOKE measurements were carried out on a Fe sample at the L-edge [78]. In this case, the dipole transition is 2p→ 3d and thus directly probed the itinerant 3d bands. The asymmetry ratio increases by up to ∼20% as a peak-to-peak value, and the data obtained allow us to extract the total width of an excited state and the magnitude of the exchange splitting when combined with theoretical resonant scattering calculations [79]. Triggered by this research, T-RMOKE experiments were reported in [80,81,82,83] for the Co M-edge, in [82,83,84], for the Co L-edge, in [82,85,86,87], for the Fe M-edge, in [82,88,89,90,91], for the Fe L-edge, in [82,87,92], for the Ni M-edge, in [82,87], for the Ni L-edge, in [93], for the Pt L-edge, and in [94], for the Mn L-edge. Additionally, the L-edge T-MOKE experiment was applied to the investigation of the magneto-crystalline anisotropy energy of an ultra-thin transition metal (Co) film [84]. It should be noted that the T-RMOKE signal basically originates from pure-charge and pure-magnetic signals; however, when the angle of incidence is tuned to the Brewster angle, components of the charge scattering are suppressed, and a pure-magnetic signal can be obtained within this geometry [86,89,95].
Moving onto the L-RMOKE research, polarization analyses of L-RMOKE were reported in [11,96]. The Kerr rotation angle was measured for a Fe/Cr multilayer structure at the individual photon energies of the Fe and Cr absorption edges. The Kerr rotation angles were two orders of magnitude higher than the corresponding values in the visible region. The L-RMOKE measurements were found to enable depth analysis by varying the photon energy, including analysis of the pre-edge region. In [91,97,98,99], depth profile measurements using Fe, Co and Ni L-edge L-RMOKE were demonstrated by selecting appropriate angles of incidence and energies. The spectra of the rotation angles and the ellipticities were measured for the Fe, Co and Ni metal samples [12,100]. The L-RMOKE Kerr rotation angle was related to the T-RMOKE signals, while the L-MOKE ellipticities corresponded to the XMCD spectra of the reflected beam. The researchers also discovered notable interference effects from the light reflected from the surface and the interfaces in the L-RMOKE spectra. Recently, M-edge L-RMOKE measurements of Co and Ni were reported in [83,101].
A P-RMOKE experiment has recently been the subject of intense attention from researchers because it has the only measurement geometry that can detect perpendicular magnetization (Figure 2), which is significant for the development of modern storage devices. The P-RMOKE was predicted in 1975 when Ni metal showed a value at the -edge that was 10-times larger than that in the visible region [102]. Then, P-RMOKE measurements were carried out at a synchrotron radiation bending-magnet beamline and confirmed that was 50-times larger at the Ni edges [56]. Basically, there is no apparent physical difference in the RMOKE signals between the longitudinal and polar MOKE geometries. Either technique can be used, depending on whether the magnetization direction is parallel or perpendicular.
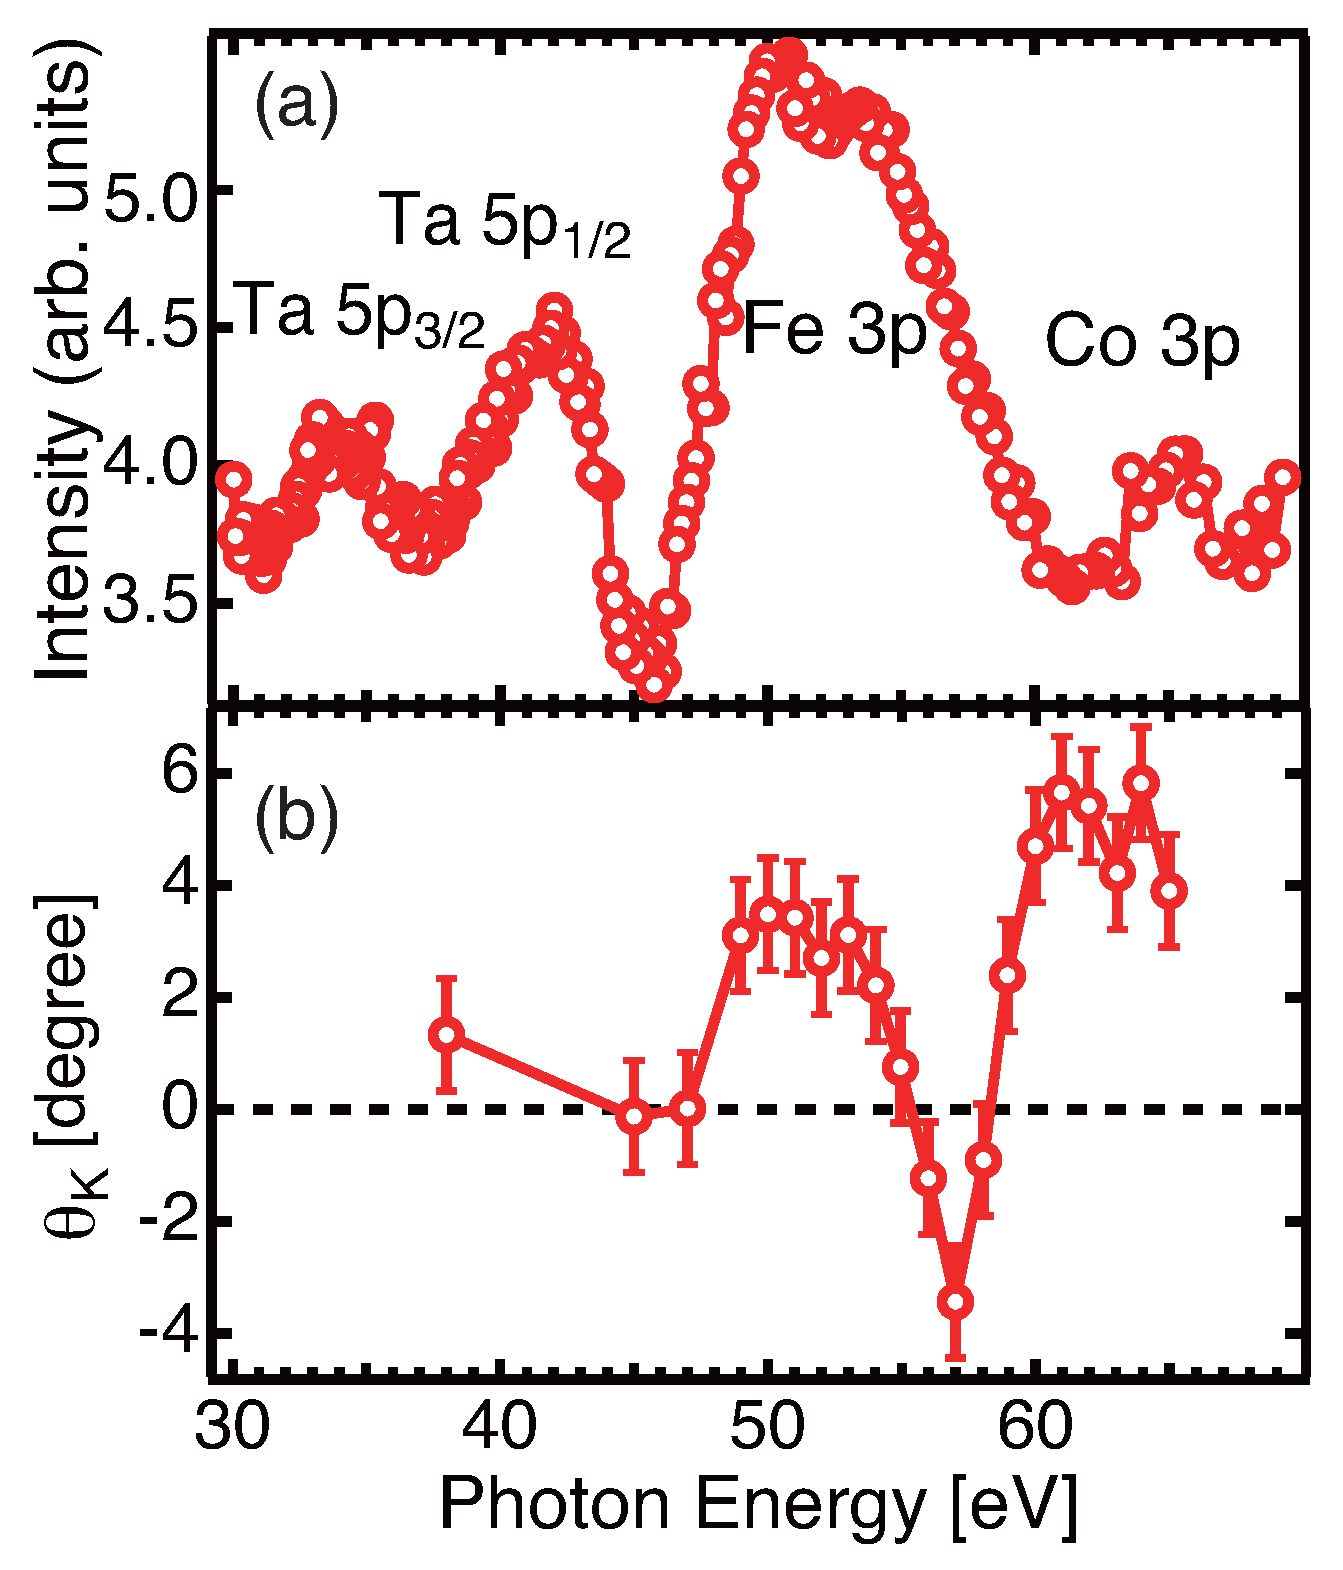
We now provide an example of RMOKE for a thin-film structure of Ta (2 nm)/Gd(FeCo) (20 nm)/Ta (10 nm) that was fabricated on thermally-oxidized silicon wafers using a radio-frequency (RF) magnetron sputtering process. The Gd(FeCo) alloy is ferrimagnetic. The magnetic moment of the transition metal (Fe) sublattice at room temperature is higher than that of the rare earth (Gd) metal, and the direction of the magnetic moment of the Fe atom is parallel to that of the external magnetic field. The Ta (2 nm) capping layer prevents oxidation of the Gd(FeCo), and the Ta (10 nm) underlayer helps with adhesion to the Si substrate. Figure 9a shows a set of soft X-ray absorption spectra for the Gd(FeCo) sample that were measured under saturated magnetization conditions (Figure 5), where the external field of ±0.47 T was applied perpendicularly to the sample surface. The measurements were performed at bending-magnet beamline BL5B at the Ultraviolet Synchrotron Orbital Radiation facility (UVSOR, Okazaki, Japan). The degree of linear polarization is at least 0.98 [101]. The spectra were obtained using the total electron yield mode. The vertical axis in Figure 9a was normalized by incident intensity measured by a gold mesh. The peaks at 33 eV, 42 eV, 53 eV and 66 eV were assigned to the Ta 5, 5, Fe and Co absorptions, respectively.
Figure 9b shows the experimental RMOKE spectra obtained around the Fe M-absorption edge. The RMOKE measurements were conducted in a polar geometry (P-RMOKE), and the Kerr rotation angle values were obtained by the RAE method, which was shown in Figure 7. At the Fe 3p absorption, was approximately 3, while at the Co 3p absorption, was approximately 5, and these values were approximately 10-times larger than those obtained from the visible MOKE, as shown in Figure 5. From a set of the absorption and RMOKE spectra, the photon energy of 53 eV is found to have sufficiently large values for both the absorption peak and , and the Fe atom is thus the most suitable candidate for tracing of the magnetization dynamics in Gd(FeCo) during ultrafast switching for the time-resolved measurements.
6. Demonstration of TR-RMOKE with a Soft X-ray FEL
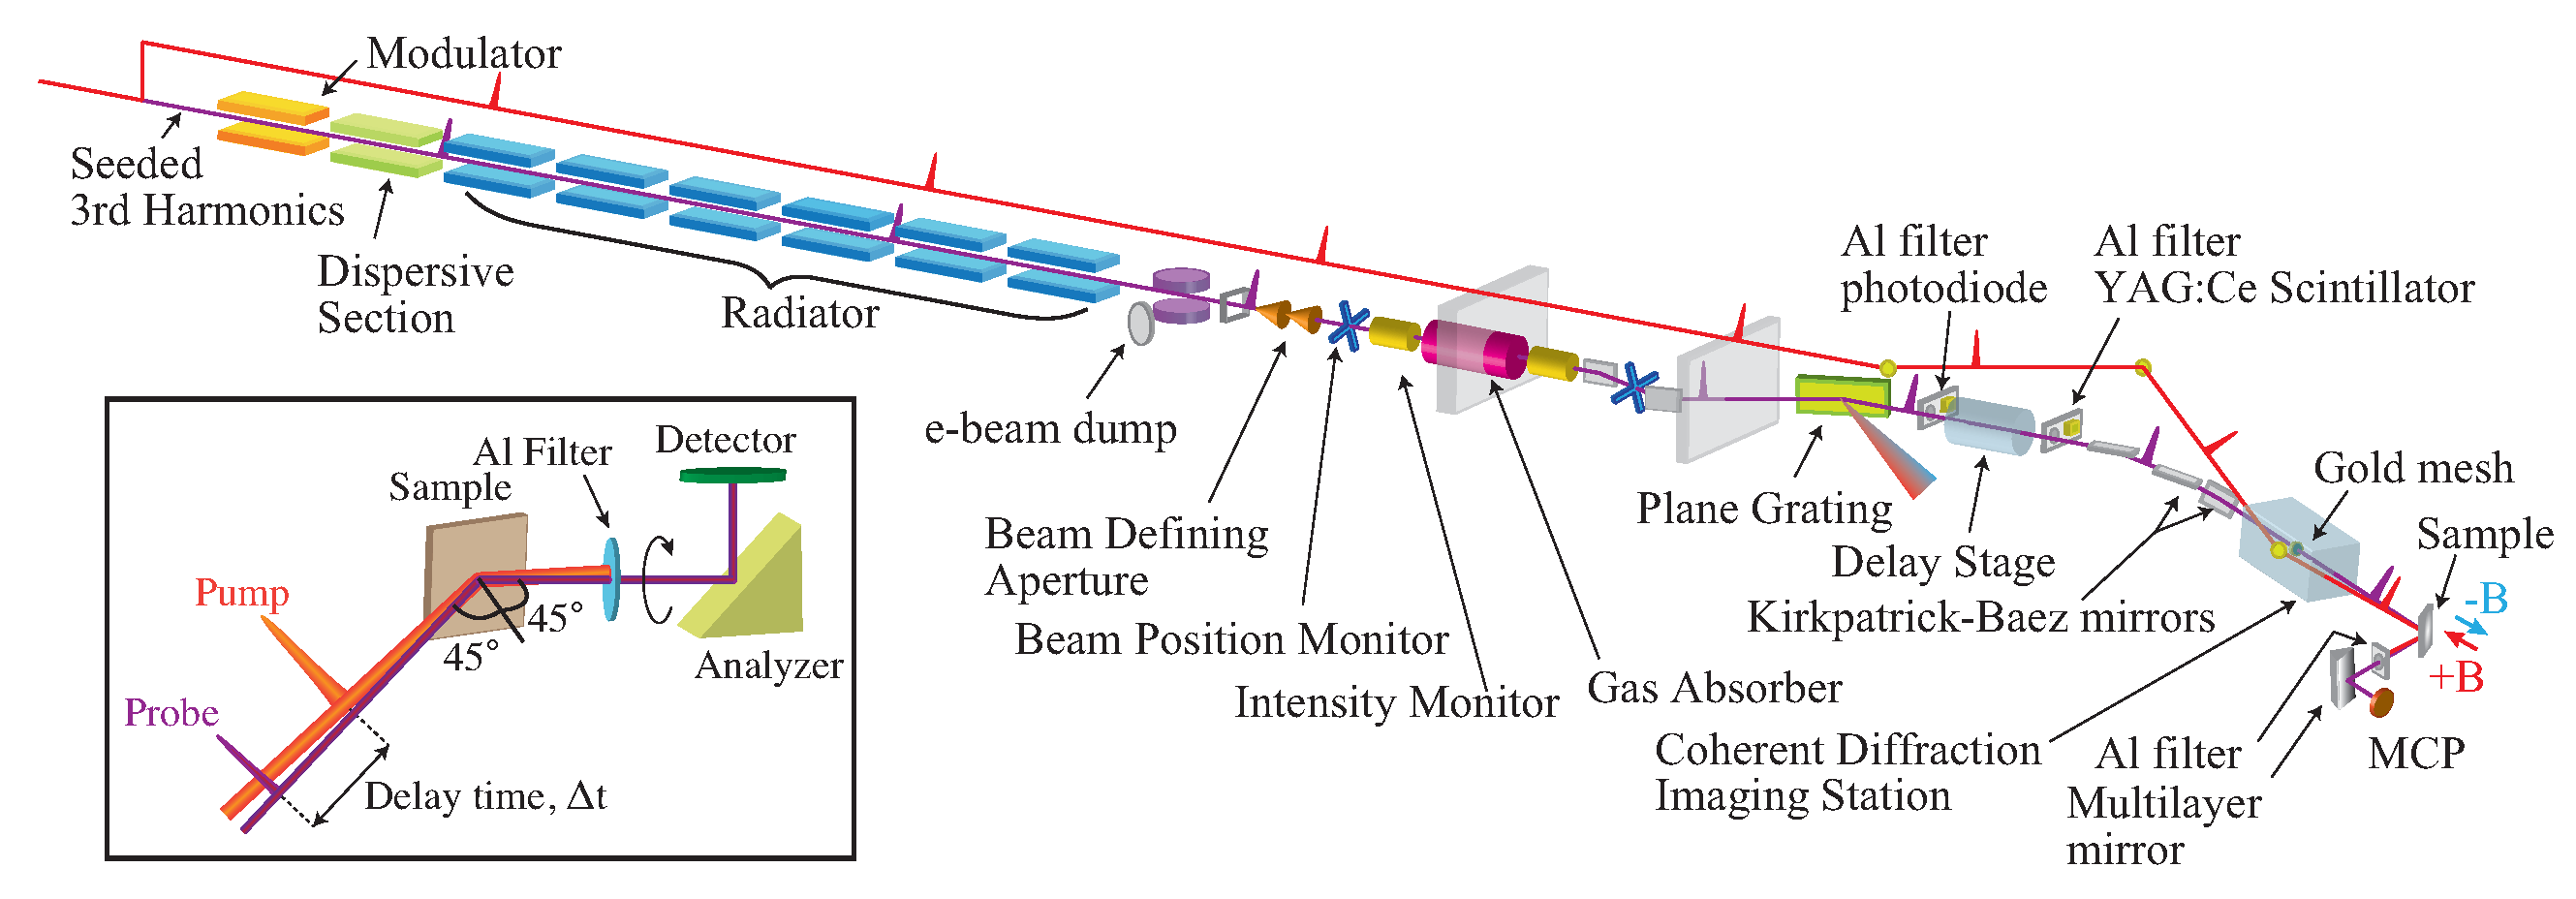
Figure 10 shows a schematic of the TR-RMOKE experiment that was carried out on the Diffraction and Projection Imaging (DiProI) beamline [103] at the seeded FERMI FEL at the Elettra laboratory in Italy. We used the FEL-I, which is normally operated at 60–20 nm (where hv = 12.4–62 eV) with an electron beam energy of 1.2 GeV [104,105]. The optical pumping was performed using the infrared (IR) lasers that are used for seeding of the FEL, and the pump pulses were thus intrinsically synchronized with the FEL probe pulses with practically jitter-free time resolution [106]. It should be noted that the seeded FEL at FERMI has excellent longitudinal coherence and spectral purity when compared with the commonly-used self-amplified spontaneous emission (SASE) scheme, and it also offers a multiple polarized pulse capability [61].
Measurements were performed using 23.6-nm (52.5 eV) FEL pulses with widths of 80–100 fs and a 780-nm IR laser. The pump-probe method was used with a repetition rate of 10 Hz. The FEL and IR laser beam spot sizes on the sample were 420 m and 530 m in diameter, respectively. The time resolution was limited by the pulse width of the pump laser of 150 fs. The fluences of the pump beam and the probe pulses were tuned to 14 mJ/cm and 3 mJ/cm, respectively. The temporal overlap of these pulses was determined with 250 fs resolution by monitoring the reflectivity changes of SiN in the FEL pump/IR laser probe experiment [106,107]. The spatial overlap was checked using a YAG crystal.
The measurement configuration was set such that a linear-horizontally-polarized IR beam and the linear-vertically polarized FEL beam were coaxially incident on the sample. The degree of linear polarization of the FEL, which was nominally called vertical polarization, was ∼0.97 [108]. The FEL was used to irradiate the sample in the s-polarization configuration with an angle of incidence of 45 with respect to the surface normal. The ellipsometry was conducted by rotation of the RAE unit, in which the reflected FEL beam traveled through a rotary flange, which was then reflected at a Mo/Si multilayer mirror (10 periods of 19.1-nm layers) and was finally detected at the MCP. An Al filter was used to attenuate the reflected IR laser beam. The fluctuating pulse-to-pulse intensity of the FERMI pulses was monitored in a shot-by-shot manner using an intensity monitor composed of a gas cell.
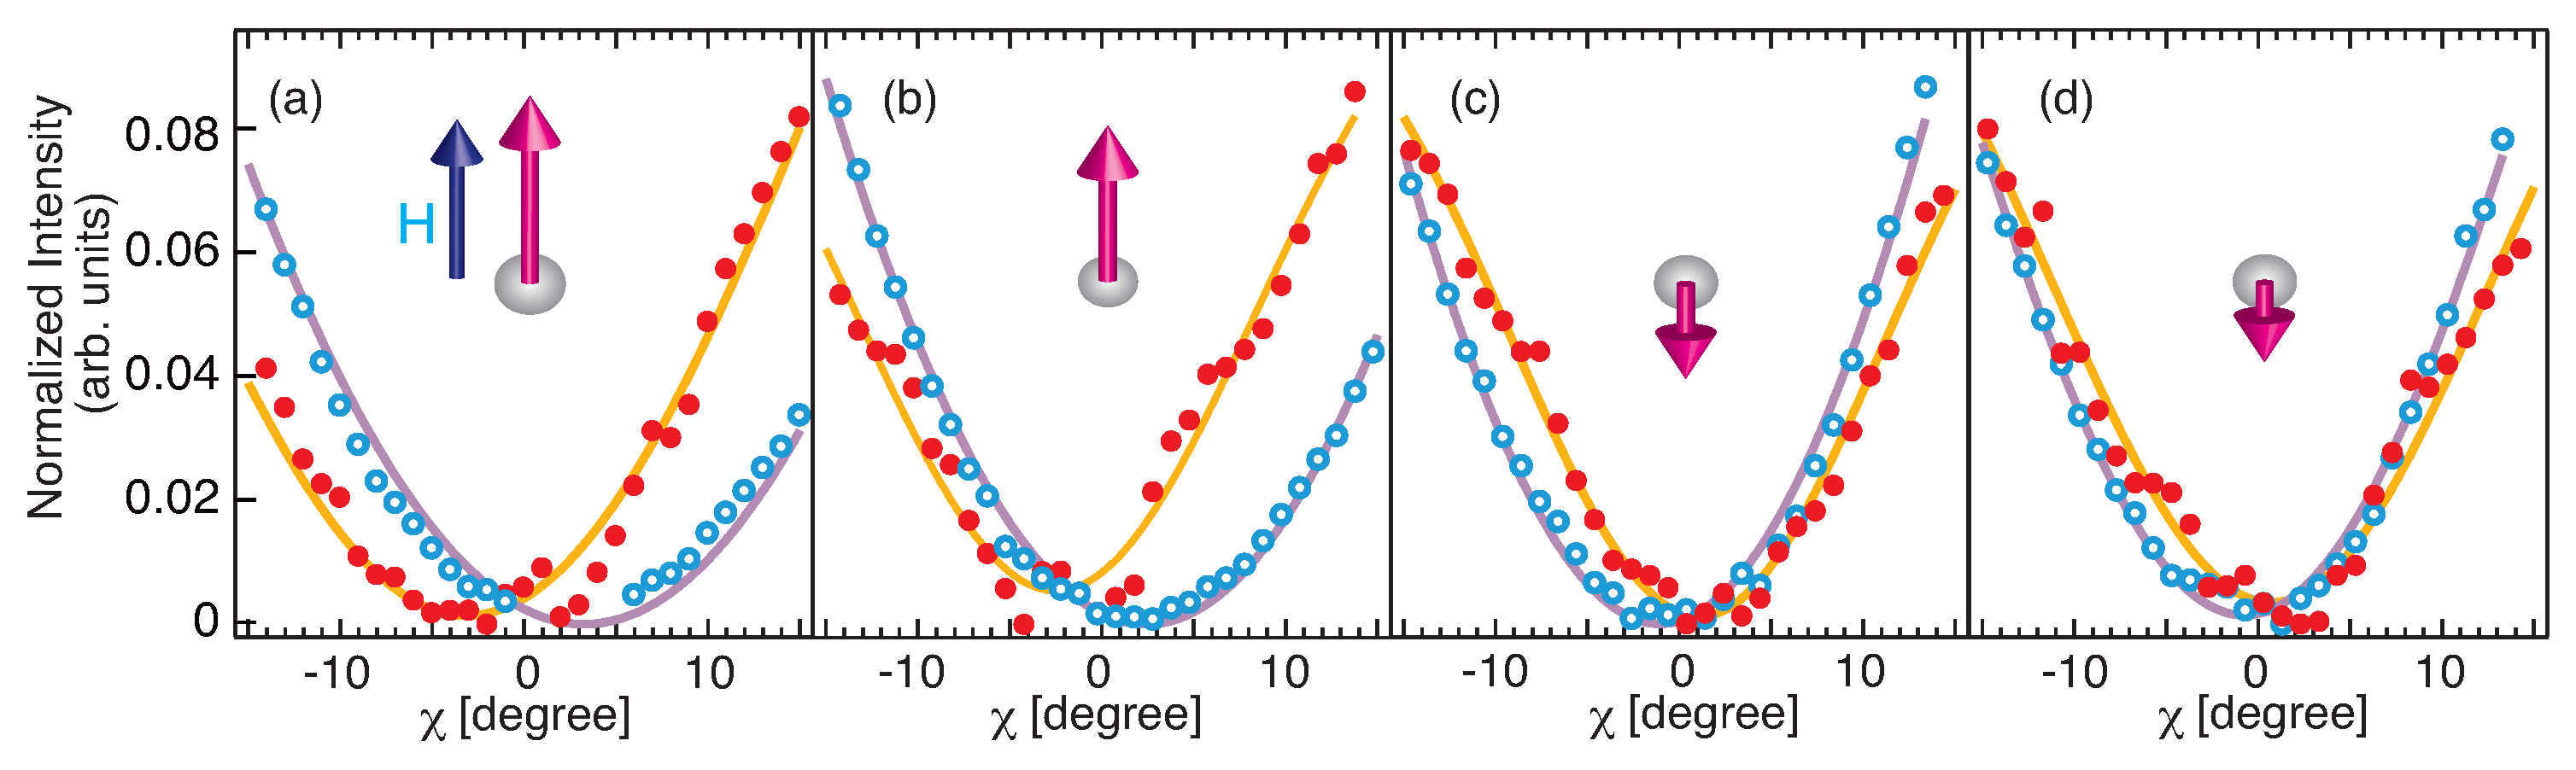
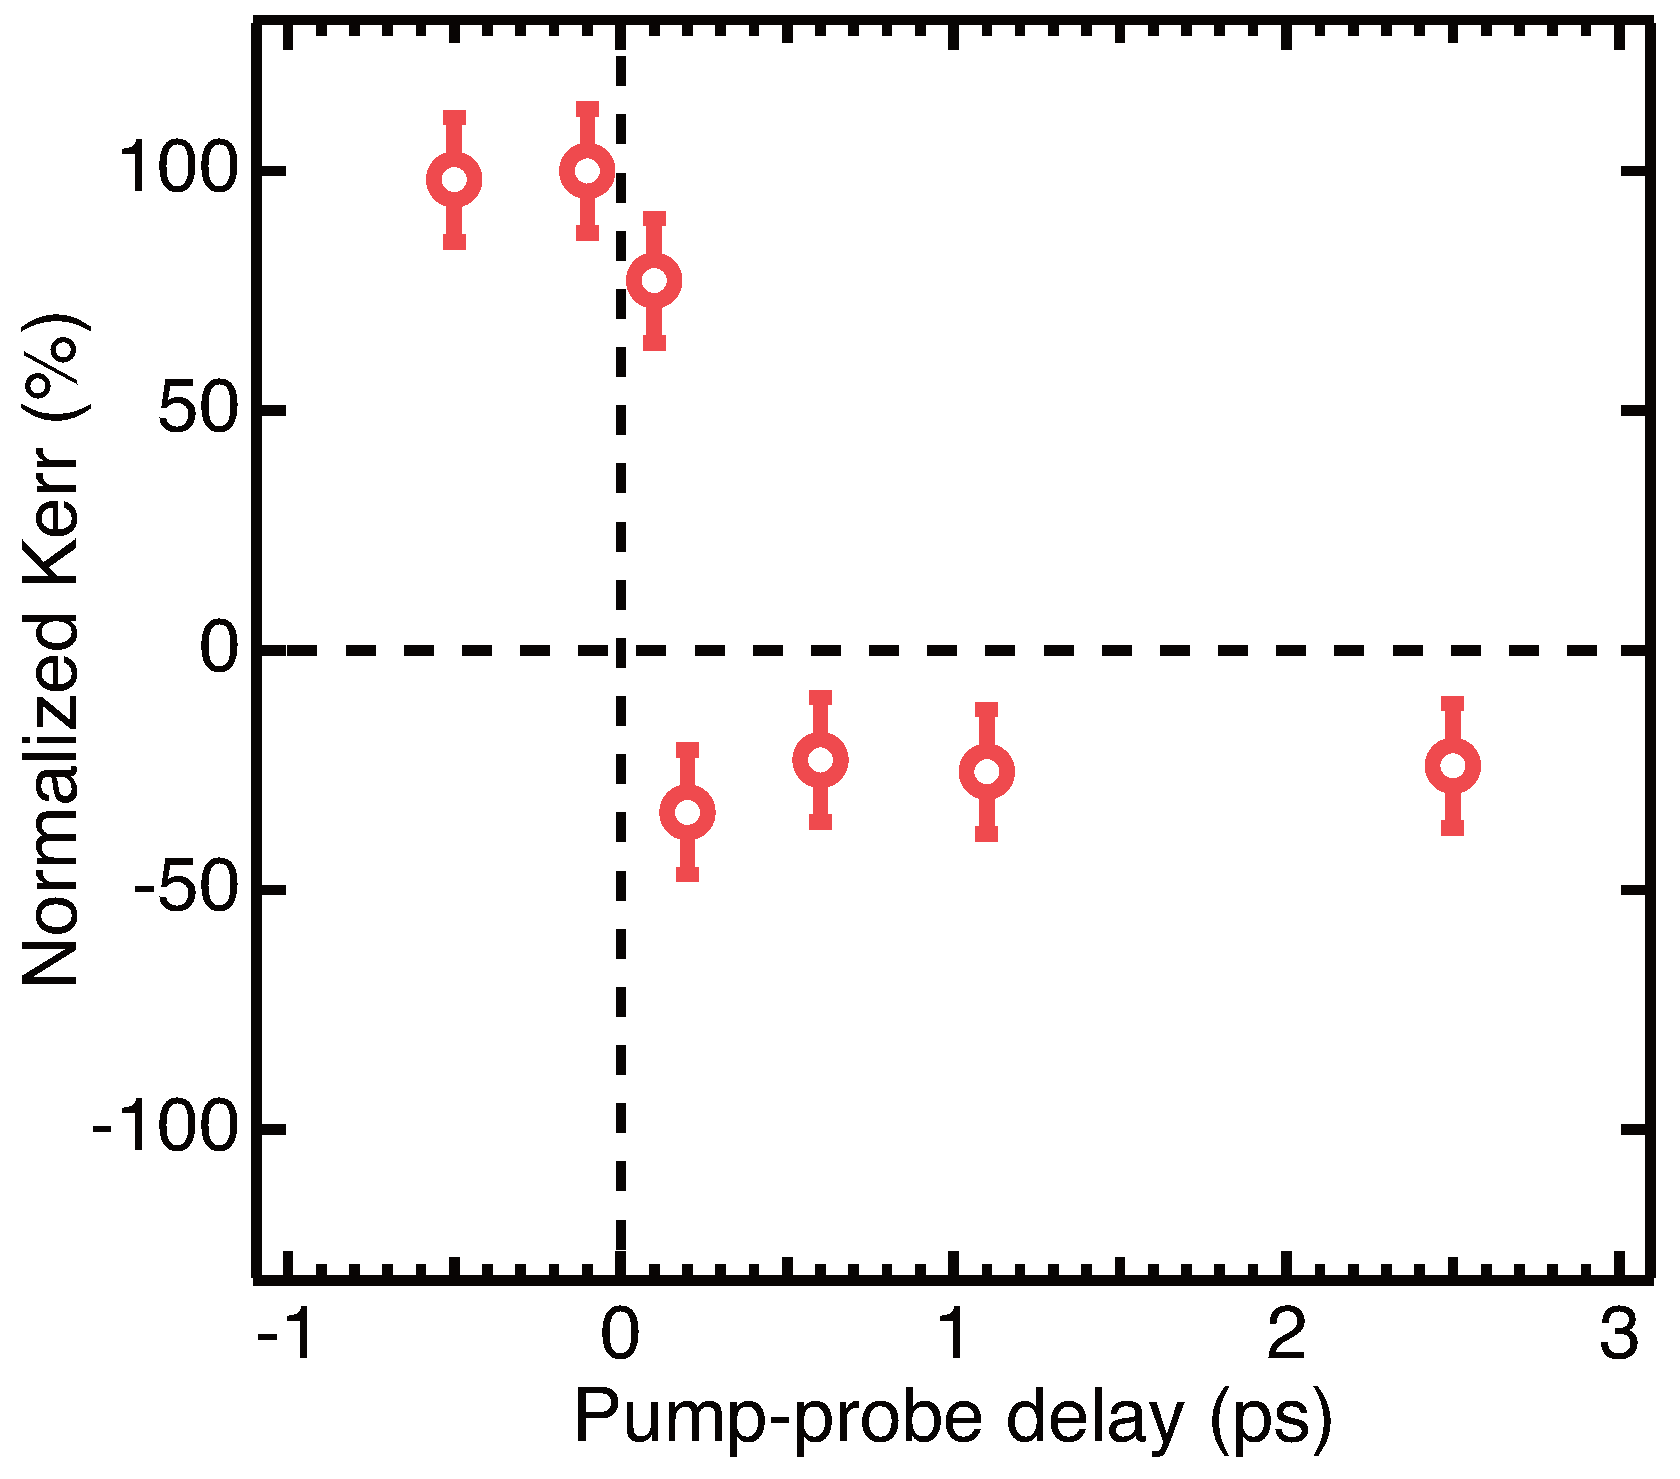
Figure 11 shows the results of time-resolved measurements of the Gd(FeCo) sample (using the Ta (2 nm)/Gd(FeCo) (20 nm)/Ta (10 nm)/SiO structure) that has been known to enable ultrafast spin switching. Each panel shows the intensity variation when normalized with respect to the incident intensity, which was monitored in a shot-by-shot manner with at each delay time. The vertical axis denotes the normalized intensity, i.e., the intensity that was detected at the MCP divided by the incident intensity. The intensity of the light that was reflected by the analyzer is monitored at the detector as a function of , as shown in the inset of Figure 10. The two curves (blue and red) correspond to measurements performed under applied magnetic fields in the up and down directions along the sample surface normal, respectively. The solid lines indicate cosine fitting (Equation (11)) to the experimental results. The zero angle was set at the middle angle between the minima of the curves that were obtained under application of +H and −H. The position of the middle angle did not change with respect to the delay time to within 0.5 degrees, which was the resolution used to determine in this experiment. We see that the apparent shifts in the entire curves increase the reliability and the accuracy of the change, even with the possible existence of fluctuations between the individual data points. The Kerr rotation angle at each delay time can be extracted from the phase difference between the two curves, 3.2, 2.5, −1.1 and −0.7 for the delay times of −100, 100, 200 and 600 fs, respectively. The Kerr rotation angle of 3.1, which was measured from the static RMOKE (see Figure 9), was reproduced in the time-resolved measurements by tuning the FEL energy to 53 eV at fs, at which the Kerr rotation angle is 3.2. Because a polar geometry is used in the TR-RMOKE measurements, the Kerr rotation angle indicates the out-of-plane magnetic moment of Fe in the Gd(FeCo) structure. Figure 11 shows a schematic depiction of the magnetization dynamics with respect to the external field that result from the time-dependent Kerr rotation angle. The lengths of the arrows in the figure correspond to the Kerr rotation angle magnitude for each delay time. At 200 fs after the high-intensity laser irradiation, the changes in the sign of the Kerr rotation angle indicate reversal of the Fe magnetization. Because at 200-fs delay time was larger than the resolution for determining Kerr angle in these measurements, the results showed magnetization reversal rather than the demagnetization. When the FERMI-FEL repetition rate of 10 Hz is considered, the Fe magnetic moment is recovered within at least 100 ms after pumping. This reversal mechanism is classified as a thermal process, unlike the non-thermal effect, such as the process involving the inverse Faraday effect that was observed in previous studies using circularly-polarized beams [109]. Because a linearly-polarized IR pump laser was used, there is no coupling in terms of the exchange of angular momentum between the photons and the spins in the material, although there is a possibility of coherent interaction between spin and photon field [110], which occurs on a much faster timescale than this experimental resolution. Therefore, the angular momentum transfer path is closed between the Gd and Fe sub-lattices [111]. In Figure 12, the time-dependent results that were obtained from this TR-RMOKE experiment with the FEL are shown. The magnetization reversal timescale of the Fe sublattice is the same as that in a previous study that used TR-XMCD with laser slicing [3]. Although the microscopic mechanism of the magnetization dynamics should be explored with various experimental conditions and materials, which is beyond the scope of this review paper, here we demonstrated that the TR-RMOKE scheme is useful for tracing of light-induced magnetization dynamics on a subpicosecond timescale. It should be noted that in time-resolved MOKE measurements, it has been argued that the MOKE signal is modified by a nonequilibrium state that is generated during the femtosecond pulse, meaning that the MOKE signal does not reflect the sample magnetization [112,113]. While this effect is negligible for the time delays shown in Figure 11 and Figure 12, this should be considered when the delay becomes close to the dephasing time of the coherent correlation between the photons and the spins.
7. Conclusions and Outlook
In summary, we reviewed experimental measurements of the polar resonant magneto-optical Kerr effect (P-RMOKE) using soft X-rays and the extension of the method to time-resolved measurements using a free electron laser (FEL). We showed that the method has various advantages, including: (1) element specificity, (2) large Kerr rotation angle, (3) probing of the out-of-plane magnetization with various experimental setup at M-edge range for 3d transition metals, (4) use of the linearly-polarized light and (5) femtosecond-scale time resolution. Because the experiments were performed using the photon-in and photon-out configuration, we expect that the measurements could also be taken under magnetic and electric fields. This type of operando experimental method will be a promising tool for research into femtomagnetism and for the development of ultrafast spintronics.
Acknowledgments
This work was partly supported by the MEXT program “X-ray Free Electron Laser Priority Strategy Program”, by the Hyogo Science and Technology Association and by the Japan Society for the Promotion of Science with a grant-in-aid for Scientific Research (C) (Grant No. 26400328). Sh. Yamamoto was supported by a Grant-in-Aid for JSPS Fellows and by the Program for Leading Graduate Schools (Materials Education program for the future leaders in Research, Industry, and Technology, MERIT). The supporting experiments were performed using the facilities of the Synchrotron Radiation Research Organization of the University of Tokyo, Nos. 2014A7401, 2014B7401, 2014B7473, 2015A7401 and 2015B7401. The authors are grateful to S. Iwata and T. Kato of Nagoya University for synthesizing the GdFeCo sample and measuring the visible MOKE. E. Shigemasa and M. Hasumoto supported the static RMOKE measurement experiments at Ultraviolet Synchrotron Orbital Radiation (UVSOR). M. Kiskinova, F. Capotondi, E. Pedersoli and M. Manfredda supported the TR-RMOKE experiments at FERMI@Elettra. H. Wadati, M. Fujisawa and T. Someya conducted the TR-RMOKE experiments together.
Conflicts of Interest
The authors declare no conflict of interest.
Abbreviations
The following abbreviations are used in this manuscript:
| AFMR | Antiferromagnetic resonance |
| BLS | Brillouin light scattering |
| EUV | Extreme ultraviolet |
| FEL | Free electron laser |
| FMR | Ferromagnetic resonance |
| FTH | Fourier transform holography |
| HHG | High harmonic generation |
| L-RMOKE | Longitudinal resonant magneto-optical Kerr effect |
| MSHG | Magnetization-induced second harmonic generation |
| P-RMOKE | Polar resonant magneto-optical Kerr effect |
| RAE | Rotating analyzer ellipsometry |
| RMOKE | Resonant magneto-optical Kerr effect |
| RIXS | Resonant inelastic X-ray scattering |
| RSXD | Resonant soft X-ray diffraction |
| SAXS | Small angle X-ray scattering |
| SR | Synchrotron radiation |
| TFY | Total fluorescence yield |
| THz-TDS | Terahertz time domain spectroscopy |
| TR | Time-resolved |
| XMCD | X-ray magnetic circular dichroism |
| T-RMOKE | Transverse resonant magneto-optical Kerr effect |
| UV | Ultraviolet |
| XMCD | X-ray magnetic circular dichroism |
| XMLD | X-ray magnetic linear dichroism |
References
- Kirilyuk, A.; Kimel, A.V.; Rasing, T. Ultrafast optical manipulation of magnetic order. Rev. Mod. Phys. 2010, 82, 2731–2784. [Google Scholar] [CrossRef]
- Beaurepaire, E.; Merle, J.C.; Daunois, A.; Bigot, J.Y. Ultrafast spin dynamics in ferromagnetic nickel. Phys. Rev. Lett. 1996, 76, 4250–4253. [Google Scholar] [CrossRef] [PubMed]
- Radu, I.; Vahaplar, K.; Stamm, C.; Kachel, T.; Pontius, N.; Dürr, H.; Ostler, T.; Barker, J.; Evans, R.; Chantrell, R.; et al. Transient ferromagnetic-like state mediating ultrafast reversal of antiferromagnetically coupled spins. Nature 2011, 472, 205–208. [Google Scholar] [CrossRef] [PubMed]
- Thiele, J.U.; Buess, M.; Back, C.H. Spin dynamics of the antiferromagnetic-to-ferromagnetic phase transition in FeRh on a sub-picosecond time scale. Appl. Phys. Lett. 2004, 85, 2857–2859. [Google Scholar] [CrossRef]
- Yamaguchi, K.; Nakajima, M.; Suemoto, T. Coherent control of spin precession motion with impulsive magnetic fields of half-cycle terahertz radiation. Phys. Rev. Lett. 2010, 105, 237201. [Google Scholar] [CrossRef] [PubMed]
- Schellekens, A.; Koopmans, B. Comparing ultrafast demagnetization rates between competing models for finite temperature magnetism. Phys. Rev. Lett. 2013, 110, 217204. [Google Scholar] [CrossRef] [PubMed]
- Bigot, J.Y.; Vomir, M. Ultrafast magnetization dynamics of nanostructures. Annalen der Physik 2013, 525, 2–30. [Google Scholar] [CrossRef]
- Rudolf, D.; Chan, L.O.; Battiato, M.; Adam, R.; Shaw, J.M.; Turgut, E.; Maldonado, P.; Mathias, S.; Grychtol, P.; Nembach, H.T.; et al. Ultrafast magnetization enhancement in metallic multilayers driven by superdiffusive spin current. Nat. Commun. 2012, 3, 1037. [Google Scholar] [CrossRef] [PubMed]
- Dean, M.; Cao, Y.; Liu, X.; Wall, S.; Zhu, D.; Mankowsky, R.; Thampy, V.; Chen, X.; Vale, J.; Casa, D.; et al. Ultrafast energy-and momentum-resolved dynamics of magnetic correlations in the photo-doped Mott insulator Sr2IrO4. Nat. Mater. 2016, 15, 601–605. [Google Scholar] [CrossRef] [PubMed]
- Oppeneer, P. Magneto-optical Kerr spectra. Handb. Magn. Mater. 2001, 13, 229–422. [Google Scholar]
- Kortright, J.; Rice, M. Soft X-ray magneto-optic Kerr rotation and element-specific hysteresis measurement. Rev. Sci. Instrum. 1996, 67, 3353. [Google Scholar] [CrossRef]
- Mertins, H.C.; Valencia, S.; Abramsohn, D.; Gaupp, A.; Gudat, W.; Oppeneer, P.M. X-ray Kerr rotation and ellipticity spectra at the 2 p edges of Fe, Co, and Ni. Phys. Rev. B 2004, 69. [Google Scholar] [CrossRef]
- Chen, C.; Idzerda, Y.; Lin, H.J.; Smith, N.; Meigs, G.; Chaban, E.; Ho, G.; Pellegrin, E.; Sette, F. Experimental confirmation of the X-ray magnetic circular dichroism sum rules for iron and cobalt. Phys. Rev. Lett. 1995, 75, 152–155. [Google Scholar] [CrossRef] [PubMed]
- Stöhr, J.; Padmore, H.; Anders, S.; Stammler, T.; Scheinfein, M. Principles of X-ray magnetic dichroism spectromicroscopy. Surf. Rev. Lett. 1998, 5, 1297–1308. [Google Scholar] [CrossRef]
- Yamamoto, Sh.; Taguchi, M.; Someya, T.; Kubota, Y.; Ito, S.; Wadati, H.; Fujisawa, M.; Capotondi, F.; Pedersoli, E.; Manfredda, M.; et al. Ultrafast spin-switching of a ferrimagnetic alloy at room temperature traced by resonant magneto-optical Kerr effect using a seeded free electron laser. Revi. Sci. Instrum. 2015, 86. [Google Scholar] [CrossRef] [PubMed]
- Yang, Z.; Scheinfein, M. Combined three-axis surface magneto-optical Kerr effects in the study of surface and ultra-thin-film magnetism. J. Appl. Phys. 1993, 74, 6810–6823. [Google Scholar] [CrossRef]
- Strelniker, Y.M.; Bergman, D.J. Magneto-optical response of a periodic metallic nano-structure. In Proceedings of the SPIE 9574, International Society for Optics and Photonics, San Diego, CA, USA, 9 August 2015; p. 954705. [Google Scholar]
- Nozaki, T.; Shiota, Y.; Miwa, S.; Murakami, S.; Bonell, F.; Ishibashi, S.; Kubota, H.; Yakushiji, K.; Saruya, T.; Fukushima, A.; et al. Electric-field-induced ferromagnetic resonance excitation in an ultra-thin ferromagnetic metal layer. Nat. Phys. 2012, 8, 491–496. [Google Scholar] [CrossRef]
- Milano, J.; Steren, L.; Grimsditch, M. Effect of dipolar interaction on the antiferromagnetic resonance spectra of NiO. Phys. Rev. Lett. 2004, 93. [Google Scholar] [CrossRef] [PubMed]
- Hangyo, M.; Tani, M.; Nagashima, T. Terahertz time-domain spectroscopy of solids: A review. Int. J. Infrared Millim. Waves 2005, 26, 1661–1690. [Google Scholar] [CrossRef]
- Parchenko, S.; Satoh, T.; Yoshimine, I.; Stobiecki, F.; Maziewski, A.; Stupakiewicz, A. Non-thermal optical excitation of terahertz-spin precession in a magneto-optical insulator. Appl. Phys. Lett. 2016, 108. [Google Scholar] [CrossRef]
- Khorsand, A.; Savoini, M.; Kirilyuk, A.; Kimel, A.; Tsukamoto, A.; Itoh, A.; Rasing, T. Element-specific probing of ultrafast spin dynamics in multisublattice magnets with visible light. Phys. Rev. Lett. 2013, 110, 107205. [Google Scholar] [CrossRef] [PubMed]
- Ogawa, Y.; Kaneko, Y.; He, J.; Yu, X.; Arima, T.; Tokura, Y. Magnetization-induced second harmonic generation in a polar ferromagnet. Phys. Rev. Lett. 2004, 92, 047401. [Google Scholar] [CrossRef] [PubMed]
- Regensburger, H.; Vollmer, R.; Kirschner, J. Time-resolved magnetization-induced second-harmonic generation from the Ni (110) surface. Phys. Rev. B 2000, 61, 14716–14722. [Google Scholar] [CrossRef]
- Mertins, H.C.; Oppeneer, P.; Kuneš, J.; Gaupp, A.; Abramsohn, D.; Schäfers, F. Observation of the X-ray magneto-optical Voigt effect. Phys. Rev. Lett. 2001, 87, 047401. [Google Scholar] [CrossRef] [PubMed]
- Höchst, H.; Rioux, D.; Zhao, D.; Huber, D.L. Magnetic linear dichroism effects in reflection spectroscopy: A case study at the Fe M 2, 3 edge. J. Appl. Phys. 1997, 81, 7584–7588. [Google Scholar] [CrossRef]
- Schwickert, M.; Guo, G.; Tomaz, M.; O’Brien, W.; Harp, G. X-ray magnetic linear dichroism in absorption at the L edge of metallic Co, Fe, Cr, and V. Phys. Rev. B 1998, 58, R4289. [Google Scholar] [CrossRef]
- Finazzi, M.; Duo, L.; Ciccacci, F. Magnetic properties of interfaces and multilayers based on thin antiferromagnetic oxide films. Surf. Sci. Rep. 2009, 64, 139–167. [Google Scholar] [CrossRef]
- Ament, L.J.; Van Veenendaal, M.; Devereaux, T.P.; Hill, J.P.; Van Den Brink, J. Resonant inelastic X-ray scattering studies of elementary excitations. Rev. Mod. Phys. 2011, 83, 705–767. [Google Scholar] [CrossRef]
- Fabbris, G.; Meyers, D.; Xu, L.; Katukuri, V.; Hozoi, L.; Liu, X.; Chen, Z.Y.; Okamoto, J.; Schmitt, T.; Uldry, A.; et al. Doping Dependence of Collective Spin and Orbital Excitations in the Spin-1 Quantum Antiferromagnet La2−xSrxNiO4 Observed by X Rays. Phys. Rev. Lett. 2017, 118, 156402. [Google Scholar] [CrossRef] [PubMed]
- Dean, M.; Springell, R.; Monney, C.; Zhou, K.; Pereiro, J.; Božović, I.; Dalla Piazza, B.; Rønnow, H.; Morenzoni, E.; Van Den Brink, J.; et al. Spin excitations in a single La2CuO4 layer. Nat. Mater. 2012, 11, 850–854. [Google Scholar] [CrossRef] [PubMed]
- Minola, M.; Di Castro, D.; Braicovich, L.; Brookes, N.; Innocenti, D.; Sala, M.M.; Tebano, A.; Balestrino, G.; Ghiringhelli, G. Magnetic and ligand field properties of copper at the interfaces of (CaCuO2)n/(SrTiO3)n superlattices. Phys. Rev. B 2012, 85, 235138. [Google Scholar] [CrossRef]
- Müller, L.; Gutt, C.; Pfau, B.; Schaffert, S.; Geilhufe, J.; Büttner, F.; Mohanty, J.; Flewett, S.; Treusch, R.; Düsterer, S.; et al. Breakdown of the X-ray resonant magnetic scattering signal during intense pulses of extreme ultraviolet free-electron-laser radiation. Phys. Rev. Lett. 2013, 110, 234801. [Google Scholar] [CrossRef] [PubMed]
- Yamasaki, Y.; Sudayama, T.; Okamoto, J.; Nakao, H.; Kubota, M.; Murakami, Y. Diffractometer for small angle resonant soft X-ray scattering under magnetic field. J. Phys. Conf. Ser. 2013, 425. [Google Scholar] [CrossRef]
- Günther, C.M.; Guehrs, E.; Schneider, M.; Pfau, B.; von Korff Schmising, C.; Geilhufe, J.; Schaffert, S.; Eisebitt, S. Experimental evaluations of signal-to-noise in spectro-holography via modified uniformly redundant arrays in the soft X-ray and extreme ultraviolet spectral regime. J. Opt. 2017, 19. [Google Scholar] [CrossRef]
- Eisebitt, S.; Lüning, J.; Schlotter, W.; Lörgen, M.; Hellwig, O.; Eberhardt, W.; Stöhr, J. Lensless imaging of magnetic nanostructures by X-ray spectro-holography. Nature 2004, 432, 885–888. [Google Scholar] [CrossRef] [PubMed]
- Tanaka, A.; Chang, C.; Buchholz, M.; Trabant, C.; Schierle, E.; Schlappa, J.; Schmitz, D.; Ott, H.; Metcalf, P.; Tjeng, L.; et al. Analysis of charge and orbital order in Fe3O4 by Fe L2,3 resonant X-ray diffraction. Phys. Rev. B 2013, 88, 195110. [Google Scholar] [CrossRef]
- Chan, L.O.; Siemens, M.; Murnane, M.M.; Kapteyn, H.C.; Mathias, S.; Aeschlimann, M.; Grychtol, P.; Adam, R.; Schneider, C.M.; Shaw, J.M.; et al. Ultrafast demagnetization dynamics at the M edges of magnetic elements observed using a tabletop high-harmonic soft X-ray source. Phys. Rev. Lett. 2009, 103, 257402. [Google Scholar]
- Turgut, E.; Shaw, J.M.; Grychtol, P.; Nembach, H.T.; Rudolf, D.; Adam, R.; Aeschlimann, M.; Schneider, C.M.; Silva, T.J.; Murnane, M.M.; et al. Controlling the competition between optically induced ultrafast spin-flip scattering and spin transport in magnetic multilayers. Phys. Rev. Lett. 2013, 110, 197201. [Google Scholar] [CrossRef] [PubMed]
- Ferrari, E.; Spezzani, C.; Fortuna, F.; Delaunay, R.; Vidal, F.; Nikolov, I.; Cinquegrana, P.; Diviacco, B.; Gauthier, D.; Penco, G.; et al. Element Selective Probe of the Ultra-Fast Magnetic Response to an Element Selective Excitation in Fe-Ni Compounds Using a Two-Color FEL Source. Photonics 2017, 4, 6. [Google Scholar] [CrossRef]
- Stamm, C.; Kachel, T.; Pontius, N.; Mitzner, R.; Quast, T.; Holldack, K.; Khan, S.; Lupulescu, C.; Aziz, E.; Wietstruk, M.; et al. Femtosecond modification of electron localization and transfer of angular momentum in nickel. Nat. Mater. 2007, 6, 740–743. [Google Scholar] [CrossRef] [PubMed]
- Willems, F.; Smeenk, C.; Zhavoronkov, N.; Kornilov, O.; Radu, I.; Schmidbauer, M.; Hanke, M.; von Korff Schmising, C.; Vrakking, M.; Eisebitt, S. Probing ultrafast spin dynamics with high-harmonic magnetic circular dichroism spectroscopy. Phys. Rev. B 2015, 92, 220405. [Google Scholar] [CrossRef]
- Higley, D.J.; Hirsch, K.; Dakovski, G.L.; Jal, E.; Yuan, E.; Liu, T.; Lutman, A.A.; MacArthur, J.P.; Arenholz, E.; Chen, Z.; et al. Femtosecond X-ray magnetic circular dichroism absorption spectroscopy at an X-ray free electron laser. Rev. Sci. Instrum. 2016, 87. [Google Scholar] [CrossRef] [PubMed]
- Pfau, B.; Schaffert, S.; Müller, L.; Gutt, C.; Al-Shemmary, A.; Büttner, F.; Delaunay, R.; Düsterer, S.; Flewett, S.; Frömter, R.; et al. Ultrafast optical demagnetization manipulates nanoscale spin structure in domain walls. Nat. Commun. 2012, 3, 1100. [Google Scholar] [CrossRef] [PubMed]
- Vodungbo, B.; Gautier, J.; Lambert, G.; Sardinha, A.B.; Lozano, M.; Sebban, S.; Ducousso, M.; Boutu, W.; Li, K.; Tudu, B.; et al. Laser-induced ultrafast demagnetization in the presence of a nanoscale magnetic domain network. Nat. Commun. 2012, 3, 999. [Google Scholar] [CrossRef] [PubMed]
- Graves, C.; Reid, A.; Wang, T.; Wu, B.; De Jong, S.; Vahaplar, K.; Radu, I.; Bernstein, D.; Messerschmidt, M.; Müller, L.; et al. Nanoscale spin reversal by non-local angular momentum transfer following ultrafast laser excitation in ferrimagnetic GdFeCo. Nat. Mater. 2013, 12, 293–298. [Google Scholar] [CrossRef] [PubMed]
- Büttner, F.; Moutafis, C.; Schneider, M.; Krüger, B.; Günther, C.; Geilhufe, J.; Schmising, C.v.K.; Mohanty, J.; Pfau, B.; Schaffert, S.; et al. Dynamics and inertia of skyrmionic spin structures. Nat. Phys. 2015, 11, 225–228. [Google Scholar] [CrossRef]
- Bukin, N.; McKeever, C.; Burgos-Parra, E.; Keatley, P.; Hicken, R.; Ogrin, F.; Beutier, G.; Dupraz, M.; Popescu, H.; Jaouen, N.; et al. Time-resolved imaging of magnetic vortex dynamics using holography with extended reference autocorrelation by linear differential operator. Sci. Rep. 2016, 6. [Google Scholar] [CrossRef] [PubMed]
- Von Korff Schmising, C.; Pfau, B.; Schneider, M.; Günther, C.; Giovannella, M.; Perron, J.; Vodungbo, B.; Müller, L.; Capotondi, F.; Pedersoli, E.; et al. Imaging ultrafast demagnetization dynamics after a spatially localized optical excitation. Phys. Rev. Lett. 2014, 112, 217203. [Google Scholar] [CrossRef]
- Holldack, K.; Pontius, N.; Schierle, E.; Kachel, T.; Soltwisch, V.; Mitzner, R.; Quast, T.; Springholz, G.; Weschke, E. Ultrafast dynamics of antiferromagnetic order studied by femtosecond resonant soft X-ray diffraction. Appl. Phys. Lett. 2010, 97. [Google Scholar] [CrossRef]
- Pontius, N.; Kachel, T.; Schüßler-Langeheine, C.; Schlotter, W.; Beye, M.; Sorgenfrei, F.; Chang, C.; Foehlisch, A.; Wurth, W.; Metcalf, P.; et al. Time-resolved resonant soft X-ray diffraction with free-electron lasers: Femtosecond dynamics across the Verwey transition in magnetite. Appl. Phys. Lett. 2011, 98, 182504. [Google Scholar] [CrossRef]
- Först, M.; Caviglia, A.; Scherwitzl, R.; Mankowsky, R.; Zubko, P.; Khanna, V.; Bromberger, H.; Wilkins, S.; Chuang, Y.D.; Lee, W.; et al. Spatially resolved ultrafast magnetic dynamics initiated at a complex oxide heterointerface. Nat. Mater. 2015, 14, 883–888. [Google Scholar] [CrossRef] [PubMed]
- Henke, B.L.; Gullikson, E.; Davis, J.C. X-ray Interactions: Photoabsorption, Scattering, Transmission, and Reflection at E = 50–30,000 eV, Z = 1–92. At. Data Nucl. Data Tables 1993, 54, 181–342. [Google Scholar] [CrossRef]
- Tsuyama, T.; Chakraverty, S.; Macke, S.; Pontius, N.; Schüßler-Langeheine, C.; Hwang, H.; Tokura, Y.; Wadati, H. Photoinduced Demagnetization and Insulator-to-Metal Transition in Ferromagnetic Insulating BaFeO3 Thin Films. Phys. Rev. Lett. 2016, 116, 256402. [Google Scholar] [CrossRef] [PubMed]
- Takubo, K.; Yamamoto, K.; Hirata, Y.; Yokoyama, Y.; Kubota, Y.; Yamamoto, Sh.; Yamamoto, S.; Matsuda, I.; Shin, S.; Seki, T.; et al. Capturing ultrafast magnetic dynamics by time-resolved soft x-ray magnetic circular dichroism. Appl. Phys. Lett. 2017, 110, 162401. [Google Scholar] [CrossRef]
- Yamamoto, Sh.; Taguchi, M.; Fujisawa, M.; Hobara, R.; Yamamoto, S.; Yaji, K.; Nakamura, T.; Fujikawa, K.; Yukawa, R.; Togashi, T.; et al. Observation of a giant Kerr rotation in a ferromagnetic transition metal by M-edge resonant magneto-optic Kerr effect. Phys. Rev. B 2014, 89, 064423. [Google Scholar] [CrossRef]
- Valencia, S.; Gaupp, A.; Gudat, W.; Mertins, H.C.; Oppeneer, P.; Abramsohn, D.; Schneider, C. Faraday rotation spectra at shallow core levels: 3p edges of Fe, Co, and Ni. New J. Phys. 2006, 8, 254. [Google Scholar] [CrossRef]
- Miyahara, T.; Park, S.Y.; Hanyu, T.; Hatano, T.; Moto, S.; Kagoshima, Y. Comparison between 3 p and 2 p magnetic circular dichroism in transition metals and alloys: Is the sum rule applicable to itinerant magnetic systems? Rev. Sci. Instrum. 1995, 66, 1558–1560. [Google Scholar] [CrossRef]
- Razdolski, I.; Alekhin, A.; Martens, U.; Bürstel, D.; Diesing, D.; Münzenberg, M.; Bovensiepen, U.; Melnikov, A. Analysis of the Time-Resolved Magneto-Optical Kerr Effect for Ultrafast Magnetization Dynamics in Ferromagnetic Thin Films. J. Phys. Condens. Matter 2017, 29, 174002. [Google Scholar] [CrossRef] [PubMed]
- Holldack, K.; Bahrdt, J.; Balzer, A.; Bovensiepen, U.; Brzhezinskaya, M.; Erko, A.; Eschenlohr, A.; Follath, R.; Firsov, A.; Frentrup, W.; et al. FemtoSpeX: A versatile optical pump–soft X-ray probe facility with 100 fs X-ray pulses of variable polarization. J. Synchrotron. Radiat. 2014, 21, 1090–1104. [Google Scholar] [CrossRef] [PubMed]
- Allaria, E.; Diviacco, B.; Callegari, C.; Finetti, P.; Mahieu, B.; Viefhaus, J.; Zangrando, M.; De Ninno, G.; Lambert, G.; Ferrari, E.; et al. Control of the polarization of a vacuum-ultraviolet, high-gain, free-electron laser. Phys. Rev. X 2014, 4, 041040. [Google Scholar] [CrossRef]
- Roussel, E.; Allaria, E.; Callegari, C.; Coreno, M.; Cucini, R.; Mitri, S.D.; Diviacco, B.; Ferrari, E.; Finetti, P.; Gauthier, D.; et al. Polarization Characterization of Soft X-ray Radiation at FERMI FEL-2. Photonics 2017, 4, 29. [Google Scholar] [CrossRef]
- Lutman, A.A.; MacArthur, J.P.; Ilchen, M.; Lindahl, A.O.; Buck, J.; Coffee, R.N.; Dakovski, G.L.; Dammann, L.; Ding, Y.; Dürr, H.A.; et al. Polarization control in an X-ray free-electron laser. Nat. Photonics 2016, 10, 468–472. [Google Scholar] [CrossRef]
- Vodungbo, B.; Sardinha, A.B.; Gautier, J.; Lambert, G.; Valentin, C.; Lozano, M.; Iaquaniello, G.; Delmotte, F.; Sebban, S.; Lüning, J.; et al. Polarization control of high order harmonics in the EUV photon energy range. Opt. Express 2011, 19, 4346–4356. [Google Scholar] [CrossRef] [PubMed]
- Lambert, G.; Vodungbo, B.; Gautier, J.; Mahieu, B.; Malka, V.; Sebban, S.; Zeitoun, P.; Luning, J.; Perron, J.; Andreev, A.; et al. Towards enabling femtosecond helicity-dependent spectroscopy with high-harmonic sources. Nat. Commun. 2015, 6. [Google Scholar] [CrossRef] [PubMed]
- Rasing, T.; Koerkamp, M.G.; Koopmans, B.; Berg, H.V. Giant nonlinear magneto-optical Kerr effects from Fe interfaces. J. Appl. Phys. 1996, 79, 6181–6185. [Google Scholar] [CrossRef]
- Williams, P.; Rose, A.; Wang, C. Rotating-polarizer polarimeter for accurate retardance measurement. Appl. Opt. 1997, 36, 6466–6472. [Google Scholar] [CrossRef] [PubMed]
- Aspnes, D.; Studna, A. High precision scanning ellipsometer. Appl. Opt. 1975, 14, 220–228. [Google Scholar] [CrossRef] [PubMed]
- Suzuki, M.; Hirono, T. Control the light polarization. Jpn. Soc. Synchrotron Radiat. Res. 2006, 19, 444–453. [Google Scholar]
- Fujiwara, H. Spectroscopic Ellipsometry: Principles and Applications; John Wiley & Sons: Chichester, UK, 2007. [Google Scholar]
- Schäfers, F.; Mertins, H.C.; Gaupp, A.; Gudat, W.; Mertin, M.; Packe, I.; Schmolla, F.; Di Fonzo, S.; Soullié, G.; Jark, W.; et al. Soft-X-ray polarimeter with multilayer optics: Complete analysis of the polarization state of light. Appl. Opt. 1999, 38, 4074–4088. [Google Scholar] [CrossRef] [PubMed]
- Kimura, H.; Hirono, T.; Tamenori, Y.; Saitoh, Y.; Salashchenko, N.; Ishikawa, T. Transmission type Sc/Cr multilayer as a quarter-wave plate for near 400 eV. J. Electron. Spectrosc. Relat. Phenom. 2005, 144, 1079–1081. [Google Scholar] [CrossRef]
- Hirono, T.; Kimura, H.; Muro, T.; Saitoh, Y.; Ishikawa, T. Full polarization measurement of SR emitted from twin helical undulators with use of Sc/Cr multilayers at near 400 eV. J. Electron. Spectrosc. Relat. Phenom. 2005, 144, 1097–1099. [Google Scholar] [CrossRef]
- Namikawa, K.; Ando, M.; Nakajima, T.; Kawata, H. X-ray resonance magnetic scattering. J. Phys. Soc. Jpn. 1985, 54, 4099–4102. [Google Scholar] [CrossRef]
- De Bergevin, F.; Brunel, M. Diffraction of X-rays by magnetic materials. I. General formulae and measurements on ferro-and ferrimagnetic compounds. Acta Crystallogr. Sect. A 1981, 37, 314–324. [Google Scholar] [CrossRef]
- Igarashi, J.I.; Hirai, K. Magnetic circular dichroism at the K edge of nickel and iron. Phys. Rev. B 1994, 50, 17820. [Google Scholar] [CrossRef]
- Krinchik, G.; Gushchin, V. Investigation of Interband Transitions in Ferromagnetic Metals and Alloys by the Magneto-optical Method. Sov. Phys. JETP 1969, 29, 984. [Google Scholar]
- Kao, C.; Hastings, J.; Johnson, E.; Siddons, D.; Smith, G.; Prinz, G. Magnetic-resonance exchange scattering at the iron L II and L III edges. Phys. Rev. Lett. 1990, 65, 373. [Google Scholar] [CrossRef] [PubMed]
- Hannon, J.; Trammell, G.; Blume, M.; Gibbs, D. X-ray resonance exchange scattering. Phys. Rev. Lett. 1988, 61, 1245–1248. [Google Scholar] [CrossRef] [PubMed]
- Hillebrecht, F.; Kinoshita, T.; Spanke, D.; Dresselhaus, J.; Roth, C.; Rose, H.; Kisker, E. New magnetic linear dichroism in total photoelectron yield for magnetic domain imaging. Phys. Rev. Lett. 1995, 75, 2224–2227. [Google Scholar] [CrossRef] [PubMed]
- Kinoshita, T.; Rose, H.B.; Roth, C.; Spanke, D.; Hillebrecht, F.U.; Kisker, E. A new type of magnetic linear dichroism at Fe and Co M2,3 edges. J. Electron. Spectrosc. Relat. Phenom. 1996, 78, 237–240. [Google Scholar] [CrossRef]
- Grychtol, P.; Adam, R.; Kaiser, A.; Cramm, S.; Bürgler, D.; Schneider, C. Layer-selective studies of an anti-ferromagnetically coupled multilayer by resonant magnetic reflectivity in the extreme ultraviolet range. J. Electron. Spectrosc. Relat. Phenom. 2011, 184, 287–290. [Google Scholar] [CrossRef]
- Tesch, M.; Gilbert, M.; Mertins, H.C.; Bürgler, D.; Berges, U.; Schneider, C. X-ray magneto-optical polarization spectroscopy: An analysis from the visible region to the X-ray regime. Appl. Opt. 2013, 52, 4294–4310. [Google Scholar] [CrossRef] [PubMed]
- Kleibert, A.; Senz, V.; Bansmann, J.; Oppeneer, P. Thickness dependence and magnetocrystalline anisotropy of the X-ray transverse magneto-optical Kerr effect at the Co 2 p edges of ultra-thin Co films on W (110). Phys. Rev. B 2005, 72, 144404. [Google Scholar] [CrossRef]
- Pretorius, M.; Friedrich, J.; Ranck, A.; Schroeder, M.; Voss, J.; Wedemeier, V.; Spanke, D.; Knabben, D.; Rozhko, I.; Ohldag, H.; et al. Transverse magneto-optical Kerr effect of Fe at the Fe 3p threshold. Phys. Rev. B 1997, 55, 14133. [Google Scholar] [CrossRef]
- Hecker, M.; Oppeneer, P.M.; Valencia, S.; Mertins, H.C.; Schneider, C.M. Soft X-ray magnetic reflection spectroscopy at the 3p absorption edges of thin Fe films. J. Electron. Spectrosc. Relat. Phenom. 2005, 144, 881–884. [Google Scholar] [CrossRef]
- Zaharko, O.; Oppeneer, P.; Grimmer, H.; Horisberger, M.; Mertins, H.C.; Abramsohn, D.; Schäfers, F.; Bill, A.; Braun, H.B. Exchange coupling in Fe/NiO/Co film studied by soft X-ray resonant magnetic reflectivity. Phys. Rev. B 2002, 66, 134406. [Google Scholar] [CrossRef]
- Knabben, D.; Weber, N.; Raab, B.; Koop, T.; Hillebrecht, F.; Kisker, E.; Guo, G. Transverse magneto-optical Kerr effect of Fe at the 2p excitation threshold. J. Magn. Magn. Mater. 1998, 190, 349–356. [Google Scholar] [CrossRef]
- Mertins, H.C.; Abramsohn, D.; Gaupp, A.; Schäfers, F.; Gudat, W.; Zaharko, O.; Grimmer, H.; Oppeneer, P. Resonant magnetic reflection coefficients at the Fe 2 p edge obtained with linearly and circularly-polarized soft x rays. Phys. Rev. B 2002, 66, 184404. [Google Scholar] [CrossRef]
- Senz, V.; Kleibert, A.; Bansmann, J. Transverse magneto-optical Kerr effect in the soft X-ray regime of ultra-thin iron films and islands on W (110). Surf. Rev. Lett. 2002, 9, 913–919. [Google Scholar] [CrossRef]
- Kortright, J.; Kim, S.K.; Fullerton, E.; Jiang, J.; Bader, S. X-ray magneto-optic Kerr effect studies of spring magnet heterostructures. Nucl. Instrum. Methods Phys. Res. A 2001, 467, 1396–1403. [Google Scholar] [CrossRef]
- Sacchi, M.; Panaccione, G.; Vogel, J.; Mirone, A.; van der Laan, G. Magnetic dichroism in reflectivity and photoemission using linearly polarized light: 3 p core level of Ni (110). Phys. Rev. B 1998, 58, 3750–3754. [Google Scholar] [CrossRef]
- De Bergevin, F.; Brunel, M.; Gale, R.; Vettier, C.; Elkaim, E.; Bessière, M.; Lefebvre, S. X-ray resonant scattering in the ferromagnet CoPt. Phys. Rev. B 1992, 46, 10772. [Google Scholar] [CrossRef]
- Valencia, S.; Gaupp, A.; Gudat, W.; Abad, L.; Balcells, L.; Martinez, B. Surface degradation of magnetic properties in manganite thin films proved with magneto-optical techniques in reflection geometry. Appl. Phys. Lett. 2007, 90, 252509. [Google Scholar] [CrossRef]
- Kortright, J.B. Resonant soft X-ray and extreme ultraviolet magnetic scattering in nanostructured magnetic materials: Fundamentals and directions. J. Electron. Spectrosc. Relat. Phenom. 2013, 189, 178–186. [Google Scholar] [CrossRef]
- Kortright, J.; Rice, M.; Kim, S.K.; Walton, C.; Warwick, T. Optics for element-resolved soft X-ray magneto-optical studies. J. Magn. Magn. Mater. 1999, 191, 79–89. [Google Scholar] [CrossRef]
- Hellwig, O.; Kortright, J.; Takano, K.; Fullerton, E.E. Switching behavior of Fe-Pt/Ni-Fe exchange-spring films studied by resonant soft-X-ray magneto-optical Kerr effect. Phys. Rev. B 2000, 62, 11694. [Google Scholar] [CrossRef]
- Lee, K.S.; Kim, S.K.; Kortright, J. Atomic-scale depth selectivity of soft X-ray resonant Kerr effect. Appl. Phys. Lett. 2003, 83, 3764–3766. [Google Scholar] [CrossRef]
- Kim, S.K.; Lee, K.S.; Kortright, J.; Shin, S.C. Soft X-ray resonant Kerr rotation measurement and simulation of element-resolved and interface-sensitive magnetization reversals in a NiFe/FeMn/Co trilayer structure. Appl. Phys. Lett. 2005, 86, 102502. [Google Scholar] [CrossRef]
- Valencia, S.; Mertins, H.C.; Abramsohn, D.; Gaupp, A.; Gudat, W.; Oppeneer, P.M. Interference effects in the X-ray Kerr rotation spectrum at the Fe 2p edge. Phys. B Condensed Matter 2004, 345, 189–192. [Google Scholar] [CrossRef]
- Saito, K.; Igeta, M.; Ejima, T.; Hatano, T.; Watanabe, M. Faraday and Magnetic Kerr Rotation Measurements on Co and Ni Films Around M2, 3 Edges. Surf. Rev. Lett. 2002, 9, 943–947. [Google Scholar] [CrossRef]
- Erskine, J.; Stern, E. Calculation of the m 23 magneto-optical absorption spectrum of ferromagnetic nickel. Phys. Rev. B 1975, 12, 5016. [Google Scholar] [CrossRef]
- Capotondi, F.; Pedersoli, E.; Mahne, N.; Menk, R.; Passos, G.; Raimondi, L.; Svetina, C.; Sandrin, G.; Zangrando, M.; Kiskinova, M.; et al. Invited Article: Coherent imaging using seeded free-electron laser pulses with variable polarization: First results and research opportunities. Rev. Sci. Instrum. 2013, 84, 051301. [Google Scholar] [CrossRef] [PubMed]
- Allaria, E.; Appio, R.; Badano, L.; Barletta, W.; Bassanese, S.; Biedron, S.; Borga, A.; Busetto, E.; Castronovo, D.; Cinquegrana, P.; et al. Highly coherent and stable pulses from the FERMI seeded free-electron laser in the extreme ultraviolet. Nat. Photonics 2012, 6, 699–704. [Google Scholar] [CrossRef]
- Allaria, E.; Battistoni, A.; Bencivenga, F.; Borghes, R.; Callegari, C.; Capotondi, F.; Castronovo, D.; Cinquegrana, P.; Cocco, D.; Coreno, M.; et al. Tunability experiments at the FERMI@ Elettra free-electron laser. New J. Phys. 2012, 14, 113009. [Google Scholar] [CrossRef]
- Danailov, M.B.; Bencivenga, F.; Capotondi, F.; Casolari, F.; Cinquegrana, P.; Demidovich, A.; Giangrisostomi, E.; Kiskinova, M.P.; Kurdi, G.; Manfredda, M.; et al. Towards jitter-free pump-probe measurements at seeded free electron laser facilities. Opt. Express 2014, 22, 12869–12879. [Google Scholar] [CrossRef] [PubMed]
- Casolari, F.; Bencivenga, F.; Capotondi, F.; Giangrisostomi, E.; Manfredda, M.; Mincigrucci, R.; Pedersoli, E.; Principi, E.; Masciovecchio, C.; Kiskinova, M. Role of multilayer-like interference effects on the transient optical response of Si3N4 films pumped with free-electron laser pulses. Appl. Phys. Lett. 2014, 104, 191104. [Google Scholar] [CrossRef]
- Finetti, P.; Allaria, E.; Diviacco, B.; Callegari, C.; Mahieu, B.; Viefhaus, J.; Zangrando, M.; De Ninno, G.; Lambert, G.; Ferrari, E.; et al. Polarization measurement of free electron laser pulses in the VUV generated by the variable polarization source FERMI. In Proceedings of the SPIE 9210, International Society for Optics and Photonics, San Diego, CA, USA, 17 August 2014; p. 92100K. [Google Scholar]
- Stanciu, C.; Hansteen, F.; Kimel, A.; Kirilyuk, A.; Tsukamoto, A.; Itoh, A.; Rasing, T. All-optical magnetic recording with circularly-polarized light. Phys. Rev. Lett. 2007, 99, 047601. [Google Scholar] [CrossRef] [PubMed]
- Bigot, J.Y.; Vomir, M.; Beaurepaire, E. Coherent ultrafast magnetism induced by femtosecond laser pulses. Nat. Phys. 2009, 5, 515–520. [Google Scholar] [CrossRef]
- Mentink, J.; Hellsvik, J.; Afanasiev, D.; Ivanov, B.; Kirilyuk, A.; Kimel, A.; Eriksson, O.; Katsnelson, M.; Rasing, T. Ultrafast spin dynamics in multisublattice magnets. Phys. Rev. Lett. 2012, 108, 057202. [Google Scholar] [CrossRef] [PubMed]
- Zhang, G.; Hübner, W.; Lefkidis, G.; Bai, Y.; George, T.F. Paradigm of the time-resolved magneto-optical Kerr effect for femtosecond magnetism. Nat. Phys. 2009, 5, 499–502. [Google Scholar] [CrossRef]
- Carva, K.; Battiato, M.; Oppeneer, P.M. Is the controversy over femtosecond magneto-optics really solved? Nat. Phys. 2011, 7, 665. [Google Scholar] [CrossRef]
Figure 1.
Illustration of the (polar) magneto-optical Kerr effect (MOKE). Linearly-polarized light with photon energy of becomes elliptically polarized after reflection from a magnetized material with magnetization (), and the main polarization plane is tilted by a small angle with respect to that of the incident light. The ellipticity of the reflected light is quantified using .

Figure 2.
Schematic diagram of MOKE measurement geometry for p-polarized incident light. The dashed line in the geometry row expresses the incident plane. In the polarization variation row, the changes in the polarization states that are projected in the plane that lies perpendicular to the direction of the travel of the light are shown for both incident (left) and reflected light (right).

Figure 3.
Experimental methods that have been used to trace magnetization dynamics over a time scale ranging from +∞ (corresponding to static measurements) to 10 s (femtosecond scale) are presented with respect to the energies and temporal ranges with which each technique has been used. The methods are limited to photon-in and photon-out schemes. With regard to the Kerr methods, longitudinal (L), polar (P) and transverse (T) represent the longitudinal, polar and transverse geometries, respectively, which are explained in the text. Above the temporal axis, the magnetization dynamics that occur for each timescale are shown. On the right side, the related optical transitions are depicted schematically. The core-state positions are those for the 3d transition metals. Use of femtosecond X-ray pulses, free electron laser (FEL), high harmonic generation (HHG) laser and laser slicing sources, are indicated according to their pulse durations and energy ranges.

Figure 4.
Measurement system for polar MOKE in the visible range using a polarization plane modulation technique. A Faraday cell is used to compensate for the Kerr angle that originated from the sample.
Figure 4.
Measurement system for polar MOKE in the visible range using a polarization plane modulation technique. A Faraday cell is used to compensate for the Kerr angle that originated from the sample.

Figure 5.
Polar Kerr hysteresis loop measured at a wavelength of 700 nm. The sample is a thin-film structure composed of Ta (2 nm)/Gd(FeCo) (20 nm)/Ta (10 nm)/SiO. The measurements were taken at room temperature.
Figure 5.
Polar Kerr hysteresis loop measured at a wavelength of 700 nm. The sample is a thin-film structure composed of Ta (2 nm)/Gd(FeCo) (20 nm)/Ta (10 nm)/SiO. The measurements were taken at room temperature.

Figure 6.
Methods for polarization analysis for wavelengths ranging from visible light to hard X-rays. Typical materials that are used as polarizers are shown for each energy region.
Figure 6.
Methods for polarization analysis for wavelengths ranging from visible light to hard X-rays. Typical materials that are used as polarizers are shown for each energy region.

Figure 7.
Measurement system for polar resonant MOKE that uses a rotating analyzer ellipsometry (RAE) technique. The section enclosed by the dotted rectangular line is rotated together. The RAE unit is shown in the inset photograph.
Figure 7.
Measurement system for polar resonant MOKE that uses a rotating analyzer ellipsometry (RAE) technique. The section enclosed by the dotted rectangular line is rotated together. The RAE unit is shown in the inset photograph.

Figure 8.
Intensity variation with rotation angle . Red (blue) circles show the results for + (−). The orange and purple curves show fitted cosine functions. The sample is a thin-film structure of Ta (2 nm)/Gd(FeCo) (20 nm)/Ta (10 nm)/SiO. Measurements were taken at room temperature. The photon energy was tuned to 53 eV, which corresponds to the M edge of iron.

Figure 9.
(a) Absorption spectrum and (b) variation with photon energy measured using a polar geometry. The sample is a thin-film structure of Ta (2 nm)/Gd(FeCo) (20 nm)/Ta (10 nm)/SiO. The measurements were taken at room temperature.
Figure 9.
(a) Absorption spectrum and (b) variation with photon energy measured using a polar geometry. The sample is a thin-film structure of Ta (2 nm)/Gd(FeCo) (20 nm)/Ta (10 nm)/SiO. The measurements were taken at room temperature.

Figure 10.
Schematic diagram of seeded FEL at Free Electron laser Radiation for Multidisciplinary Investigations (FERMI)@Elettra. Femtosecond pulses are used as seeds for the FEL and as a pump source for the TR-RMOKE measurements. The measurement chamber was directly connected on the downstream side of the chamber for the Diffraction and Projection Imaging (DiProI) station. (Inset) Details of the TR-RMOKE measurements. An Al filter was inserted to prevent the pump pulses from entering the unit composed of the analyzer (Mo/Si multilayer) and the detector (MCP).

Figure 11.
Intensity variation with rotation angle at delay times of (a) fs, (b) 100 fs, (c) 200 fs and (d) 600 fs under application of the external magnetic fields +H (red circles) and −H (blue circles). These characteristics were obtained using a photon energy of 53 eV. The sample is a thin-film structure composed of Ta (2 nm)/Gd(FeCo) (20 nm)/Ta (10 nm)/SiO. Solid lines show cosine fitting using Equation (11) for the data points that were obtained under application of +H (orange) and −H (purple). Inside the graphs, schematic diagrams of the time evolution of the Fe magnetic moment that were deduced from the time-dependent Kerr rotation angle are shown. At the delay time of fs, pointed in the same direction as the magnetic moment of the Fe sublattice.

Figure 12.
Time evolution of normalized Kerr rotation angle obtained from TR-RMOKE measurements. The sample used was a thin film structure composed of Ta (2 nm)/Gd(FeCo) (20 nm)/Ta (10 nm)/SiO. The vertical axis represents the Kerr rotation angles divided by the average of the Kerr angles for negative delay times of fs and fs.

© 2017 by the authors. Licensee MDPI, Basel, Switzerland. This article is an open access article distributed under the terms and conditions of the Creative Commons Attribution (CC BY) license (http://creativecommons.org/licenses/by/4.0/).
Share and Cite
MDPI and ACS Style
Yamamoto, S.; Matsuda, I. Measurement of the Resonant Magneto-Optical Kerr Effect Using a Free Electron Laser. Appl. Sci. 2017, 7, 662. https://doi.org/10.3390/app7070662
AMA Style
Yamamoto S, Matsuda I. Measurement of the Resonant Magneto-Optical Kerr Effect Using a Free Electron Laser. Applied Sciences. 2017; 7(7):662. https://doi.org/10.3390/app7070662
Chicago/Turabian StyleYamamoto, Shingo, and Iwao Matsuda. 2017. "Measurement of the Resonant Magneto-Optical Kerr Effect Using a Free Electron Laser" Applied Sciences 7, no. 7: 662. https://doi.org/10.3390/app7070662
Note that from the first issue of 2016, this journal uses article numbers instead of page numbers. See further details here.