
Analysis on the Accuracy of Intraoral Scanners: The Effects of Mandibular Anterior Interdental Space


1
Graduate School of Clinical Dentistry, Ewha Womans Universiy, Seoul 07985, Korea
2
Harvard School of Dental Medicine, Harvard University, Boston, MA 02115, USA
3
Department of Orthodontics, Ewha Womans University, Seoul 07985, Korea
4
Department of Prosthodontics and Dental Research Institute, Seoul National University Gwanak Dental Hospital, Seoul 08826, Korea
5
Department of Orthodontics, School of Medicine, Ewha Womans University Mokdong Hospital, 1071 Anyangcheon-ro, Yang Cheon-Gu, Seoul 07985, Korea
*
Author to whom correspondence should be addressed.
Appl. Sci. 2017, 7(7), 719; https://doi.org/10.3390/app7070719
Submission received: 20 June 2017
/
Revised: 7 July 2017
/
Accepted: 10 July 2017
/
Published: 13 July 2017
(This article belongs to the Special Issue Laser Scanning)
Abstract
:In this study, we evaluated the effects of mandibular anterior interdental space on the accuracy of intraoral scanners. Four models of mandibular arch with varying distances of anterior interdental space were analyzed; incisors were evenly spaced out between the two canines by 0 mm, 1 mm, 3 mm, and 5 mm. The full arch of each model was scanned 10 times with iTero® and Trios®. The images were superimposed with those from the reference scanner (Sensable S3) and compared using Geomagic Verify. Statistical analysis was conducted using a t-test, paired t-test, and one-way analysis of variance (ANOVA). Differences in the accuracy of images were statistically significant according to both iTero® and Trios®; a greater deviation was noted with increasing anterior interdental space (p < 0.05). Upon dividing the lower arch into five sections, larger deviation was observed with iTero® in the molar area, except in the model with 1 mm space. With Trios®, the largest deviation was observed in the right molar area in all models. The maximum deviations of intermolar width were 0.66 mm and 0.76 mm in iTero® and Trios®, respectively. This comparison suggests that Trios® demonstrates a higher accuracy than iTero® in all models and in all sections of the arch. However, the mean deviations indicate that both iTero® and Trios® are clinically acceptable.
1. Introduction
Since the introduction of CAD/CAM in 1980s, digitized databases have been used in various ways in different fields of dentistry because of their advantages in storing, sharing, and modifying available information [1,2,3,4,5]. In addition to active research on restorative dentistry and implantology, Nakamura et al. [6] developed a computer-assisted marginal and internal fit of restoration [2,7], Cha et al. [3] analyzed the amount of tooth movement after extraction, Hajeer et al. [4] fabricated orthodontic appliances, and Leifert et al. [8] introduced methods to utilize orthodontic diagnosis and treatment planning based on space analysis using digital dental models.
Although most of the images were previously obtained from plaster models that were scanned extraorally [1,3,4,9], multiple comparison studies have proved that digitized models demonstrate equal accuracy [8,10,11,12]. Some studies that evaluated the accuracy of several direct intraoral scanning devices [4,13,14,15,16,17] are also available. The notion of accuracy consists of trueness and precision (ISO 5725-1) [18]. Trueness represents the degree of sameness between the scanned image and the actual model without three-dimensional distortions. Precision is interchangeable with “reproducibility”, which indicates the level of agreement between the images obtained in an equal environment.
Flugge et al. [19] evaluated the mean deviation of iTero® at 50 μm, to study the reproducibility of intraoral scanners. According to Jung [20], direct measurements from the digital calipers on the experiment models can be compared with values obtained from scanned images. However, there is a potential limitation due to the likelihood of error derived from repeated measurements; thus, a reference scanner is required to prove the accuracy of experimental intraoral scanners. Experimental research was conducted with extraoral reference scanner D250 (3Shape A/S, Copenhagen, Denmark) and D101 (Imetric 3D GmbH, Courgenay, Switzerland) in Persson et al. [7] and Patzelt et al. [17], respectively. Likewise, the industrial scanner, Sensable S3 (Solutionix Inc., Seoul, Korea), was selected as a reference scanner after its reliability was confirmed. This reference scanner uses the triangulation method to construct an image from acquired image information from multiple cameras based on reflections, as the subject is oriented to new positions at a consistent angle. Intraoral scanners such as iTero® and Trios® presented the potential for improved accuracy compared to other devices that use the confocal method, which limits their information to the use of in-focus reflected light.
The purpose of this study was to evaluate the applicability of intraoral scanners in orthodontics by assessing the accuracy of scanning the full mandibular arch based on image comparison analysis report of sectioned versus full arch in Mehl et al. [21]. Our study also aimed to expand on previous knowledge at comparably lower accuracy found at the distal surface of the molar and the incisal edge of the incisor, by evaluating a well-aligned dental arch [17,19,22].
In this experiment, mandibular arch models with misaligned dentition requiring orthodontic treatment were used. Four interdentally spaced lower incisors had been misinterpreted as two, three, or even five teeth. Thus, deviations from measurements were calculated: (1) to assess the effects of anterior interdental space on the accuracy of intraoral scanners; (2) to measure changes in the accuracy of three-dimensional images based on different anterior interdental spaces and the type of scanner by comparing the scanned images with the reference image; and (3) to evaluate the effects on intermolar width, which is a particularly significant clinical data. We hypothesized that there would be differences between the images from the reference scanner and those from the experimental intraoral scanners, and that the degree of deviations would be larger when there was a greater amount of space present among mandibular anterior teeth.
2. Materials and Methods
2.1. Experimental Models
Four models of mandibular arches were designed using mandibular acrylic resin teeth (Protex, Shanghai Rabbit Dental Material Industrial Co. Ltd., Shanghai, China) and acrylic resin base (Ortho-Jet Liquid & Acrylic powder, Lang Dental Man. Co. Inc., Wheeling, IL, USA). To use as a base, a resin ball of 1.5 mm in diameter was placed at 13 mm gingival to the occlusal plane formed by the mesiobuccal cusps of the first molars and the cusp tips of the canines. The models were classified as Ideal, Mild, Moderate, or Severe, depending on the distance between the canine and the lateral incisor, the lateral incisor and the central incisor, and the two central incisors. The amount of anterior interdental space was 0 mm, 1 mm, 3 mm, and 5 mm in the order of Ideal, Mild, Moderate, and Severe (Figure 1). Anterior interdental spaces were created solely using horizontal buccolingual displacement without any vertical or torque movements to eliminate potential error due to differences in the vertical heights and buccolingual angulation.
2.2. Protocols for Scanning
The four experimental models were sprayed with a minimum amount of powder, immobilized, and automatically scanned with the reference scanner, Sensable S3 (Solutionix Inc., Seoul, Korea). In order to validate the reliability of the reference scanner, the Ideal model was digitized five times with the reference scanner. These images served as the standard data once the reliability of the reference scanner had been confirmed. Then, the four experimental models were each scanned 10 times with both iTero®1 iTero® Orthodontic ver. 5.2.1.290 (Align Technology Inc., Santa Clara, CA, USA) and Trios®2 3Shape Trios® ver. 1.3.2.1 (3shape Dental Systems, Copenhagen, Denmark) in the same manner. Geomagic Verify superimposed scanned images from the experimental scanners with those from the reference scanner to obtain 10 superimposable pairs of data. Simple linear regression analysis was performed, and deviation was calculated. Based on the Shapiro-wilk test applied to the repeated scanned data, a p value of 0.276 confirmed that the data was normally distributed. In addition, the Wald-Wolfowitz test showed a p value of 0.314, proving that the data was mutually independent. These values indicate that the same results are expected with any additional data.
Using iTero®, the full mandibular arch was scanned in Invisalign mode. The left side of the arch was scanned first, following the instruction manual, starting with the occlusal surface of the most distal molar. The same sequence of scanning was repeated from the right to the left side of the arch to construct a complete image. The following images from both sides of the arch were combined in the anterior region to generate an image of a single full arch; the areas of deficiency were scanned again to construct a complete image (Figure 2A).
Using Trios®, the left side of the arch was scanned first, following the manufacturer’s guidelines. A calibration was performed prior to the experiment, with the calibration function incorporated in the scanner. This time, the incisor region was scanned slowly in a zigzag pattern. The second phase started from the last-scanned location on the right side, scanning toward the lingual surface to scan up to the most distal molar on the left side. In this process, the wand was turned 45–90 degrees. In the third phase, the wand was rolled up towards the buccal surface to scan the buccal side of the arch, from left to right. The areas of deficiency were scanned again to complete the whole image (Figure 2B). The four models (Ideal, Mild, Moderate, and Severe) were scanned 10 times, each with iTero® and Trios®; two sets of 40 images were produced by scanning the models with iTero® and Trios®, separately. In this process, five severely distorted images were produced; they have been excluded from the data in order to avoid potential discrepancies (Figure 3).
A total of 80 scanned images were then superimposed with the reference image. All data were configured into Standard Tessellation Language (STL) files to standardize the collected data, and Geomagic Verify superimposed the images using the best-fit algorithm. This method aligned the reference data with the scanned experimental data by using the overlapped regions until the overall mean deviation between the surfaces was the smallest. The reference plane was formed by connecting the resin-balls located at the apices of the bilateral canines and first molar in each type of model. Bases of the superimposed model were trimmed using the reference plane (Figure 4). Deviations from superimposing the reference image and the scanned image were quantified as the shortest mean in three dimensions, which was used as a reference point for the accuracy of superimposed data (Figure 4F). One investigator, who was trained for proficiency prior to initiating the experiment, scanned the models for data collection. The same investigator trimmed the edges of the models.
The center point, which is located at the junction of the anterior-posterior axis through the midpoint between the two central incisors along the occlusal plane and the transverse axis through buccal resin-balls of the first molars along the occlusal plane, was used to create a reference division plane. The lower arch was divided into five sections (LM, LP, Ant, RP, and RM), which were formed by the two axes that make up the center point and the two axes that pass through resin-balls of the canines (Figure 5).
2.3. Measurements and Calculations
To compare deviations in three-dimensions in a full arch versus a sectioned arch, a mesh deviation of the full arch was calculated, followed by the average absolute value of deviations, maximum deviation, and standard deviation. For the sectioned arch, the superimposed data was divided into five sections (LM, LP, Ant, RP, RM). Then, the average absolute value of deviations, maximum deviation, and standard deviation were calculated.
Two lines were drawn to calculate intermolar widths. The first dividing line passed through the resin-ball points of the bilateral first molars to form a model that included the mesial surface of the left first molar to that of the right first molar. The second dividing line passed through the highest contour points of bilateral first molars parallel to the occlusal plane. Then, the resultant two edge points were measured (Figure 6). The intermolar width of the reference image and that of the scanned image were measured three times, and the average values were calculated.
The same measurements were made a week after the first trial to evaluate the reliability of intermolar width measurements. The first measurements were named Group 1 and the second measurements, Group 2. A t-test revealed the difference between the two groups to be statistically insignificant (iTero® p = 0.97, Trios® p = 0.95). The first set of measurements, Group 1, was used to record the deviation.
2.4. Statistical Analysis
The SPSS Ver. 19.0 statistic package program was used to perform a t-test, a paired t-test, and a one-way ANOVA. A statistical significance of p < 0.05 was set. The statistical calculation was divided into five types based on the standard. A one-way ANOVA was performed on the sectioned arch to evaluate the accuracy of iTero® and Trios®. A Duncan post-hoc test was used as a follow-up for ANOVA.
In order to evaluate the accuracy of iTero® and Trios®, a paired t-test was performed on the differences in deviations among four models (Ideal, Mild, Moderate, Severe), sectioned arches (LM, LP, Ant, RP, RPM, Total), and intermolar widths.
3. Results
3.1. Comparison of Accuracy with the Increase in Anterior Interdental Space
A one-way ANOVA was performed on deviations of the scanned images of the four models (Ideal, Mild, Moderate, and Severe) from iTero®; the results are shown in Table 1. Statistically significant differences were observed. A higher deviation was observed in all sections of the arch and in the full arch, with respect to the increase in mandibular anterior interdental space. The highest deviation of the full arch was 519 μm in the Ideal model, 651 μm in the Mild model, 963 μm in the Moderate model, and 841 μm in the Severe model.
A one-way ANOVA was also performed on deviations observed in the sectioned arches (LM, LP, Ant, RP, RM, Total) from iTero®. The results showed statistically significant differences in all models. The deviation increased in all models in the order of incisors, premolars, and molars. The superimposed images from iTero® with each model type are depicted in colors, as shown in Figure 7.
In order to compare intermolar widths, the difference between the mean intermolar width of the reference scanner and that of the 10 scanned images from iTero® was calculated in each type of models (Table 2). The highest deviation from iTero® was 0.66 mm. A t-test was performed on the first and second sets of measurements to validate the reliability of intermolar width measurements. The intermolar width differences were statistically insignificant (p > 0.05).
A one-way ANOVA was also performed on the deviations of scanned images from Trios®; the results are shown in Table 3. In sectioned arches, differences in deviations were statistically significant in Ant, RP, and Total, depending on the type of model. However, the data were statistically insignificant in other sections of the arch. The highest deviation of the full arch was 249 μm in the Ideal model, 324 μm in the Mild model, 362 μm in the Moderate model, and 589 μm in the Severe model.
Likewise with Trios®, a one-way ANOVA was performed on the deviations of scanned individual sections of the arch (LM, LP, Ant, RP, RM, Total). The results showed a greater deviation in the molar area compared to incisors, and premolars in all models. Additionally, deviations in the premolar and molar areas were greater on the right side than on the left side. These calculations were statistically significant in the Ideal, Moderate, and Severe models, but statistically insignificant in the Mild model.
The LM and RM sections showed larger deviations, with the largest deviation in RM. The highest deviation occurred in the right molar region upon scanning the full arch from the left side; greater deviation was observed in the most distal region of the scanned area opposite to the starting point of the scanner. The superimposed models from Trios® are portrayed in color, as shown in Figure 8.
For the comparison of intermolar widths, three measurements of intermolar width were taken from the reference image and the scanned images; then, the average intermolar widths were calculated. The minimum and the maximum differences between the mean of the reference scanner and that of Trios® were calculated (Table 4). The highest deviation in the intermolar width from Trios® was 0.76 mm. A t-test was performed on the first and second sets of measurements to validate the precision of intermolar width measurements. The differences in the intermolar widths were statistically insignificant, with a p-value of 0.95.
3.2. Comparing the Accuracy of iTero® Versus Trios®
A t-test was performed to evaluate the accuracy of interdental space measurements observed in the four models, depending on the types of scanner used (iTero® or Trios®); the results are shown in Table 5 and Figure 9. Differences observed in all models with both iTero® and Trios® were statistically significant. However, deviations from Trios® were smaller than those from iTero® in all models. The significance of deviation in scanned images with the existing interdental spaces was less than that of the Ideal model; this observation was most prominent in the Severe model.
A t-test was performed again to evaluate the accuracy of measurements observed in sectioned arches (LM, LP, Ant, RP, RM, Total) from iTero® and Trios®. The results are shown in Table 6 and Figure 10. Differences observed in each section of the arch were statistically significant, depending on the type of scanner (p < 0.001). Deviations from Trios® in each section were smaller than those from iTero®. Upon comparing deviations between the reference image and the scanned images, the differences were greater in LM and RM sections.
The difference in intermolar widths between iTero® and Trios® is shown in Table 7. The data was statistically significant in the Ideal, Moderate, and Severe models, but statistically insignificant in the Mild model. iTero® showed a higher deviation in the Ideal and Severe models, whereas Trios® showed a higher deviation in Moderate model.
4. Discussion
Evaluating the accuracy of intraoral scanners has become an important topic of research in clinical orthodontics, since digital models can be applied to many areas of orthodontic diagnosis and treatment. While the accuracy of intraoral scanners has been studied in many literatures with respect to ideal occlusion and teeth alignment, such optimal situations are not always the case in orthodontic patients. Therefore, in this study, we aimed to assess the accuracy of scanning the full mandibular arch when there were various distances of interdental spaces present in the mandibular incisor region.
Our results indicated that the increase in the interdental space among the lower incisors led to a significant deviation in the molar region. The deviation was produced because the size of the scanner’s sensor was confined to certain dimensions. Therefore, a complete three-dimensional image of the entire arch was obtained by an image assembly process, called stitching. This method involves attaching the overlapped areas created by two adjacent images, but is prone to deliver inaccurate information when similar overlapping patterns repeat in the stitching area [21]. Because there were overlapped areas with similar repeated patterns in the mandibular incisor region of the scanned images, the errors created in the stitching process led to deviations in the molar region. With iTero®, an undesired overlapped area from one canine to the contralateral canine was produced when the left and right sides of the arch were scanned separately and then combined in the anterior region. This slight error created when superimposing the left and right sides appeared more exaggerated in the molar region. However, Trios® also produced deformations when the models were scanned from the most distal molar to the contralateral molar, despite scanning the anterior incisor region slowly in a zigzag pattern, from lingual to buccal. For Trios®, the accumulated errors were most evident on the contralateral side. Even though the interdental space was increased without altering other factors (such as intermolar width, incisor angulation, and torque), elongation of the incisor region due to the increase in interdental space caused lengthening of the arch, which, in turn, caused deformation in the molar area. Figure 7 shows deviations in the superimposed images of the models when the images were scanned using iTero®.
Distortion in the incisor region was the main cause of deformation in the molar region because the four incisors could be seen as a single tooth. This explains the delay in combining the images of the left and right sides of the arch in Ideal and Mild models, compared to those in Moderate and Severe models. Trios® makes a continuous scan of the entire arch where occlusal, buccal, and lingual surfaces of each tooth are combined through time; thus, distortion in one area affects the subsequently scanned area. Distortion frequently occurred between the two canines upon scanning the lingual surface, but the most deformation was found among the incisors and in the right molar region (the most distant area from the scanner’s starting point). Larger anterior interdental spaces resulted in more distortions in the scanned images; severe distortions were made more frequently in Moderate and Severe models. Figure 8 shows deviations in the superimposed images of the models when the images were scanned using Trios®. In addition, severely distorted images, as shown in Figure 3, may explain some of the deviations observed in the intraoral scanners.
In addition, greater deviations were found in the left and right molar areas with both iTero® and Trios® when the arch was divided into molar, premolar, and incisor regions. Such findings paralleled the results from Ahn et al. [23], which showed statistically greater deviation in the molar region. The data obtained in our study was contributory to the distortion of the scanned images from increased anterior interdental space, which caused arch elongation and subsequent distortion in the molar area, as mentioned earlier. Therefore, such results suggested that the effects of the anterior interdental space and subsequent arch elongation led to a greater deviation in the molar region, more so than in the anterior area.
Furthermore, when the reference image and the scanned images from iTero® and Trios® were superimposed in all four types of models, deviations among the images of the full arch was statistically significant with the increase in the interdental space. With iTero®, the maximum deviation was found in the right molar region of the Moderate model (0.96 mm), and with Trios®, the maximum deviation was found in the right molar region of the Severe model (0.59 mm). When using iTero®, deviation increased in the order of incisor, premolar, and molar areas. When using Trios®, greater deviation was observed in the molar region, with the left side showing a greater deviation than the right side. These findings correlated to those obtained by Mehl et al. [21], which also showed that scanning the sectioned arch showed a greater accuracy than scanning the full arch.
The purpose of finding statistical differences was to observe whether there were differences when the images from the reference scanner were compared with those from the intraoral scanners. These values became clinically significant when there was a large amount of deviation between the images being compared. As shown in Figure 7 and Figure 8, deviations in the posterior region may lead to differences in the width of the arch, which, in turn, may cause errors in fabricating clear aligners and other removable appliances. The deviations found among individual teeth may also produce defects in making transfer zig for indirect bonding.
It is important to note that determining whether the value of deviation is small or large is subjective. The amount of deviation that affects the clinical outcome depends on the purpose of taking digital impressions; the objective is similar to that of taking conventional impressions. For example, if the goal of taking digital impressions was to reach the level of accuracy of taking alginate impressions (i.e., for orthodontic diagnosis or fabrication of removable orthodontic appliances), there would be clinical errors in reproducibility if the range of error was greater than 0.2 mm. For reference, the range of error in the alginate impression technique is reported to be up to 0.18 mm [24]. If the aim was to achieve the level of accuracy of taking rubber impressions (i.e., for restorations or making zig for precise indirect bonding), there would be clinical errors in reproducibility if the range of error was greater than 0.05 mm.
Upon comparing the accuracy of the two scanners, however, Trios® showed a greater accuracy than iTero® in all sections, with more prominent differences between the left and right molar regions. The highest deviation in the intermolar width of the Moderate model was greater by 0.66 mm with iTero® and was smaller by 0.76 mm with Trios®. Differences in the intermolar width deviations, as shown in Figure 11, were due to uniformly distinct superimposed data seen with iTero® toward the molars in the scanned image compared to the reference image. In Trios®, there was an unequal mixture of expanded and constricted portions in the scanned images, which explained the corresponding expansion and constriction of intermolar width.
Intermolar width provides important information in data-based treatment planning and construction of orthodontic appliances. Our results indicated that due to a large deviation in intermolar width (the highest deviation value was 0.7 mm), iTero® may not be suitable for making orthodontic appliances for the mandibular teeth with large anterior interdental spaces. Such an undesired phenomenon with iTero® parallels the findings in Sebastian et al. [17], where horizontal expansion of molar region was observed during the process of image integration through the software within the scanner. These observations, however, contradict the statements from Flugge et al. [19] in that digital models made with iTero® can be used for treatment planning and making orthodontic appliances, and from Kusnoto et al. [25], which supports the use of three-dimensional laser scanning for treatment changes, growth, surgical stimulation, and fabrication of orthodontic appliances. Yet, it is important to note that interdental spaces in the anterior region and the subsequent intermolar width deviations in this study suggest potential limitations of the clinical use of iTero® in orthodontic settings.
Overall, this study showed that the accuracy of scanned images was correlated to the increase in anterior interdental spaces of the lower arch, affecting the extent of the clinical use of intraoral scanners in orthodontics. More errors were found in the incisor area due to uniformity in the shape of incisors, and more distinct results were found in the Severe model, which represented the lower arch with atypical tooth arrangement. The accuracy of the experimental intraoral scanners may be reduced if there are similar patterns of spacing repeated among the mandibular incisors. These factors should be acknowledged when using the scanners.
In addition, because the scanners were applied to dry, powdered models, different measurements were expected when the scanners were used directly with patients. For the purpose of this study, patient-related factors (such as patient movement, limited intraoral space, oral humidity, and saliva flow) were disregarded [19]. Therefore, the drawbacks of this study included: (1) patient-related factors when the scanners are directly applied to patients; (2) using only four types of models to represent various orthodontic cases; and (3) slight differences in the overall arch length in each model because the study concentrated on the interdental space while keeping the size of the teeth uniform throughout all models.
The focus of this experiment was to study the general effects of interdental spaces on the accuracy of intraoral scanners. Future studies will involve how interdental spaces produced by altering the size and the number of teeth in a dental arch can influence the accuracy of intraoral scanners. Furthermore, the study on the precision of scanners in combining the images of the anterior area can also be investigated.
5. Conclusions
Both iTero® and Trios® are acceptable to be used in clinical orthodontics, but Trios® showed a greater accuracy when there were larger anterior interdental spaces present in the mandibular arch. Furthermore, there was a clinical significance of the lower anterior interdental space upon scanning the mandibular arch with intraoral scanners, because of its considerable effects on the molar region, as shown in the intermolar width measurements.
When using iTero®, the scanning region of the quadrant should be widened if the similar pattern of spacing is to be repeated in the anterior region. This way, the image of the right side will be captured when scanning the left side, and vice versa. In contrast, when scanning the anterior region with Trios®, the entire buccal and lingual sides must be scanned in its entirety in the first scan so that the largest area possible can be scanned. For reference, the manufacturer also recommends a zigzag scan when scanning the anterior region.
In order to increase the use of intraoral scanners in orthodontics, further research is required in order to improve the accuracy of scanning techniques, the method of clinical applications with different selections of scanner, and the accuracy of intraoral scanners independent of lengthening of the scanned area or the changes in the lower anterior region.
Acknowledgments
This study was supported by intramural research promotion grants from the Ewha Womans University School of Medicine in Seoul, South Korea, and the National Research Foundation of Korea (NRF) grants funded by the Korean government(MSIP; Ministry of Science, ICT&Future Planning) (No. 2017R1C1B5018349).
Author Contributions
Ji-hye Chun performed the experiment, analyzed the data, and developed the manuscript; Ji Hyun Tahk developed the manuscript; Youn-Sic Chun designed the experiment and analyzed the data; Ji-Man Park designed the experiment and analyzed the data; Minji Kim designed the experiment, analyzed the data, and provided direct supervision.
Conflicts of Interest
The authors declare no conflict of interest.
References
- Al Mortadi, N.; Eggbeer, D.; Lewis, J.; Williams, R.J. CAD/CAM/AM applications in the manufacture of dental appliances. Am. J. Orthod. Dentofac. Orthop. 2012, 142, 727–733. [Google Scholar] [CrossRef] [PubMed]
- Beuer, F.; Schweiger, J.; Edelhoff, D. Digital dentistry: An overview of recent developments for CAD/CAM generated restorations. Br. Dent. J. 2008, 204, 505–511. [Google Scholar] [CrossRef] [PubMed]
- Cha, B.K.; Lee, J.Y.; Jost-Brinkmann, P.G.; Yoshida, N. Analysis of tooth movement in extraction cases using three-dimensional reverse engineering technology. Eur. J. Orthod. 2007, 29, 325–331. [Google Scholar] [CrossRef] [PubMed]
- Hajeer, M.Y.; Millett, D.T.; Ayoub, A.F.; Siebert, J.P. Applications of 3D imaging in orthodontics: Part II. J. Orthod. 2004, 31, 154–162. [Google Scholar] [CrossRef] [PubMed]
- Patel, N. Integrating three-dimensional digital technologies for comprehensive implant dentistry. J. Am. Dent. Assoc. 2010, 141, 20s–24s. [Google Scholar] [CrossRef] [PubMed]
- Nakamura, T.; Dei, N.; Kojima, T.; Wakabayashi, K. Marginal and internal fit of Cerec 3 CAD/CAM all-ceramic crowns. Int. J. Prosthodont. 2003, 16, 244–248. [Google Scholar] [PubMed]
- Persson, A.S.; Oden, A.; Andersson, M.; Sandborgh-Englund, G. Digitization of simulated clinical dental impressions: Virtual three-dimensional analysis of exactness. Dent. Mater. 2009, 25, 929–936. [Google Scholar] [CrossRef] [PubMed]
- Leifert, M.F.; Leifert, M.M.; Efstratiadis, S.S.; Cangialosi, T.J. Comparison of space analysis evaluations with digital models and plaster dental casts. Am. J. Orthod. Dentofac. Orthop. 2009, 136, 16. [Google Scholar] [CrossRef]
- Chandran, D.T.; Jagger, D.C.; Jagger, R.G.; Barbour, M.E. Two- and three-dimensional accuracy of dental impression materials: Effects of storage time and moisture contamination. Biomed. Mater. Eng. 2010, 20, 243–249. [Google Scholar] [PubMed]
- Keating, A.P.; Knox, J.; Bibb, R.; Zhurov, A.I. A comparison of plaster, digital and reconstructed study model accuracy. J. Orthod. 2008, 35, 191–201. [Google Scholar] [CrossRef] [PubMed]
- Bootvong, K.; Liu, Z.; McGrath, C.; Hagg, U.; Wong, R.W.; Bendeus, M.; Yeung, S. Virtual model analysis as an alternative approach to plaster model analysis: reliability and validity. Eur. J. Orthod. 2010, 32, 589–595. [Google Scholar] [CrossRef] [PubMed]
- Zilberman, O.; Huggare, J.A.; Parikakis, K.A. Evaluation of the validity of tooth size and arch width measurements using conventional and three-dimensional virtual orthodontic models. Angle Orthod. 2003, 73, 301–306. [Google Scholar] [PubMed]
- Kachalia, P.R.; Geissberger, M.J. Dentistry a la carte: In-office CAD/CAM technology. J. Calif. Dent. Assoc. 2010, 38, 323–330. [Google Scholar] [PubMed]
- Wiranto, M.G.; Engelbrecht, W.P.; Nolthenius, H.E.T.; van der Meer, W.J.; Ren, Y. Validity, reliability, and reproducibility of linear measurements on digital models obtained from intraoral and cone-beam computed tomography scans of alginate impressions. Am. J. Orthod. Dentofac. Orthop. 2013, 143, 140–147. [Google Scholar] [CrossRef] [PubMed]
- Logozzo, S.; Zanetti, E.M.; Franceschini, G.; Kilpelä, A.; Mäkynen, A. Recent advances in dental optics—Part I: 3D intraoral scanners for restorative dentistry. Opt. Lasers Eng. 2014, 54, 203–221. [Google Scholar] [CrossRef]
- Naidu, D.; Freer, T.J. Validity, reliability, and reproducibility of the iOC intraoral scanner: a comparison of tooth widths and Bolton ratios. Am. J. Orthod. Dentofac. Orthop. 2013, 144, 304–310. [Google Scholar] [CrossRef] [PubMed]
- Patzelt, S.B.; Emmanouilidi, A.; Stampf, S.; Strub, J.R.; Att, W. Accuracy of full-arch scans using intraoral scanners. Clin. Oral Investig. 2014, 18, 1687–1694. [Google Scholar] [CrossRef] [PubMed]
- Accuracy (Trueness and Precision) of measurement Methods and Results–General Principles and Definitions; ISO 5725-1; International Organization for Standardization: Geneva, Switzerland, 1994.
- Flugge, T.V.; Schlager, S.; Nelson, K.; Nahles, S.; Metzger, M.C. Precision of intraoral digital dental impressions with iTero and extraoral digitization with the iTero and a model scanner. Am. J. Orthod. Dentofac. Orthop. 2013, 144, 471–478. [Google Scholar] [CrossRef] [PubMed]
- Jung, Y.R.; Park, J.M.; Chun, Y.S.; Lee, K.N.; Kim, M. Accuracy of four different digital intraoral scanners: effects of the presence of orthodontic brackets and wire. Int. J. Comput. Dent. 2016, 19, 203–215. [Google Scholar] [PubMed]
- Mehl, A.; Ender, A.; Mormann, W.; Attin, T. Accuracy testing of a new intraoral 3D camera. Int. J. Comput. Dent. 2009, 12, 11–28. [Google Scholar] [PubMed]
- Ender, A.; Mehl, A. Accuracy of complete-arch dental impressions: A new method of measuring trueness and precision. J. Prosthet. Dent. 2013, 109, 121–128. [Google Scholar] [CrossRef]
- Ahn, J.W.; Park, J.M.; Chun, Y.S.; Kim, M.; Kim, M. A comparison of precision of three dimensional images acquired by 2 digital intraoral scanners: Effects of tooth irregularity and scanning direction. Korean J. Orthod. 2016, 46, 3–12. [Google Scholar]
- Peutzfeldt, A.; Asmussen, E. Effect of disinfecting solutions on accuracy of alginate and elastomeric impressions. Scand. J. Dent. Res. 1989, 97, 470–475. [Google Scholar] [CrossRef] [PubMed]
- Kusnoto, B.; Evans, C.A. Reliability of a 3D surface laser scanner for orthodontic applications. Am. J. Orthod. Dentofac. Orthop. 2002, 122, 342–348. [Google Scholar] [CrossRef]
Figure 1.
The experimental models with different interdental spaces in the anterior dentition. Ideal has no spacing (0 mm); Mild has 1 mm spacing; Moderate has 3 mm spacing; Severe has 5 mm spacing.
Figure 1.
The experimental models with different interdental spaces in the anterior dentition. Ideal has no spacing (0 mm); Mild has 1 mm spacing; Moderate has 3 mm spacing; Severe has 5 mm spacing.
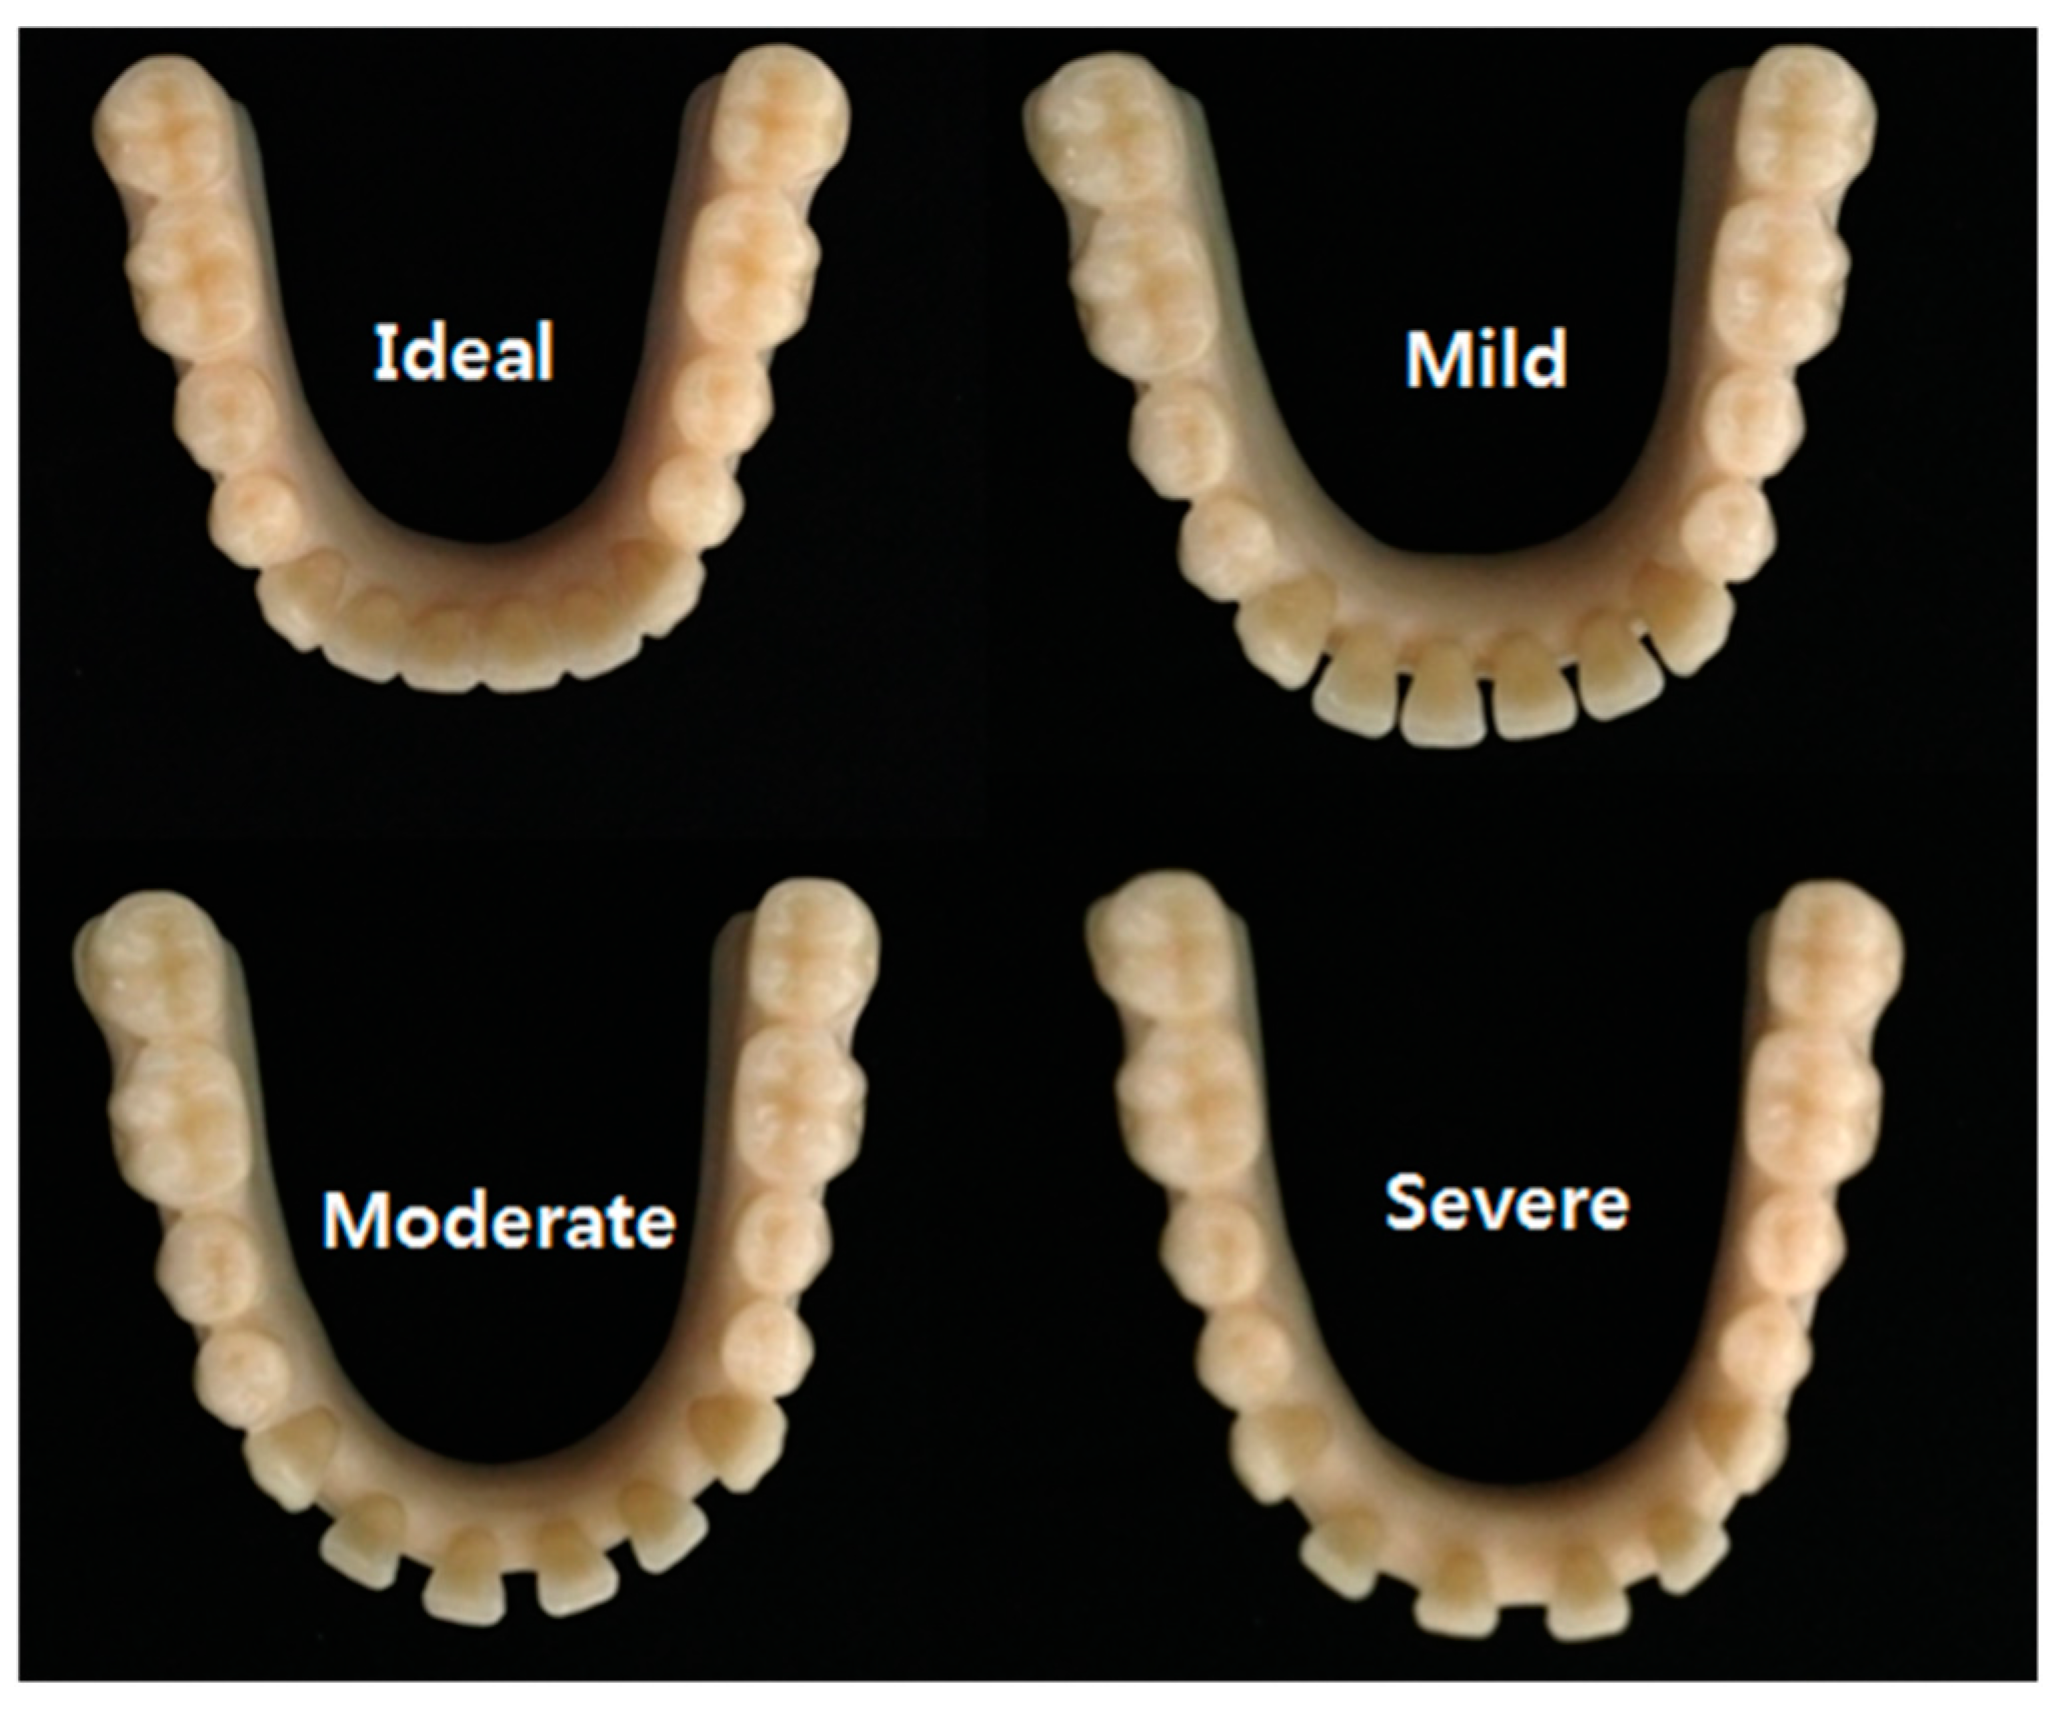
Figure 2.
Scanning sequence. (A) iTero® scanner: ① Scans the occlusal surface of the left-most posterior molar; ② Scans from the left-most posterior molar towards the anterior teeth, scanning the occlusal and buccal surfaces; ③ Scans from the left-most posterior molar towards the anterior teeth, scanning the lingual and occlusal surfaces; ④ Scans the occlusal surface of the right-most posterior molar; ⑤ Scans from the right-most posterior molar towards the anterior teeth, scanning the occlusal and buccal surfaces; ⑥ Scans from the right-most posterior molar towards the anterior teeth, scanning the lingual and occlusal surfaces; (B) Trios® scanner. ① Scans from the left molar region to the right molar region following the occlusal surfaces; ② Scans from the right molar region to the left molar region following the lingual surfaces; ③ Scans from the left molar region to the right molar region following the buccal surfaces.

Figure 3.
Severely distorted images from iTero® and Trios® (A) Data from iTero®: Four anterior teeth were scanned as one anterior tooth. The arch form is distorted; (B) Data from Trios®: lingual area showing severe distortions from the left canine to the right molar. The arch form is significantly constricted.
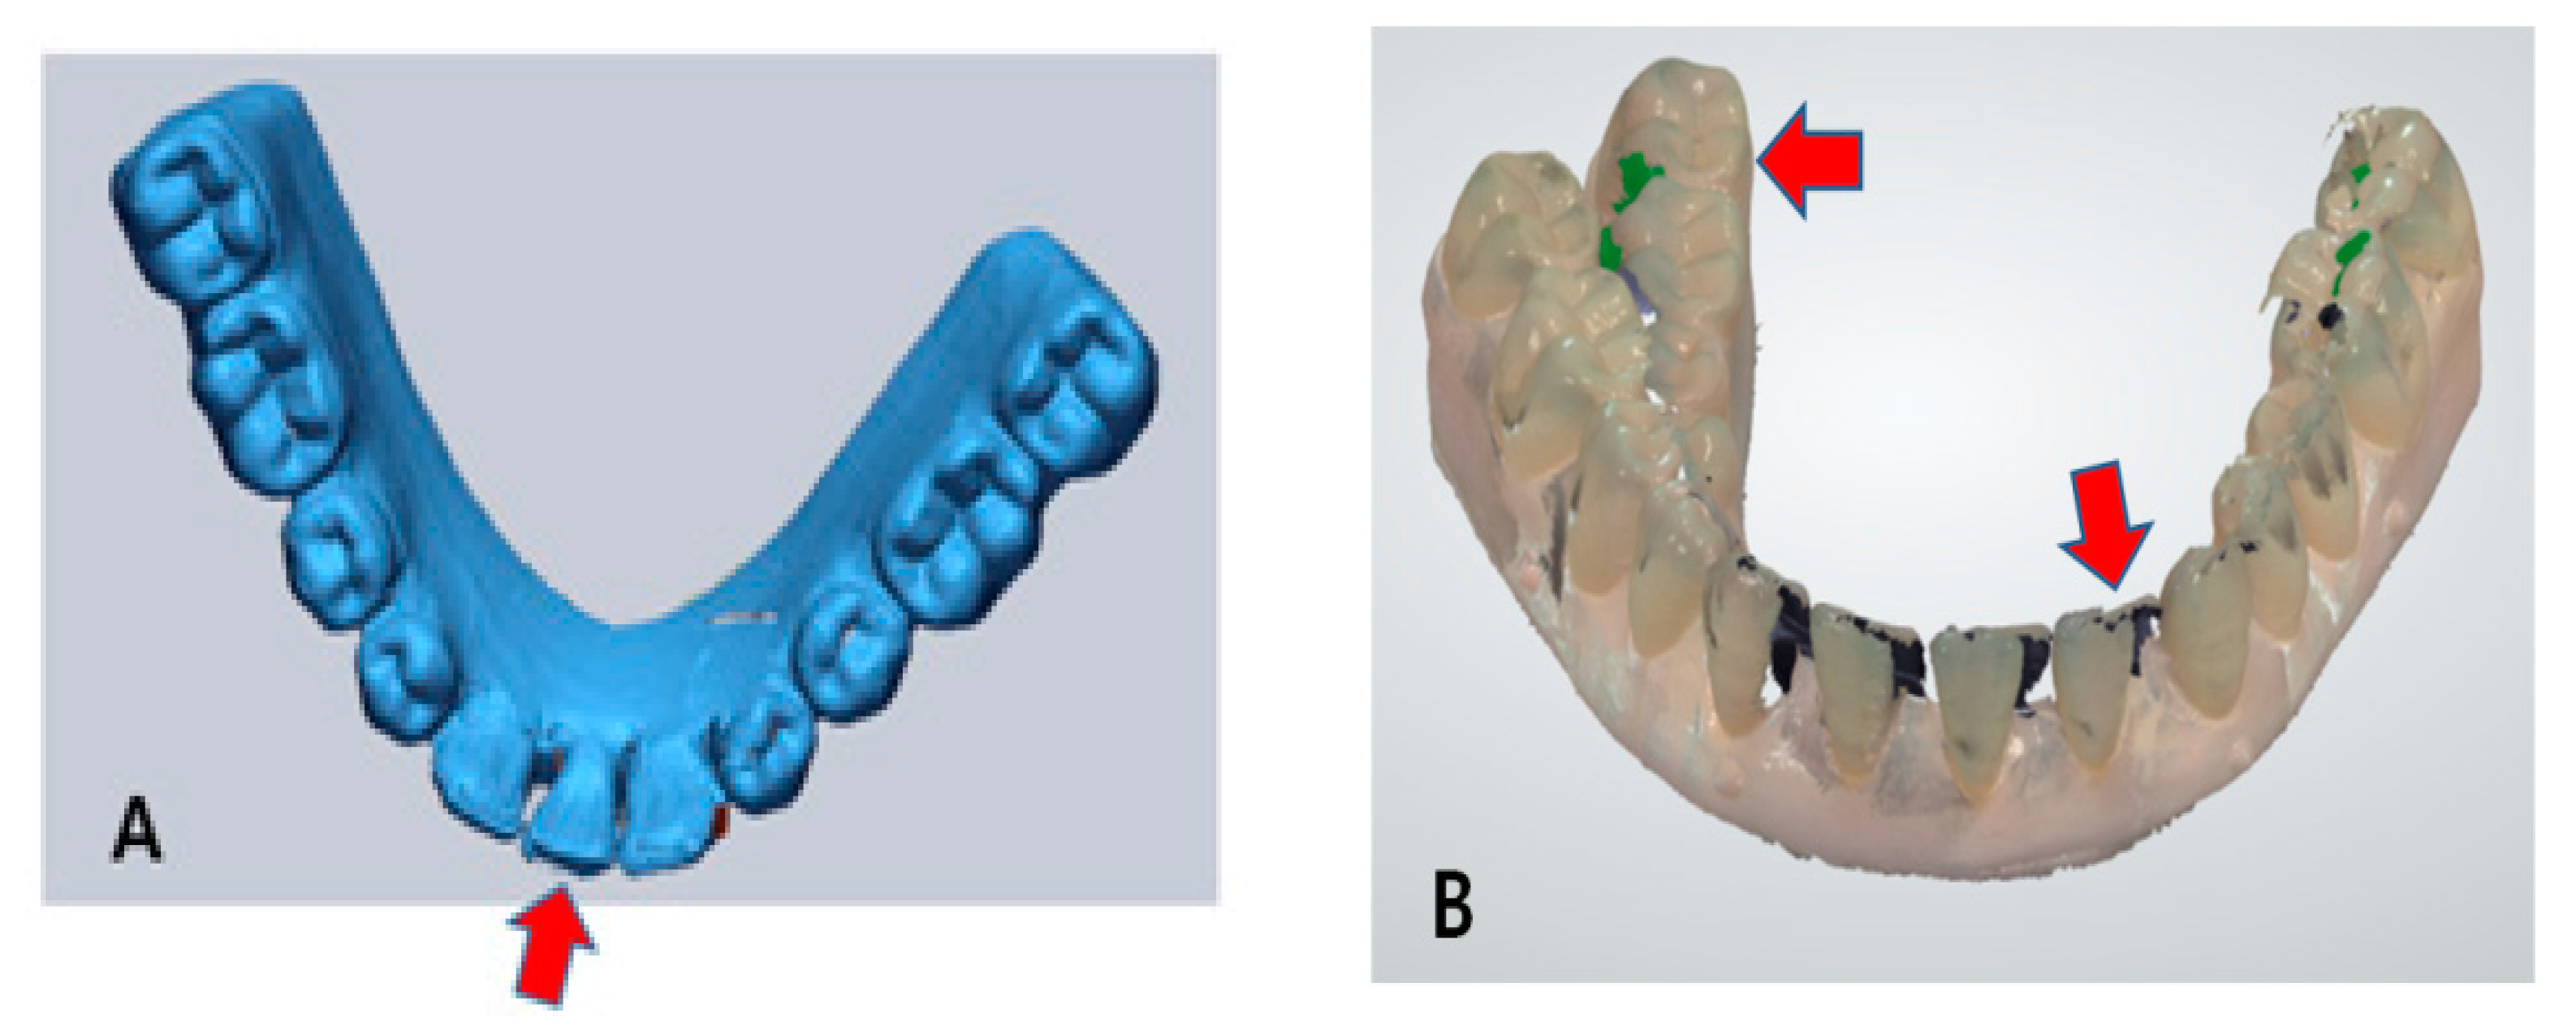
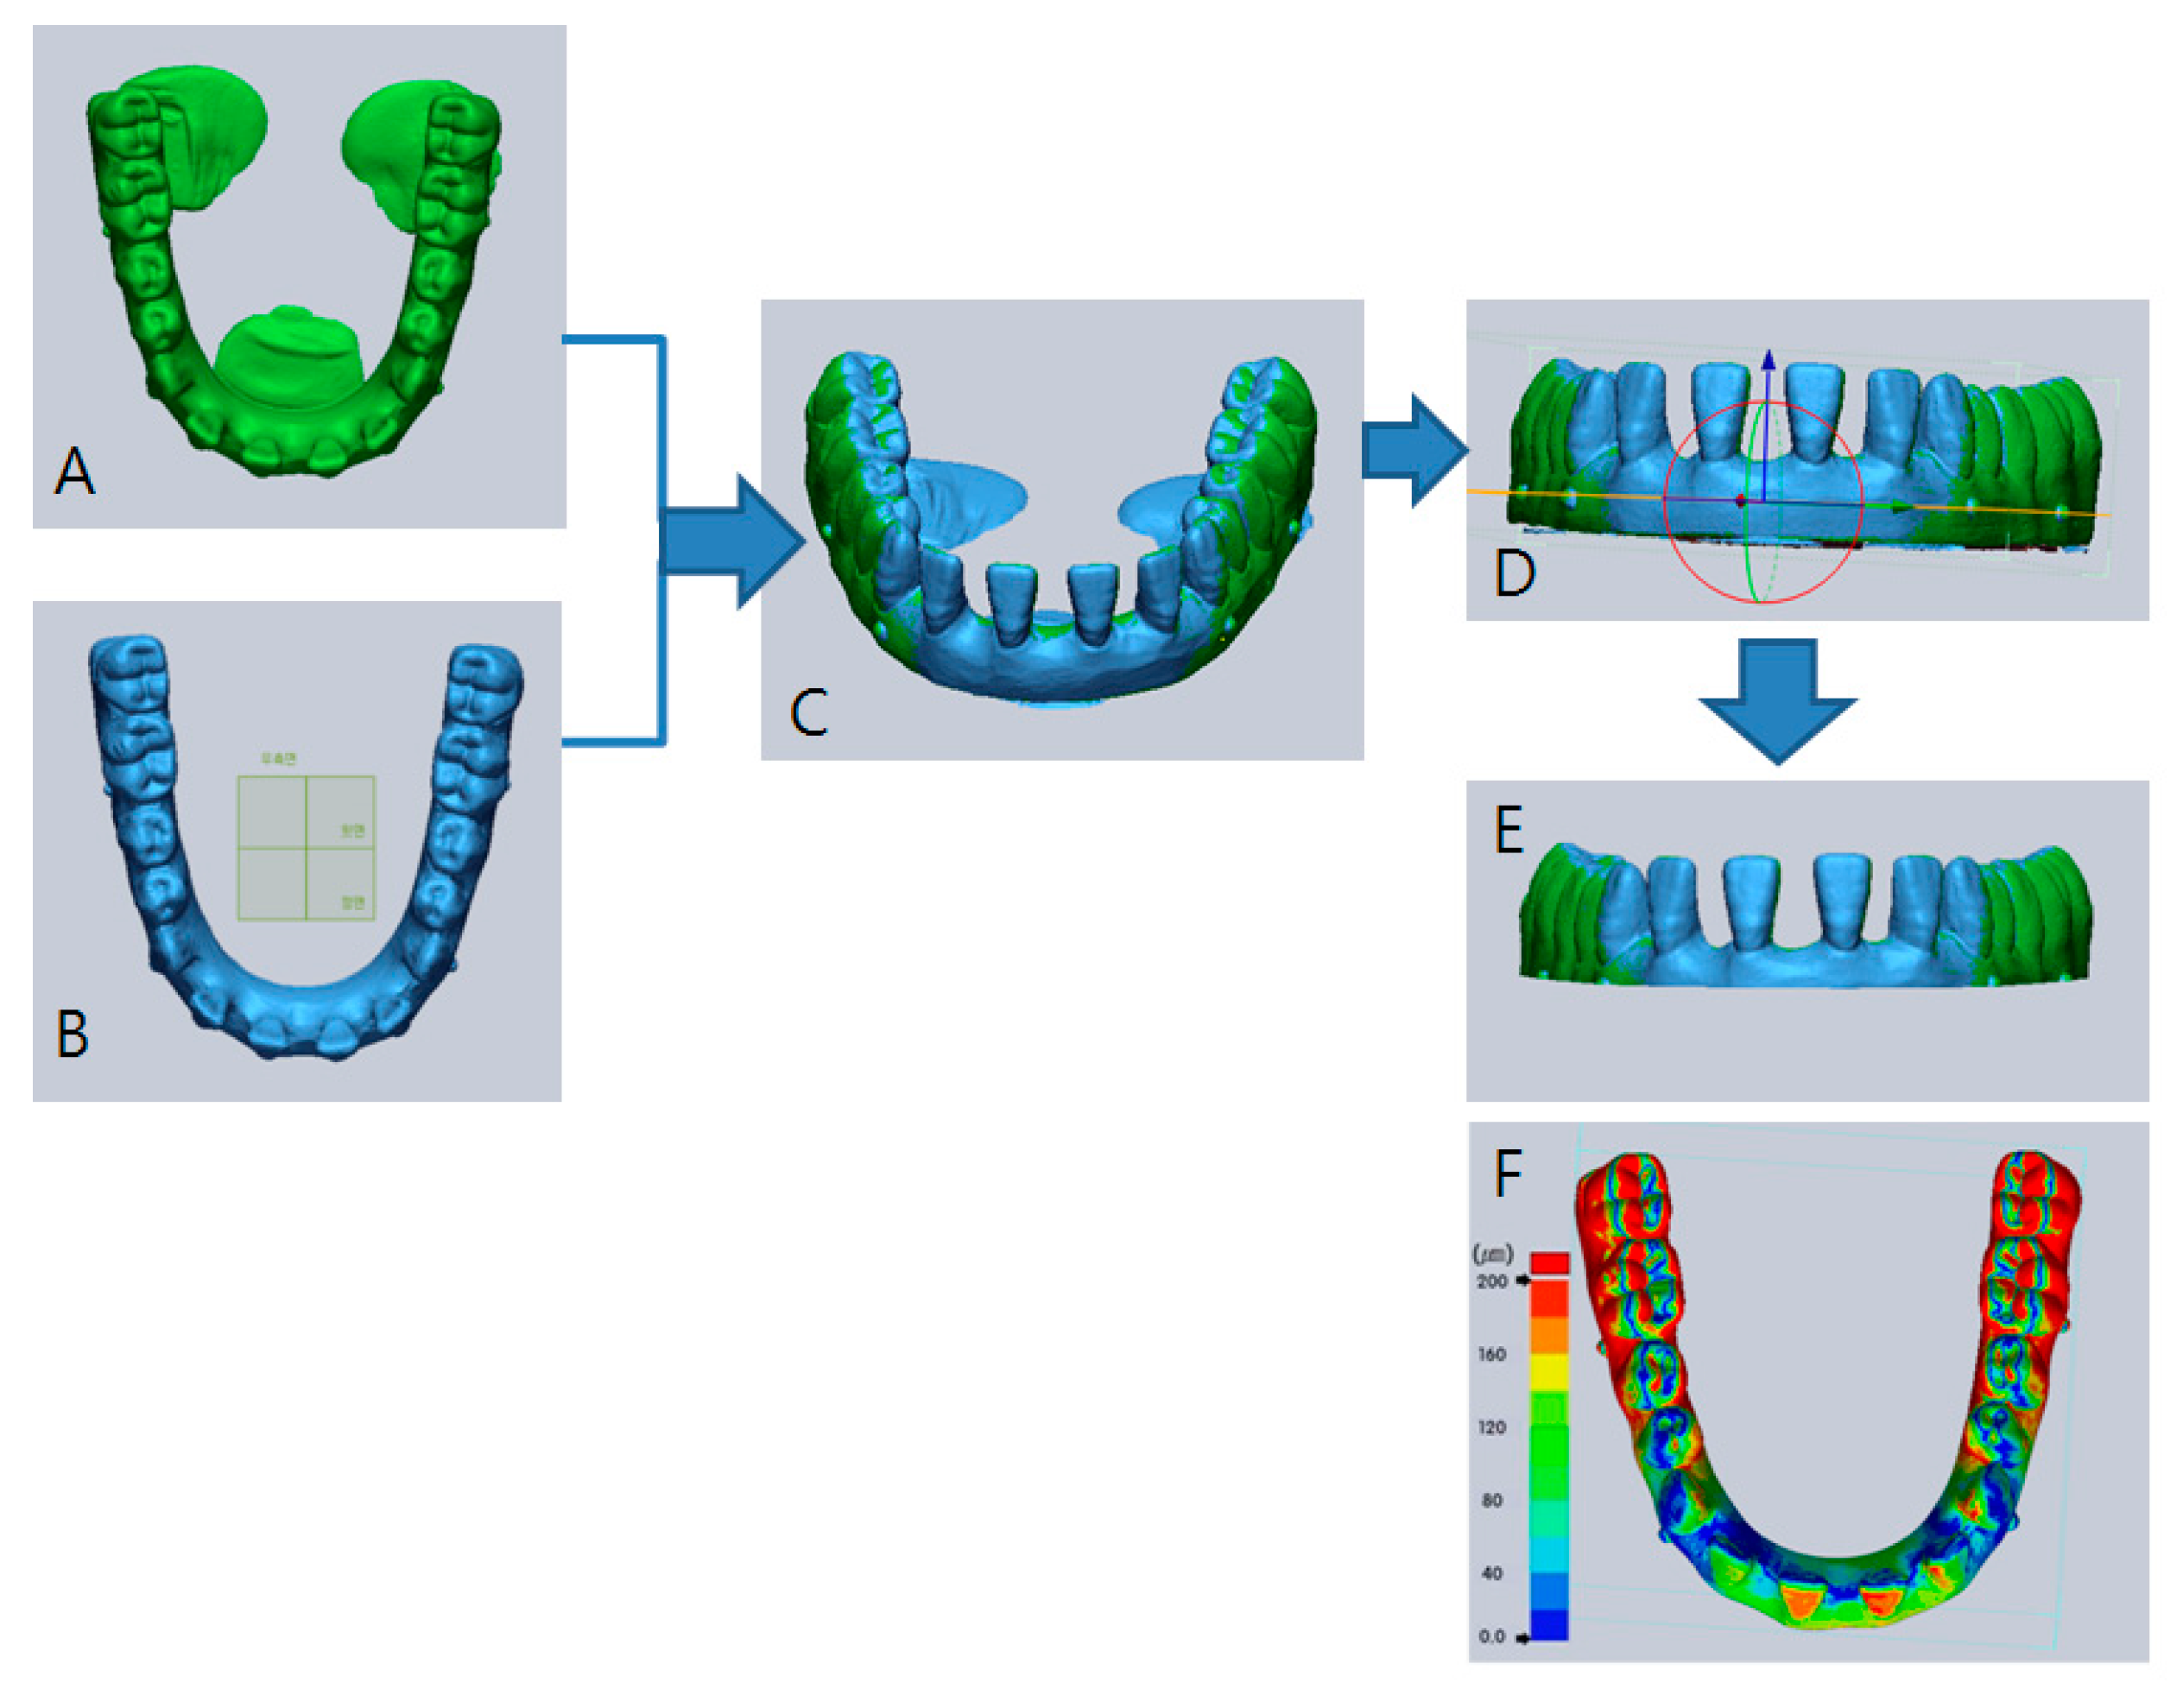
Figure 4.
Illustration of superimposed models and division sequence using Geomagic Verify™. (A) Scanned data from the reference scanner with the Severe model; (B) Scanned data from iTero® with the Severe model; (C) Superimposed model using the best-fit algorithm between (A) and (B); (D) A reference plane set with resin-balls for cutting the base of the superimposed model; (E) Finished product of a superimposed model after cutting the base; (F) Colored representation showing deviations after superimposition. Red represents areas of high deviation (around 200 μm). Blue represents areas of low deviation (around 0 μm).

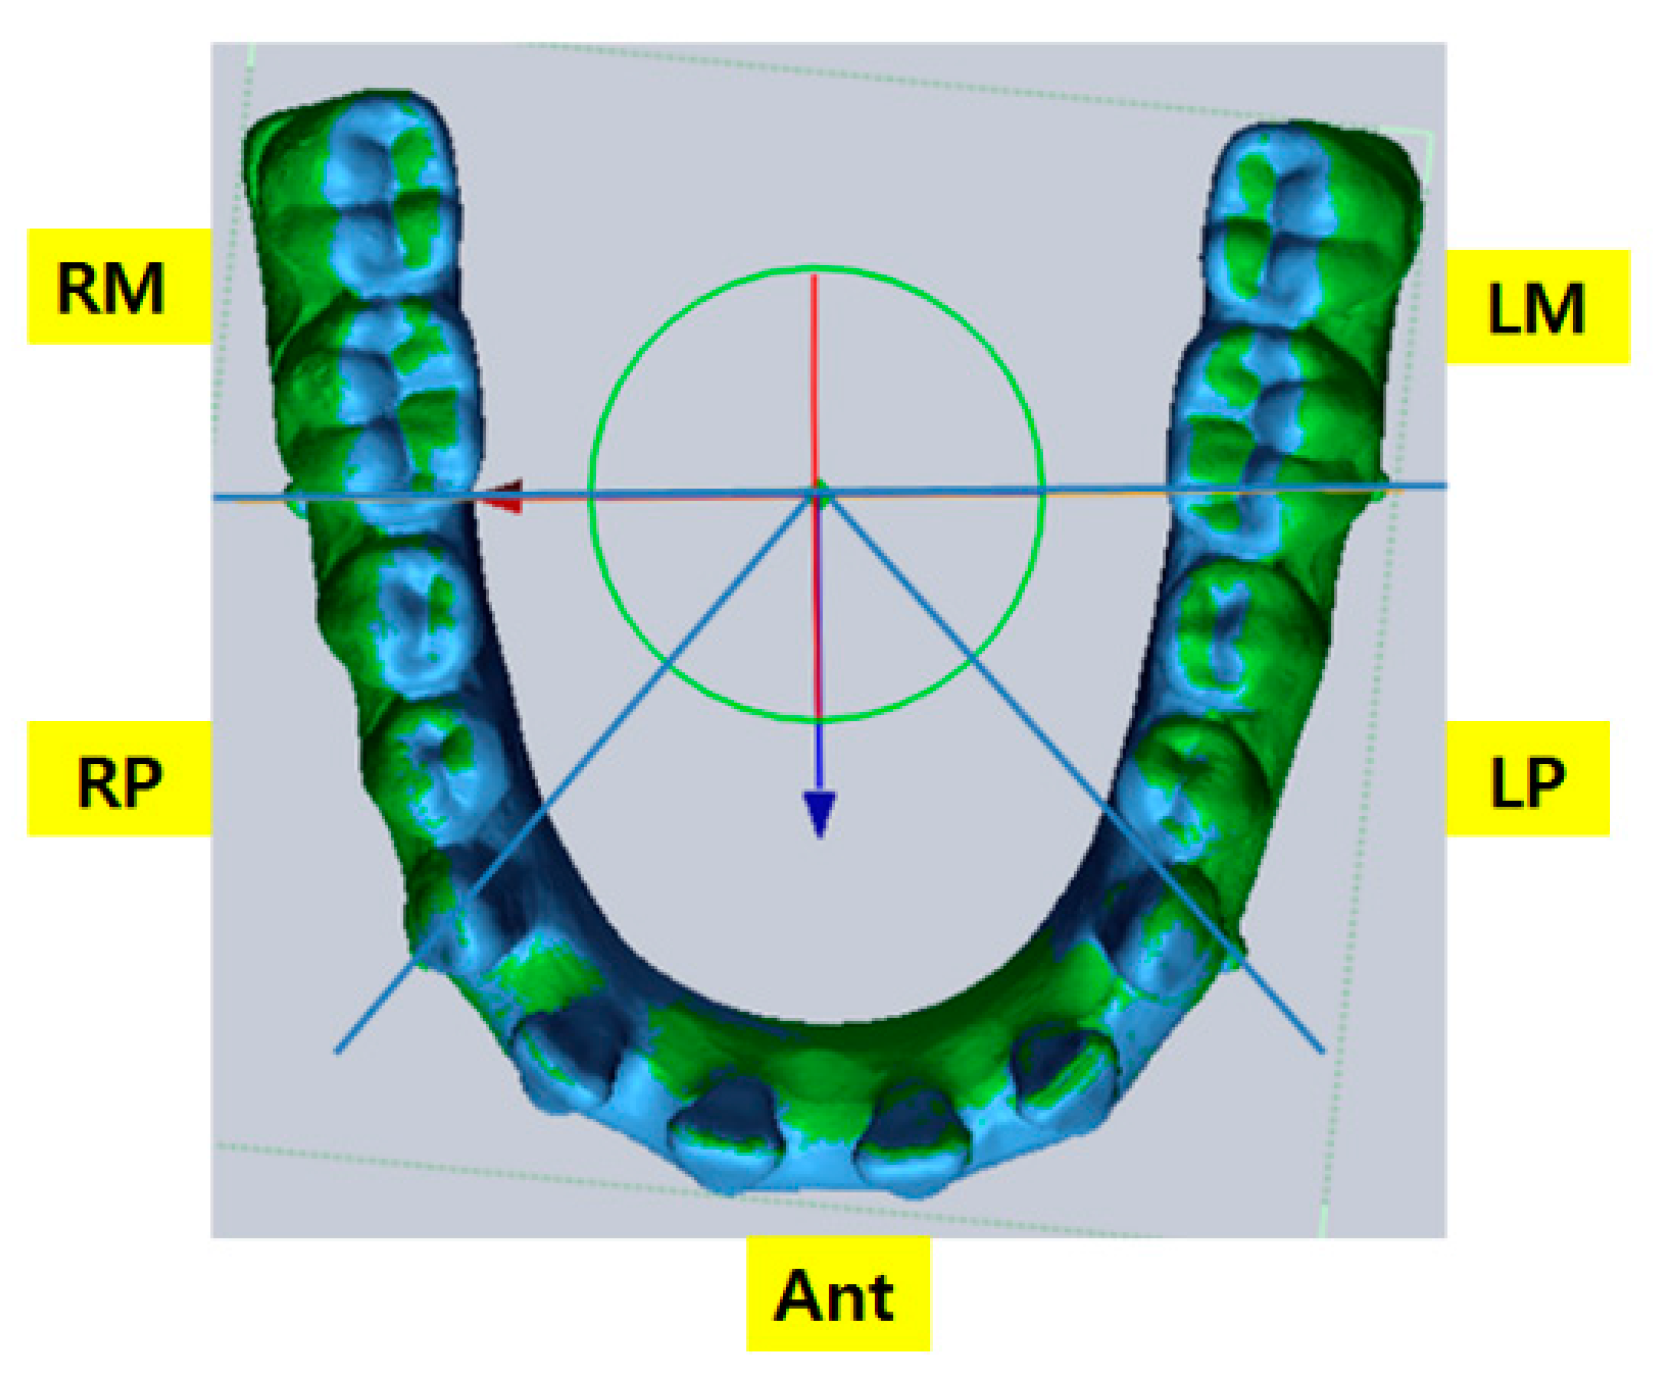
Figure 5.
Superimposed model divided into five Sections. LM: left molars, LP: left premolars, Ant: anterior, RP: right premolars, RM: right molars.
Figure 5.
Superimposed model divided into five Sections. LM: left molars, LP: left premolars, Ant: anterior, RP: right premolars, RM: right molars.

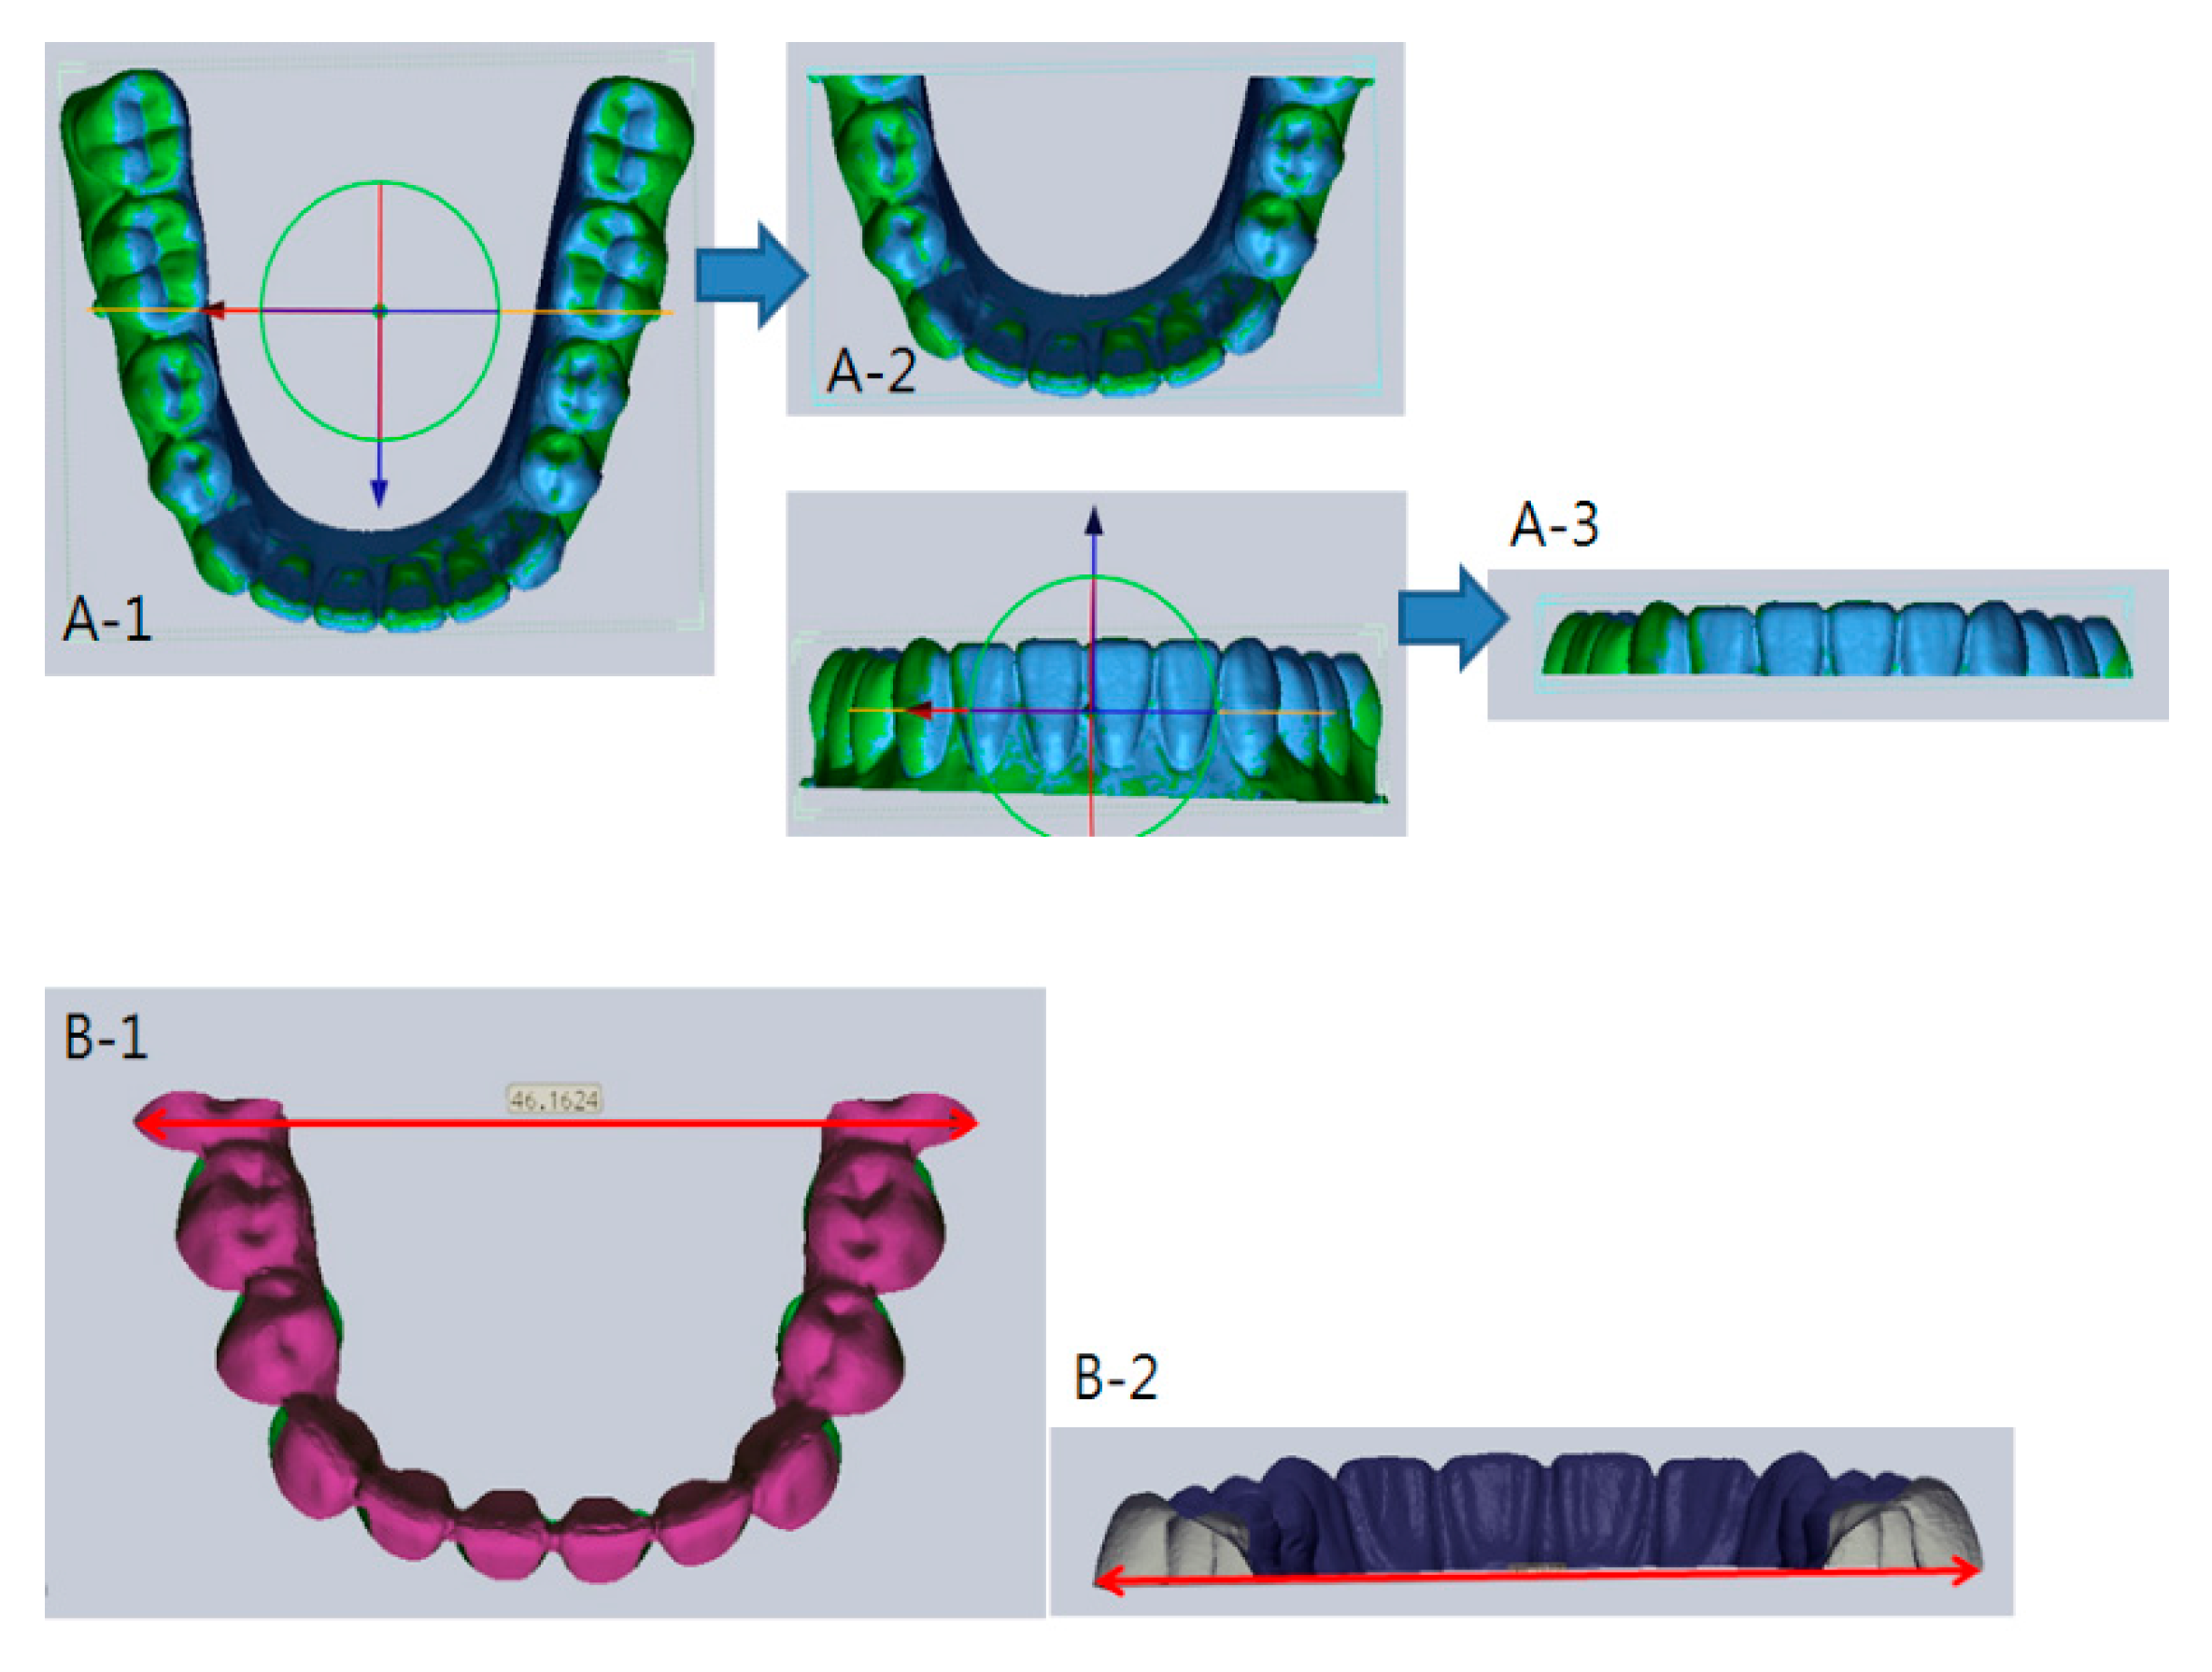
Figure 6.
Sequence of measuring intermolar width. A-1, Setting a reference plane that passes through the molar resin ball of both sides, and then divide; A-2, Setting a reference plane that passes through the most prominent point of the first molars of both sides, and then dividing; A-3, Shows the divided model for measuring intermolar width; B-1 and B-2, Shows the intermolar width measurement.

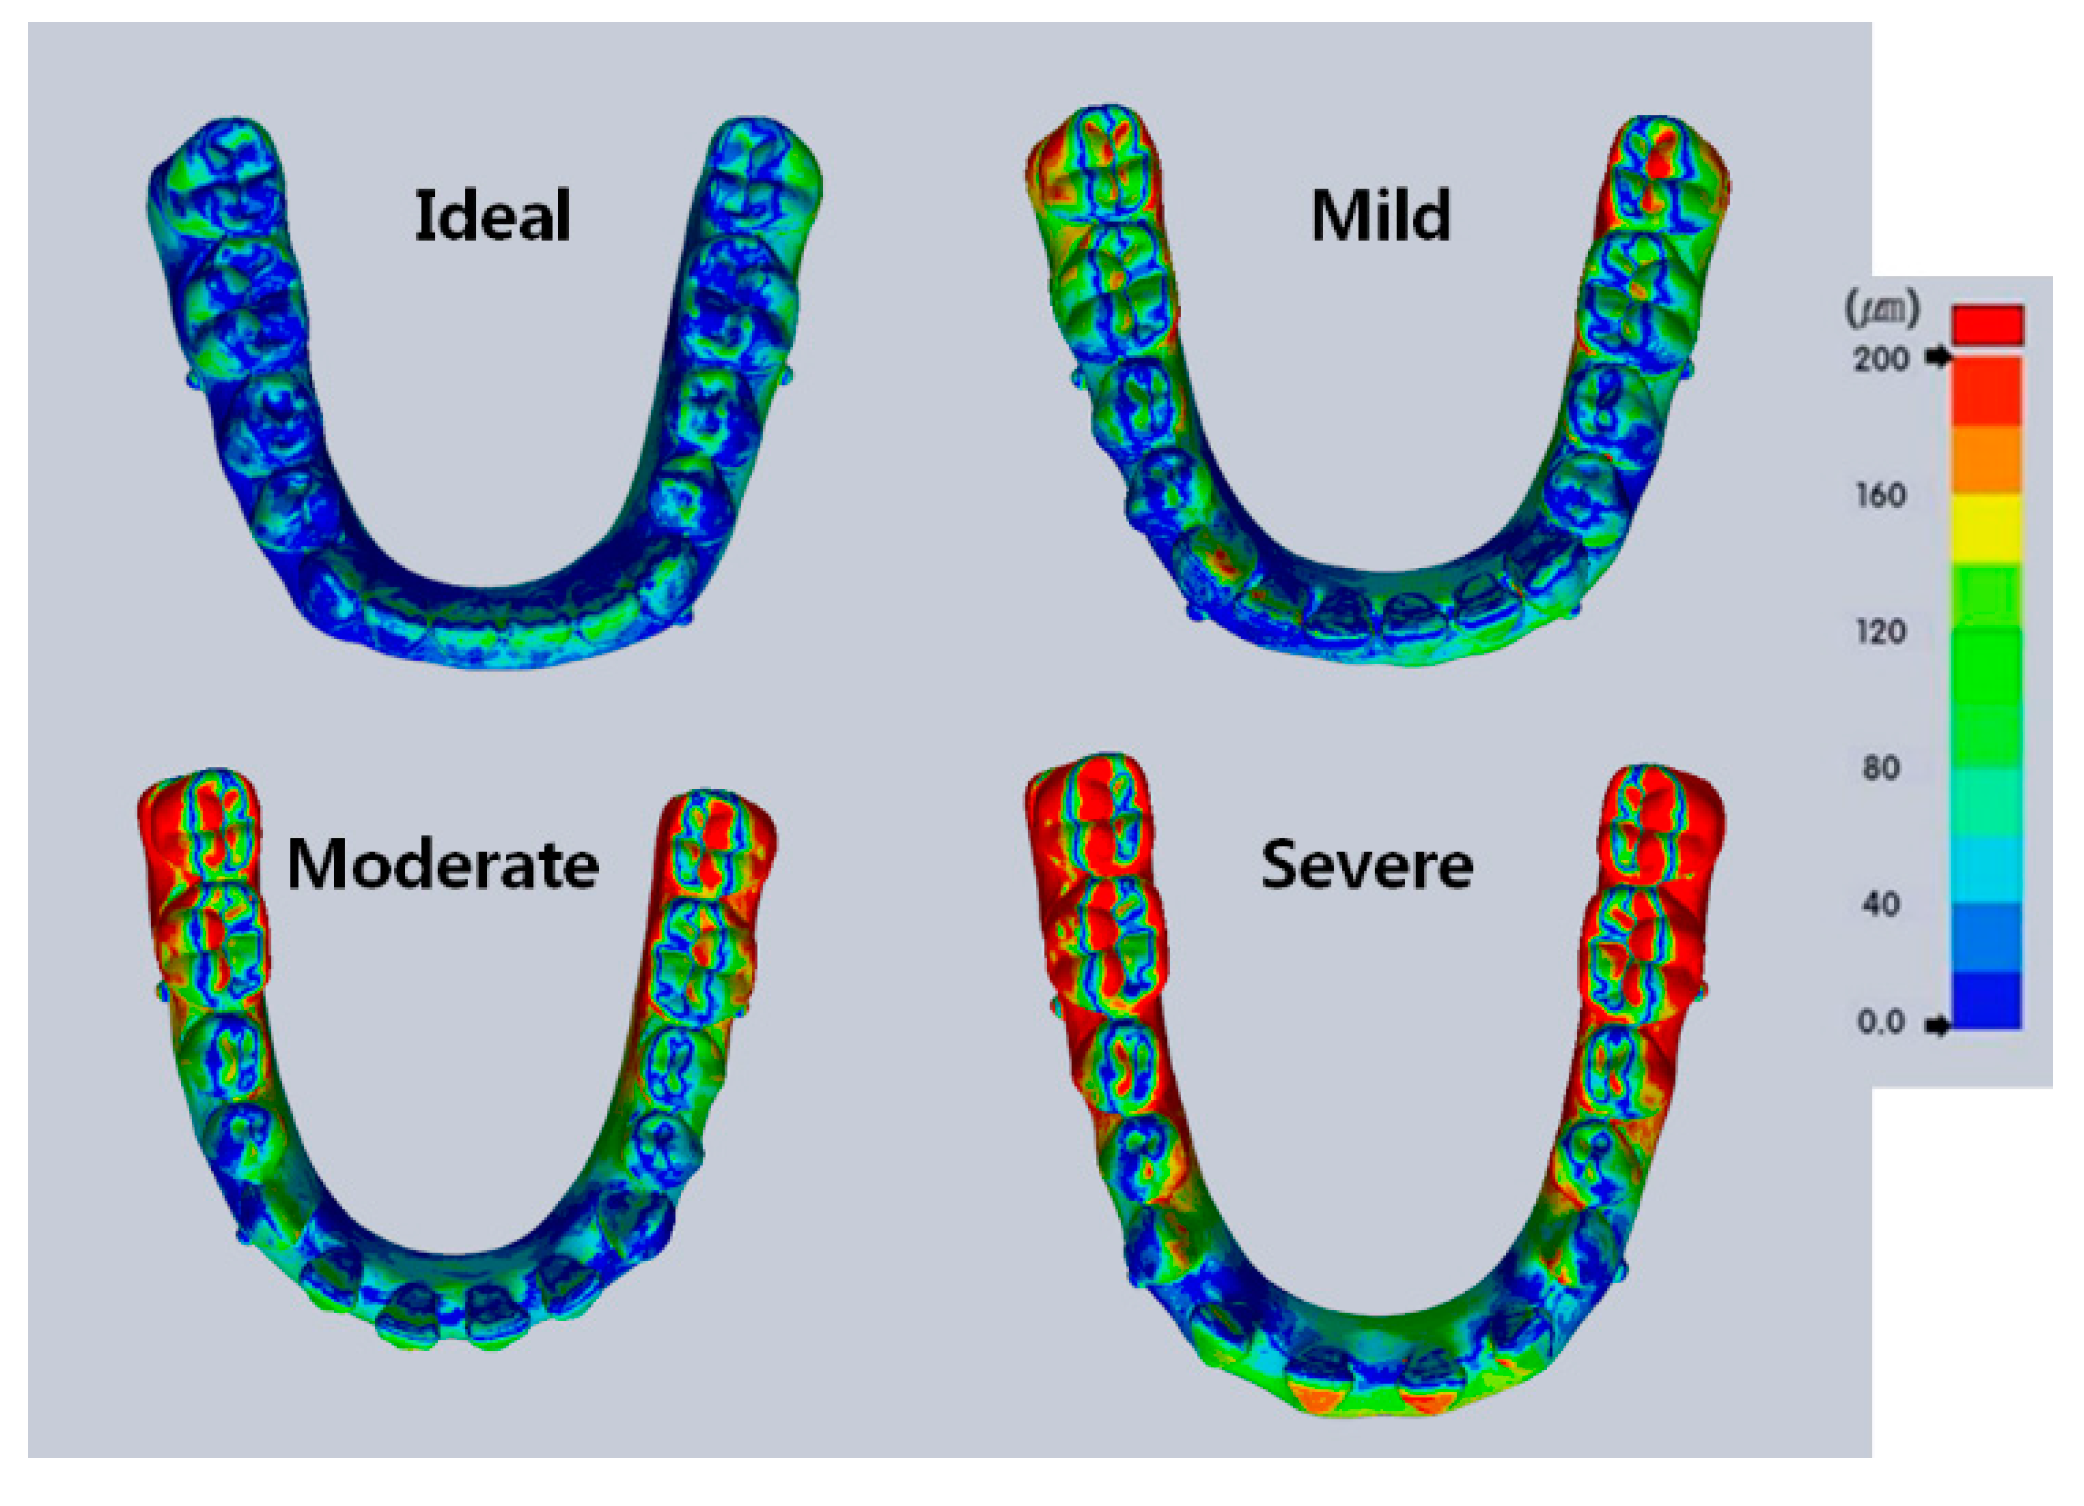
Figure 7.
Representation of deviations when using iTero®. The color map was set from 0 μm to +200 μm. Ideal: ideal dental arch; Mild: 1 mm spacing; Moderate: 3 mm spacing; and Severe: 5 mm spacing. Red represents areas of large deviations; Blue represents areas of small deviations. The deviation of Ideal is the smallest; that of Mild is larger than Ideal; that of Moderate is larger than Mild; and that of Severe is the largest, especially in the posterior area.

Figure 8.
Representation of deviations when using Trios® Color map was set from 0 μm to +200 μm. Ideal: ideal dental arch; Mild: 1 mm spacing; Moderate: 3 mm spacing; and Severe: 5 mm spacing. Red represents areas of large deviations; Blue represents areas of small deviations. The deviation of Ideal is the smallest; that of Mild is larger than Ideal; that of Moderate is larger than Mild; and that of Severe is the largest, especially in the posterior area.
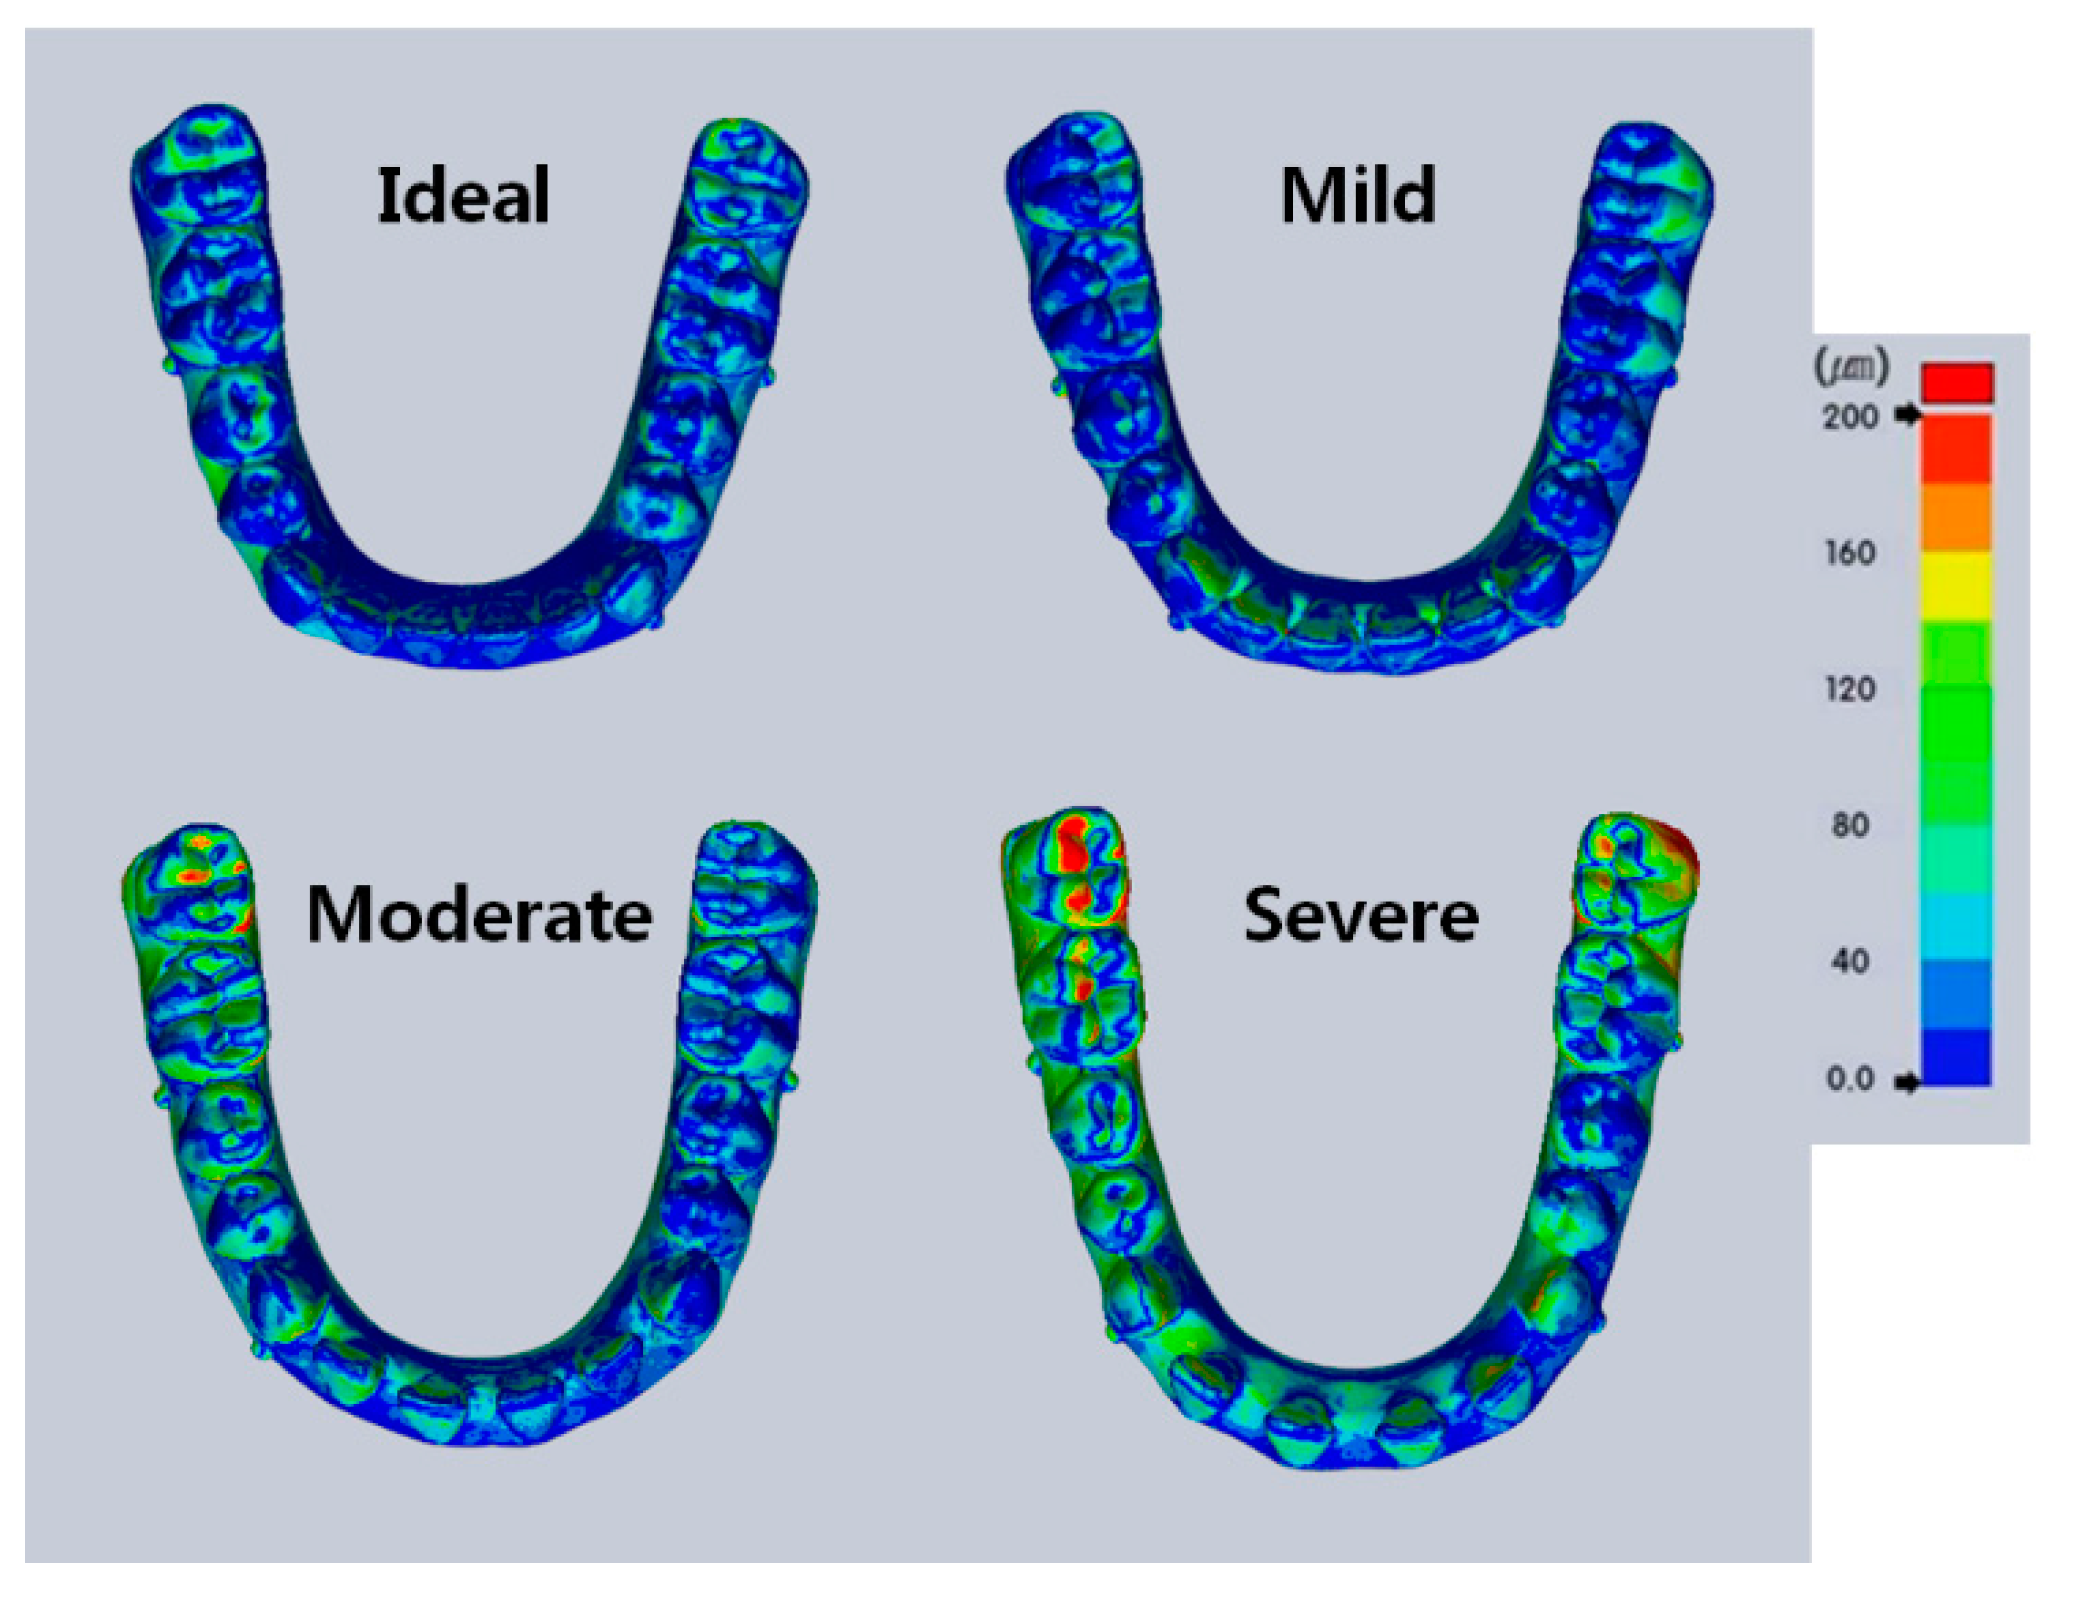
Figure 9.
Boxplot showing deviations among four models in the scanned images from iTero® and Trios®. For the sectioned arch, Ant is the anterior teeth; LP is the left premolars; RP is the right premolars; LM is the left molars; RM is the right molars; Total is the entire arch. The plot shows median, 25% quartile, 75% quartile and maximum-minimum range.

Figure 10.
Boxplot showing deviations among sections in the scanned images from iTero® and Trios®. For sectioned arch, Ant is the anterior teeth; LP is the left premolars; RP is the right premolars; LM is the left molars; RM is the right molars; Total is the entire arch. The plot shows the median, 25% quartile, 75% quartile and the maximum-minimum range.
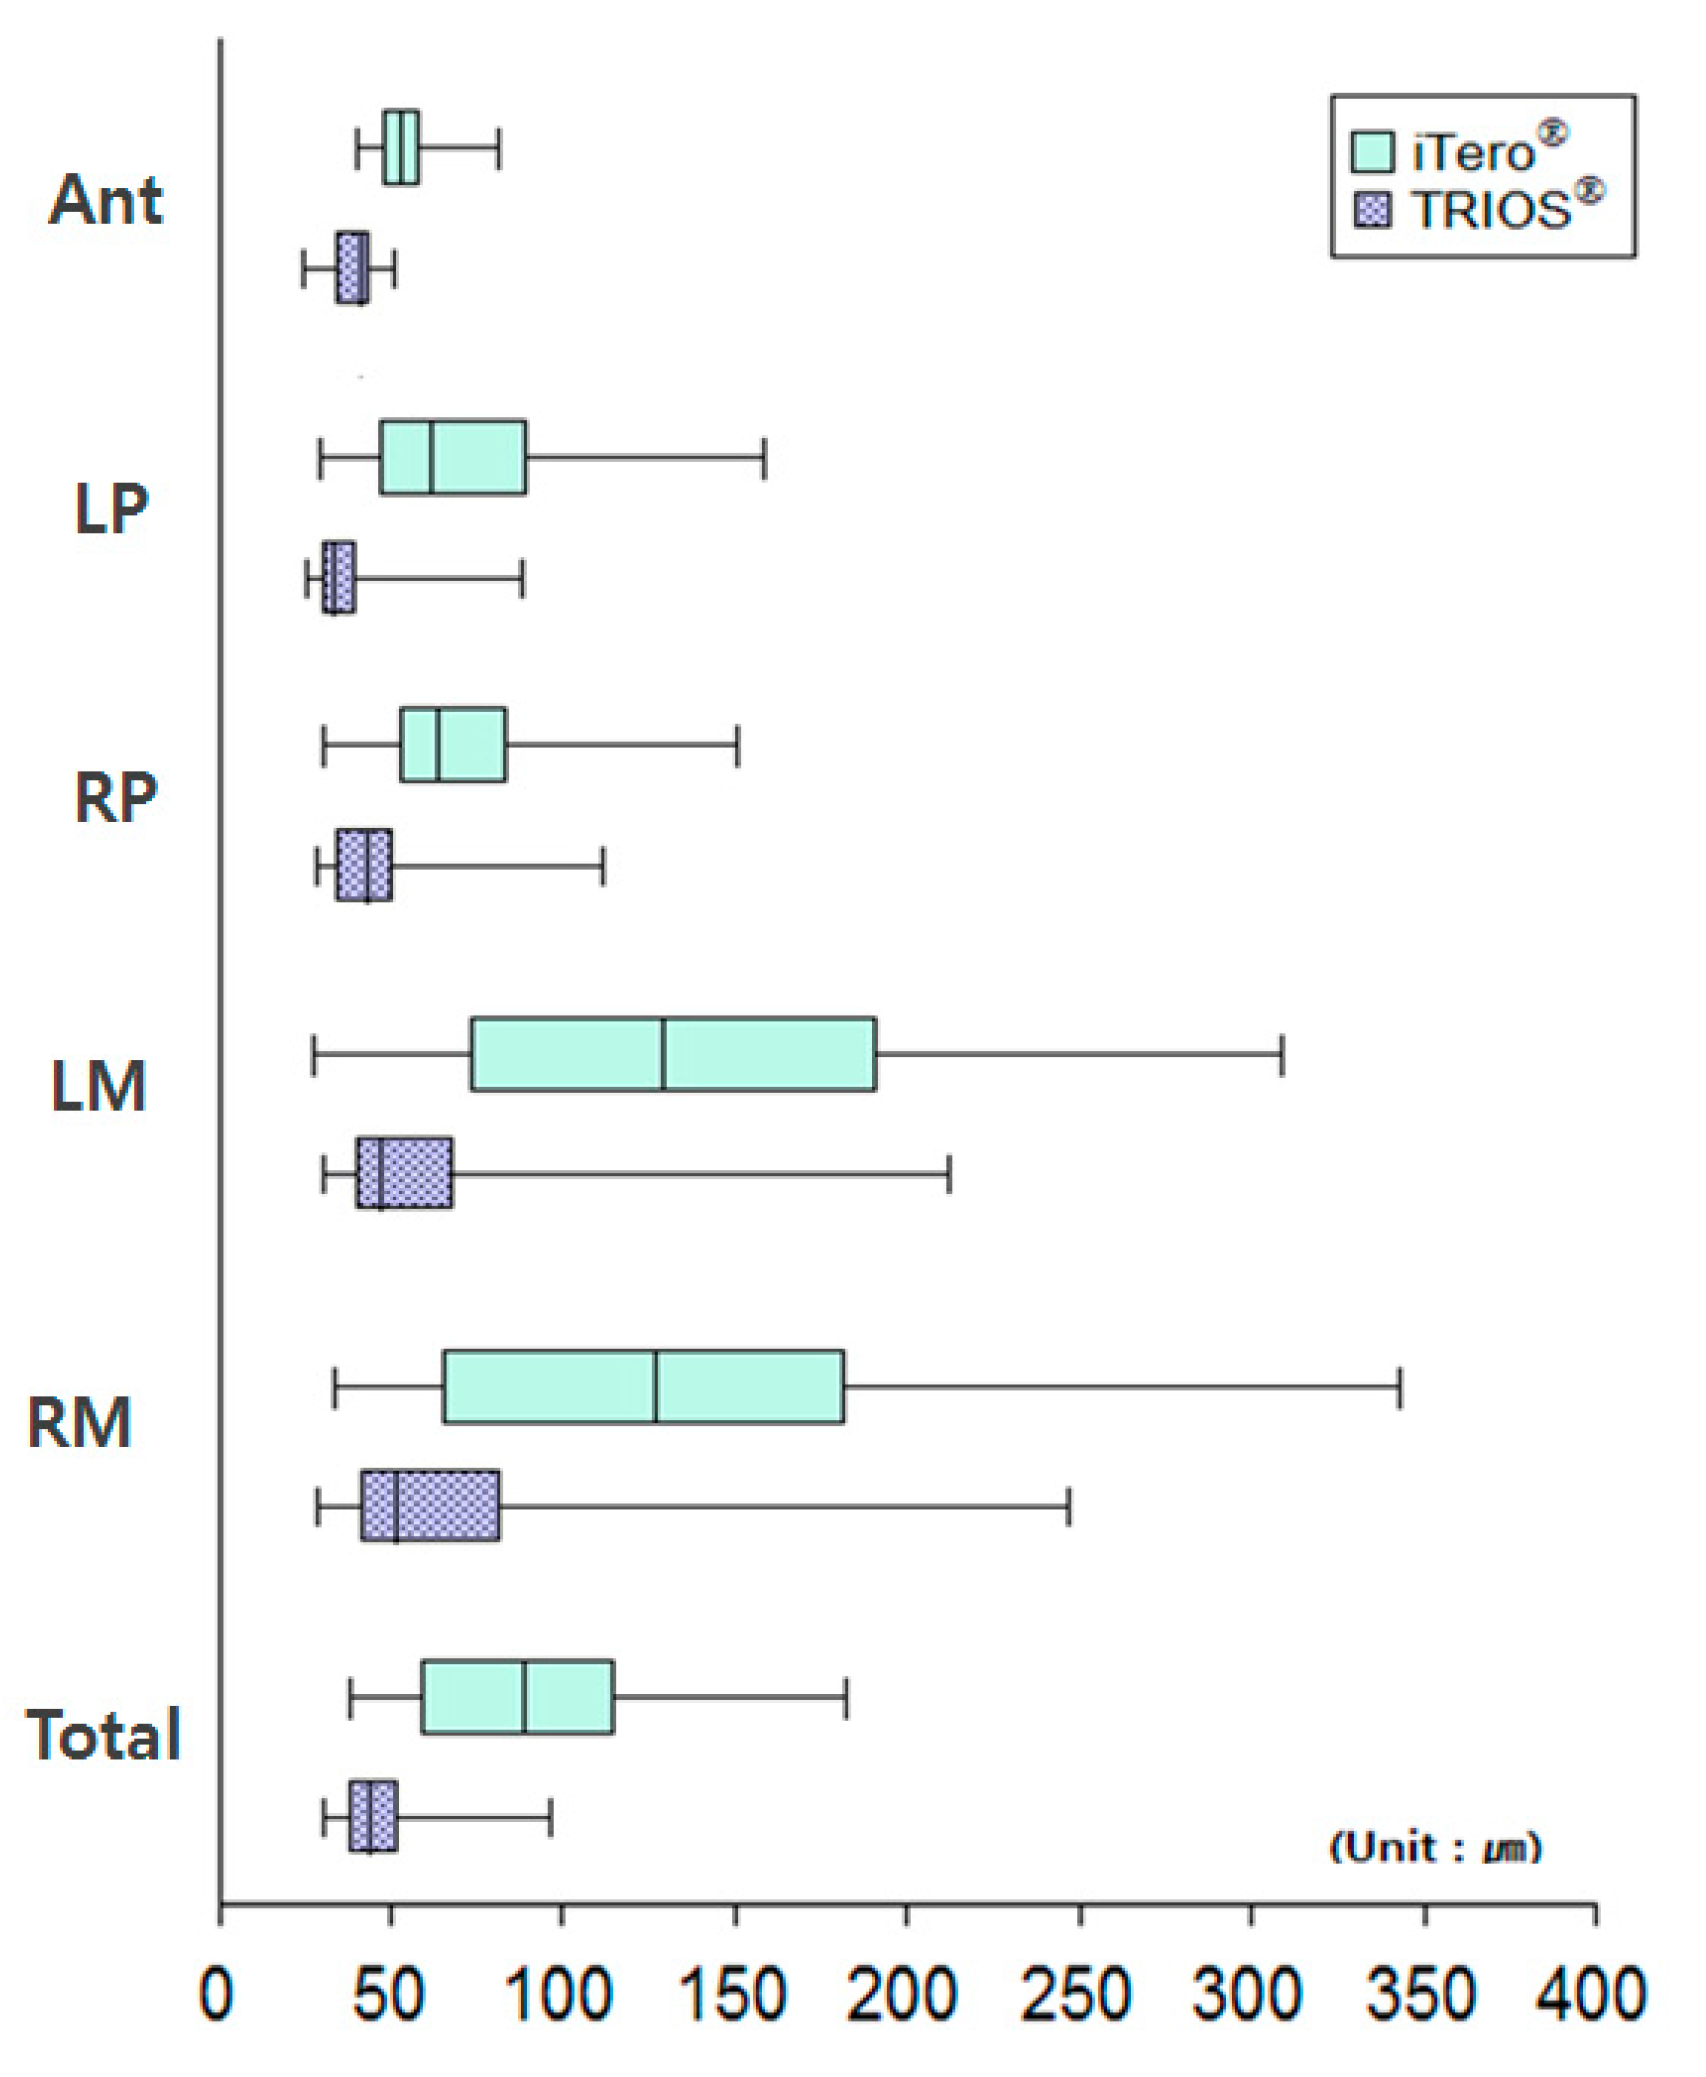
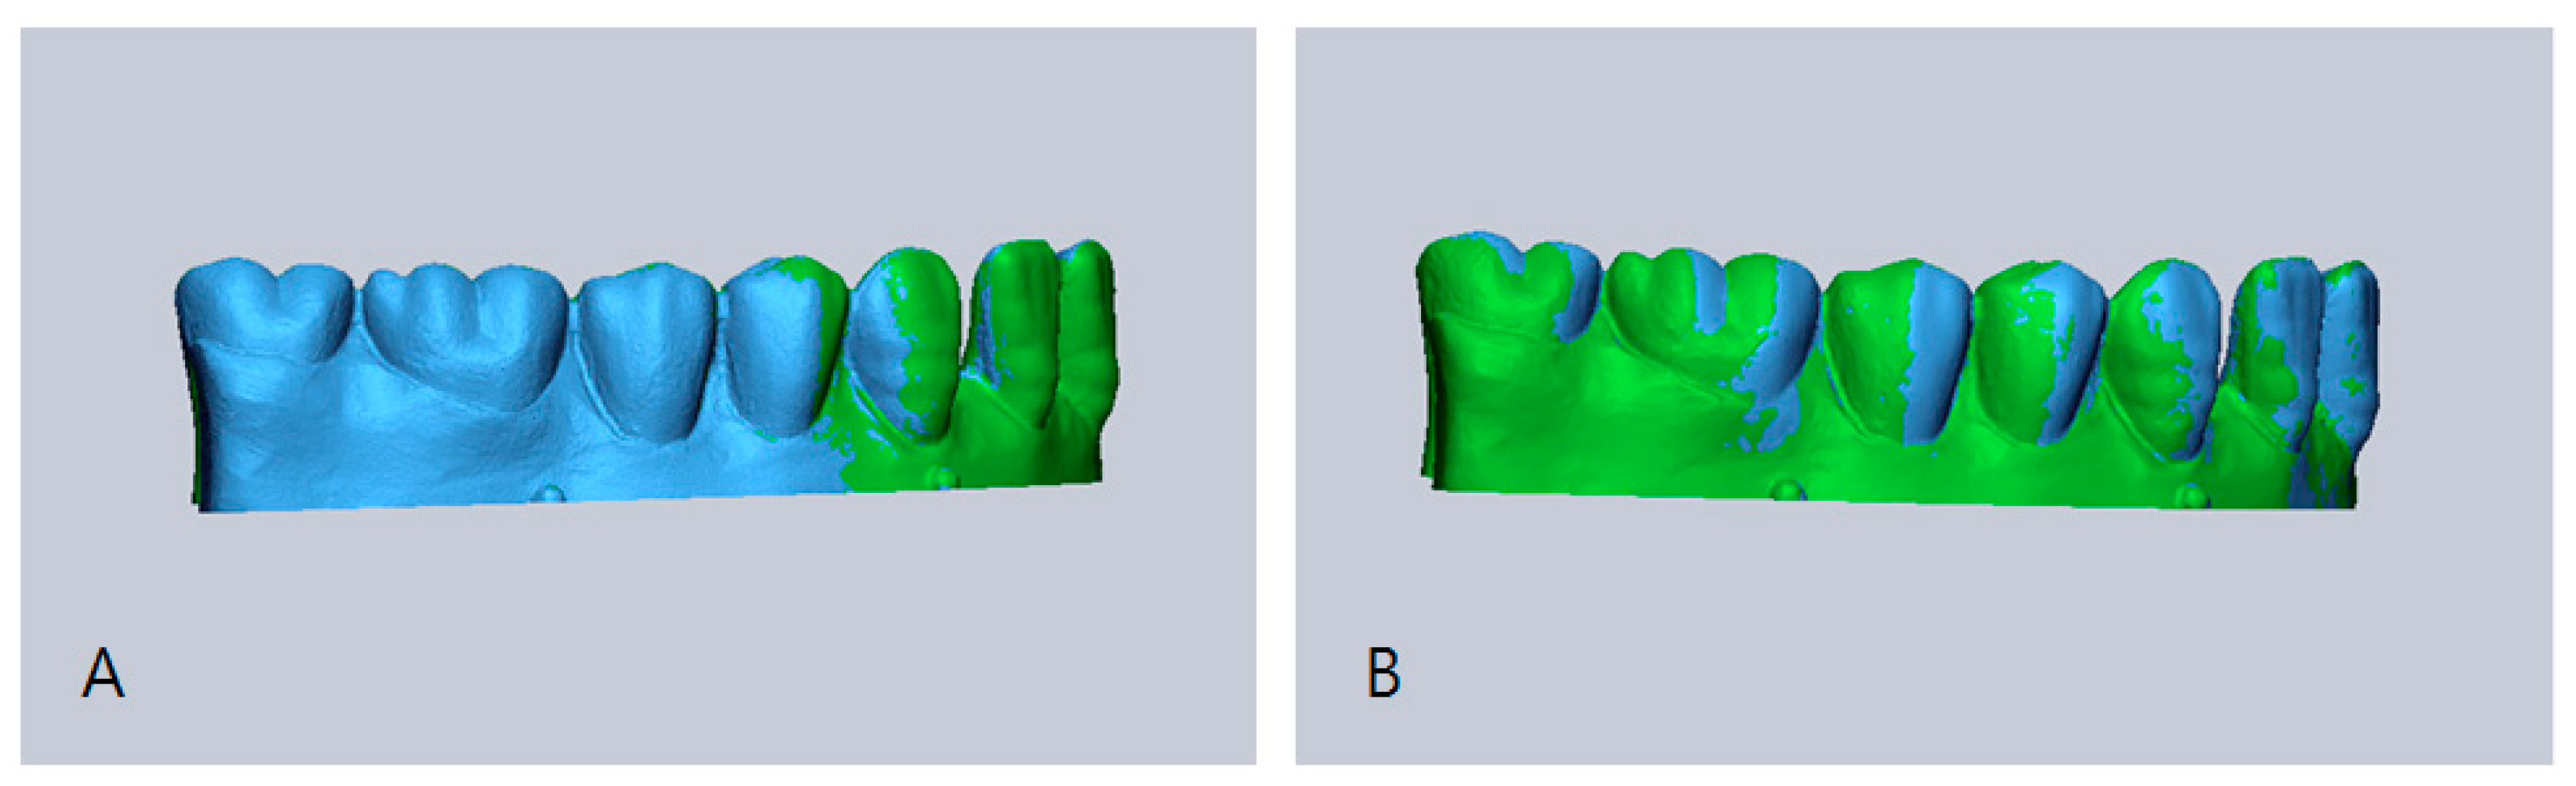
Figure 11.
Deviation occurs in the posterior area after superimposition. Blue: data from the intraoral scanners, Trios® and iTero®; Green: data from the reference scanner. (A) Represents iTero®: more blue than green in the posterior region. (B) Represents Trios®: mixed blue and green in the posterior region.

Table 1.
Comparison of deviations in the scanned images of the four models using iTero® (unit: μm).
| Models | Ideal | Mild | Moderate | Severe | p-Value ∫ | |
|---|---|---|---|---|---|---|
| Sections | Mean (SD) | Mean (SD) | Mean (SD) | Mean (SD) | ||
| Ant | 45.32 (5.66) a,A | 51.67 (5.49) ab,A | 60.50 (10.65) c,A | 57.29 (7.74) b,A | <0.001 * | |
| LP | 49.93 (19.68) a,A | 55.24 (11.35) ab,A | 73.78 (26.62) c,A | 106.49 (32.56) b,B | <0.001 * | |
| RP | 49.23 (16.65) a,A | 55.19 (12.36) a,A | 81.80 (31.25) b,A | 93.77 (27.21) b,AB | <0.001 * | |
| LM | 98.13 (64.84) a,B | 116.49 (50.64) a,B | 136.98 (71.75) a,BC | 205.36 (66.05) b,C | 0.004 * | |
| RM | 93.73 (67.48) a,B | 113.25 (52.73) a,B | 151.27 (95.42) ab,C | 188.03 (57.88) b,C | 0.024 * | |
| Total | 67.74 (33.13) a,AB | 76.07 (23.93) a,B | 99.43 (43.61) ab,AB | 119.65 (32.15) b,B | 0.007 * | |
| p-value ∫∫ | 0.015 ** | <0.001 ** | 0.002 ** | <0.001 ** | - | |
Values from all sections of the four models (Ideal, Mild, Moderate, Severe) are statistically different. ∫ p-values for models after one-way ANOVA. * Indicates that the values are statistically different among models (* p < 0.05). (Post-hoc (Duncan): a < b < c) Values from the sectioned arches (Ant, LP, RP, LM, RM, Total) of all models are statistically different. ∫∫ p-values for sections after one-way ANOVA. ** Indicates that the values are statistically different among sections (* p < 0.05). (Post-hoc (Duncan): A < B < C) SD: standard deviation. Ideal: ideal dental arch; Mild: 1 mm spacing; Moderate: 3 mm spacing; and Severe: 5 mm spacing. For the sectioned arch: Ant is the anterior teeth; LP is the left premolars; RP is the right premolars; LM is the left molars; RM is the right molars; Total is the entire arch.
Table 2.
Comparison of differences in intermolar widths between iTero® and the reference scanner (unit: mm).
Table 2.
Comparison of differences in intermolar widths between iTero® and the reference scanner (unit: mm).
| Models | Reference Scanner | iTero® | ||
|---|---|---|---|---|
| Mean | Mean | Minimum Difference | Maximum Difference | |
| Ideal | 46.02 | 46.23 | 46.02 (0.00) | 46.56 (0.54) |
| Mild | 46.52 | 46.69 | 46.48 (0.04) | 46.89 (0.37) |
| Moderate | 47.68 | 47.79 | 47.65 (0.03) | 48.34 (0.66) |
| Severe | 48.45 | 48.82 | 48.54 (0.09) | 49.08 (0.64) |
Ideal: ideal dental arch; Mild: 1 mm spacing; Moderate: 3 mm spacing; and Severe: 5 mm spacing. Mean of reference scanner: average intermolar width when the data was collected three times using reference scanner; Mean of iTero®: average intermolar width of 10 scanned images by measuring the data 3 times using iTero®. Minimum difference: the minimum value of the difference between the mean of reference scanner and 10 scanned data from iTero®; Maximum difference: the maximum value of the difference between the mean of reference scanner Mean and 10 scanned data from iTero®.
Table 3.
Comparison of deviations in the scanned images of the four models from Trios® (unit: μm).
| Models | Ideal | Mild | Moderate | Severe | p-Value ∫ | |
|---|---|---|---|---|---|---|
| Sections | Mean (SD) | Mean (SD) | Mean (SD) | Mean (SD) | ||
| Ant | 26.78 (2.72) a,A | 40.16 (2.53) b | 41.34 (5.21) b,A | 42.51 (2.45) b,A | <0.001 * | |
| LP | 29.27 (4.13) A | 34.22 (7.85) | 37.34 (9.76) A | 40.78 (18.09) A | 0.146 | |
| RP | 35.39 (7.03) a,A | 38.62 (10.12) ab | 49.65 (15.11) bc,AB | 54.20 (21.78) c,A | 0.020 * | |
| LM | 47.63 (15.85) B | 48.29 (24.16) | 61.14 (24.08) BC | 74.38 (54.49) AB | 0.242 | |
| RM | 49.53 (17.10) B | 51.83 (29.69) | 69.97 (37.69) C | 91.69 (61.40) B | 0.083 | |
| Total | 32.21 (4.97) a,A | 41.38 (7.95) ab | 47.48 (11.24) bc,AB | 52.47 (16.83) c,A | 0.002 * | |
| p-value ∫∫ | <0.001 ** | 0.209 | 0.006 ** | 0.018 ** | - | |
Values from Ant, RP, and Total in the four models (Ideal, Mild, Moderate, Severe) are statistically different. * indicates that the values are statistically different among models. (* p < 0.05). ∫ p-values among models after one-way ANOVA. (Post-hoc (Duncan): a < b < c). Mark ** indicates that the values are statistically different among sections (* p < 0.05). ∫∫ p-Values among sections after one-way ANOVA. (Post-hoc (Duncan): A < B < C) SD: standard deviation. Ideal: ideal dental arch; Mild: 1 mm spacing; Moderate: 3 mm spacing; and Severe: 5 mm spacing. For the sectioned arch: Ant is the anterior teeth; LP is the left premolars; RP is the right premolars; LM is the left molars; RM is the right molars; Total is the entire arch.
Table 4.
Comparison of differences in intermolar widths between Trios® and the reference scanner (unit: mm).
Table 4.
Comparison of differences in intermolar widths between Trios® and the reference scanner (unit: mm).
| Models | Reference Scanner | Trios® | ||
|---|---|---|---|---|
| Mean | Mean | Minimum Difference | Maximum Difference | |
| Ideal | 46.0238 | 46.00 | 46.03 (0.00) | 45.75 (0.27) |
| Mild | 46.5214 | 46.53 | 46.51 (0.01) | 46.65 (0.13) |
| Moderate | 47.6796 | 47.46 | 47.60 (0.08) | 46.92 (0.76) |
| Severe | 48.45 | 48.41 | 48.41 (0.03) | 48.21 (0.24) |
Ideal: ideal dental arch; Mild: 1 mm spacing; Moderate: 3 mm spacing; and Severe: 5 mm spacing. Mean of reference scanner: average intermolar width was obtained by measuring the reference data three times; Mean of Trios®: average intermolar width of 10 scanned images was obtained by measuring the data three times using Trios®. Minimum difference: the minimum value of the difference between the mean of reference scanner and that of 10 scanned data from Trios®; Maximum difference: the maximum value of the difference between the mean of reference scanner and that of 10 scanned data from Trios®.
Table 5.
Comparison of deviations of the scanned images of the four models from iTero® and Trios® (unit: μm).
Table 5.
Comparison of deviations of the scanned images of the four models from iTero® and Trios® (unit: μm).
| Models | iTero® | Trios® | p-Value |
|---|---|---|---|
| Mean (SD) | Mean (SD) | ||
| Ideal | 67.74 (33.13) | 32.21 (4.97) | 0.008 * |
| Mild | 76.07 (23.93) | 41.38 (7.95) | 0.001 * |
| Moderate | 99.43 (43.61) | 47.48 (11.24) | 0.004 * |
| Severe | 119.65 (32.15) | 52.47 (16.83) | <0.001 * |
* Indicates that the values are statistically different between iTero® and Trios® (p < 0.05). Values obtained from all models (Ideal, Mild, Moderate, Severe5) using iTero® and Trios® are statistically different. Ideal: ideal dental arch; Mild: 1 mm spacing; Moderate: 3 mm spacing; and Severe: 5 mm spacing. SD: standard deviation.
Table 6.
Comparison of deviations of the scanned images among sections in iTero® and Trios® (unit: μm).
Table 6.
Comparison of deviations of the scanned images among sections in iTero® and Trios® (unit: μm).
| Section | iTero® | Trios® | p-Value |
|---|---|---|---|
| Mean (SD) | Mean (SD) | ||
| Ant | 53.70 (9.41) | 37.70 (7.23) | <0.001 * |
| LP | 71.36 (32.09) | 35.40 (11.58) | <0.001 * |
| RP | 70.00 (29.03) | 44.47 (16.07) | <0.001 * |
| LM | 139.24 (73.79) | 57.86 (33.69) | <0.001 * |
| RM | 136.57 (76.88) | 65.76 (41.99) | <0.001 * |
| Total | 90.72 (38.57) | 43.39 (13.17) | <0.001 * |
* Indicates that the values are statistically different between iTero® and Trios® (p < 0.05). Values obtained from every section (Ant, LP, RP, LM, RM, Total) using iTero® and Trios® are statistically different. p-values are <0.001. SD: standard deviation. For the sectioned arch, Ant is the anterior teeth; LP is the left premolars; RP is the right premolar; LM is the left molar; RM is the right molar; Total is the entire arch.
Table 7.
Comparison of differences in intermolar widths in iTero® versus Trios® (unit: μm).
| Model | iTero® | Trios® | p-Value |
|---|---|---|---|
| Mean (SD) | Mean (SD) | ||
| Ideal | 0.20 (0.01) | 0.02 (0.02) | <0.001 * |
| Mild | 0.17 (0.08) | 0.07 (0.03) | 0.112 |
| Moderate | 0.11 (0.03) | 0.22 (0.02) | 0.004 * |
| Severe | 0.38 (0.01) | 0.04 (0.03) | <0.001 * |
* Indicates that the values are statistically different between iTero® and Trios® (p < 0.05). Ideal presents the ideal arch dentition; Mild 1 mm spacing dentition; Moderate 3 mm spacing dentition and Severe 5 mm spacing dentition. Mean value of iTero® is the average intermolar width when the data was scanned 10 times using iTero; Mean value of Trios® is the average intermolar width when the data was scanned 10 times using Trios®. SD: standard deviation.
© 2017 by the authors. Licensee MDPI, Basel, Switzerland. This article is an open access article distributed under the terms and conditions of the Creative Commons Attribution (CC BY) license (http://creativecommons.org/licenses/by/4.0/).
Share and Cite
MDPI and ACS Style
Chun, J.-h.; Tahk, J.H.; Chun, Y.-S.; Park, J.-M.; Kim, M. Analysis on the Accuracy of Intraoral Scanners: The Effects of Mandibular Anterior Interdental Space. Appl. Sci. 2017, 7, 719. https://doi.org/10.3390/app7070719
AMA Style
Chun J-h, Tahk JH, Chun Y-S, Park J-M, Kim M. Analysis on the Accuracy of Intraoral Scanners: The Effects of Mandibular Anterior Interdental Space. Applied Sciences. 2017; 7(7):719. https://doi.org/10.3390/app7070719
Chicago/Turabian StyleChun, Ji-hye, Ji Hyun Tahk, Youn-Sic Chun, Ji-Man Park, and Minji Kim. 2017. "Analysis on the Accuracy of Intraoral Scanners: The Effects of Mandibular Anterior Interdental Space" Applied Sciences 7, no. 7: 719. https://doi.org/10.3390/app7070719
Note that from the first issue of 2016, this journal uses article numbers instead of page numbers. See further details here.