
Ideal Operation of a Photovoltaic Power Plant Equipped with an Energy Storage System on Electricity Market

Abstract
:1. Introduction
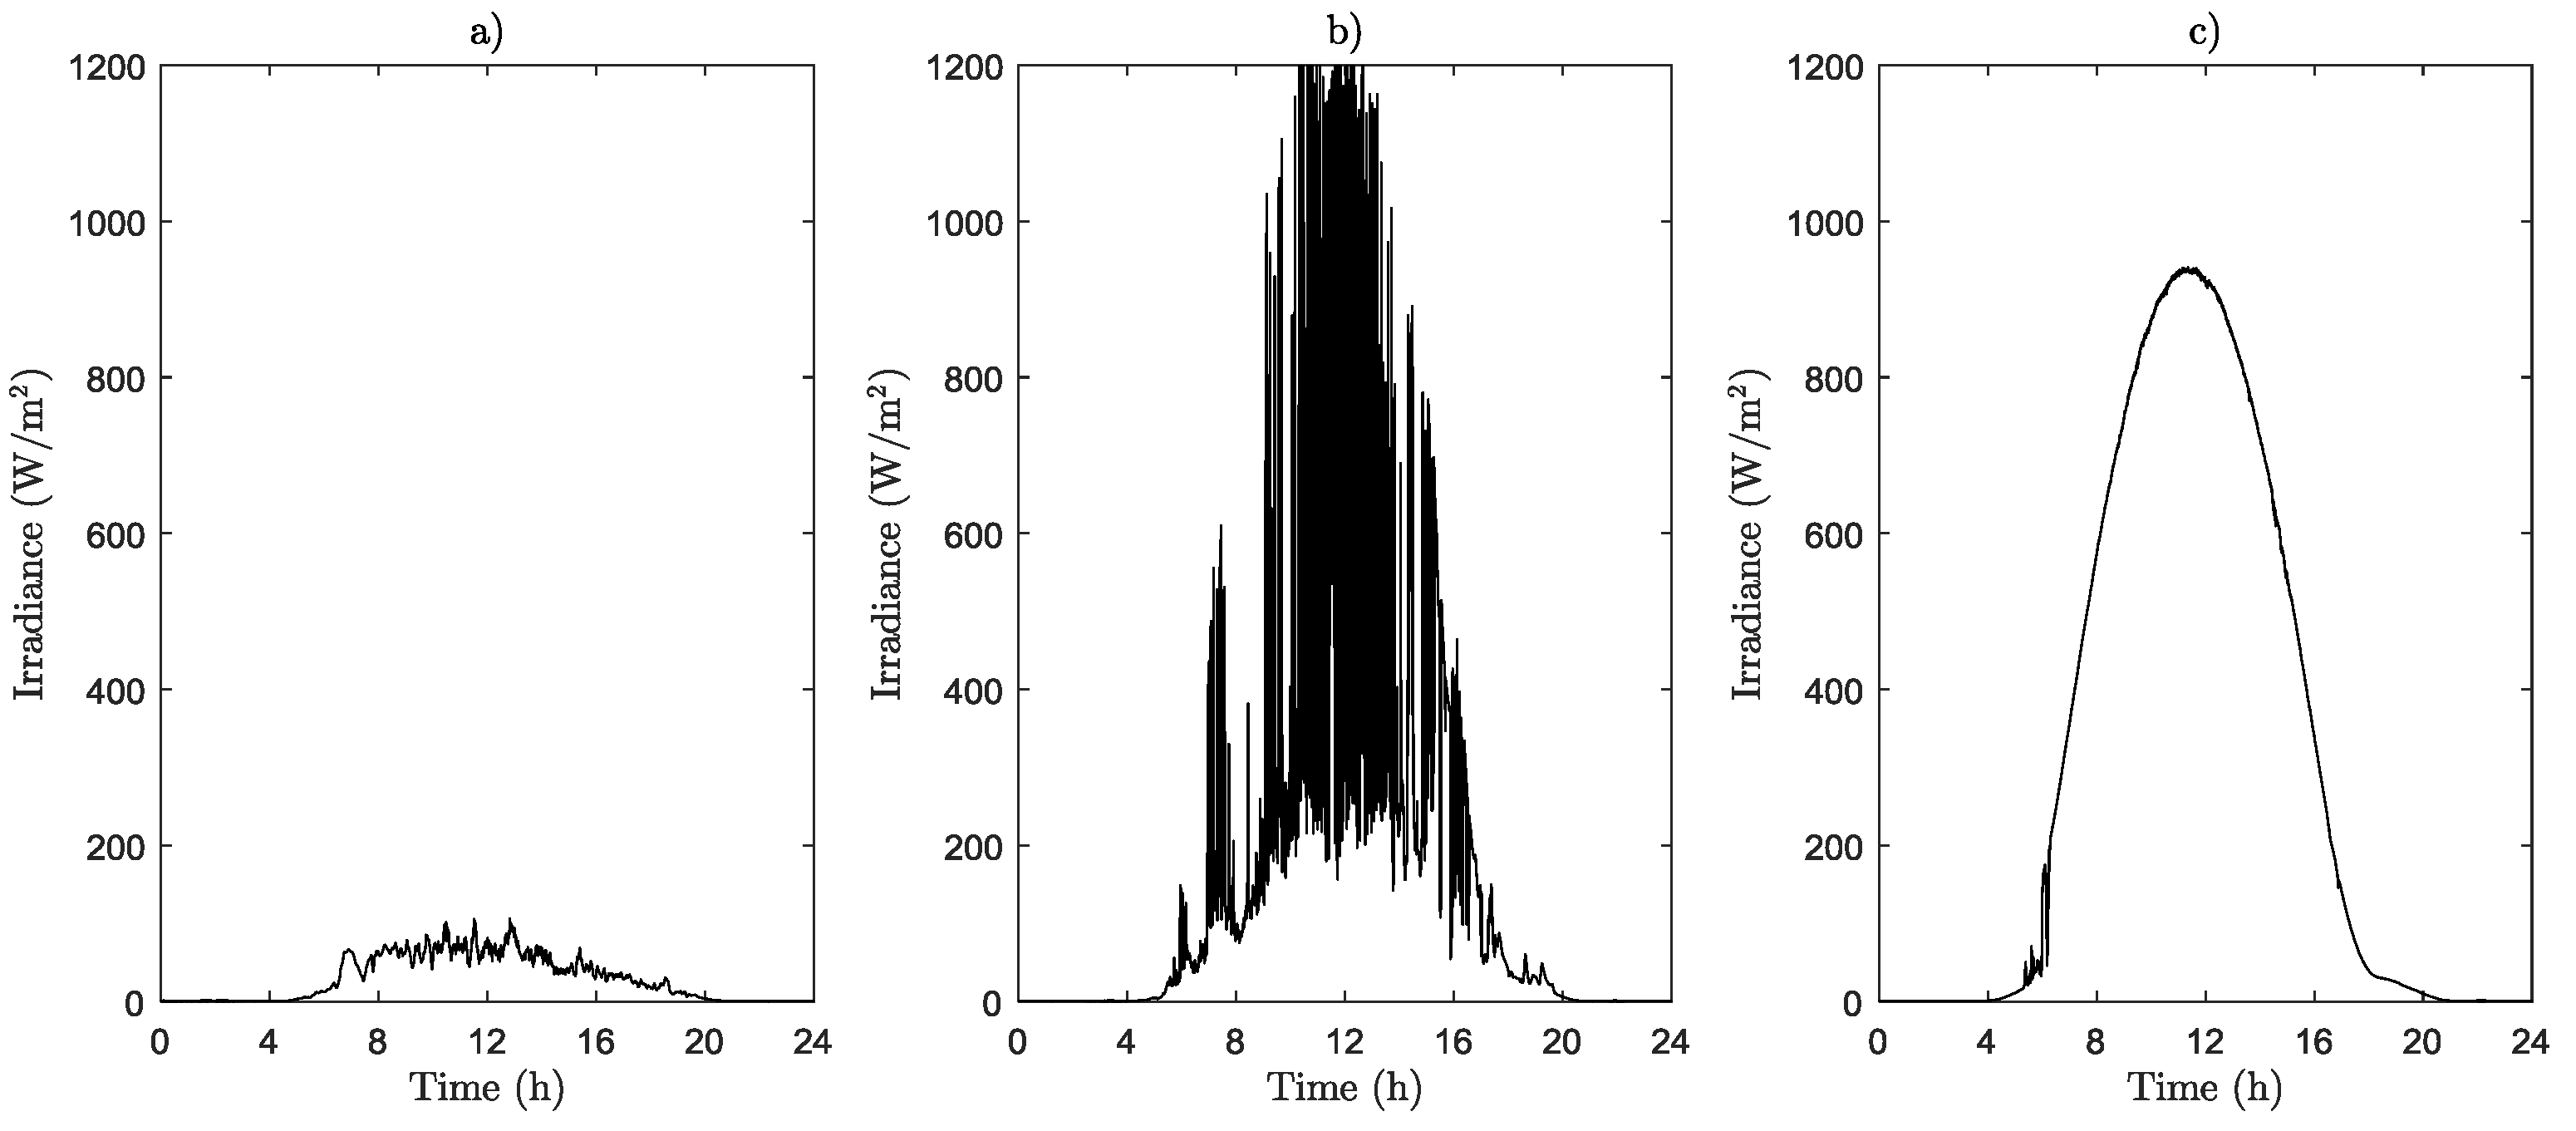
2. Measurement Data
3. Method of Analysis
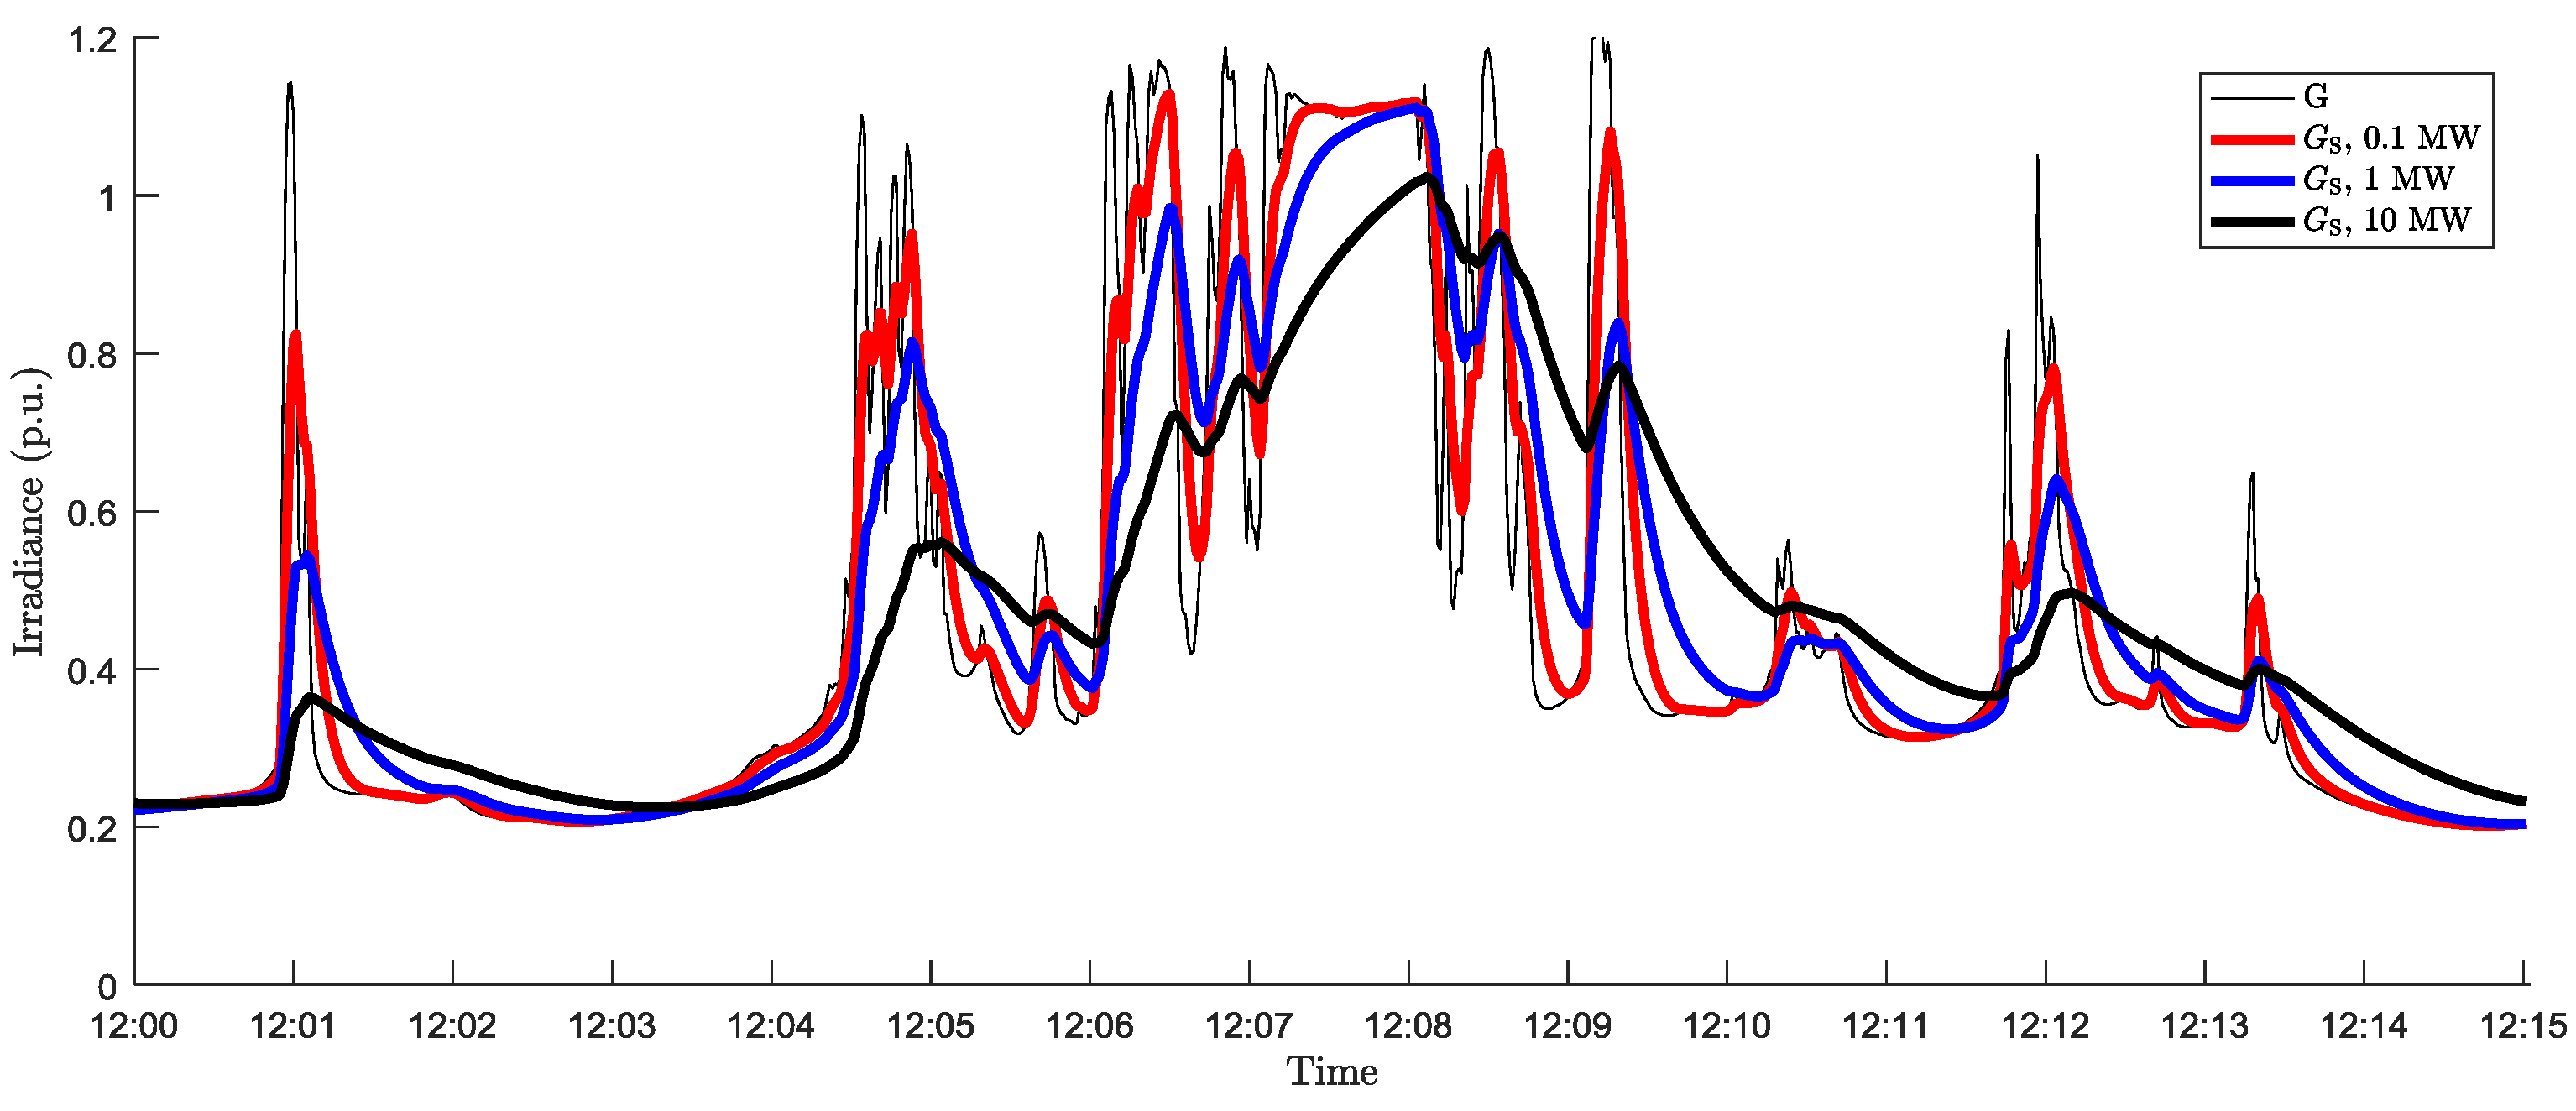
3.1. PV Generator Model
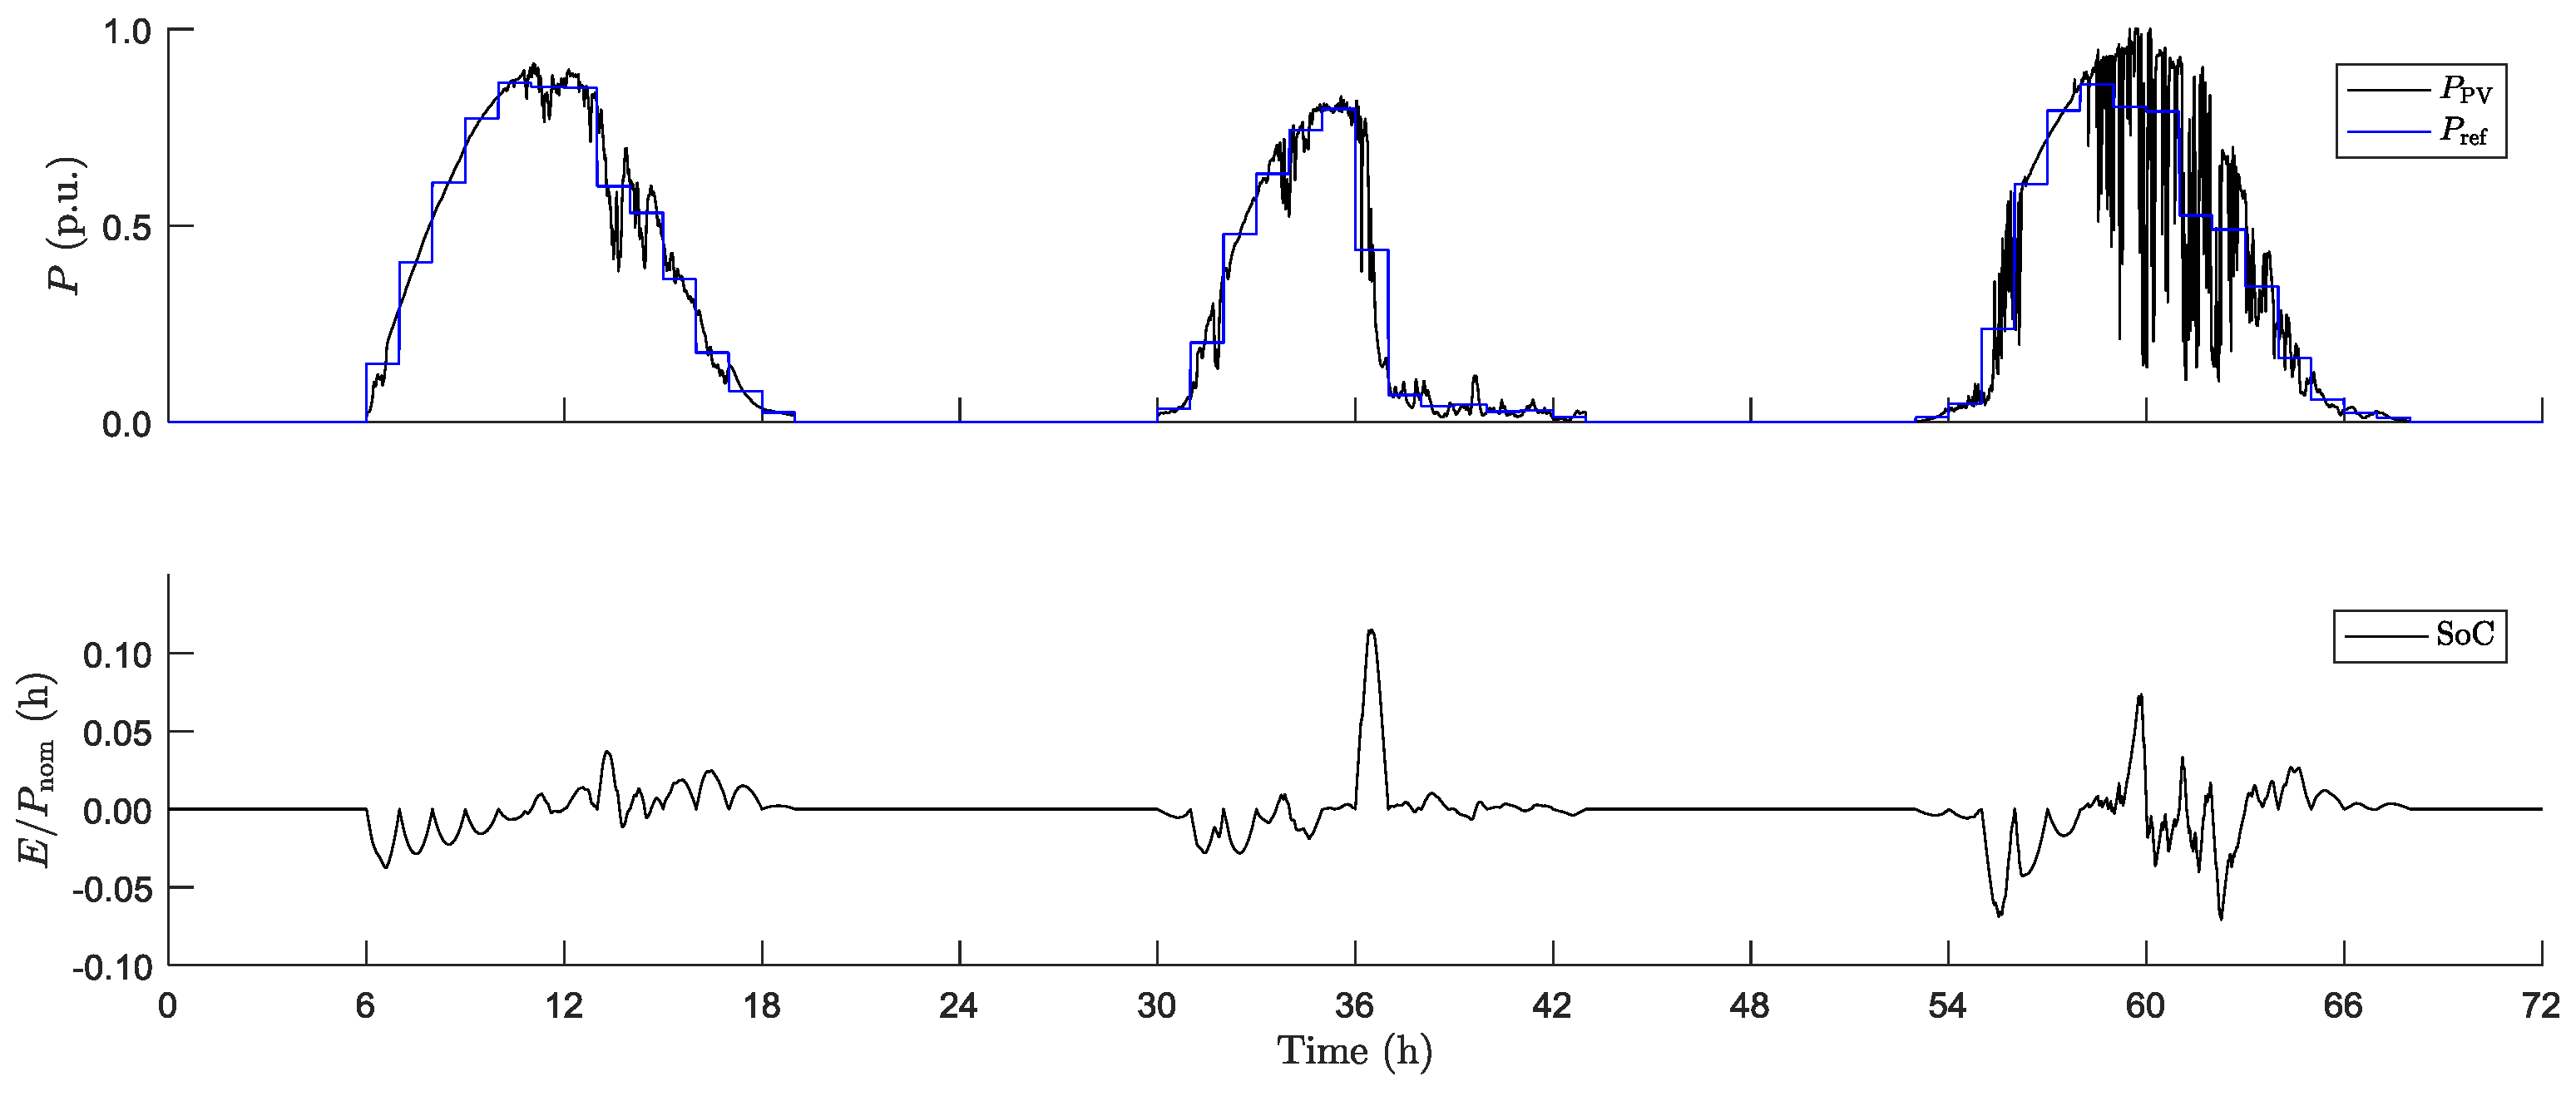
3.2. Electricity Production Forecasting and Spot Markets
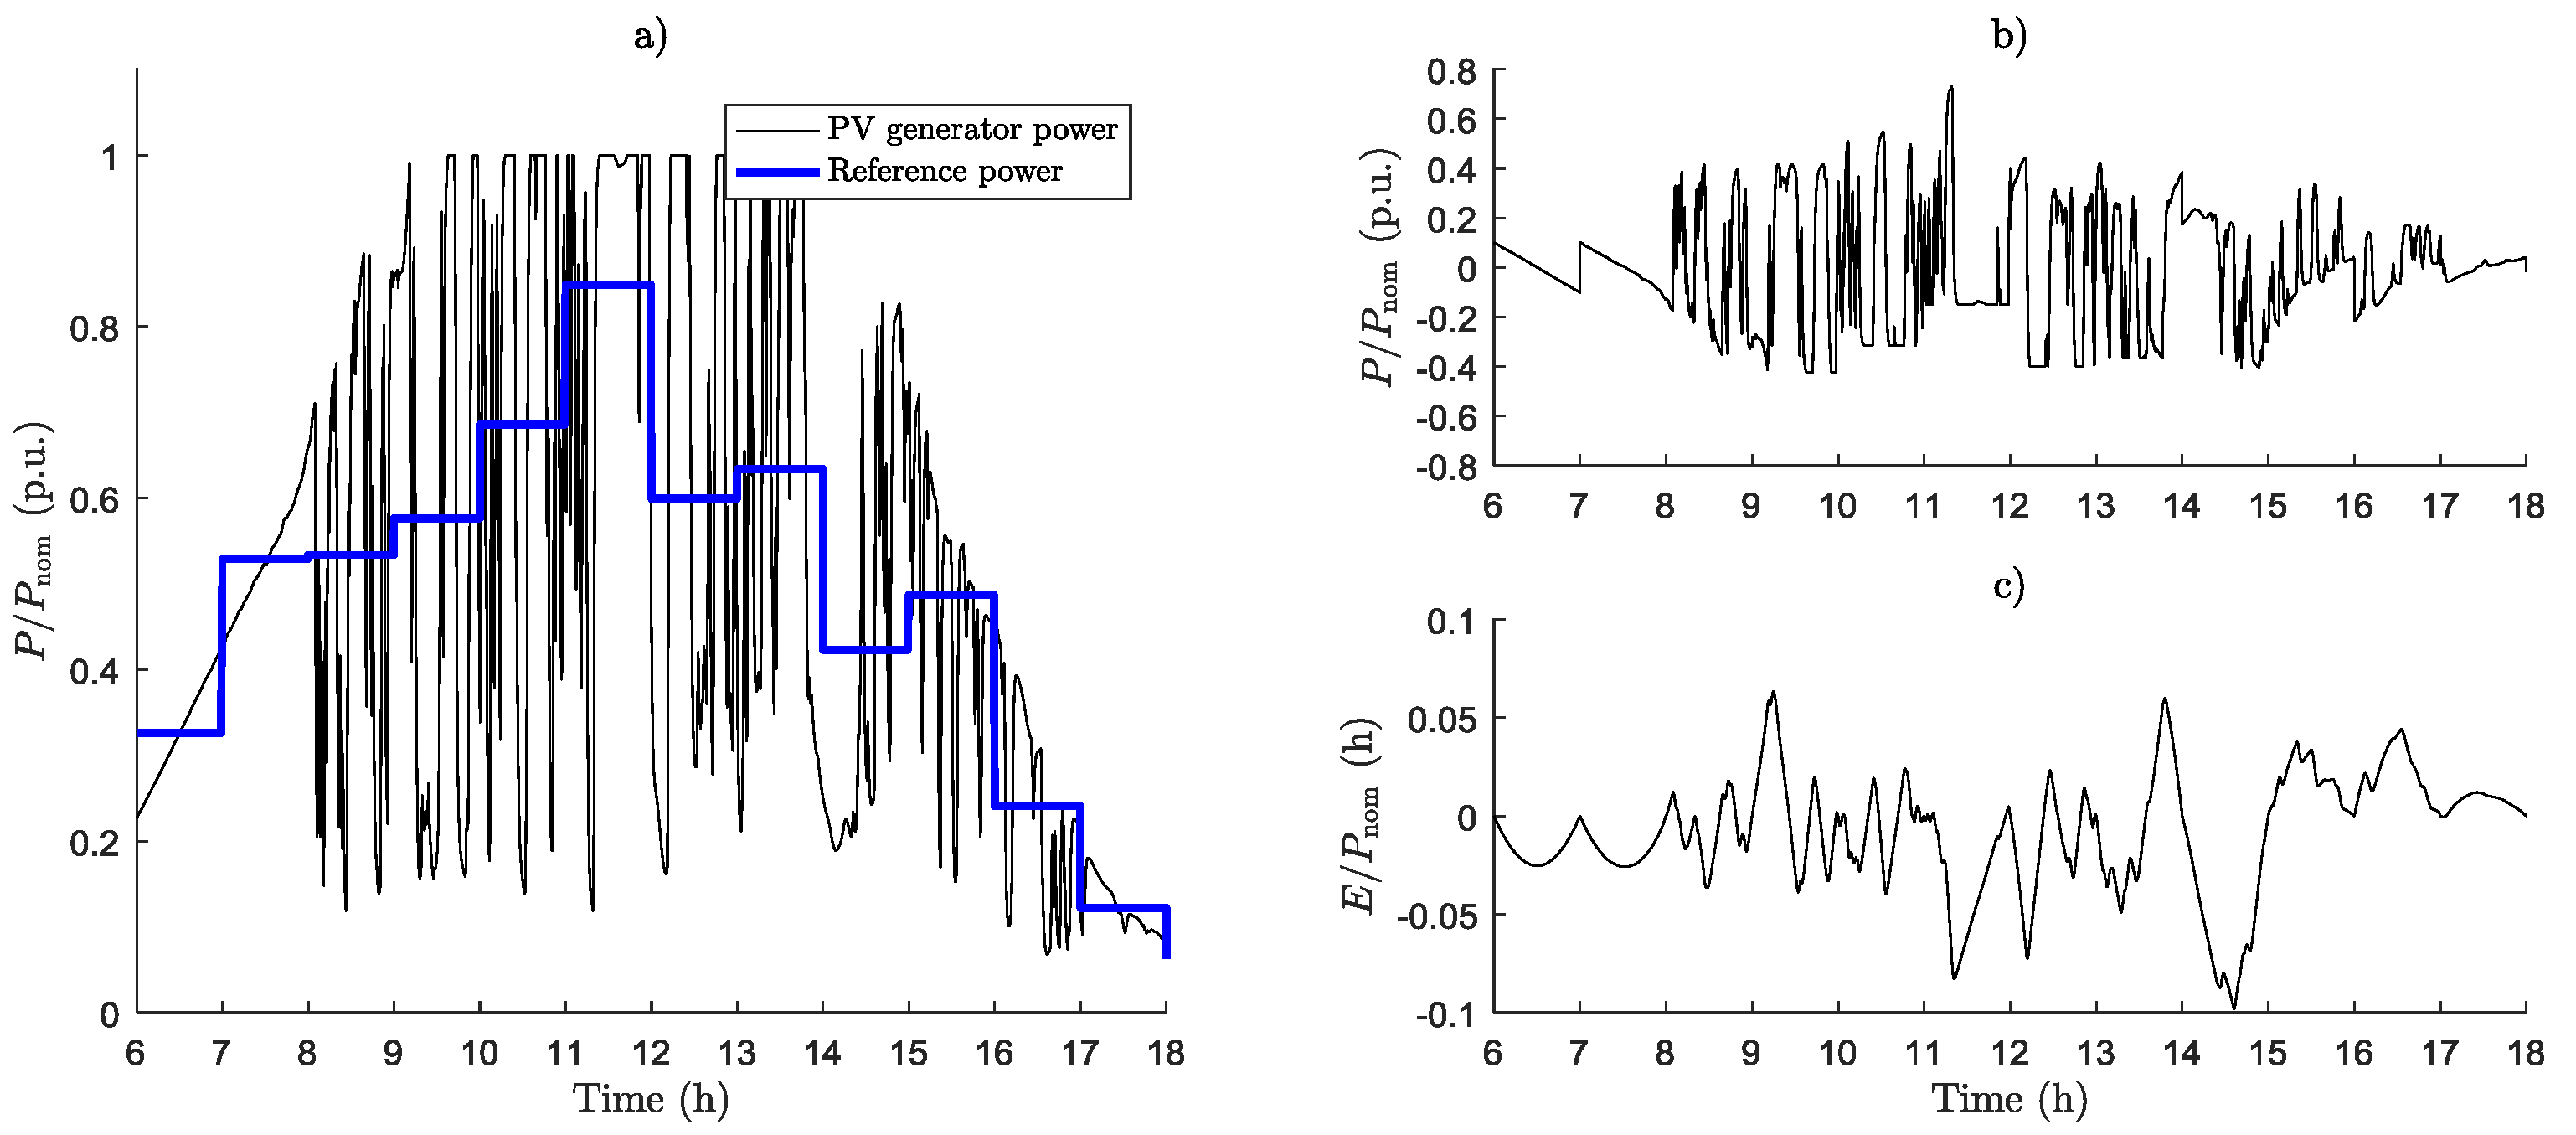
3.3. Energy Storage Model
4. Results
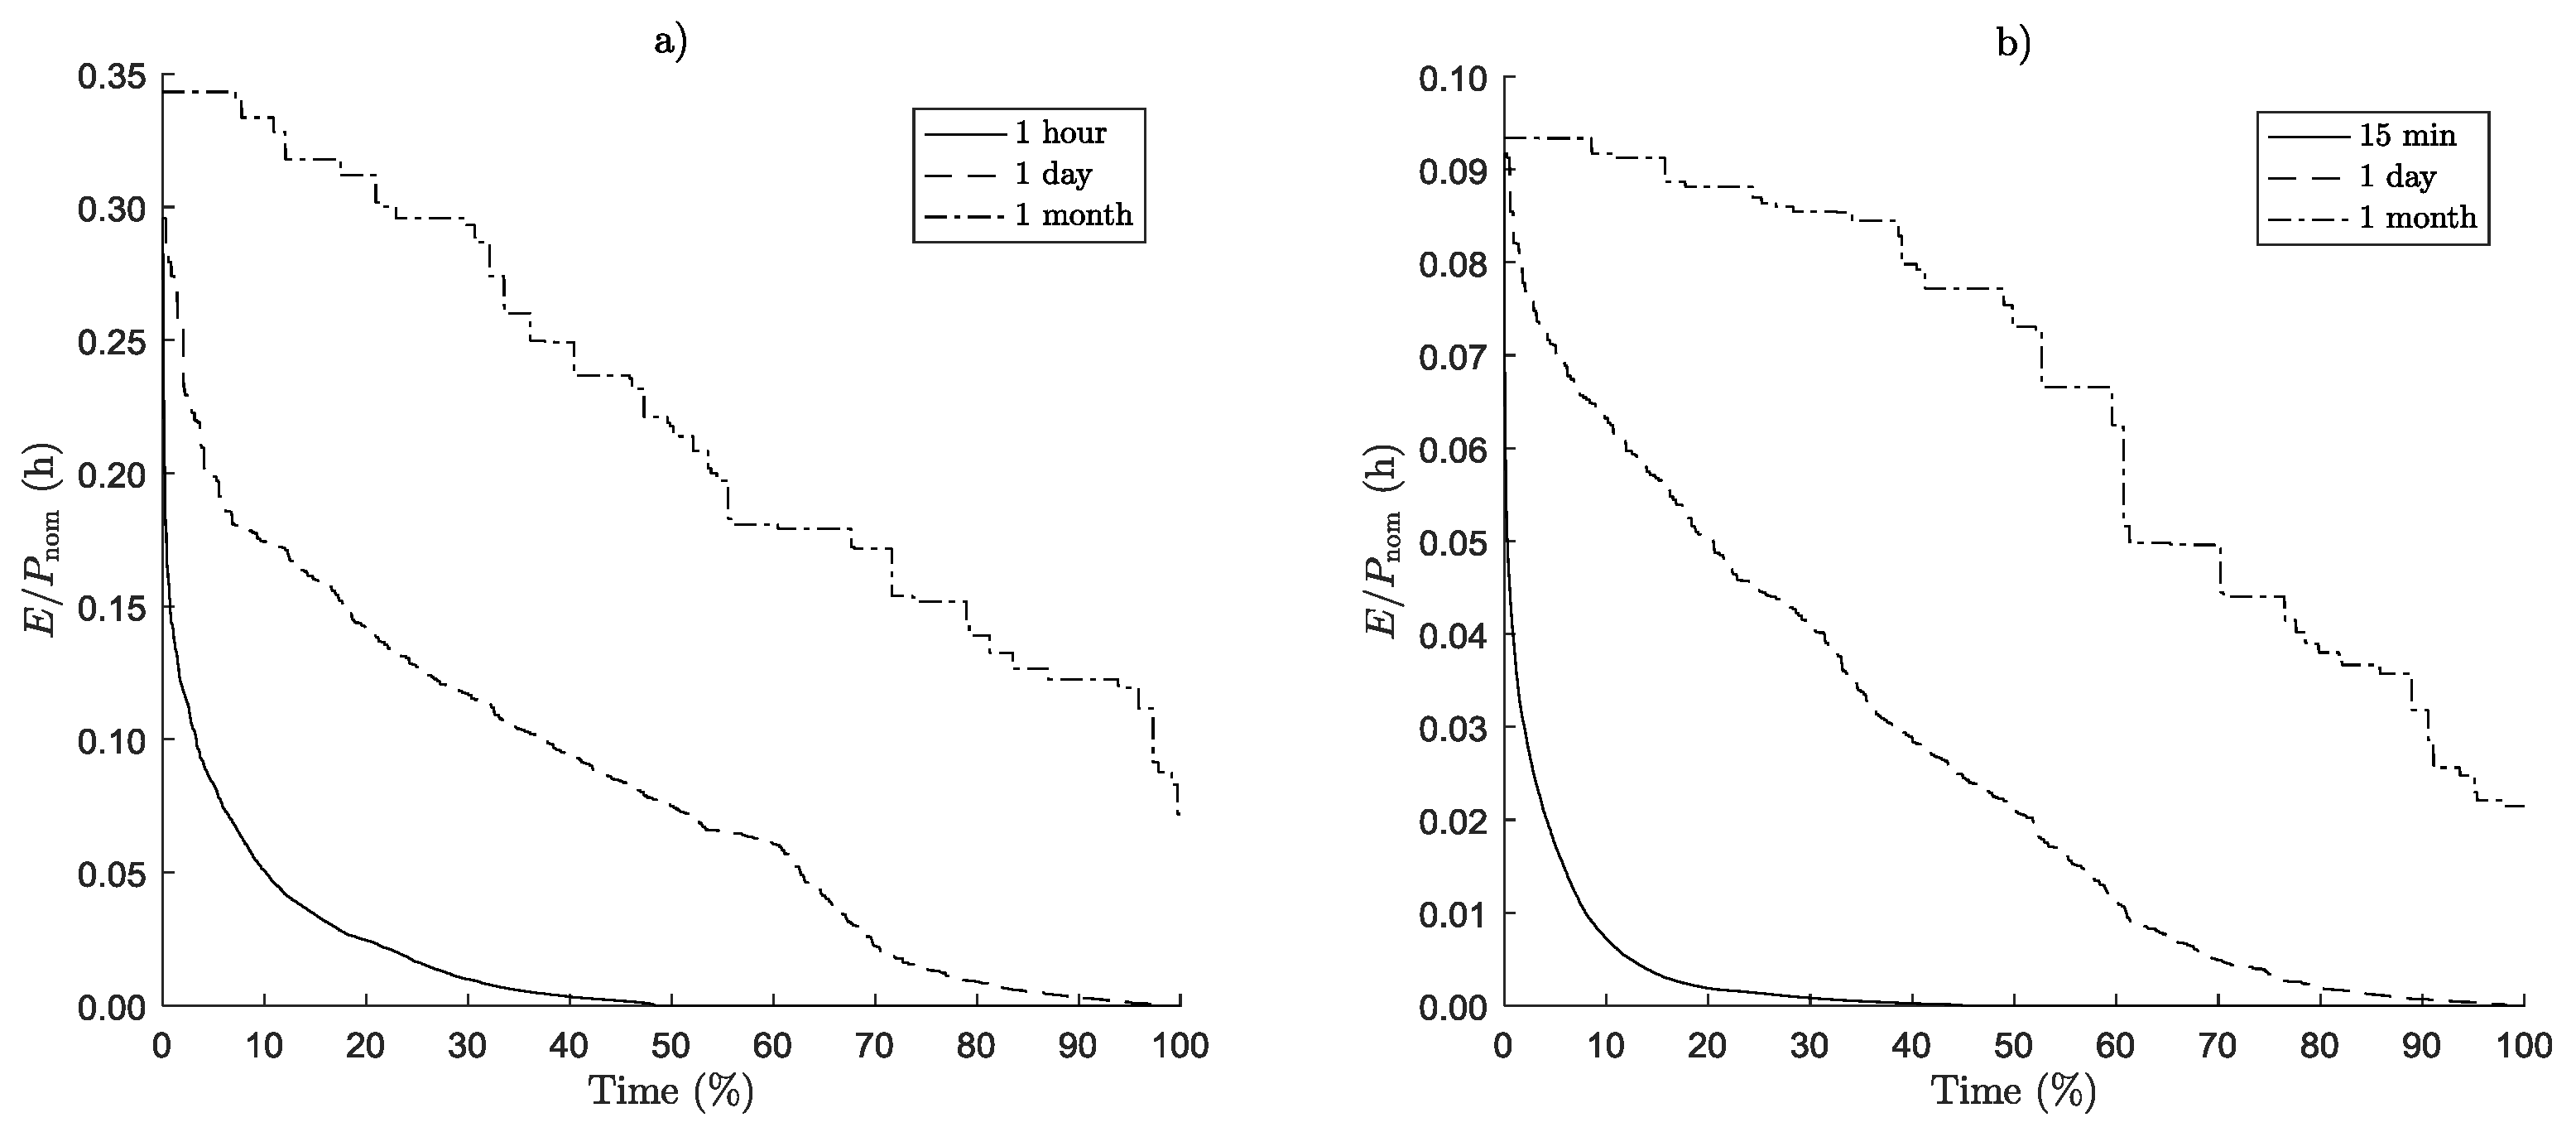
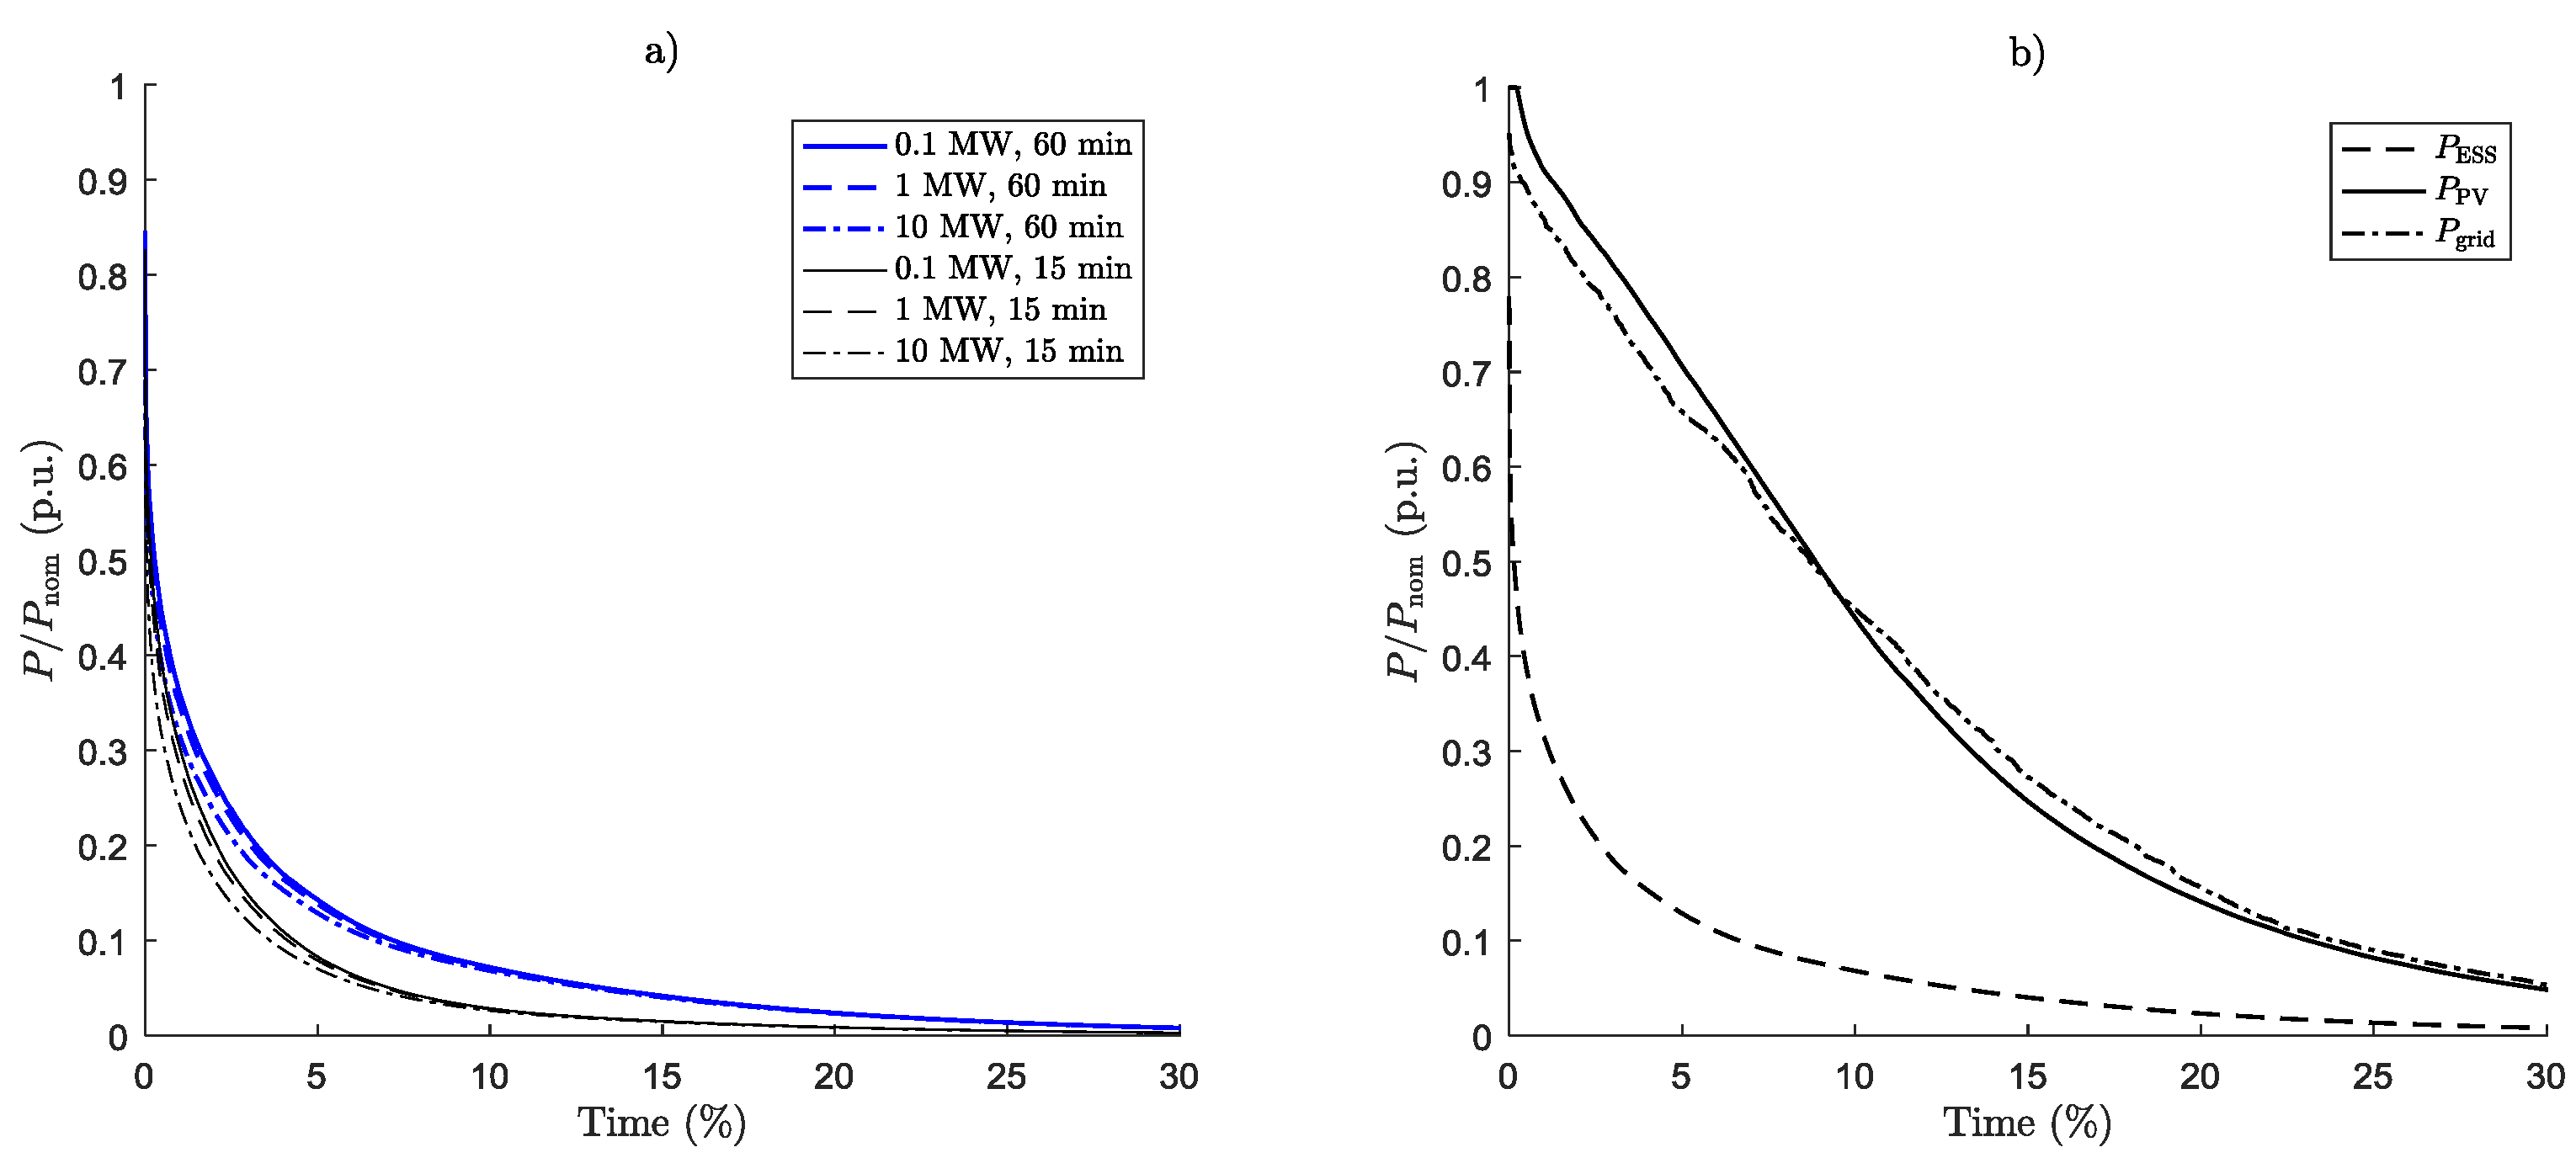
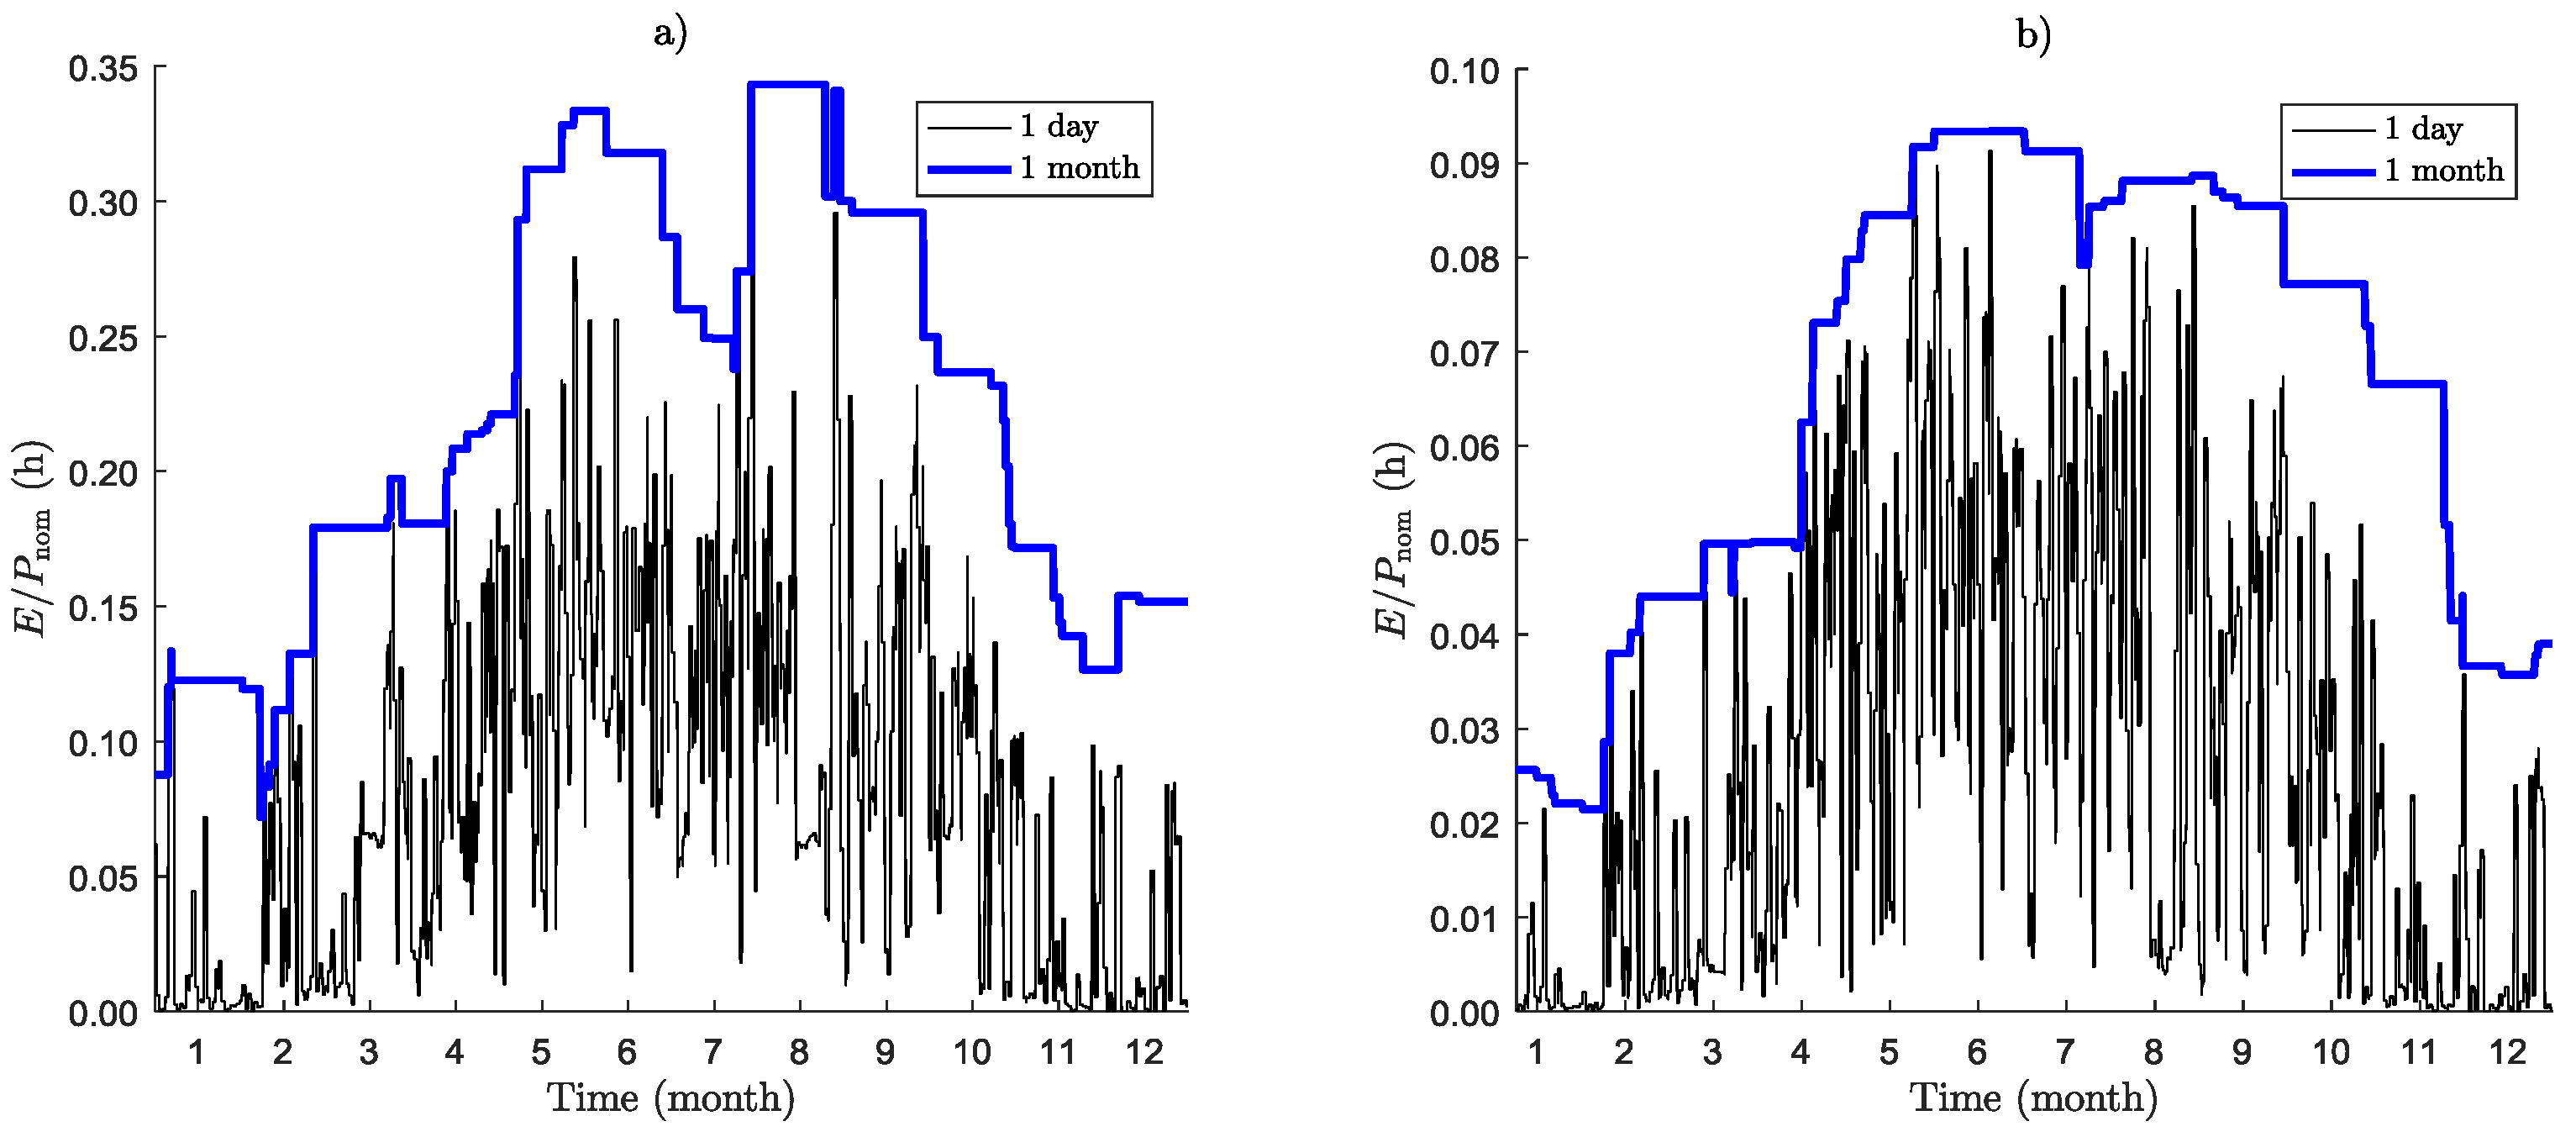
4.1. Energy Storage System Requirements
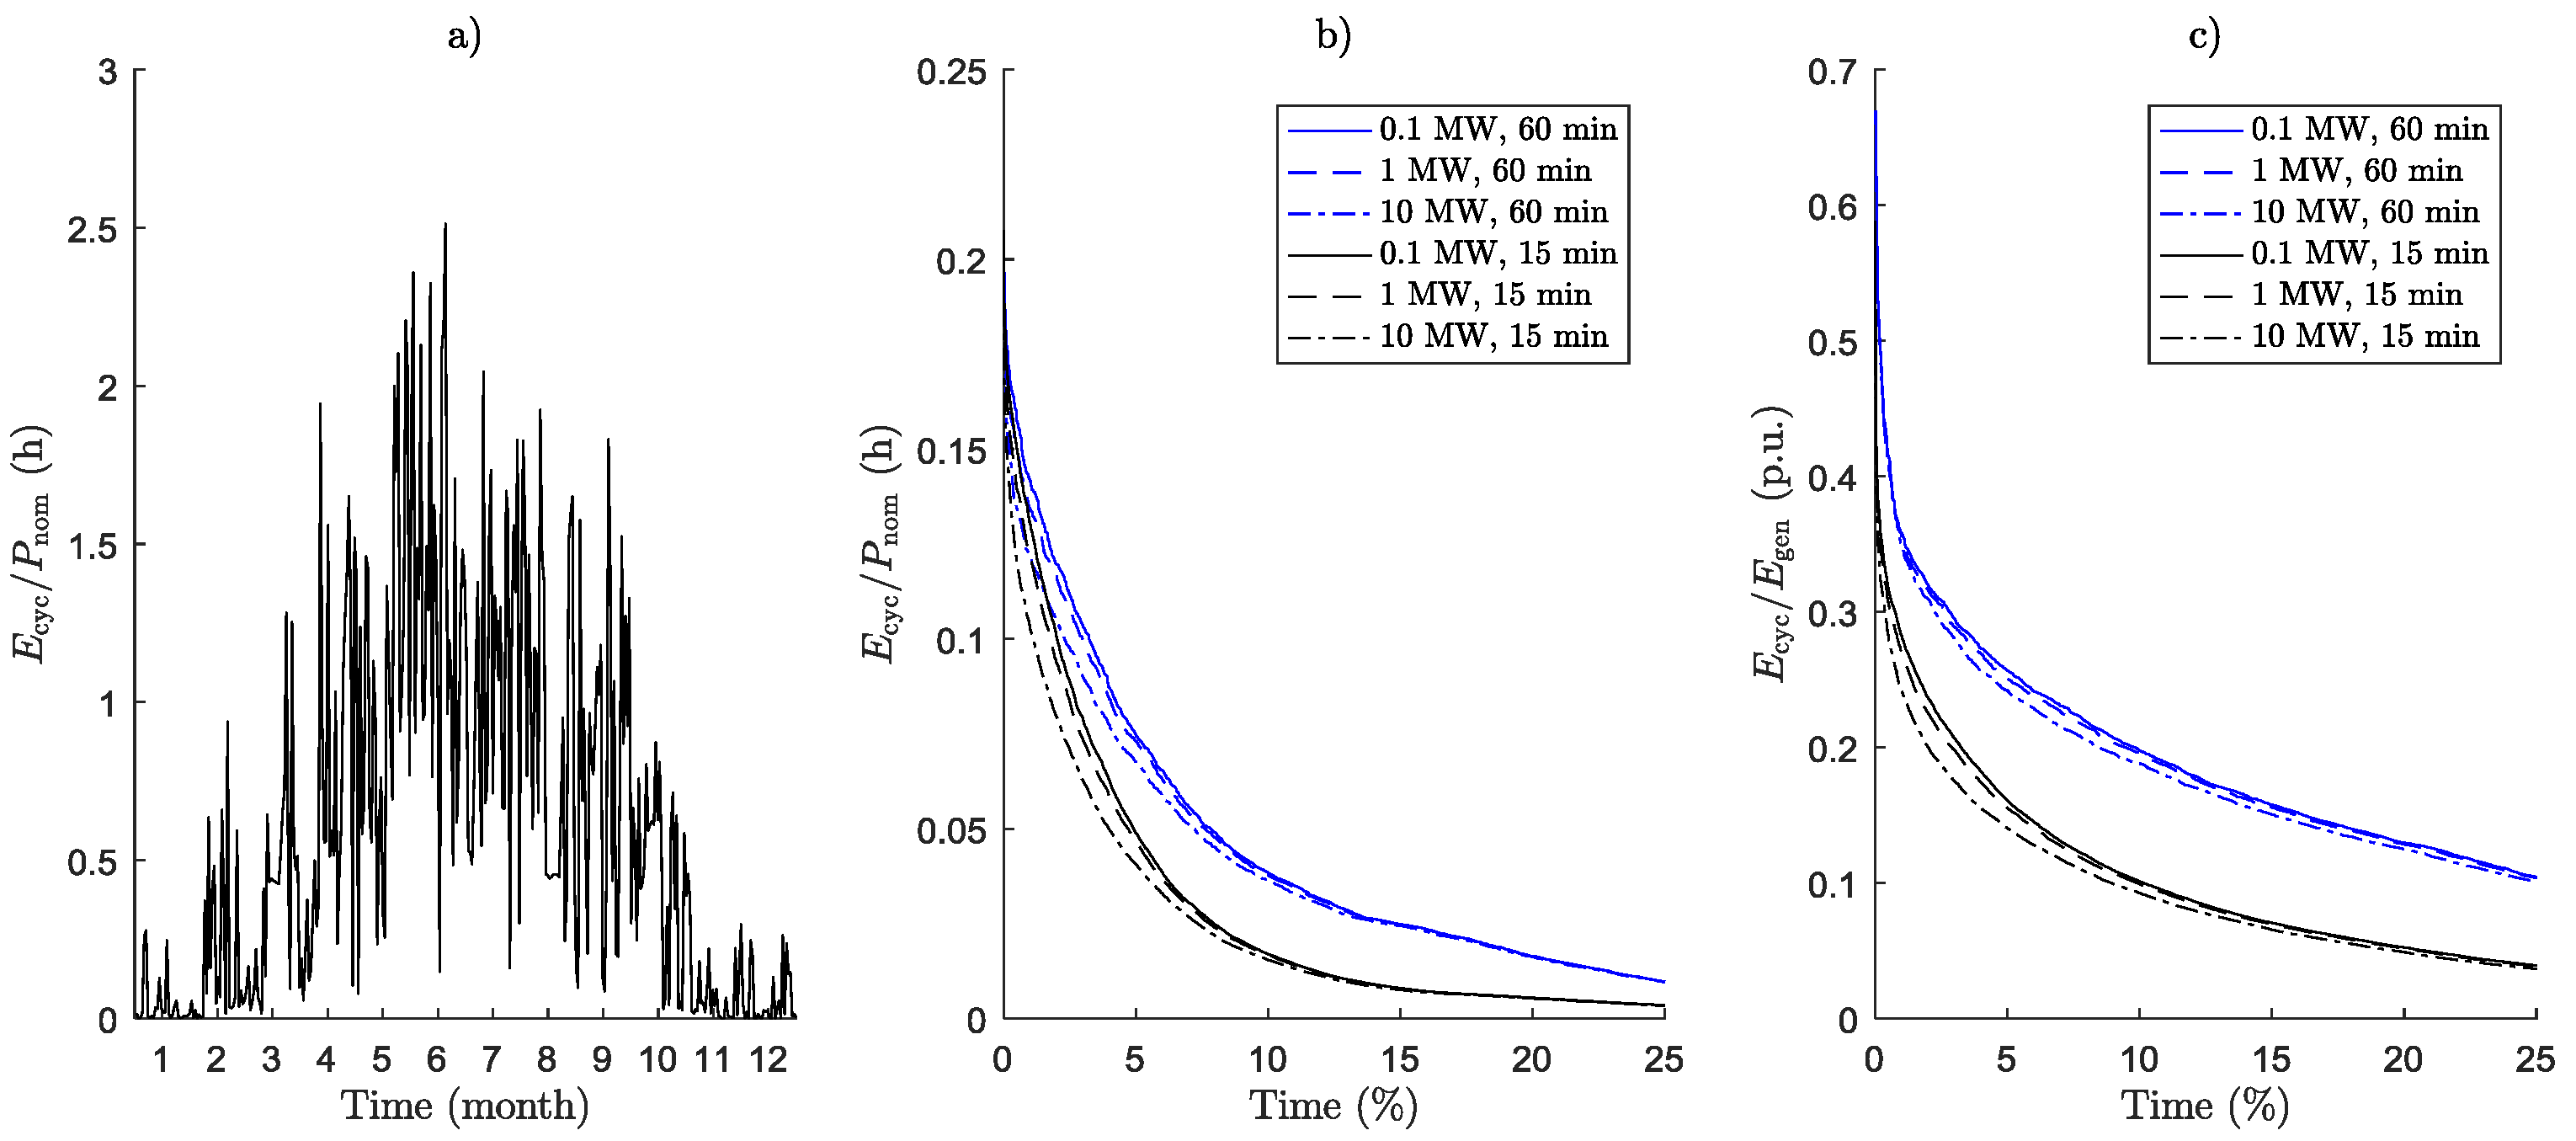
4.2. Energy Cycling Analysis
5. Conclusions
Acknowledgments
Author Contributions
Conflicts of Interest
References
- Jäger-Waldau, A. PV Status Report 2016, Joint Research Centre; Publication Office of the European Union: Brussels, Belgium, 2016. [Google Scholar]
- Lappalainen, K.; Valkealahti, S. Output power variation of different PV array configurations during irradiance transitions caused by moving clouds. Appl. Energy 2017, 190, 902–910. [Google Scholar] [CrossRef]
- Marcos, J.; Marroyo, L.; Lorenzo, E.; García, M. Smoothing of PV power fluctuations by geographical dispersion. Prog. Photovol. Res. Appl. 2012, 20, 226–237. [Google Scholar] [CrossRef] [Green Version]
- European Commission. Proposal for a Regulation of the European Parliament and of the Council on the Internal Market for Electricity. Available online: http://eur-lex.europa.eu/legal-content/EN/TXT/?uri=COM:2016:861:FIN (assessed on 16 June 2017).
- Gevorgian, V.; Booth, S. Review of PREPA Technical Requirements for Interconnecting Wind and Solar Generation; NREL/TP-5D00-57089; National Renewable Energy Laboratory (NREL): Golden, CO, USA, 2013.
- Technical regulation 3.2.5 for wind power plants above 11 kW. Energinet.DK: Erritsø, Denmark, 2016.
- Palizban, O.; Kauhaniemi, K. Energy storage systems in modern grids—Matrix of technologies and applications. J. Energy Storage 2016, 6, 248–259. [Google Scholar] [CrossRef]
- Graditi, G.; Ippolito, M.G.; Telaretti, E.; Zizzo, G. Technical and economical assessment of distributed electrochemical storages for load shifting applications: An Italian case study. Renew. Sustain. Energy Rev. 2016, 57, 515–523. [Google Scholar] [CrossRef]
- Amirante, R.; Cassone, E.; Distaso, E.; Tamburrano, P. Overview on recent developments in energy storage: Mechanical, electrochemical and hydrogen technologies. Energy Convers. Manag. 2017, 132, 372–387. [Google Scholar] [CrossRef]
- Marcos, J.; Storkël, O.; Marroyo, L.; Garcia, M.; Lorenzo, E. Storage requirements for PV power ramp-rate control. Sol. Energy 2014, 99, 28–35. [Google Scholar] [CrossRef]
- Wang, G.; Ciobotaru, M.; Agelidis, V.G. Optimal capacity design for hybrid energy storage system supporting dispatch of large-scale photovoltaic power plant. J. Energy Storage 2015, 3, 25–35. [Google Scholar] [CrossRef]
- Lobera, D.T.; Mäki, A.; Huusari, J.; Lappalainen, K.; Suntio, T.; Valkealahti, S. Operation of TUT solar PV power station research plant under partial shading caused by snow and buildings. Int. J. Photoenergy 2013, 2013. [Google Scholar] [CrossRef]
- Ong, S.; Campbell, C.; Denholm, P.; Margolis, R.; Heath, G. Land-Use Requirements for Solar Power Plants in the United States; NREL/TP-6A20-56290; National Renewable Energy Laboratory (NREL): Golden, CO, USA, 2013.
- Marcos, J.; Marroyo, L.; Lorenzo, E.; Alvira, D.; Izco, E. From irradiance to output power fluctuations: The PV plant as a low pass filter. Prog. Photovolt. Res. Appl. 2011, 19, 505–510. [Google Scholar] [CrossRef] [Green Version]
- Schnabel, J.; Valkealahti, S. Energy Storage Requirements for PV Power Ramp Rate Control in Northern Europe. Int. J. Photoenergy 2016, 2016. [Google Scholar] [CrossRef]
- Raza, M.; Nadarajah, M.; Ekanayake, C. On recent advances in PV output power forecast. Sol. Energy 2016, 136, 125–144. [Google Scholar] [CrossRef]
- Nord Pool—The Power Market. Available online: http://www.nordpoolspot.com/How-does-it-work/ (accessed on 18 May 2017).
- Tapakis, R.; Charalambides, A.G. Enhanced values of global irradiance due to the presence of clouds in Eastern Mediterranean. Renew. Energy 2014, 62, 459–467. [Google Scholar] [CrossRef]
- Wang, G.; Ciobotaru, M.; Agelidis, V.G. Power Smoothing of Large Solar PV Plant Using Hybrid Energy Storage. IEEE Trans. Sustain. Energy 2014, 5, 834–842. [Google Scholar] [CrossRef]


| PV Generator Size (MW) | EESS/Pnom (h) | PESS/ Pnom (p.u.) | ||
|---|---|---|---|---|
| 60 min ISP | 15 min ISP | 60 min ISP | 15 min ISP | |
| 0.1 | 0.36 | 0.093 | 0.85 | 0.83 |
| 1 | 0.36 | 0.093 | 0.78 | 0.78 |
| 10 | 0.36 | 0.091 | 0.78 | 0.75 |
| PV Generator Size (MW) | Ecyc/Etot (p.u.) | |
|---|---|---|
| 60 min ISP | 15 min ISP | |
| 0.1 | 0.12 | 0.071 |
| 1 | 0.11 | 0.068 |
| 10 | 0.11 | 0.060 |
© 2017 by the authors. Licensee MDPI, Basel, Switzerland. This article is an open access article distributed under the terms and conditions of the Creative Commons Attribution (CC BY) license (http://creativecommons.org/licenses/by/4.0/).
Share and Cite
Järvelä, M.; Valkealahti, S. Ideal Operation of a Photovoltaic Power Plant Equipped with an Energy Storage System on Electricity Market. Appl. Sci. 2017, 7, 749. https://doi.org/10.3390/app7070749
Järvelä M, Valkealahti S. Ideal Operation of a Photovoltaic Power Plant Equipped with an Energy Storage System on Electricity Market. Applied Sciences. 2017; 7(7):749. https://doi.org/10.3390/app7070749
Chicago/Turabian StyleJärvelä, Markku, and Seppo Valkealahti. 2017. "Ideal Operation of a Photovoltaic Power Plant Equipped with an Energy Storage System on Electricity Market" Applied Sciences 7, no. 7: 749. https://doi.org/10.3390/app7070749
APA StyleJärvelä, M., & Valkealahti, S. (2017). Ideal Operation of a Photovoltaic Power Plant Equipped with an Energy Storage System on Electricity Market. Applied Sciences, 7(7), 749. https://doi.org/10.3390/app7070749