The Static Frictional Behaviors of Rubber for Pipe-Laying Operation

1
College of Mechanical and Transportation Engineering, China University of Petroleum, Beijing 102249, China
2
Laboratory of Tribology and Surface Engineering, China University of Petroleum, Beijing 102249, China
*
Author to whom correspondence should be addressed.
Appl. Sci. 2017, 7(8), 760; https://doi.org/10.3390/app7080760
Submission received: 9 June 2017
/
Revised: 7 July 2017
/
Accepted: 20 July 2017
/
Published: 26 July 2017
Abstract
:Featured Application
This research aims to reveal the static frictional behavior of rubber pipe contact systems during a pipe-laying operation. The testing results of friction facilitate the selection of appropriate contact pairs for tribological optimal design of the tensioner. The discussion about the instability of static friction is helping us to avoid pipe slipping accidents and to maintain accuracy of pipeline installations.
Abstract
Experimental research is carried out to reveal the static frictional behaviors of rubber pipe contact systems. This research is motivated by deep water pipe-laying operations where rubber blocks are used to clamp the pipe to supply sufficient static friction. Within this context, a friction testing instrument has been designed to mimic a situation of the beginning of the pipe-laying installation. Using this instrument, the maximum static friction forces (F) of a rubber pipe contact system are tested. The results show that the ultimate values of the static frictions fluctuate due to the increasing rate of the tangential load (FT). The evolution of contact between rubber and polymethyl methacrylate (PMMA) pipe is observed to identify the formation and propagation of the folds within the apparent contact area. In addition, it is confirmed that the evolution of contact is influenced by the folds and creep of the rubber surface. The creep deformation takes primary effect in accelerating the separation of the interfaces of contact during relative high normal loads (20, 30, 40 N) and low increasing rate of FT; whereas for all of the testing normal loads (10–40 N), the propagation of the folds release the energy which is stored in the interface of rubber when the increasing rate of FT is high. Therefore, the fluctuation of the maximum static friction of the contact system can be regarded as a consequence of interaction of the creep and folds. Furthermore, the instability of the coefficient of static friction in this test has been examined, and it indicated that the creep and folds could affect the static friction distinctly within a certain range of a normal load. This research is beneficial for arranging appropriate normal loads and laying speeds to avoid pipes slipping during a pipe-laying operation.
1. Introduction
Deep water pipe-laying is a standard industrial process for offshore pipeline installation or maintenance [1,2,3,4]. In addition, the tensioner is one of the key pieces of equipment for the pipe-laying operation. Rubber blocks are fixed on creeper treads of tensioner against a pipe wall with normal loading. The static friction between rubber blocks and the pipe wall is used to counteract the deadweight of pipeline [5]. Therefore, the contact between the rubber blocks and the pipe wall can be seen as a soft contact of static friction during the pipe-laying operation.
Rubber materials are working in great deformation due to their low elastic modulus when in contact with a rigid substrate. Tribological behaviors of rubber in soft contact is of paramount importance and have been widely investigated in many fields. It is well known that the friction force is related to the total area of real contact [6], and friction of rubber-steel contact is proportional to normal load, due to the increase in real contact zone [7]. Adhesion force is seen as a very important factor affecting rubber friction in certain contact conditions, because the molecular interaction forces within and around the contact area add the effect of the normal load. Johnson et al. [8] evolved an approach (the Johnson-Kendall-Roberts (JKR) theory) from the Hertz theory to estimate the mechanics of adhesive contact of elastic materials. Schallamach [9] observed a succession of adhesions and ruptures of the contact when rubber was sliding on a substrate plat at low velocity. These detachment waves were called Schallamach waves and they indicated that air tunnels which occurred on the interface of rubber was propagating across the contact area instead of slipping on the surface of the plat. Subsequent research, which was carried out by Fukahori et al. [10], focused on the essence between the Schallamach waves and stick-slip motion. According to Brörmann et al. [11], the detachment waves were also observed at the quasi-sliding stage, most of the waves vanishing during their propagation across the contact area due to the very low sliding velocity of the rubber.
In addition, systematic progresses have been achieved in the studies of the static frictional behaviors of rubber contact. Ghosh et al. [12] reported the phenomenon that the central adhesive zone and partial slipping zone appear in the apparent contact area, which is similar to the observations of Mindlin [13]. Persson et al. [14] discussed the nature of static friction and creep. Cho et al. revealed the mechanisms of static and kinetic friction of different contact pairs during sliding [15]. Loeve et al. [16] reported the static frictions of steel-rubber contacts in the field of fishing. Deladi et al. [17] proposed a static contact model to predict friction between rough rubber and metal surfaces. Furthermore, the fracture mechanics that were developed by Maugis et al. [18], Savkoor [19] and more recently to Scheibert et al. [20] or Audry and co-workers [21] have been used to discuss the separation of interfaces in the rubber-static frictional contact.
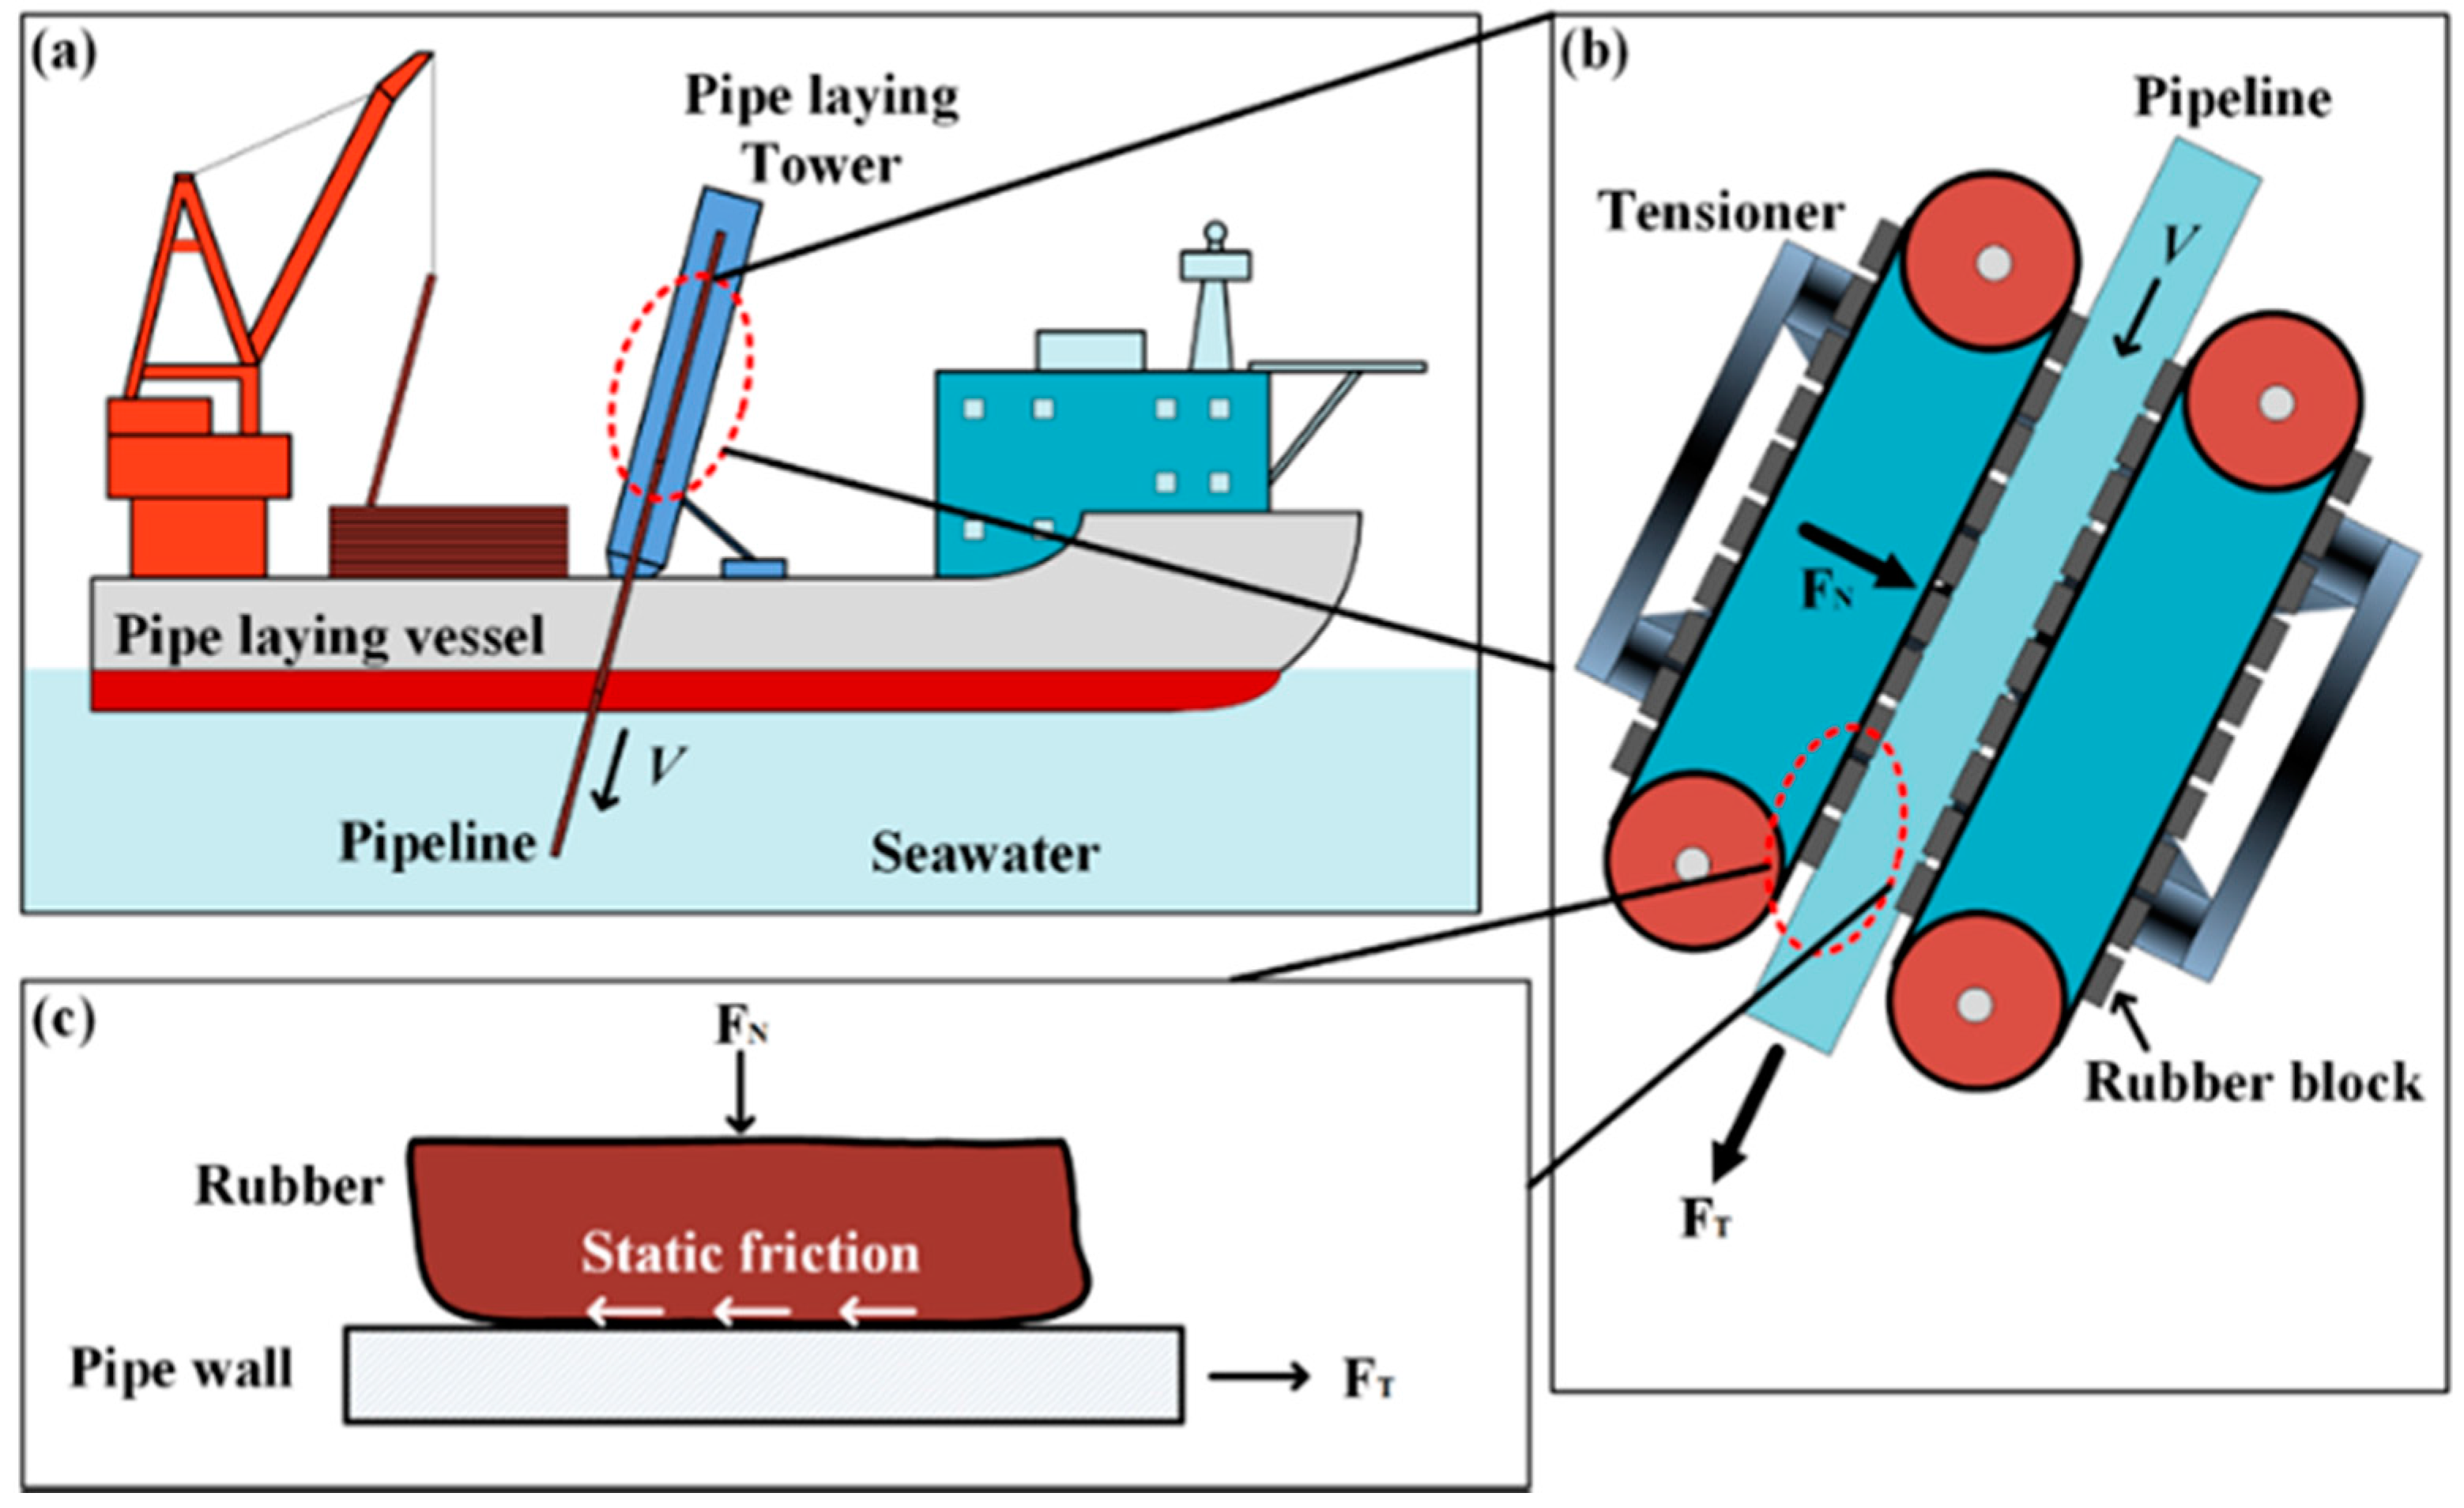
However, despite this progress, little attention has been paid to the project of static frictional behaviors of soft contact during deep water pipe-laying operations [22]. As is schematically shown in Figure 1, at the beginning of a pipe-laying operation, the pipeline is falling into the seawater by the pipe-laying tower with a preset velocity. The rubber blocks on the tensioner contact against the pipeline with a normal load and there is no relative displacement within the rubber-pipe contact system. The dead weight of the pipeline is increasing during the pipe-laying operation, therefore the tangential load (FT) in the rubber-pipe contact system increases with constant increasing rate. Little attention has been paid to the static frictional behaviors which are under different increasing rates of the tangential load. The knowledge of the static behaviors is of great importance for accurate control and safety of the pipe-laying operation.
In this work, a series of experiments for rubber pipe contact are set up with a self-built friction-testing instrument to uncover the static frictional behaviors under different loading processes. The deformation of the contact area which is caused by the tangential load has been discussed in detail.
2. Experimental
2.1. Samples
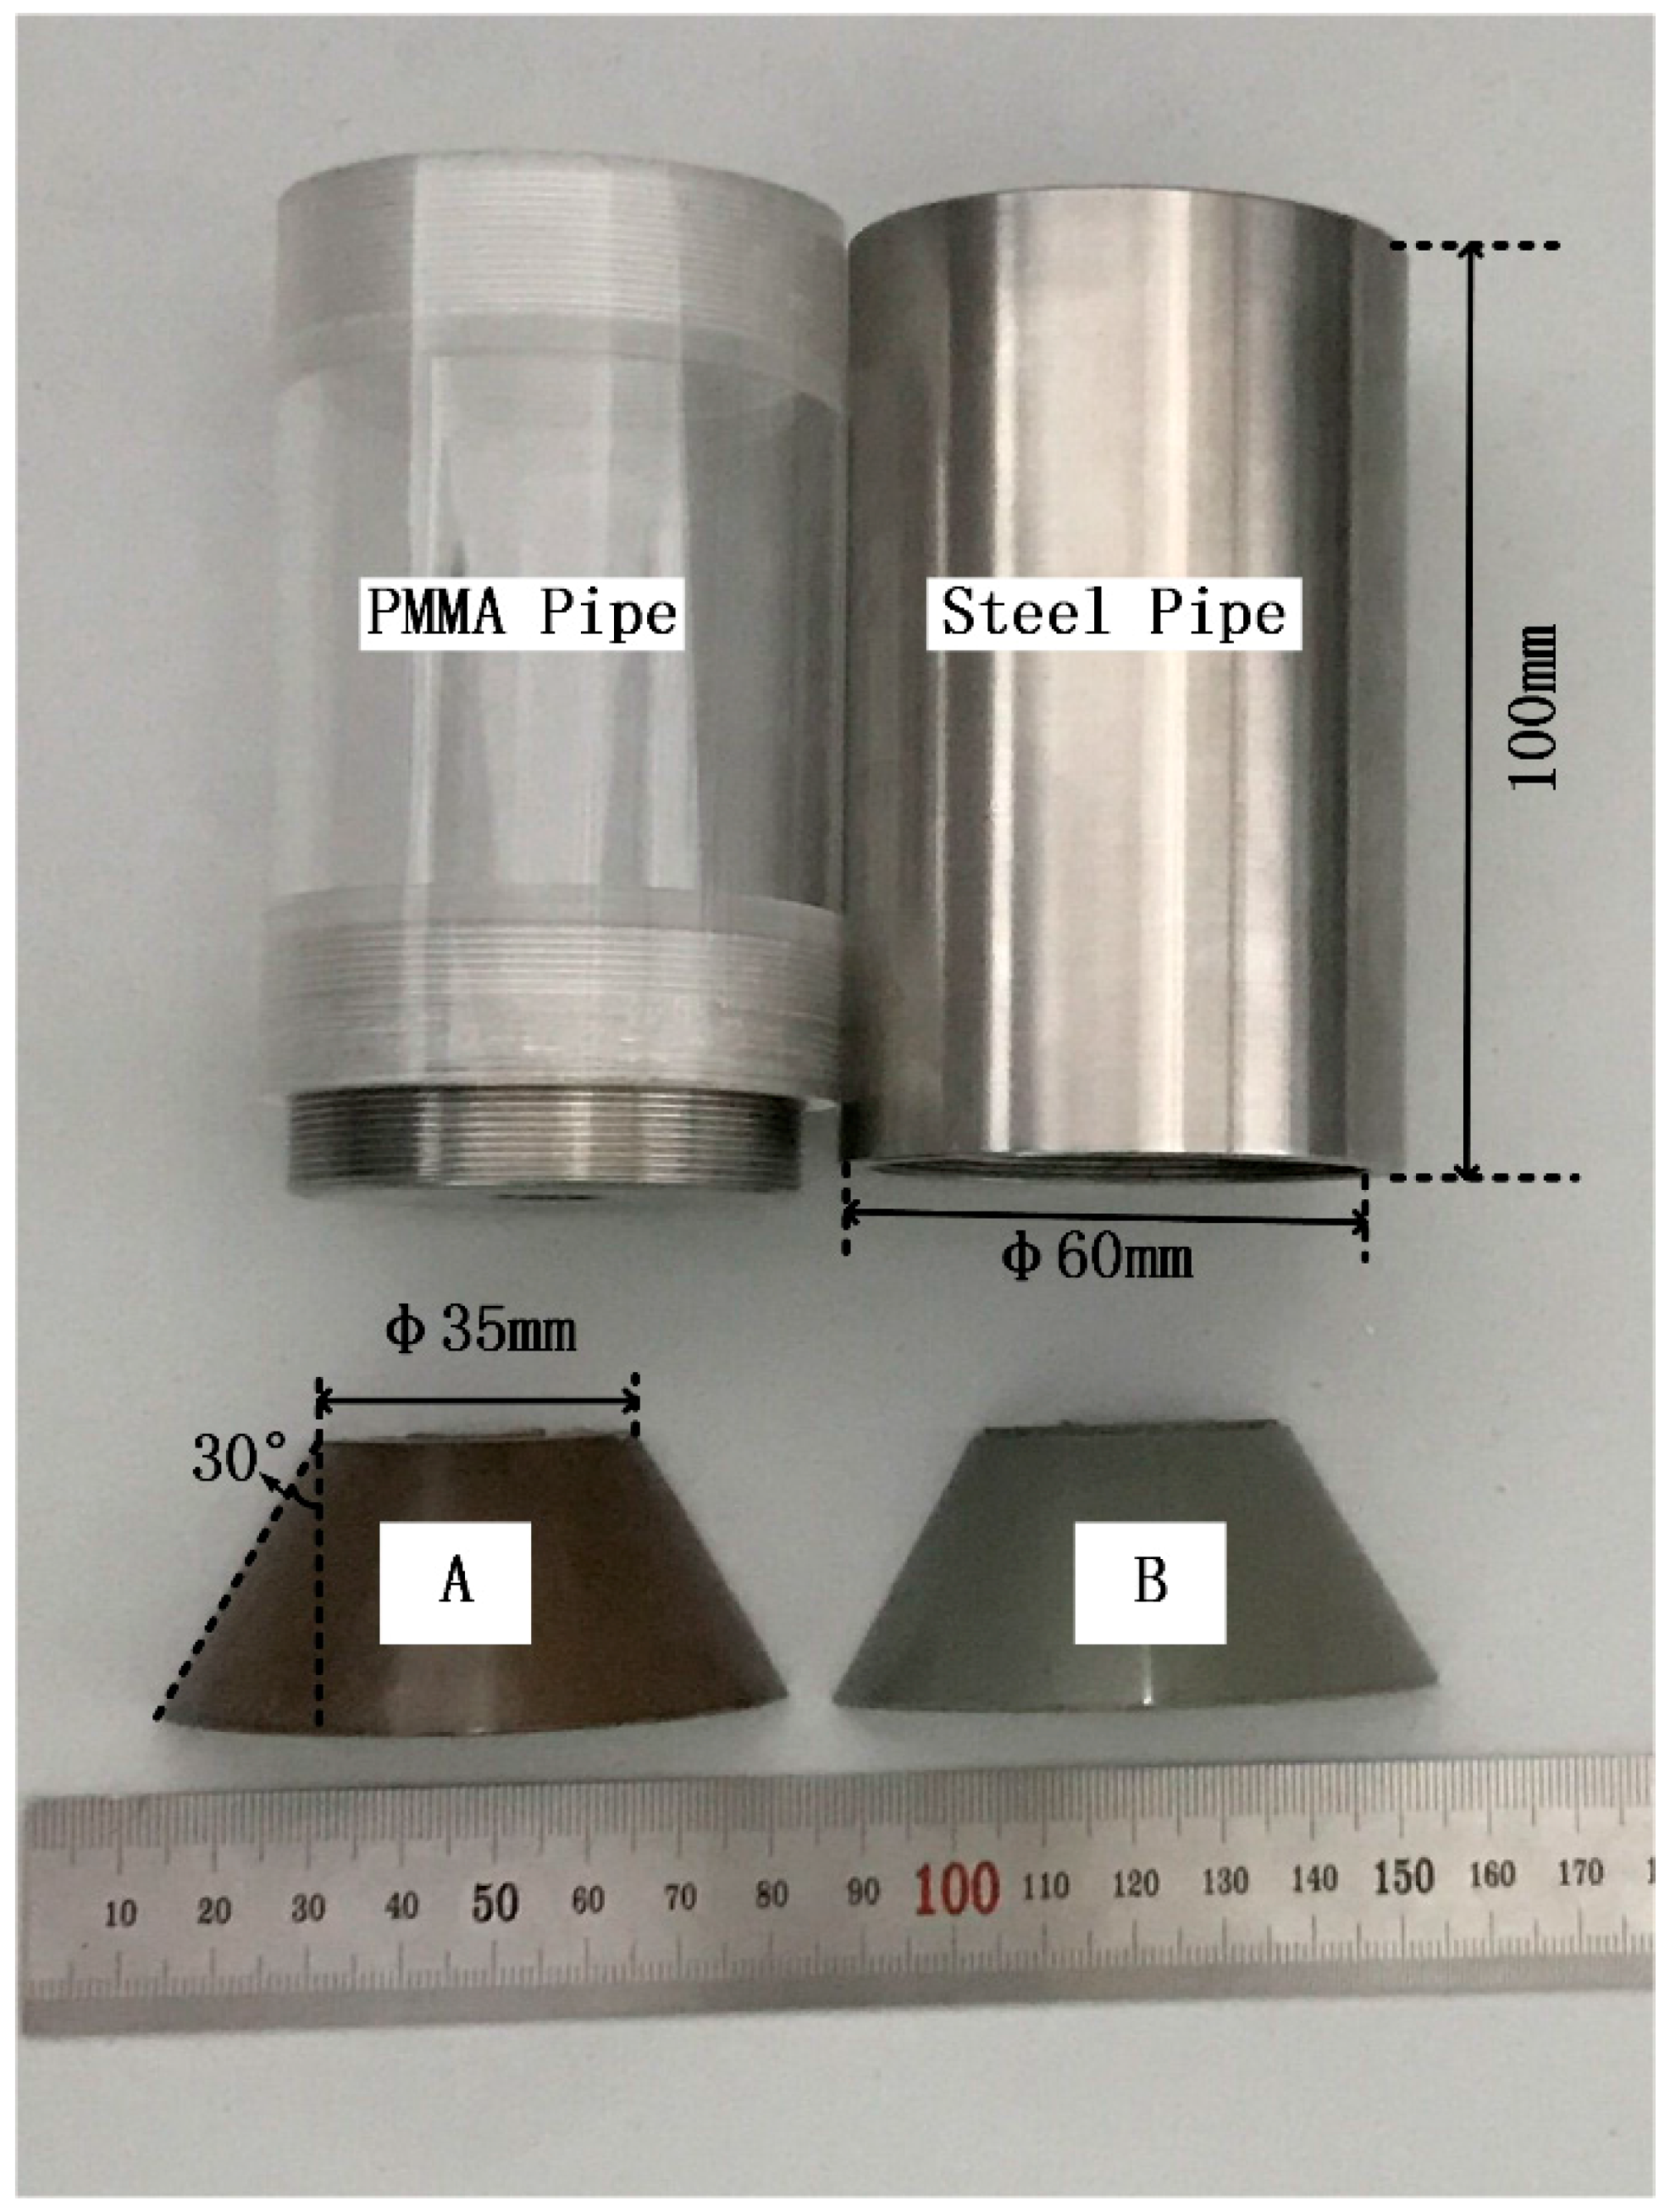
The shapes and dimensions of rubber and pipe samples are shown in Figure 2. In order to simulate conditions that rubber blocks are pressed against the pipe wall, the rubber samples are manufactured in a shape of half oblique frustum cone. Two types of rubber samples are selected to test in this research, they behave different in elastic modulus and hardness distinctly due to their different components [23]. Meanwhile, two types of pipe samples are used in tests, where steel pipe is made of X70 steel which is a common metal material for pipeline manufacture. The other pipe sample is made of polymethyl methacrylate (PMMA), which is widely used as transparent substrate in soft contact research to uncover the contact area. It is necessary to note that the PMMA pipe is not used in real pipe-laying operations; the rubber-PMMA tests aim to observe the contact area in situ to identify its evolution with increasing tangential load.
The surface roughness of the rubber and pipe samples are unified, respectively, so that the effect of roughness to the level of static friction can be neglected between different contact pairs. In addition, the values of roughness in average (Ra) and Root Mean Square (RMS) of rubber and pipe samples are measured by the roughness measuring machine, respectively (model LINKSTM 2205, Harbin Haliang Instrument Technology Co., Ltd., Harbin, China). The testing length is 0.25 mm, and the testing velocity is 0.1 mm/s. Table 1 and Table 2 list the mechanical properties of rubber and pipe samples, respectively.
2.2. Fricitional Testing Instrument
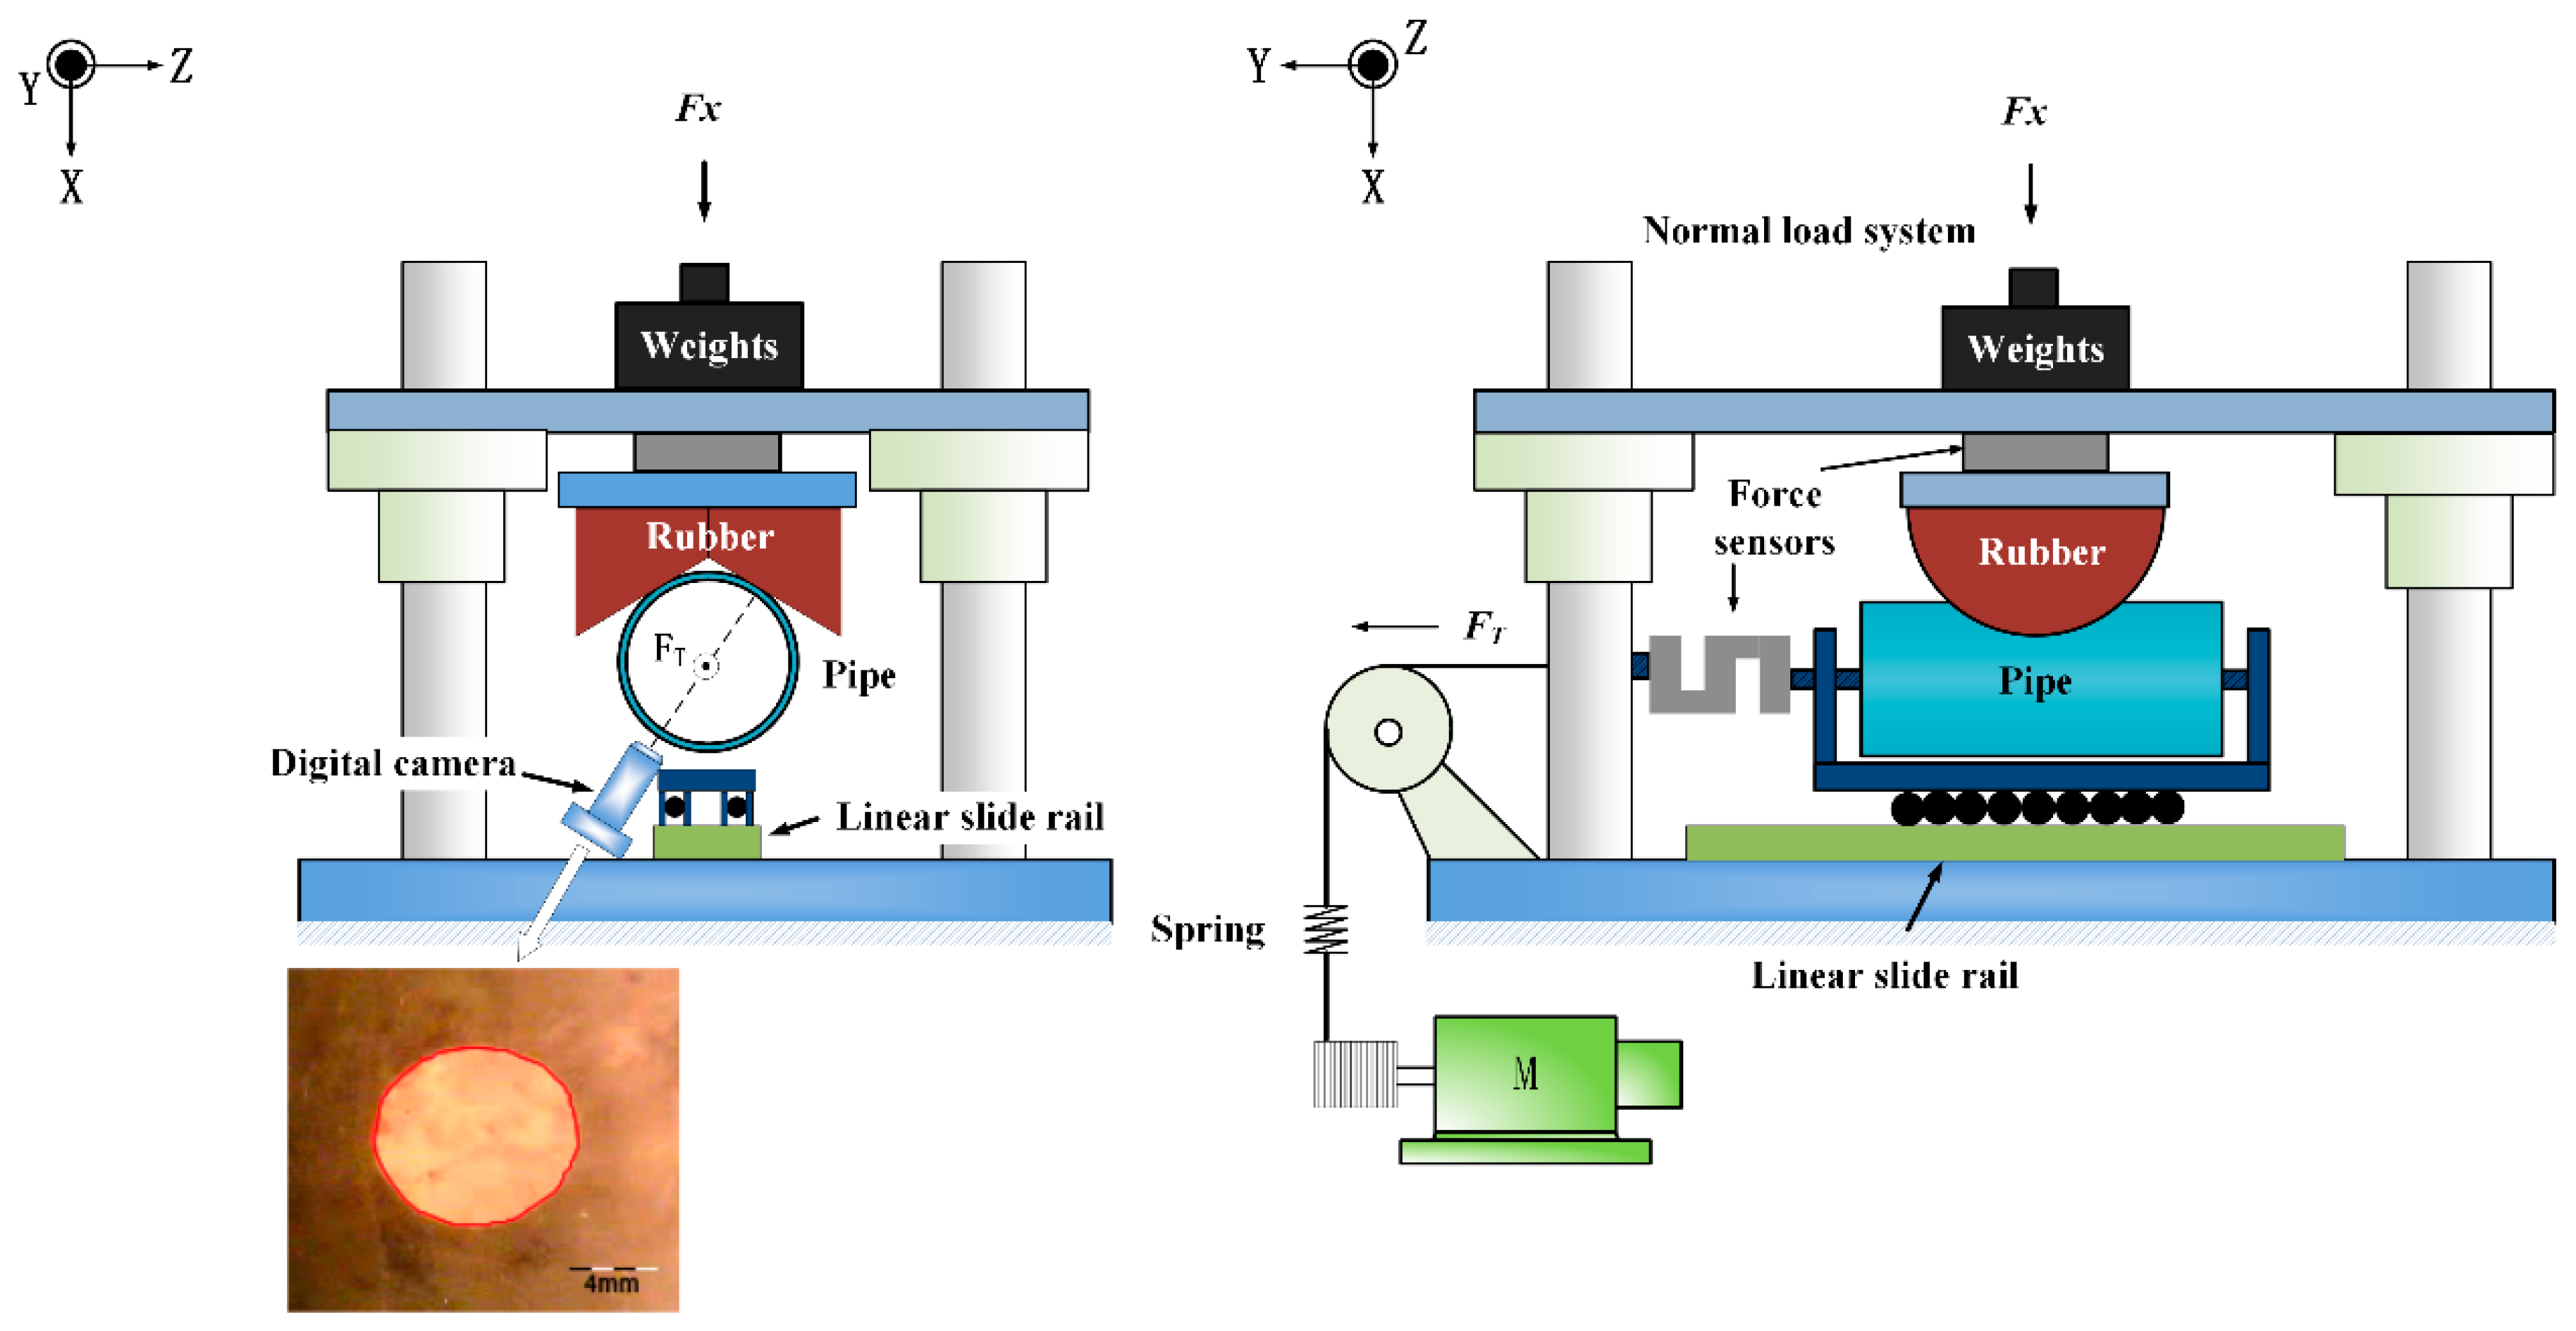
Figure 3 illustrates a schematic view of the frictional testing instrument [22]. This testing instrument consists of three major systems, the X-direction loading component, the rubber-pipe contact testing component and the Y-direction loading component. The rubber samples are fixed at the bottom of the normal loading component, and can slide in X-direction to approach the pipe sample. A spoke-structure pressure sensor (model MeaconTM MIK-LCL-20 kg, Hangzhou Meacon Instrument Technology Co., Ltd., Hangzhou, China) which ranges from 0–200 N of capacity, with accuracy of 0.1%, is positioned between the rubber sample and normal loading arm to detect normal load. The pipe sample is placed on the linear slide block to ensure it can slide in the Y-direction smoothly. In addition, the tangential load is detected by an S model transduce (Model CeltronTM STC-25 kg, Vishay (Tianjin) Technology Co., Ltd., Tianjin, China) which is mounted in front of the pipe sample. Its capacity is 0–250 N, and its accuracy is around 0.5%. The coefficient of friction of the linear slide rail is about 0.12 when normal load is zero, and it will not change more than 5% when normal load is up to 100 N. A portable video camera (model SupereysTM A005; Shenzhen Deyufu Instrument Technology Co., Ltd., Shenzhen, China) is used for in situ observation of the contact area during a test run.
2.3. Experimental Procedures
In order to investigate the static frictional behaviors of a rubber pipe contact system, two groups of tests were carried out by the testing instrument. The corresponding testing parameters are listed in Table 3.
At the start of a single test run, rubber samples were normal loaded first. A contact area was forming when rubber samples were squeezed against the pipe sample. The contact area was increasing instantaneously due to elastic deformation during the normal loading operation. After the normal load is completely applied to the contact system, the contact area can still increase gradually to a limiting value due to adhesion between the interfaces and creep property of rubber. The tangential load started to be imposed to the pipe sample until the contact area was becoming stable. As the tangential load was continuously increasing, the normal load was keeping constant, and then macroscopic slip between interfaces takes place. The increasing rate of the FT can be changed by altering output rotate speed of motor and reducer.
Simultaneously, other groups of tests were carried out between rubber and PMMA to record the deformation of contact area.
All tests were operated in laboratory environments, the temperature remained at 25 °C (Standard Deviation 0.1–0.5) and relative humidity remained at 45% (Standard Deviation 3–5%) which were controlled by central air-conditioning.
3. Results
3.1. Instability of the Maximum Static Friction
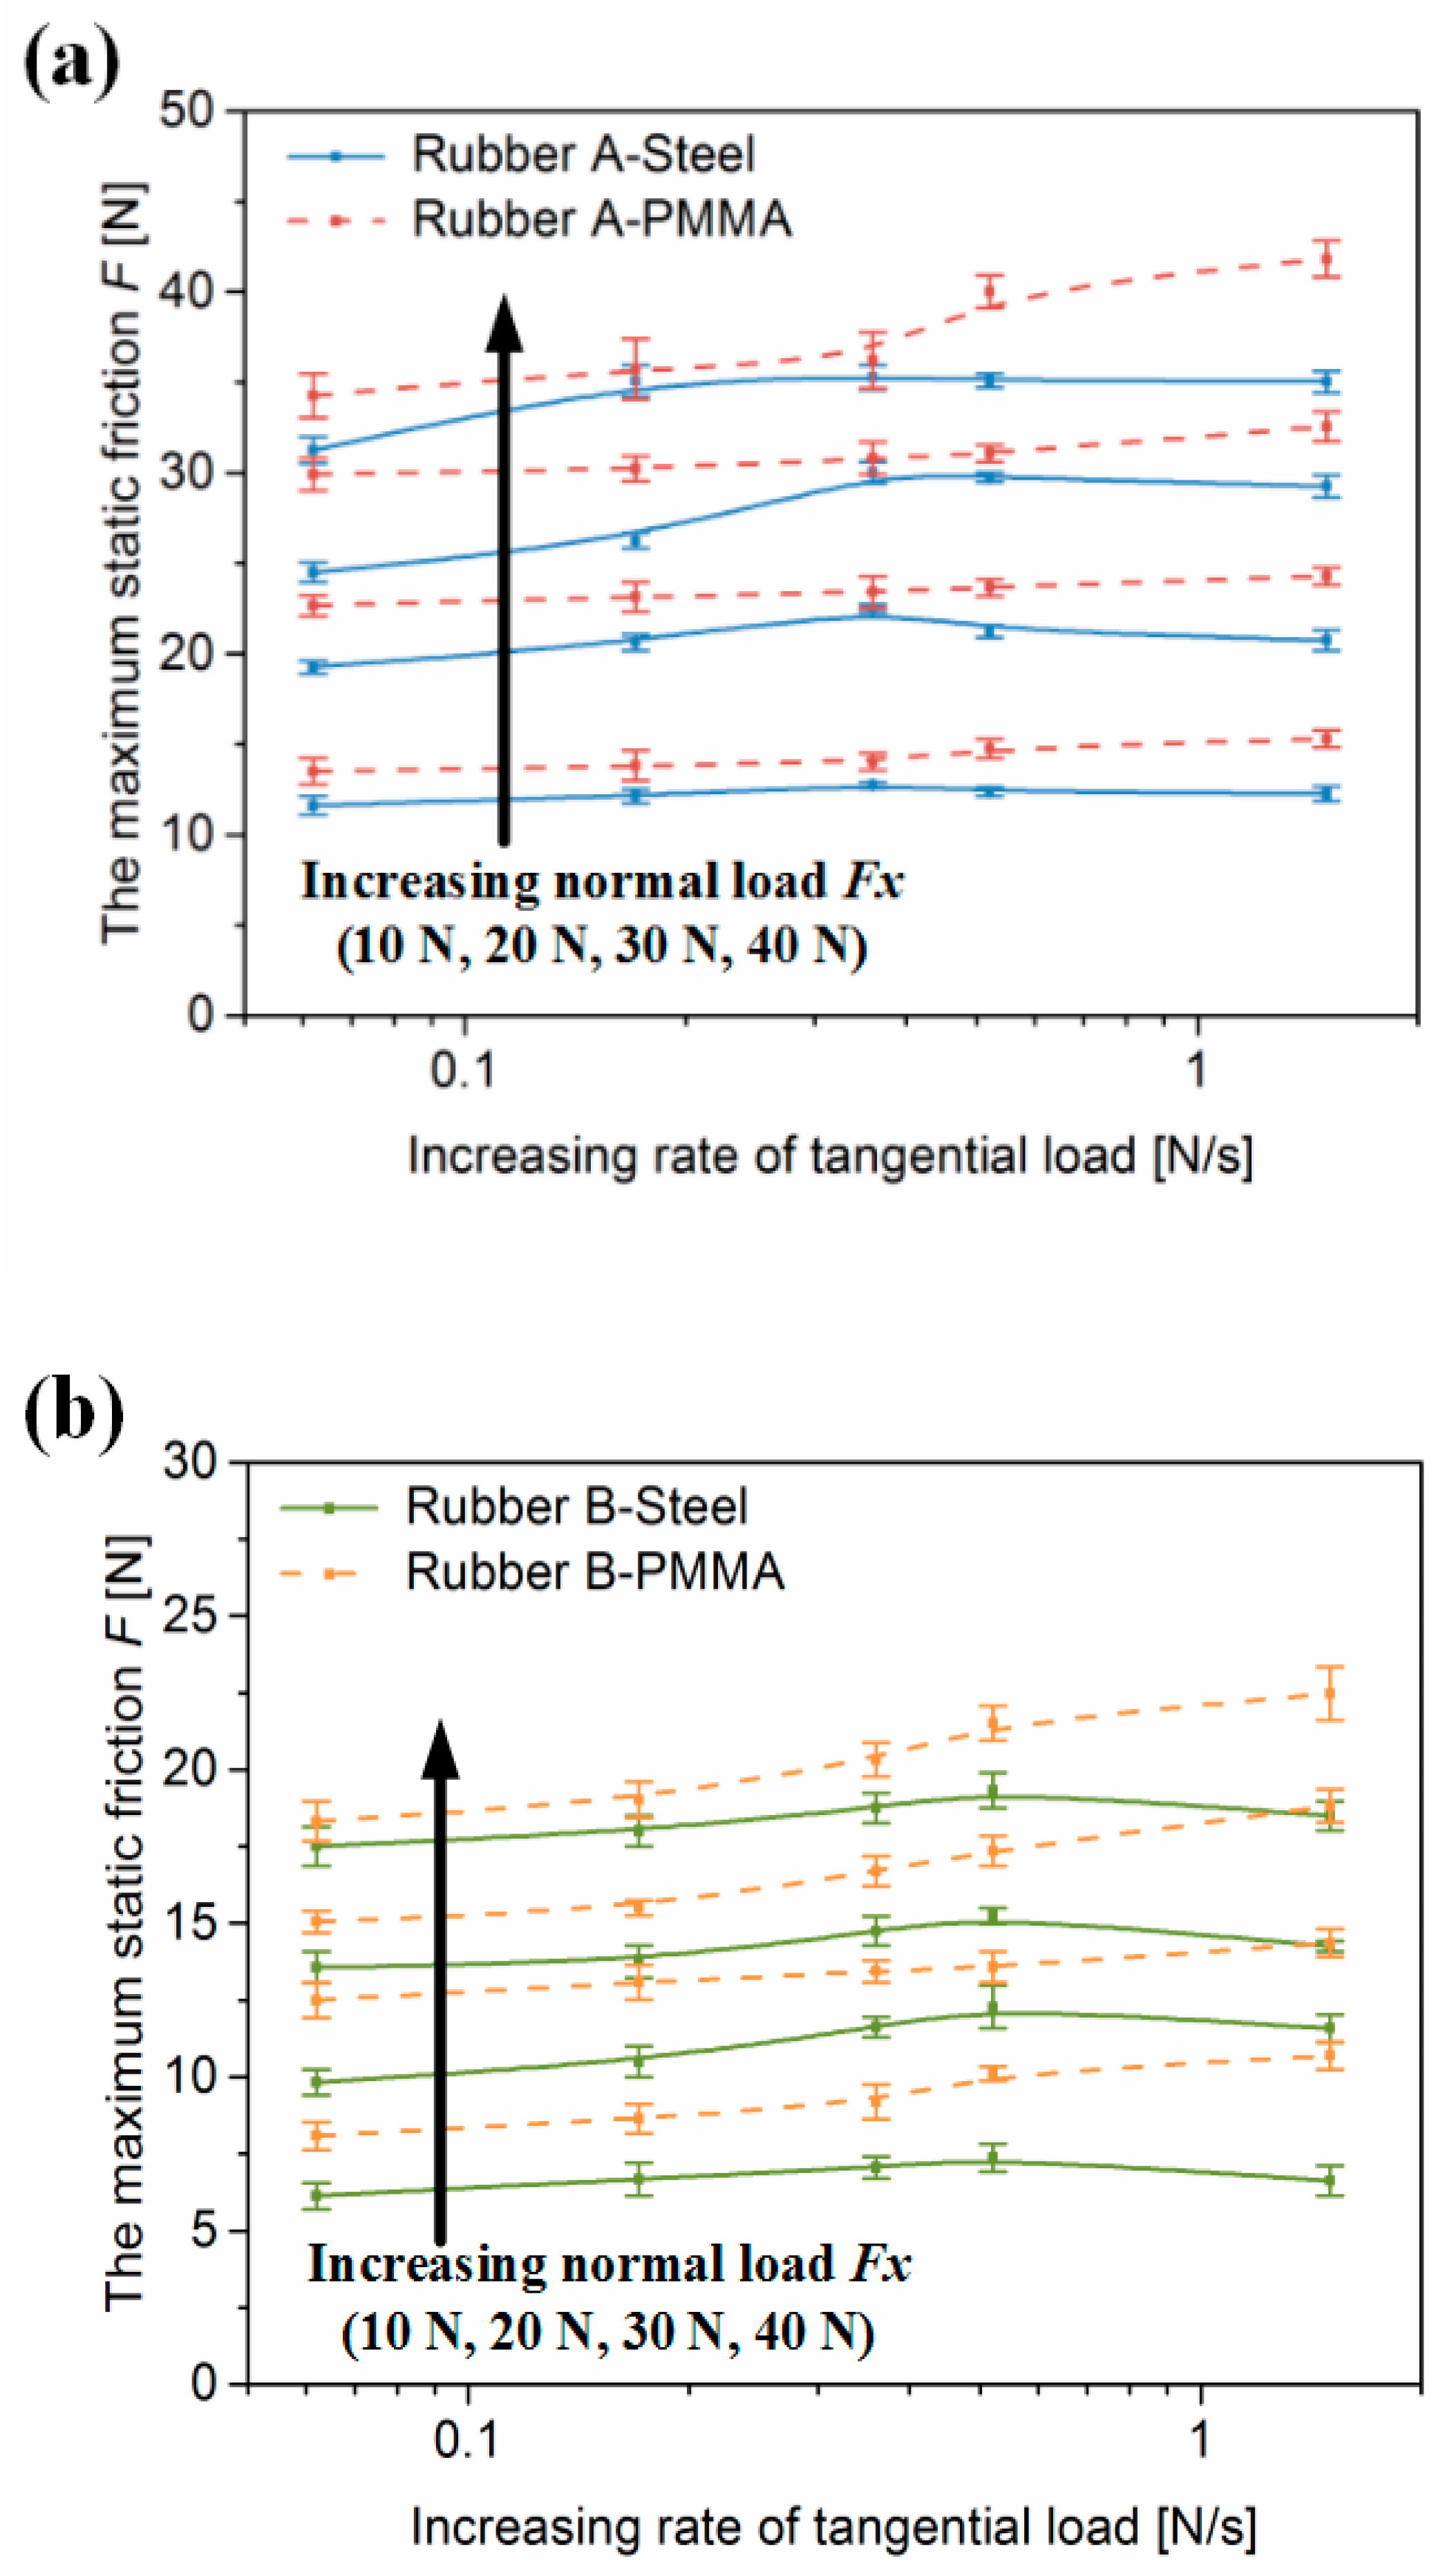
All the results are presented in form of the maximum static frictions against increasing rate of FT. Two groups of the maximum static frictions (F) of rubber A, B in contact with steel and PMMA are plotted in Figure 4a,b, respectively. In general, the curves of F for each contact test present a similar trend, values of F increase due to the increasing normal load, and the static friction of rubber- PMMA contact for each normal load is higher than that of rubber-steel contact. In rubber-steel contact, the values of F behave unstably with increasing rate of FT, specifically, the static friction increases for the relative low increasing rate of FT, and then decreases with little scale when the increasing rate of FT continues to increase. However, for the rubber-PMMA contact, the static friction increases monotonically with the increasing rate of FT without a shift point.
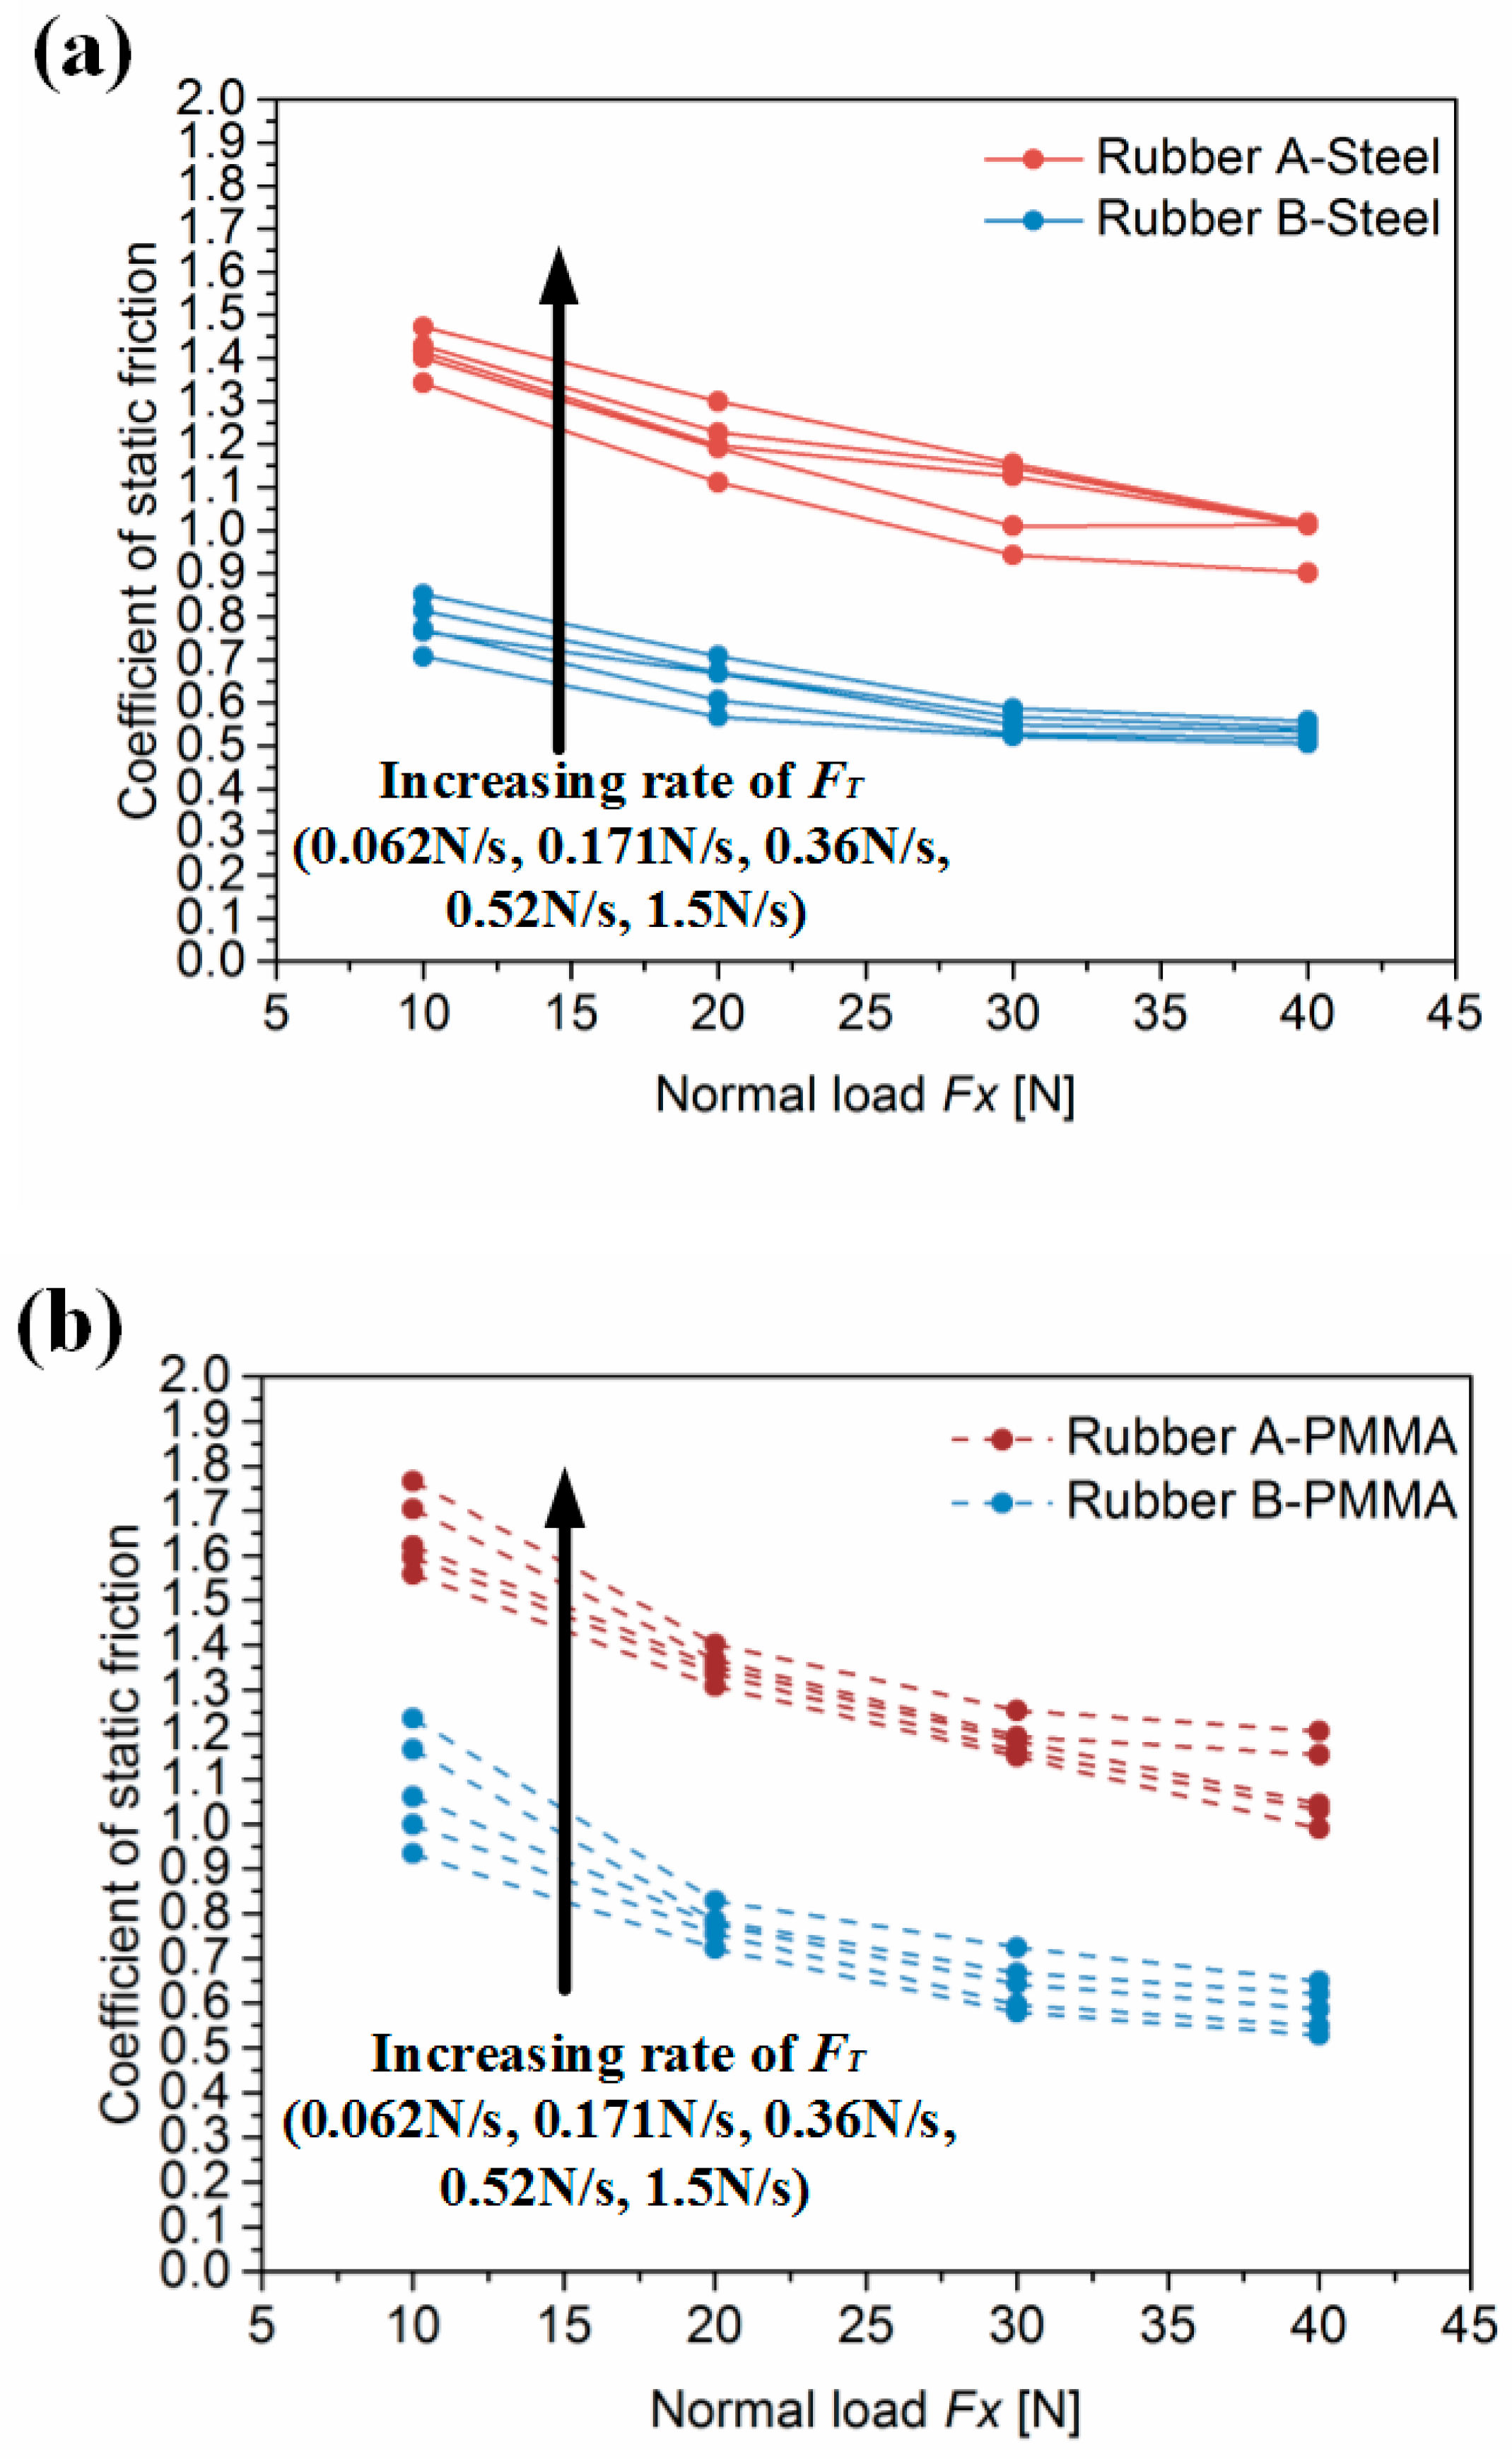
A groups’ coefficient of static friction (COF) of rubber is plotted in Figure 5. The instability of the rubber frictional behaviors is also reflected in the fluctuation of COF. Firstly, the COF of rubber A is always higher than that of rubber B, and the values of COF decrease with an increase in normal load for both rubber samples. Furthermore, values of COF which are under the same normal load vary in obvious range by 10–30%. As is shown in Figure 5a, the scale of variation for the COF of rubber A is larger than that for rubber B. The variation of COF behaves more intensely as the normal load increases for rubber A, whereas it shrinks in rubber B tests. However, Figure 5b illustrates that the strongest variation of the COF takes place at the smallest normal load for both rubber samples, and the scale of variation of the COF becomes less distinct with an increase of the normal load, except for the results of rubber A in contact with PMMA under 40 N normal load.
3.2. Deformation of Contact
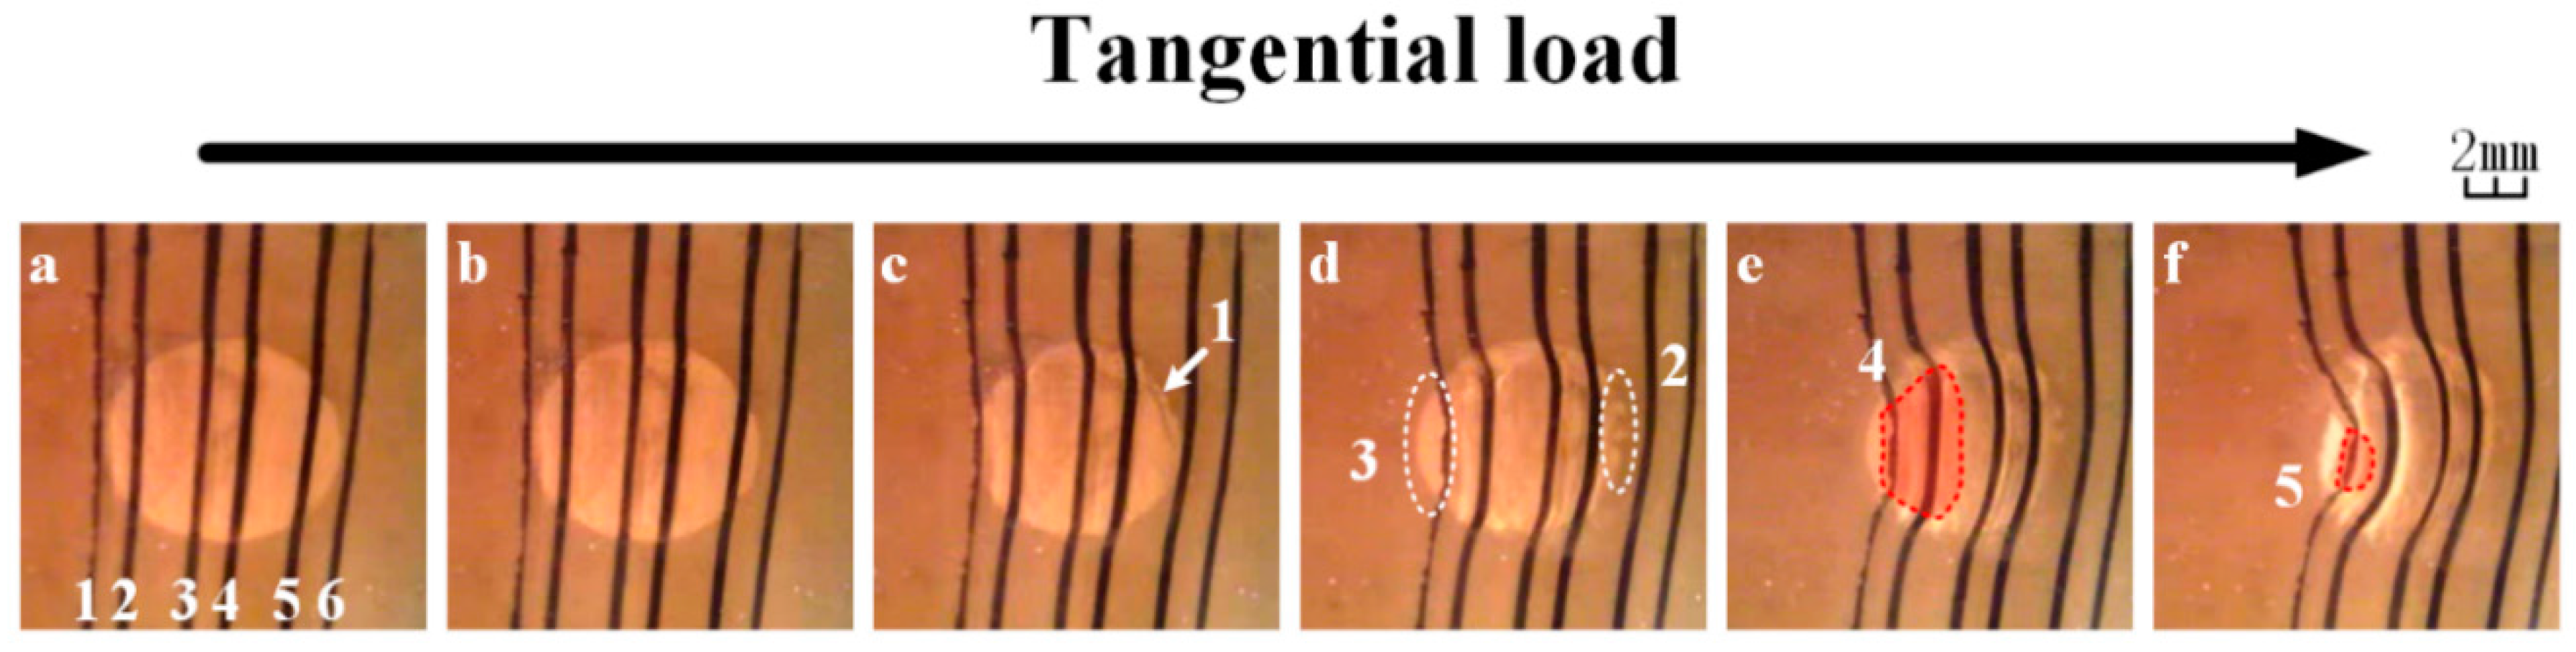
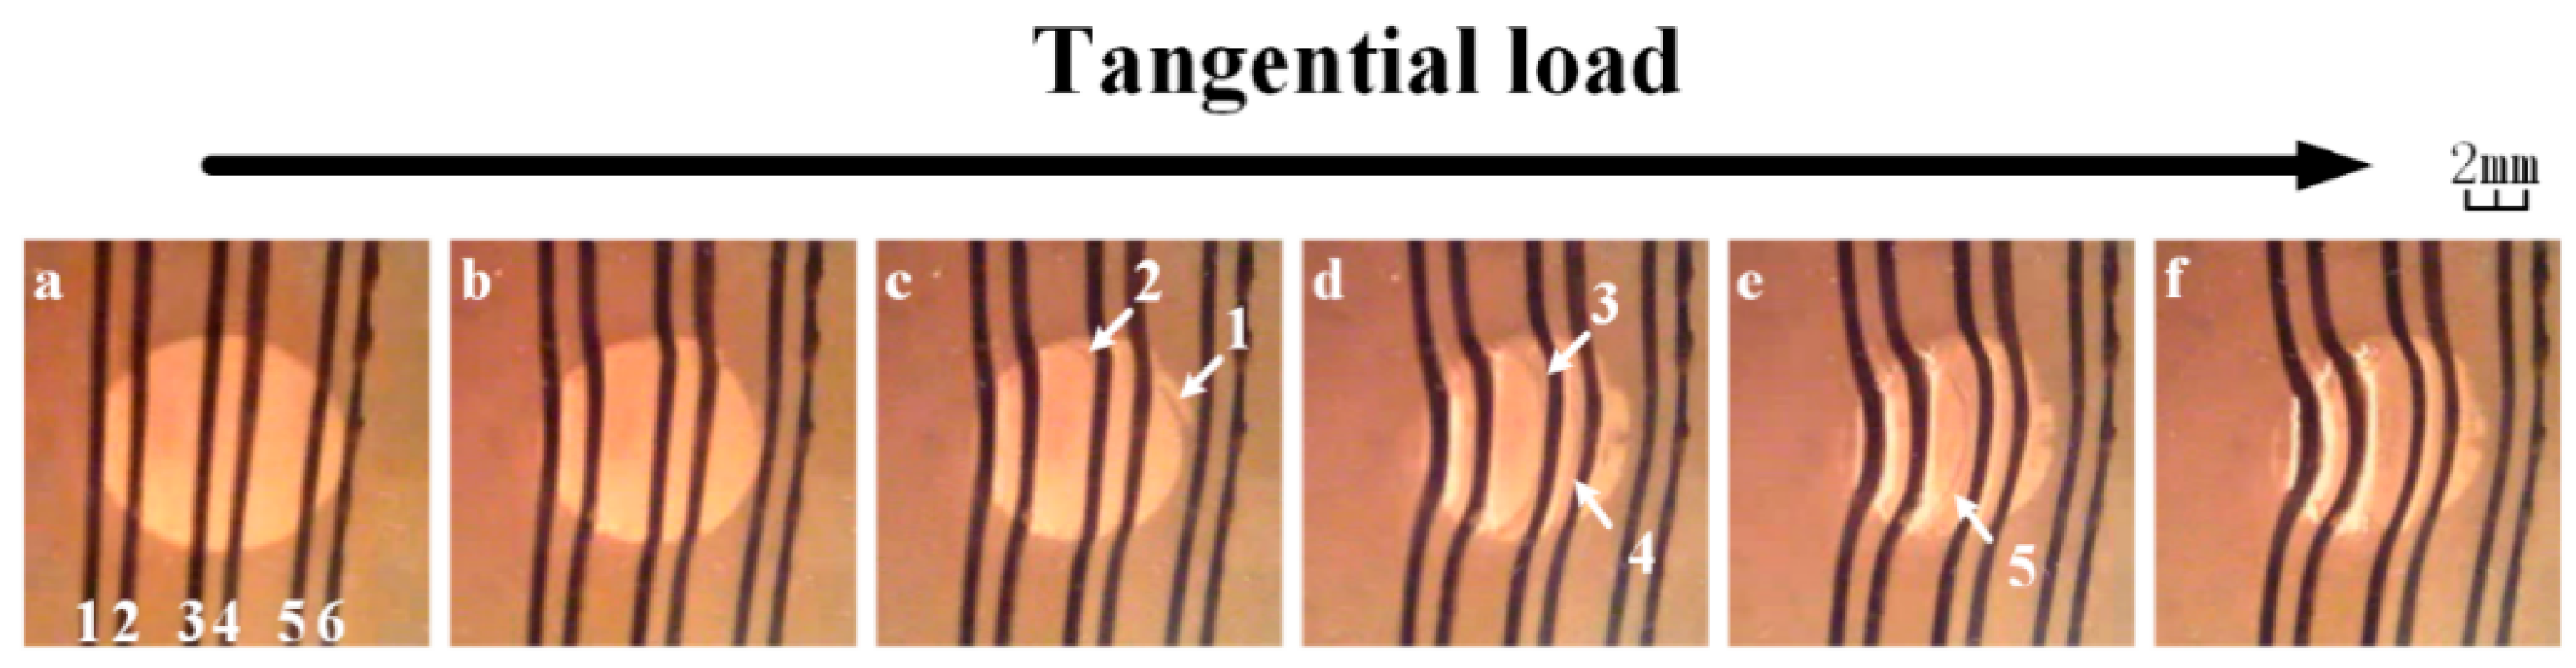
A sequence of six frames are demonstrated in Figure 6 to identify the deformation of the contact area in rubber A-PMMA test where the normal load is 30 N and the increasing rate of FT is 0.062 N/s. Six pen lines which are drawn on the rubber surface beforehand are ordered from 1 to 6 to confirm the scale of deformation of the rubber surface.
As is shown in Figure 6a, contact system sustains the normal load only, the contact area is stable and the black lines are approximately linear. The slight bend of the black lines indicates that the contact area deforms due to the normal loading. As soon as the pipe sample is dragged by the tangential load, the contact area begins to deform from its original shape, the front edge of the contact shrinks to the center with very small scale, while the rear edge expands smoothly (Figure 6b). This phenomenon can be deduced as a result of integral elastic deformation of the rubber sample. The black lines bend distinctly with increasing tangential load, meaning that the surface of the contact moves forward with the pipe surface. A fold appears at the front edge of the contact (Figure 6c 1), and then vanishes due to the re-adhesion of the interfaces (Figure 6d 2). The contact at the rear edge enlarges to beyond the line 1 (Figure 6d 3), this phenomenon illustrates an obvious and continuous attachment between contact surfaces. The red area which is marked in Figure 6e 4 within the apparent contact area represents the estimation of the adhesive zone. The shape of the adhesive zone is deduced from the different bend of the black lines. The black line keeps partially straight at the part of rubber surface which is located at the adhesive zone, whereas it becomes a bend at the partial slip zone. In Figure 6f, most of the apparent contact area is occupied by the partial slip zone; the residual adhesive zone (Figure 6f 5) cannot hold the tangential load, and then the macroscopic slip is emerging.
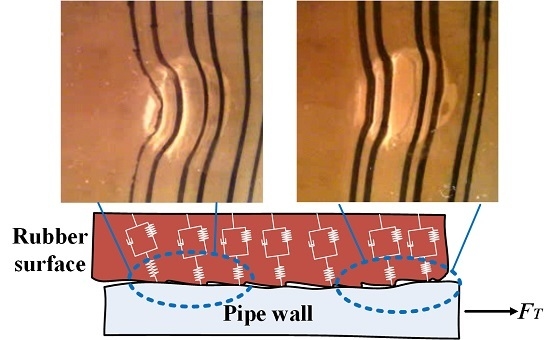
The other sequence of six frames illustrating the deformation of the rubber A-PMMA contact are shown in Figure 7, where the normal load is 30 N and the increasing rate of FT is 1.5 N/s. At the beginning of the test, the deformation of the contact behaves similarly to the deformation which is under the low increasing rate of the FT. However, distinct difference takes place when the tangential load increases quickly. In Figure 7c,d, two folds appear at the front edge of the contact simultaneously (Figure 7c 1 and 2), and then propagate towards the center of the contact (Figure 7d 3 and 4). The propagating speed of the folds slows down when the folds get close to the boundary between the adhesive zone and partial slip zone. The first fold stops at the boundary of the adhesive zone, and the boundary is compressed to the rear edge of the contact due to the subsequent folds (Figure 7e 5). Finally, the displacement between the contact surfaces takes place. Attachment is rarely observed at the rear edge of the contact; this observation indicates that the integral elastic deformation of the rubber sample does not affect to the deformation of the contact area effectively.
4. Discussion
There are mainly two factors contributing to the level of friction in both sliding and static conditions. The first and foremost factor is the adhesion force between interfaces. The adhesion force cannot be neglected because it becomes active in contact between the smooth rubber surface and clean substrate which is under relatively low normal load [24]. Another factor is the inherent response of rubber to the external loading conditions, which is caused by the viscoelastic property of rubber. The pipe samples (steel and PMMA) are tough enough when compared with rubber and they can be seen as incompressible and do not change in terms of surface characteristics [25]. Therefore, the static frictional behaviors are mostly influenced by the special characteristics of rubber materials.
4.1. Normal Loading Condition
It is confirmed that the friction is directly proportion to the real contact area or the adhesive zone, the classical Hertz theory gives a relationship between the real contact area and normal load [17]:
where FN, υ, R, and E are the normal load, Poisson’s ratio, curvature radius and Young’s modulus of the rubber, respectively.
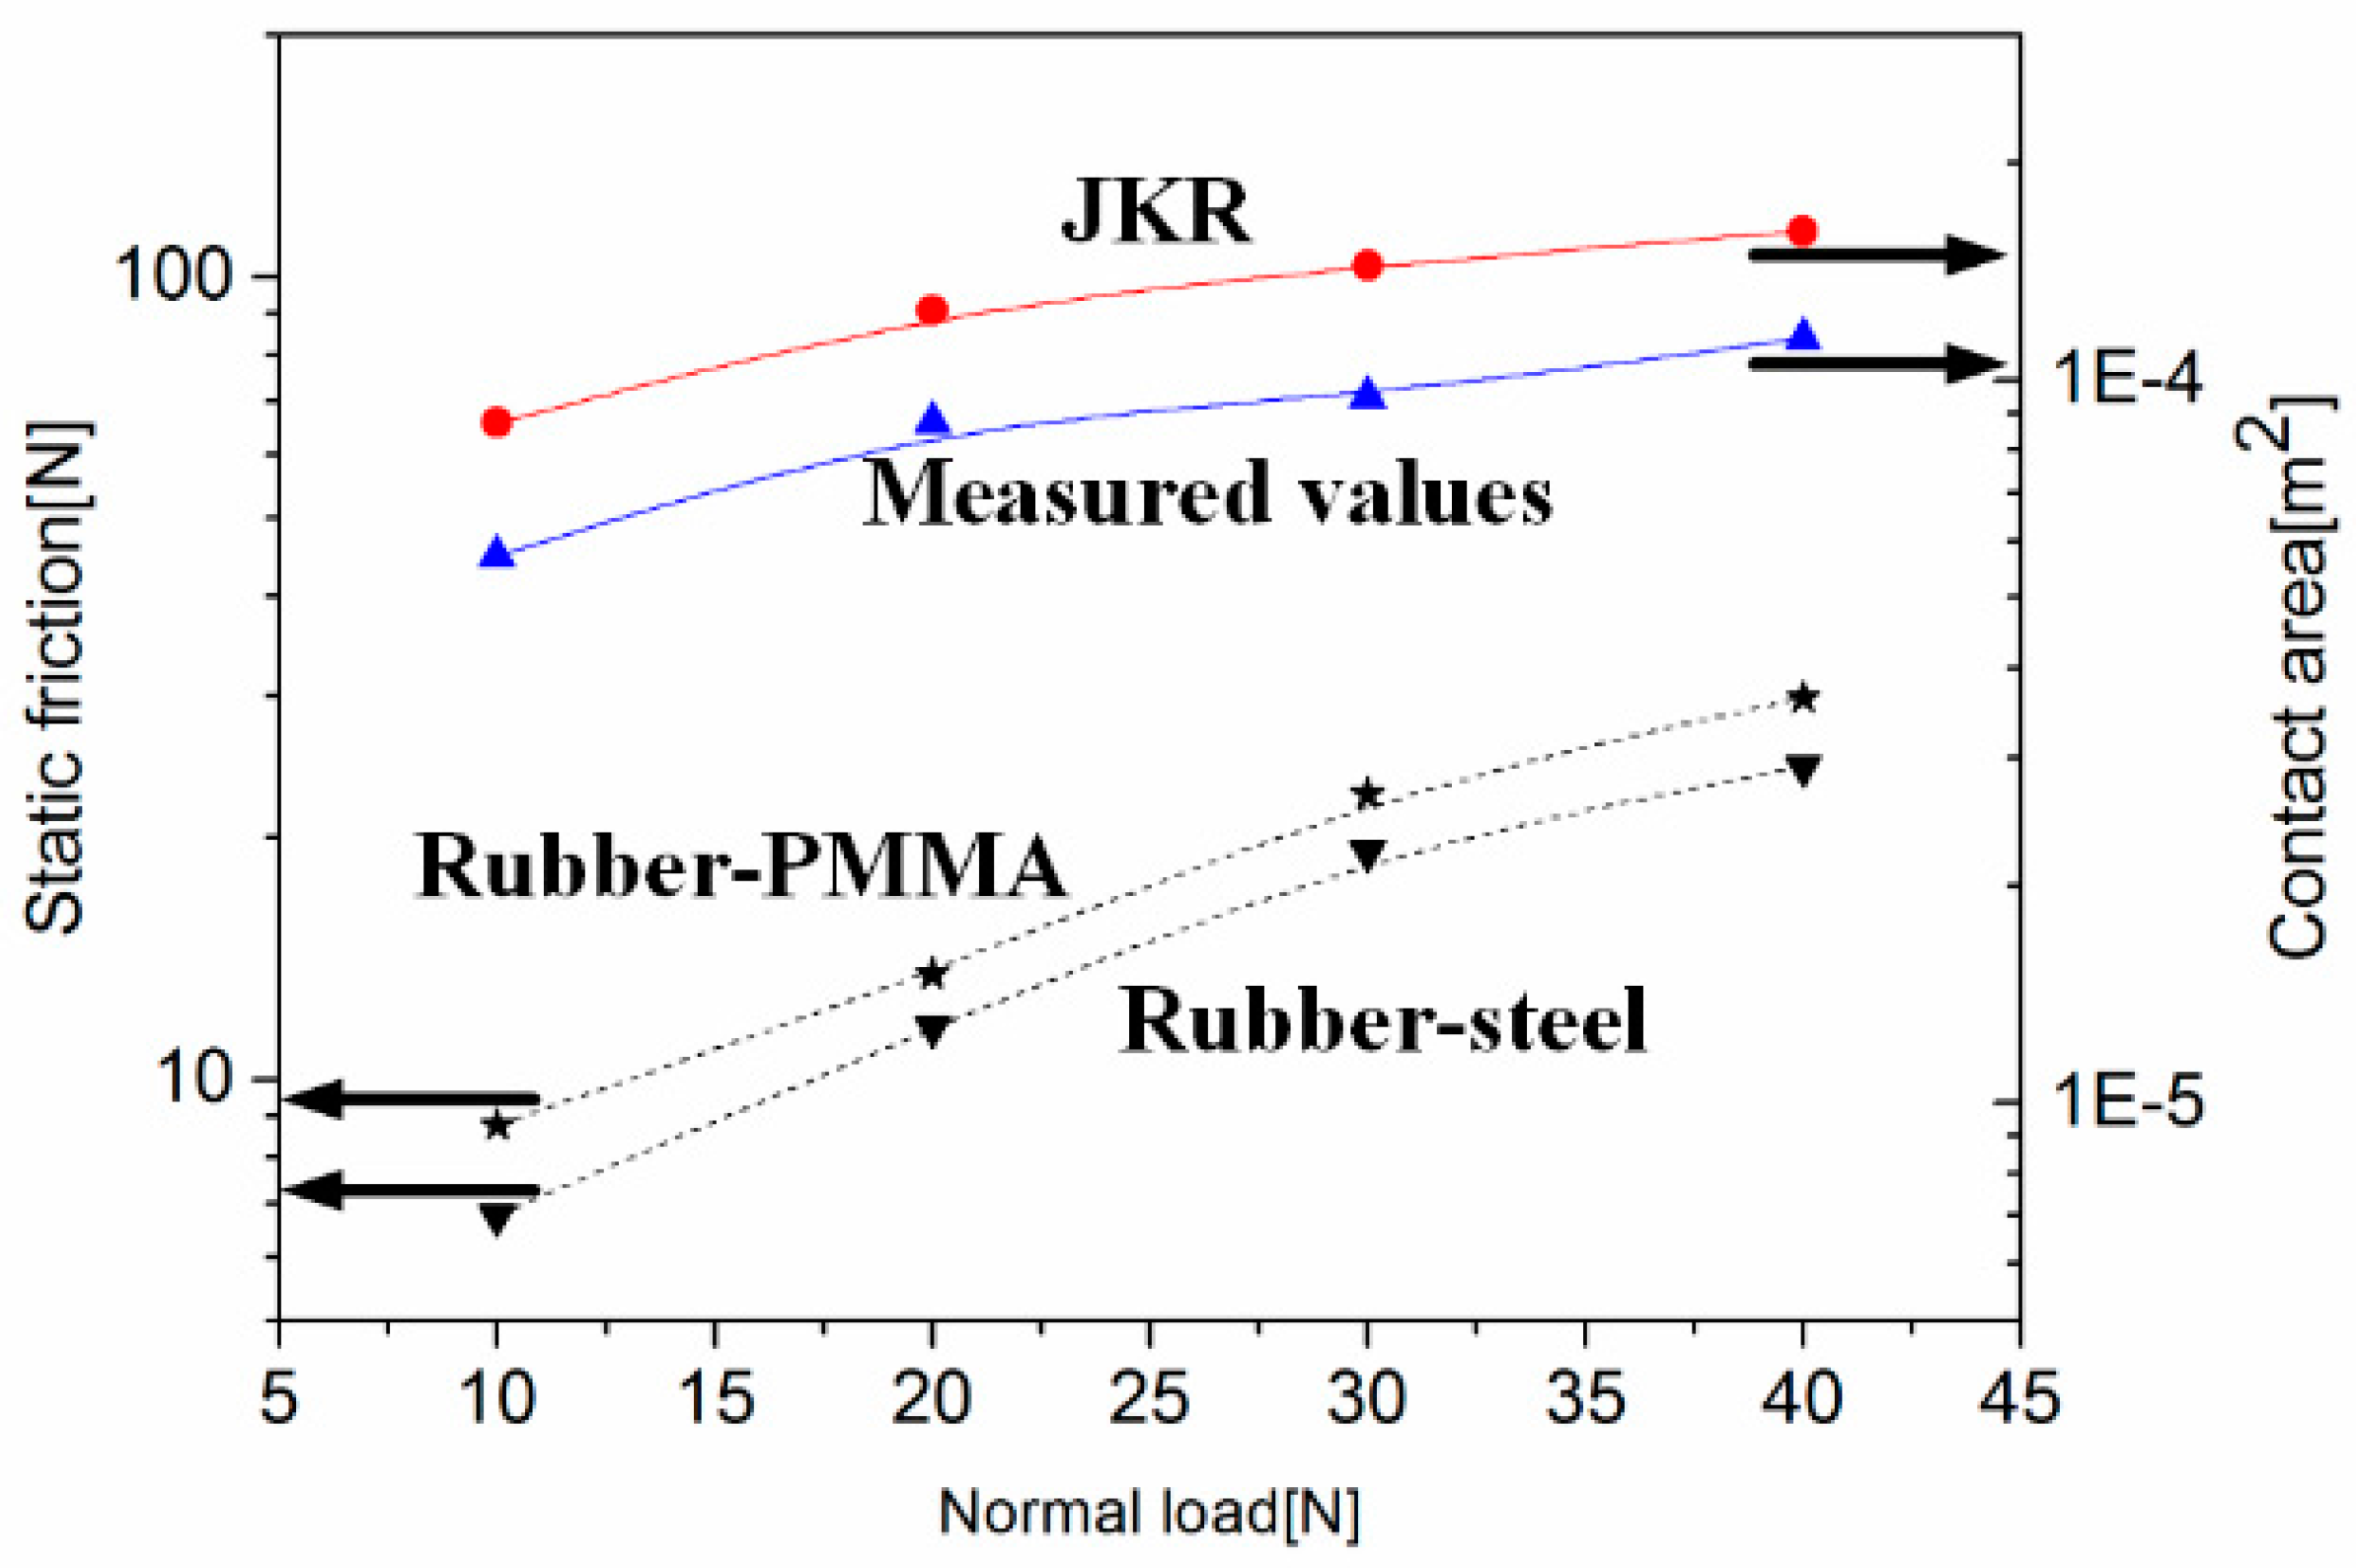
Apparently, the real contact area increases with increasing normal load within a certain range. Furthermore, according to Johnson et al. [8], the real contact area is larger than the value which is calculated by the Hertz theory. They deduced a new approach- the JKR approach- from the Hertz theory by taking adhesion into consideration:
where Fn1 is the apparent Hertzian load which would cause the same contact area, W12 is the work of adhesion [26].
The calculating values of the contact area by the JKR theory is compared with the measured values from the video frames in Figure 8. Even difference between the two groups of values of the contact area exists, they increase as normal load increases with a same trend. It indicates that the JKR theory is appropriate to estimate the contact in this study. In addition, the static frictions of rubber-steel and PMMA contacts are plotted in Figure 8, either. As being proportion to the real contact area, the increasing trends of the static frictions show good agreement with that of the real contact areas [7,27].
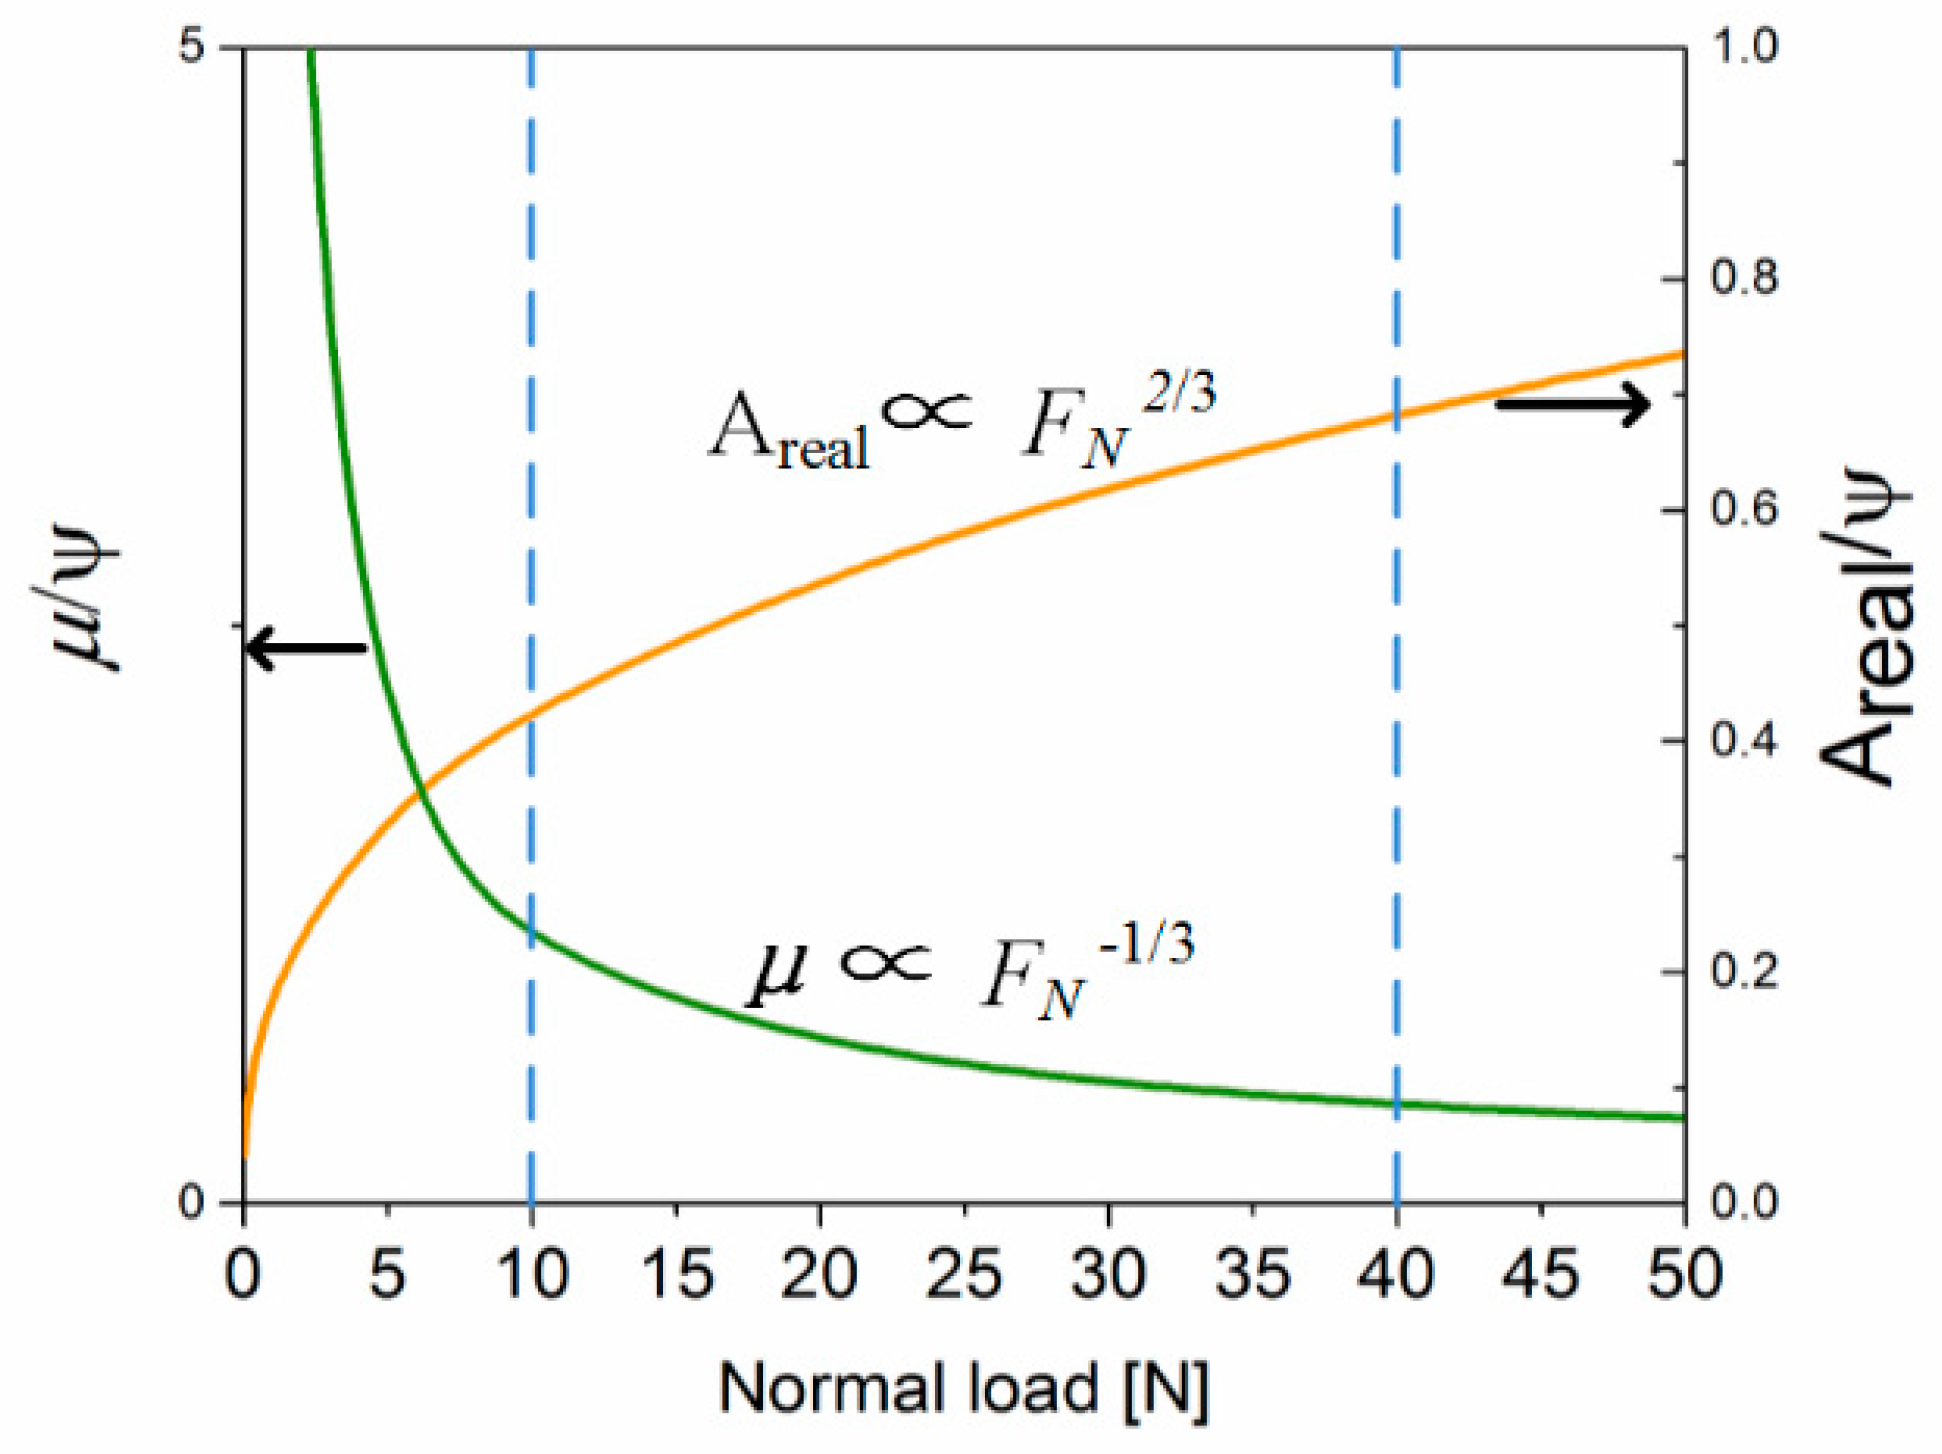
There are two major soft contact models to predict the level of friction. Model 1 is appropriate for the condition that the roughness of the rubber surface is extremely high. The other one for when the rubber surface is smooth in a certain range. Apparently, the second model is suitable for this research. Model 2 assumes that the real contact area will increase with normal load due to the viscoelastic deformation of the entire rubber surface, whereas the deformations of asperities on the rubber surface contribute little to the increment of the real contact area. In addition, the friction is proportional to the real contact area. Thus, according to Equations (1) and (2), the real contact area can be seen as proportional to FN2/3, the COF μ which is acquired from FT/FN, is proportion to FN−1/3. The tendencies of real contact area and μ with increasing normal load are plotted in Figure 9. At the range of normal load which is used in this research, the testing results of COF in Figure 5 are shown in good agreement with μ which comes from the model 2.
4.2. Tangential Load Condition
4.2.1. Description of Fracture Mechanics
It is known to us that partial slip takes place adjacent to the boundary of the central adhesive zone when tangential load is imposed to the contact system [9,10,11,17]. In the description of the fracture mechanics, the central adhesive zone never slips as a whole until the critical value of the tangential load is reached. In addition, the boundary of the central adhesive zone is assumed to be a crack tip which propagates in the interface. Specifically, crack tips are moving towards to the core of central adhesive zone from both edges of contact with increasing tangential load. For the rigid sphere-rubber plate contact, the propagating velocity of crack tip at the front edge is quite lower than that at tail edge of contact. That is because that compression stress that is resulting from bulking at the front edge is much less than shear stress which is caused by peeling at the tail edge.
The Griffith equilibrium is introduced and defined by G = w to reveal the energy balance at the edge of the crack tip [18], where G represents the strain energy release rate, and w is the thermodynamic work of adhesion. The equilibrium can be disrupted by the change of tangential load. In this study, it is deduced that the increasing tangential load leads G to increase while w is unchanging. When G is higher than w, the interfaces start to separate and the central adhesive zone decreases. The difference of G-w can be seen as “crack extension force” and the crack should be accelerated to a limiting value due to the viscoelastic losses of crosslink rubber materials.
The partial slip zone replaces the central adhesive zone continuously as crack tips are propagating in the interface and releasing shear stress. As soon as crack tips propagate across the whole apparent contact area, the central adhesive zone is replaced by slip zone entirely. The static friction reaches the peak value.
The fracture mechanics can help us to identify the differences of evolution of the contact area which are under different increasing rates of the tangential load. Distinction of the deformations that are shown in Figure 6 and Figure 7 should be attributed to the fluctuation of the maximum static friction. More details need to be discussed by taking adhesive dragging and viscoelastic property of rubber into consideration.
4.2.2. Increasing Rate of the Tangential Load
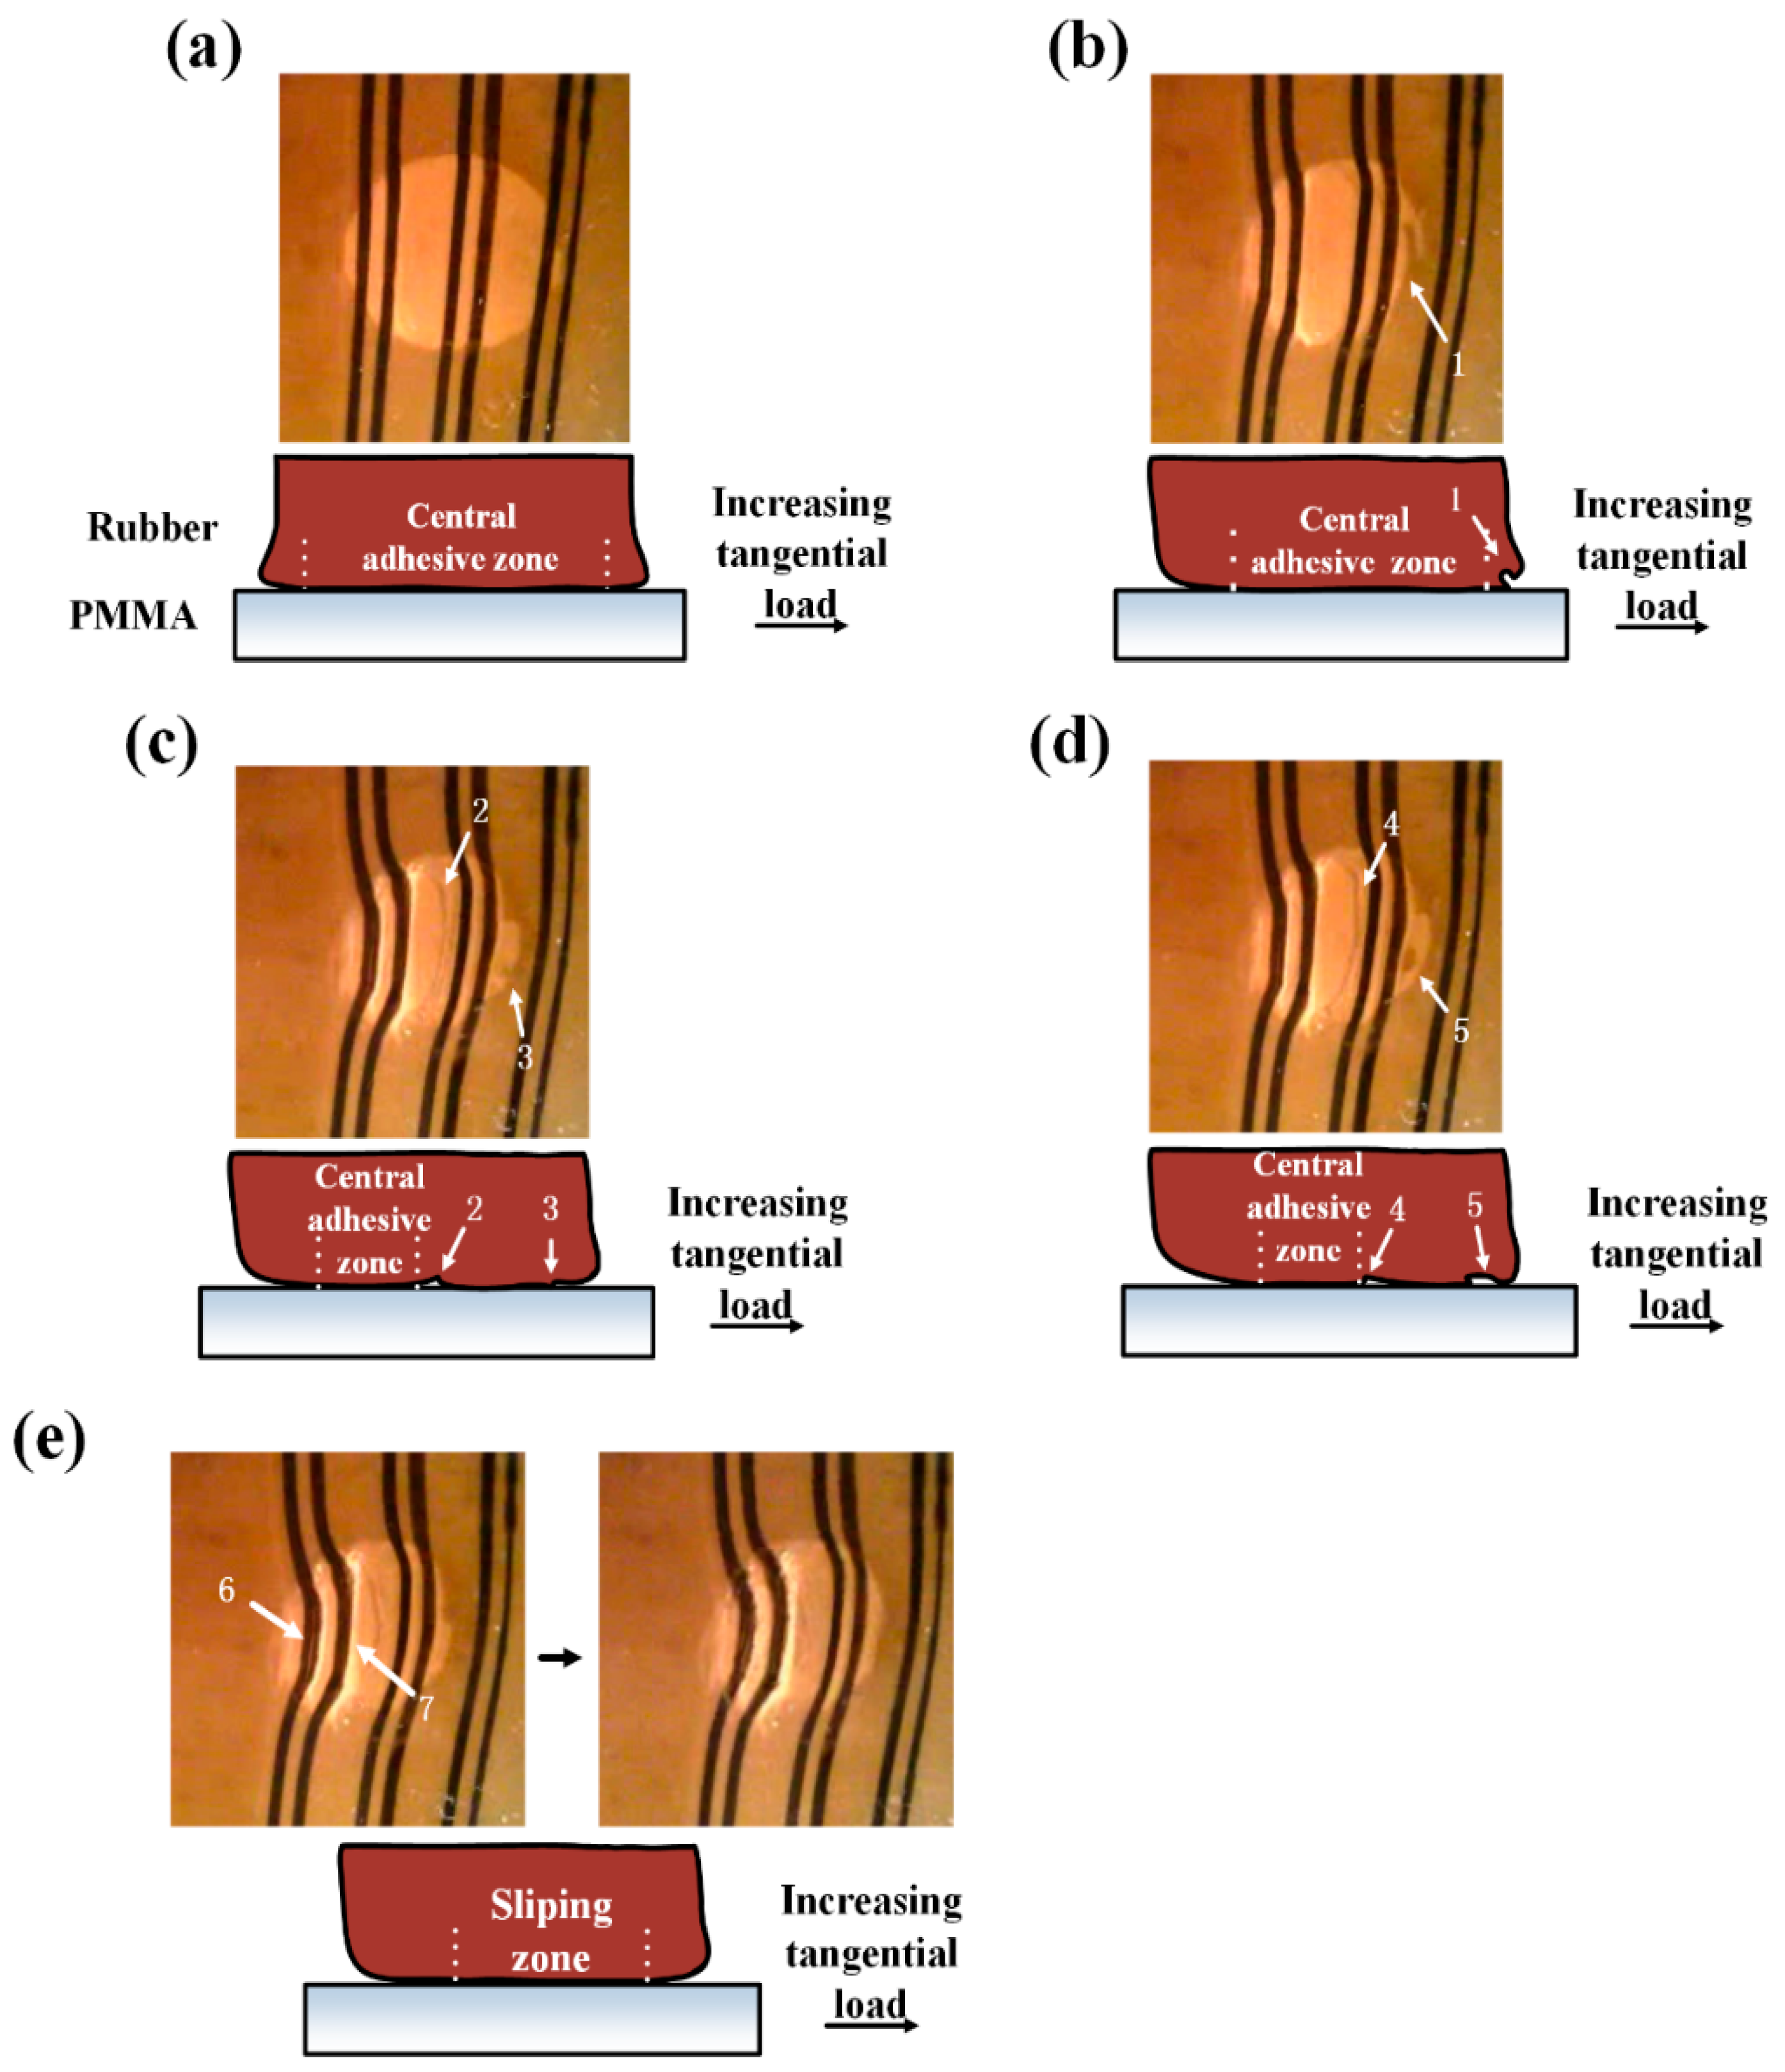
Figure 10 illustrates schematic cutaway views of rubber-PMMA contact during a whole test run for the increasing rate of FT at 1.5 N/s. As the tangential load begins to increase, the apparent contact area becomes smaller and loses its original symmetric shape, and the front edge of the contact area shrinks remarkably (Figure 10a,b). The fold appears at the front edge of the contact area (Figure 10b 1), and the schematic cutaway views of formation of the fold are shown in Figure 10b. Even though there is no slipping within the central adhesive zone, the partial slip zone increases with increasing of the normal load. Relative displacement has taken place in the apparent contact area, and this situation can be seen as a quasi-sliding stage of contact. According to the former studies [9,10], the fold or detachment wave forms at the front edge results from the strong adhesive junction between the interfaces and the discrepancy of rubber deformation and pipe motion. The fold or detachment wave never slips on the pipe surface, but propagates on the surface of rubber. In sliding contact, the detachment wave can propagate across the contact zone when the motion of the pipe is high enough. However, in the static contact, the motion of the pipe cannot allow the fold propagating from the leading edge to the rear. Even the speed of the fold is distinctly higher than the relative displacement velocity between the interfaces. The fold slows down when it comes close to the boundary of the adhesive zone (Figure 10c 2) and finally stops adjacent to the boundary (Figure 10d 4). It is deduced that the fold is resisted by the bulking of the rubber surface which is under extremely high compression and shear stress within the central adhesive zone. This phenomenon can also be described by fracture mechanics. The fold is commonly regarded as an air tunnel between the interfaces, the leading edge of the fold is the side part which is close to the boundary of the central adhesive zone, whereas the opposite side part is the rear edge of the fold. When the fold is propagating across the contact area, the leading edge of the fold can be regarded as a crack tip which opens the adhesive junction between the interfaces. On the contrary, the rear edge of the fold closes the crack and the interfaces re-adhere together. The propagating mechanism of the fold is also observed at the front edge of the contact area. As is shown in Figure 10c 3, a small fold forms and moves to the rear edge of the contact for a little distance, and then being stopped by the bulking of rubber surface which is in front of the fold (Figure 10d 5). The fold vanishes because that the apparent contact area is shrinking with the increasing tangential load. Finally, the central adhesive zone is squeezed by two sides (Figure 10e 6 and 7) and replaced by the partial slip zone. The relative displacement takes place at the whole apparent contact area.
We have known that the strain of the rubber surface can be relaxed by the propagation of the detachment wave in sliding conditions [10], so that it is easy to deduce that the propagation of the fold can also release the extremely high shear stress which is caused by the increasing tangential load. It means that the partial slip zone can convert to the adhesive zone for a moment when the folds pass through. Typically, the partial slip zone holds more shear stress due to the successive propagation of the folds, and it leads an increasing of the critical value of the tangential load which triggers macroscopic slip.
The schematic cutaway views of the contact are shown in Figure 11 when the increasing rate of the FT is 0.062 N/s. Even when the fold forms at the front edge of the contact area (Figure 11b 1), its scale is smaller than that of which is shown in Figure 10b 1. It indicates that the motion of the pipe affects the formation of the fold. The pipe cannot move forward fast enough to supply sufficient space to initiate a wider fold. In addition, the fold lasts until the central adhesive zone shrinks, and the fold rarely appeared after the first fold is vanishing. The subsequent deformation of the contact area behaves gentler than that of high increasing rate of FT. Furthermore, the expansion of the apparent contact area (from Figure 11b 2 to Figure 11c 4) indicates that compression stress is concentrated at the rear edge of the contact by a rotation of the rubber sample which is caused by the slow increasing tangential load, whereas the front edge is lifted up from the pipe surface (Figure 11c 3). The shear stress which is concentrated at the central adhesive zone increases gradually with increase of the tangential load. Meanwhile, it is released when the partial slip zone replaces the central adhesive zone. Finally, the shear stress is beyond the limitation of the adhesive junction between the interfaces, the macroscopic slip is emerging. This stage lasts a long time due to the low increasing rate of the tangential load, and the viscoelastic property of rubber plays important role in affecting the separation of the interfaces.
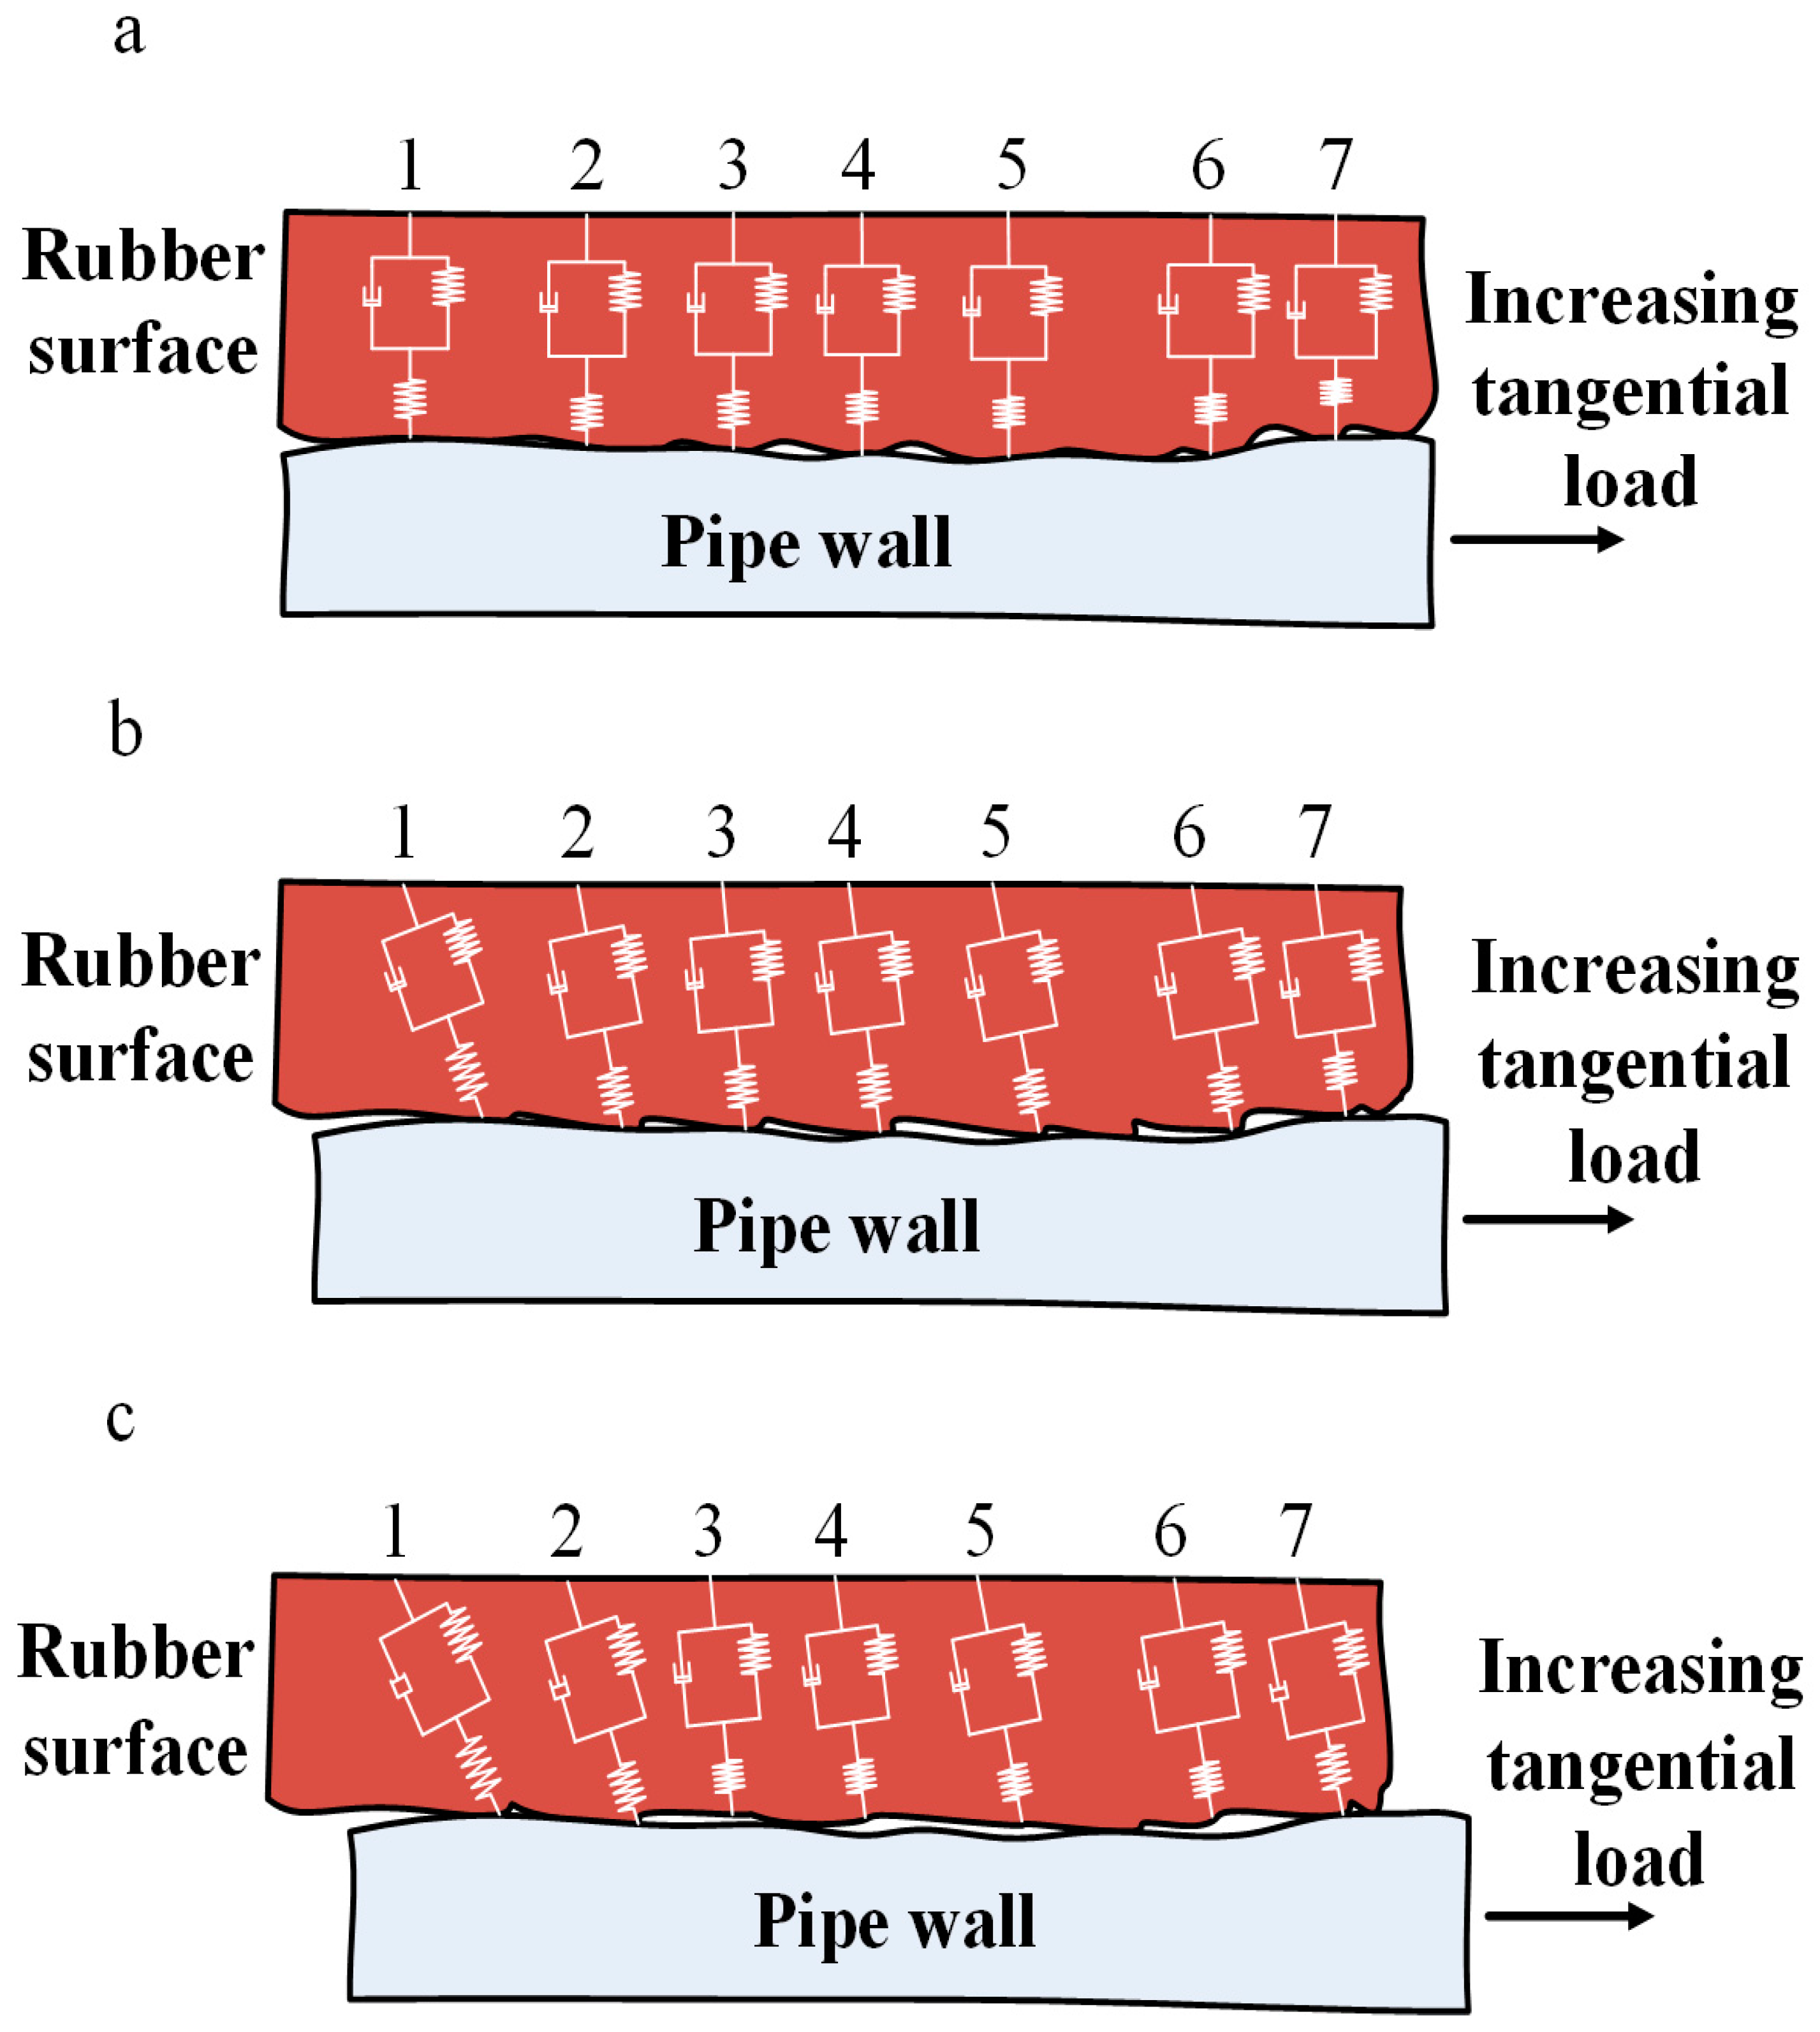
The creep deformation is a viscoelastic characteristic of rubber materials and it much depends on time [28,29]. The strain of the rubber surface which sustains a constant load will exponentially increase to the limiting value [30]. The fact that viscoelastic deformation can affect the level of static friction of rubber had been verified by Barquins [31]. In his paper, when a rigid sphere is pressed against a smooth rubber substrate, the tangential load started to increase and the partial slip zone enlarged step by step, then the tangential load stops increasing and was holding for two minutes. During the holding time, when the partial slip zone occupied the whole apparent contact area gradually, the macroscopic slip was emerging. This phenomenon means that the viscoelastic deformation of the rubber surface decreases the adhesive junctions between interfaces. Even the maximum value of the tangential load which initiates full slip is not attached, and the contact area can also change its appearance. Furthermore, when there is an increasing load instead of the constant one, the increment of strain can be superposition.
Based on this principle, we have deduced the creep deformation on the rubber surface at the rear edge of the contact area. As is shown in Figure 12a, there are many adhesive junctions which can be seen as Standard Linear Solid models (SLS Model) between the interfaces. These adhesive junctions will be stretched and the rubber surface is dragged towards the limitation of elastic deformation (Figure 12b). The creep deformation is becoming active as the tangential loading time is growing. However, the creep deformation cannot hold more shear stress. On the contrary, as the tangential load is continuously increasing, some of the adhesive junctions (Figure 12c 1,2,7) take the lead in enlarging their strains by creep deformation, because they are reaching the limitation of elastic deformation ahead of the other adhesive junctions due to their locations. The other adhesive junctions do not have enough time to take creep deformation. As a consequence, they are broken by displacement between the interfaces. Therefore, even the intense deformation at the rear edge of the contact (Figure 11d 6), which is stronger than that for the higher increasing rate of FT condition can be seen, the broken adhesive junctions facilitate to opening of the boundary of the adhesive zone, and make it easier for the macroscopic slip to take place (Figure 11d 5). Hence, the creep deformation can be regarded as a function that decreases the maximum static friction.
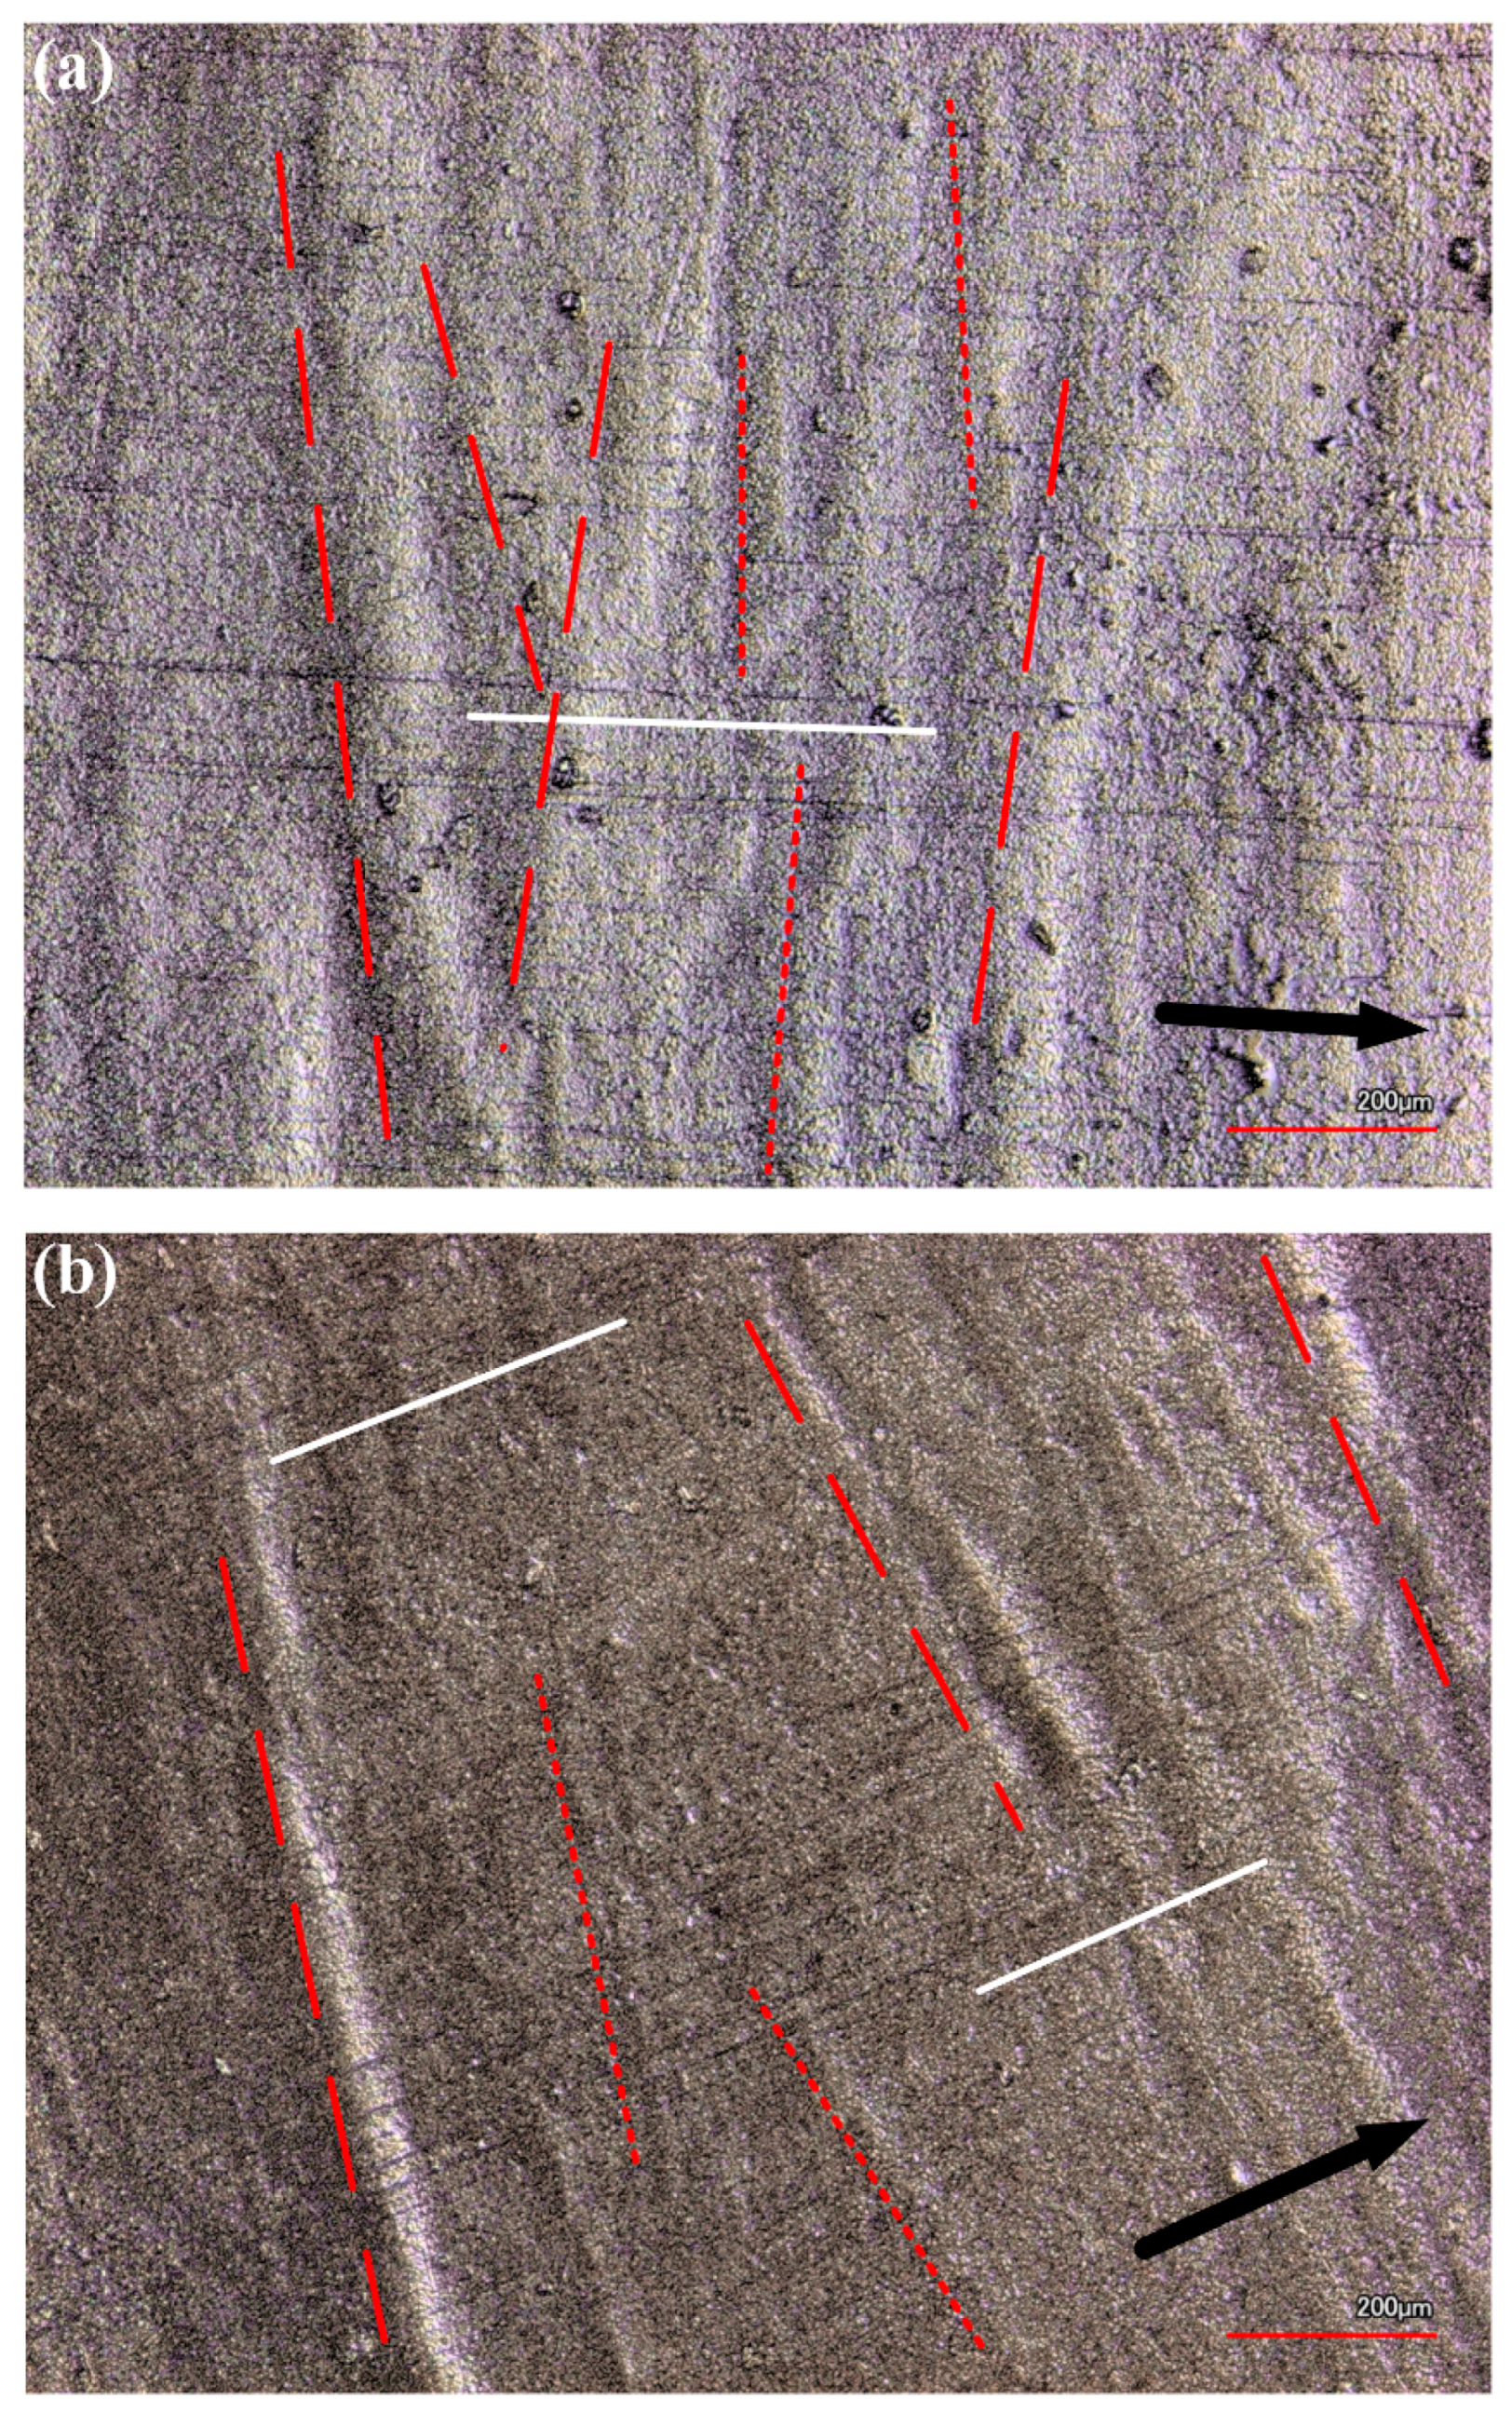
It is hard to detect the creep deformation directly in this study. However, we can examine the wear surface within the adhesive zone to identify the existence of the creep deformation. As far as we know, the creep deformation is beyond the extent of the elastic deformation and it cannot recover to its original shape [32]. As shown in Figure 13a, the rubber surface is full of wrinkles which are perpendicular to the direction of sliding when the increasing rate of FT is 0.062 N/s. It is deduced that the wrinkles can be seen as the permanent deformation due to the creep. When the increasing rate of FT is 1.5 N/s, fewer wrinkles are observed on the rubber surface (Figure 13b), this phenomenon may indicate that the creep deformation is weaker distinctly than that for the low increasing rate condition.
Therefore, it is concluded that the instability of the static frictional behaviors of rubber contact that are observed in this research can be seen as consequences of the interaction between normal load and increasing tangential load. Apparently, the increasing rate of FT takes the primary effort to cause fluctuation in the maximum static friction. For the low increasing rate, the creep deformation acts as a function of decreasing the static friction, whereas for the high increasing rate, the creep deformation cannot behave active due to short loading time. On the contrary, the propagation of the folds on the rubber surface becomes distinct with the increasing rate of the tangential load and makes the critical value of the tangential load that initiates the macroscopic slip between interfaces increase.
It is inevitable to note that the instability of contact stays in a certain rage of normal load. As is mentioned in Section 3.1, the fluctuation of the F is getting less intense as the normal load increases for the stiff rubber sample (rubber B). The reason for this phenomenon is mainly attributed to the high compression stress, which is concentrated in the contact area and the high elastic modulus of the rubber, both of them restricting the deformation of the rubber surface. For the soft rubber (rubber A), deformation of the rubber surface can still occur even the normal load is increasing.
The above discussions may not completely analyze the precise interactions between rubber and pipe samples. However, the results in this research propose that the maximum static friction fluctuates under different increasing tangential loads. The instability of F results from the combination of propagation of folds and creep deformation. These results may provide experimental knowledge for further systematic tensioner design and more accurate tribological behavior analysis of static contact.
5. Conclusions
An experimental investigation is set up using a self-built frictional testing instrument to uncover the static frictional behaviors of different rubber pipe contact pairs. The results show that values of the maximum static friction (F) increase with an increasing normal load, whereas it fluctuates due to different increasing rates of tangential load. It is observed that the contact area evolves obviously in stages with increase in the tangential load.
The fluctuation of the static friction results from the interaction between folds and creep deformation. On the one hand, the propagation of the folds on the rubber surface becomes distinct with the increasing rate of the tangential load and makes the critical value of the tangential load which initiates the macroscopic slip between interfaces increase. On the other hand, creep deformation behaves more actively at low increasing rates of tangential load, to decrease the maximum value of the static friction. In addition, the instability of contact stays in a certain rage of normal load, high compression stress restricts the propagation of folds and creep deformation on the rubber surface.
It is necessary to note that the creep deformation of the rubber surface may cause damage to the pipe-laying operation, when the pipeline is maintained by the tensioner. Even though the static friction increases due to the propagation of the folds, the high static friction cannot be lasting for a long time. Furthermore, the position of the pipeline is affected by the propagation of the folds on the rubber surface. Therefore, folds and creep deformation should be avoided during the pipe-laying operation.
Acknowledgments
This research is sponsored by the National Natural Science Foundation of China (No. 51375495), the Tribology Science Fund of State Key Laboratory of Tribology (No. SKLTKF14A08) and the Science Foundation of China University of Petroleum, Beijing (No. 2462017BJB06, C201602).
Author Contributions
Yong-Jie Zhou set up the test devices, performed tribology, and wrote the manuscript; Yan-Bao Guo and De-Guo Wang conceived research, performed mechanical testing, analysis, and contributed in writing the manuscript; Shu-Hai Liu contributed in analyzing results.
Conflicts of Interest
The authors declare no conflict of interest.
References
- Zhang, Z.; Wang, L.; Ci, H. An apparatus design and testing of a flexible pipe-laying in submarine context. Ocean Eng. 2015, 106, 386–395. [Google Scholar] [CrossRef]
- Szczotka, M. Pipe laying simulation with an active reel drive. Ocean Eng. 2010, 37, 539–548. [Google Scholar] [CrossRef]
- Beltrão, M.A.N.; Bastian, F.L. Fractographic analysis of weld metal and HAZ Regions of API X-80 Steel subjected to simulation of the Reel-Lay method. J. Mater. Eng. Perform. 2014, 23, 3523–3533. [Google Scholar] [CrossRef]
- Mattiazzo, G.; Stefano, M.; Guinzio, P.S. A tensioner simulator for use in a pipe laying design tool. Mechatronics 2009, 19, 1280–1285. [Google Scholar] [CrossRef]
- Tan, G.; Wang, D.; Liu, S.; Zhang, S. Probing tribological properties of waxy oil in pipeline pigging with fluorescence technique. Tribol. Int. 2014, 71, 26–37. [Google Scholar] [CrossRef]
- Persson, B.N.J. Theory of rubber friction and contact mechanics. J. Chem. Phys. 2001, 115, 3840–3861. [Google Scholar] [CrossRef]
- Lang, A.; Manfred, K. Influences of temperature and load on the dry friction behaviour of tire tread compounds in contact with rough granite. Wear 2017, 380, 15–25. [Google Scholar] [CrossRef]
- Johnson, K.L.; Kendall, K.; Roberts, A.D. Surface energy and the contact of elastic solids. Proceedings of the Royal Society of London A: Mathematical, Physical and Engineering Sciences. R. Soc. 1971, 324, 301–313. [Google Scholar] [CrossRef]
- Schallamach, A. How does rubber slide? Wear 1971, 17, 301–312. [Google Scholar] [CrossRef]
- Fukahori, Y.; Gabriel, P.; Busfield, J.J.C. How does rubber truly slide between Schallamach waves and stick–slip motion? Wear 2010, 269, 854–866. [Google Scholar] [CrossRef]
- Brörmann, K.; Barel, I.; Urbakh, M.; Bennewitz, R. Friction on a microstructured elastomer surface. Tribol. Lett. 2013, 50, 3–15. [Google Scholar] [CrossRef]
- Ghosh, A.; Leonard, B.; Sadeghi, F. A stress based damage mechanics model to simulate fretting wear of Hertzian line contact in partial slip. Wear 2013, 307, 87–99. [Google Scholar] [CrossRef]
- Mindlin, R.D. Compliance of elastic bodies in contact. J. Appl. Mech. 1949, 16, 259–268. [Google Scholar]
- Persson, B.N.J.; Albohr, O.; Mancosu, F.; Peveri, V.; Samoilov, V.N.; Sivebæk, I.M. On the nature of the static friction, kinetic friction and creep. Wear 2003, 254, 835–851. [Google Scholar] [CrossRef]
- Cho, D.H.; Bhushan, B.; Dyess, J. Mechanisms of static and kinetic friction of polypropylene, polyethylene terephthalate, and high-density polyethylene pairs during sliding. Tribol. Int. 2016, 94, 165–175. [Google Scholar] [CrossRef]
- Loeve, A.J.; Krijger, T.; Mugge, W.; Breedveld, P.; Dodou, D.; Dankelman, J. Static friction of stainless steel wire rope-rubber contacts. Wear 2014, 319, 27–37. [Google Scholar] [CrossRef]
- Deladi, E.L.; De Rooij, M.B.; Schipper, D.J. Modelling of static friction in rubber-metal contact. Tribol. Int. 2007, 40, 588–594. [Google Scholar] [CrossRef]
- Maugis, D.; Barquins, M. Fracture mechanics and adherence of viscoelastic solids. Adhes. Adsorpt. Polym. 1980, 12, 203–277. [Google Scholar]
- Savkoor, A.R. Mechanics of sliding friction of elastomers. Wear 1986, 113, 37–60. [Google Scholar] [CrossRef]
- Scheibert, J.; Dysthe, D.K. Role of friction-induced torque in stick-slip motion. Europhys. Lett. 2010, 92, 54001. [Google Scholar] [CrossRef]
- Nguyen, D.T.; Paolino, P.; Audry, M.C. Surface pressure and shear stress fields within a frictional contact on rubber. J. Adhes. 2011, 87, 235–250. [Google Scholar] [CrossRef]
- Zhou, Y.; Wang, D.; Guo, Y. The Reduction of Static Friction of Rubber Contact under Sea Water Droplet Lubrication. Lubricants 2017, 5, 12. [Google Scholar] [CrossRef]
- Cao, Z.Q.; Wang, D.G.; Cong, C.B.; Wang, Y.F.; Zhou, Q. Dependence of abrasion behavior on cross-linked heterogeneity in unfilled nitrile rubber. Tribol. Int. 2014, 69, 141–149. [Google Scholar] [CrossRef]
- Persson, B.N.J.; Albohr, O.; Tartaglino, U.; Volokitin, A.I.; Tosatti, E. On the nature of surface roughness with application to contact mechanics, sealing, rubber friction and adhesion. J. Phys. 2004, 17, R1. [Google Scholar] [CrossRef] [PubMed]
- Liu, S.; Tan, G.; Wang, D. Microbubble phenomenon in contact area between soft tribological interfaces in sliding contact. Tribol. Lett. 2015, 57, 17. [Google Scholar] [CrossRef]
- Król, D.J.; Wymysłowski, A.; Allaf, K.N. Adhesion work analysis through molecular modeling and wetting angle measurement. Microelectron. Reliab. 2015, 55, 758–764. [Google Scholar]
- Maegawa, S.; Itoigawa, F.; Nakamura, T. Effect of normal load on friction coefficient for sliding contact between rough rubber surface and rigid smooth plane. Tribol. Int. 2015, 92, 335–343. [Google Scholar] [CrossRef]
- Zhang, J.; Ru, J.; Chen, H.; Li, D.; Lu, J. Viscoelastic creep and relaxation of dielectric elastomers characterized by a Kelvin-Voigt-Maxwell model. Appl. Phys. Lett. 2017, 110, 044104. [Google Scholar] [CrossRef]
- Kashiwagi, T.; Mu, M.; Winey, K.; Cipriano, B.; Raghavan, S.R.; Pack, S.; Harris, R. Relation between the viscoelastic and flammability properties of polymer nanocomposites. Polymer 2008, 49, 4358–4368. [Google Scholar] [CrossRef]
- Fleury, G.; Schlatter, G.; Brochon, C.; Travelet, C.; Lapp, A.; Lindner, P.; Hadziioannou, G. Topological polymer networks with sliding cross-link points: The “sliding gels”. Relationship between their molecular structure and the viscoelastic as well as the swelling properties. Macromolecules 2007, 40, 535–543. [Google Scholar] [CrossRef]
- Barquins, M. Adherence, friction and wear of rubber-like materials. Wear 1992, 158, 87–117. [Google Scholar] [CrossRef]
- Georgiopoulos, P.; Kontou, E.; Christopoulos, A. Short-term creep behavior of a biodegradable polymer reinforced with wood-fibers. Compos. Eng. 2015, 80, 134–144. [Google Scholar] [CrossRef]
Figure 1.
Schematic view of the rubber contact during pipe-laying operation. (a) Schematic view of the beginning of the pipe-laying operation; (b) Functional mode of the tensioner; (c) Schematic view of the rubber- pipe contact system. (FN, the normal load; FT, the tangential load; V, the velocity of the pipeline.)

Figure 2.
The shapes and dimensions of rubber and pipe samples. Rubber A and B; Steel pipe and PMMA pipe.
Figure 2.
The shapes and dimensions of rubber and pipe samples. Rubber A and B; Steel pipe and PMMA pipe.

Figure 3.
Schematic view of the frictional testing instrument.

Figure 4.
The maximum static frictions (F) of rubber - pipe tests; (a) Rubber A-pipe tests; (b) Rubber B-pipe tests.
Figure 4.
The maximum static frictions (F) of rubber - pipe tests; (a) Rubber A-pipe tests; (b) Rubber B-pipe tests.

Figure 5.
Coefficient of the static friction versus normal load; (a) Rubber samples in contact with steel; (b) Rubber samples in contact with PMMA.
Figure 5.
Coefficient of the static friction versus normal load; (a) Rubber samples in contact with steel; (b) Rubber samples in contact with PMMA.

Figure 6.
Evolution of the rubber A-PMMA contact area. Normal load: 30 N; increasing rate of FT: 0.062 N/s; (a) Stable contact area; (b) The contact area deforms due to the tangential load; (c) The fold appears as the tangential load increases; (d) The contact area deforms with the integral elastic deformation of the rubber sample; (e) Shrink of the central adhesive zone; (f) The instant of the macroscopic slip. Six black lines are marked from 1–6; the white dotted lines circle the areas which deform distinctly due to the tangential load; the red dotted lines circle the central adhesive zone.

Figure 7.
Evolution of the rubber A-PMMA contact area. Normal load: 30 N; increasing rate FT: 1.5 N/s; (a) Stable contact area; (b) The contact area deforms due to the tangential load; (c) The folds appear as the tangential load increases; (d) The propagation of the folds; (e) The folds is stopped adjacent the boundary of the central adhesive zone; (f) The instant of the macroscopic slip. Six black lines are marked from 1–6.

Figure 8.
Calculating values by the JKR theory and measured values from the video frames versus the normal load. The maximum static friction undergoes the same trend with the adhesive contact area.
Figure 8.
Calculating values by the JKR theory and measured values from the video frames versus the normal load. The maximum static friction undergoes the same trend with the adhesive contact area.

Figure 9.
The soft contact model for relative smooth interfaces; μ is coefficient of friction; Areal is real contact area; ψ is constant factor for the rubber sample. The μ/ψ and Areal/ψ indicate that even for different rubber samples, coefficient of friction and real contact area behave in their same tendencies, respectively.

Figure 10.
Schematic cutaway views of the rubber A-PMMA contact during a whole test run. Normal load: 30 N; Increasing rate of the FT: 1.5 N/s; (a) Stable contact area without tangential load; (b) The folds appear as the tangential load increases; (c) The propagation of the folds; (d) The folds is stopped adjacent the boundary of the central adhesive zone; (e) The instant of the macroscopic slip.

Figure 11.
Schematic cutaway views of the rubber A-PMMA contact during a whole test run. Normal load: 30 N; Increasing rate of FT: 0.062 N/s; (a) Stable contact area without tangential load; (b) Few folds appear as the tangential load increases; (c) Deformation of the contact area due to a rotation of the rubber sample; (d) The instant of the macroscopic slip.
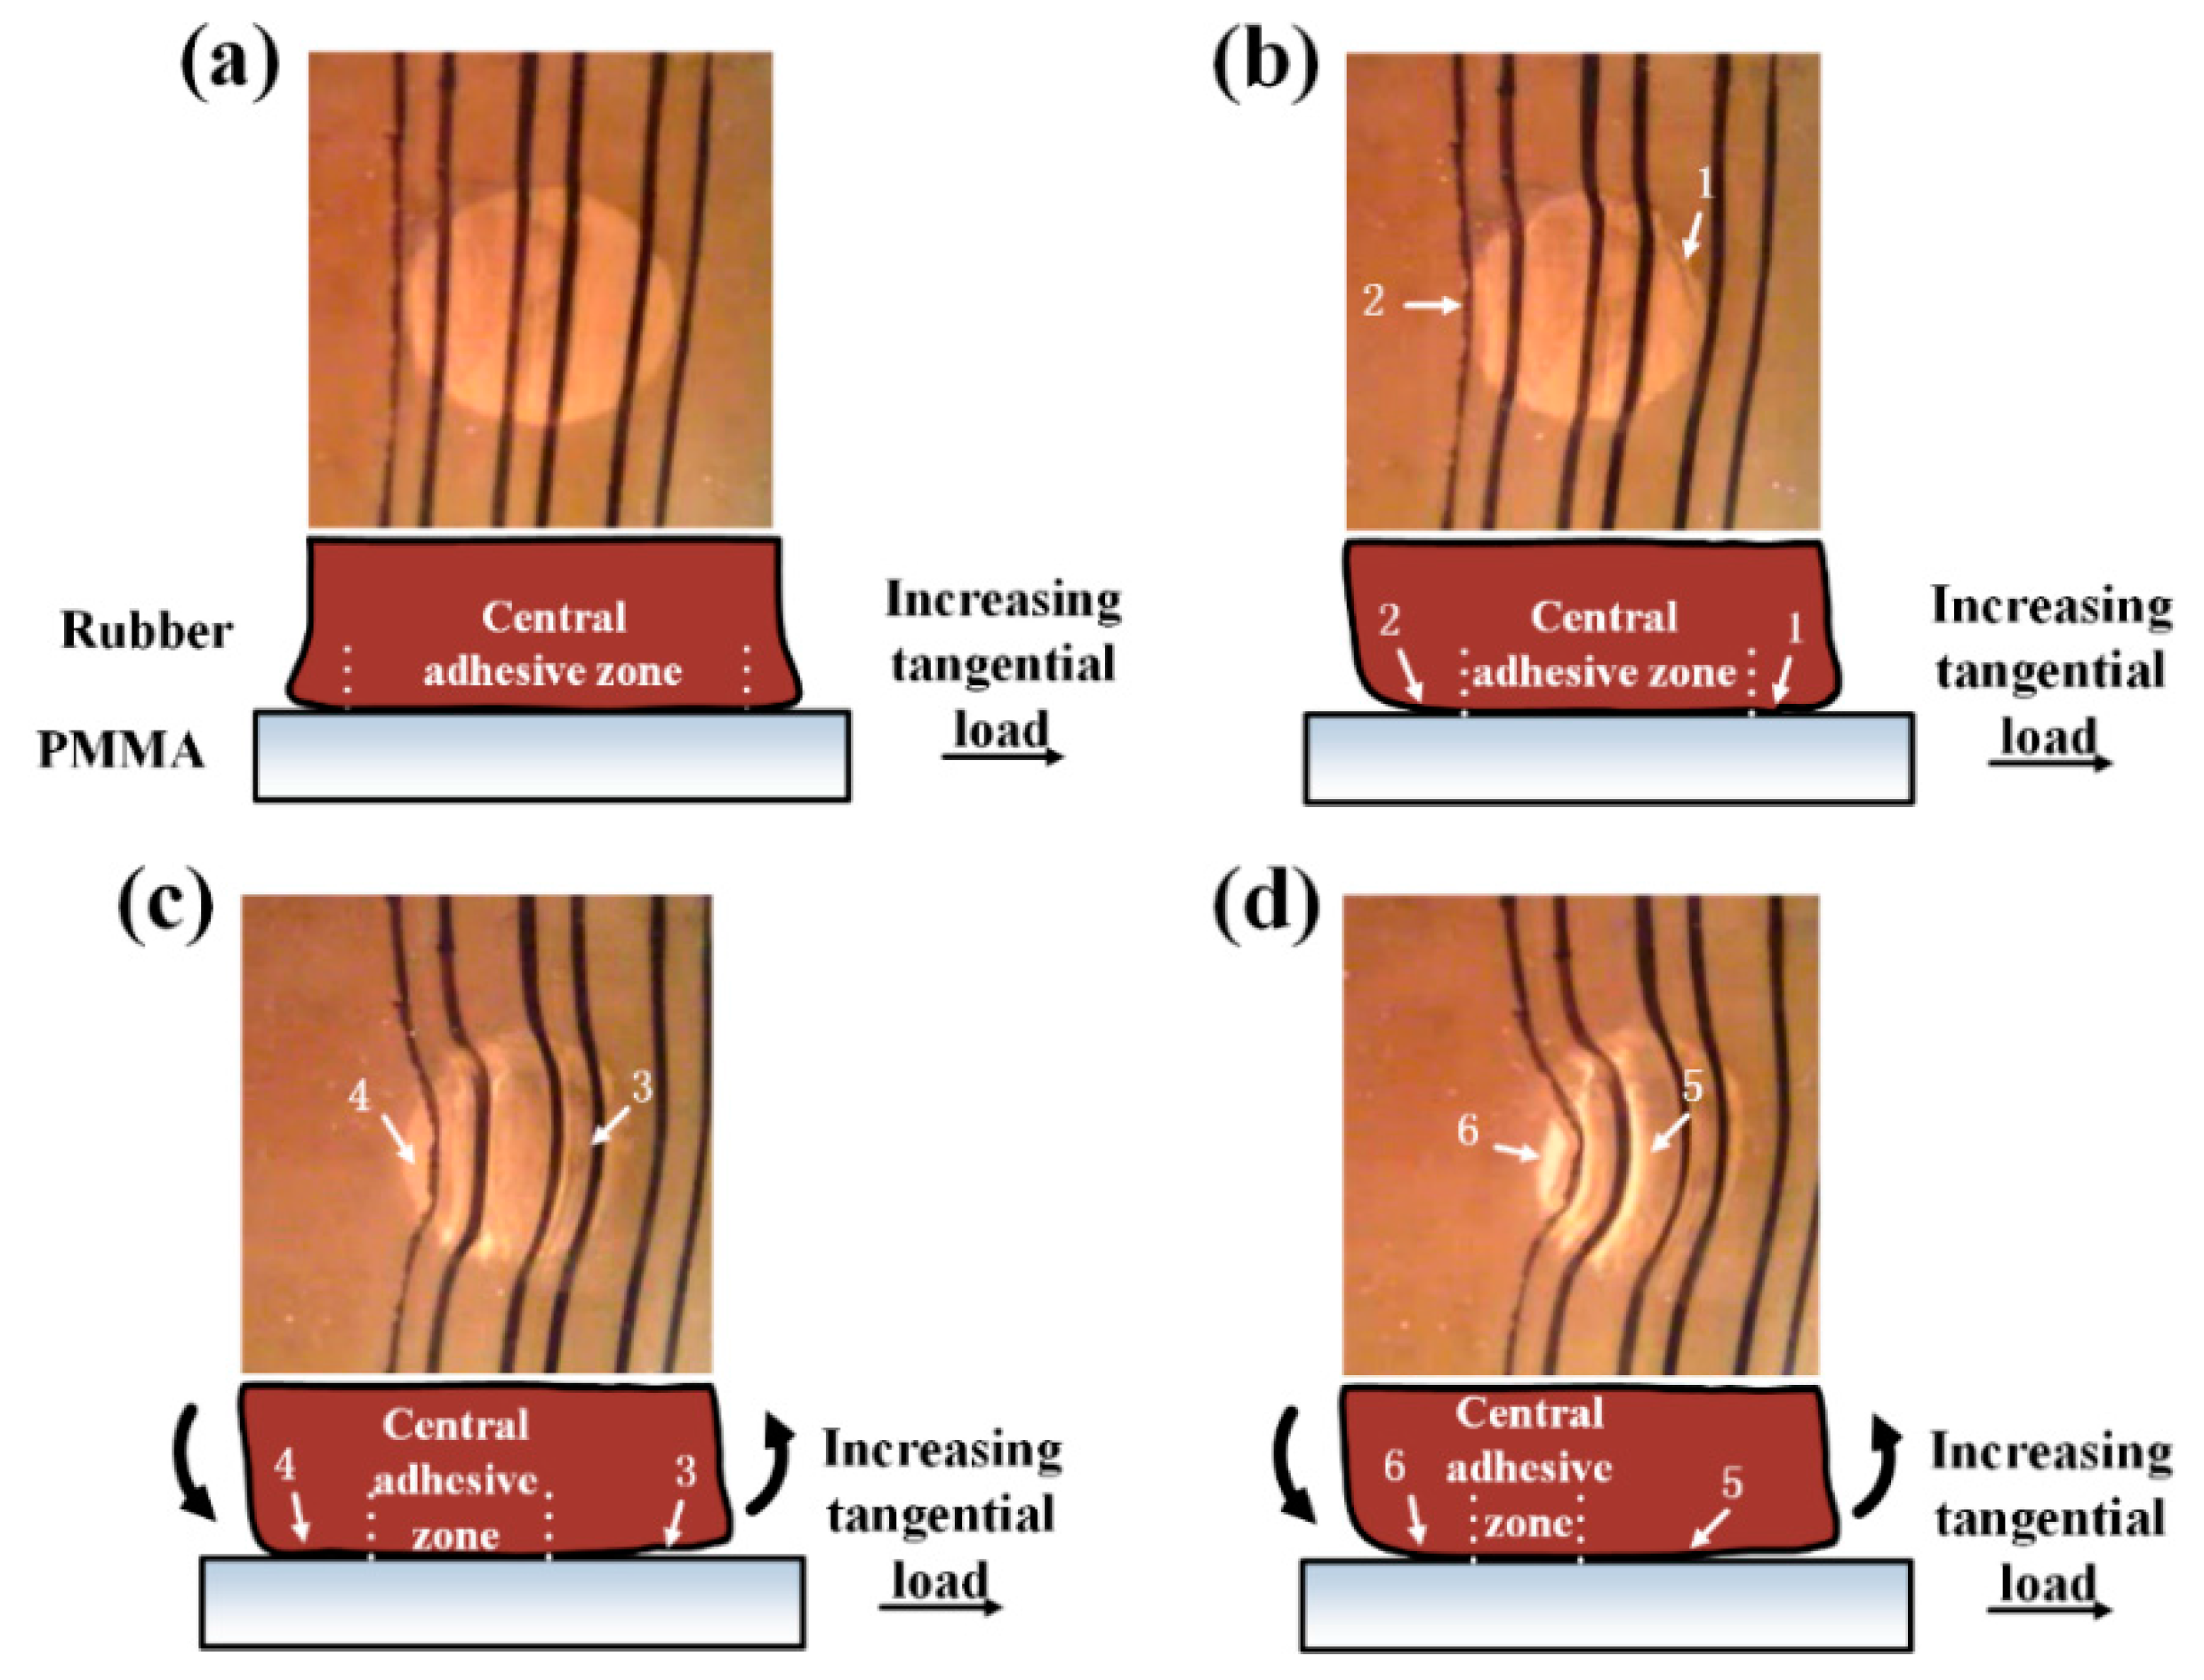
Figure 12.
Creep deformation of the rubber surface at the rear edge of the contact area; (a) The tangential load starts to affect; (b) Adhesive junctions reach limitation of elastic deformation; (c) some of adhesive junctions have been further creep deformed, whereas the other adhesive junctions do not have enough time to creep.

Figure 13.
Wear morphology of the rubber surface within the adhesive zone; (a) Increasing rate of FT: 0.062 N/s; (b) Increasing rate of FT: 1.5 N/s. Normal load: 30 N. The black arrow line: direction of the tangential load; The white straight line: inherent texture of the rubber surface; The red broken line: distinct wrinkle at the rubber surface; The red dotted line: fine wrinkle at the rubber surface.


Table 1.
Mechanical properties of rubber A and B; Ra: roughness in average; RMS: Root Mean Square roughness.
Table 1.
Mechanical properties of rubber A and B; Ra: roughness in average; RMS: Root Mean Square roughness.
| Rubber Type | Mechanical Properties | ||||
|---|---|---|---|---|---|
| Elastic Modulus | Tensile Strength | Shore Hardness | Roughness | ||
| [MPa] | [MPa] | Ra [μm] | RMS [nm] | ||
| A | 2.26 | 13.2 | 37 | 3.1 | 125 |
| B | 3.7 | 12.79 | 51 | 3.2 | 126 |
Table 2.
Mechanical properties of the steel and PMMA (polymethyl methacrylate) pipe.
| Pipe Type | Mechanical Properties | |||
|---|---|---|---|---|
| Elastic Modulus | Rockwell Hardness | Roughness | ||
| [MPa] | Ra [μm] | RMS [nm] | ||
| Steel | 2.1 × 10⁵ | 80 | 1.7 | 68 |
| PMMA | 3 × 10³ | 99 | 1.6 | 65 |
Table 3.
Testing parameters.
| Rubber Type | Pipe Type | Normal Load [N] | Increasing Rate of FT [N/s] |
|---|---|---|---|
| A | Steel, PMMA | 10, 20, 30, 40 | 0.062, 0.171, 0.36, 0.52, 1.5 |
| B | Steel, PMMA |
© 2017 by the authors. Licensee MDPI, Basel, Switzerland. This article is an open access article distributed under the terms and conditions of the Creative Commons Attribution (CC BY) license (http://creativecommons.org/licenses/by/4.0/).
Share and Cite
MDPI and ACS Style
Zhou, Y.-J.; Wang, D.-G.; Guo, Y.-B.; Liu, S.-H. The Static Frictional Behaviors of Rubber for Pipe-Laying Operation. Appl. Sci. 2017, 7, 760. https://doi.org/10.3390/app7080760
AMA Style
Zhou Y-J, Wang D-G, Guo Y-B, Liu S-H. The Static Frictional Behaviors of Rubber for Pipe-Laying Operation. Applied Sciences. 2017; 7(8):760. https://doi.org/10.3390/app7080760
Chicago/Turabian StyleZhou, Yong-Jie, De-Guo Wang, Yan-Bao Guo, and Shu-Hai Liu. 2017. "The Static Frictional Behaviors of Rubber for Pipe-Laying Operation" Applied Sciences 7, no. 8: 760. https://doi.org/10.3390/app7080760
Note that from the first issue of 2016, this journal uses article numbers instead of page numbers. See further details here.