Effects of Vibration on the Electrical Performance of Lithium-Ion Cells Based on Mathematical Statistics


1
National Center for Materials Service Safety, University of Science and Technology Beijing, Beijing 100083, China
2
School of Chemistry and Biological Engineering, University of Science and Technology Beijing, Beijing 100083, China
*
Author to whom correspondence should be addressed.
Appl. Sci. 2017, 7(8), 802; https://doi.org/10.3390/app7080802
Submission received: 20 June 2017
/
Revised: 23 July 2017
/
Accepted: 5 August 2017
/
Published: 7 August 2017
(This article belongs to the Special Issue Solid-State Batteries)
Abstract
:Lithium-ion batteries are increasingly used in mobile applications where mechanical vibrations and shocks are a constant companion. There is evidence both in the academic and industrial communities to suggest that the electrical performance and mechanical properties of the lithium-ion cells of an electric vehicle (EV) are affected by the road-induced vibration. However, only a few studies related to the effects of vibration on the degradation of electrical performance of lithium-ion batteries have been approached. Therefore, this paper aimed to investigate the effects of vibration on the DC resistance, 1C capacity and consistency of NCR18650BE lithium-ion cells. Based on mathematical statistics, the method changes of the DC resistance and the capacity of the cells both before and after the test were analyzed with a large sample size. The results identified that a significant increase in DC resistance was observed as a result of vibration at the 95% confidence level, while typically a reduction in 1C capacity was also noted. In addition, based on a multi-feature quantity, a clustering algorithm was adopted to analyze the effect of vibration on cell consistency; the results show that the cell consistency had deteriorated after the vibration test.
1. Introduction
With the successful promotion of Tesla, electric vehicles have shown a rapid development trend in recent years. As the key technology of electric vehicles, research on the energy storage devices of lithium-ion batteries has become a state-of-the art research field [1]. Some researchers are focused on preparing new kinds of lithium-ion batteries, while others are studying the influence factors of lithium-ion batteries to improve their service life, mechanical durability and reliability. Compared with conventional factors such as the C-rate, the depth of discharge (DOD) and temperature, the vibration has not attracted widespread attention. Vibrations resulting from road roughness, acceleration inertia and sudden collision will seriously affect the mechanical properties and electrical performance of batteries.
The fatigue failure caused by vibration is a common problem in the research area in electrical power systems. The electrode material of lead-acid batteries [2,3] and the mechanical structure of proton exchange membrane fuel cells (PEMFC) [4] were deformed and cracked under the condition of the certain vibration load. In terms of electrical performance, it has been found that the voltage and power of the PEMFC did not obviously change after vibration and shock tests [5].
In the past 5 years, the influence of the mechanical force on lithium-ion batteries has attracted more and more attention from researchers. Some researchers have studied how to utilize vibration to achieve a health diagnosis [6] or energy harvesting [7]; while, at the same time, the battery array is configured to prevent the effects of vibration on the electric vehicle [8]. Via the static analysis of the battery pack level, the stress distribution of mechanical structure of the battery pack has also been considered to determine deformation induced by vibration load. In Ref. [9] the vibration durability of the battery tray was studied through experimentation and simulation techniques. The results showed that the load spectrum simulation experiment could reflect the road-induced vibration well. At the same time, it was also found that the vibration in the Z-axis direction was the most dominant excitation when compared to other axes. Moreover, the finite element model of the battery tray [10,11,12] was established to analyze the intrinsic mode and the characteristics of the responses caused by the random vibration. Based on the above, researchers have set out the design of the mechanical durability and electrical durability for the battery packaging structure [13,14].
In the past three years, research concerning the effects of vibration on single battery cells has been carried out from different aspects and provided different sorts of insight into the effects of the vibration on the electrical performance and the internal mechanical structure. At present, the effects of the vibration on the electrical performance have not yet been met by consistent conclusions. It is worth noting that the conclusions within Refs. [15,16] were opposite to each other. It is reported in Ref. [15] that the LiCoO2/mesocarbon microbeads (MCMB) battery displayed an increase by 3.77% in the ohmic resistance and displayed a reduction by 1.04% in the 1C capacity after vibration testing, while it is reported in Ref. [16] that the internal resistance of the lithium-ion battery was significantly decreased and the capacity was increased slightly after vibration testing. It has also been noticed that, within Refs. [15,16], conclusions are restricted due to the limited sample size employed, since each test condition was evaluated only by two single cells. Concerning this problem, some scholars have conducted further research. In Ref. [17], the method by which these mechanical loads affect lithium-ion cells was researched, and the results showed that in 18,650 cells stressed in the Z-direction the mandrel dispatched itself and struck against internal components, which were observed with a micro-computer tomograph, but the electrical performance exhibited no degradation. However, within Ref. [17], the 3 h load profile was carried out ten times with an inspection, so that battery resting time was not enough, resulting in the measurement uncertainty. In addition, each test condition was evaluated only by two single cells, and accidental errors also cannot be neglected, such as a sudden increase in battery resistance for the long-term vibrational test. In summary, while studies above have identified the effects of the vibration on the mechanical structure inside the lithium-ion cells, it is ambiguous whether the vibration had a significant effect on the electrical performance of lithium-ion cells. With regard to the problem of whether the deformation of the mechanical structure inside cells would lead to the degradation of electrical performance, research in Ref. [18] noted that the capacity fading of LiFePO4 batteries was caused by the formation of cracks inside the electrode material. Therefore, it is reasonable to suspect that the electrical performance of cells would be affected by the structural deformation and cracks inside cells induced by the vibration loading.
Hooper, J. and Marco, J. from Warwick University, dedicated to studying the vibration durability of lithium-ion batteries, have performed a great deal of related research works and efforts in recent years. In Ref. [19], the authors emphasized that studies on the vibration characteristics of the battery pack should attract more attention; in Ref. [20], the cells natural frequency was proposed by authors for the first time to quantify the mechanical characteristics of cells; in Refs. [21,22,23], 18,650 lithium-ion cells of different materials were investigated with different load profiles; and in Ref. [24], the authors defined a process to devise random power spectral density (PSD) profiles utilizing vibration measurements from three contemporary EVs, for undertaking vibration durability evaluations of underfloor mounted rechargeable energy storage systems (RESS). In brief, two scholars have opened up a wide range of the research space for this issue. It is reported that, within Ref. [21], these nickel manganese cobalt oxide (NMC) cells displayed a significant increase in ohmic resistance within the range of 25.82 to 38.09% after vibration testing, and a reduction in the measured 1C energy capacity was observed in some samples, with 12.22% being the greatest reduction observed. Due to the limited sample size employed, therefore, authors performed further research within Ref. [23], and this study identified that both the electrical performance and the mechanical properties of the nickel cobalt aluminum oxide (NCA) lithium-ion cells were relatively unaffected when exposed to the vibration energy that is commensurate with a typical EV life. However, the study also noted that a similar reduction in energy capacity and increase in DC resistance was witnessed within the reference samples, which indicated that the change in these electrical attributes was a function of other environmental conditions. Because the total duration between pre and post-test characterization was 3 months, the effect between the cell ageing and the vibration cannot be fully quantified. The authors also suggested that a further set of repeat tests should be conducted to increase the size of the data set, indicating that a greater sample size is necessary to increase confidence of findings.
From the review above, it can be seen that there is a problem when the sample size is too small; results are greatly affected by some accidental errors such as the cell-to-cell variation, the environmental factors and the measurement uncertainty. Consequently, it is difficult to identify whether the vibration or the accidental error leads to the change in the electrical performance of cells. Therefore, it is necessary to evaluate the change in the electrical performance of cells overall with a larger sample size. In this paper, 32 NCR18650BE lithium-ion cells are investigated with the load profile according to the standard Society of Automotive Engineers (SAE) J2380, and changes in the electrical performance of the samples before and after the test are analyzed by the mathematical statistic method. In addition, this paper also studies the effects of vibration on the cell consistency, based on the hierarchical clustering method.
This paper is structured as follows: Section 2 provides a detailed description of the experimental procedure, including the electrical performance testing method and the design of the vibration test profile. Results are presented in Section 3, and an assessment of the 1C capacity degradation is included as well as changes in DC resistance of the cell. Section 4 analyses the consistency of the cell before and after test. Conclusions are presented in Section 5.
2. Experimental Method
2.1. Determination of Sample Size
The determination of the sample size is critical to the accuracy of the test result. In general, the smaller the number of samples, the greater the error of the statistics, but the increase in the sample size is subject to many restrictions. In order to achieve the purpose of testing and minimize the error, the similar sample standard deviation σ and the acceptable estimation error E were known at a certain confidence level 1 − α in this paper. An equation of the sample size calculated could be derived as the following:
According to the prior data, which was tested by the same measurement method and the environment using the hybrid pulse power characterization (HPPC) test with an ambient temperature of 25 °C ± 3 °C around the kind of cells, the standard deviation of the resistance of the same batch battery is about 0.8 mΩ [25]. An estimation error of less than 1% is assumed. From the central limit theorem, the mean value of samples will obey the normal distribution for a sufficiently large sample size (n ≥ 30). Therefore, the value of the sample estimation error E is considered to be 0.28 mΩ, and the calculation result of n ≥ 31.36 was obtained at a 95% confidence level; therefore, 32 lithium-ion cells are used in this experiment.
2.2. Test Electrical Performance
2.2.1. The Program Design of Cell Sample Test
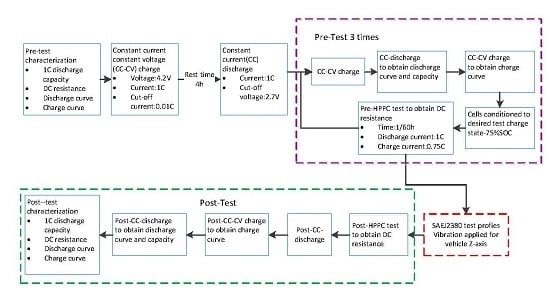
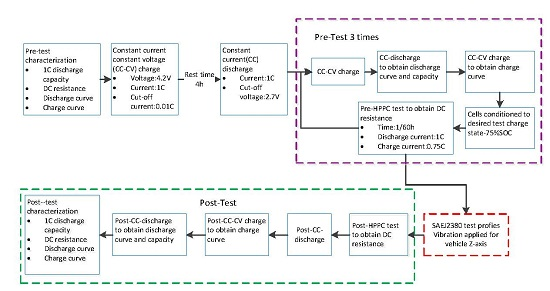
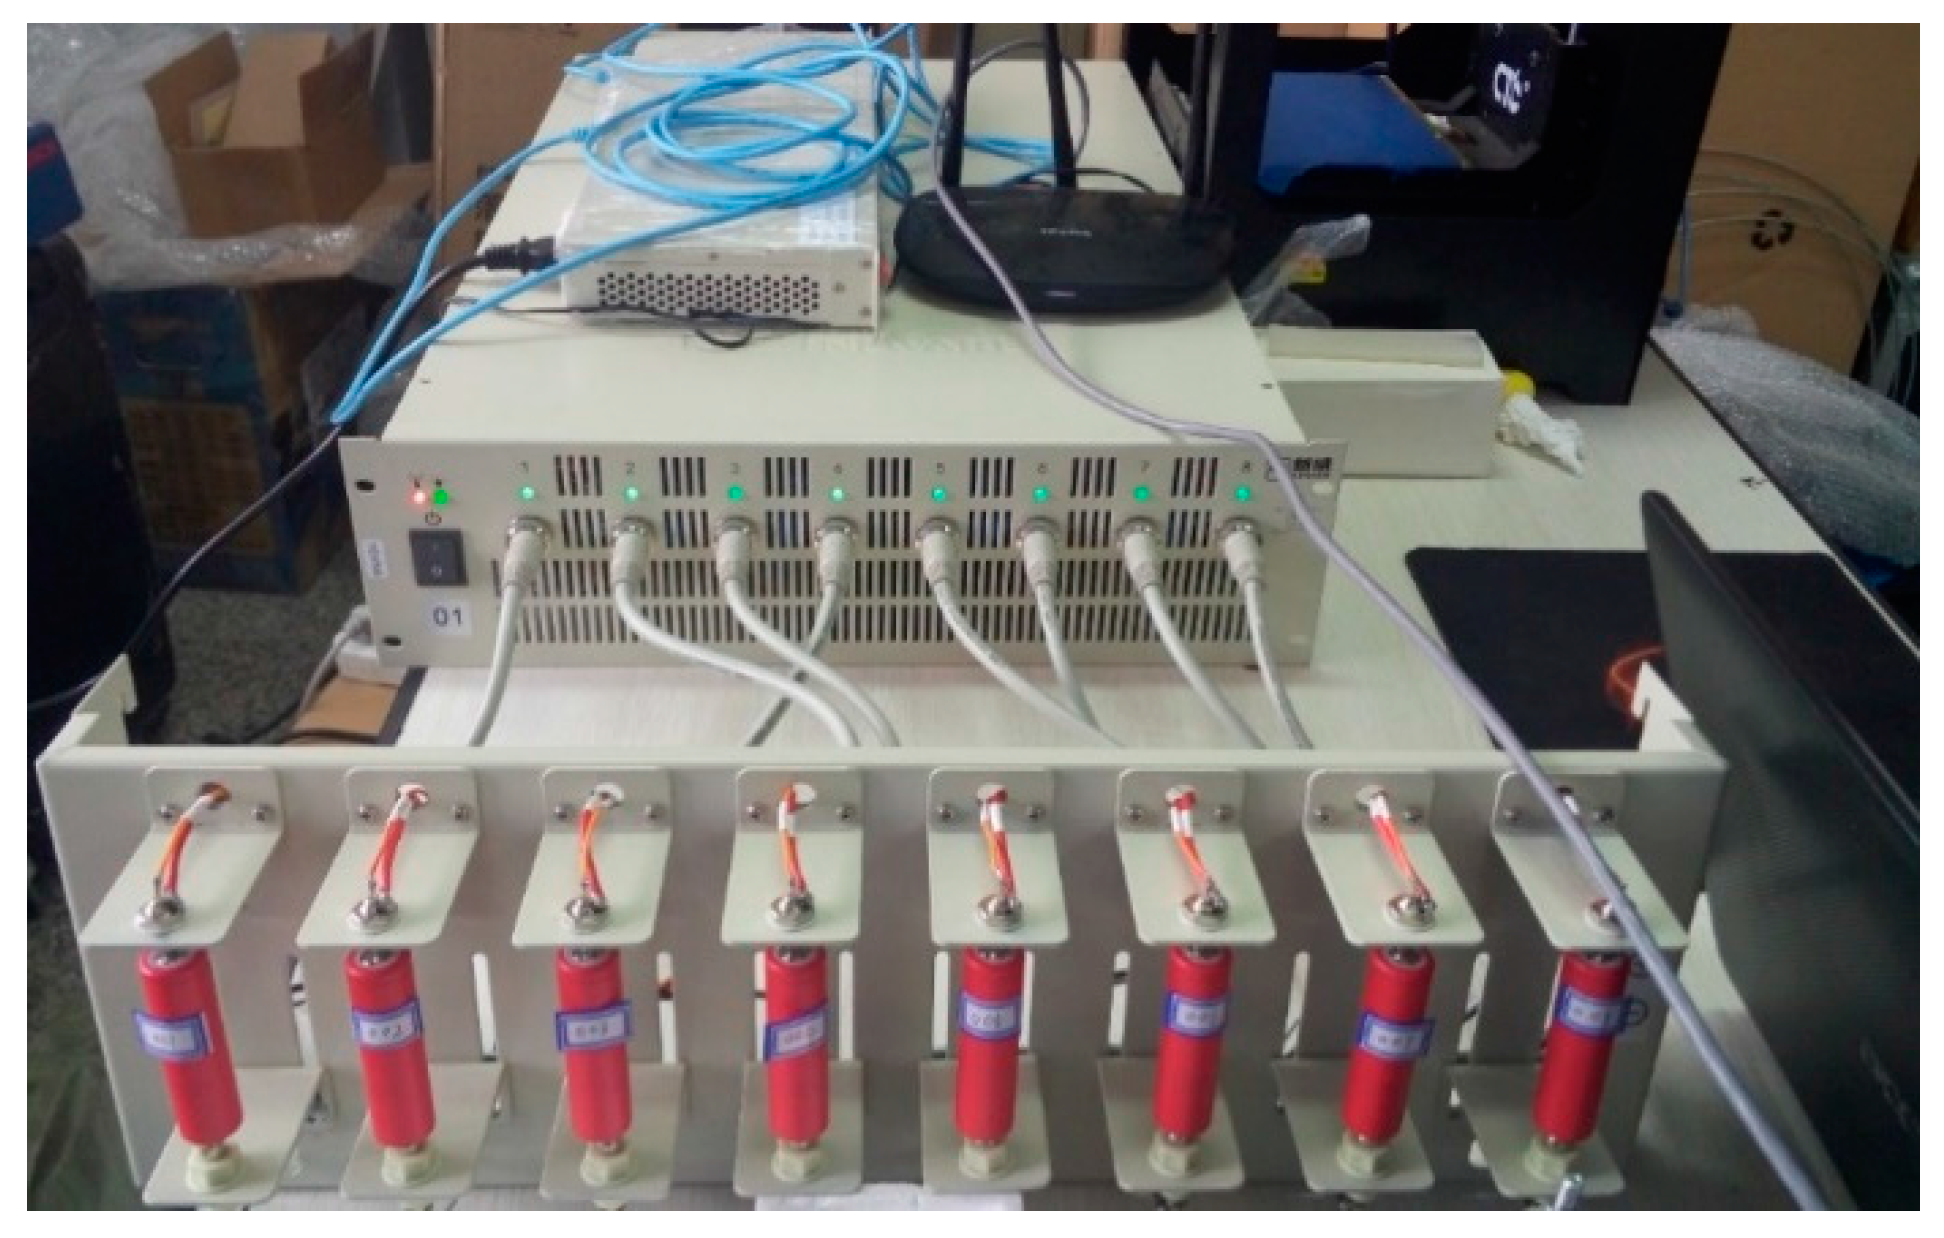
When accomplishing the electrical performance test of cells, internal resistance measurements are, in particular, very sensitive to electronic instrumentation and mechanical preparations; therefore, some precautions should be taken to produce consistent measurements throughout testing. A testing bench shown in Figure 1 is established; battery holders, cables or connectors are standard components of the battery management system. It is composed of a Battery Test System 4000 (BTS4000, NEWARE, Shenzhen, China) battery tester with eight independent channels, an intermediate machine, and a 64-bit host computer onto which a NEWARE BTS Software v7.5.6 and a MATLAB R2012a are installed. The battery tester is used to load the programmed current profiles on battery cells within a range of voltage of 0~10 V and a current of −6~6 A. The intermediate machine is mainly responsible for the network connection, receiving the control command from the host computer, controlling the lower battery cycler and uploading the real-time test data. The host computer is employed to control and monitor the cycler via Ethernet cables, as well as to store the voltage and current values acquired by sensors. Batteries, brackets, cables, or connectors, as shown in Figure 1, are standard components of the battery management system. The tested battery cells are Panasonic NCR18650BE cylindrical cells (LiCoO2 oxide) whose specifications mainly include the nominal capacity 3200 mAh, the operating voltage 3.7 V, the charging limit voltage 4.2 V, the discharge limit voltage 2.7 V and the maximum continuous discharging current 10 A. During the test, the battery current and the voltage values are recorded every second, while they are recorded every 10 ms during the PPC test. As for the vibrating table, 3 db/oct was applied in this experiment; the Switch-2 (SW-2) vibration controller and the MMF (Metra Mess- und Frequenztechnik in Radebeul e.K.) vibration accelerometer were also used. Based on the test bench, the detailed test steps about the electrical performance of cells are presented in Figure 2.
In pre-test, from Figure 2, constant current and constant voltage (CC-CV) charge and CC-discharge are performed first in order to allow new cells to achieve a stable state of the performance; the test data will therefore be more accurate. Between the two steps, cells were allowed to stabilize during a rest period of 4 h [26]. It was identified within Ref. [21] that cells conditioned to 75% state of charge (SOC) displayed a greater tendency for electrical degradation; therefore, each cell was allocated a sample reference number, pre-conditioned to 75% SOC. In order to reduce the measurement uncertainty of capacity and DC resistance, the cells’ characteristic values are used by the average of three measurement results.
Post testing, if no significant mechanical damage or degradation (such as electrolyte leakage or external fatigue cracking) was observed on any of test samples after the vibration test, then the DC resistance, capacity, charge and discharge curve were measured at the environment temperature ranging from 25 °C ± 3 °C.
2.2.2. Measuring the 1C Discharge Capacity
From the 100% SOC to the 0% SOC, the 1C constant current discharge to the cut-off voltage of 2.7 V to measure the cell capacity is used while recording the cell discharge curve.
2.2.3. Measurement Uncertainty of DC Resistance
Some factors that can affect testing reliability are cell temperature, calendar aging, etc. Hence, the definition of internal resistance and an accurate measurement of internal resistance is very important [27]. According to Ref. [28], the hybrid pulse power characterization (HPPC) test is used to measure the DC resistance, the calculation formula of which is as follows:
where U1 represents the no-load voltage and U2 represents the voltage of 100 ms measurement time after the voltage drop, and I represents the discharge [28].
An accurate measurement of internal resistance is critical, thus Equation (2) was used in this paper for bias estimation. The first item is the method error, the second item and the third item are the instrument error, and the fourth item is the environment error. The SOC, state of health (SOH), current, temperature and time of measurement can affect the accuracy and consistency of the measurements [29]. In this paper, all internal resistances are measured in the 75% SOC, the discharge current is 1C, the ambient temperature is 25 °C ± 3 °C, and the time of measurement is 100 ms; therefore, the influence of these factors on internal resistance will be greatly reduced. As for SOH, the cycle life of the test battery is greater than 1000; therefore, the effects of a few cycles on the internal resistance measurement are not very large. Therefore, in this paper, the internal resistance measurement is very accurate. The measurement uncertainty of resistance can be calculated by the following equation [28]:
where the , and measurement uncertainty are caused by measuring instruments; the accuracy of the battery test system used in this test is 0.01% full scale (FS). The measurement uncertainty are caused by the ambient temperature; the effect of this part can be neglected in this experiment as the ambient temperature remains unchanged. Consequently, the results of , and calculations are 0.6 mA, 1 mV and 1 mV, respectively, and the value of is about 0.625 mΩ. Eventually, the DC resistance can be written in (R ) format.
2.3. Design of Vibration Test
Both United Nations Recommendations on the Transport of Dangerous Goods (UN) 38.3 and SAE J2380 are common standards for the cell vibration and the shock test. The UN 38.3 standard was chosen within Ref. [17]; while regulation UN 38.3 is a legal requirement, the standard is primarily focused on emulating the worst case shock load and vibration that may be experienced by the cell. Load profiles are unrepresentative of those that would be experienced by the battery during road vehicle operation [19]. However, it is noteworthy that SAE J2380 vibration profiles defined have been synthesized from actual rough road measurement data and sequenced to emulate 100,000 miles of vehicle usage. In addition, the UN 38.3, ECE Regulation 100, SAE J2380 and BS 62660 standards were analyzed within Ref. [19]; the conclusion of the SAE J2380 standard could better reflect the actual vibration of lithium-ion cells which was obtained, and therefore the SAE J2380 standard is used in this paper. The test steps of the vertical direction (i.e., the Z-axis) are summarized in Table 1, and loading curves are presented in Figure 3
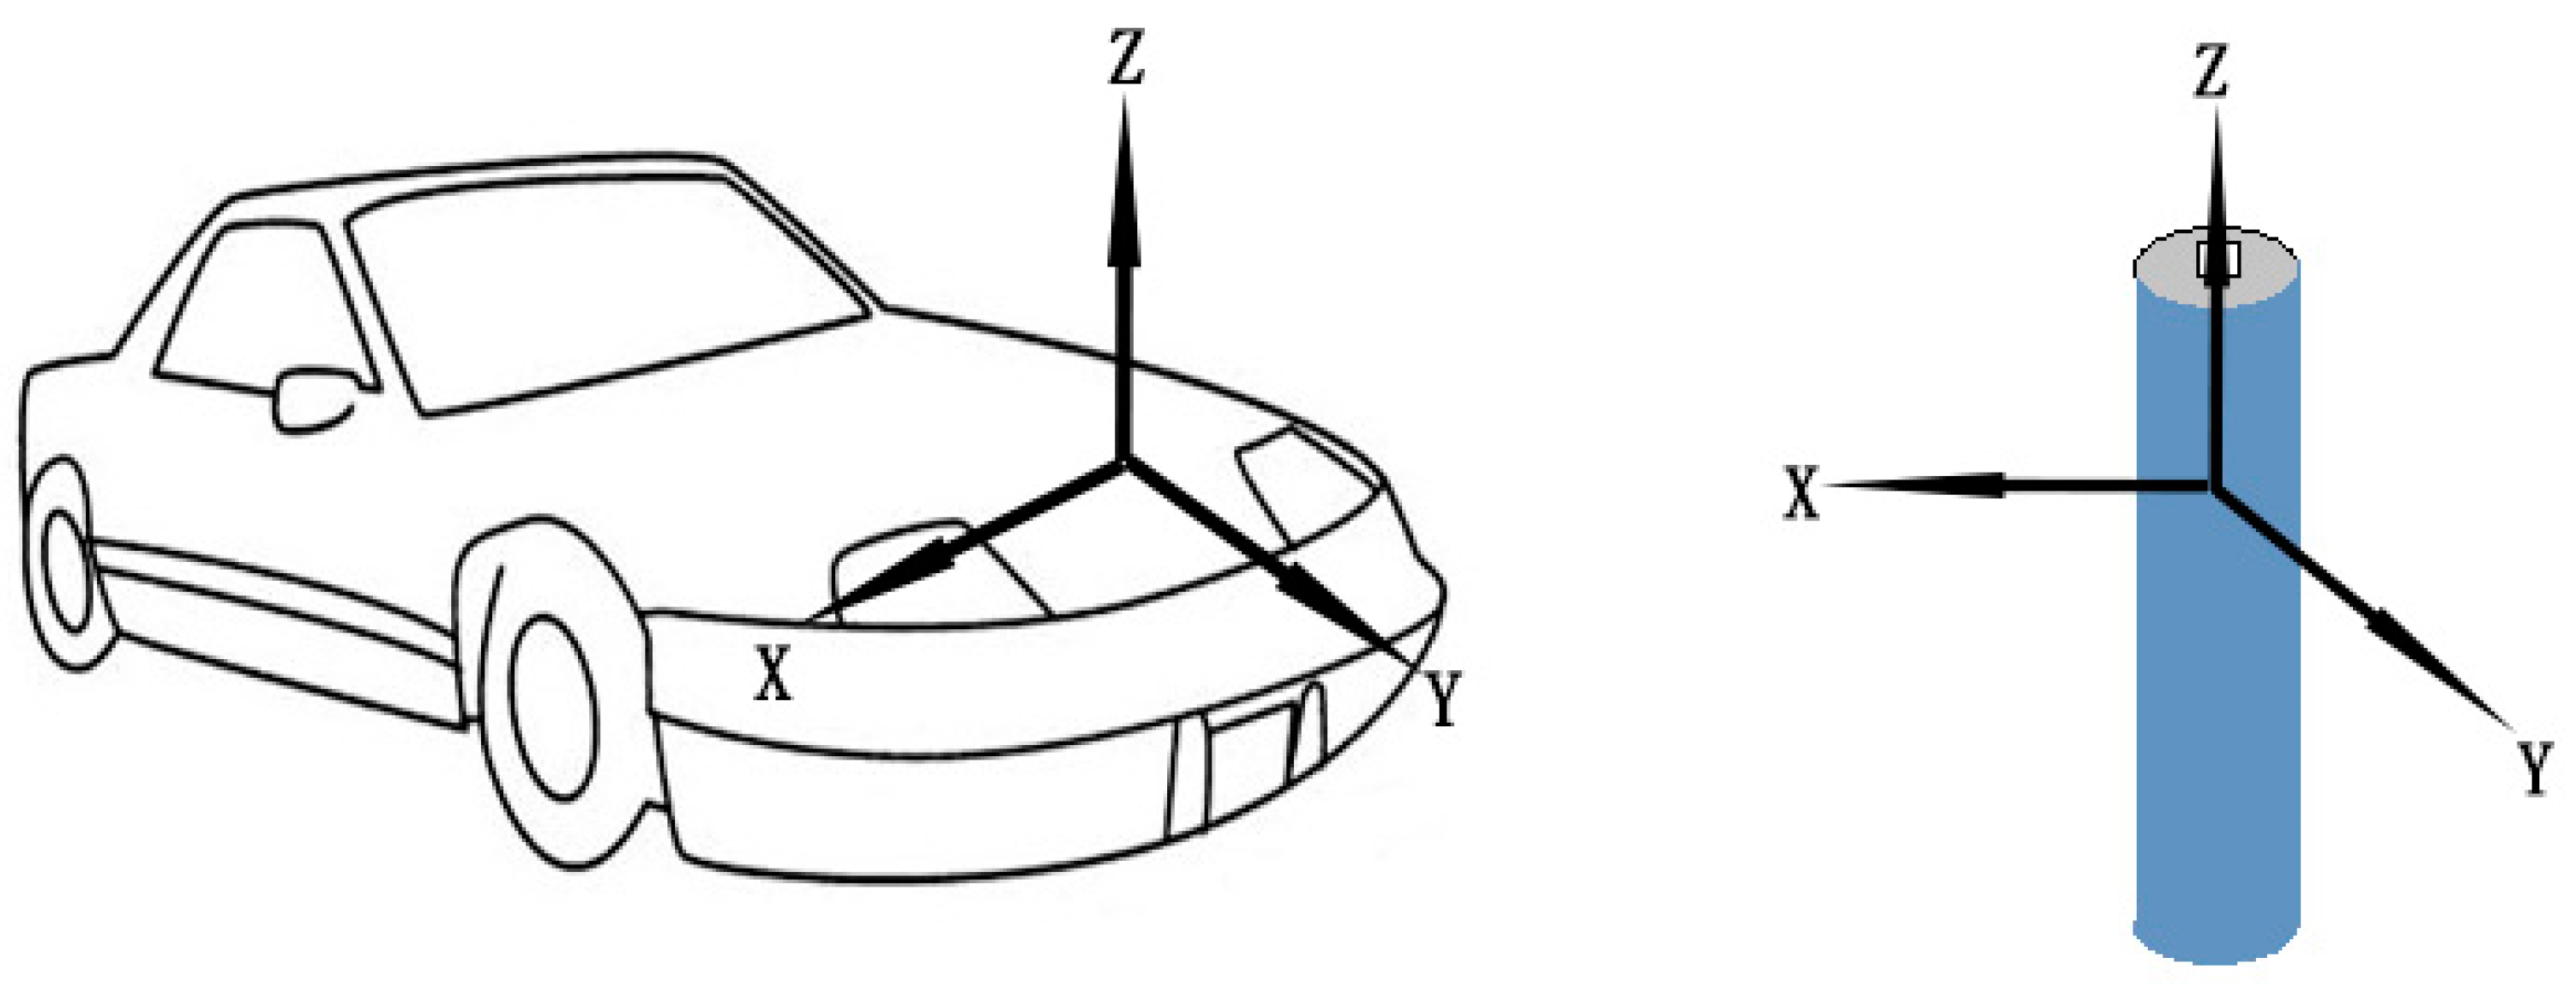
In this paper, a short-term vibration effect on the electrical properties of batteries was researched. On the premise that no resonance occurs during the vibration process, the test was carried out based on the SAE J2380 standard, but some steps in the actual process are different compared to the standard. For example, the standard requires the SOC at 100% and 20% to be complete, but a 75% SOC was used according to the literature [23]. In addition, the standard requires both X-axis and Y-axis direction to be used to conduct a certain vibration test, but it was noted within [9,17,21] that the Z-axis vibration displayed a greater tendency for electrical degradation. The Z-axis profile was only loaded in this paper, in order to eliminate the influence of the non-main vibration direction on the electrical performance. However, it should be noted that, even if the battery will be affected in a single vibration direction but three directions are subjected to vibration, this does not necessarily have an impact; therefore, it can be said that the contents of Refs. [21,23] are studied in detail. In addition, the test only considers the effect of short-term vibration on the electrical performance of the cell, and the test of long-term vibration is a key point of further research. The definition of directions is presented in Figure 4. The Z-direction defined by the battery is in accordance with the Z-direction defined by the electric vehicle.
3. Experimental Results
3.1. Effect of Vibration on 1C Discharge Capacity
3.1.1. Probability Density Function of Capacity Samples
In this paper, 32 lithium-ion cells are investigated, of which the 1C capacity before vibration are within the range of 2930 mAh to 3065 mAh and the 1C capacity after vibration are within the range of 2854 mAh to 3016 mAh. In order to obtain the distribution of 1C capacity of samples before and after vibration, samples are grouped in the first place and the number of groups is determined by the equation as follows:
where n represents the number of tested battery samples (32). Therefore, the capacity of samples should be divided into six groups.
The median value of each group is in accordance with the abscissa, and the observed probability density of each group as the ordinate is calculated as follows:
where ni represents the number of samples in each group, n represents the number of the total samples and represents group distance.
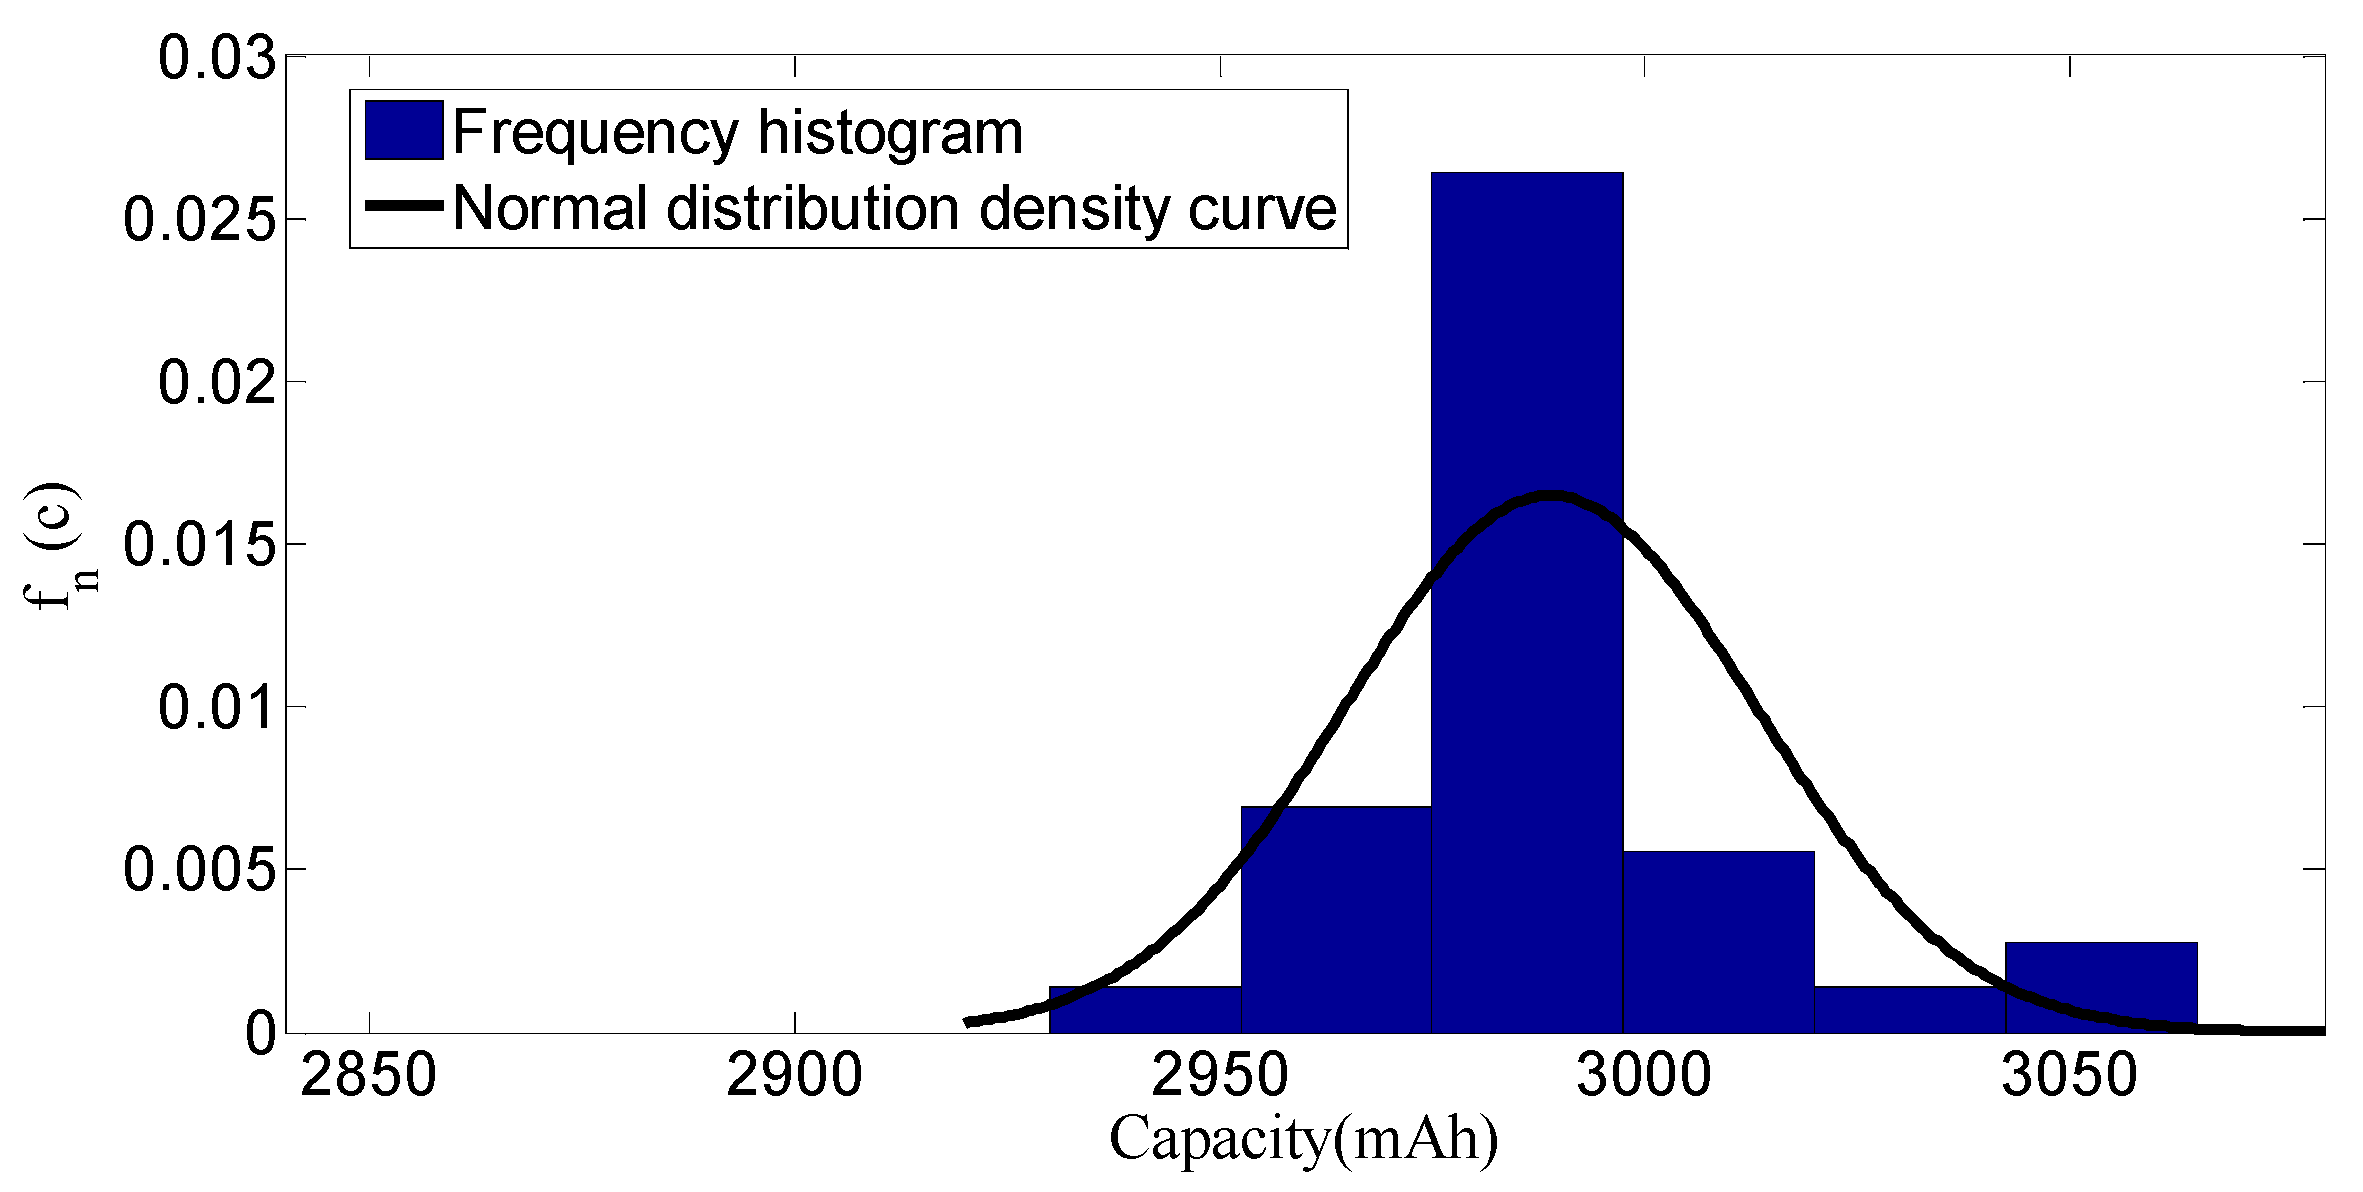
Based on Equation (5), the frequency histogram of the capacity before and after vibration is obtained; then, according to the sample distribution, the normal distribution probability density curve is also obtained, as shown in Figure 5 and Figure 6 respectively.
From the above figures, it can be seen that the frequency histogram is well in accordance with the corresponding standard normal distribution. In more detail, the frequency histogram before vibration is in accordance with the normal distribution N (2988.9, 24.17942), and the frequency histogram after vibration is in accordance with the normal distribution N (2920.1, 29.32572).
3.1.2. Cumulative Distribution Function of Capacity Samples
The theoretical cumulative distribution function of the capacity can be defined as follows:
where C represents the capacity of the samples and c represents the capacity of any cells.
Given the capacity sample in ascending order, the sample cumulative distribution function of the 1C capacity can be determined as the following:
According to the Glivenko–Cantelli theorem, when the sample size is large, the maximum difference between the empirical cumulative distribution function and the theoretical cumulative distribution function would be small; in other words, can be displaced by estimating .
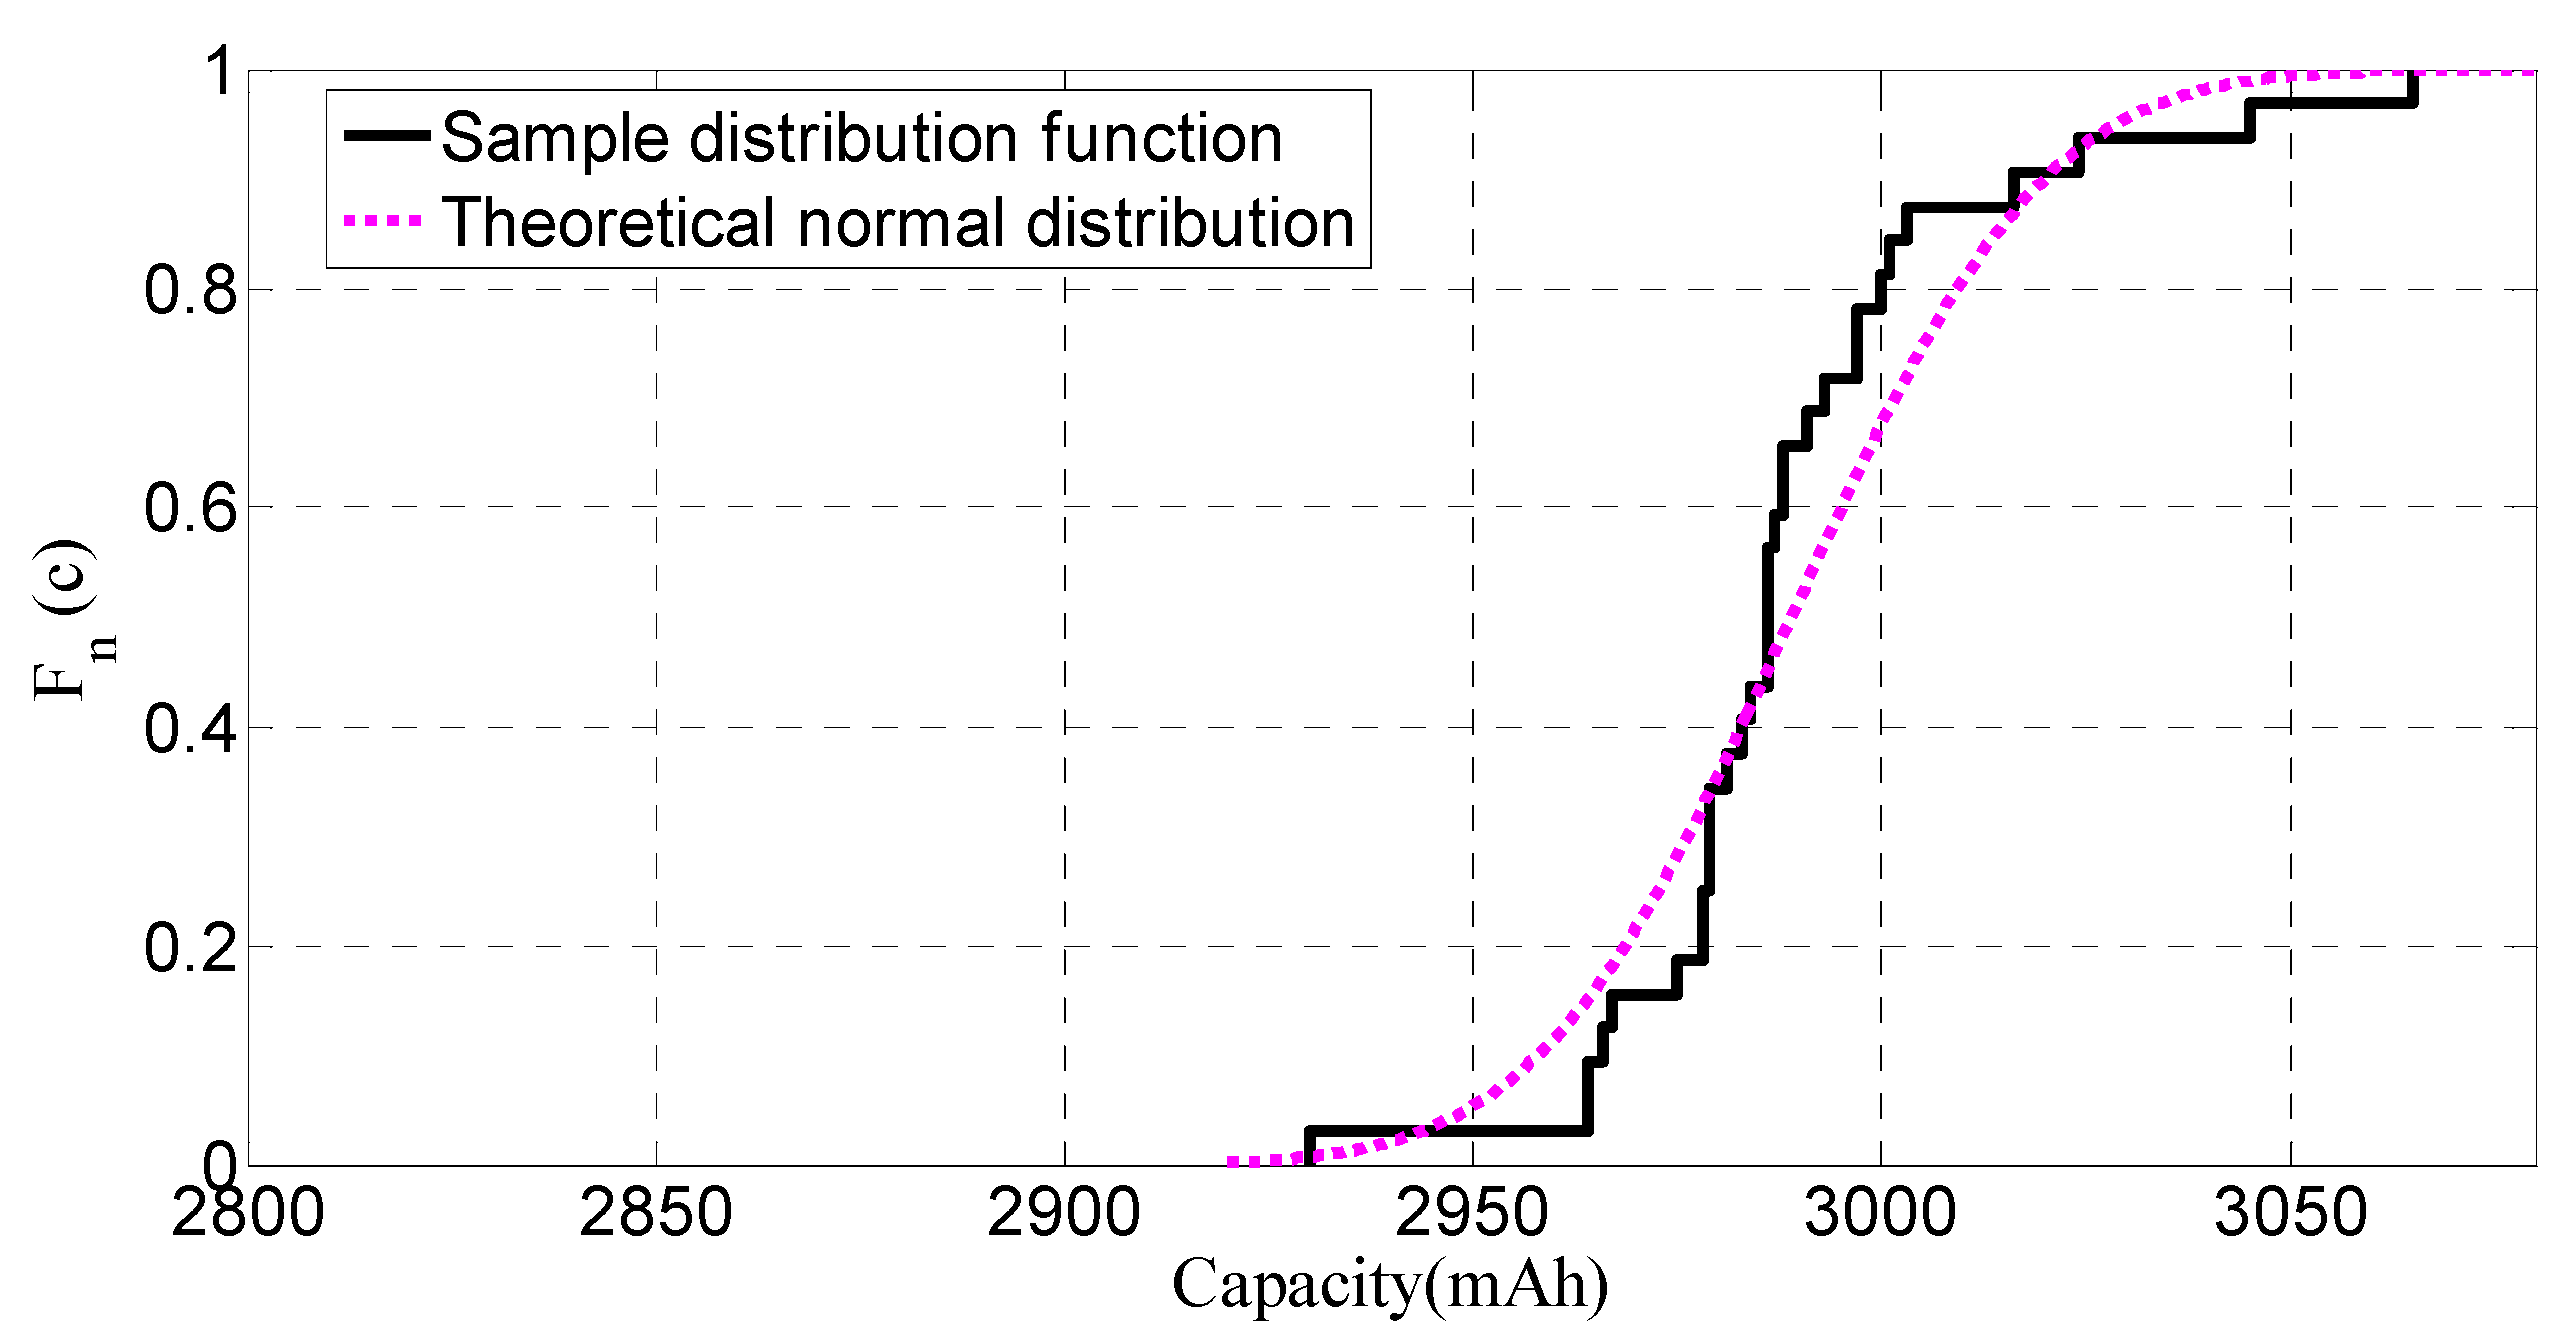
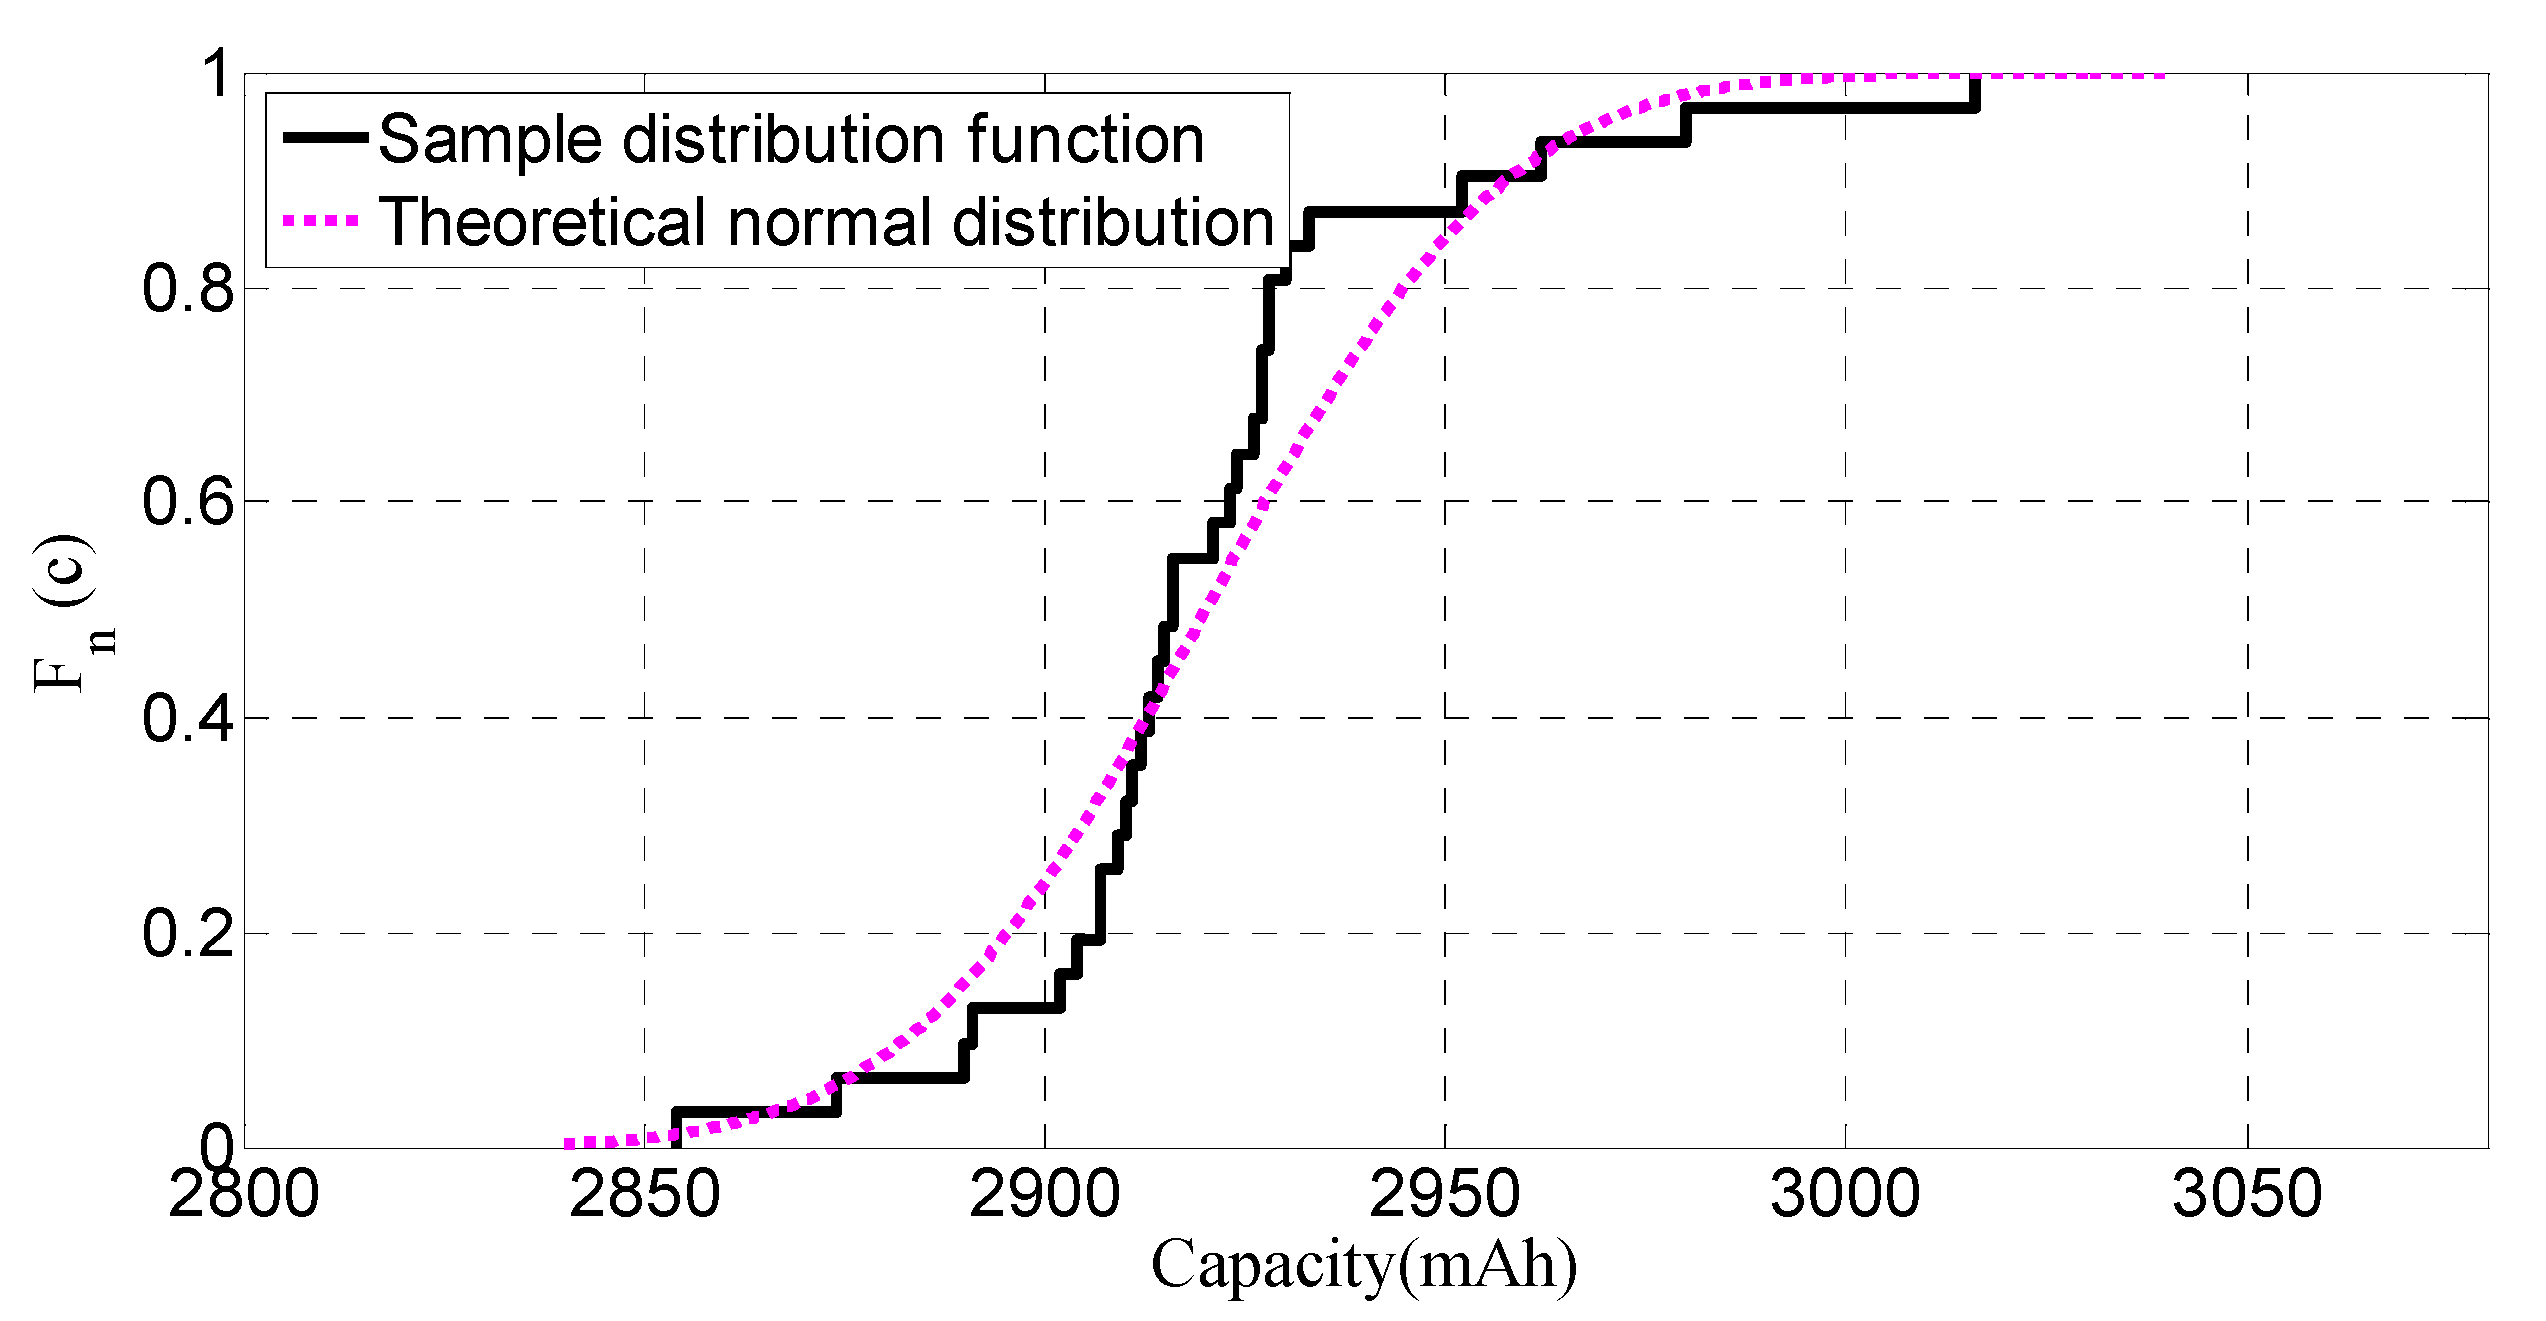
Based on the method described above, the empirical cumulative distribution function of the of samples for 1C capacity before and after vibration is obtained, and the cumulative function of theoretical normal distribution before and after vibration is also obtained, as shown in Figure 7 and Figure 8, respectively.
It can be seen from the above figures that the empirical cumulative distribution function is well in accordance with the cumulative function of the theoretical normal distribution, no matter whether it is based on samples before vibration or based on the samples after vibration.
3.1.3. Kolmogorov–Smirnov (K–S) Test for 1C Capacity Distribution
In the case where the population distribution function is completely unknown or only its form known but its parameters unknown, the hypothesis test is generally performed in order to infer some of the properties of the population. In this study, the K–S test is adopted to test whether the capacity of the samples was in accordance with the normal distribution. Based on the cumulative distribution function and the specified distribution function G(c), the tested statistic is constructed as follows:
The null hypothesis is expressed as follows:
where represents the critical value, n represents the number of the total samples, and represents the significant level. For a given value of n and , by looking up the quantile table of Kolmogorov distribution the critical value can be obtained to satisfy = 1 − ; then, if is less than , the null hypothesis is accepted, otherwise it is rejected.
For the capacity distribution of samples before vibration, by taking advantage of MATLAB R2012a, is obtained as 0.1711, and for the given significant level , is also obtained as 0.2379 by looking at the table. Obviously, it can be seen that is less than , so the null hypothesis cannot be rejected. In other words, it is believed that the capacity distribution of samples before vibration obeys the normal distribution N (2988.9, 24.17942).
Similarly, for the capacity distribution of the samples after vibration, is obtained as 0.2065, and for the given significant level , is obtained as 0.2379. Obviously, it can be also seen that is less than , so the null hypothesis cannot be rejected; in other words, it is also believed that the capacity distribution of the samples after vibration obeys the normal distribution N (2920.1, 29.32572).
3.1.4. Comparison for Capacity Distribution of Samples before and after Vibration
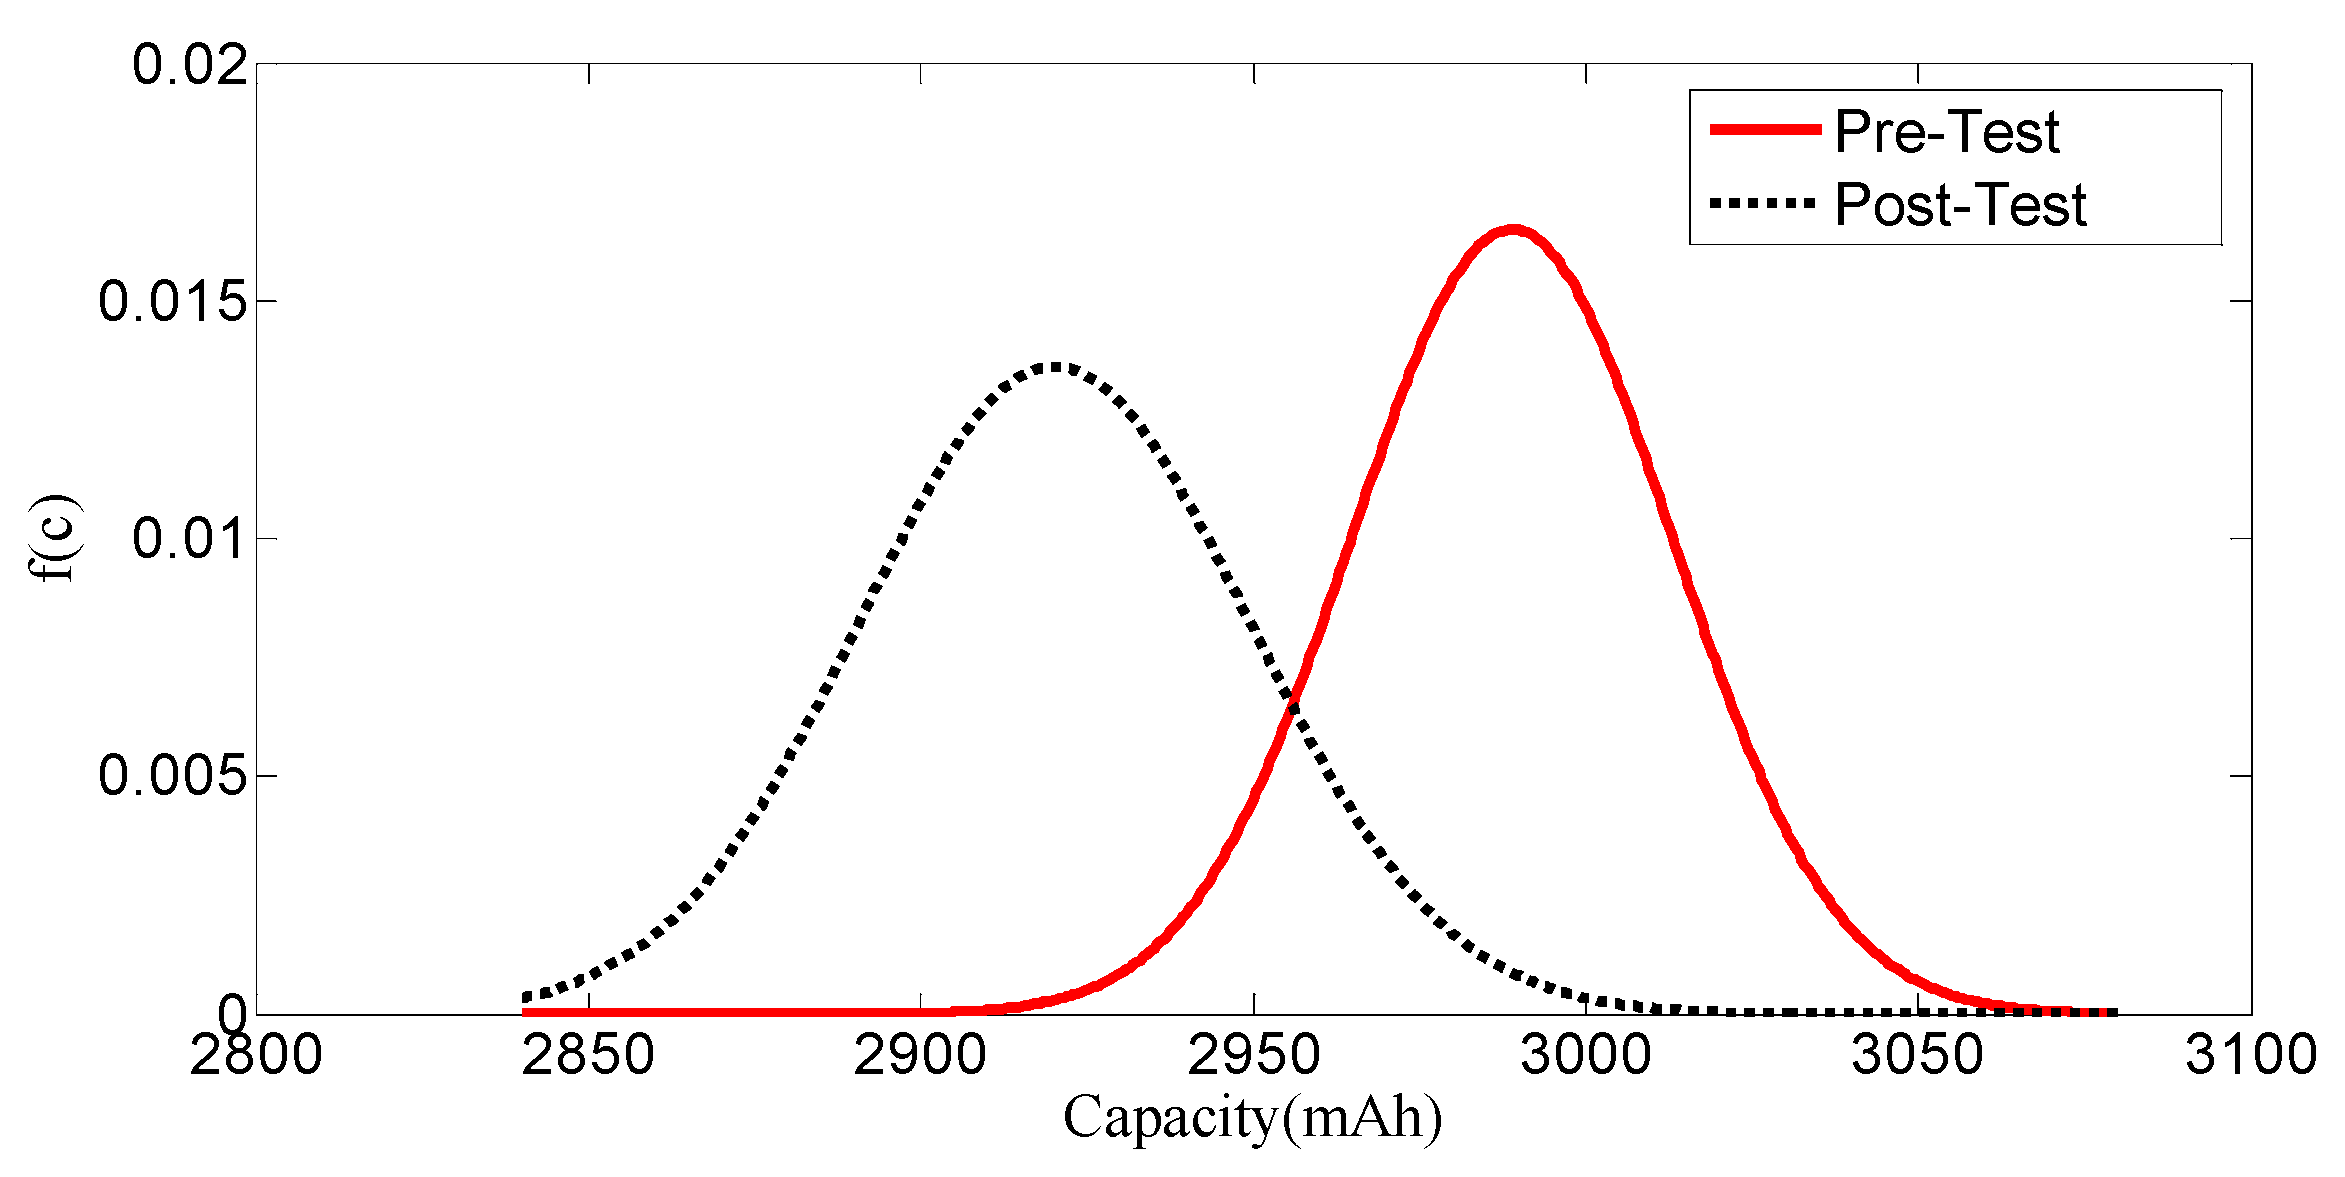
According to the analysis results above, the probability density curves of the capacity for samples before and after vibration are superimposed in Figure 9.
From Figure 9, it can be seen that the probability density curve after vibration exhibits a shift to the left and is flat as well as wide compared to that before vibration. This shows that the capacity mean of samples exhibited a reduction by 68.8 mAh and the standard variation increased by 5.1463 mAh after vibration.
3.2. Effect of Vibration on DC Resistance
The DC resistance distribution before and after the vibration test are presented in Table 2 and Table 3, respectively.
According to existing studies, the effect of vibration on the electrical performance of the battery is weak. Therefore, the conclusion that vibration has no effect on the electrical properties cannot be made, even if the electric performance does not change significantly before and after vibration. The statistical knowledge must be used to study how the electrical properties change.
As can be seen from Table 2 and Table 3 and Figure 10, some cells exhibit an increase in internal resistance while others exhibit a decrease after the vibration test simply on the perspective of the single cell; therefore, there are no consistent conclusions to be reached on this problem as to whether the vibration and the mechanical loading lead to an increase or a decrease in the internal resistance. However, from another point of view, it also can be seen that, on the whole, there is an increasing trend in internal resistance, where 26 out of 32 cells which exhibit an increase in the internal resistance occupy most of the sample, while just 6 out of 32 cells exhibit a slight decrease. Therefore, in order to eliminate the influence of the measurement uncertainty and other accidental factors which may lead to an illusion of a decreasing trend, the mathematical statistical analysis is adopted to excavate a more reasonable conclusion.
In order to identify whether there is an increasing trend that relates to the impact of vibration on the cell resistance, this paper adopts the method of hypothesis testing to give reasonable assumptions. Based on the sample distribution of the internal resistance before and after the vibration test, a decision regarding the acceptance or rejection of the null hypothesis is made under a certain significant level . In general, the null hypothesis is the hypothesis that the researcher wants to collect the evidence to object to, which is expressed usually as H0. The alternative hypothesis is the hypothesis that the researcher wants to collect evidence to support this, which is expressed as H1. Therefore, in this paper, the null hypothesis is where represents the internal resistance mean of samples before vibration testing and represents the internal resistance mean of samples after vibration testing. Consequently, the alternative hypothesis is . If a decision to reject the null hypothesis is made under a certain significant level , it would show that there is a probability of 95% that the sample mean after the vibration test is greater than the sample mean before the vibration test. In other words, there are good reasons to believe it is vibration which leads to an increase in the internal resistance. Therefore, hypothesis testing can be used to explain the effect of the vibration on the internal resistance of the battery in a statistically significant way. Before hypothesis testing, it is necessary to perform a parameter estimation of the sample.
3.2.1. Parameters Estimation Based on Samples before Vibration
The resistance of the battery before the vibration is regarded as a sample of this batch of batteries, the mean value and the standard deviation of which are estimated by the method of parameter estimation. In the next section, the internal resistance of the samples after vibration is tested with the standard by which the parameters are estimated based on the samples before vibration.
Before the parameter estimation, it is necessary to test the population distribution of the internal resistance of samples before vibration in the same way as described in Section 3.1 for the capacity distribution test; that is to say, the frequency histogram is fitted at first, then the K–S hypothesis testing is carried out, and finally the distribution of the internal resistance based on the samples before vibration is obtained as normal distribution N (37.20, 1.0562).
Estimation of Confidence Interval for the Population Mean
According to the theorem related to statistics, suppose the sample values obey the population normal distribution N (), applying the following formula:
where X, denotes the sample mean and sample variance, respectively, and does not depend on any unknown parameters.
Using as the statistic, for a given confidence level 1 − , the following formula applies:
Thus, the confidence interval of the population mean is obtained as
When the confidence level 1 − is set to be 0.95, by taking advantage of MATLAB R2012a, the confidence interval of the overall mean is calculated, resulting in (36.81, 37.58) mΩ.
Estimation of Confidence Interval for the Population Standard Variation
According to the theorem related to statistics, suppose the sample values obey the population normal distribution N (), applying the following formula:
where X, denotes the sample mean and the sample variance, respectively, and does not depend on any unknown parameters.
Using as the statistic, for a given confidence level 1 − , the following formula applies:
Thus, the confidence interval of the population standard variation is obtained as
When the confidence level 1 − is set to be 0.95, by taking advantage of MATLAB R2012a, the confidence interval of the population standard variation is calculated, resulting in (0.844, 1.411) mΩ.
3.2.2. Hypothesis Testing for Samples after Vibration
Similarly, before the hypothesis testing, it is necessary to test the population distribution of the internal resistance based on samples after vibration in the same way as described in Section 3.1 for the capacity distribution test. Finally, the distribution of the internal resistance based on the samples after vibration is obtained as normal distribution N (38.09, 1.2442).
Hypothesis Testing for the Internal Resistance Mean μ after Vibration
Confidence intervals of the population mean and the standard variation have been obtained in the previous section. According to the theorem related to statistics, based on the normal distribution N (, ) the Z-test is adopted to test whether the internal resistance mean μ after vibration exhibits a significant increase compared to that before vibration. Therefore, the null hypothesis and the alternative hypothesis are expressed as follows:
The null hypothesis H0:
The alternative hypothesis H1:
Then, the statistic is adopted to determine the rejection region. Thus, the rejection region can be expressed as follows:
where n = 32, = 38.09, = 37.58 and = 1.411, respectively, from the sections above.
Based on Equation (18), Z = 2.0023 is obtained and then, according to the standard normal distribution table, the corresponding P is obtained as 0.0226. Given the significant level = 0.05, there is P . Therefore, there are good reasons to refuse the null hypothesis, and it is accepted that the internal resistance mean μ after vibration increased at significant level = 0.05.
Hypothesis Testing for the Resistance Standard Variation after Vibration
According to the theorem related to statistics, the chi-square test is adopted to test whether the internal resistance standard variation σ after vibration exhibits a significant increase compared to that before vibration. Therefore, the null hypothesis and the alternative hypothesis are expressed as follows:
The null hypothesis H0:
The alternative hypothesis H1:
Then, the statistic is adopted to determine the rejection region. Thus, the rejection region can be expressed as follows:
where n = 32, S = 1.244 and = 1.056, respectively, from the above sections.
Based on Equation (21), = 41.633 is obtained, and then, given the significant level = 0.05, we check the corresponding table and get the value = 44.98. Consequently, . In other words, there are not good reasons to refuse the null hypothesis at the significant level = 0.05. Similarly, given the significant level of = 0.1, we check the corresponding table and get the value = 41.422. Consequently, . Therefore, there are good reasons to refuse the null hypothesis, and it is accepted that the internal resistance standard variation after vibration increased at significant level = 0.1.
4. Consistency Analysis
4.1. Feature Extraction
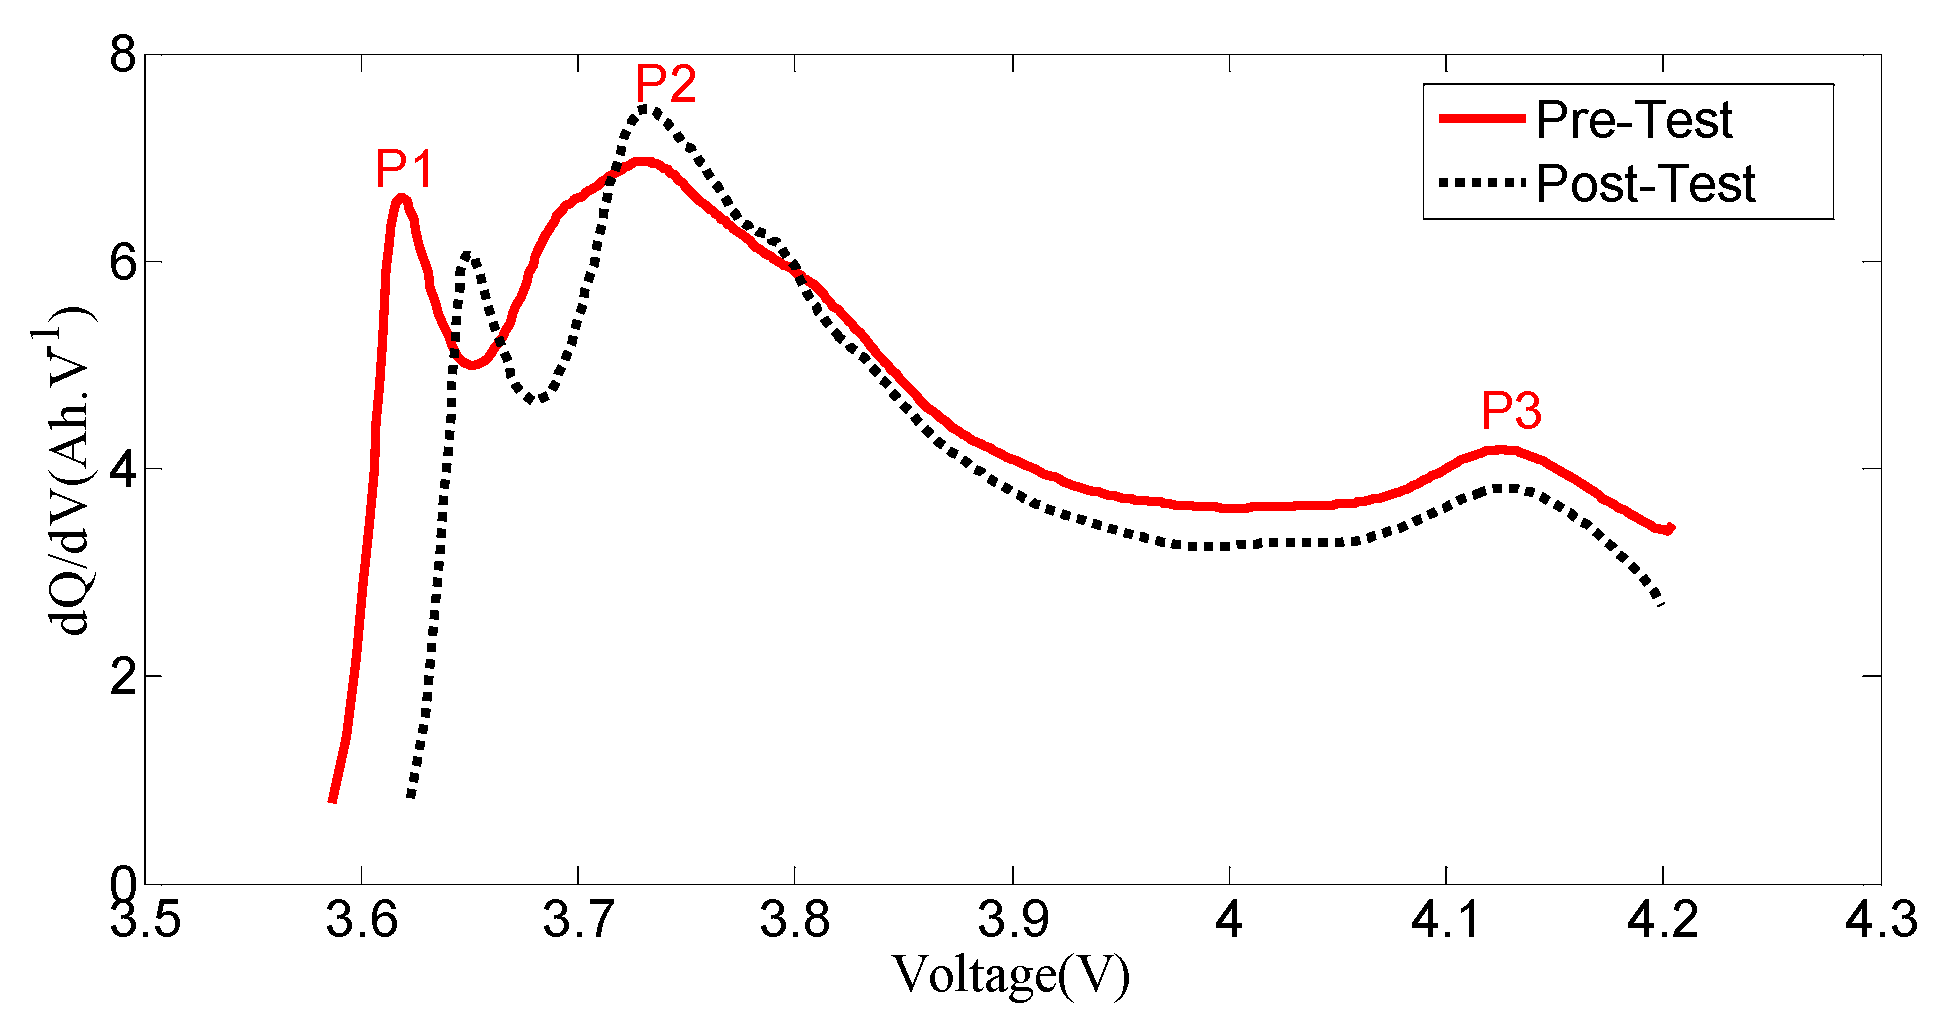
4.1.1. Peaks Value of Incremental Capacity (IC) Curves Phase Transformation
The incremental capacity analysis (ICA) method has been applied to the study of the aging mechanism of cells, and this method has the potential to be integrated in a battery management system (BMS) to estimate the cell SOH and observe the internal changes in cells in real time [30]. Cell IC curves could be determined on the basis of the constant current charge curves.
During the cell charging or discharging process, it can be easily determined that, with the insertion and extraction of lithium ions, cathode and anode materials will undergo phase transformation, and such a phase transformation corresponds to a voltage plateau. The IC curve is defined as follows.
In this paper, the IC curve has been smoothed, so the decrease of capacity may not very precise, but it can indicate the trend of the voltage value of the voltage plateau increasing and the capacity decreasing. Figure 11 shows the IC curves of Cell 1 before and after the vibration test; there are three obvious voltage plateaus, but the cell IC curve after the vibration test has a tendency to move right as a whole, and the peak value is slightly lower than before the vibration test. According to the characteristics of the cell aging IC curve, the position of the voltage plateau shift to the right and the peak value drop shows that there is degradation of cell electrical performance. In this paper, the voltage value of the voltage plateau is regarded as a characteristic quantity to evaluate the consistency of the cells; as a result, three characteristic quantities can be found, which are denoted as P1, P2 and P3, respectively.
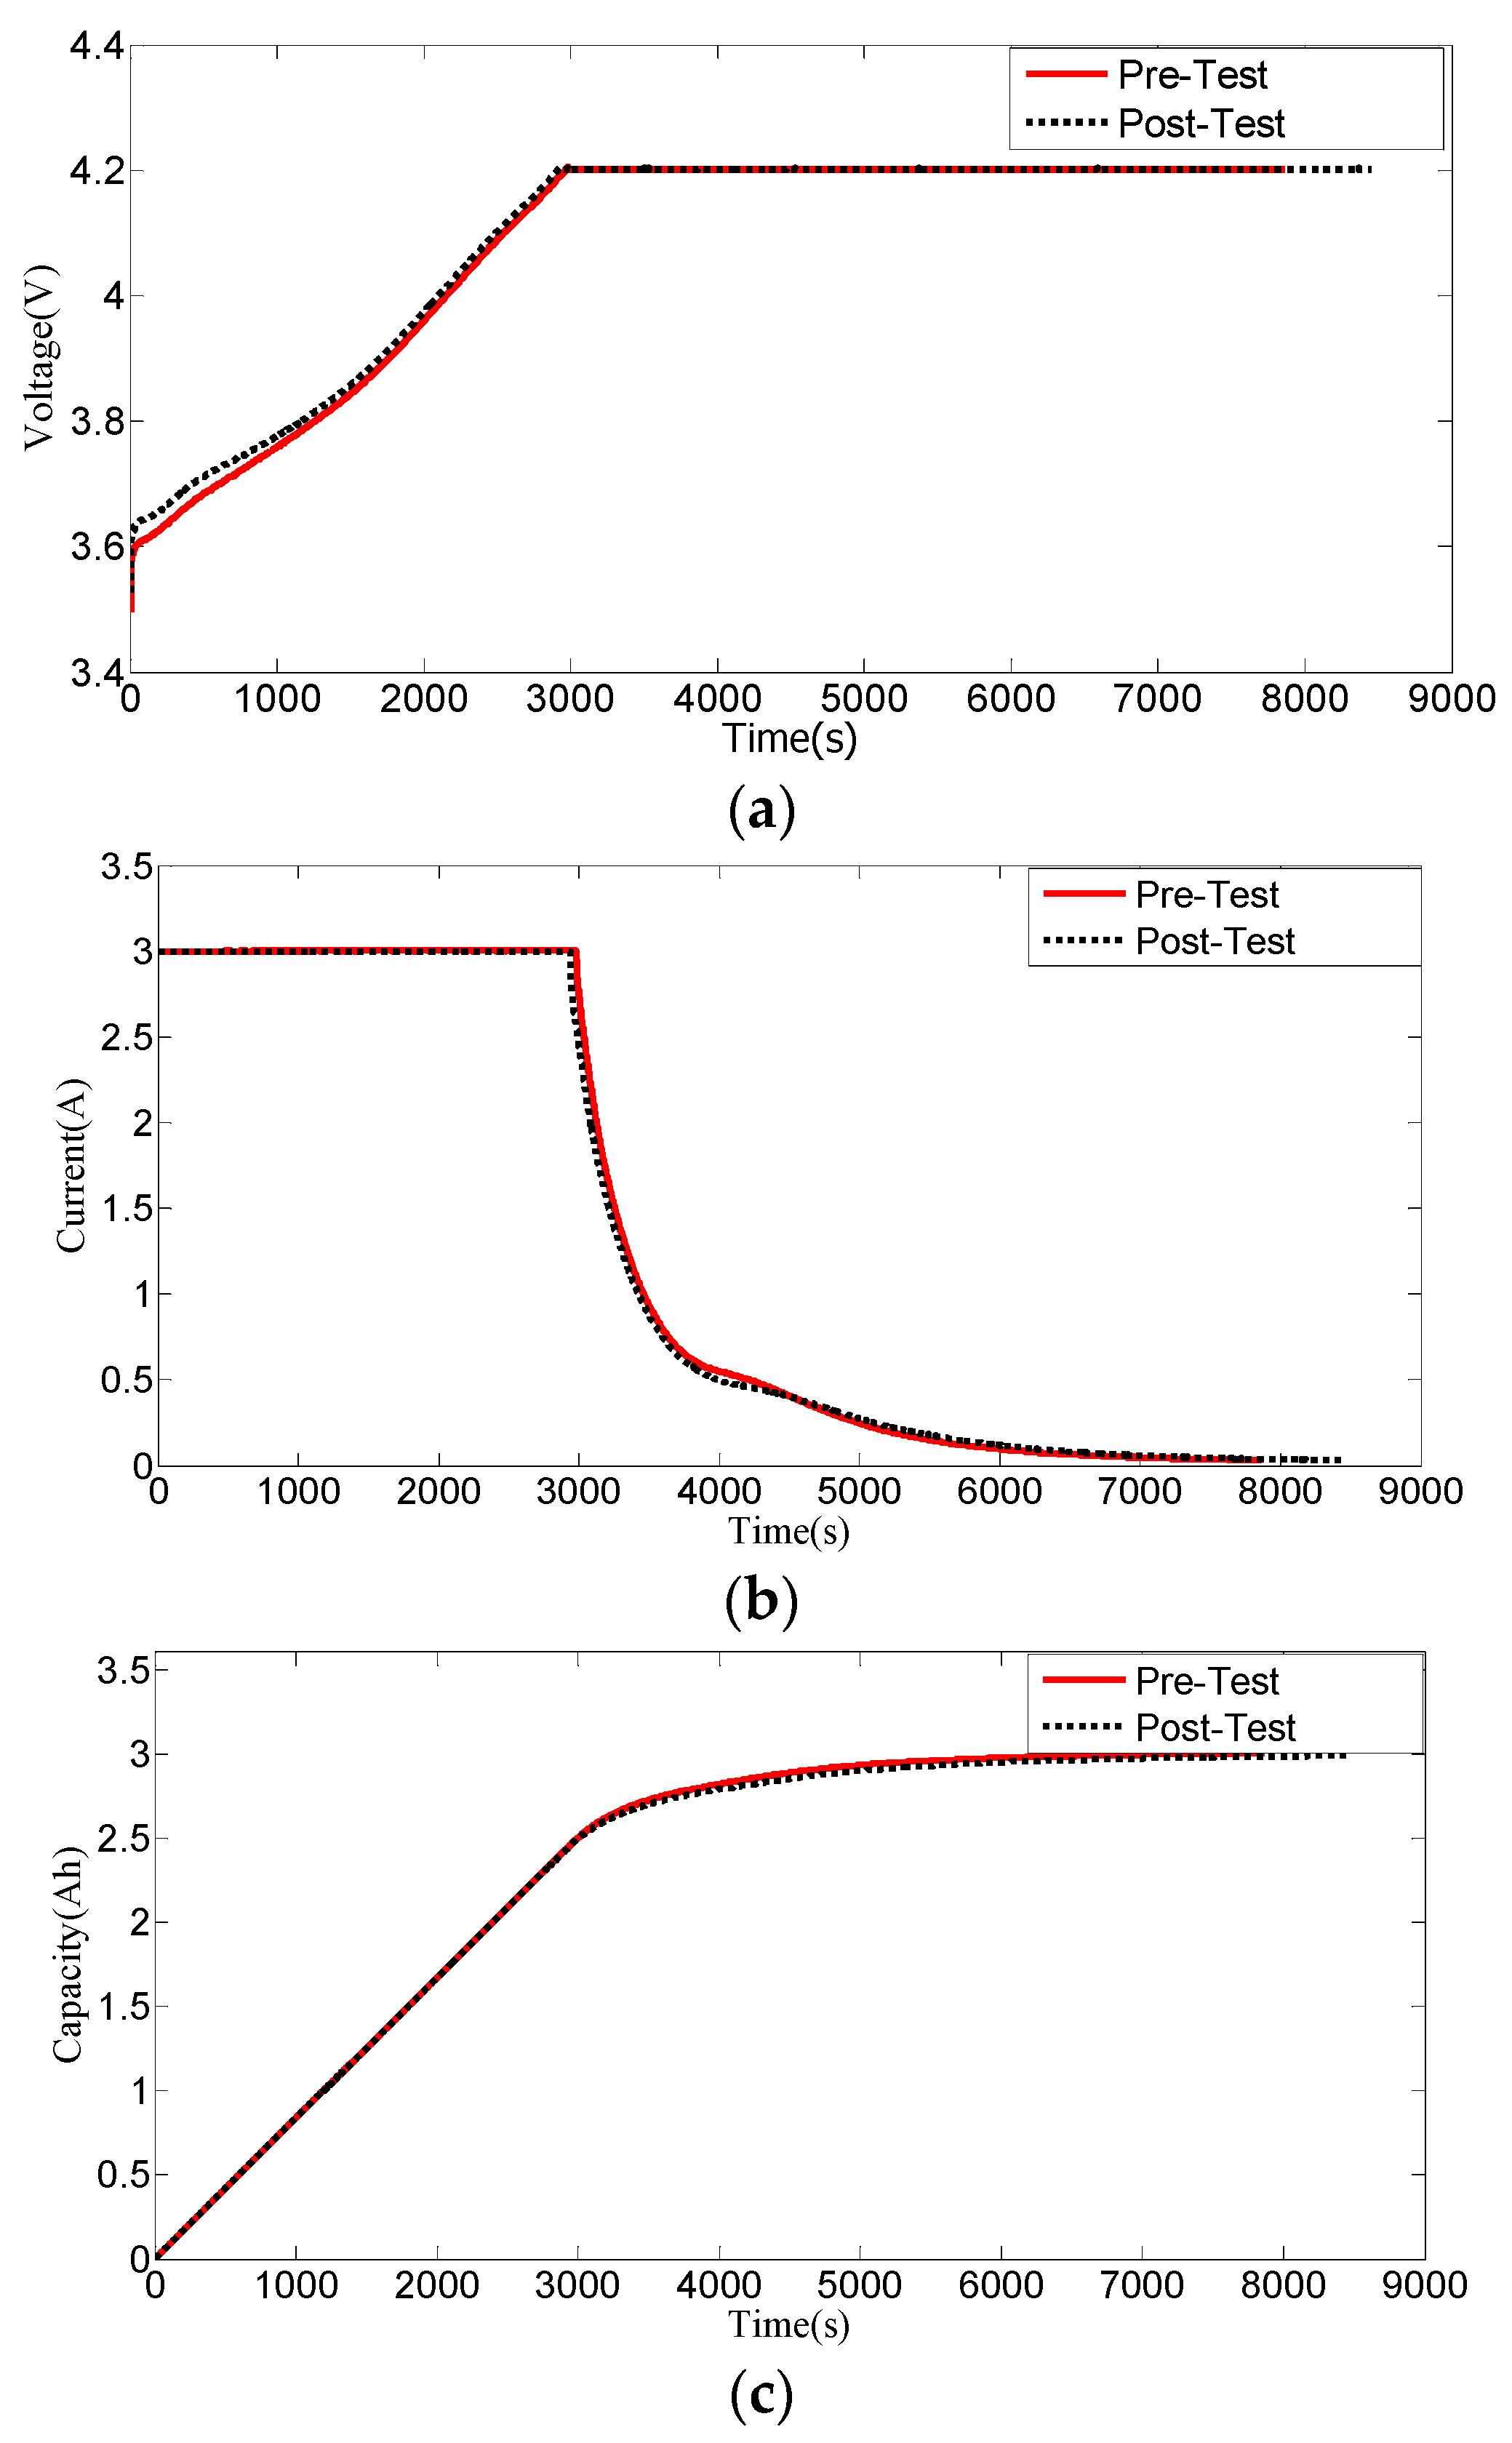
4.1.2. Ratio of Potentio-Charge Capacity to Galvano-Charge Capacity
Here a method based on the ratio of the potentio-charge capacity to the galvano-charge capacity (RPG) was developed to determine the diffusion coefficient of intercalary species for porous electrode by the spherical diffusion model [31]. In the process of movement, the electrons and ions in the battery will be subject to certain resistance, which will cause polarization.
With the polarization enhanced, the cell’s cycle performance will be worse. When the cell is charged at a constant current, the concentration polarization increases gradually with the increase of the terminal voltage, and the cell voltage reaches the rated value when it is not full. During the constant voltage charging process, the concentration polarization is gradually eliminated, so that the cell capacity is full. It can be easily concluded that the more capacity charged of constant current, the better cycle performance of the cell, or vice versa. Therefore, the RPG can be used as a characteristic to evaluate the consistency of the cell, which is defined as follows:
Figure 12 represents the voltage, current and capacity curve during the constant current constant voltage charging process of Cell 1 before and after the vibration test. From Figure 10, the charging time of the constant current after the vibration test is shorter than before the test, indicating that there may be a degradation of cell electrical performance. It can also be seen that the time of the whole charging process becomes longer the after vibration test.
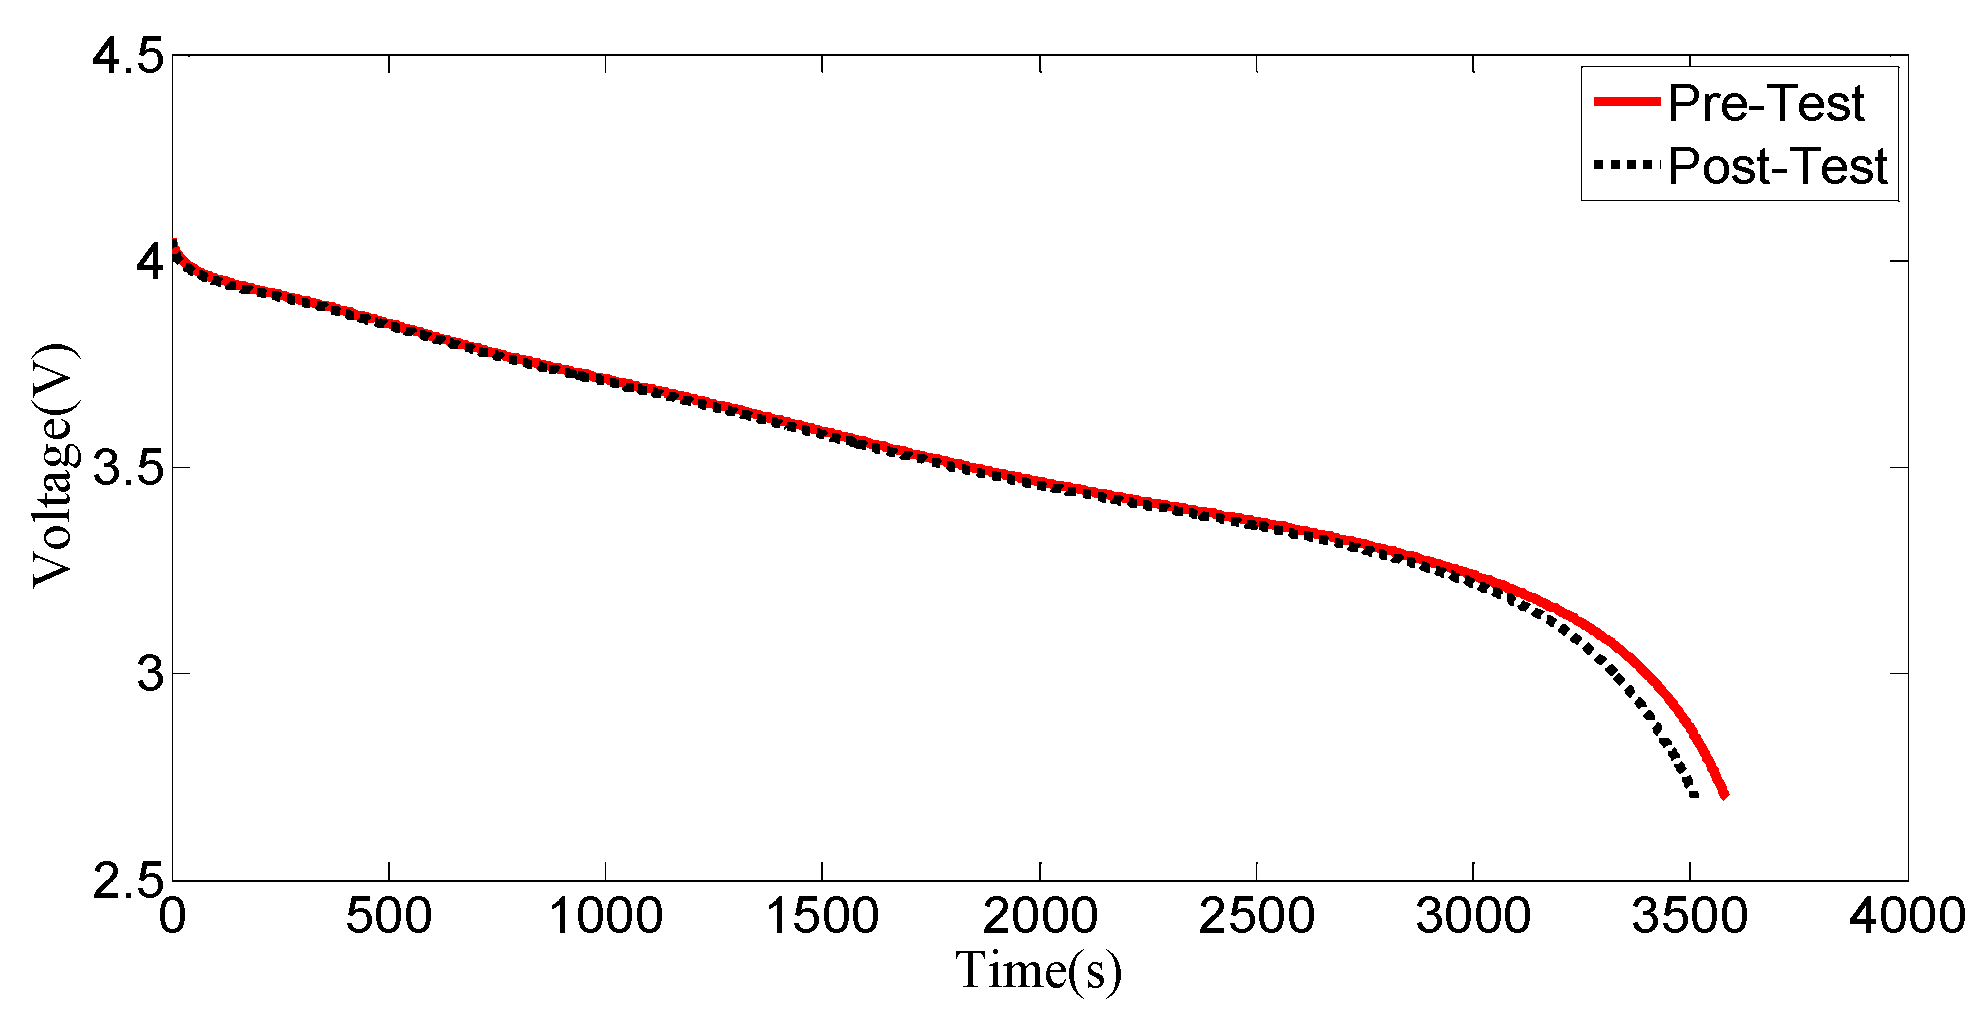
4.1.3. Discharge Curve
The discharge curve has been used to predict capacity fading of lithium-ion cells [32], which can reflect the discharge cut-off point, discharge plateau and capacity of the cell; the discharge curve can therefore be used as a feature of the cell consistency evaluation. In this paper, the area surrounded by the discharge curve is used to describe the similarity of the discharge curve, which is defined as follows:
Figure 13 shows discharge curves before and after the vibration test of Cell 1; the area surrounded by the discharge curve after the vibration test is smaller than before the test, indicating that there may be a degradation of cell electrical performance.
In summary, the features of the consistency evaluation for lithium-ion cells are capacity (C), DC resistance (R), the position of the peaks (P1, P2, P3) of the voltage plateau, the ratio (q) of the potentio-charge capacity to the galvano-charge capacity and the area (A) surrounded by the discharge curve.
4.2. Feature Calculation
The value of DC resistances (R) and capacities (C) are obtained by the HPPC test and constant current discharge test, respectively; the position of the peaks (P1, P2, P3) of the voltage plateau are obtained by drawing IC curves, the ratio (q) of the potentio-charge capacity to the galvano-charge capacity and the area (A) surrounded by the discharge curve are obtained via calculating the formulae which were described in Section 4.1. The calculated results of each cell before and after vibration test are shown in Table 4 and Table 5.
4.3. Consistency Analysis Based on Hierarchical Clustering Method
Clustering is an unsupervised knowledge discovery process that groups a set of data such that the intracluster similarity is maximized and the inter-cluster similarity is minimized [33]. The distance is a measure of the similarity between samples when the samples are clustered. Assuming that the “P” is the number of feature quantities for each cell, and the “” represents the -th feature of the No. “” cell, each cell can be viewed as a point in the vector space defined as ; therefore, the number of cell is “n”, and correspondingly the number of point is “n” in . A kind of distance should be defined in ; the “” represents the distance between the -th cell and the -th cell during the clustering process, and the closer points tend to be clustered as a cluster or vice versa. The distance commonly used in clustering is Euclidean distance, which is defined as follows:
Due to the different units of cell features, the measurement range varies greatly; therefore, it is necessary to normalize data of each feature. The following is the commonly used normalization.
where the and the is the sample mean and variance of the -th feature, respectively.
The basic idea of hierarchical clustering is that, at first, each cell is considered as a class, and then the nearest distance samples are merged into a new class; at the same time, calculating the distance between the new class and other classes, repeating two recent classes of mergers, until all cells are merged into one class. Therefore, the distance between samples before and after vibration could be calculated. If the sample distance increases, it is shown that cells become dispersed in and the similarity becomes worse; in addition, the method by which the consistency deteriorates can be further explained.
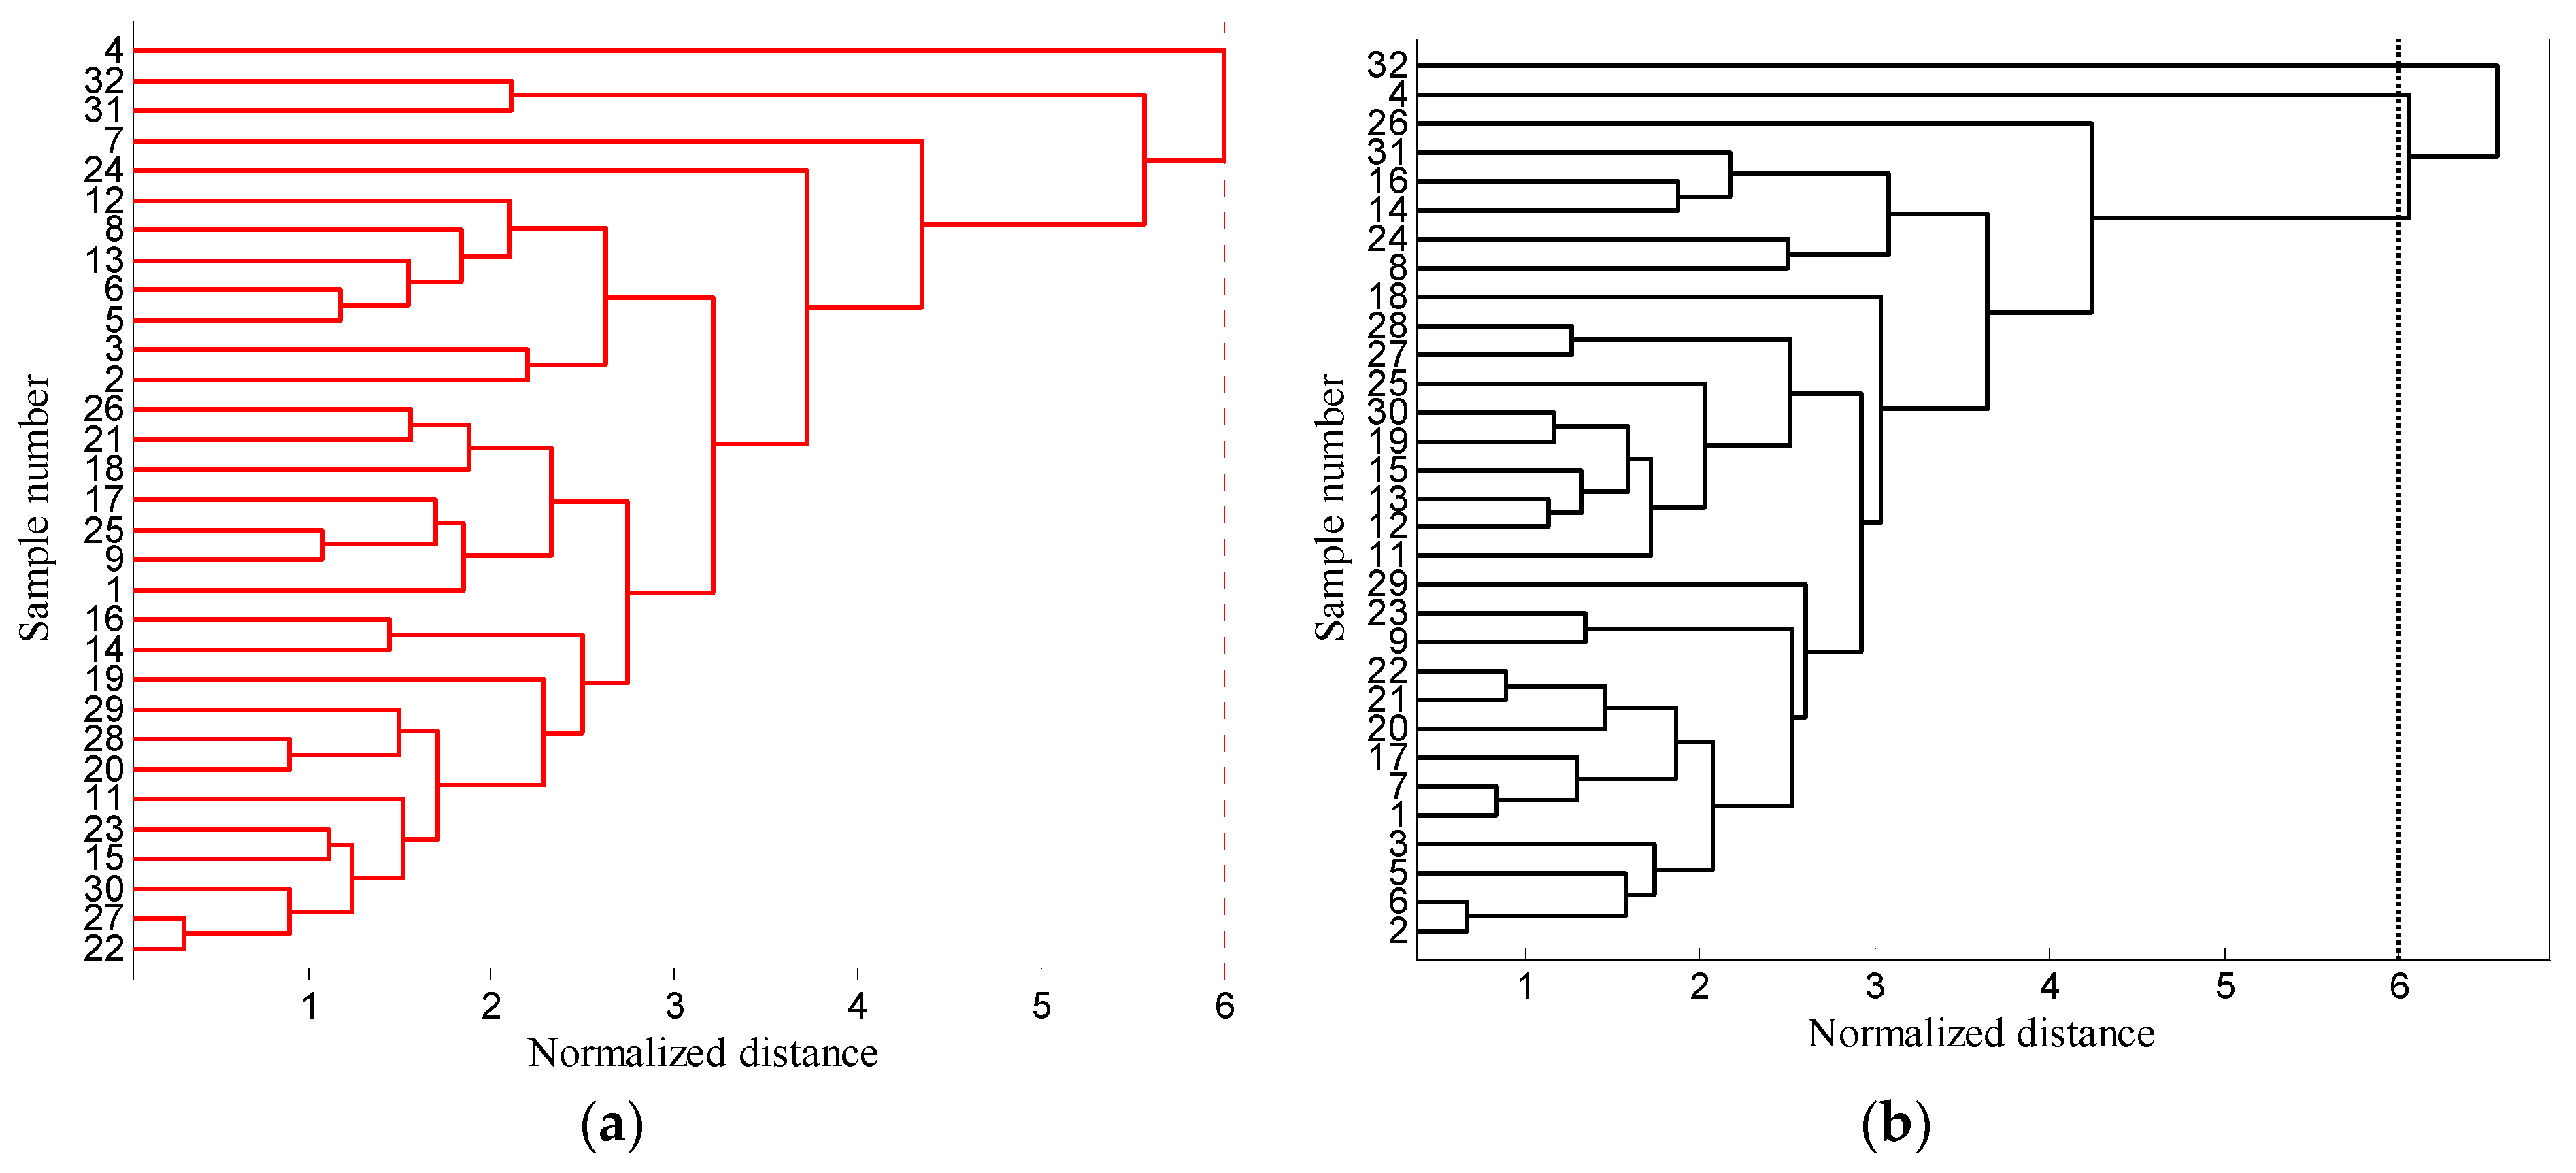
4.3.1. Clustering Tree
In this paper, the average linkage method is used, as the space is neither too dense nor too expansive. Figure 14 represents the cluster trees of cells before and after vibration.
By comparison, when cell samples are classified into a class, the normalized distance of cells after vibration is greater than before vibration. At the same time, when the standard distance is six, cell samples are divided into one class before vibration; however, after the vibration, the cell samples are divided into three classes, indicating that the consistency of cells are deteriorated after vibration.
4.3.2. Inconsistent Coefficient
The inconsistent coefficient of the hierarchical clustering method has a self-adaptability feature, and can show that cells should be divided into several categories according to the characteristics of the cells’ sample data.
Therefore, in this paper, the inconsistent coefficient should be calculated when the samples are merged into a new class before and after the vibration, respectively; then, the increment of inconsistent coefficients are obtained. If the increment is large after the class merging, this would indicate that the two classes should not be able to merge into a new class, and that the previous class merging is reasonable. Therefore, the category of the previous class merging as a standard for cells should be divided into several categories. If results show that there are more categories of cells after the vibration test, the consistency of the cells which are deteriorated can be concluded.
In this paper, the function INCONSISTENT of MATLAB was used to compute the inconsistent value of each non-leaf node in the hierarchical cluster tree Z, which is a matrix generated by the function LINKAGE. The Y is a matrix with rows corresponding to each of the non-leaf nodes represented in Z, therefore the inconsistent value of k-th (k-th indicates the number of batteries classified is k) class merging is defined as follows.
The calculation results of the inconsistent coefficient are presented in Table 6.
In the case of a cell classification as small as possible, according to Table 6, before the vibration, the increment on the inconsistent coefficient of the last five times of class merging is 0.29, 0.2, 0.48 and −0.27, while after the vibration, the increment values on the inconsistent coefficient of the last five times of class merging are 1.01, 0.29, 0.84 and −0.34. The maximum increment of the inconsistency coefficient is 0.48 before the vibration, and results show that, when the three classes are merged into the two classes, the increment of the inconsistent coefficient is the largest; therefore, cells being divided into three classes before vibration is reasonable. Similarly, cells being divided into five classes is more reasonable after vibration. Furthermore, it was found that the number of classes of cells after vibration are increased, which indicate that the consistency of cells is deteriorated.
5. Conclusions
In this paper, the influence of vibration load on electrical performance of lithium-ion cells was analyzed, the results showed that the mean value and the standard deviation of DC resistance increased at the 0.05 and 0.1 significance level, respectively. In addition, the significant decrease in cell capacity and the slight deterioration in consistency was observed after the vibration test.
Compared with previous articles, a large number of samples of 32 lithium-ion cells were used for the test, and the changes in DC resistances or capacity was compared by using the holistic samples in order to eliminate the influence of the accidental factors caused by a single cell on the overall trend. In addition, the distribution function of cell capacity and DC resistance were obtained by data fitting and using hypothesis testing, which can well reveal the distribution of the cells before and after the vibration test. Finally, the influence of vibration on the consistency of lithium-ion cells was studied based on multi-feature quantities, and a reasonable conclusion was obtained by using the hierarchical clustering method. This point has not been studied in the previous literature, but it must be a research focus, as the consistency can better reflect the performance of the cell pack.
The quantitative analysis and the error estimation were carried out in the choice of sample size, and the most representative vibration standard of SAE J2380 was selected after referencing a large amount of the literature. In addition, the control of the time interval and the ambient temperature were set reasonably in the measurement process of cell features; therefore, the comprehensive consideration of the experimental details makes the results more credible.
Acknowledgments
This work was financially supported by the National Key Research and Development Program of China (No. 2016YFF0203804), the National Natural Science Foundation of China (No. 51375019), and the Fundamental Research Funds for Central Universities of China (No. FRF-TP-14-061A2).
Author Contributions
Lijun Zhang, Zhansheng Ning and Changyan Sun conceived and designed the experiments; Zhansheng Ning, Hui Peng and Zhongqiang Mu performed the experiments; Zhansheng Ning and Hui Peng analyzed the data; and Lijun Zhang and Zhansheng Ning wrote the paper.
Conflicts of Interest
The authors declare no conflict of interest.
References
- Wu, L.; Fu, X.; Guan, Y. Review of the remaining useful life prognostics of vehicle lithium-ion batteries using data-driven methodologies. Appl. Sci. 2016, 6, 166. [Google Scholar] [CrossRef]
- Saravanan, M.; Ambalavanan, S. Failure analysis of cast-on-strap in lead-acid battery subjected to vibration. Eng. Fail. Anal. 2011, 18, 2240–2249. [Google Scholar] [CrossRef]
- He, B.; Wang, H.; He, X. Vibration test methods and their experimental research on the performance of the lead-acid battery. J. Power Sources 2014, 268, 326–330. [Google Scholar] [CrossRef]
- Rajalakshmi, N.; Pandian, S.; Dhathathreyan, K.S. Vibration tests on a PEM fuel cell stack usable in transportation application. Int. J. Hydrogen Energy 2009, 34, 3833–3837. [Google Scholar] [CrossRef]
- Betournay, M.C.; Bonnell, G.; Edwardson, E.; Paktunc, D.; Kaufman, A.; Lomma, A.T. The effects of mine conditions on the performance of a PEM fuel cell. J. Power Sources 2004, 134, 80–87. [Google Scholar] [CrossRef]
- Pham, H.L.; Dietz, J.E.; Adams, D.E.; Sharp, N.D. Lithium-ion battery cell health monitoring using vibration diagnostic test. In Proceedings of the ASME 2013 International Mechanical Engineering Congress and Exposition, San Diego, CA, USA, 15–21 November 2013. [Google Scholar]
- Shevtsov, S.; Chang, S.H. Modeling of vibration energy harvesting system with power PZT stack loaded on Li-Ion battery. Int. J. Hydrogen Energy 2016, 41, 12618–12625. [Google Scholar] [CrossRef]
- Kume, M.; Murakami, T. Battery array configured to prevent vibration. U.S. Patent 8,999,555, 7 April 2015. [Google Scholar]
- Choi, Y.; Jung, D.; Ham, K.; Bae, S. A study on the accelerated vibration endurance tests for battery fixing bracket in electrically driven vehicles. Procedia Eng. 2011, 10, 851–856. [Google Scholar] [CrossRef]
- Reddy, P.R.; Reddy, P.S.; Reddy, K.V.K. Vibration analysis of a Torpedo battery tray using FEA. Int. J. Eng. Res. Technol. 2014, 03, 128–134. [Google Scholar]
- Li, J.; Tian, H.; Wu, P. Analysis of random vibration of power battery box in electric vehicles. In Proceedings of the 2014 IEEE Conference Transportation Electrification ASIA-Pacific (ITEC Asia-Pacific), Beijing, China, 31 August–3 September 2014; pp. 1–5. [Google Scholar]
- Hong, S.K.; Epureanu, B.I.; Castanier, M.P. Parametric reduced-order models of battery pack vibration including structural variation and prestress effects. J. Power Sources 2014, 261, 101–111. [Google Scholar] [CrossRef]
- Arora, S.; Shen, W.; Kapoor, A. Review of mechanical design and strategic placement technique of a robust battery pack for electric vehicles. Renew. Sustain. Energy Rev. 2016, 60, 1319–1331. [Google Scholar] [CrossRef]
- Lee, J.K.; Yeo, J.S.; Jang, M.C.; Yoon, J.M.; Kang, D.M. Mechanical durability and electrical durability of an aluminium-laminated lithium-ion polymer battery pack for a hybrid electric vehicle. J. Automob. Eng. 2010, 224, 765–773. [Google Scholar] [CrossRef]
- Yang, L.; Cheng, X.; Gao, Y.; Yin, G. Effect of vibration on the life of LiCoO2/MCMB battery. Battery Bimon. 2014, 04, 202–205. (In Chinese) [Google Scholar]
- An, Y.; Zhang, Z.; Chang, X.; Jiang, T.; Rong, C.; Chen, H. Resarch on vibration resistance of electric vehicle lithium-ion battery cells. In Proceedings of the China Automotive Engineering Society Annual Meeting, Beijing, China, 26 November 2013. (In Chinese). [Google Scholar]
- Brand, M.; Schuster, S.; Bach, T.; Fleder, E.; Stelz, M.; Glaser, S.; Muller, J.; Sextl, G.; Jossen, A. Effects of vibrations and shocks on lithium-ion cells. J. Power Sources 2015, 288, 62–69. [Google Scholar] [CrossRef]
- Wang, D.; Wu, X.; Wang, Z.; Chen, L. Cracking causing cyclic instability of LiFePO4 cathode material. J. Power Sources 2005, 140, 125–128. [Google Scholar] [CrossRef]
- Hooper, J.; Marco, J. Characterising the in-vehicle vibration inputs to the high voltage battery of an electric vehicle. J. Power Sources 2014, 245, 510–519. [Google Scholar] [CrossRef]
- Hooper, J.; Marco, J. Experimental modal analysis of lithium-ion pouch cells. J. Power Sources 2015, 285, 247–259. [Google Scholar] [CrossRef]
- Hooper, J.; Marco, J.; Chouchelamane, G.; Lyness, C. Vibration durability testing of nickel manganese cobalt oxide (NMC) lithium-ion 18650 battery cells. Energies 2016, 9, 52. [Google Scholar] [CrossRef]
- Bruen, T.; Hooper, J.; Marco, J.; Gama, M.; Chouchelamane, G. Analysis of a battery management system (BMS) control strategy for vibration aged nickel manganese cobalt oxide (NMC) lithium-Iion 18650 battery cells. Energies 2016, 9, 255. [Google Scholar] [CrossRef]
- Hooper, J.; Marco, J.; Chouchelamane, G.; Lyness, C.; Taylor, J. Vibration durability testing of nickel cobalt aluminum oxide (NCA) lithium-ion 18650 battery cells. Energies 2016, 9, 281. [Google Scholar] [CrossRef] [Green Version]
- Marco, J.; Hooper, J. Defining a representative vibration durability test for electric vehicle (EV) rechargeable energy storage systems (RESS). In Proceedings of the Electric Vehicle Symposium (EVS 29), Montréal, QC, Canada, 19–21 June 2016. [Google Scholar]
- Gao, Y.; Jiang, J.; Zhang, C.; Zhang, W.; Ma, Z.; Jiang, Y. Lithium-ion battery aging mechanisms and life model under different charging stresses. J. Power Sources 2017, 356, 103–114. [Google Scholar] [CrossRef]
- Barai, A.; Chouchelamane, G.H.; Guo, Y.; McGordon, A.; Jennings, P. A study on the impact of lithium-ion cell relaxation on electrochemical impedance spectroscopy. J. Power Sources 2015, 280, 74–80. [Google Scholar] [CrossRef]
- Piłatowicz, G.; Marongiu, A.; Drillkens, J.; Sinhuber, P.; Sauer, D.U. A critical overview of definitions and determination techniques of the internal resistance using lithium-ion, lead-acid, nickel metal-hydride batteries and electrochemical double-layer capacitors as examples. J. Power Sources 2015, 296, 365–376. [Google Scholar] [CrossRef]
- Schweiger, H.G.; Obeidi, O.; Komesker, O.; Raschke, A.; Schiemann, M.; Zehner, C.; Birke, P. Comparison of several methods for determining the internal resistance of lithium ion cells. Sensors 2010, 10, 5604–5625. [Google Scholar] [CrossRef] [PubMed]
- Jossen, A. Fundamentals of battery dynamics. J. Power Sources 2006, 154, 530–538. [Google Scholar] [CrossRef]
- Han, X.; Ouyang, M.; Lu, L.; Li, J.; Zheng, Y.; Li, Z. A comparative study of commercial lithium ion battery cycle life in electrical vehicle: Aging mechanism identification. J. Power Sources 2014, 251, 38–54. [Google Scholar] [CrossRef]
- Tang, X.C.; Pan, C.Y.; He, L.P.; Li, L.Q.; Chen, Z.Z. A novel technique based on the ratio of potentio-charge capacity to galvano-charge capacity (RPG) for determination of the diffusion coefficient of intercalary species within insertion-host materials: Theories and experiments. Electrochim. Acta 2004, 49, 3113–3119. [Google Scholar] [CrossRef]
- Honkura, K.; Takahashi, K.; Horiba, T. Capacity-fading prediction of lithium-ion batteries based on discharge curves analysis. J. Power Sources 2011, 196, 10141–10147. [Google Scholar] [CrossRef]
- Jiang, D.; Pei, J.; Zhang, A. DHC: A density-based hierarchical clustering method for time series gene expression data. In Proceedings of the Third IEEE Symposium on BioInformatics and BioEngineering, Hongkong, China, 12–12 March 2003; pp. 393–400. [Google Scholar]
Figure 1.
Battery Test System 4000 (BTS4000) power battery testing bench.

Figure 2.
Schematic of electrical performance test process.
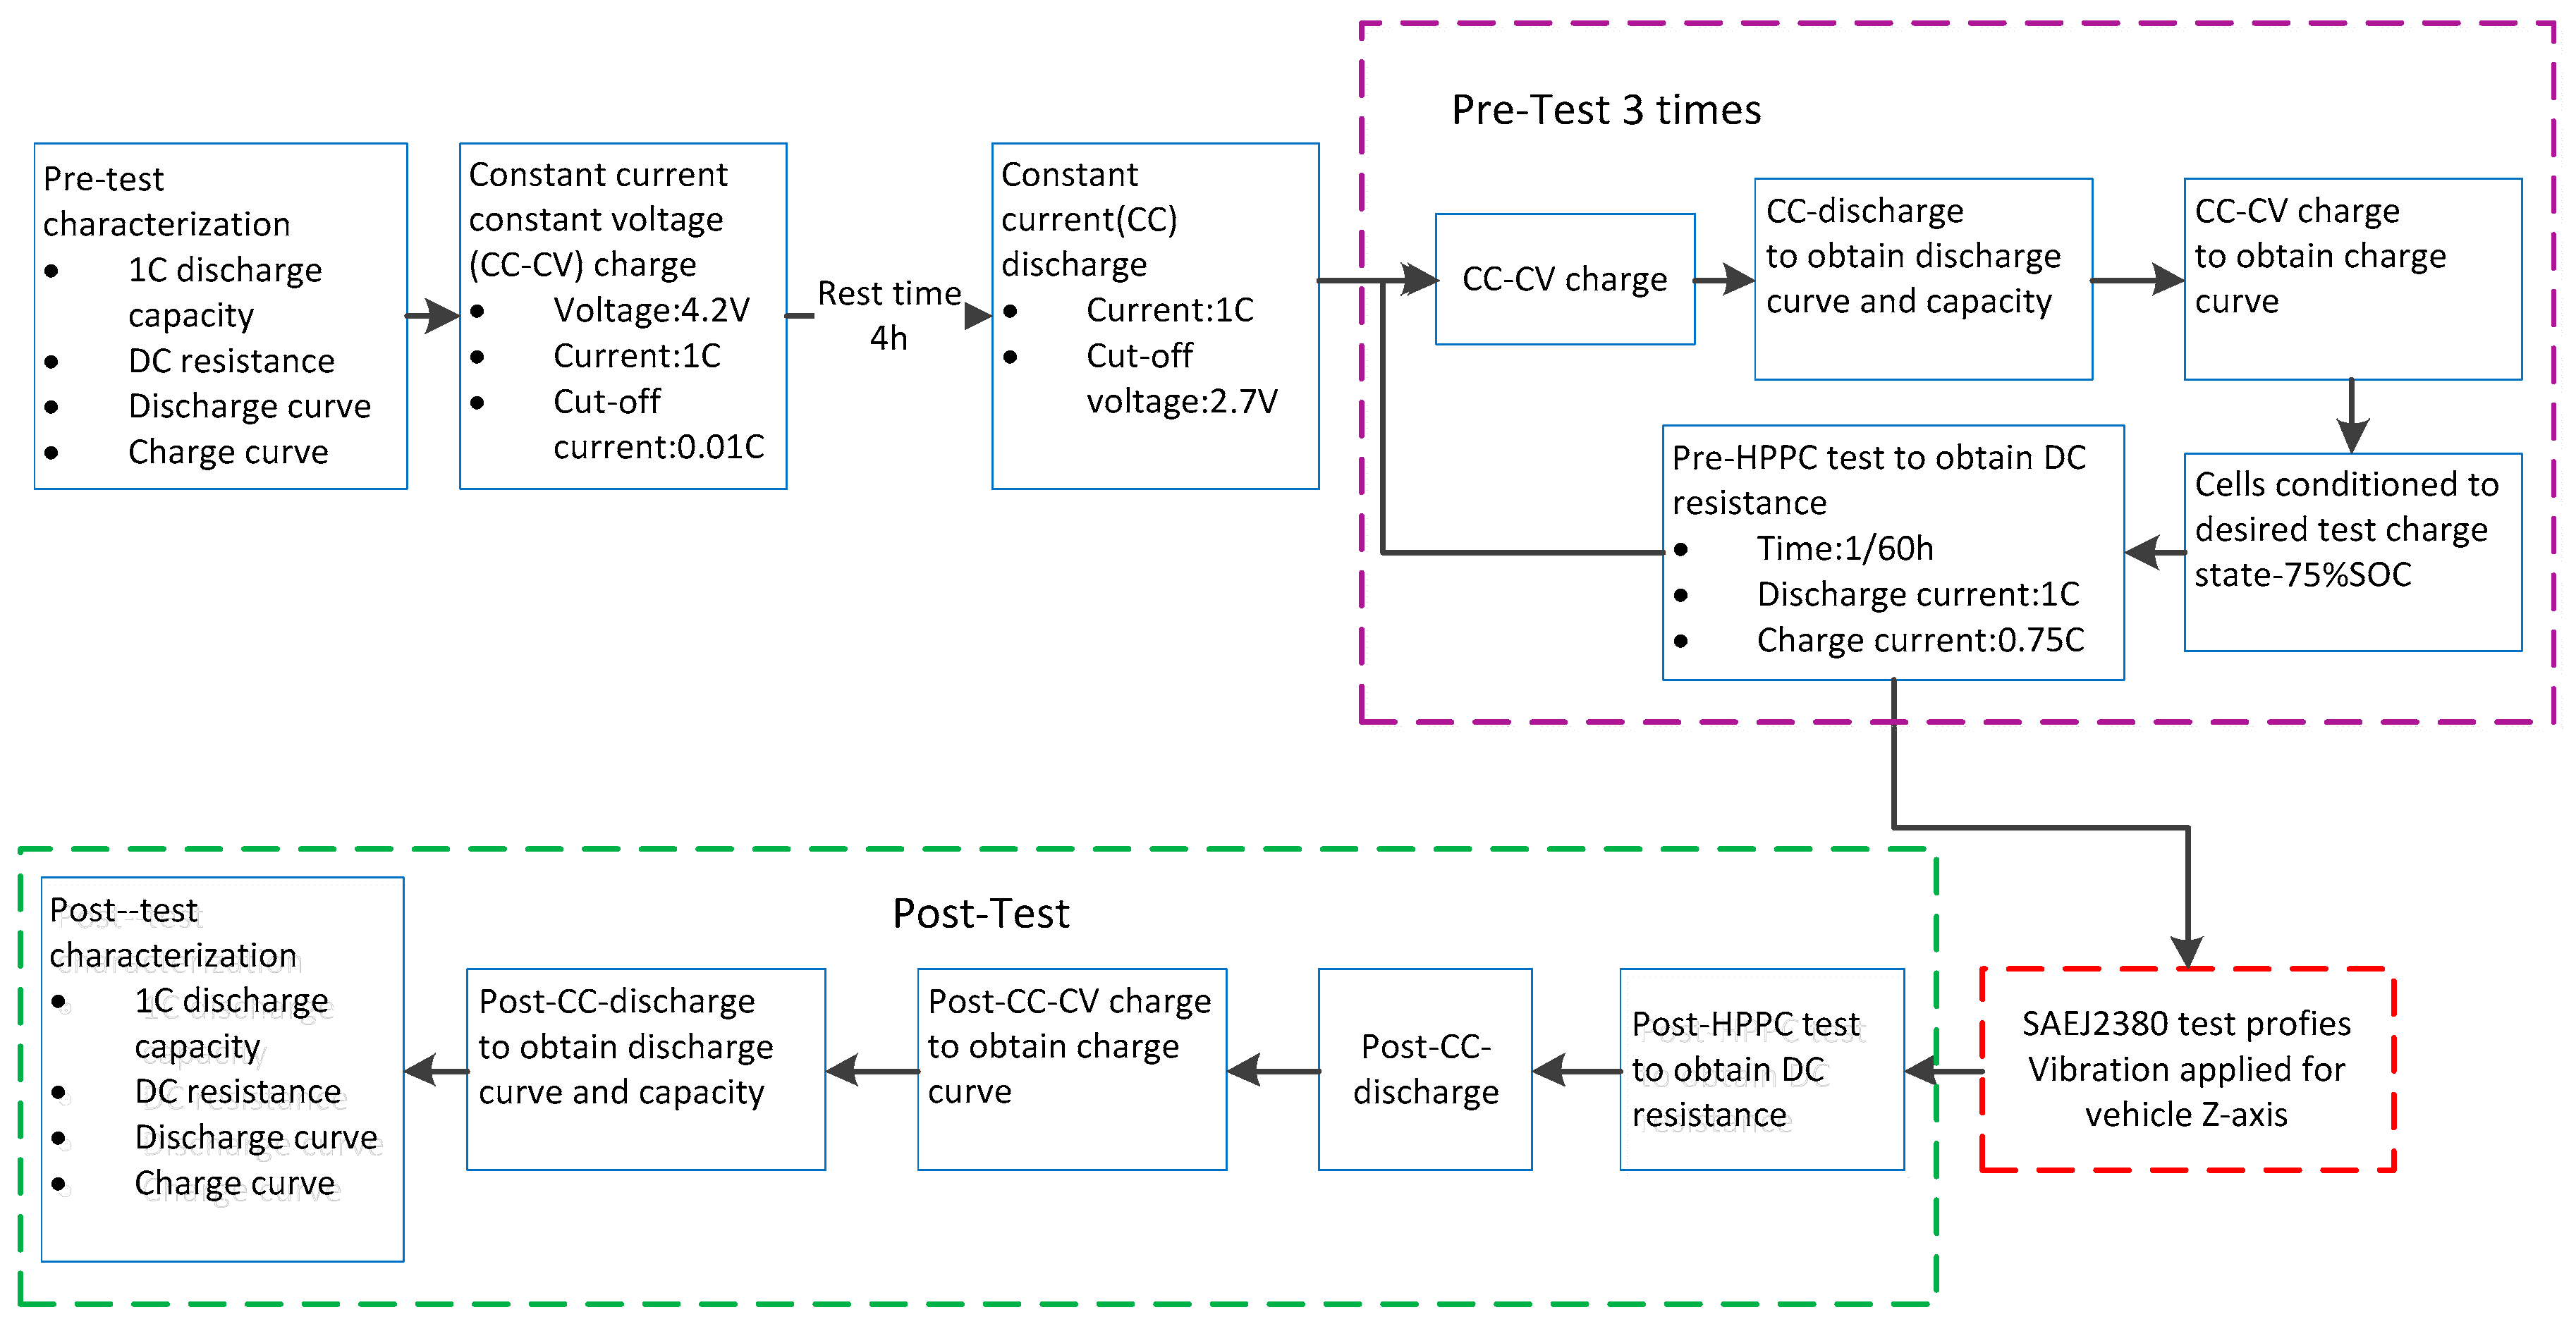
Figure 3.
Vibration spectra for random vibration test referring to Society of Automotive Engineers (SAE) J2380 standard.
Figure 3.
Vibration spectra for random vibration test referring to Society of Automotive Engineers (SAE) J2380 standard.
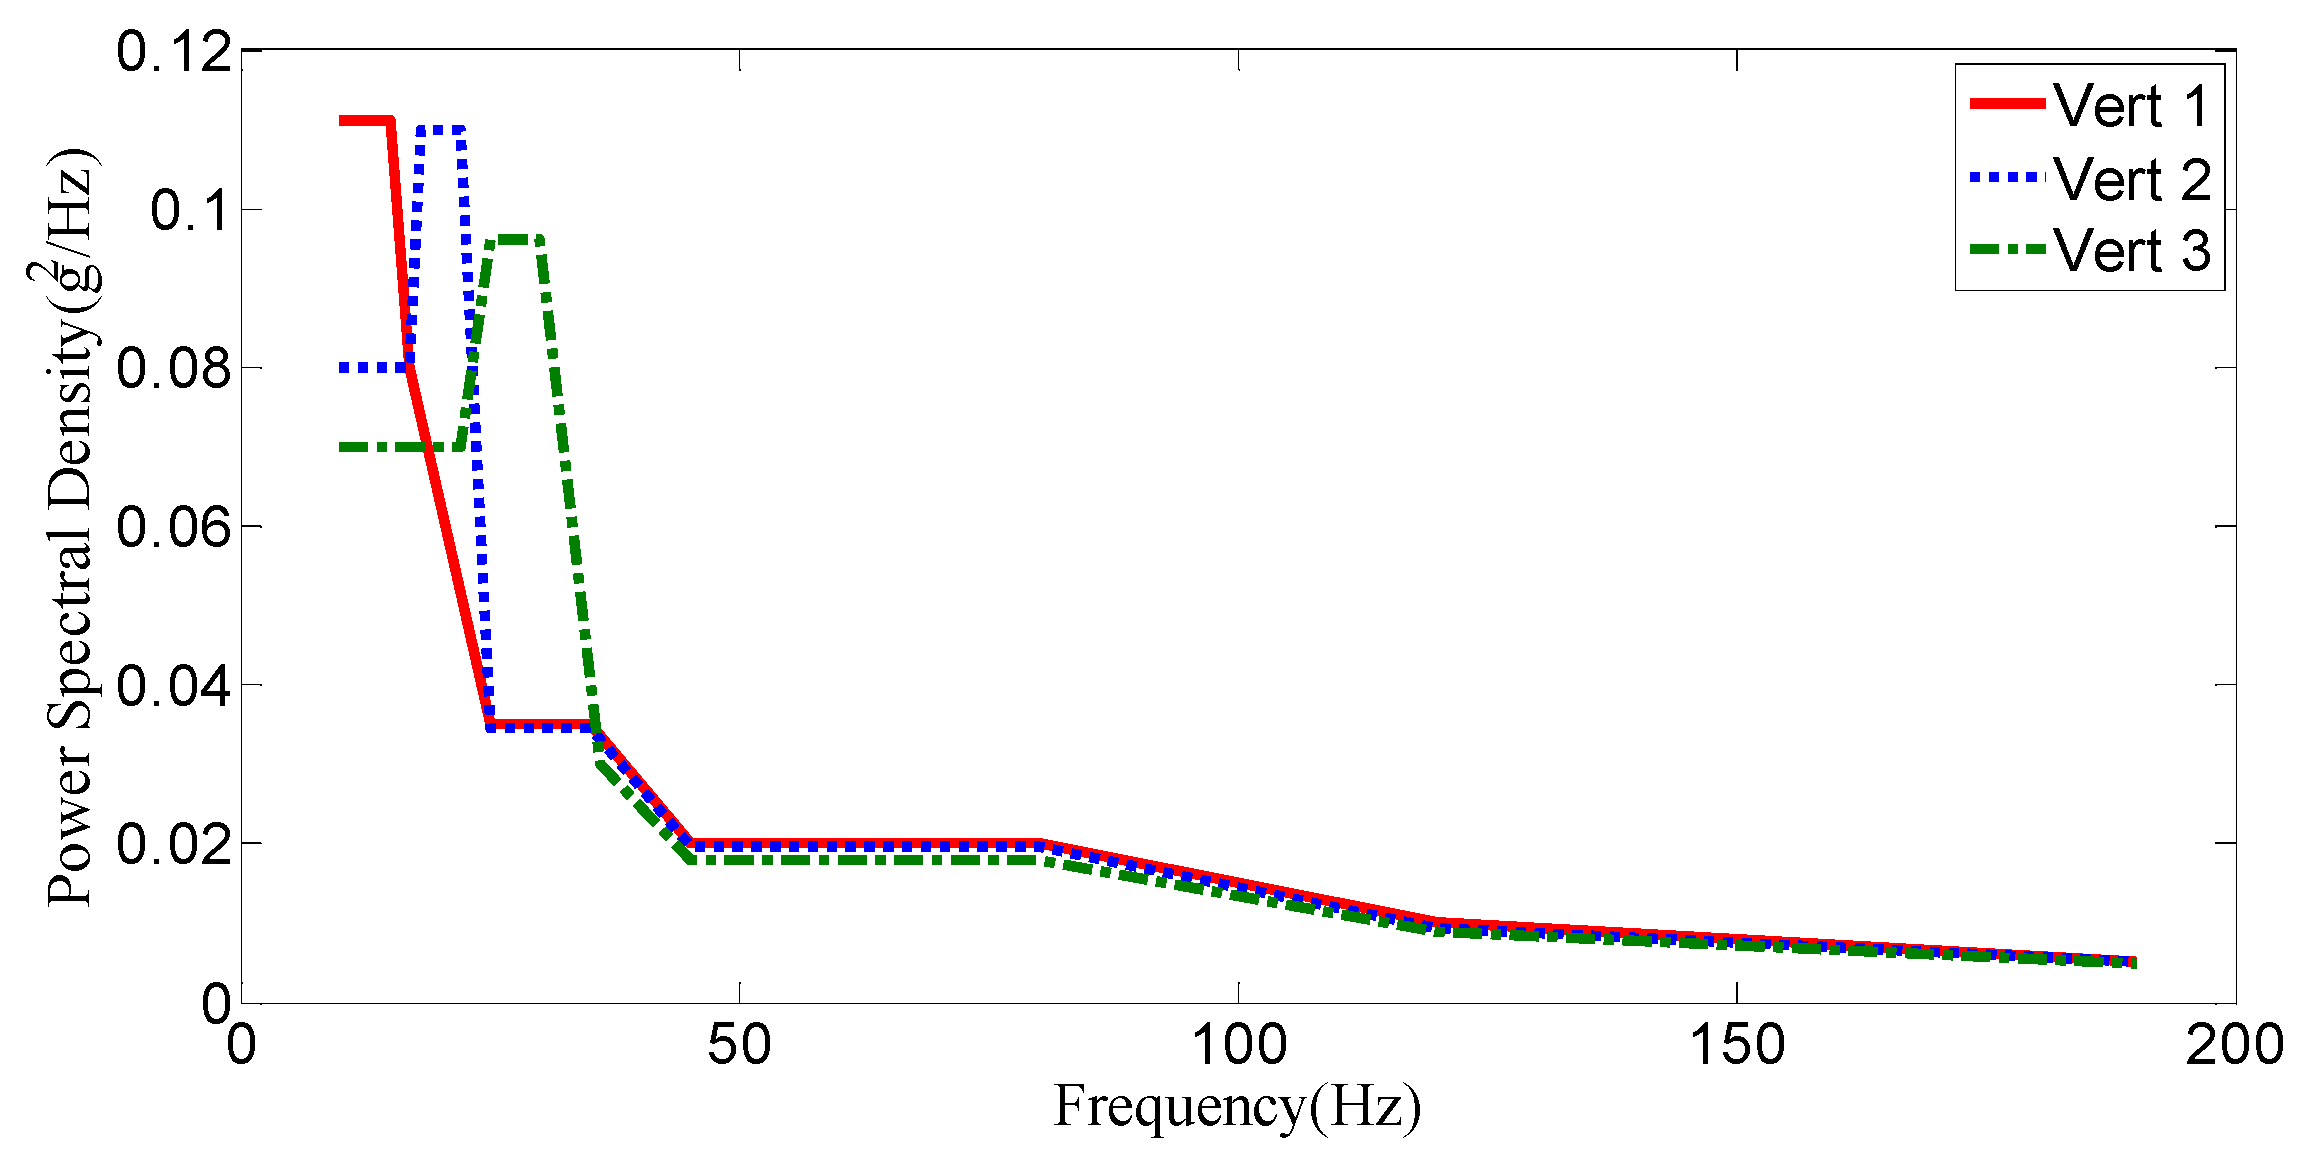
Figure 4.
Axis convention of cells.

Figure 5.
The frequency histogram and theoretical normal distribution density function of the capacity samples before vibration.
Figure 5.
The frequency histogram and theoretical normal distribution density function of the capacity samples before vibration.

Figure 6.
The frequency histogram and theoretical normal distribution density function of the capacity samples after vibration.
Figure 6.
The frequency histogram and theoretical normal distribution density function of the capacity samples after vibration.
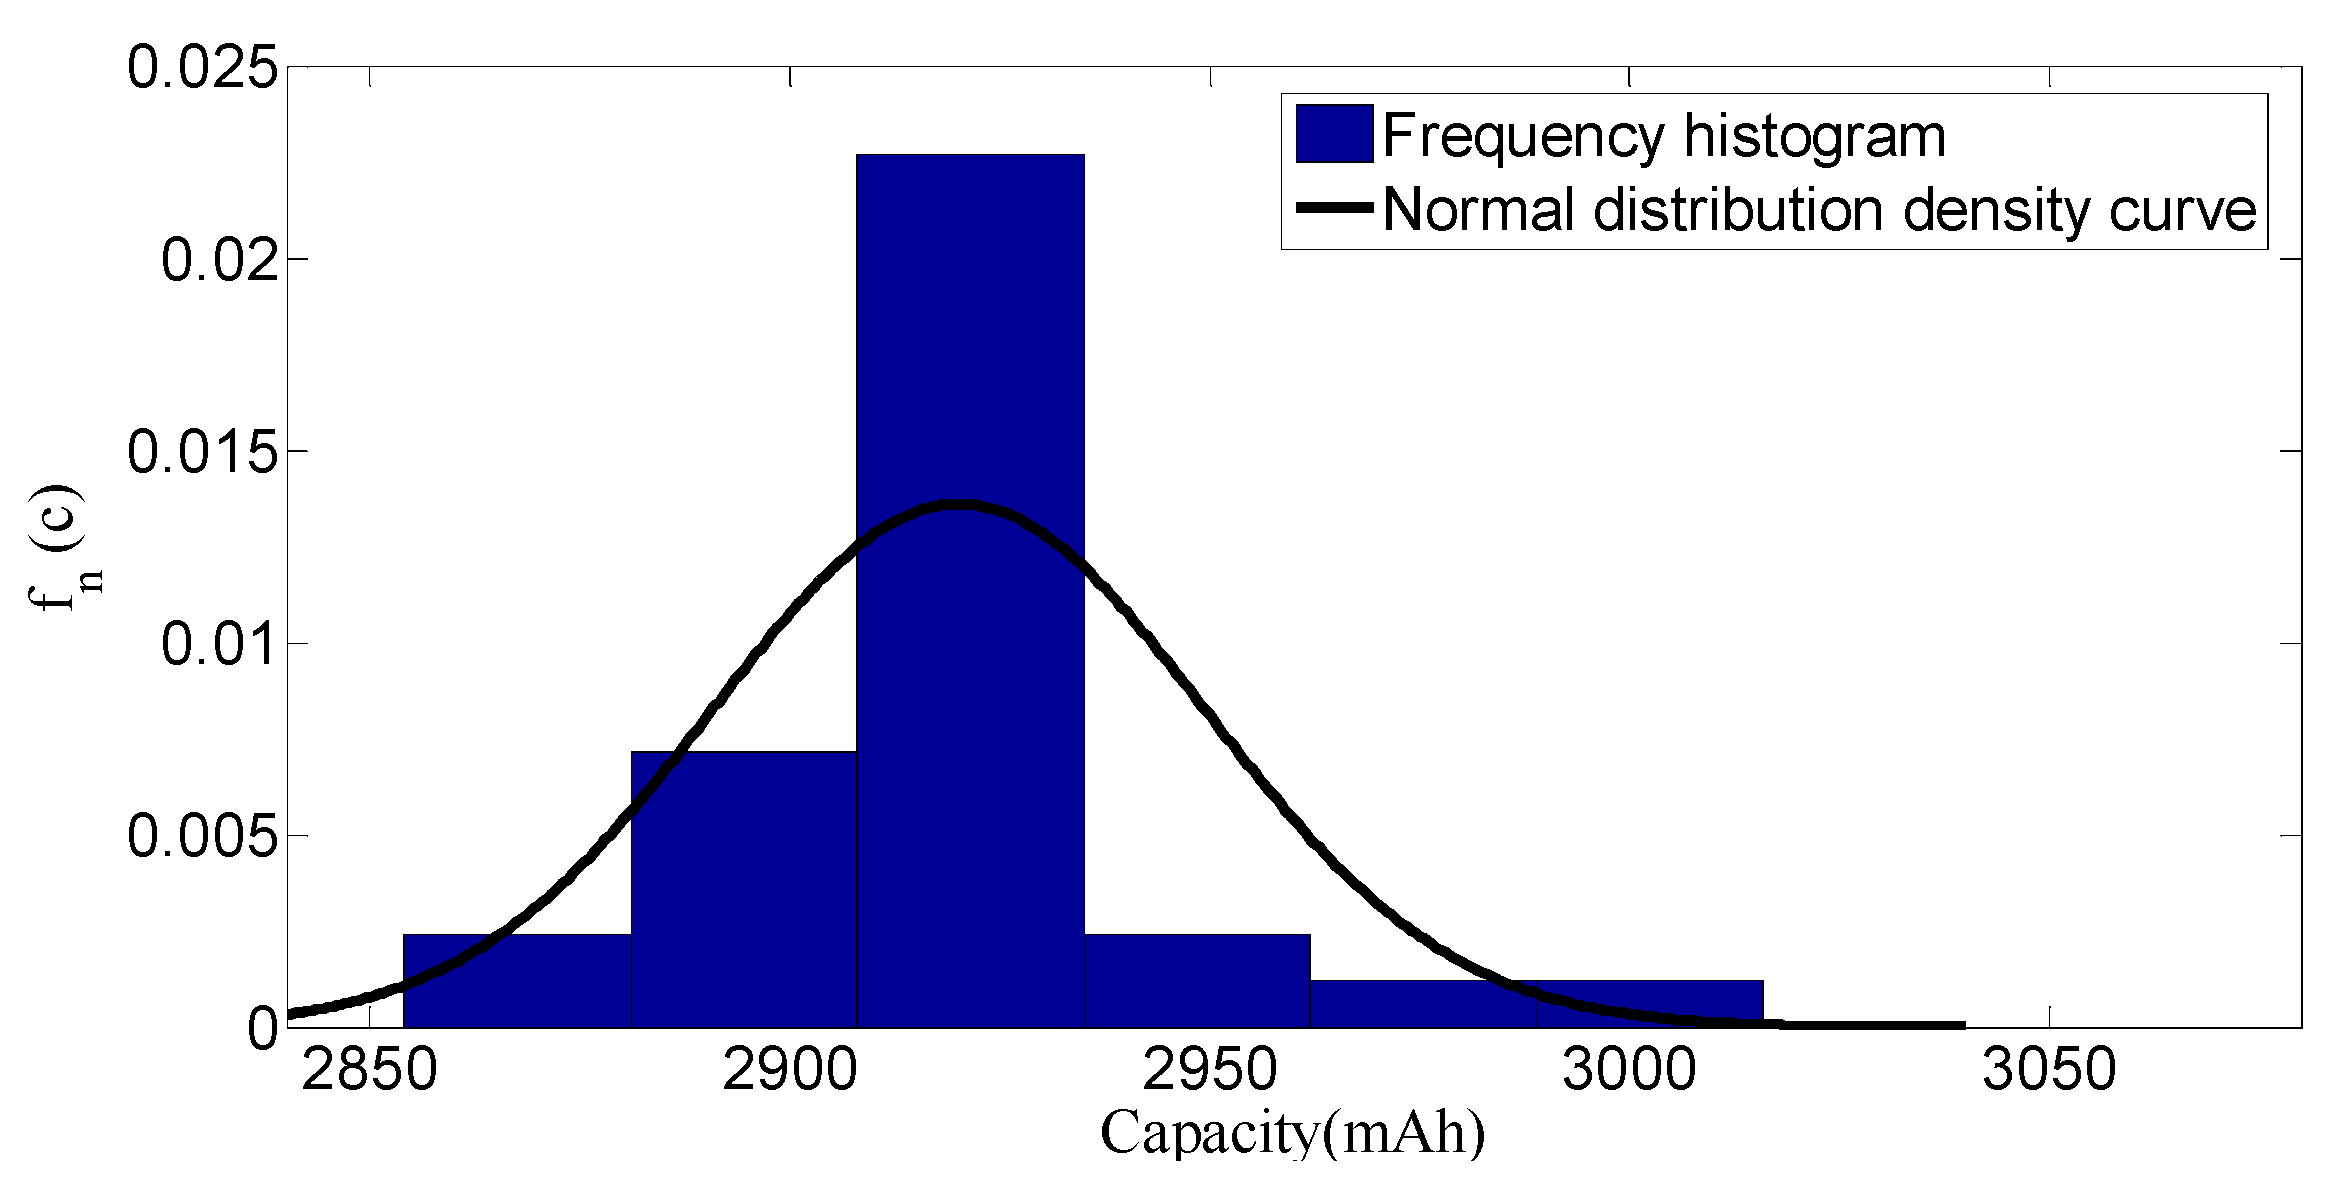
Figure 7.
The distribution function and theoretical normal distribution function of the capacity samples before vibration.
Figure 7.
The distribution function and theoretical normal distribution function of the capacity samples before vibration.

Figure 8.
The distribution function and theoretical normal distribution function of the capacity samples after vibration.
Figure 8.
The distribution function and theoretical normal distribution function of the capacity samples after vibration.

Figure 9.
The distribution function and theoretical normal distribution function of the capacity samples after vibration.
Figure 9.
The distribution function and theoretical normal distribution function of the capacity samples after vibration.

Figure 10.
DC resistance distribution before and vibration test.
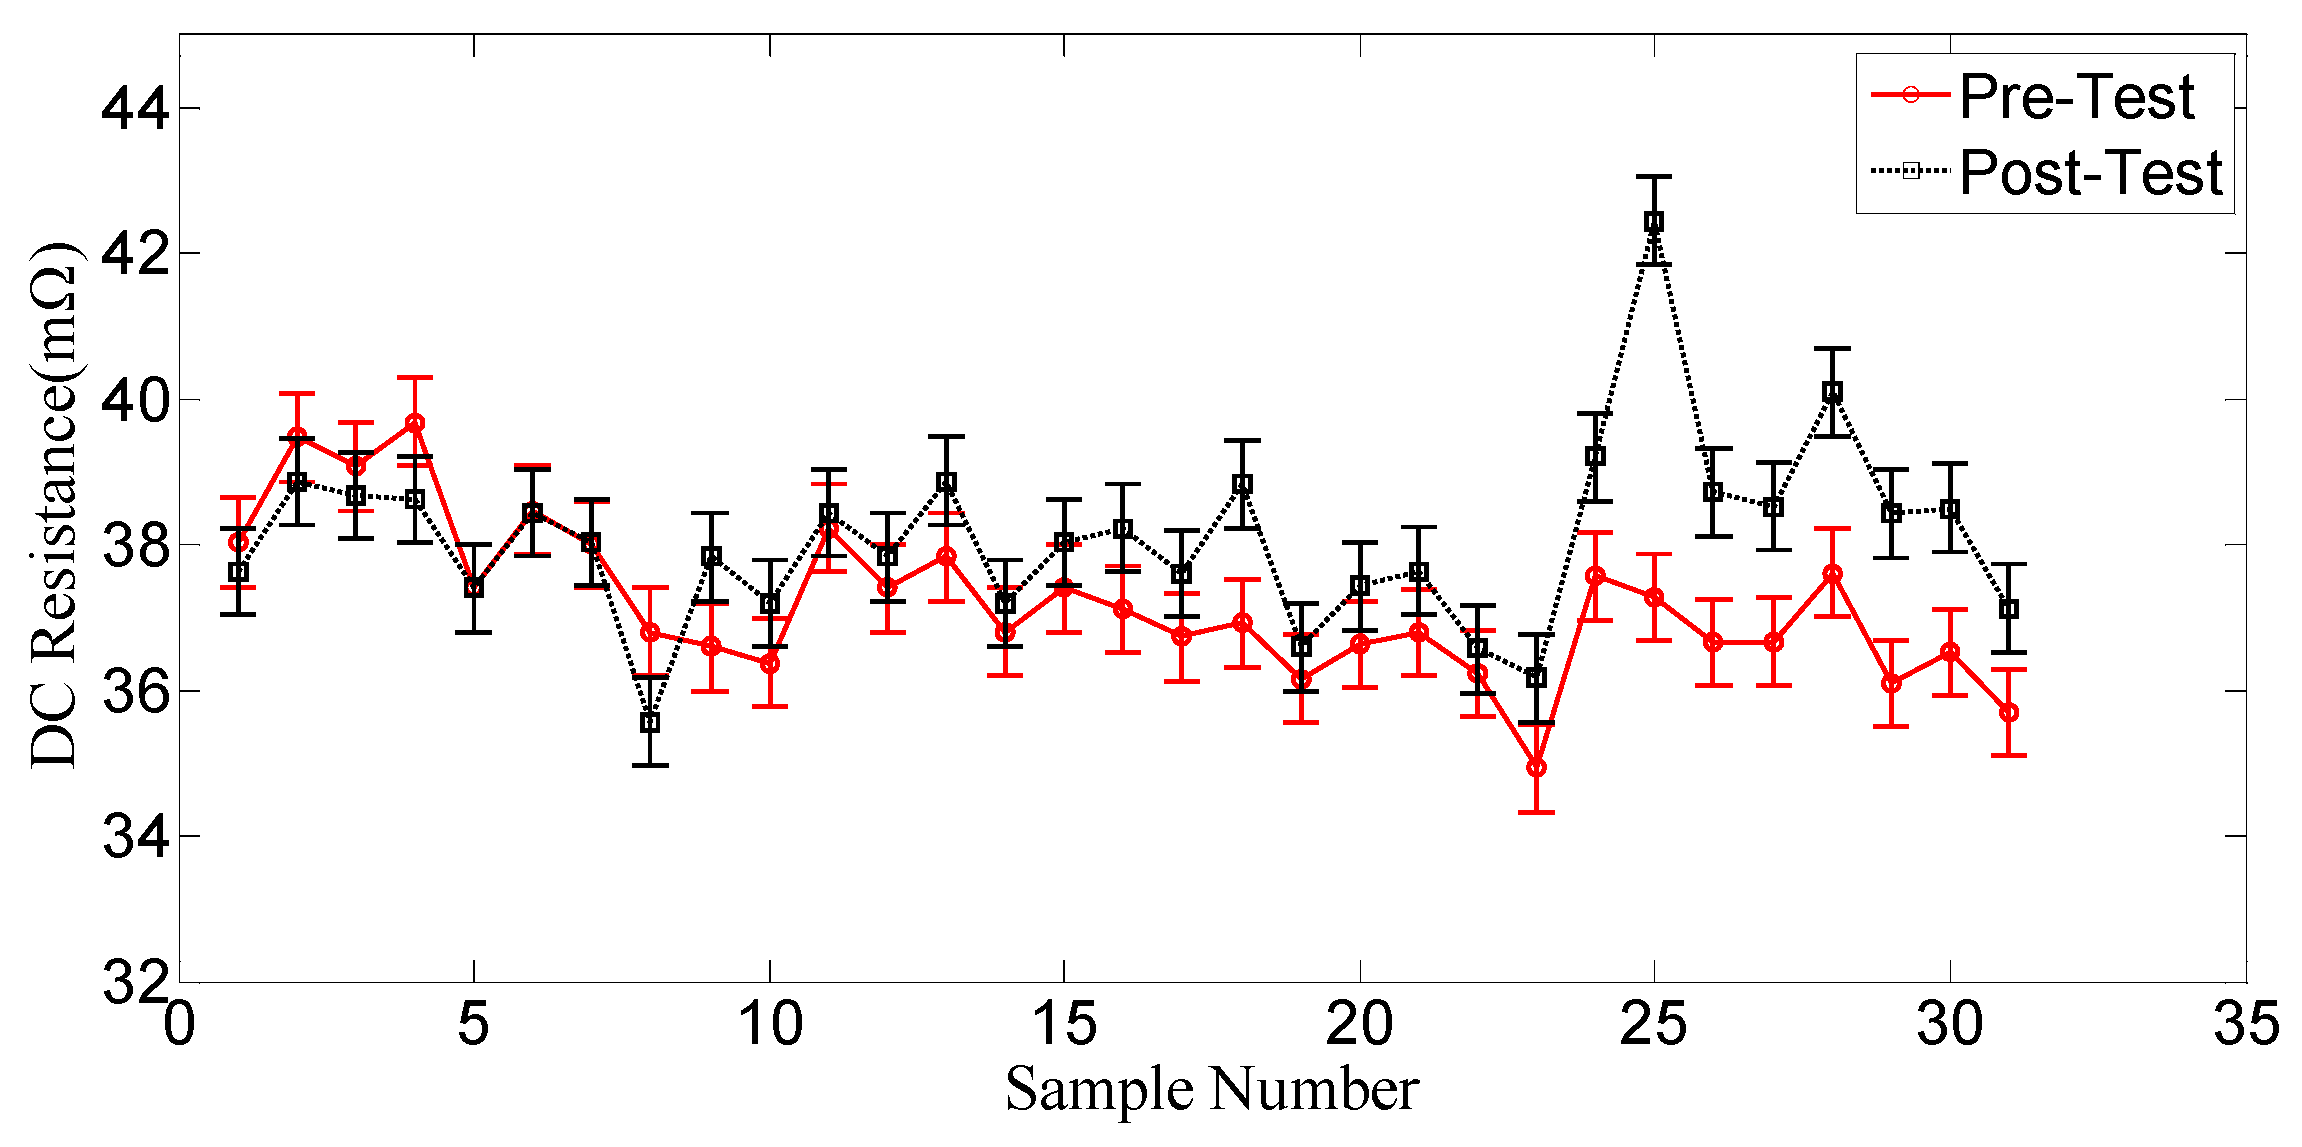
Figure 11.
Incremental capacity (IC) curves before and after vibration.

Figure 12.
Constant current constant voltage charging process. (a) Voltage variation of the constant current and constant voltage (CC-CV) charging; (b) Current variation of the CC-CV charging; (c) Capacity variation of the CC-CV charging.
Figure 12.
Constant current constant voltage charging process. (a) Voltage variation of the constant current and constant voltage (CC-CV) charging; (b) Current variation of the CC-CV charging; (c) Capacity variation of the CC-CV charging.

Figure 13.
Discharge curves before and after vibration test.

Figure 14.
Clustering tree. (a) Clustering tree before vibration test; (b) Clustering tree after vibration test.
Figure 14.
Clustering tree. (a) Clustering tree before vibration test; (b) Clustering tree after vibration test.


Table 1.
Test schedule.
| Test Conditions Vibration Spectrum | Test Conditions State of Charge (StableOC) (%) | Normal Test Accel. (g rms) | Normal Test Time (h) | Normal Test Cumul. Time (h) |
|---|---|---|---|---|
| Vertical 1 spectrum | 75 | 1.9 | 0.15 | 0.15 |
| Vertical 1 spectrum | 75 | 0.95 | 3.5 | 3.65 |
| Vertical 2 spectrum | 75 | 1.9 | 0.15 | 3.8 |
| Vertical 2 spectrum | 75 | 0.95 | 3.5 | 7.3 |
| Vertical 3 spectrum | 75 | 1.9 | 0.15 | 7.45 |
| Vertical 3 spectrum | 75 | 0.95 | 3.5 | 10.95 |
Table 2.
DC resistance distribution before vibration test (mΩ).
| Test Condition | DC Internal Resistance | ||||||
|---|---|---|---|---|---|---|---|
| Pre-Test | 38.03 | 39.47 | 39.07 | 39.67 | 37.40 | 38.47 | 38.00 |
| 36.80 | 36.60 | 36.37 | 38.23 | 37.40 | 37.83 | 36.80 | |
| 37.40 | 37.12 | 36.73 | 36.92 | 36.16 | 36.64 | 36.79 | |
| 36.23 | 34.93 | 37.56 | 37.27 | 36.66 | 36.67 | 37.61 | |
| 36.10 | 36.52 | 35.69 | |||||
Table 3.
DC resistance distribution after vibration test (mΩ).
| Test Condition | DC Internal Resistance | ||||||
|---|---|---|---|---|---|---|---|
| Post-Test | 37.63 | 38.87 | 38.67 | 38.63 | 37.40 | 38.43 | 38.03 |
| 35.57 | 37.83 | 37.20 | 38.43 | 37.83 | 38.87 | 37.20 | |
| 38.03 | 38.23 | 37.60 | 38.83 | 36.60 | 37.43 | 37.63 | |
| 36.57 | 36.17 | 39.20 | 42.44 | 38.72 | 38.52 | 40.09 | |
| 38.43 | 38.50 | 37.13 | |||||
Table 4.
Consistency features of cells sample before vibration test.
| Sample Number | Capacity (mAh) | DC Resistance (mΩ) | q | A (Vs) | P1 (V) | P2 (V) | P3 (V) |
|---|---|---|---|---|---|---|---|
| 1 | 2984.2 | 38.03 | 0.2073 | 12576.5 | 3.615 | 3.648 | 4.15 |
| 2 | 2967.1 | 39.47 | 0.2061 | 12498.8 | 3.624 | 3.644 | 4.126 |
| 3 | 2987.9 | 39.07 | 0.1975 | 12582.7 | 3.617 | 3.647 | 4.129 |
| 4 | 2930.4 | 39.67 | 0.2083 | 12364.4 | 3.64 | 3.66 | 4.127 |
| 5 | 2964.1 | 37.40 | 0.2021 | 12488.5 | 3.622 | 3.654 | 4.126 |
| 6 | 2965.7 | 38.47 | 0.2050 | 12491.7 | 3.622 | 3.654 | 4.128 |
| 7 | 2977.9 | 38.00 | 0.2038 | 12570.6 | 3.619 | 3.651 | 4.165 |
| 8 | 2978.7 | 36.80 | 0.1970 | 12559.1 | 3.622 | 3.656 | 4.129 |
| 9 | 2978.2 | 36.60 | 0.2070 | 12567.5 | 3.612 | 3.646 | 4.137 |
| 11 | 3002.8 | 36.37 | 0.2016 | 12666.4 | 3.606 | 3.651 | 4.129 |
| 12 | 2993.4 | 38.23 | 0.2024 | 12621.0 | 3.616 | 3.658 | 4.134 |
| 13 | 2974.7 | 37.40 | 0.2015 | 12540.5 | 3.61 | 3.655 | 4.123 |
| 14 | 3023.8 | 37.83 | 0.1953 | 12739.2 | 3.614 | 3.655 | 4.132 |
| 15 | 2982.7 | 36.80 | 0.2018 | 12582.8 | 3.606 | 3.653 | 4.134 |
| 16 | 3015.6 | 37.40 | 0.1975 | 12722.3 | 3.61 | 3.647 | 4.134 |
| 17 | 2986 | 37.12 | 0.2032 | 12584.3 | 3.6 | 3.647 | 4.147 |
| 18 | 2964.3 | 36.73 | 0.2063 | 12503.1 | 3.599 | 3.636 | 4.141 |
| 19 | 3001 | 36.92 | 0.1962 | 12637.8 | 3.596 | 3.642 | 4.123 |
| 20 | 2997.1 | 36.16 | 0.1972 | 12638.3 | 3.6 | 3.646 | 4.14 |
| 21 | 2986.2 | 36.64 | 0.1971 | 12588.7 | 3.601 | 3.635 | 4.142 |
| 22 | 2985.7 | 36.79 | 0.2003 | 12579.5 | 3.602 | 3.648 | 4.133 |
| 23 | 2980.9 | 36.23 | 0.2000 | 12577.5 | 3.596 | 3.655 | 4.134 |
| 24 | 2990.7 | 34.93 | 0.1922 | 12610.3 | 3.586 | 3.648 | 4.136 |
| 25 | 2979.1 | 37.56 | 0.2076 | 12564.5 | 3.607 | 3.644 | 4.139 |
| 26 | 2987.2 | 37.27 | 0.2033 | 12586.6 | 3.603 | 3.638 | 4.136 |
| 27 | 2988 | 36.66 | 0.1990 | 12587.7 | 3.602 | 3.648 | 4.132 |
| 28 | 3000.4 | 36.67 | 0.1950 | 12646.5 | 3.6 | 3.65 | 4.139 |
| 29 | 2997.4 | 37.61 | 0.1983 | 12626.9 | 3.607 | 3.651 | 4.141 |
| 30 | 2985.7 | 36.10 | 0.2007 | 12574.7 | 3.596 | 3.646 | 4.134 |
| 31 | 3045.4 | 36.52 | 0.1908 | 12836.2 | 3.6 | 3.636 | 4.134 |
| 32 | 3064.6 | 35.69 | 0.1852 | 12928.2 | 3.587 | 3.637 | 4.136 |
Table 5.
Consistency features of cells sample after vibration test.
| Sample Number | Capacity (mAh) | DC Resistance (mΩ) | q | A (Vs) | P1 (V) | P2 (V) | P3 (V) |
|---|---|---|---|---|---|---|---|
| 1 | 2925.9 | 37.63 | 0.2222 | 12331.6 | 3.646 | 3.677 | 4.151 |
| 2 | 2907.4 | 38.87 | 0.2200 | 12240.2 | 3.657 | 3.685 | 4.127 |
| 3 | 2927.6 | 38.67 | 0.2117 | 12320.8 | 3.651 | 3.678 | 4.133 |
| 4 | 2854.1 | 38.63 | 0.2228 | 12036.6 | 3.689 | 3.708 | 4.143 |
| 5 | 2913.9 | 37.40 | 0.2157 | 12264.1 | 3.655 | 3.684 | 4.141 |
| 6 | 2913.4 | 38.43 | 0.2208 | 12256.3 | 3.656 | 3.686 | 4.133 |
| 7 | 2920.5 | 38.03 | 0.2190 | 12319.9 | 3.651 | 3.682 | 4.153 |
| 8 | 2930.2 | 35.57 | 0.2116 | 12340.4 | 3.643 | 3.673 | 4.12 |
| 9 | 2904.3 | 37.83 | 0.2226 | 12241.4 | 3.632 | 3.664 | 4.157 |
| 11 | 2923.8 | 37.20 | 0.2151 | 12306.2 | 3.626 | 3.655 | 4.134 |
| 12 | 2902.2 | 38.43 | 0.2189 | 12210.9 | 3.638 | 3.657 | 4.13 |
| 13 | 2890.3 | 37.83 | 0.2174 | 12160.1 | 3.631 | 3.663 | 4.124 |
| 14 | 2951.9 | 38.87 | 0.2114 | 12403.4 | 3.637 | 3.664 | 4.116 |
| 15 | 2908.9 | 37.20 | 0.2200 | 12251.6 | 3.628 | 3.662 | 4.123 |
| 16 | 2962.1 | 38.03 | 0.2134 | 12469.3 | 3.623 | 3.654 | 4.129 |
| 17 | 2927.7 | 38.23 | 0.2226 | 12328.9 | 3.634 | 3.679 | 4.144 |
| 18 | 2873.7 | 37.60 | 0.2277 | 12121.6 | 3.635 | 3.672 | 4.135 |
| 19 | 2926.9 | 38.83 | 0.2147 | 12307.9 | 3.628 | 3.661 | 4.127 |
| 20 | 2926.6 | 36.60 | 0.2157 | 12324.9 | 3.633 | 3.676 | 4.142 |
| 21 | 2912.2 | 37.43 | 0.2169 | 12260.4 | 3.635 | 3.678 | 4.131 |
| 22 | 2915.5 | 37.63 | 0.2207 | 12268.4 | 3.638 | 3.671 | 4.134 |
| 23 | 2911.3 | 36.57 | 0.2189 | 12274.7 | 3.629 | 3.663 | 4.151 |
| 24 | 2933.2 | 36.17 | 0.2089 | 12362.1 | 3.617 | 3.651 | 4.124 |
| 25 | 2890.7 | 39.20 | 0.2218 | 12189.4 | 3.621 | 3.658 | 4.138 |
| 26 | 2915.9 | 42.44 | 0.2185 | 12273.4 | 3.628 | 3.658 | 4.132 |
| 27 | 2915.2 | 38.72 | 0.2104 | 12264.9 | 3.623 | 3.654 | 4.113 |
| 28 | 2923.1 | 38.52 | 0.2059 | 12301.2 | 3.623 | 3.666 | 4.11 |
| 29 | 2907.4 | 40.09 | 0.2136 | 12227.2 | 3.636 | 3.676 | 4.144 |
| 30 | 2909.9 | 38.43 | 0.2166 | 12239.0 | 3.621 | 3.668 | 4.127 |
| 31 | 2979.8 | 38.50 | 0.2049 | 12537.5 | 3.623 | 3.659 | 4.111 |
| 32 | 3016.2 | 37.13 | 0.1977 | 12699.5 | 3.611 | 3.647 | 4.125 |
Table 6.
The inconsistent coefficient of class merging before and after the vibration test.
| Cell Sample Condition | The Inconsistent Coefficient of Different Classes | ||||
|---|---|---|---|---|---|
| Class 5 | Class 4 | Class 3 | Class 2 | Class 1 | |
| Pre-Test | 2.22 | 2.51 | 2.74 | 3.22 | 2.95 |
| Post-Test | 1.30 | 2.31 | 2.60 | 3.44 | 3.10 |
© 2017 by the authors. Licensee MDPI, Basel, Switzerland. This article is an open access article distributed under the terms and conditions of the Creative Commons Attribution (CC BY) license (http://creativecommons.org/licenses/by/4.0/).
Share and Cite
MDPI and ACS Style
Zhang, L.; Ning, Z.; Peng, H.; Mu, Z.; Sun, C. Effects of Vibration on the Electrical Performance of Lithium-Ion Cells Based on Mathematical Statistics. Appl. Sci. 2017, 7, 802. https://doi.org/10.3390/app7080802
AMA Style
Zhang L, Ning Z, Peng H, Mu Z, Sun C. Effects of Vibration on the Electrical Performance of Lithium-Ion Cells Based on Mathematical Statistics. Applied Sciences. 2017; 7(8):802. https://doi.org/10.3390/app7080802
Chicago/Turabian StyleZhang, Lijun, Zhansheng Ning, Hui Peng, Zhongqiang Mu, and Changyan Sun. 2017. "Effects of Vibration on the Electrical Performance of Lithium-Ion Cells Based on Mathematical Statistics" Applied Sciences 7, no. 8: 802. https://doi.org/10.3390/app7080802
Note that from the first issue of 2016, this journal uses article numbers instead of page numbers. See further details here.