Article

Experimental Evaluation of Thermal Performance and Durability of Thermally-Enhanced Concretes

1
Department of Architecture, Sejong University, Seoul 05006, Korea
2
New Transportation Research Center, Korea Railroad Research Institute, Uiwang-Si, Gyeonggi-do 16105, Korea
3
Infra Structure Team, Technical Division, GS E & C, Grand Seoul, 33 Jong-ro, Jongno-gu, Seoul 03159, Korea
4
Department of Civil Engineering, Kangwon National University, Chuncheon-si, Gangwon-do 24341, Korea
*
Author to whom correspondence should be addressed.
Appl. Sci. 2017, 7(8), 811; https://doi.org/10.3390/app7080811
Submission received: 10 July 2017 / Revised: 1 August 2017 / Accepted: 2 August 2017 / Published: 8 August 2017
(This article belongs to the Section Energy Science and Technology)

Abstract

:
The thermal performance and durability of the thermally-enhanced concrete with various insulating materials were evaluated through a series of tests. Three types of insulating materials—diatomite powder, hollow micro-spheres, and a micro-foam agent—were used for both normalweight aggregate concrete (NWAC) and lightweight aggregate concrete (LWAC). The thermal conductivity was measured by two different test methods: quick thermal conductivity meter (QTM) and guarded hot wire (GHW) methods. Then, the results were compared with each other. All insulating materials used in this study proved their ability to reduce the thermal conductivity. Additionally, it can be found that the trend of a decrease in air-dry density is similar to that of thermal conductivity of thermally-enhanced concrete. Additional thermal transmission tests with seven large-scale specimens were conducted by using the calibrated hot box (CHB). However, from this tests, it was seen that thermal transmission reduction for tested specimens were not large compared to the thermal conductivity reduction measured by QTM and GHW, due to multiple heat transfer. To examine the durability of thermally-enhanced concretes, accelerated carbonation and freeze-thaw cycle tests were conducted. From the results, it can be found that the thermally-enhanced concrete shows good freeze-thaw resistance. However, the carbonation rates of the concretes increased rapidly and additional methods to improve the carbonation resistance should be considered.

1. Introduction

Global efforts are focusing on reducing the greenhouse gas emission since it causes the significant environmental and economic problems with climate change. Korean government has also decided to reduce greenhouse gas emissions by 37% from business-as-usual (BAU) level in 2015 to BAU level in 2030 and submitted the plan to the U.N. in August 2015 [1]. Korea recorded 18 barrels oil consumption per capita in 2014, which corresponded to the fifth largest consumption country in the world [2]. Although Korean government has tried to develop new energy business and innovative industrial sectors, one of the feasible solutions might be to decrease heating energy consumption by increasing the thermal insulation of houses and buildings, such as passive houses and zero-energy buildings, since the main energy consumption sectors in Korea shifted from industrial sectors to residual sectors. According to the report on the annual energy consumption in 2014 in Korea, the residual sectors are responsible for 27.6% of total energy consumption, which increased by 5.4% comparing to previous year [3]. The energy regulations for buildings and houses have been continuously strengthened to reduce the energy losses around the world. For example, Denmark has implemented the project for energy renovation, since heating energy occupied 40% of the total Danish energy consumption [4]. While an increase in the insulator thickness can improve the thermal insulation of buildings, it also increases construction cost and weight. Therefore, the development of advanced and lightweight insulation materials are currently underway to decrease the insulator thickness [5,6]. Thermally insulated structural concrete including various materials have been recently studied and brought great attentions, as an alternative to reduce energy consumption and increase the heating efficiency of buildings and houses [7,8]. Alani et al. [9] investigated the thermal performance of concrete using recycled glass screed. Baetens et al. [10] gave an overview of the various kinds of phase change materials (PCMs) and possibilities for building applications. Meshgin et al. [11] developed multi-scale composite models for PCM concrete to estimate the effective thermal conductivity. Gao et al. [12] experimentally studied on the lightweight aggregate concrete using silica aerogel particles to increase the thermal insulating capacity. In addition, there are several researches relating to diatomite powder to try to improve mechanical properties of cement mortar and concrete, as a replacement of cement [13]. Chung et al. [14] recently studied lightweight aggregate concrete to enhance energy efficiency in the field of building in Germany.
Several available testing methods for thermal properties are proposed and adopted by ASTM and ISO. The measurement methods by means of guarded hot plate, contact hot wire, and thermal needle have been widely used to evaluate the thermal conductivity [15,16,17,18,19]. However, the evaluation or measurement of the exact thermal properties of new materials-incorporated concrete become more difficult and inaccurate as insulating materials in concrete are getting more diverse and irregular. To enhance the accuracy and credibility of thermal properties measurement, more than two methods should be conducted. Furthermore, to accurately evaluate the heat flows and the actual thermal properties of composite or hybrid components, hot box facilities are recommended [7].
Since thermally-enhanced concrete is usually mixed with diverse materials, the durability performance of the concrete should be verified under the harmful environmental conditions for its expected life [20,21]. Considering the seasonal change of ambient temperature in Korea, the resistance on cyclic freeze-thaw should be verified. Also, there is a higher risk to the carbonation of the concrete, since atmospheric CO2 concentration is increasing as increasing greenhouse gas emission. Hydration products, Ca(OH)2, reacts with CO2 and it forms CaCO3. It results in reduction of pH of the concrete.
In this study, performance of thermally enhanced normalweight (NWAC) and lightweight concretes (LWAC) mixed with various insulating materials (diatomite powder, hollow micro-sphere and micro-foam agent) were evaluated through a series of tests. The quick thermal conductivity meter (QTM), the guarded hot plate (GHP) and the calibrated hot box (CHB) tests were performed to investigate thermal performance of the thermally-enhanced concrete with various insulating materials. Furthermore, accelerated carbonation and cyclic freeze-thaw tests were conducted to evaluate the durability performance of the thermally-enhanced concretes.

2. Materials and Methods

2.1. Materials

In order to improve the thermal performance of concrete, various insulating materials were selected in this study. Hollow micro-spheres, micrometer-sized glass bubbles with a mean diameter of 65 μm and a specific gravity of 0.125, are used as a replacement of the coarse aggregate. A micro-foam agent, an acrylic polymer-based foam agent, is added as a chemical admixture in order to develop stable foams 10–100 μm in diameter. Diatomite powder, which is categorized as one of the well-known natural pozzolans, is used as a supplementary cementitious material for a partial replacement of cement in order to compensate the compressive strength loss and reduce the manufacturing cost of thermally-insulated concrete. In addition, diatomite has been used as one of the insulating materials for refractories due to its internal pores. Since its thermal conductivity is measured 0.014 W/m·K at 400 °C [22], diatomite powder also can be expected to improve the thermal performance of thermally-enhanced concrete. In this study, diatomite powder with more than 90% SiO2 content and a mean particle diameter of 30 μm was used. The physical properties of the micro-foam agent and diatomite powder are summarized in Table 1 and Table 2, respectively.
A lightweight aggregate made of expanded slate was used, since not only do its internal pores contribute to the reduction of thermal conductivity of concrete, but it also has a low thermal conductivity of 0.106 W/m·K in totally dry conditions. Density and the maximum size of the lightweight coarse aggregate was 1460 kg/m3 and 12.5 mm. Crushed granite was used as a normalweight coarse aggregate with a specific density of 2.61 and maximum aggregate size of 25 mm. Cleaned sea-sand with a specific density of 2.60 and a fineness modulus of 2.83 was employed as a normalweight fine aggregate for all mixtures. Table 3 summarizes the physical properties of these fine and coarse aggregates. Type I Ordinary Portland Cement (OPC) with a Blaine surface area of 3325 cm2/g and a specific density of 3.15 was selected in this study. Polycarboxylate-based high-range water reducing admixture with a dosage of 0.7% of cement weight was added. An air-entraining agent 0.001% of cement weight, for a target air content of more than 4.5%, was applied to achieve the freeze-thaw resistance [23].
The concrete mixtures were categorized in two groups according to the different types of coarse aggregate (normalweight and lightweight aggregates). Three different insulation materials produced a total of eight specimens, labeled as NN and LN (e.g., the reference specimen for normalweight and lightweight aggregates concrete, adding none of the insulation materials), ND and LD (e.g., NWAC and LWAC replacing 15% of coarse aggregate volume with diatomite powder), NH and LH (e.g., NWAC and LWAC replacing 40% of the coarse aggregate volume with hollow micro-spheres instead), and NM and LM (e.g., adding the micro-foam agent in a measure of 4% of the cement binder as a chemical additive). The detailed classifications are tabulated in Table 4. The mixtures were designed for achieving the designed cylindrical compressive strength of 24 MPa at 28 days, as listed in Table 5. To design the structural concrete, comprehensive studies are needed, including recycled constituents [25]. However, structural concrete is defined as a concrete that has the compressive strength of more than 24 MPa in Korea. Thus, the target designed cylindrical compressive strength was set as 24 MPa at 28 days in this study. A foam agent tends to reduce the compressive strength of the concrete [26]. Thus, to achieve the designed 28 days compressive strength (24 MPa) of the foamed concrete, the cement contents of NM and LM were increased comparing to other specimens.
The cylindrical specimens 100 mm in diameter and 200 mm in height were cast to measure the density and compressive strength for each mixture. The prism specimens with 100 × 100 × 400 mm were cast for the accelerated carbonation and cyclic freeze-thaw tests. Three 65 × 114 × 230 mm bricks for each mixture were prepared to measure the thermal conductivity. After 24 h of mixing, all specimens were de-molded and cured in water at 20 ± 2 °C until the time of testing. Seven large-scale specimens with dimensions of 1500 × 1500 × 220 mm were built for the thermal transmission test. Unfortunately, there was an error for making a formwork, so specimen LN failed to install the calibrated hot box apparatus. These specimens were removed from the forms after seven days of curing at an average temperature of 23 °C and a relative humidity of 50%.

2.2. Test Methods

The air-dry density of hardened concrete was recorded to estimate the relationship with the thermal conductivity in accordance with ASTM C642. The axial loading test was conducted to measure the compressive strength at the age of 28 days according to ASTM C39.

2.2.1. Thermal Properties

The measurement of thermal conductivity is always related to the detected heat flow and temperature difference. There are a number of methods to measure thermal conductivity and they have relatively large shortcomings depending on the raw materials, temperature range, and moisture conditions [24]. The measurement methods are classified as steady-state and transient techniques according to the energy or heat flux equilibrium conditions. The representative measurement methods using steady-state techniques are guarded hot plate (GHP) methods, such as ASTM C177 [15], whereas the typical transient methods are hot wire methods, i.e., ASTM C1113 [16]. The GHP method is a widely used and versatile method, however, it can only obtain accurate results after reaching the moisture equilibrium. Meanwhile, hot wire methods employing transient techniques are commonly used and relatively rapid ways compared to guarded hot plate methods. Due to the irregular heat flux and heat loss between a hot wire and contact surface, it is known to indicate comparatively large experimental errors [24]. In spite of these disadvantages, there are diverse modified techniques based on the hot wire method. The well-known and well-established method is the probe method [17], utilizing a needle probe inserted into the specimen to determine the thermal properties of the lower conductivity in powder, soil, and concrete [27]. The quick thermal conductivity meter (QTM) with the probe, called the contact hot-wire method, was commercially developed to measure the temperature change, since this is very convenient and can expect relatively accurate results by repeating the test [9]. It is observed that all these methods result in a slight variation of thermal conductivity, especially in obviously heterogeneous material, such as concrete. Yun et al. [7] proposed the linear heat flow method fitting temperature distribution curves and verified the reliability of this method to measure the thermal conductivity of concrete.
While thermal conductivity represents the heat transfer through a specific type of material with unit area and has a unit temperature gradient regardless of the thickness of the material, the thermal transmission coefficient, called the U-value, is the heat loss through a given thickness of a material and a relative simple way to estimate energy efficiency of each material. Since thermal conductivity only considers conduction and does not include convection or radiation, this cannot reflect real heat movement or losses in buildings and houses. To exactly estimate heat loss, taking account radiation and convection, thermal transmission should be calculated and defined as the insulation management criteria within building regulations in Korea [28]. There are several available methods to measure the thermal transmission of composite building components with variable thermal conductivities in the steady-state condition: the most well-known testing method is the guarded hot box or calibrated hot box method (CHB), consisting of cold and hot chambers and a specimen mounting panel [18,19]. Thus, in order to evaluate a realistic thermal performance of building components (such as a wall), the calibrated hot box method (CHB) was used in this study.
Figure 1 shows a schematic plan of the calibrated hot box used in this study. The temperature difference between cold and hot boxes across a specimen is established as 20 °C and has been maintained until the constant heat balance is reached in the specimen.
In this study, both QTM and GHP were implemented to gather thermal conductivity values, while CHB was conducted to measure the thermal transmission values. The surface of the concrete brick specimen was polished before applying QTM. The measurements by QTM were averaged at four different locations on the surface at ambient temperature. For GHP [15], all specimens were oven-dried in a ventilated oven at 100 °C until the change of mass was less than 0.2% to minimize moisture effects in the concrete. A large-scale specimen with 1500 × 1500 × 220 mm was installed in the calibrated hot box apparatus, which is presented in Figure 2, in accordance of ASTM C1363 and ISO 8990 [18,19]. The temperature of the hot and cold boxes was set at 20 and 0 °C, respectively. This testing continued to maintain a constant heat flow across a specimen and measured the heat flow and surface temperatures of both sides of it.

2.2.2. Durability Performance

Accelerated carbonation and cyclic freeze-thaw tests were performed to investigate the durability of thermally-enhanced concrete. Carbonation is defined as the chemical reaction where carbon dioxide gas diffuses into the concrete and reacts with calcium hydroxide in the hydrated cement paste to form calcium carbonate (Equation (1)) [29,30]:
Ca(OH)2 + CO2 → CaCO3 + H2O
Carbonation reduces the pH of the pore solution in hardened cement paste from an average 13.5 to below 9.0, which causes the protective oxide film of reinforcement steel to degrade and corrosion may take place. It is known that the carbonation rate is a function of concrete strength, water-to-cement ratio, and curing conditions. For instance, low-strength concrete with a compressive strength lower than 30 MPa may experience relatively rapid carbonation within several years [31,32]. The well-known accelerated carbonation testing method using a carbonation chamber is recommended by Réunion Internationale Laboratoires Experts Matériaux (RILEM) to determine the depth of carbonation by means of the phenolphthalein solution as an indicator [33]. However, careful consideration should be given to interpret the accelerated carbonation testing results, since carbonation in real concrete structures is greatly influenced by the exposure conditions, such as atmospheric relative humidity, periodic wetting and drying, and temperature. The control conditions of the accelerated carbonation chamber in accordance with BS EN 13295 [32] are listed as follows: temperature 20 ± 2 °C, relative humidity 60 ± 5%, CO2 level 5 ± 0.2%. Specimens were installed for eight weeks after curing in water for 27 days. The average carbonation depth was recorded with a spaying of 1% solution of phenolphthalein at one, four, and eight weeks.
Cyclic freezing and thawing attack, one of the physical attacks on concrete, causes progressive deterioration and leads to inadequate durability of concrete since freezing water in the fine cracks results in a 9% volume expansion. The main factors influencing the resistance of concrete to freeze-thaw attack are known as the degree of saturation, strength, and the pore system of the hardened cement paste. Since thermally-enhanced concretes have various insulation materials, they may increase the porosity and adversely affect the resistance to freezing and thawing. There are no standard methods for measuring the resistance of concrete to cyclic freezing and thawing, which have been developed on a practical basis [34]. The most widely used test method is ASTM C666 [35]. This method alternatively raises and lowers the temperature of a specimen from 4 to −18 °C within 2–5 h at a freezing rate of 4 °C/h–11 °C/h. Generally, the criteria of testing is 300 cycles with 4–10 cycles per day. Among many factors, including length and mass reductions or strength loss, the relative dynamic modulus of elasticity calculated from fundamental transverse frequencies is used to assess the resistance on freezing and thawing when it drops to 60% of its original values, as defined in Equation (2):
P c = ( n 1 2 n 2 ) × 100
where Pc is the relative dynamic modulus of elasticity after c cycles of freezing and thawing in %; n is the fundamental transverse frequency at 0 cycles of testing; and n1 is the fundamental transverse frequency after c cycles of testing. However, this method is recognized as a relatively severe test since the degree of saturation of the concrete and aggregates at the early age of 14 days has a great effect on the deterioration of the concrete to freezing and thawing. It is still arguable for the testing age of concrete is suitable and the discrepancy to the real filed conditions because of ignoring the drying of concrete before exposing to freezing and thawing [36]. In this study, the rapid freeze-thaw experiments on thermally-enhanced concrete for all mixtures were performed after 14 days in water prior to testing in accordance with Procedure A of ASTM C666 [35] in which the specimens were periodically frozen and thawed in water at the specified cycle per day. All freeze-thaw cycling tests were performed at six cycles per day, up to 300 cycles, and the freeze-thaw resistance of specimens was evaluated by the changes in the relative dynamic modulus at every 30 cycles until its value dropped below 60% of the initial value.

3. Results and Discussion

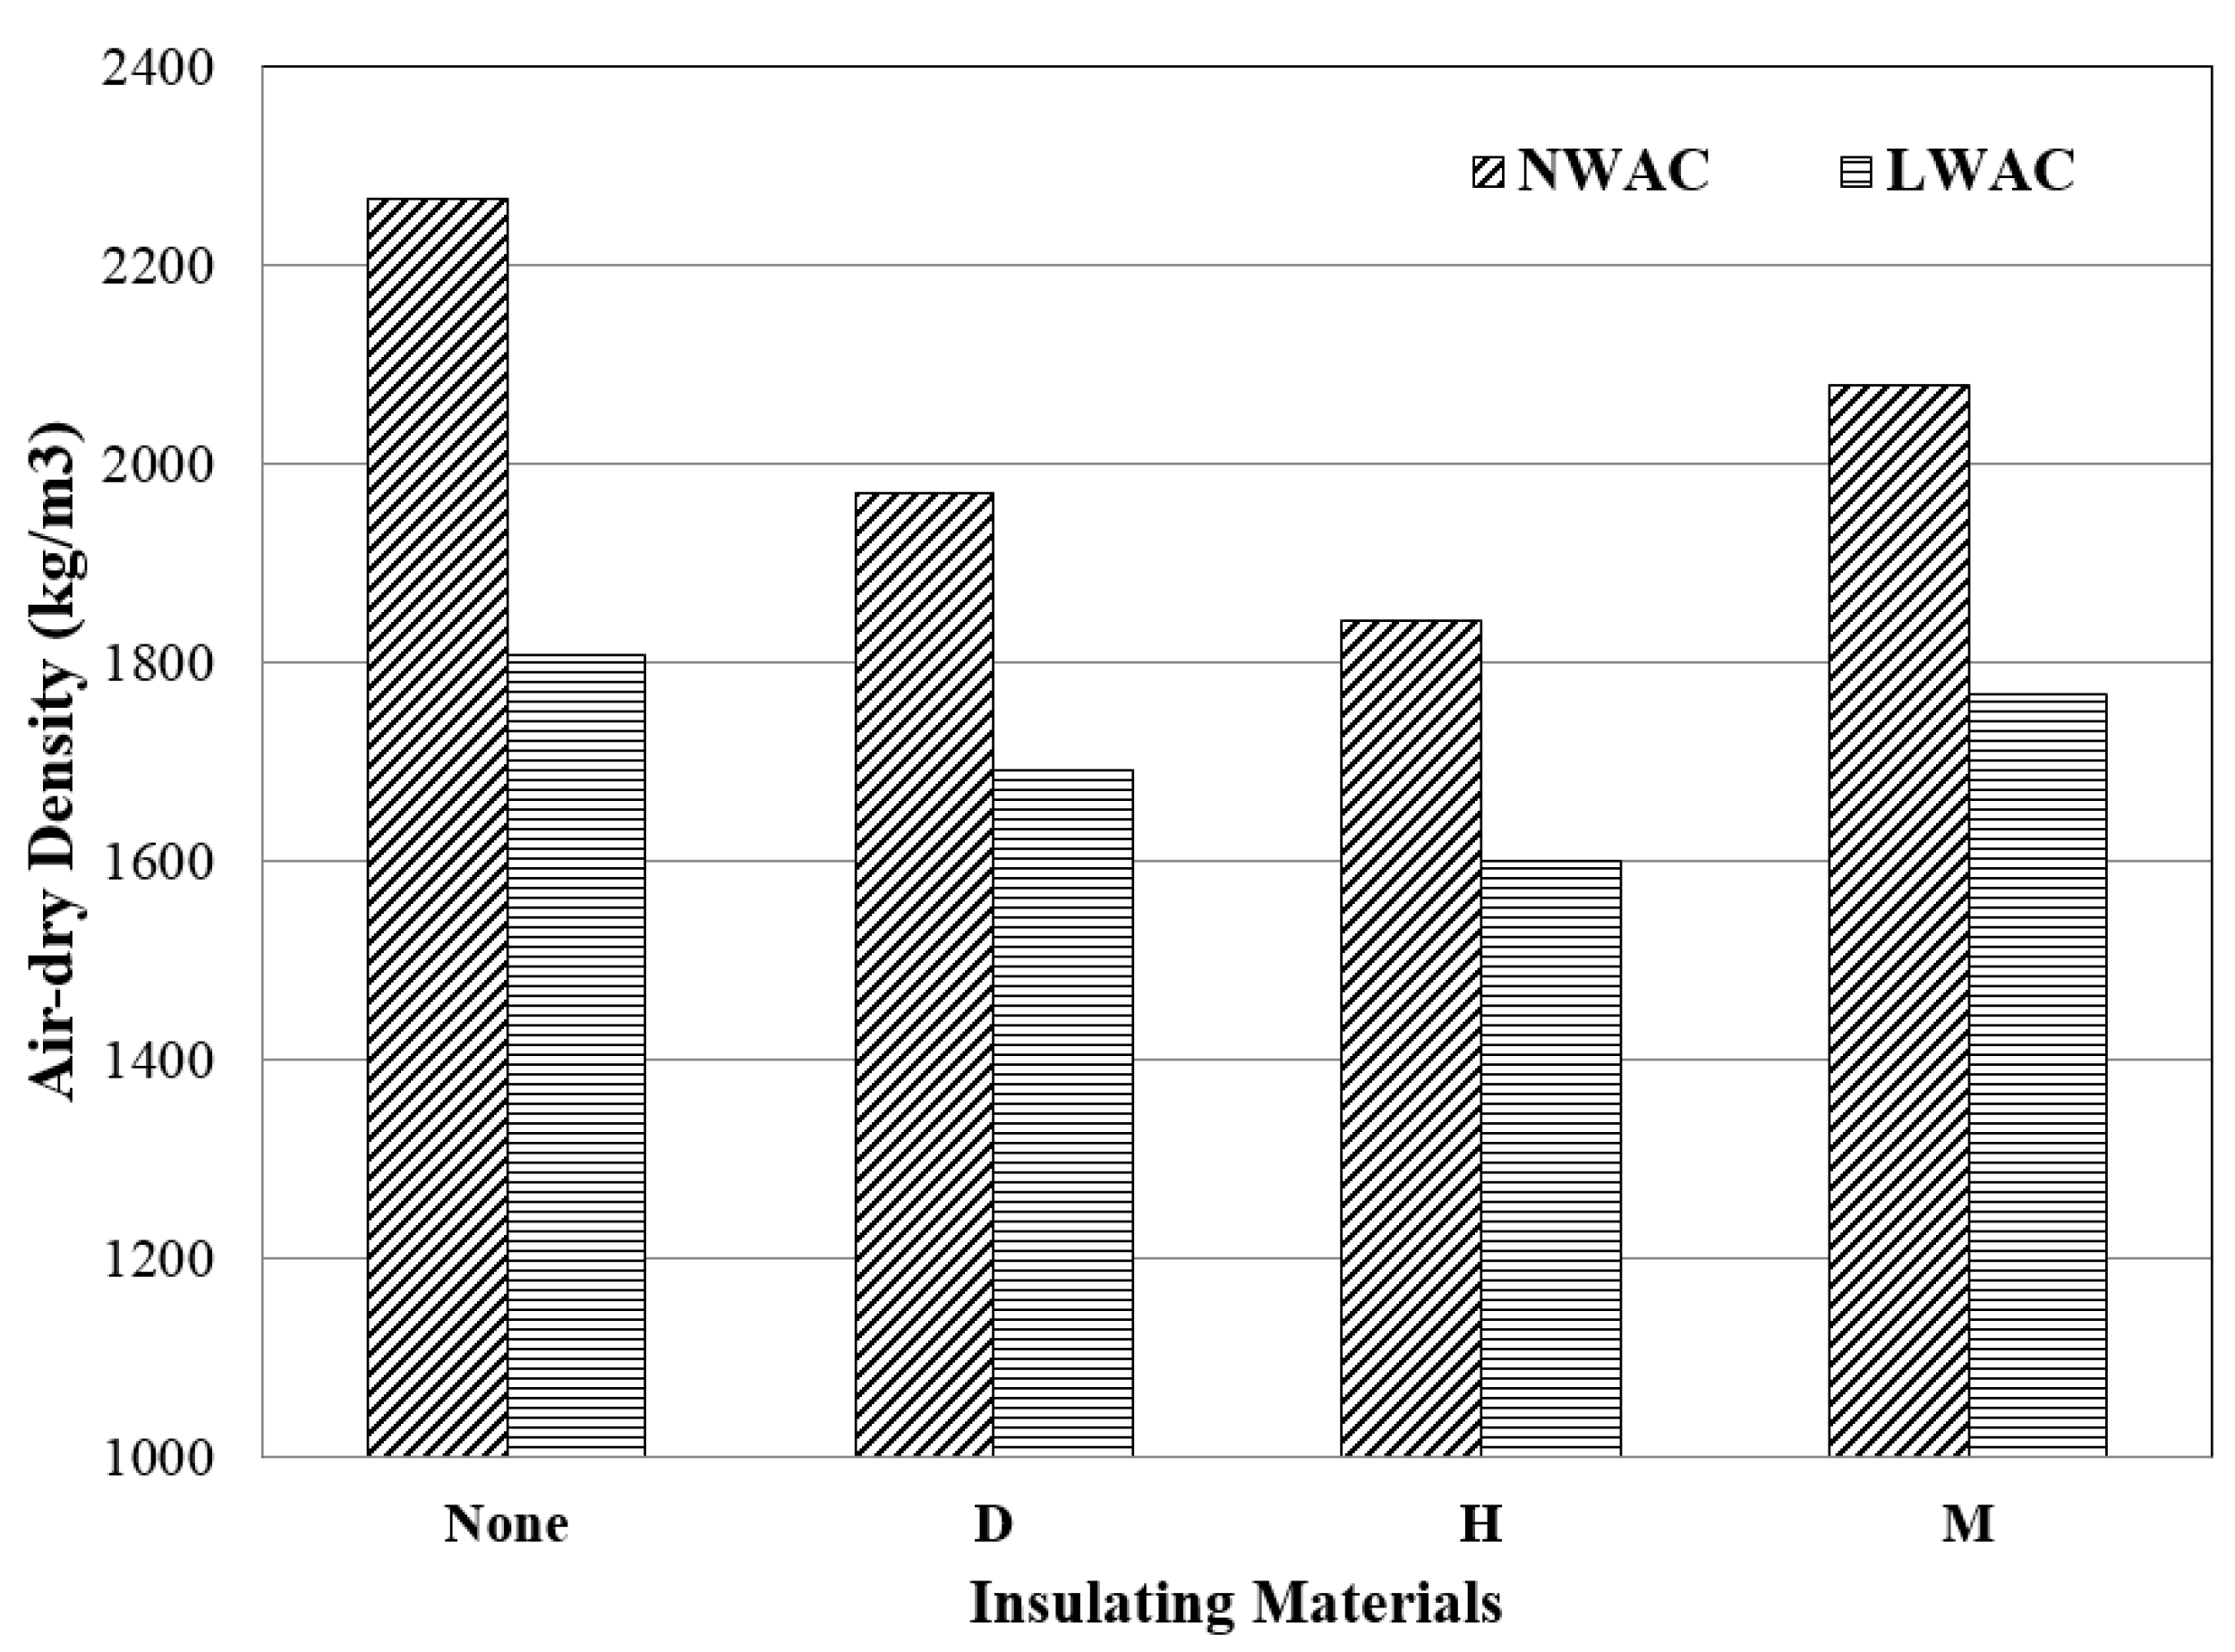
3.1. Physical Properties

The air content of fresh concrete, the air-dry density at 28 days, and the compressive strength measured at 3, 7, and 28 days of hardened concrete are reported in Table 6. The measured air content ranges from 4.3 to 10.0%. NM and LM specimens with micro-form agent showed the highest air content of 10% for both normalweight aggregate (NWA) and lightweight aggregate (LWA). In the case of the air-dry density, NH and LH specimens showed the lowest value of 1843 and 1599 kg/m3, respectively, due to the large volume replacement with hollow-micro spheres (see Figure 3). Thus, by using hollow-micro spheres, air-dry densities were reduced up to 19% and 11% for NH and LH compared to NM and LM, respectively. In addition, ND and NM specimens reduced by 13% and 8%, respectively, compared to the NN specimen. The air-dry density of all LWAC specimens was decreased by an average of 15% compared to NWAC specimens.
The compressive strengths measured at the curing age of 28 days are compared in Figure 4. A decrease in strength by adding the insulating materials was clearly demonstrated regardless of the coarse aggregate types. However, the strength difference between NWAC and LWAC was very slight since the crushed strength of LWA itself was relatively higher [37]. Conversely, the strength of specimens NH and LH (with hollow micro-spheres) failed to reach the designed compressive strength of 24 MPa and recorded the lowest compressive strength, as expected from the density results. One of the interesting points is the low strength of ND and LD specimens, where diatomite powder is used as a replacement of the aggregates. Even if diatomite powder is a natural pozzolan, the compressive strength of ND and LD reached lower strength comparing to reference specimens of NN and LN by more than 31%. This means that there is a negligible pozzolanic reaction of diatomite powder and the influence on the strength is small when diatomite powder is used as a replacement of the aggregate. In the case of specimens NM and LM (with the micro-foam agent), it was expected to have a large strength reduction due to their foams within the concrete if the same water-to-cement ratio (W/C) of 0.55 with other specimens is applied. Thus, to achieve the design strength, W/C of NM and LM were set as 0.3 and the target compressive strength can be obtained. Thus, if W/C is reduced for NH and LH, the designed compressive strength may be achieved. Finally, it is known that the trend of the air-dry density and compressive strength is quite similar each other.

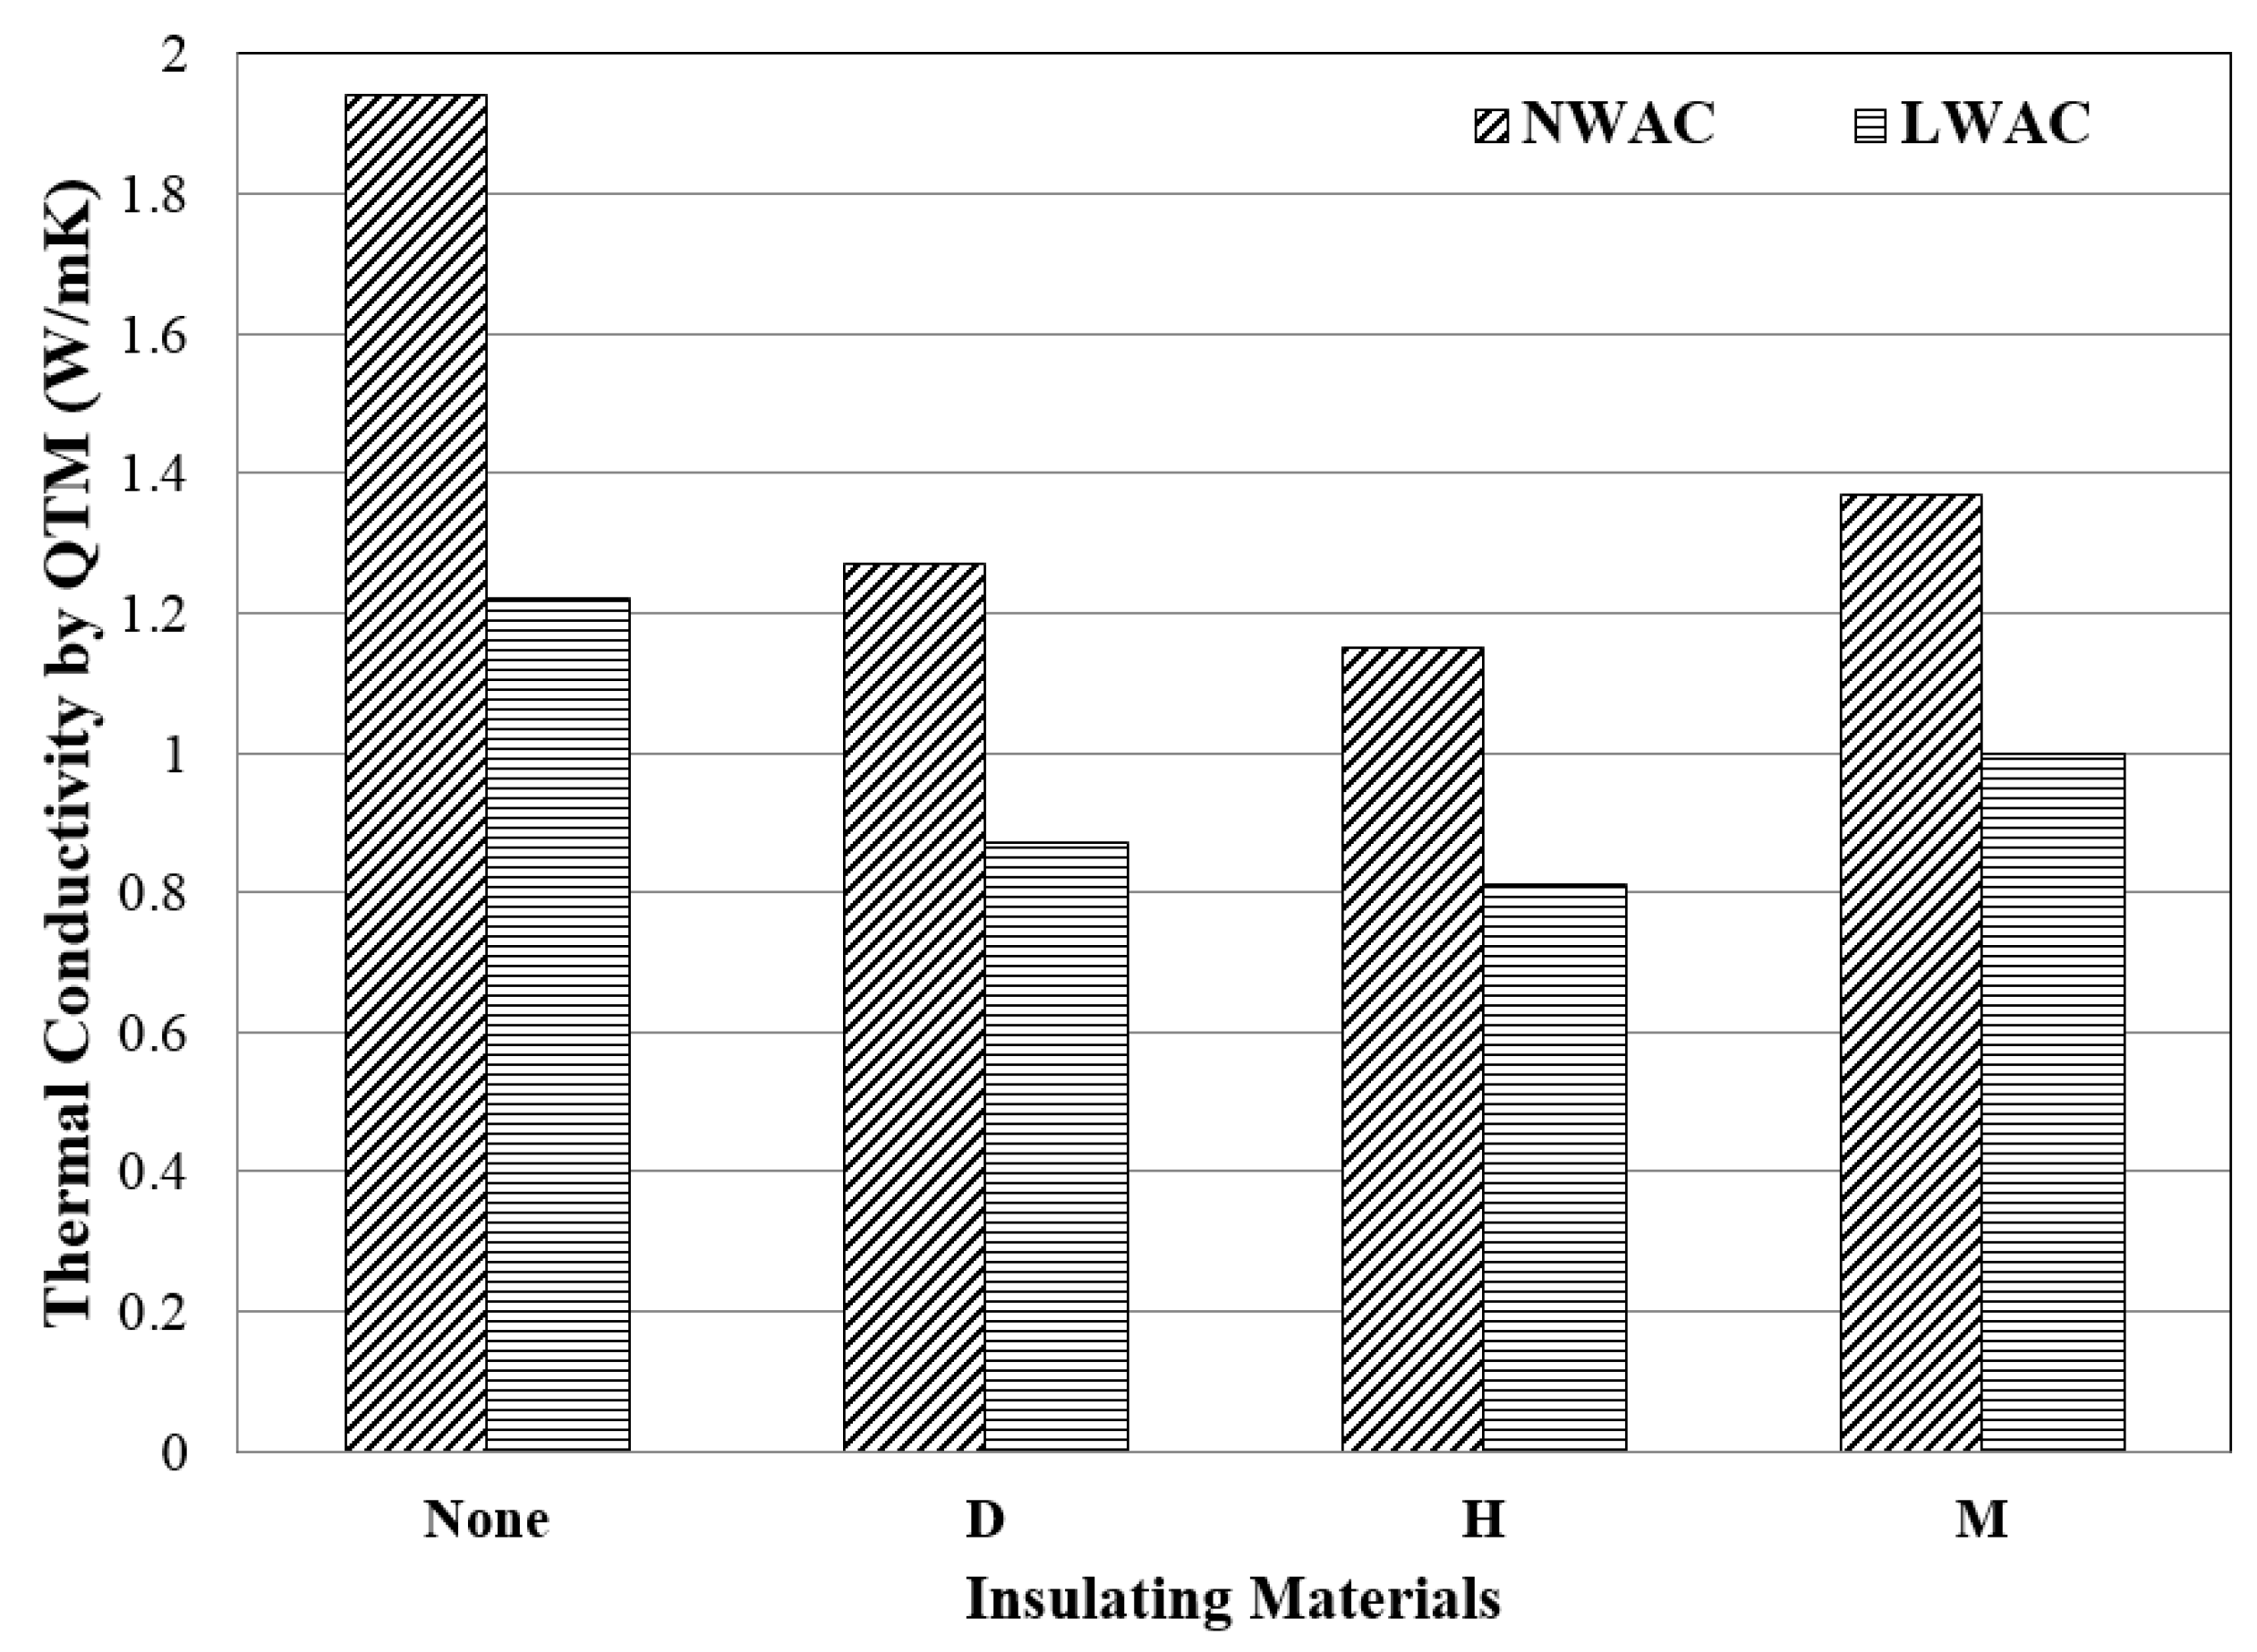
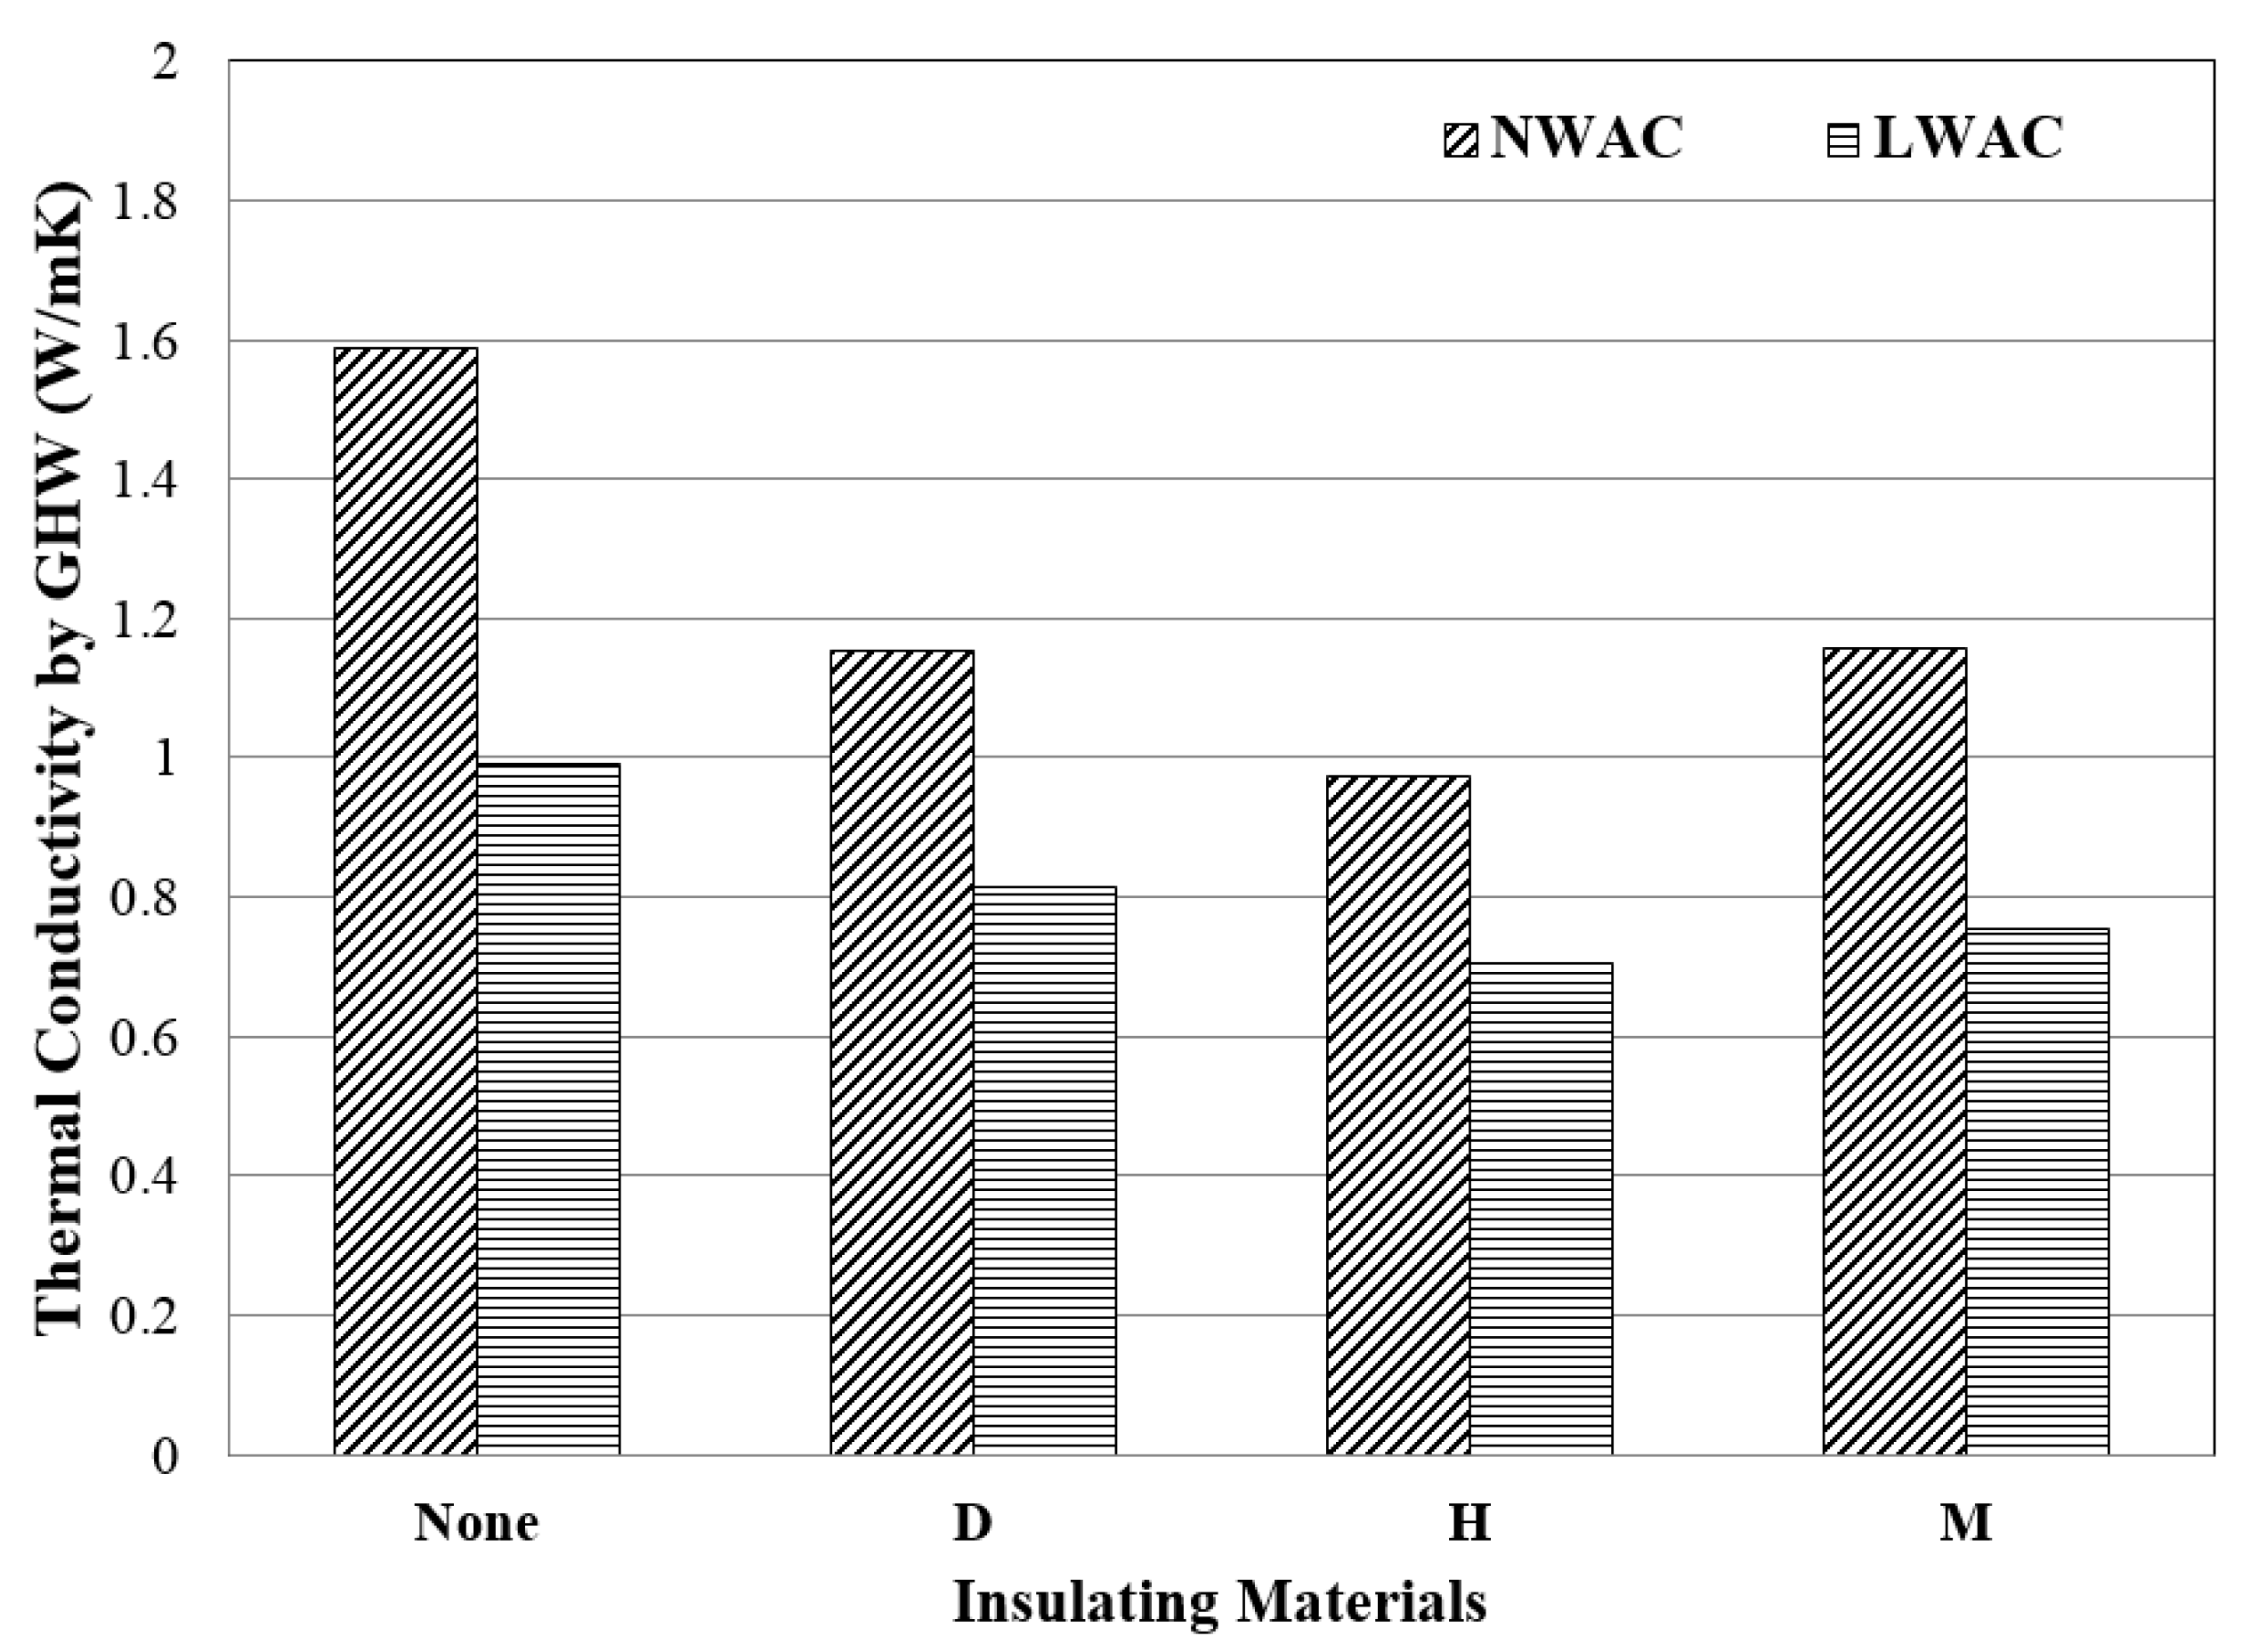
3.2. Thermal Conductivity

The thermal conductivity measured by a quick thermal conductivity meter (QTM), depicted in Figure 5 and Table 7, tended to be proportional to the corresponding air-dry density in Figure 3. Specimen NN, having a normalweight aggregate concrete without the insulating materials, showed the thermal conductivity of 1.94 W/m·K, while the LN specimen, having lightweight aggregate concrete without the insulating materials, showed a thermal conductivity of 1.22 W/m·K. The thermal conductivity values of all specimens decreased by adding the insulating materials, as shown in Figure 5. Specimens ND, NH, and NM had thermal conductivities of 1.25 W/m·K, 1.15 W/m·K, and 1.37 W/m·K, respectively. Compared with the thermal conductivity value for NN (1.94 W/m·K), the insulation materials contributed to reducing the thermal conductivity by an average of 34%. For LWAC, LD, LH, and LM specimens had thermal conductivities of 0.87 W/m·K, 0.81 W/m·K, and 1.0 W/m·K, respectively. For both NWAC and LWAC, it can be seen that the effect of hollow micro-spheres (H) on the reduction of the thermal conductivity is better than others, such as diatomite (D) and micro-foam agent (M). Hollow micro-spheres lowered the thermal conductivity by 18% with lightweight aggregates and 29% with normalweight aggregates compared to the reference results. The average thermal conductivity decrease in specimens with NWA and LWA were 34% and 27%, respectively.
Test results by using the guarded hot wire method (GHW), shown in Figure 6 and Table 7, dropped by 9–36% compared with those by QTM. This might be attributed to the evaporation of pore water in the concrete, which increases the vacant pores and reduces the thermal conductivity, since specimens were thoroughly oven-dried to eliminate the moisture content and residual water in concrete. This showed that the accuracy of QTM depended on the water contents and residual water in the pores of concrete as QTM was generally used at ambient conditions without drying the specimens [24]. The differences between QTM and GHW of NN and LN (specimens without insulation materials) was approximately 18% for both. However, the differences for ND and LD (specimens with diatomite powder) were 9% and 6%, respectively, which did not vary significantly since they had insufficient water-filled pores in the concrete. Conversely, specimens with micro-foam agent (M) and hollow micro-spheres (H) experienced considerable reductions by 13–36% due to the higher water-filled pores in the concrete.
NH and LH (specimens with hollow micro-spheres) had the lowest thermal conductivities of 0.97 and 0.70 W/m·K, respectively. This showed the same trends as QTM since they had the lowest density values. The testing results by GHW varied by 0.85 W/m·K–1.59 W/m·K in NWAC, and by 0.70 W/m·K–0.99 W/m·K in LWAC.
The average thermal conductivity reduction ratios from QTM were 35% and 27% for NWAC and LWAC, respectively, by adding insulation materials. These values are similar with those from GHW. From GHW, the thermal conductivity reduction ratios were 31% and 23% for NWAC and LWAC, respectively. This result indicates that the insulation materials have the same reduction effects on thermal conductivity reduction regardless of the aggregate types, and the insulation materials used in this study can be applicable to enhance thermal performance for both NWAC and LWAC.
Taken as a whole, it can be found that the trend of the air-dry density is similar with that of the thermal conductivity. Additionally, thermal conductivities measured by QTM and GHW had similar trends. However, the thermal conductivities measured by GHW showed somewhat lower values than QTM. This is because QTM uses the specimens without the drying process, while the specimens are thoroughly dried for GHW. Thus, the evaporation of the pore water in the concrete affects the thermal conductivity.

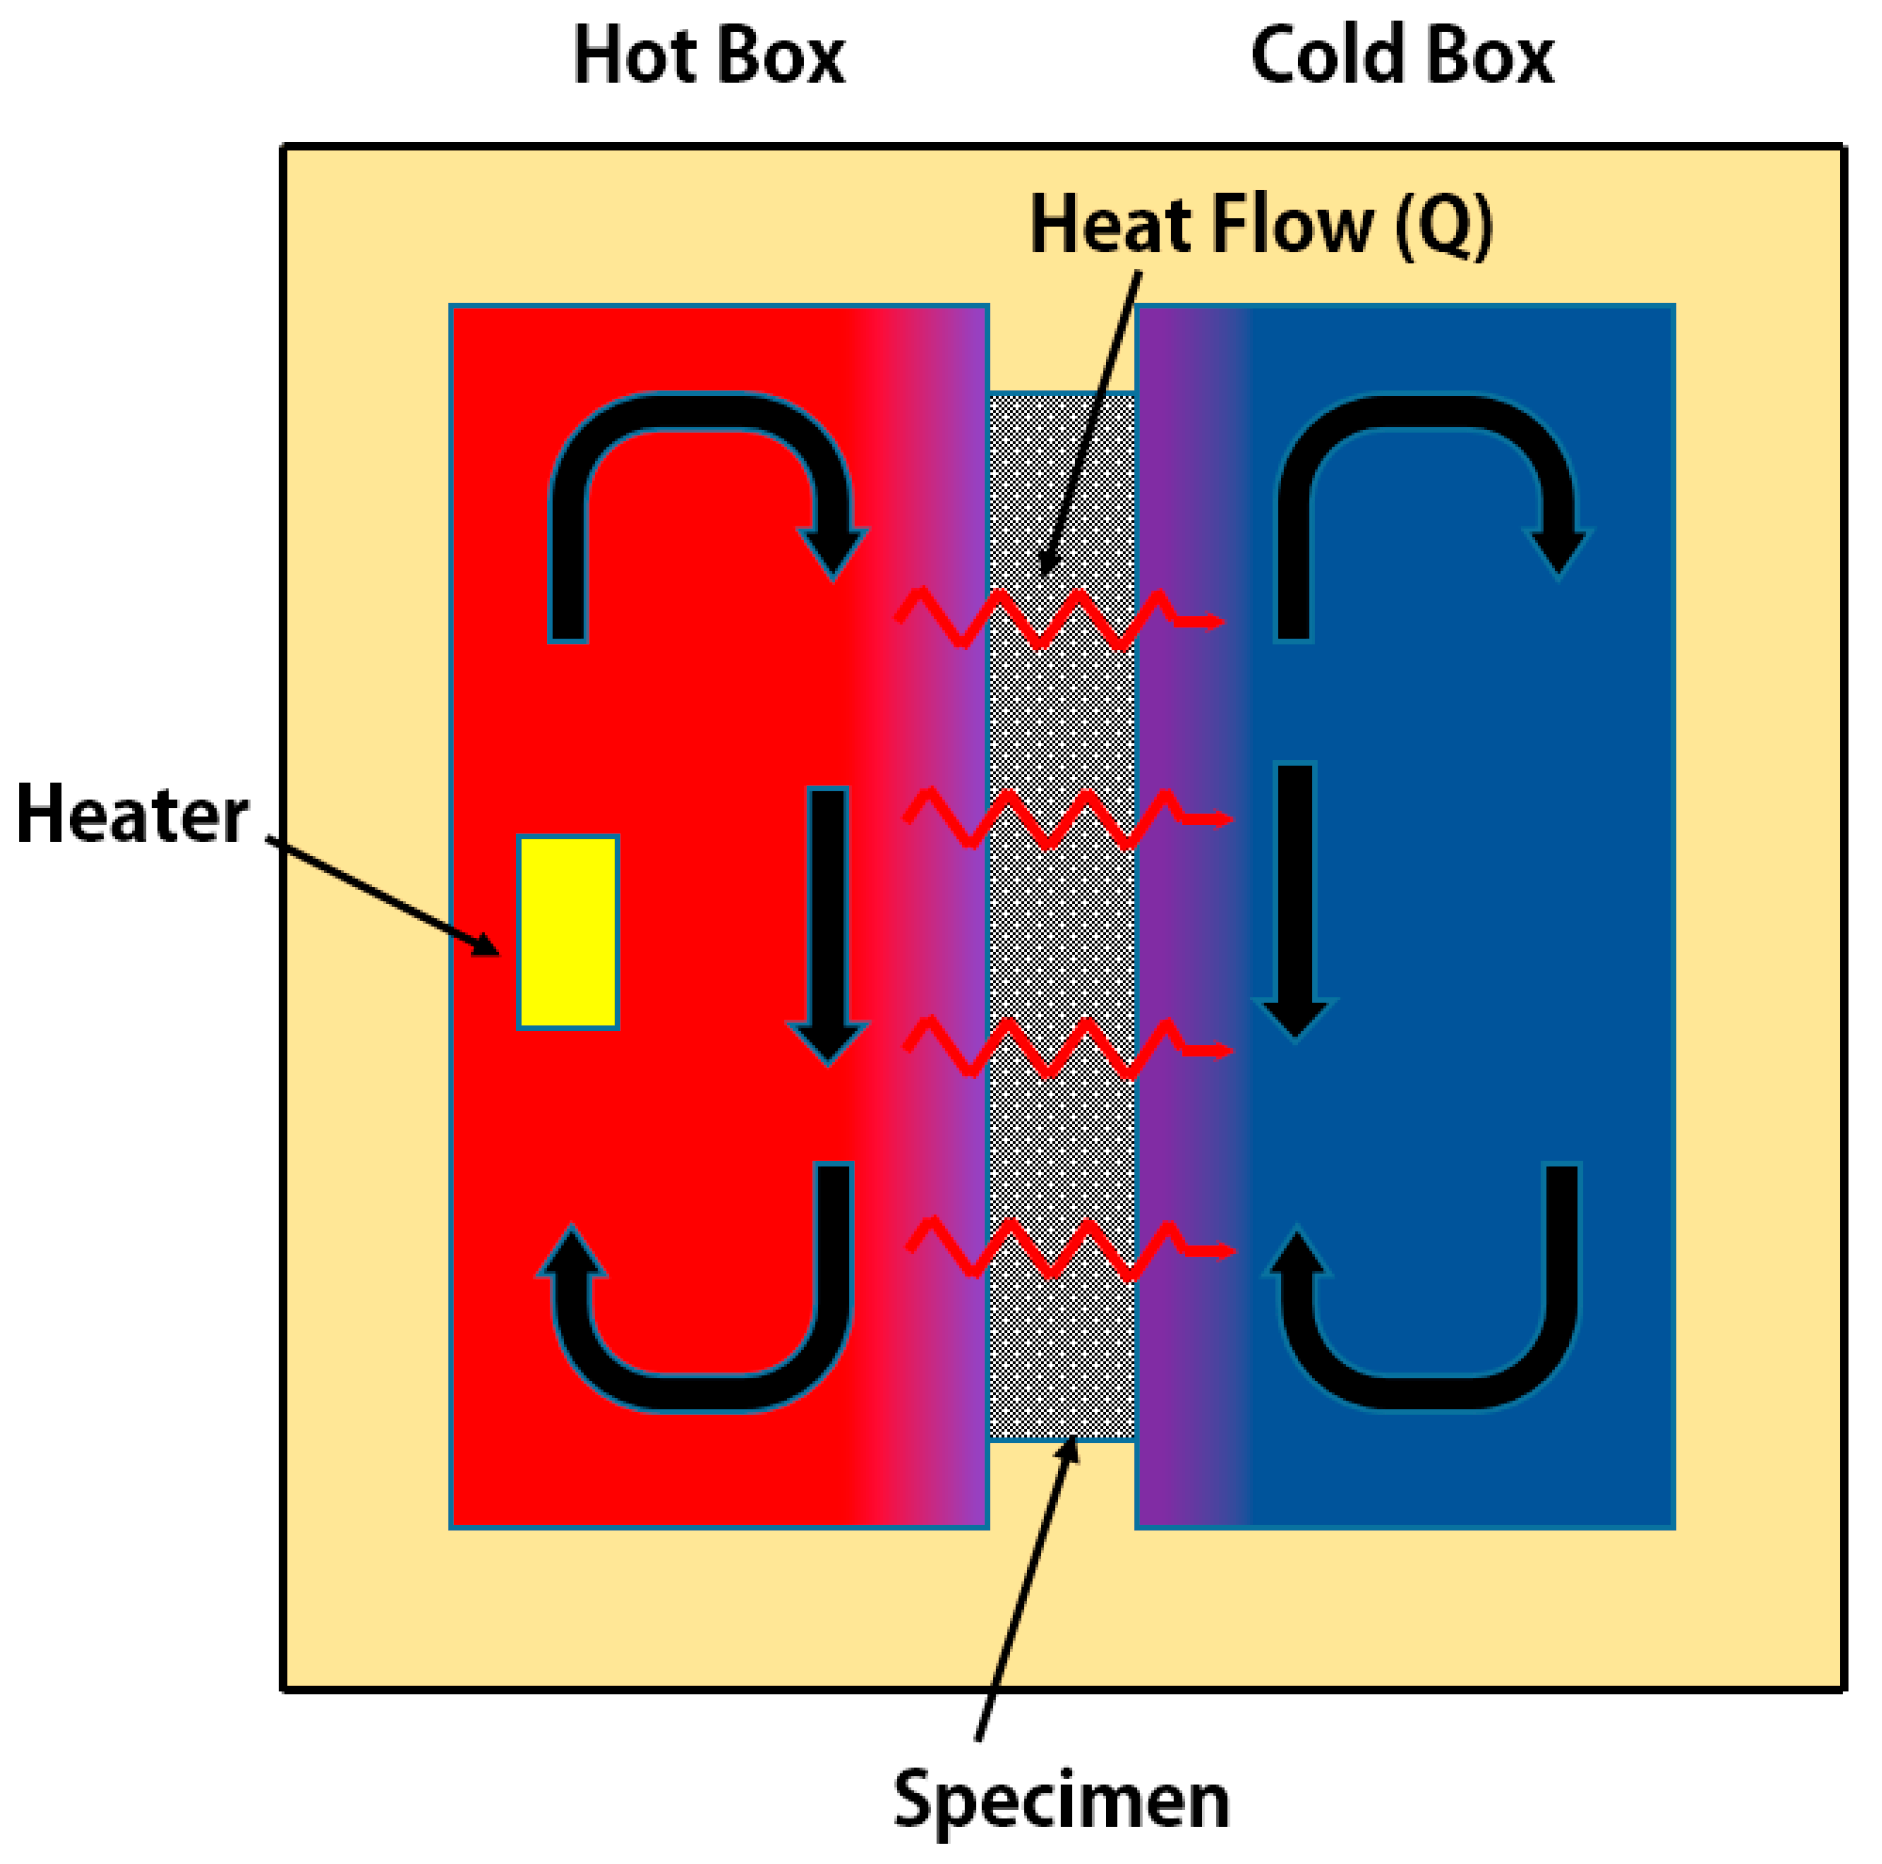
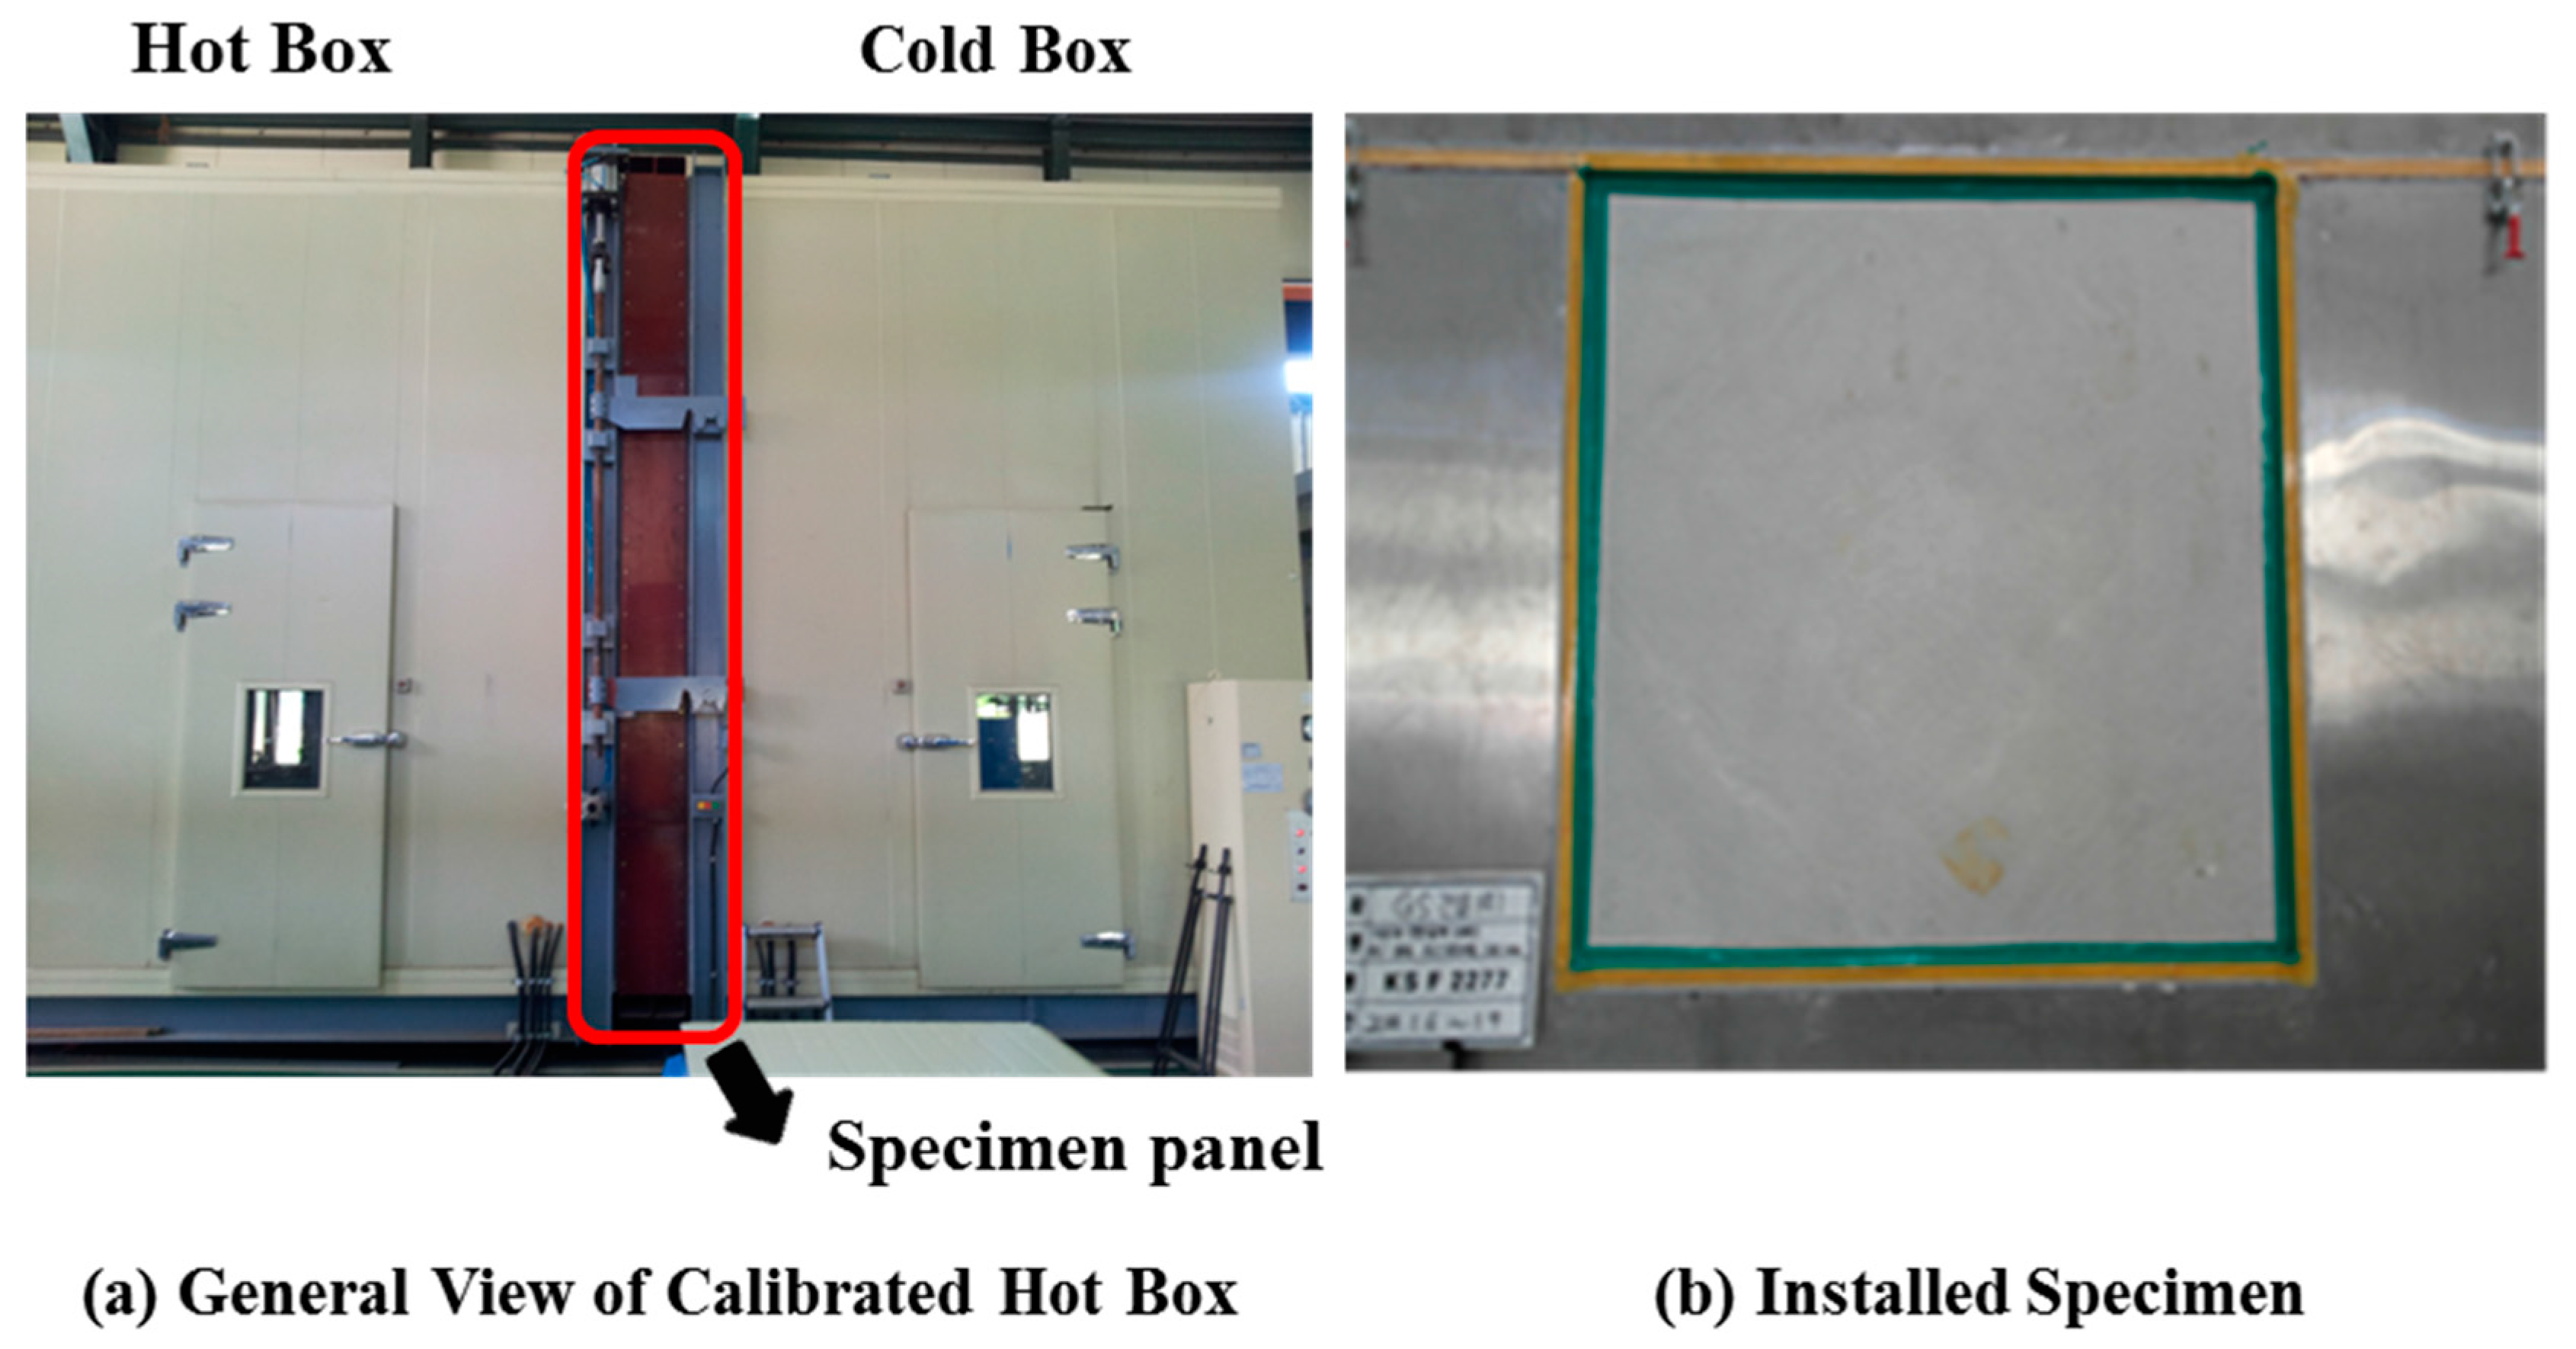
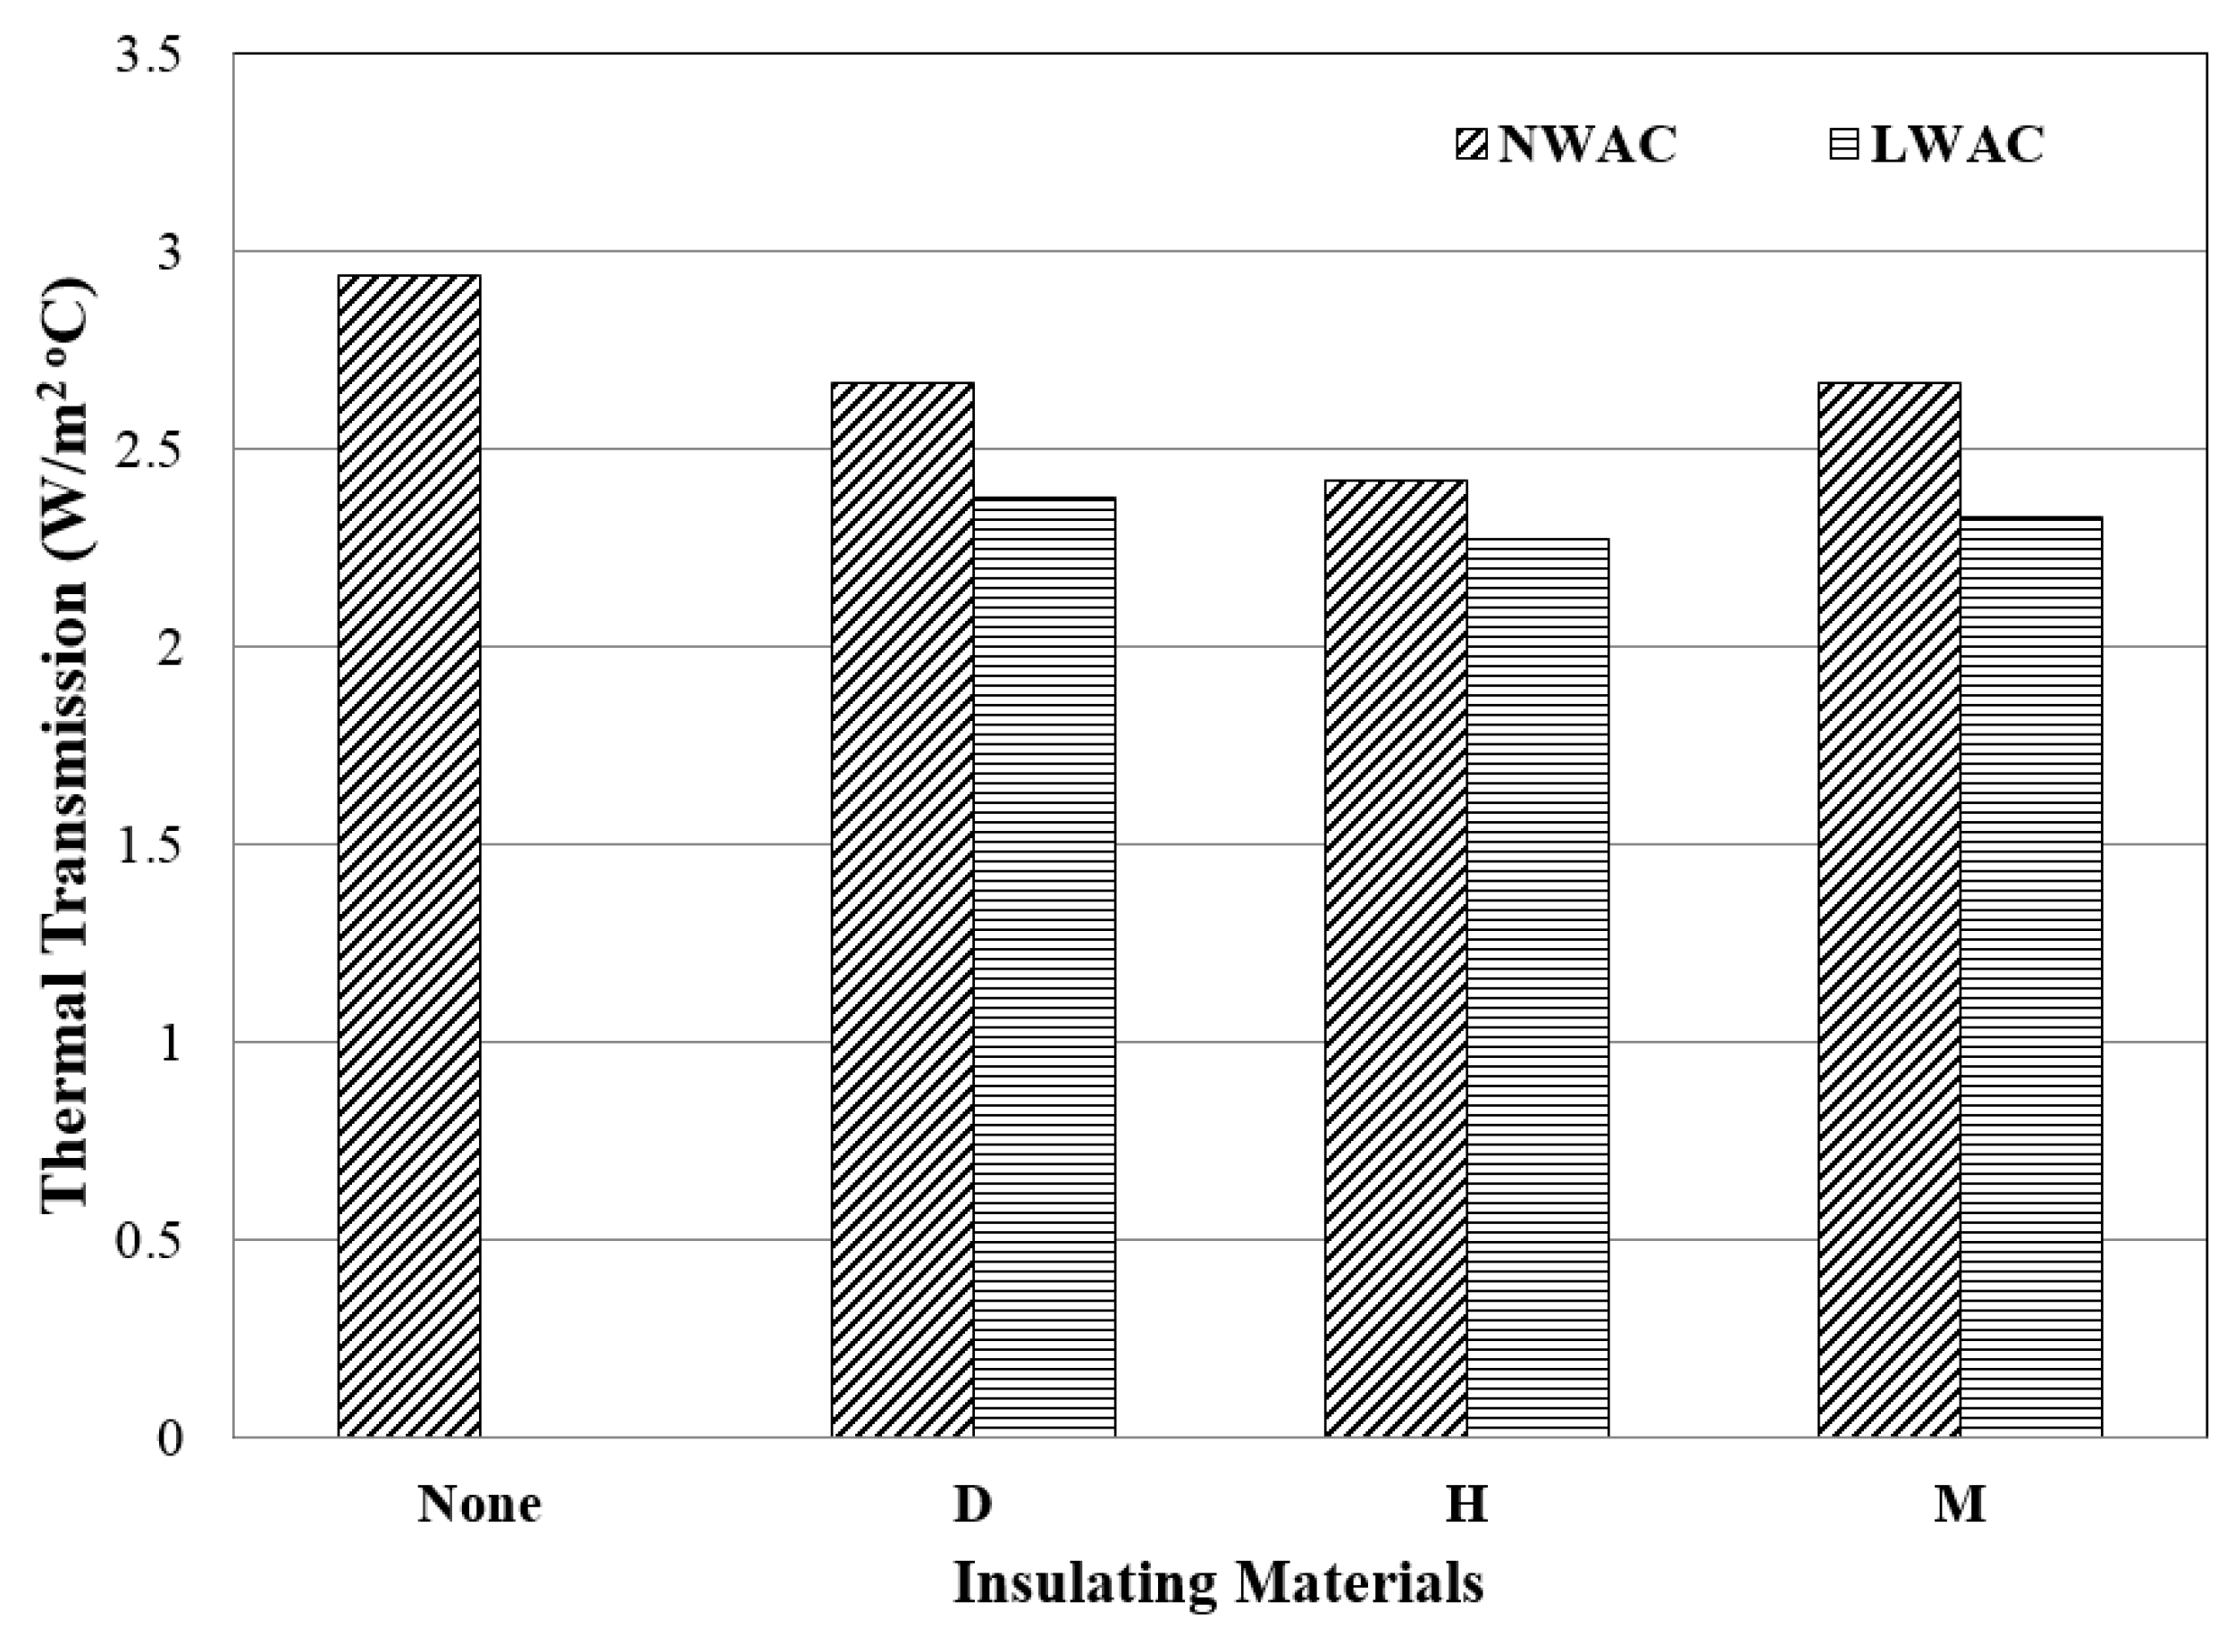
3.3. Thermal Transmission

Figure 7 and Table 7 show the thermal transmission measured by a calibrated hot box (CHB) according to ASTM C1363 and ISO 8990. NN (the specimen without the insulating materials) had a thermal transmission of 2.94 W/m2·°C. The values of other specimens with NWAC tended to decrease with the use of insulating materials. However, the reduction of the thermal transmission was not remarkable compared with the thermal conductivity reduction measured by QTM and GHW. For example, the average thermal transmission reduction ratio for NWAC by CHB was about 12%. From QTM and GHW, the average thermal conductivity reduction ratios were 35% and 31%, respectively. This is attributed to the difference in heat transfer conditions. QTM and GHW are related to the conductivity, relying on direct contact, while CHB is the thermal performance testing of the convection transferring from hot places to cold places using continuous circulation. For LWAC, their thermal transmissions varied from 2.27 to 2.38 W/m2·°C. As expected, specimens adding hollow micro-spheres had the lowest values of 2.42 and 2.27 W/m2·°C for NWAC and LWAC, respectively.
The trend of thermal transmission is similar with air-dry density of the thermally-enhanced concrete. Additionally, its trend is similar with the results from QTM and GHW. The reduction ratios are lower than that from QTM and GHW. Insulation materials used in this study still show their ability for enhancing the thermal performance of the concrete. In real heat transfer in buildings or houses, convection or radiation occurs and thermal transmission can offer a good measure for energy efficiency, while thermal conductivity measured from QTM and GHW only consider conduction.

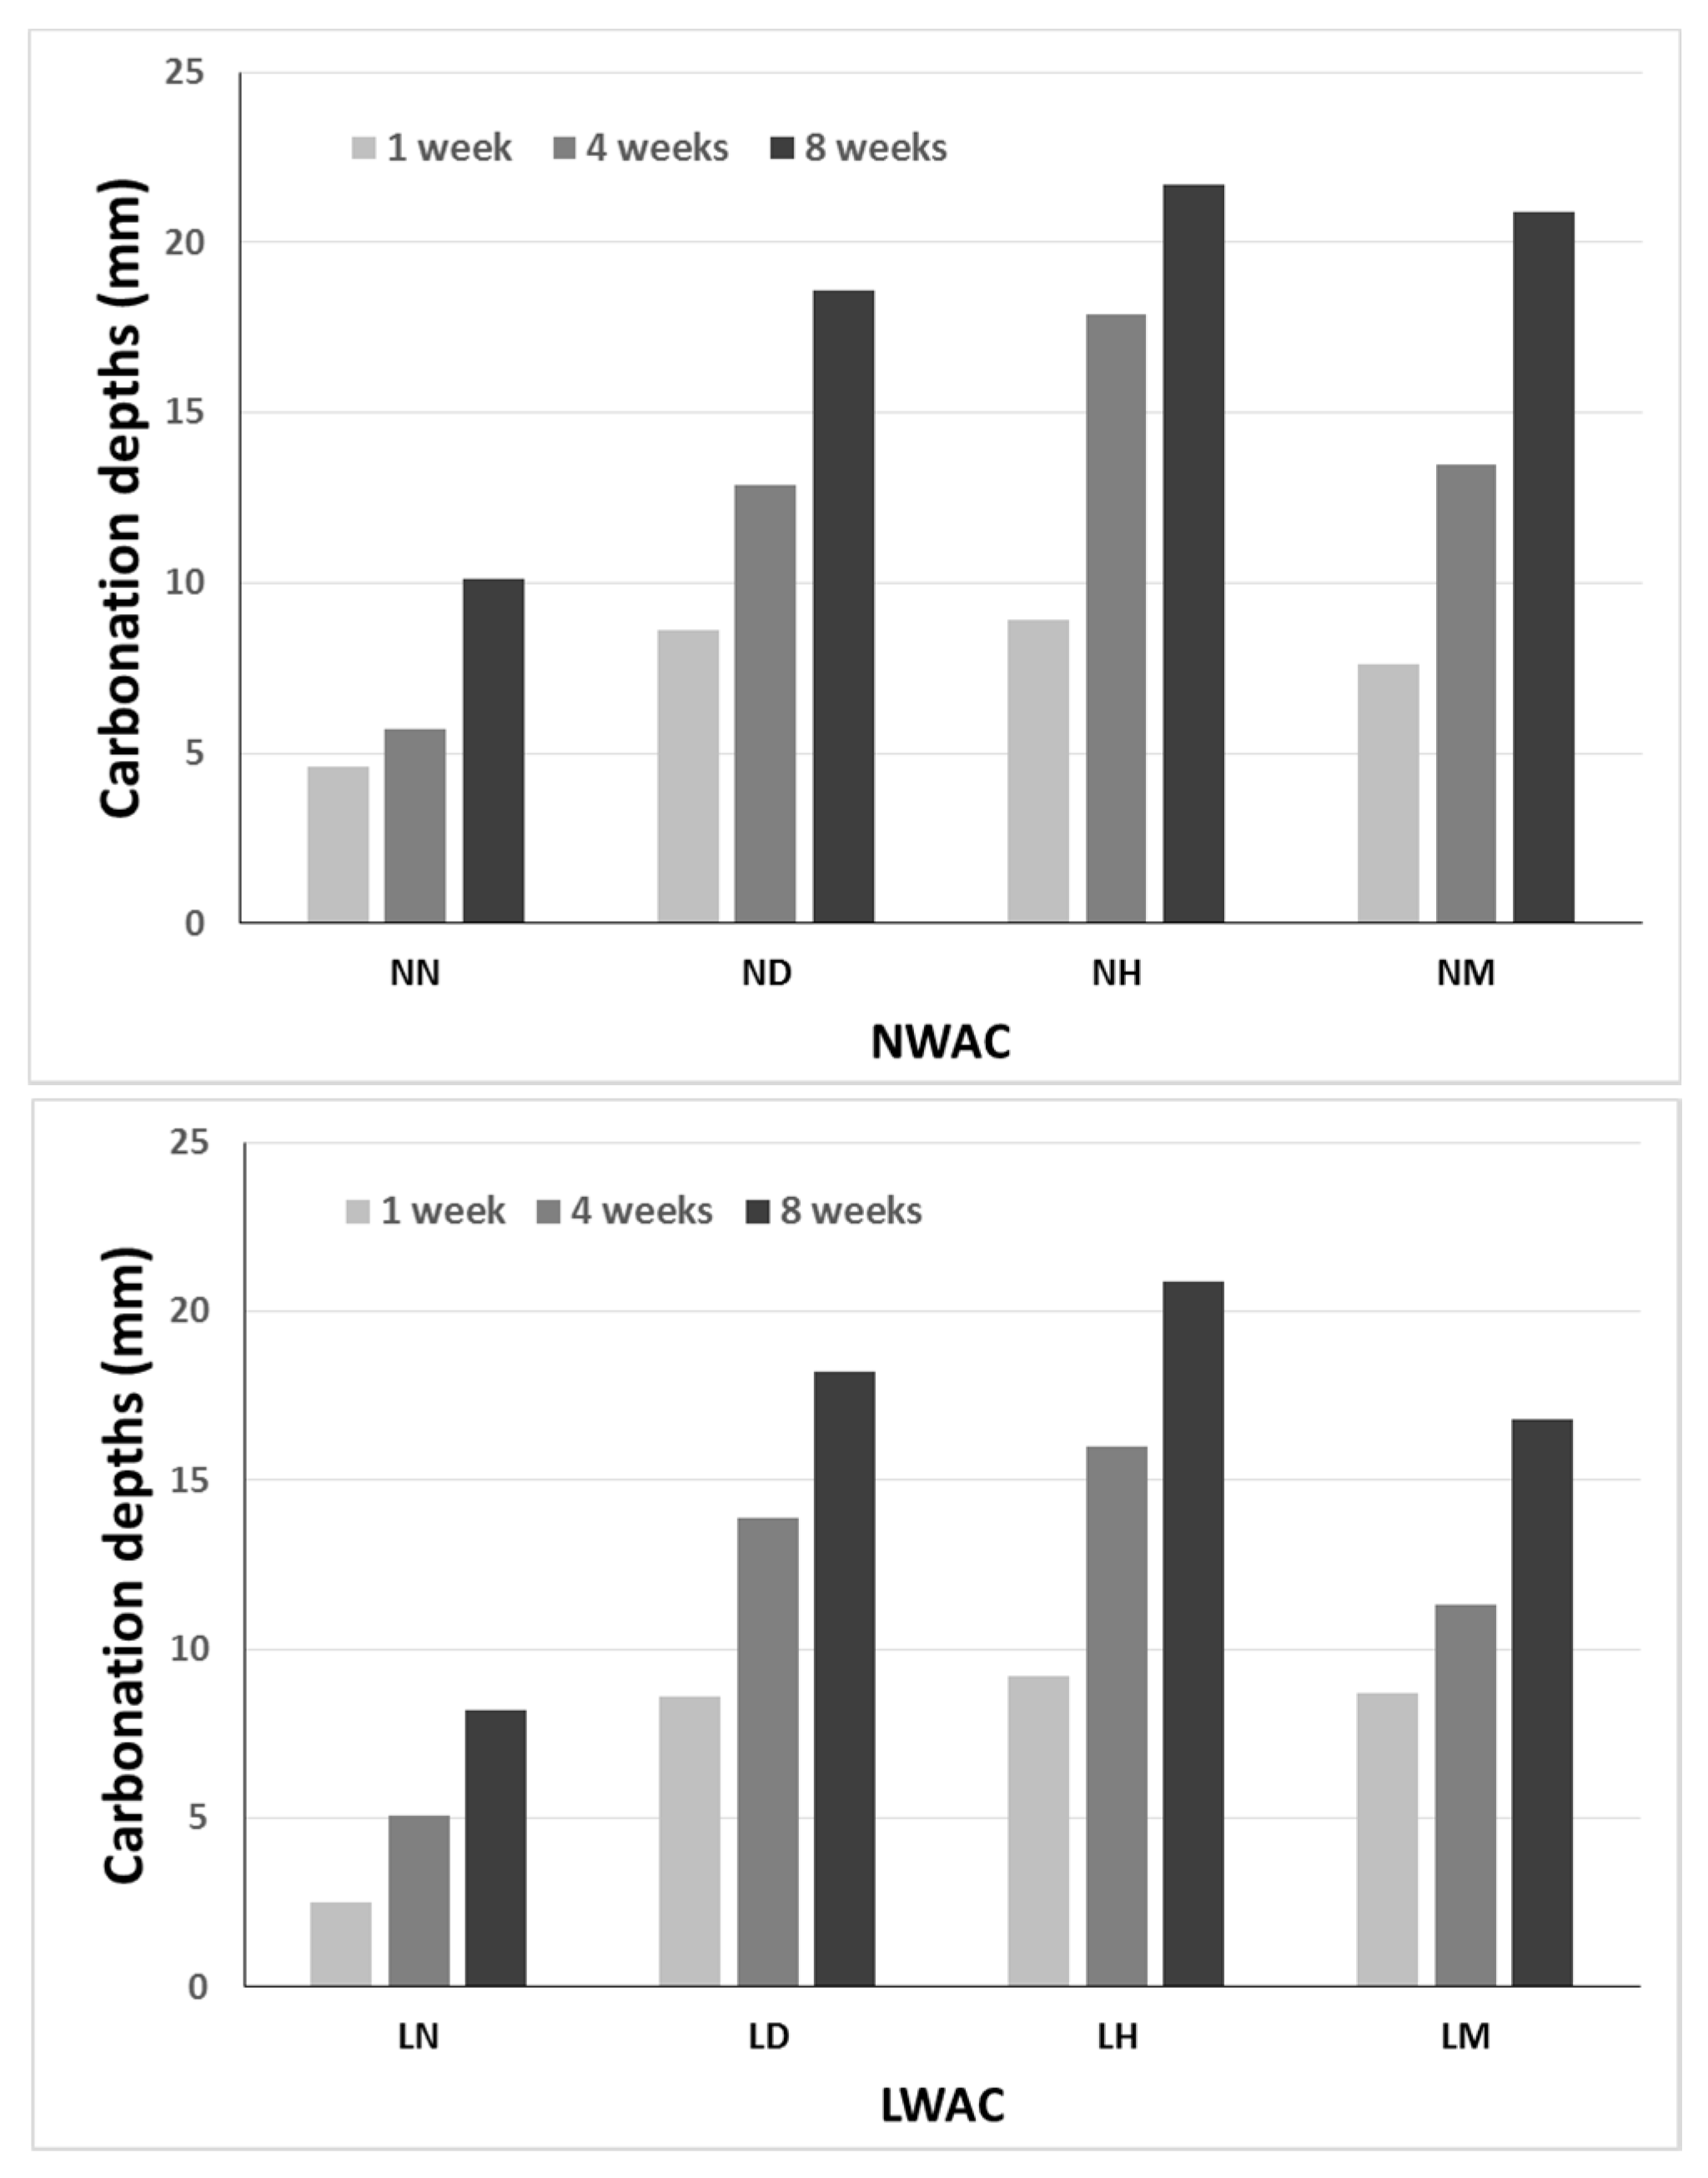
3.4. Resistance to Carbonation

The average carbonation rates of all specimens measured for eight weeks after casting were summarized in Table 8 and presented in Figure 8. These showed that the carbonation rates of NWAC were similar with those of LWAC, although LWAC was generally known to have higher carbonation rates. However, this mainly depended on the types of lightweight aggregate (LWA) [38]. Since CO2 reactivity is determined by cement microstructures, and permeability influences carbonation depth, some types of LWA having higher water absorption ratios or leading to pozzolanic reactions by sintering can increase the rates. However, the raw material of LWA used in this study is slate and it has a low water absorption ratio (below 6%) and no pozzolanic reaction. Thus, carbonation depths of LWAC were similar to NWAC.
Carbonation rates of NWAC and LWAC were almost two times greater when insulation materials were added regardless of aggregate types, the compressive strength class, and density. This is because that added insulation materials result in the higher water-filled pores and permeability (to gas). Thus, thermally-enhanced concretes with insulation materials used in this study are weak to carbonation attack and additional protection methods are needed, such as an increase in the cover depth of the concrete.

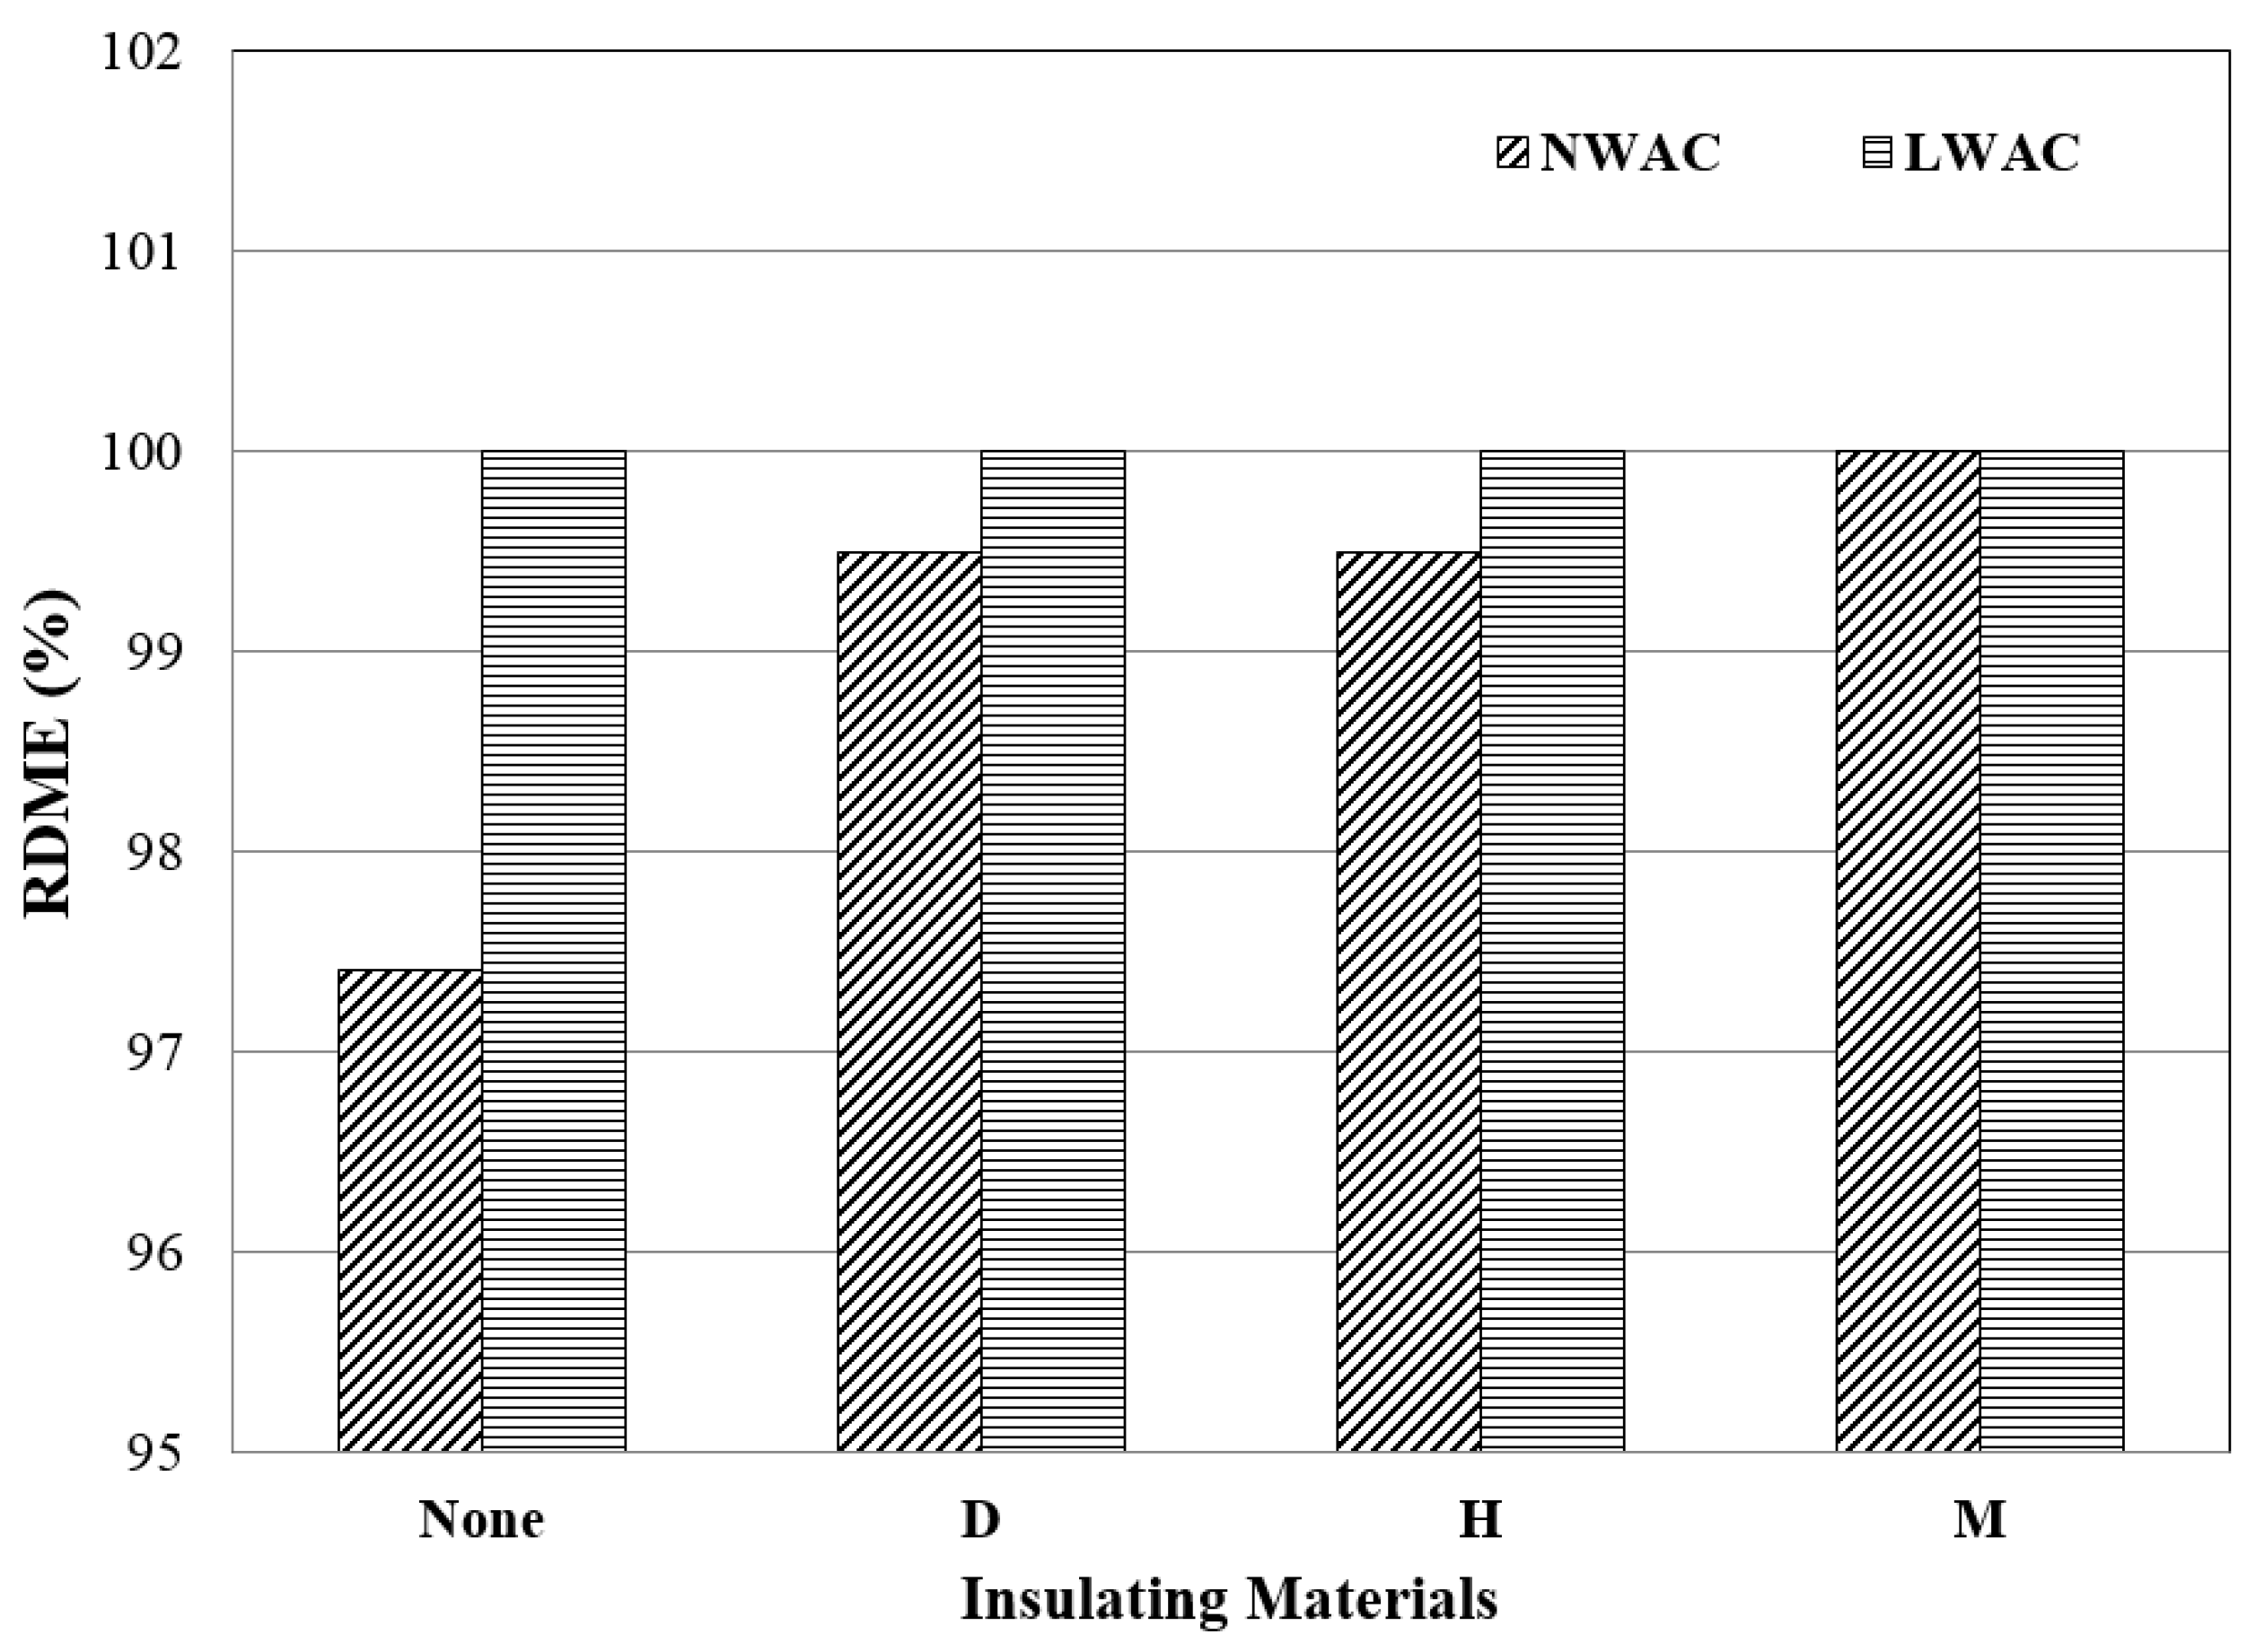
3.5. Resistance to Freeze-Thaw Cycles

The relative dynamic modulus of elasticity (RDME) measured at 300 freeze-thaw cycles is presented in Figure 9. It is clear that all specimens had sufficient freeze-thaw resistance of RDME (more than 97% compared to 0 cycles) regardless of the use of insulating materials. Pop-out or cracks on all specimens were not observed in up to 300 cycles. From the test results, it can be known that all specimens have enough voids to absorb the volume expansion due to the freezing of pore water. Thus, tested specimens showed negligible reductions of RDME. In this study, the minimum air content, except the reference specimen, having no insulating materials was 4.9%. Thus, it is recommended that thermally-enhanced concrete with insulating materials should have at least 5% air content in fresh concrete using an air-entraining agent.

4. Conclusions

In order to increase the energy efficiency of residual sectors, this study presents the structural, thermal, and durability performances of thermally-enhanced concrete by applying various insulation materials. The use of various insulation materials resulted in the reduction of the density, compressive strength, and thermal properties (thermal conductivity and thermal transmission) by increasing the permeability and porosity of the concrete. This led to the rapid ingress of CO2 resulting from accelerated carbonation experiments compared with normal concrete without insulation materials regardless of normalweight and lightweight coarse aggregates. From the experimental observations, the following conclusions were made:
(1)
The effect of diatomite powder, hollow micro-spheres, and a micro-foam agent on thermal insulation and durability of concrete was proved. Diatomite powder failed to increase the strength due to its poor pozzolanic reaction than expected. In the case of the micro-foam agent, a higher cement content and a lower water-to-cement ratio should be applied to compensate for the strength.
(2)
For both normalweight aggregate concrete (NWAC) and lightweight aggregate concrete (LWAC), the concretes with the thermal insulating materials showed superior thermal insulation. The thermal conductivity measured from GHW was somewhat lower than that from QTM due to oven-drying the pore water and an increase in vacant pores.
(3)
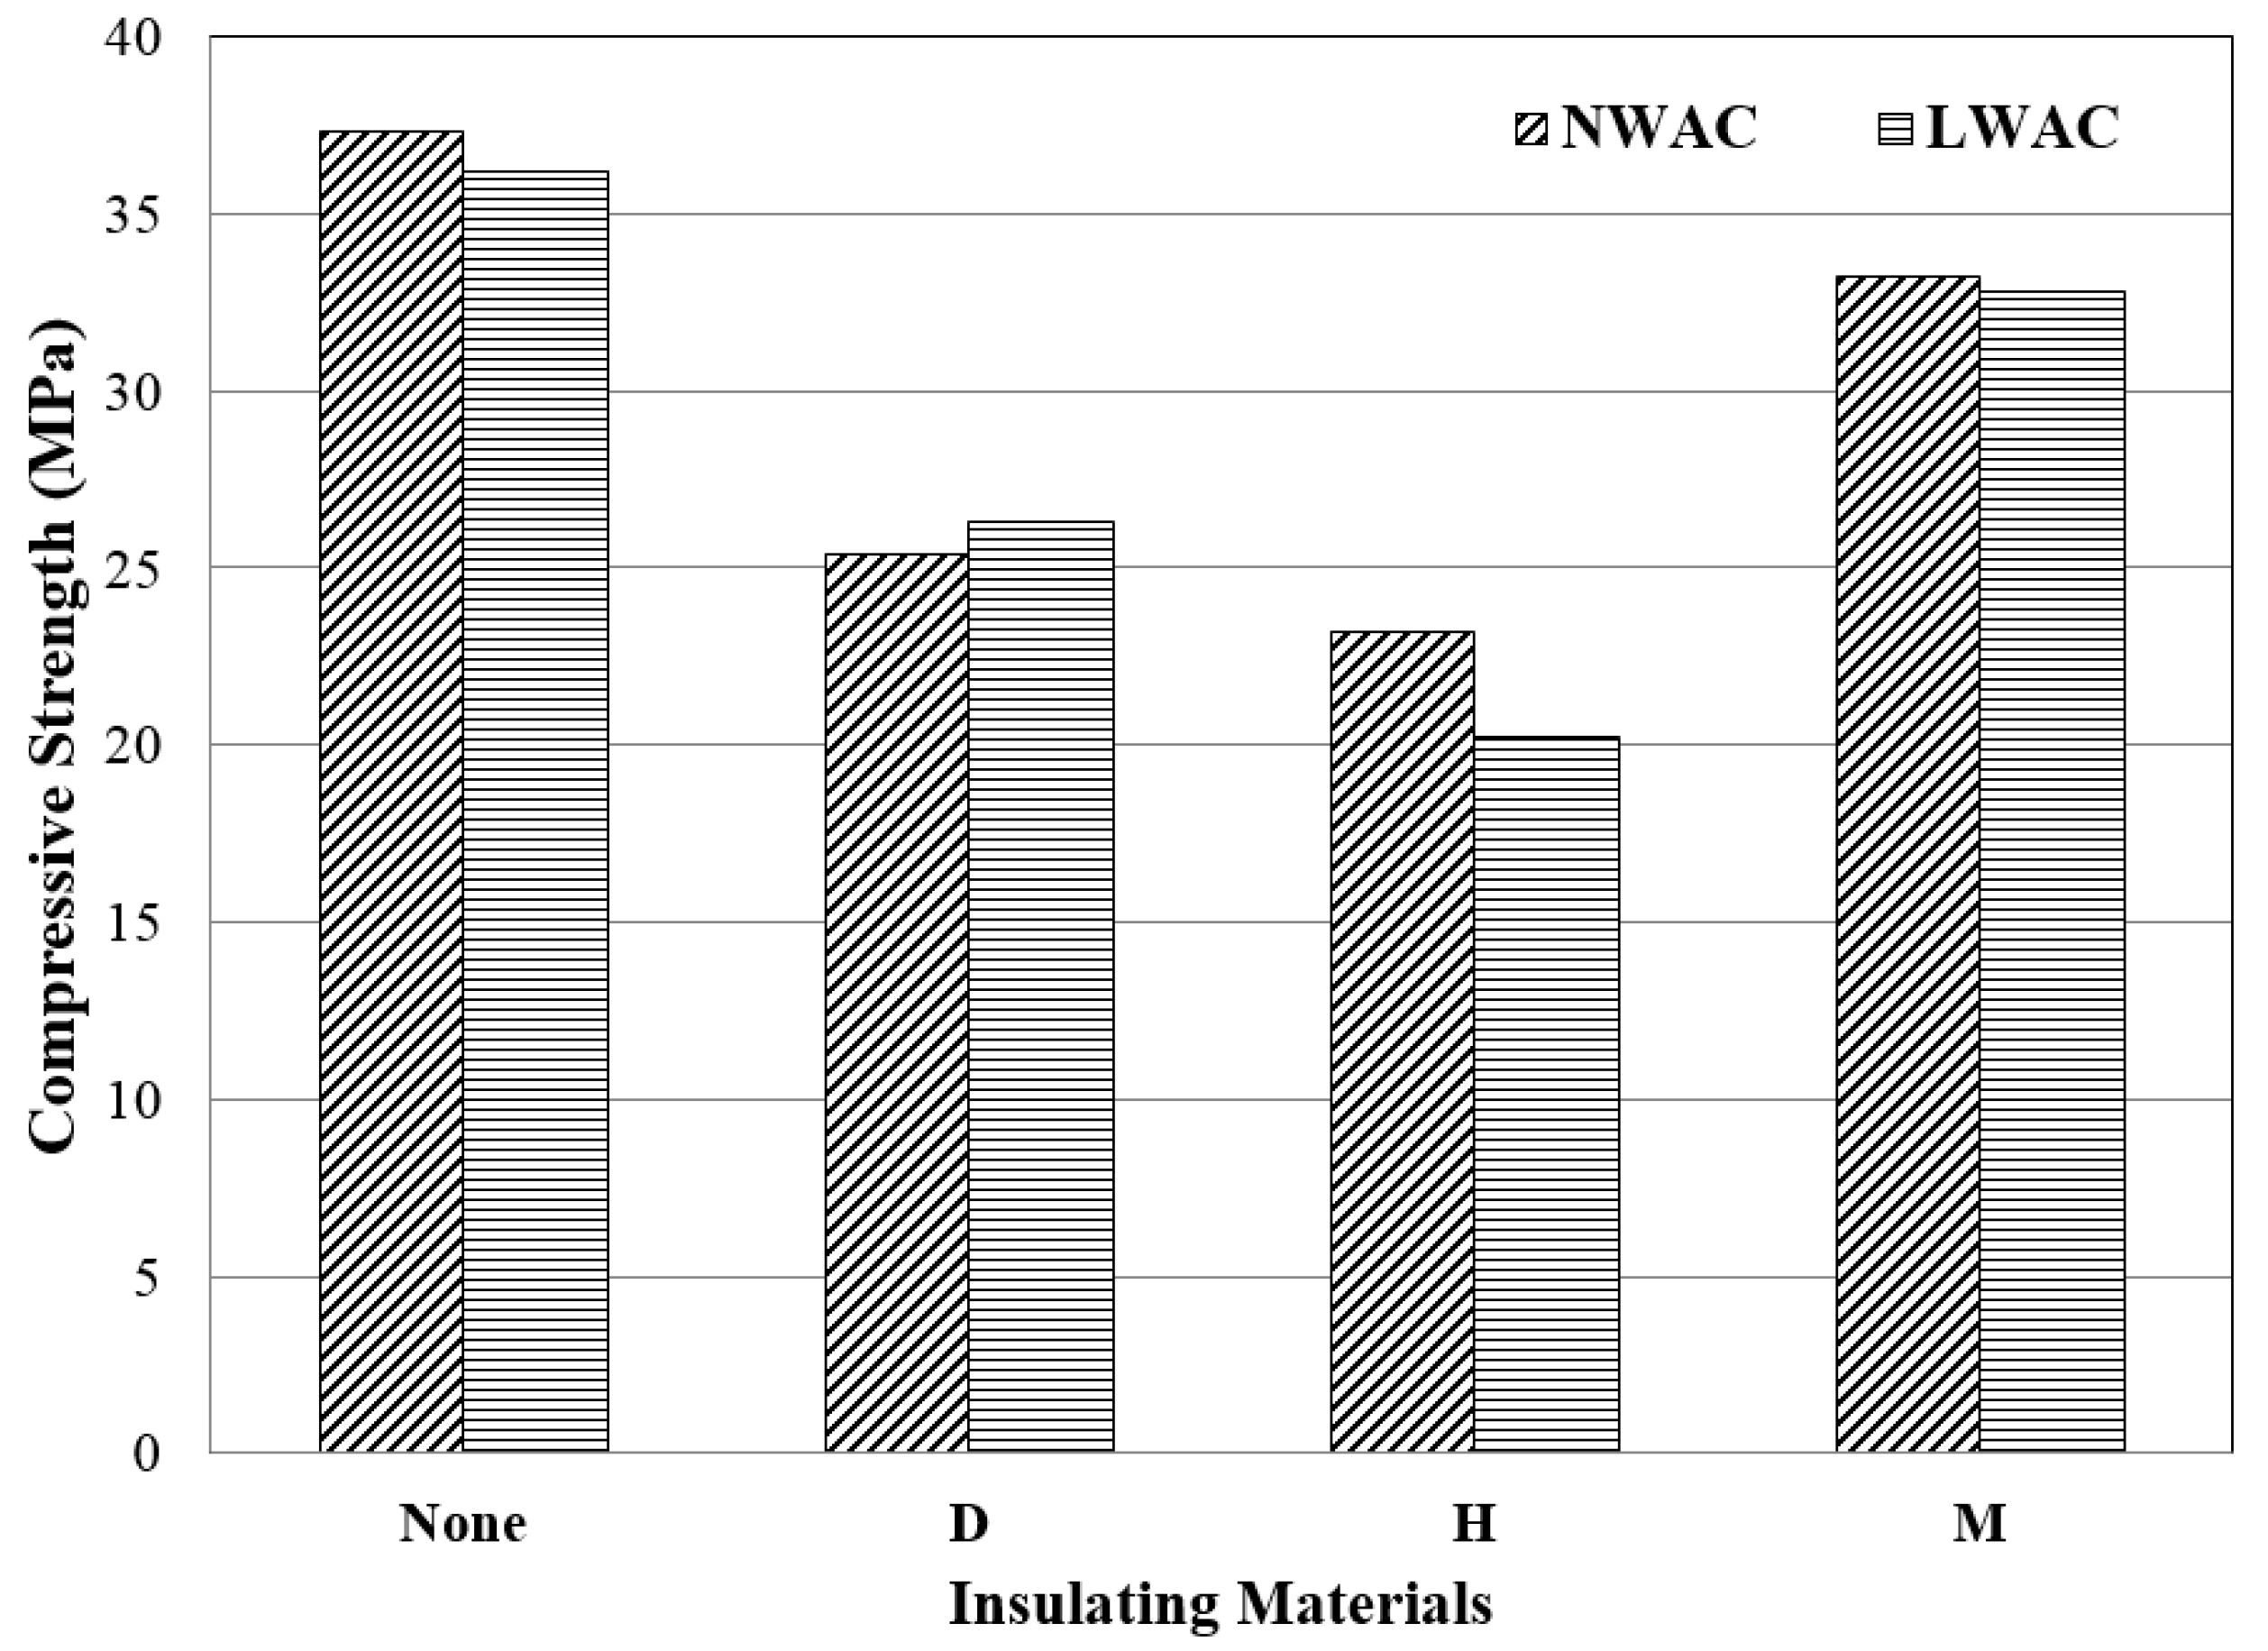
The experimental results of compressive strength at 28 days and air-dry density show the close relationship with thermal conductivity and thermal transmission.
(4)
The reduction ratios of thermal transmission for all specimens were not large compared with the thermal conductivity from QTM and GHW. This is because CHB was related to the convection by the movement of heat flow or continuous circulation while, for QTM and GHW, the conduction was via directly physical contact.
(5)
Durability performance on carbonation and freeze-thaw attacks were experimentally examined. Firstly, carbonation rates of thermally-enhanced concretes using various insulation materials were higher than normal concretes regardless of aggregate types and mixtures due to the increased permeability and higher pores. Thus, additional methods to protect the concrete from carbonation, such as an increase in cover depth, is needed for thermally-enhanced concretes with various insulation materials.
(6)
Secondly, the addition of air-entraining agent and increased pores had a good influence on the resistance to freeze-thaw attack. This is because the test specimens had enough voids to absorb the volume expansion due to the freezing of the pore water.
A test-bed house to prove the energy saving efficiency using these thermally-enhanced concretes was built in 2016 and has been monitored for more than a year. The monitored results can prove the efficiency of the thermally-enhanced concretes for our future works. In addition, to analyze the monitored energy consumption, virtual reality technology will be applied to emphasize the efficiency of the thermally-enhanced concretes to the public.

Acknowledgments

This research was supported by a grant from the R and D Program of the Korea Railroad Research Institute, Republic of Korea.

Author Contributions

J. Moon and K.-S. Youm designed and performed the tests. Also, they conceived the initial ideas. Y.-W. Jeong analyzed the data and wrote the paper. T.-H. Koh reviewed the results and the manuscript.

Conflicts of Interest

The authors declare no conflict of interest.

References

  1. Korean Government. Intended Nationally Determined Contribution for 2030; Korean Government: Seoul, Korea, 2015.
  2. British Petroleum. Statistical Review of World Energy; British Petroleum: London, UK, 2015. [Google Scholar]
  3. Korea Energy Agency. The Annual Energy Consumption in 2014; Korea Energy Agency: Yongin, Korea, 2015. [Google Scholar]
  4. Sørensen, L.S. Heat Transmission Coefficient Measurements in Buildings Utilizing a heat Loss measuring Device. Sustainability 2013, 5, 3601–3614. [Google Scholar] [CrossRef]
  5. Al-Homoud, M.S. Performance characteristics and practical applications of common building thermal insulation materials. Build. Environ. 2005, 40, 353–366. [Google Scholar] [CrossRef]
  6. Papadopoulos, A.M. State of the art in thermal insulation materials and aims for future developments. Energy Build. 2005, 37, 77–86. [Google Scholar] [CrossRef]
  7. Yun, T.S.; Jeong, Y.J.; Han, T.S.; Youm, K.S. Evaluation of thermal conductivity for thermally insulated concretes. Energy Build. 2013, 61, 125–132. [Google Scholar] [CrossRef]
  8. Jelle, B.P. Traditional, state-of-the-art and future thermal building insulation materials and solutions—Properties, requirements and possibilities. Energy Build. 2011, 43, 2549–2563. [Google Scholar] [CrossRef]
  9. Alani, A.; MacMullen, J.; Telik, O.; Zhang, Z.Y. Investigation into the thermal performance of recycled glass screed for construction purposes. Constr. Build. Mater. 2012, 29, 527–532. [Google Scholar] [CrossRef]
  10. Baetens, R.; Jelle, B.P.; Gustavsen, A. Phase change materials for building applications: A state-of-the-art review. Energy Build. 2010, 42, 1361–1368. [Google Scholar] [CrossRef]
  11. Meshgin, P.; Xi, Y. Multi-scale composite models for the effective thermal conductivity of PCM-concrete. Constr. Build. Mater. 2013, 48, 371–378. [Google Scholar] [CrossRef]
  12. Gao, T.; Jelle, B.P.; Gustavsen, A.; Jacobsen, S. Aerogel-incorporated concrete: An experimental study. Constr. Build. Mater. 2014, 52, 130–136. [Google Scholar] [CrossRef]
  13. Degirmenci, N.; Yilmaz, A. Use of diatomite as partial replacement for Portland cement in cement mortars. Constr. Build. Mater. 2009, 23, 284–288. [Google Scholar] [CrossRef]
  14. Chung, S.Y.; Elrahman, M.A.; Stephan, D. Effect of Different Gradings of Lightweight Aggregate on the Porperties of Concrete. Appl. Sci. 2017, 7, 585. [Google Scholar] [CrossRef]
  15. American Society for Testing and Materials. ASTM C177: Standard Test Method for Steady-State Heat Flux Measurements and Thermal Transmission Properties by Means of the Guarded-Hot-Plate Apparatus, Annual Book of ASTM Standards; ASTM International: West Conshohocken, PA, USA, 2004. [Google Scholar]
  16. American Society for Testing and Materials. ASTM C1113: Standard Test Method for Thermal Conductivity of Refractories by Hot Wire (Platinum Resistance Thermometer Technique), Annual Book of ASTM Standards; ASTM International: West Conshohocken, PA, USA, 2009. [Google Scholar]
  17. American Society for Testing and Materials. ASTM D5334: Standard Test Method for Determination of Thermal Conductivity of Soil and Soft Rock by Thermal Needle Probe Procedure; ASTM International: West Conshohocken, PA, USA, 2000. [Google Scholar]
  18. American Society for Testing and Materials. ASTM C1363: Standard Test Method for Thermal Performance of Building Materials and Envelope Assemblies by Means of a Hot Box Apparatus, Annual Book of ASTM Standards; ASTM International: West Conshohocken, PA, USA, 2001. [Google Scholar]
  19. European Standard. EN ISO 8990, Thermal Insulation—Determination of Steady-State Thermal Transmission Properties—Calibrated and Guarded Hot Box; International Organization for Standardization (ISO): Geneva, Switzerland, 1994. [Google Scholar]
  20. Karthick, S.P.; Muralidharan, S.; Saraswathy, V.; Kwon, S.-J. Effect of different alkali salt additions on concrete durability property. J. Struct. Integr. Maint. 2016, 1, 35–42. [Google Scholar] [CrossRef]
  21. Abbas, S.; Nehdi, M.L.; Saleem, M.A. Ultra-High Performance Concrete: Mechanical Performance, Durability, Sustainability and Implementation Challenges. Int. J. Concr. Struct. Mater. 2016, 10, 271–295. [Google Scholar] [CrossRef]
  22. Ergün, A. Effects of the usage of diatomite and waste marble powder as partial replacement of cement on the mechanical properties of concrete. Constr. Build. Mater. 2011, 25, 806–812. [Google Scholar] [CrossRef]
  23. American Concrete Institute. ACI 318-11 Building Code Requirements, Structural Concrete and Commentary; ACI Committee 318: Farmington Hills, MI, USA, 2011. [Google Scholar]
  24. Yun, T.S.; Jeong, Y.J.; Youm, K.S. Effect of surrogate aggregates on the thermal conductivity of concrete at ambient and elevated temperatures. Sci. World J. 2014, 2014, 939632. [Google Scholar] [CrossRef] [PubMed]
  25. Pepe, M.; Filho, R.D.T.; Koenders, E.A.B.; Martinelli, E. A novel mix design methodology for recycled aggregate concrete. Constr. Build. Mater. 2016, 122, 363–372. [Google Scholar] [CrossRef]
  26. Nevile, A.M. Properties of Concrete, 5th ed.; Pearson Education Limited: Edinburgh, UK, 2011. [Google Scholar]
  27. Hens, H. Building Physics—Heat, Air and Moisture; Ernst & Sohn: Berlin, Germany, 2007. [Google Scholar]
  28. Asdrubali, F.; Baldinelli, G. Thermal transmission measurements with the hot box method: Calibration, experimental procedures, and uncertainty analyses of three different approaches. Energy Build. 2011, 43, 1618–1626. [Google Scholar] [CrossRef]
  29. Thomas, M.D.A.; Skalny, J. Chemical Resistance of Concrete, STP 169D Significance of Tests and Properties of Concrete and Concrete-Making Materials; ASTM International: West Conshohocken, PA, USA, 2006; pp. 253–273. [Google Scholar]
  30. Chávez-Ulloa, E.; Camacho-Chab, R.; Sosa-Baz, M.; Castro-Borges, P.; Pérez-López, T. Corrosion Process of Reinforced Concrete by Carbonation in a Natural Environment and an Accelerated Test Chamber. Int. J. Electrochem. Sci. 2013, 8, 9015–9029. [Google Scholar]
  31. Dunster, A.M. Accelerated Carbonation Testing of Concrete; Building Research Establishment Ltd.: Watford, UK, 2000. [Google Scholar]
  32. British Standards. BS EN 13295:2004, Products and Systems for the Protection and Repair of Concrete Structures —Test Methods—Determination of Resistance to Carbonation; BSI: London, UK, 2004. [Google Scholar]
  33. RILEM Committee. CPC-18 Measurement for Hardened Concrete Carbonated Depth. Mater. Struct. 1998, 21, 453–455. [Google Scholar]
  34. Nmai, C.K. Freezing and Thawing, STP 169D Significance of Tests and Properties of Concrete and Concrete-Making Materials; ASTM International: West Conshohocken, PA, USA, 2006; pp. 154–163. [Google Scholar]
  35. American Society for Testing and Materials. ASTM C666: Standard Test Method for Resistance of Concrete to Rapid Freezing and Thawing, Annual Book of ASTM Standards; ASTM International: West Conshohocken, PA, USA, 2003. [Google Scholar]
  36. Chen, B.; Liu, N. A novel lightweight concrete-fabrication and its thermal and mechanical properties. Constr. Build. Mater. 2013, 44, 691–698. [Google Scholar] [CrossRef]
  37. Youm, K.S.; Moon, J.H.; Cho, J.Y.; Kim, J.J. Experiment study on strength and durability of lightweight aggregate concrete containing silica fume. Constr. Build. Mater. 2016, 144, 517–527. [Google Scholar] [CrossRef]
  38. Chandar, S.; Bentsson, L. Lightweight Aggregate Concrete; Noyes Publications: Norwich, NY, USA, 2003. [Google Scholar]
Figure 1. Schematic view of calibrated hot box.
Applsci 07 00811 g001
Figure 2. (a) General view of the calibrated hot box apparatus; (b) and installed large-scale specimens mounting panel (photograph courtesy of Fire Insurers Laboratories of Korea).
Applsci 07 00811 g002
Figure 3. Experimental observations of concrete air-dry density measured at 28 days.
Applsci 07 00811 g003
Figure 4. Experimental observations of concrete compressive strength measured at 28 days.
Applsci 07 00811 g004
Figure 5. Experimental observations of concrete thermal conductivity measured by quick thermal conductivity meter (QTM).
Applsci 07 00811 g005
Figure 6. Experimental observations of concrete thermal conductivity measured by guarded hot wire method (GHW).
Applsci 07 00811 g006
Figure 7. Experimental observations of concrete thermal transmission measured by calibrated hot box (CHB).
Applsci 07 00811 g007
Figure 8. Average carbonation rates for normalweight aggregate concrete (NWAC) and lightweight aggregate concrete (LWAC).
Applsci 07 00811 g008
Figure 9. Experimental observations of concrete relative dynamic modulus of elasticity relative dynamic modulus of elasticity (RDME) measured at 300 freeze-thaw cycles.
Applsci 07 00811 g009
Table 1. Physical properties of the micro-foam agent.
Density (g/cm3)pHViscosity (cPs)Solid Content (%)Color
2.156.978015.6White Translucent
Table 2. Physical properties of the diatomite powder and hollow micro-spheres.
MaterialsDensity (g/cm3)Absorption (%)No. 140 *
(% Retained)
ColorThermal Conductivity (W/m·K)
diatomite powder1.10.50.5Light red0.014
Hollow micro-sphere0.1250.0-white0.044
* Opening: 0.105 mm.
Table 3. Physical properties of aggregates [24].
ItemsType of Aggregates
Normalweight FineNormalweight CoarseLightweight Coarse
SourceCleaned sea-sandCrushed stoneSlate
Fineness modulus2.836.84-
Dry bulk density (kg/m3)14801680800
Specific gravity2.602.611.46
Gmax * (mm)-25.412.5
Thermal conductivity (W/m·K)3.52.750.106
* Gmax: Maximum size of coarse aggregate (mm).
Table 4. Description of insulation materials.
LabelDescriptionVolume Replacement Ratio of Coarse Aggregate (%)Remark
NNReference for NWAC 1-None
LNReference for LWAC 2-None
DDiatomite powder15
HHollow micro-sphere40
MMicro-foam agent-Chemical additive
1 NWAC: Normalweight aggregate concrete; 2 LWAC: Lightweight aggregate concrete.
Table 5. Mixture designs of test specimens.
Coarse Aggregate TypeLabelsW/C (%)Ingredients * (kg/m3)
WCHDSGM **
Normal (N)NN55.0215390--887852-
ND55.0215391-61887715-
NH55.02153919-813679-
NM30.0144479--753105919.2
Light (L)LN55.0215390--802543-
LD55.0215391-61802393-
LH55.02153919-813366-
LM30.0144479--75357519.2
* W: water; C: cement; H: hollow micro-spheres; D: diatomite; M: micro-foam agent; S: sand (fine aggregate); G: gravel (crushed granite coarse aggregate). ** M: added as a chemical additive.
Table 6. Test results of the physical properties.
Coarse Aggregate TypeLabelsInsulation MaterialsAir Content (%)Air-Dry Density (kg/m3)Compressive Strength (MPa)
3 Days7 Days28 Days
Normal (N)NNNone4.3226724.932.037.3
NDDiatomite7.6197112.416.925.4
NHHollow micro-sphere6.2184313.516.123.2
NMMicro-form agent10.0208020.529.033.2
Light (L)LNNone5.2180623.729.136.2
LDDiatomite7.4169113.618.026.3
LHHollow micro-sphere4.9159910.113.420.2
LMMicro-form agent10.0176921.127.932.8
Table 7. Comparison of thermal properties.
Coarse Aggregate TypeLabelsInsulation MaterialsQTM (W/m·K)GHW (W/m·K)CHB (W/m2·°C)
Normal (N)NNNone1.941.58762.94
NDDiatomite1.151.27452.67
NHHollow micro-sphere1.150.97422.42
NMMicro-form agent1.371.15812.67
Light (L)LNNone1.220.9894-
LDDiatomite0.870.81482.38
LHHollow micro-sphere0.810.70332.27
LMMicro-form agent1.000.75332.33
Table 8. Average carbonation rates.
Coarse Aggregate TypeLabelsInsulation MaterialsAverage Carbonation Depth (mm)
7 Days28 Days56 Days
Normal (N)NNNone4.65.710.1
NDDiatomite8.612.918.6
NHHollow micro-sphere8.917.921.7
NMMicro-form agent7.613.520.9
Light (L)LMNone2.55.18.2
LDDiatomite8.613.918.2
LHHollow micro-sphere9.216.020.9
LMMicro-form agent8.711.316.8

