1. Introduction
There have been tremendous advances in the information carrying capacity of optical communication systems within the past decade, with the optical techniques for communication now migrating to intra-datacenter communication [
1,
2]. The growth of stored data within datacenters and the necessity to retrieve this data is driving the requirement for cost-effective, higher capacity intra-datacenter interconnects to 400 Gbit/s and the data modulation format is evolving towards four-level pulse amplitude modulation (PAM4) that carries two bits per every transmitted symbol [
2].
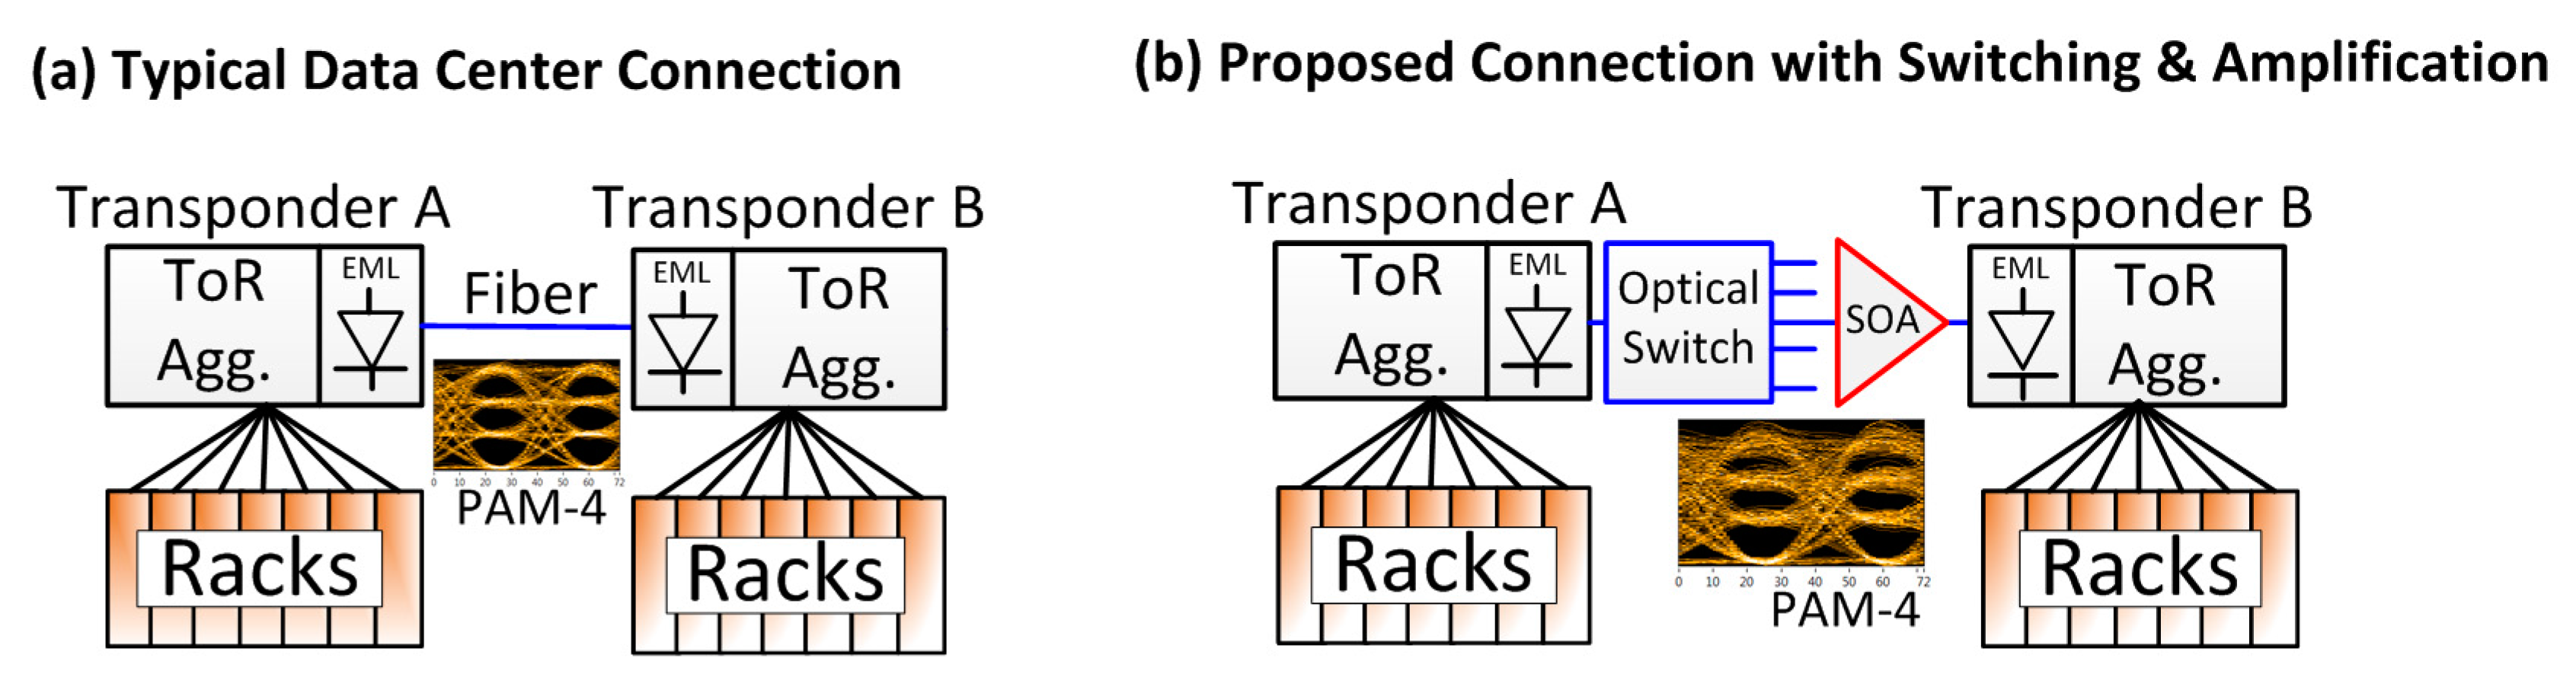
Figure 1a presents a simplified schematic of a data connection between two clusters of racks in a datacenter where optoelectronic transponders and optical fiber form the basic communication link. Already, a bank of eight externally modulated lasers using electro-absorption modulators to deliver 400 Gbit/s links on a single fiber can be offered with 28 Gbaud PAM4 offering a raw data rate of 56 Gbit/s per wavelength [
3].
Semiconductor optical amplifiers (SOA) are low cost, highly integratable amplifiers that may find two roles within intra-datacenter communication. Firstly, optical switches with light paths defined by activated SOAs have been demonstrated [
4,
5] and could provide additional switching functionality in an optical-domain switching layer. Secondly, SOAs are being given serious consideration to also play a role as pre-amplifiers for PAM4 signals as reach extenders or to overcome inevitable insertion losses of an optical switch as shown in
Figure 1b [
6,
7]. Usually, SOAs suffer from a relatively high noise figure (NF) which limits the minimum signal power that can be reliably amplified to a few tens of µW; SOAs also suffer from low gain saturation power (the order of 10 mW) which distorts the amplified signal even when the average input signal power is of the order of hundreds of microwatts [
8,
9].
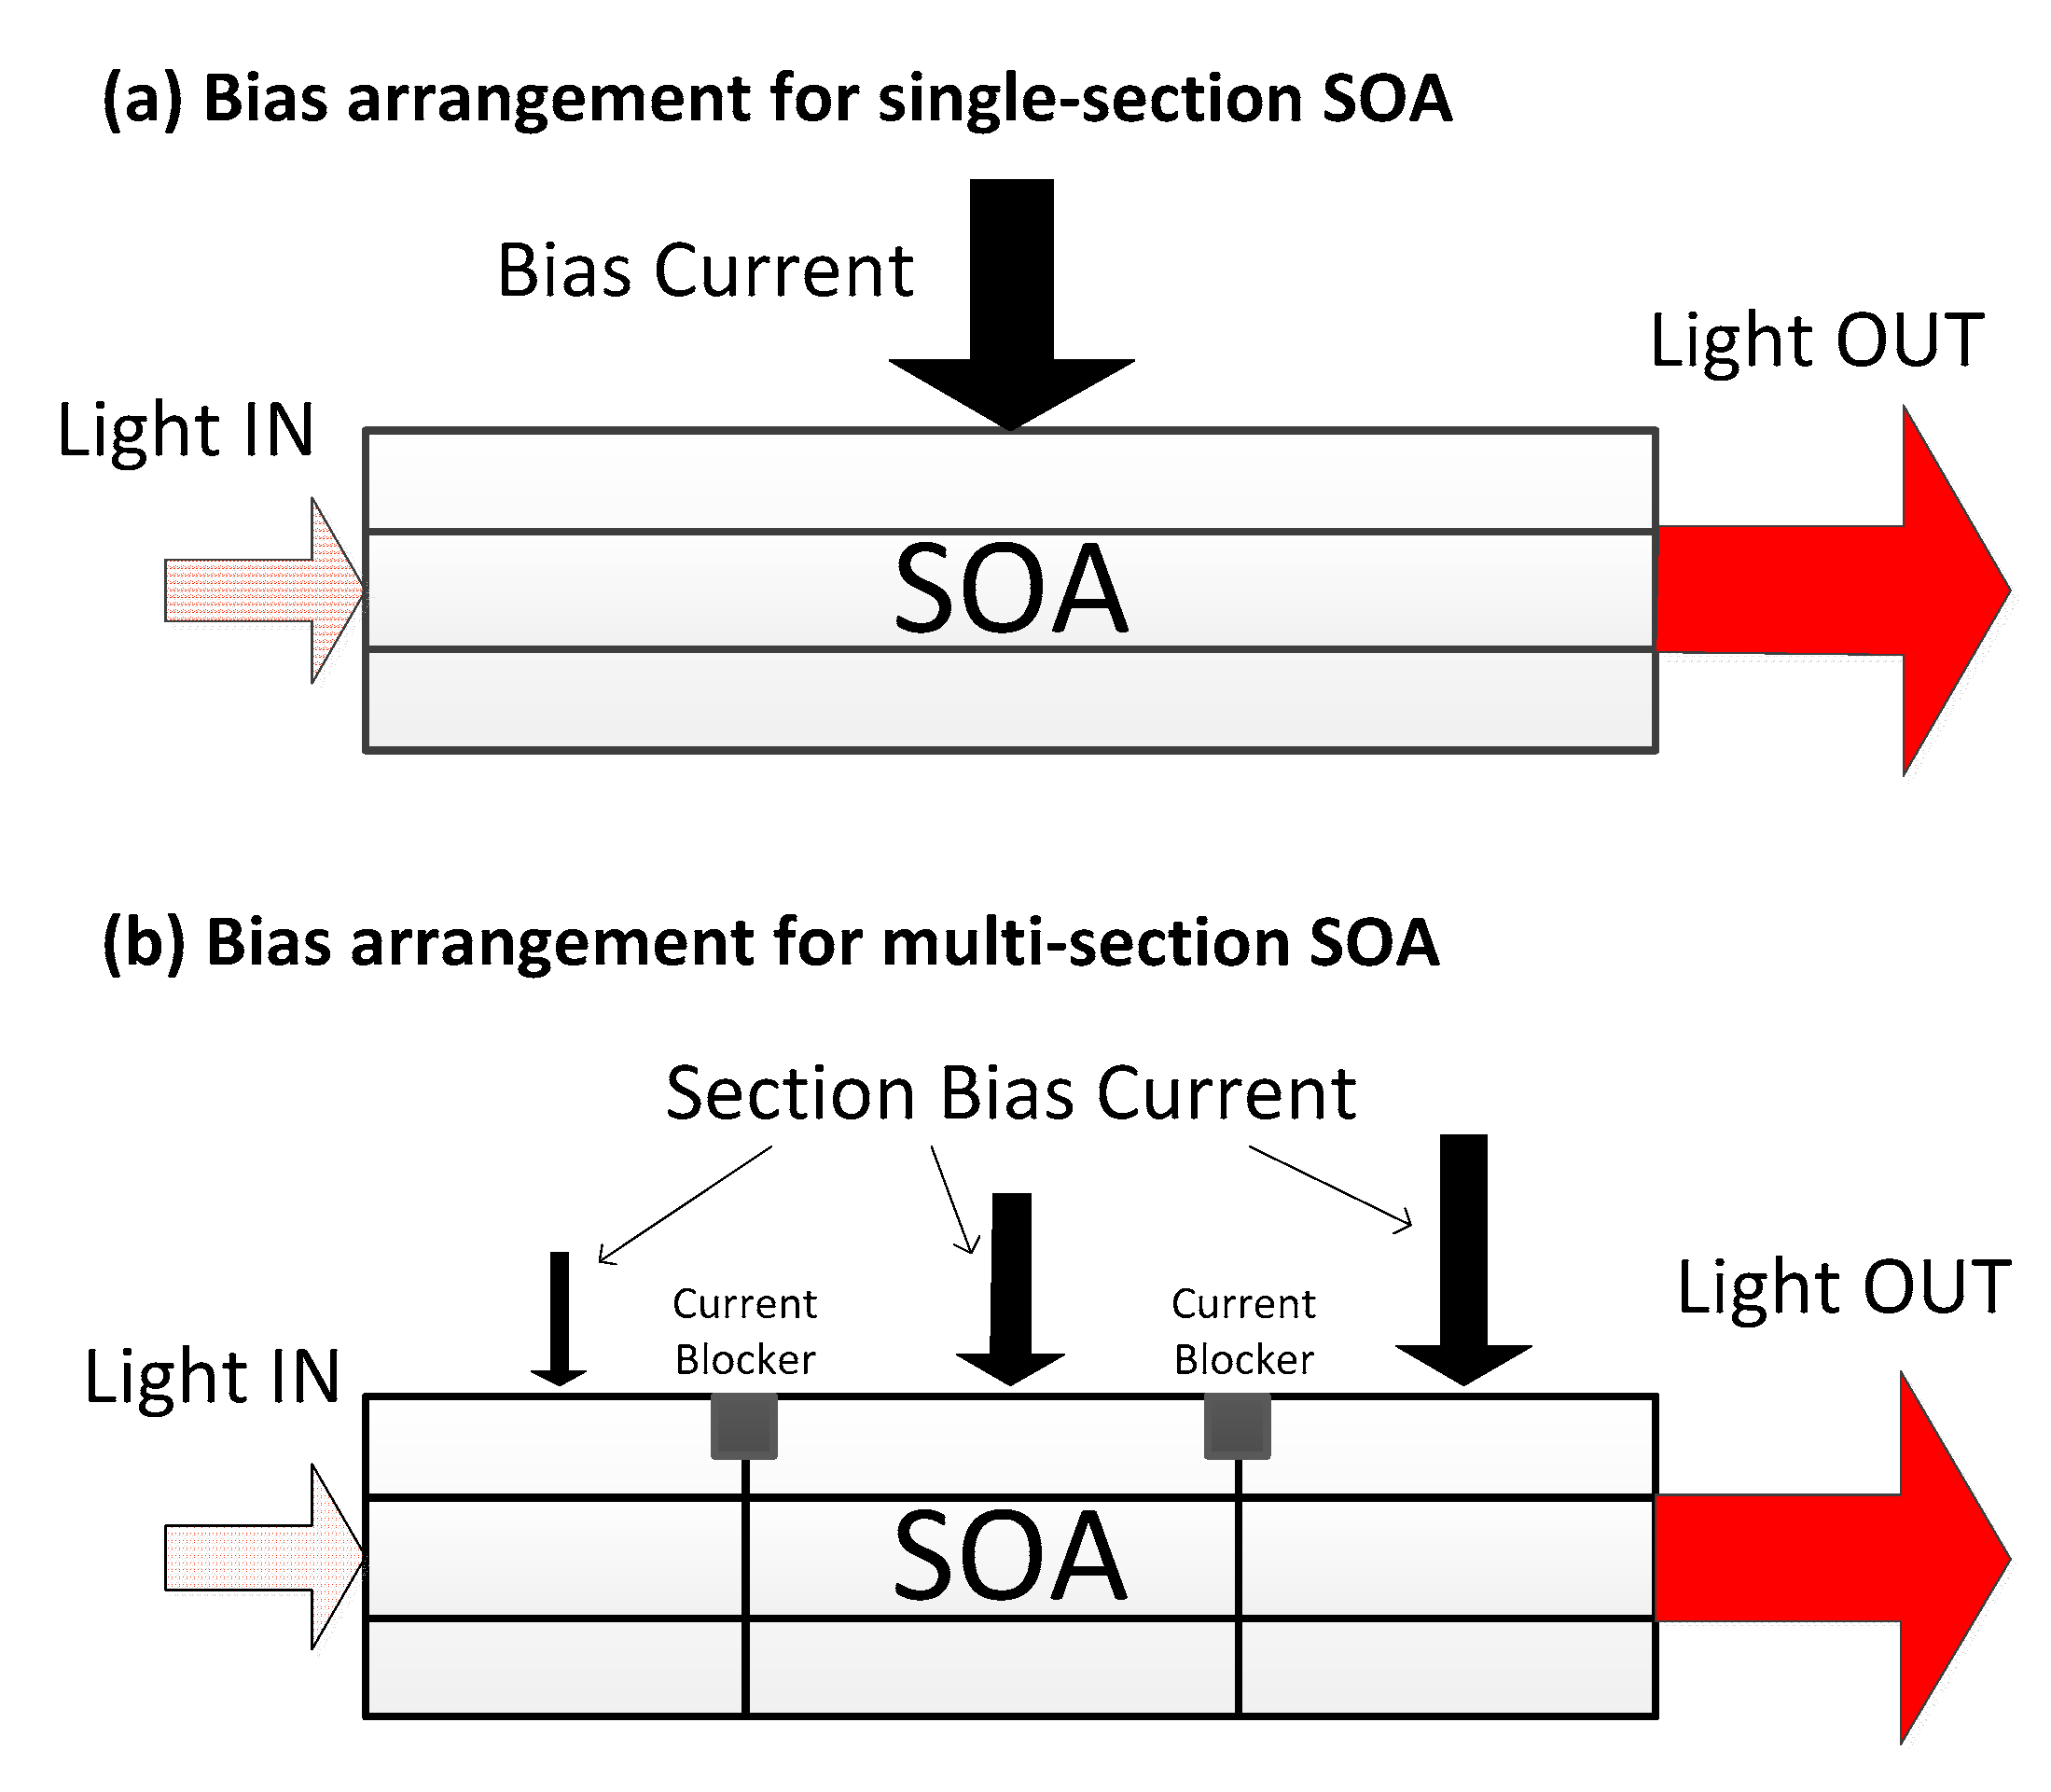
The NF and saturation power of SOAs can be improved by subdividing the amplifier into separate sections and applying a different bias current to each subsection [
10]. The concept of a multi-section SOA [
10] is shown in
Figure 2. In
Figure 2a, for a single-section SOA, a large DC bias current is applied to the SOA resulting in equal carrier injection being applied along the entire length of the SOA. For the multi-contact SOA, the SOA is subdivided into smaller sections with each section biased independently. The SOA is operated with favorable current biasing arrangements, whereby a stronger bias current is applied towards the output facet allowing for an improvement of the effective NF and increase in the effective saturation power relative to single-section SOAs [
10,
11,
12]. This favorable biasing current arrangement can be done without increasing the overall injected current and hence keeping the power consumption constant. In separate works, regarding reflective SOAs (RSOA), with the RSOA subdivided into two subsections was found to have improved the direct modulation electro-optic response of the RSOA [
13]. To date, no study (neither experimental nor numerical) has been performed on investigating the benefits of amplifying information-carrying modulated optical signals using multi-section SOAs, only the NF and saturation powers have been measured and/or calculated [
10,
11,
12]. In addition, a simplified numerical model for multi-section SOAs has not yet been developed that would allow estimating the amplification performance of modulated signals in multi-section SOAs.
In this paper, we show how to create a simplified multi-section SOA model and use that model to evaluate the amplification performance of multi-section SOAs, and as comparison to conventional single-section SOAs for 28 Gbaud PAM4 signals. We are modifying our simplified SOA model in [
14] to consider multi-section SOAs. We find that in order to replicate the experimental results for amplification of PAM4 signals using SOAs in [
15], we need only consider amplified spontaneous emission (ASE) noise generated in the SOA and thermal noise in an optical receiver, and we achieve similar bit-error rate (BER) performance to experimental 28 Gbaud PAM4 systems [
15]. The input power dynamic range (IPDR) is an important metric for amplified systems using SOAs [
8], because the IPDR indicates the useful input power range over which signals can be amplified and the data retrieved without error [
8]. We show that a multi-section SOA could improve the IPDR by more than 3 dB relative to the IPDR of a similar gain single-section SOA. The results, from this simple system simulator for multi-section SOAs, motivate the further experimental investigation of multi-section SOAs for datacom applications.
2. Numerical Simulator
We create an optical field,
, that is normalised such that
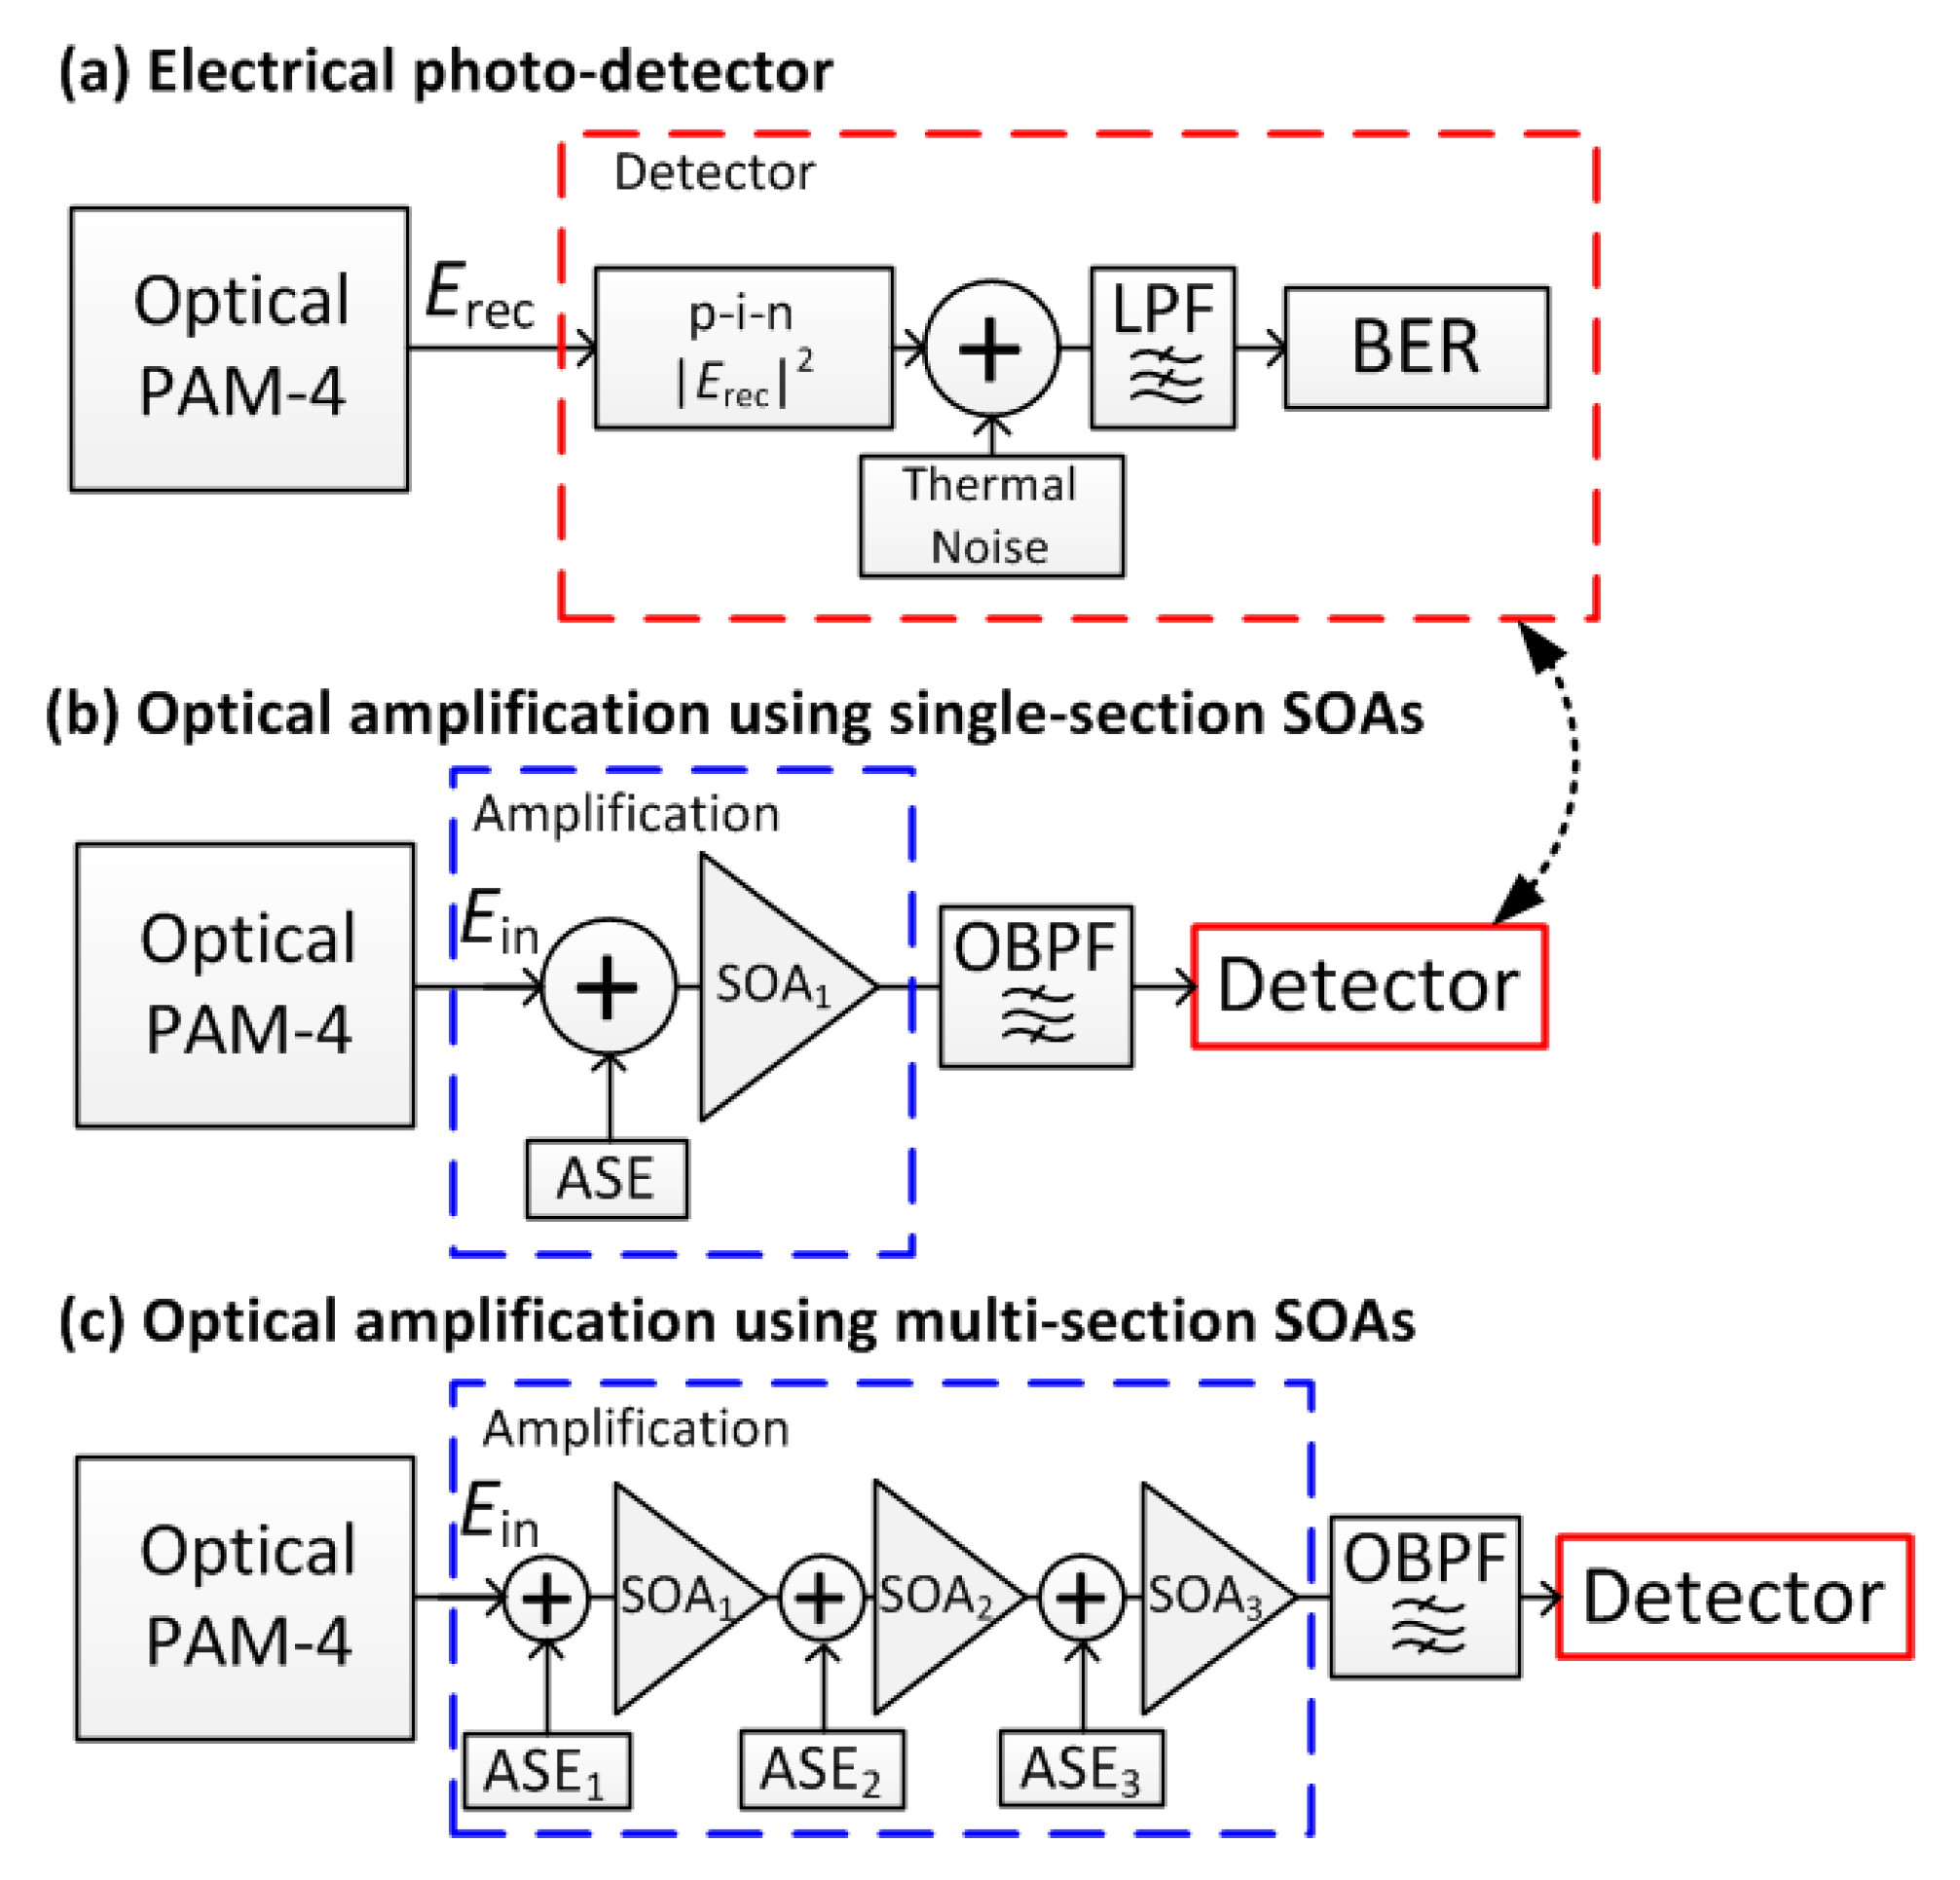
represents the optical power. The four level 28 Gbaud PAM4 signal is encoded within the optical power domain. We set the extinction ratio between the strongest and weakest levels of the PAM4 signal to be 8 dB. Before describing the SOA model we first describe the linear photo-detector model as depicted in
Figure 3a. The received photo-current is given as
where
is the optical field incident on the photodiode, the detector responsivity
= 1 A/W throughout this paper. In the detector, electrical thermal noise is added to the current generated by the signal, the thermal noise
is considered to be white Gaussian noise with autocorrelation [
16]
With
being Boltzmann’s constant,
(K) the temperature, and
= 50 Ω is the impedance of the receiver, and
is the Dirac delta function. The combined signal and noise is low-pass filtered and then a decision is made on the transmitted PAM4 symbol. Error counting after comparing the received and transmitted bits determines the BER. In the simulator the current waveform is generated by generating a random waveform with values taken from a zero-mean, unity variance Gaussian distribution,
is a random noise waveform whose values are taken from a zero-mean, unity-variance Gaussian distribution, and is the simulation bandwidth (i.e., inverse sampling time) and equals 1 THz throughout this paper. A different value for is generated for each sampling point in the waveform for the PAM4 signal .
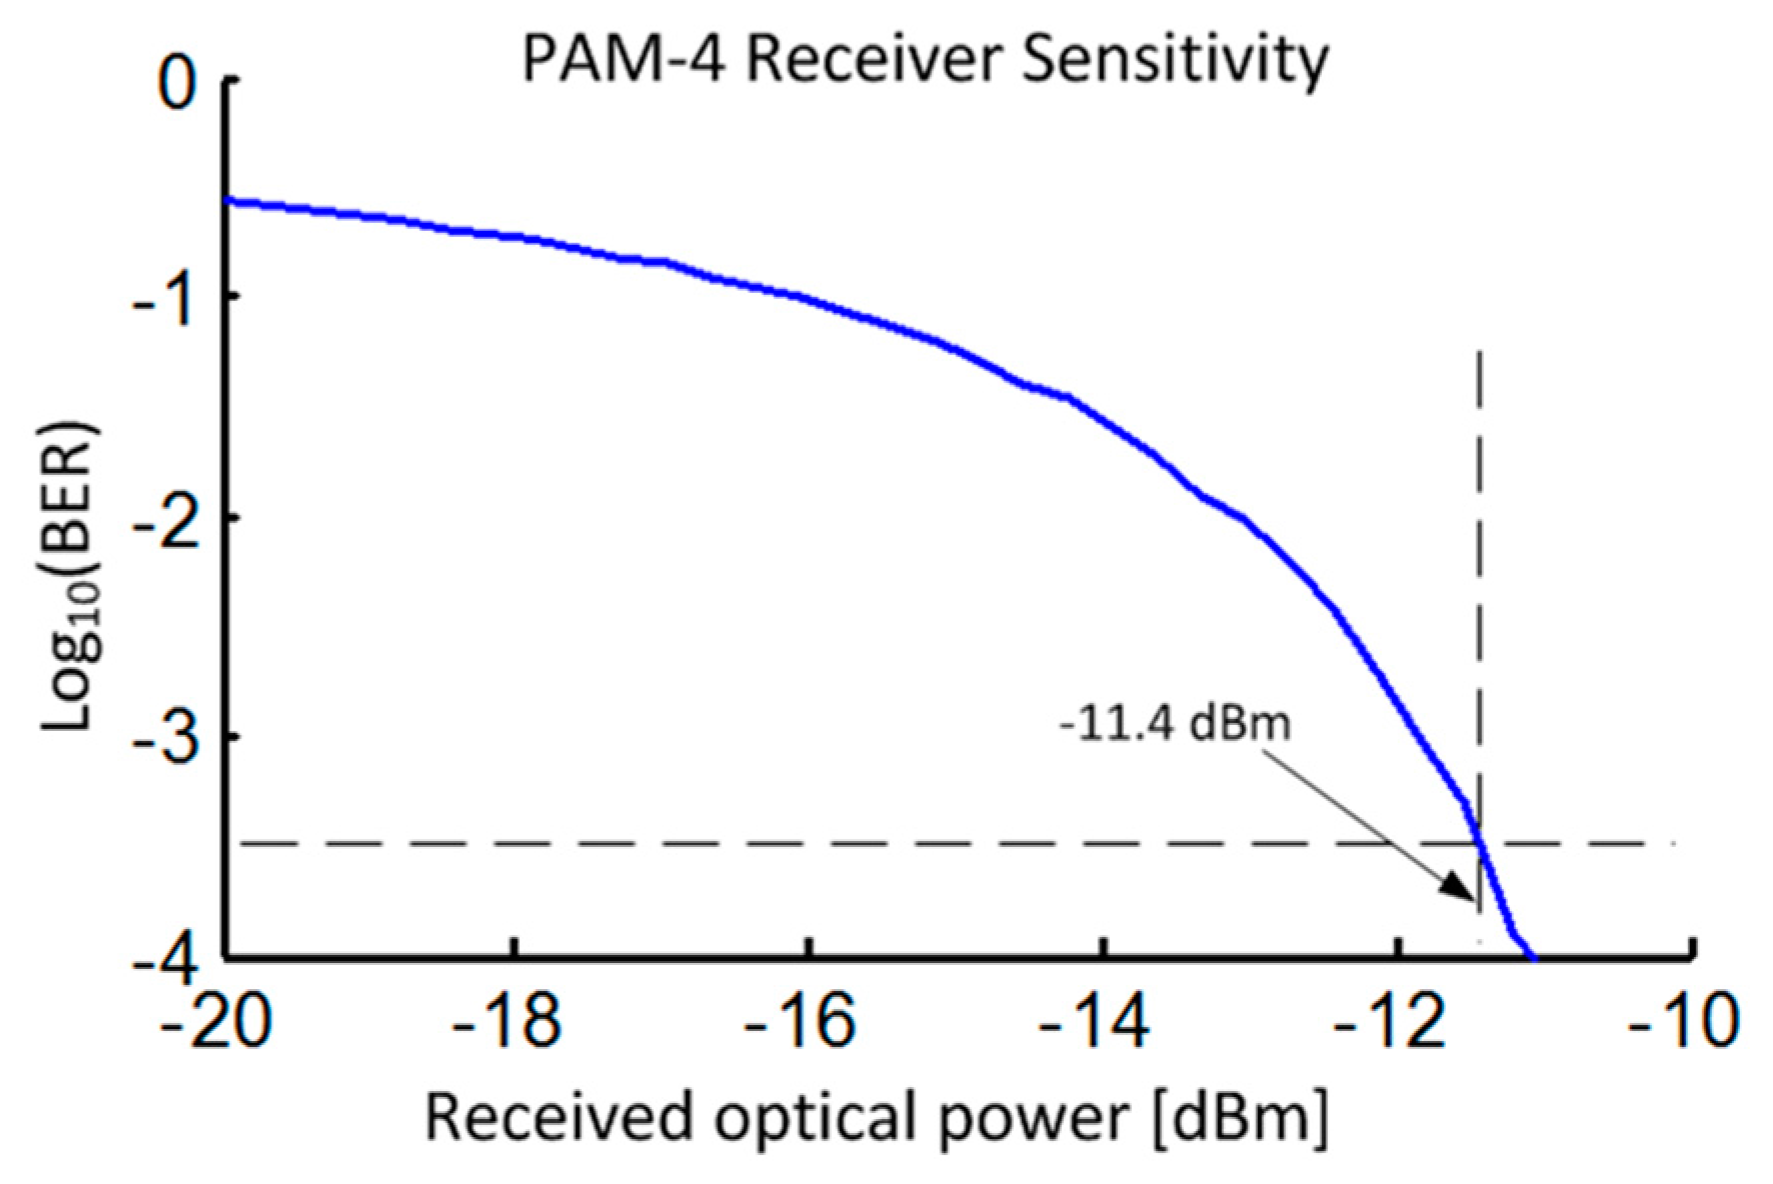
The amount of thermal noise remains fixed and the BER changes by changing the received signal power
. We calculate the BER for different values of received optical signal power with the results shown in
Figure 4. We indicate the sensitivity to achieve a BER of 3.16 × 10
−4 because this is the BER at which the forward error correction algorithms can effectively yield error-free performance [
2]. The received power that attains a BER of 3.16 × 10
−4 is estimated to be −11.4 dBm, which is in line with an experimentally obtained sensitivity of −10.8 dBm [
15], and within an acceptable range for receiver sensitivity. Reducing the responsivity of the photodiode to 0.7 would add +1.5 dB to our calculated receiver sensitivity. The detector model is central to all of our simulations and we use the detector model after amplifying the signal in an SOA.
The simulation models for the SOAs are shown in
Figure 3b,c. Typically, SOAs are travelling wave models and consideration for the spatially-distributed gain should be considered, though in the absence of internal scattering losses the SOA can be equivalently treated as a lumped device [
17] without needing to consider the propagation of the optical field in the SOA. The lumped SOA model approach avoids the need to subdivide the SOA into smaller subsections in order to compute the propagation of the optical field. Additionally, the lumped SOA model approach requires that only a single differential equation needs to be numerically solved to estimate the SOA gain. The computational savings by adopting the lumped SOA model approach makes that approach attractive for use within communication system simulators, where tens of thousands of data symbols need to be simulated in order to gauge meaningful system performance. An example of using the lumped SOA model approach for communication system simulators is given in [
18]. To address the issue of including non-negligible internal scattering losses we developed an improved lumped SOA model [
14] that is accurate to ~1 dB and we have used this model to estimate the wavelength conversion performance of optical signals in SOAs [
19]. The SOA dynamics are described by a single differential equation for each subsection [
14]:
With
representing the integrated gain-coefficient over the length of the SOA section,
is the unsaturated value of the integrated gain coefficient,
is the carrier lifetime,
is the integrated scattering losses,
is the saturation optical power at which the gain coefficient reaches half of the unsaturated value, and
is the incident optical power to the SOA. The second term on the right hand side of (4) describes stimulated emission with the first term on the right hand side describing gain recovery due a replenishment of the gain via the bias current. The output field from the SOA subsection is
being the gain-phase coupling parameter. The ‘
’ index in (4) and (5) refer to a subsection in the multi-section SOA. To account for the ASE generated within the SOA we add an equivalent ASE noise to the optical field before passing the field through the SOA [
18]. The equivalent optical ASE noise
is assumed to be white Gaussian noise with the following autocorrelation:
With
being the photon energy,
is the gain inversion parameter and is related to the NF by NF =
. There is a correction factor to ensure that the ASE noise power equals
at the output [
18]. This correction factor is accurate while the SOA gain remains unsaturated, though the ASE noise only affects the performance of low-power input signals up to a few tens of µW. In the numerical simulator we generate two random waveforms with samples taken from two uncorrelated, zero-mean, unity-variance Gaussian distributions
and
to represent the in-phase (
) and quadrature (
) components of the optical field
For the multi-section SOA, the ASE generated within each section is uncorrelated.
We consider the SOA as a pre-amplifier, and typically SOA pre-amplifiers have moderate gains of 13 to 15 dB amplification [
8,
9,
10,
11] in order to avoid deleterious gain saturation. Selecting a device with a larger gain will only reduce the input optical power at which gain saturation occurs. The lower power limit of amplifying signals in SOAs is determined by the NF (or effective NF for the case of multi-section SOAs) and mainly independent of the SOA gain. For specific parameter selection, we aim to replicate SOA saturation characteristics of an actual multi-section SOA [
10]. We set both (multi-section and single section) SOAs to have a total unsaturated gain of 13 dB. For the single section SOA:
= 6,
= 3, this implies that the unsaturated power gain is
The NF is large at 8 dB,
= 200 ps,
= 20 mW. Note, that for the single section SOA, only a single differential equation of the type in (4) is solved. The breakdown of the parameters for each section in the multi-section SOA is given in
Table 1. We assume that that the biasing arrangement allows for the first section to have modest gain with a small NF of 4 dB, and the third section to have the largest gain with a large NF of 9 dB. The multi-section SOA has an overall net gain of
The saturation power
is not a unique quantity to the SOA though rather the saturation energy which is the product
remains constant [
17]. Under strong bias currents, the carrier density increases and the carrier lifetime
falls due to increased bimolecular and Auger recombination, therefore we adjust the saturation powers such that the product
= 4 pJ for the single-section SOA and for all subsections of the multi-section SOA.
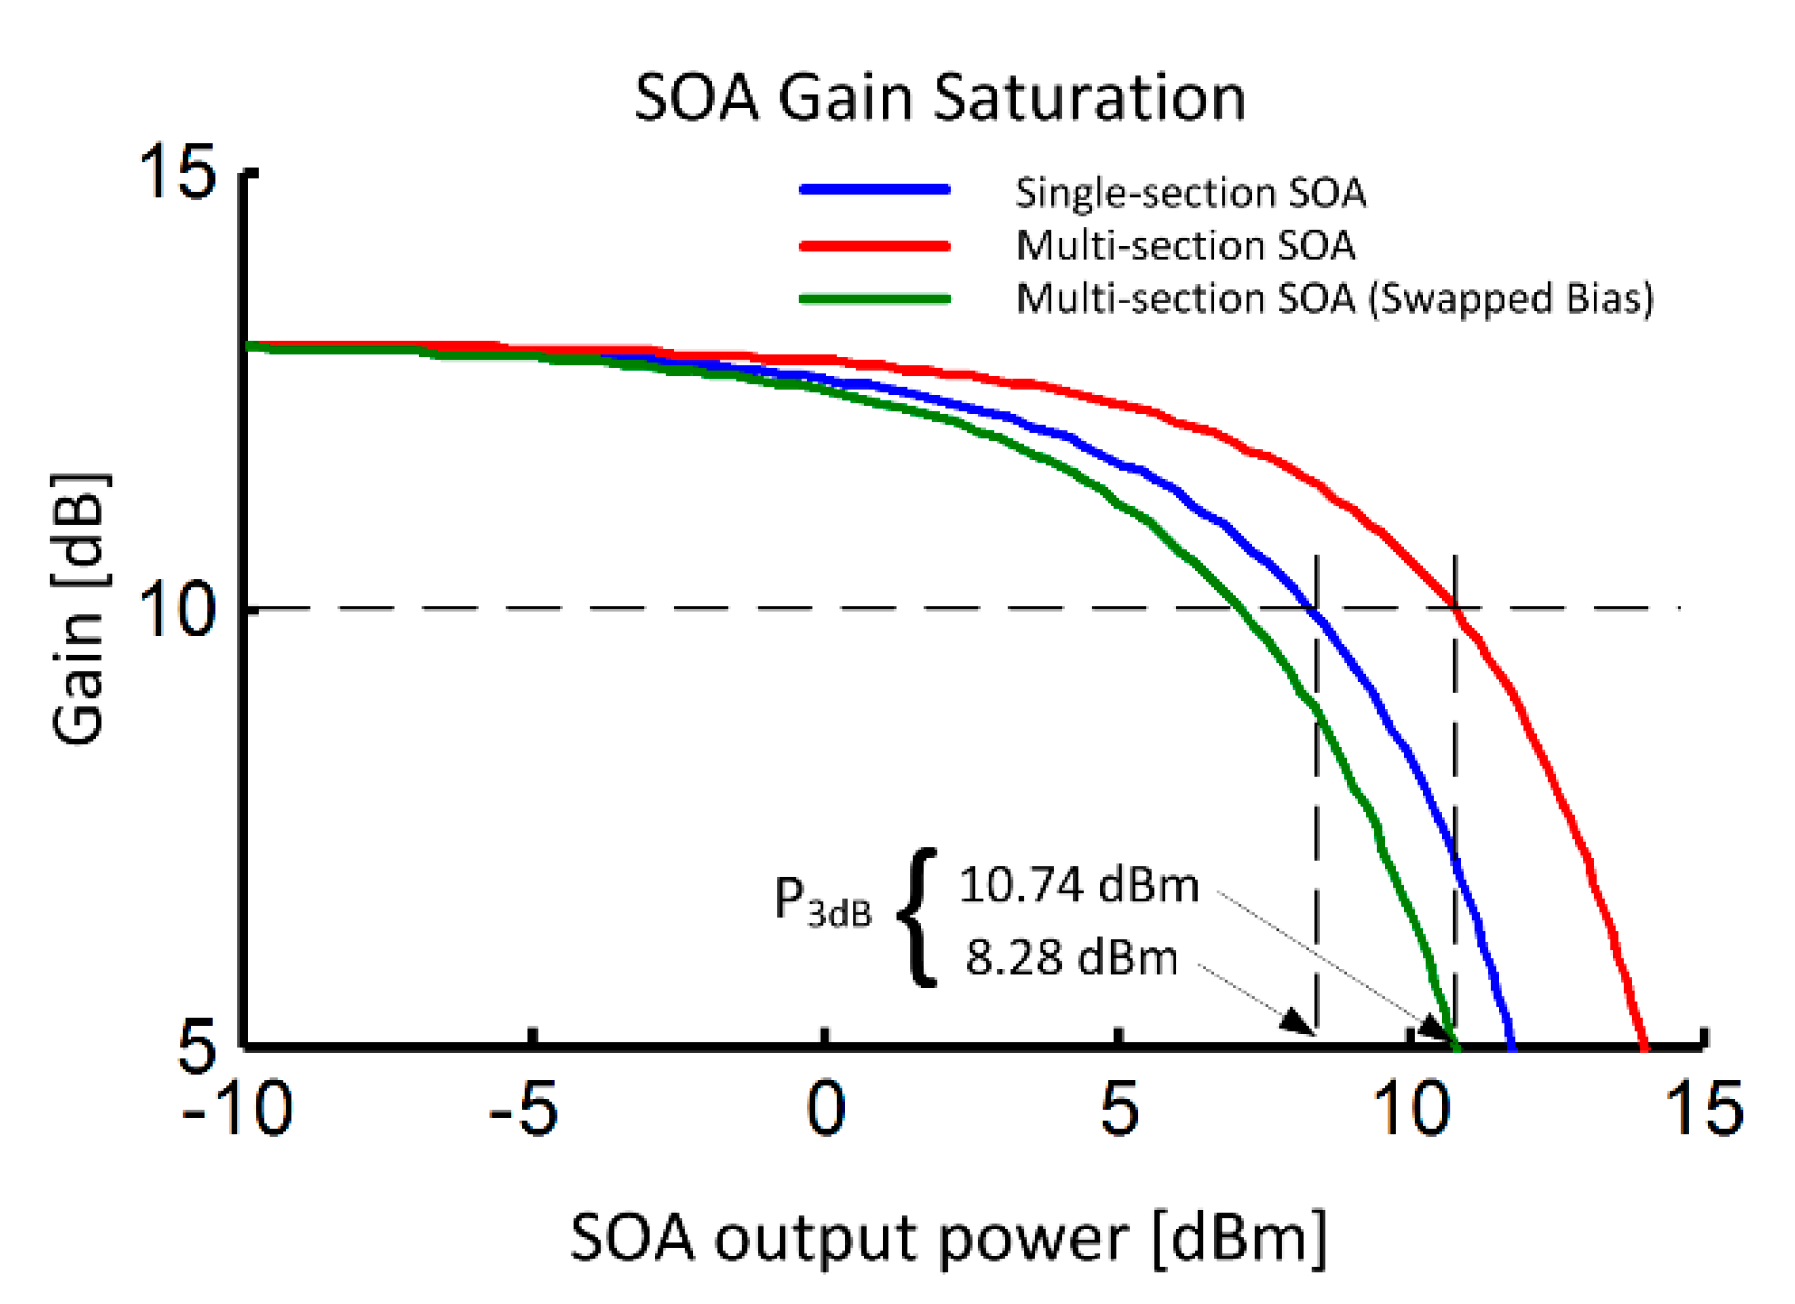
The SOA gain saturation provides much insight into the improvements offered by the multi-section SOA. We will calculate the SOA gain–output power relations for both SOAs. We create continuous wave fields without any modulation and calculate the steady-state optical power gain. Note that stochastic effects are avoided by setting the NF = −50 dB in order to get clear and precise gain calculations. The results are shown in
Figure 5. For low output powers below −5 dBm the unsaturated gain for both SOAs is 13 dB. The SOA gain falls as the output increases and we note that
is the output power at which the gain has fallen from the unsaturated value by 3 dB. The single section SOA has a
of 8.28 dBm, whereas the
for the multi-section SOA is 10.74 dBm. We also plot on
Figure 5 the gain saturation performance when the biasing arrangements are swapped between the first and third sections, the output saturation power reduces to 7.1 dBm. Such a biasing arrangement might be favourable for enhancing the nonlinear behaviour of the SOA and could be exploited for all-optical signal processing purposes [
19], though amplification using this configuration is not explored here. Experimental results taken from a multi-section SOA show a
of 9.3 dBm for the high saturation power configuration and a
of 6.3 dBm for the swapped biasing arrangement [
10]. We next examine how the SOAs perform when amplifying PAM4 signals.
3. Single Channel PAM4 Amplification Results
We create an optical field with 20,000 PAM4 symbols (40,000 bits) at 28 Gbaud encoded into the power waveform. The signals pass through the SOA and are detected in the receiver. The optical input power to the SOA is varied from −30 dBm to 0 dBm, the output of the SOA passes through an optical bandpass filter (OBPF) before the detector block which calculates the BER. The OBPF has a super-Gaussian spectral profile with optical field transfer function
With
being the central frequency of the OBPF, and
= 50 GHz, resulting in a full-width half maximum bandwidth of 108 GHz. This is wide enough to pass the central channel while offering strong rejection of neighboring channels in a multi-channel simulation, more details about the OBPF are given in the following section. Note that the smallest frequency difference to the central channel of interest that we consider throughout this paper is 100 GHz. The OBPF also limits the amount of ASE that reaches the photo-detector and reduces the detrimental spontaneous-spontaneous beat noise in direct detection systems [
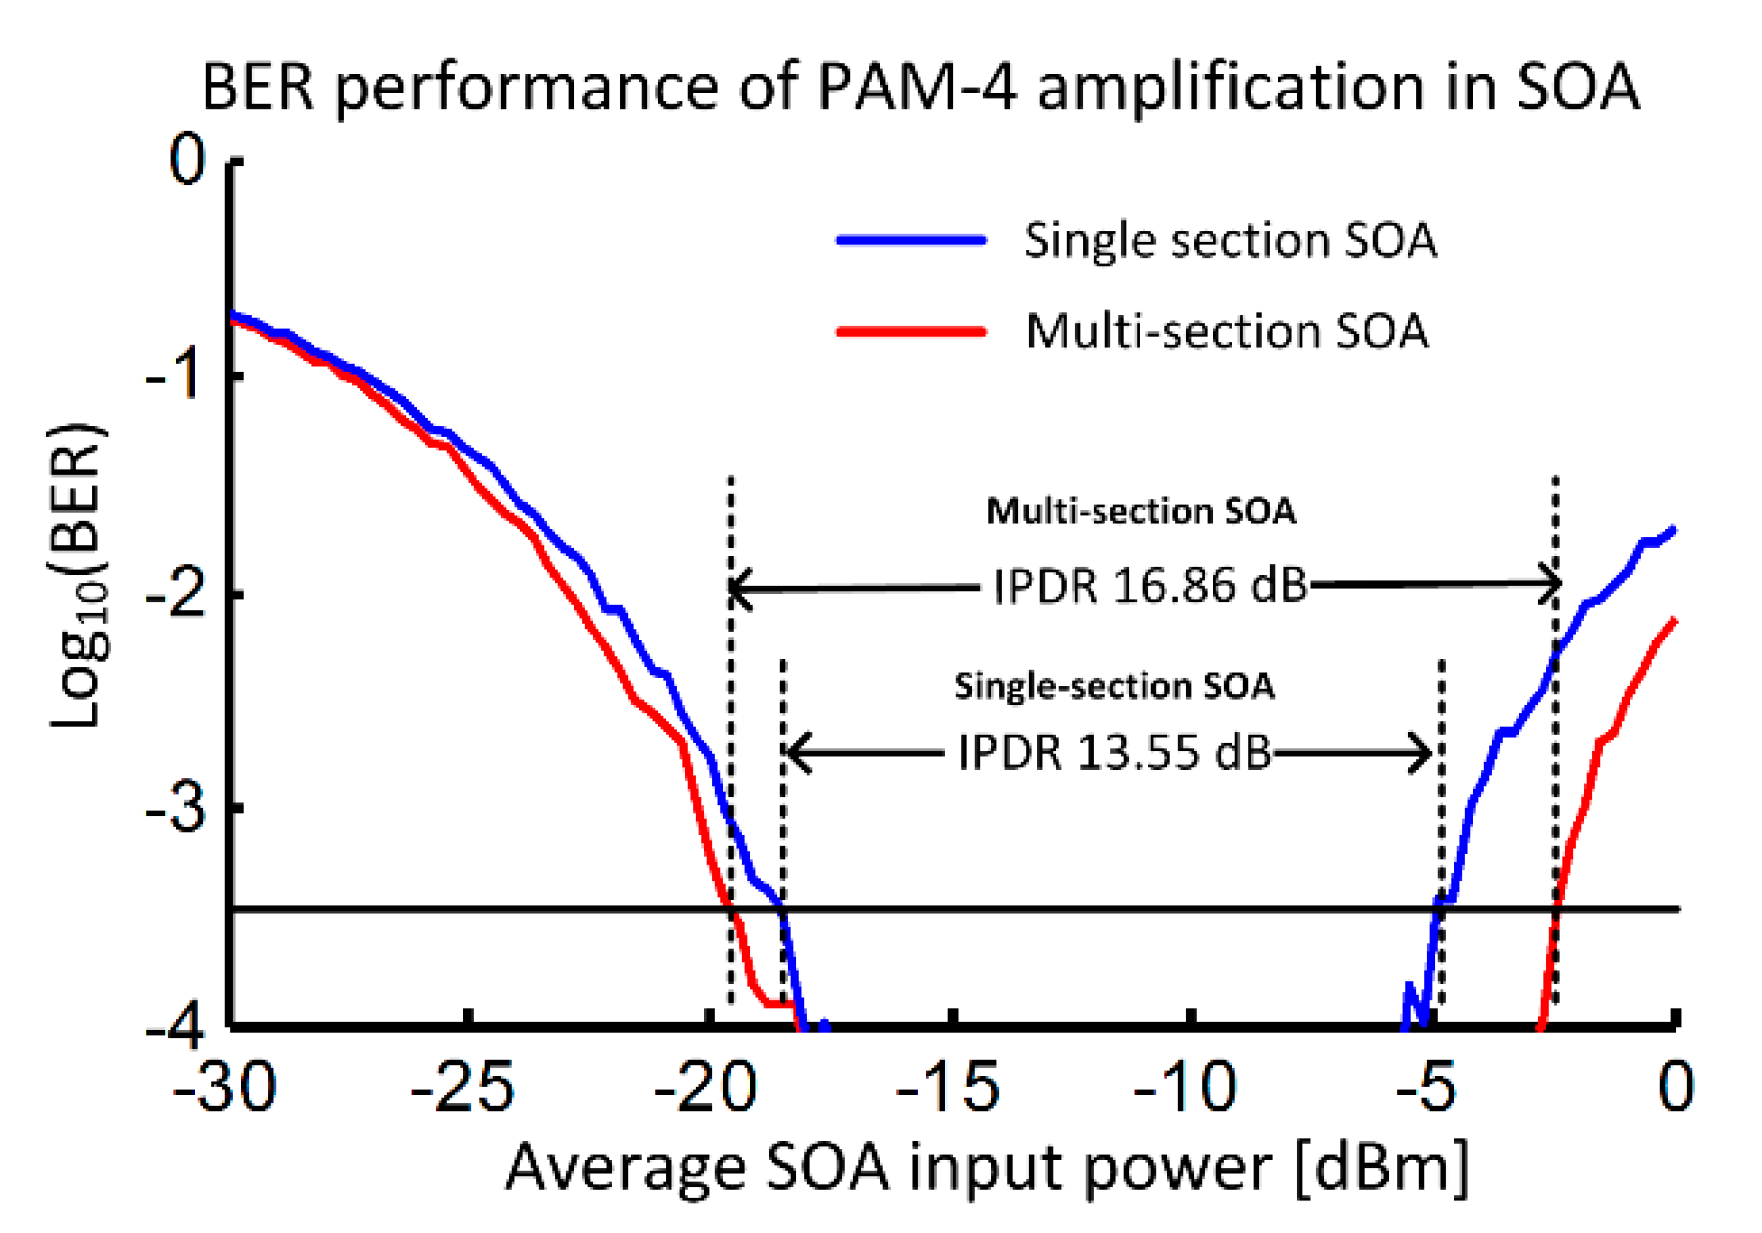
16]. The BER results are shown in
Figure 6 for a single channel scenario. The BER is large for low input powers below −30 dBm because the ASE dominates, and the BER reduces sharply as the power is increased. The BER is just greater than 10
−3 at −20 dBm which is in-line with experimental results [
15]. The multi-section SOA gives a 0.84 dB sensitivity improvement on the lower power side compared to a single-section SOA due to the lower effective NF of the multi-section SOA. As the power increases, the ASE no longer limits performance and BERs <10
−4 are achieved. However, as the power increases above −5 dBm, the BER increases sharply due to signal distortion caused by the SOA gain saturation. The multi-section SOA performs better than a single section SOA because of increased effective
. These findings are in line with an experimental study of the saturation characteristics of multisection SOAs that showed picosecond pulses suffer less distortion than regular single section SOAs [
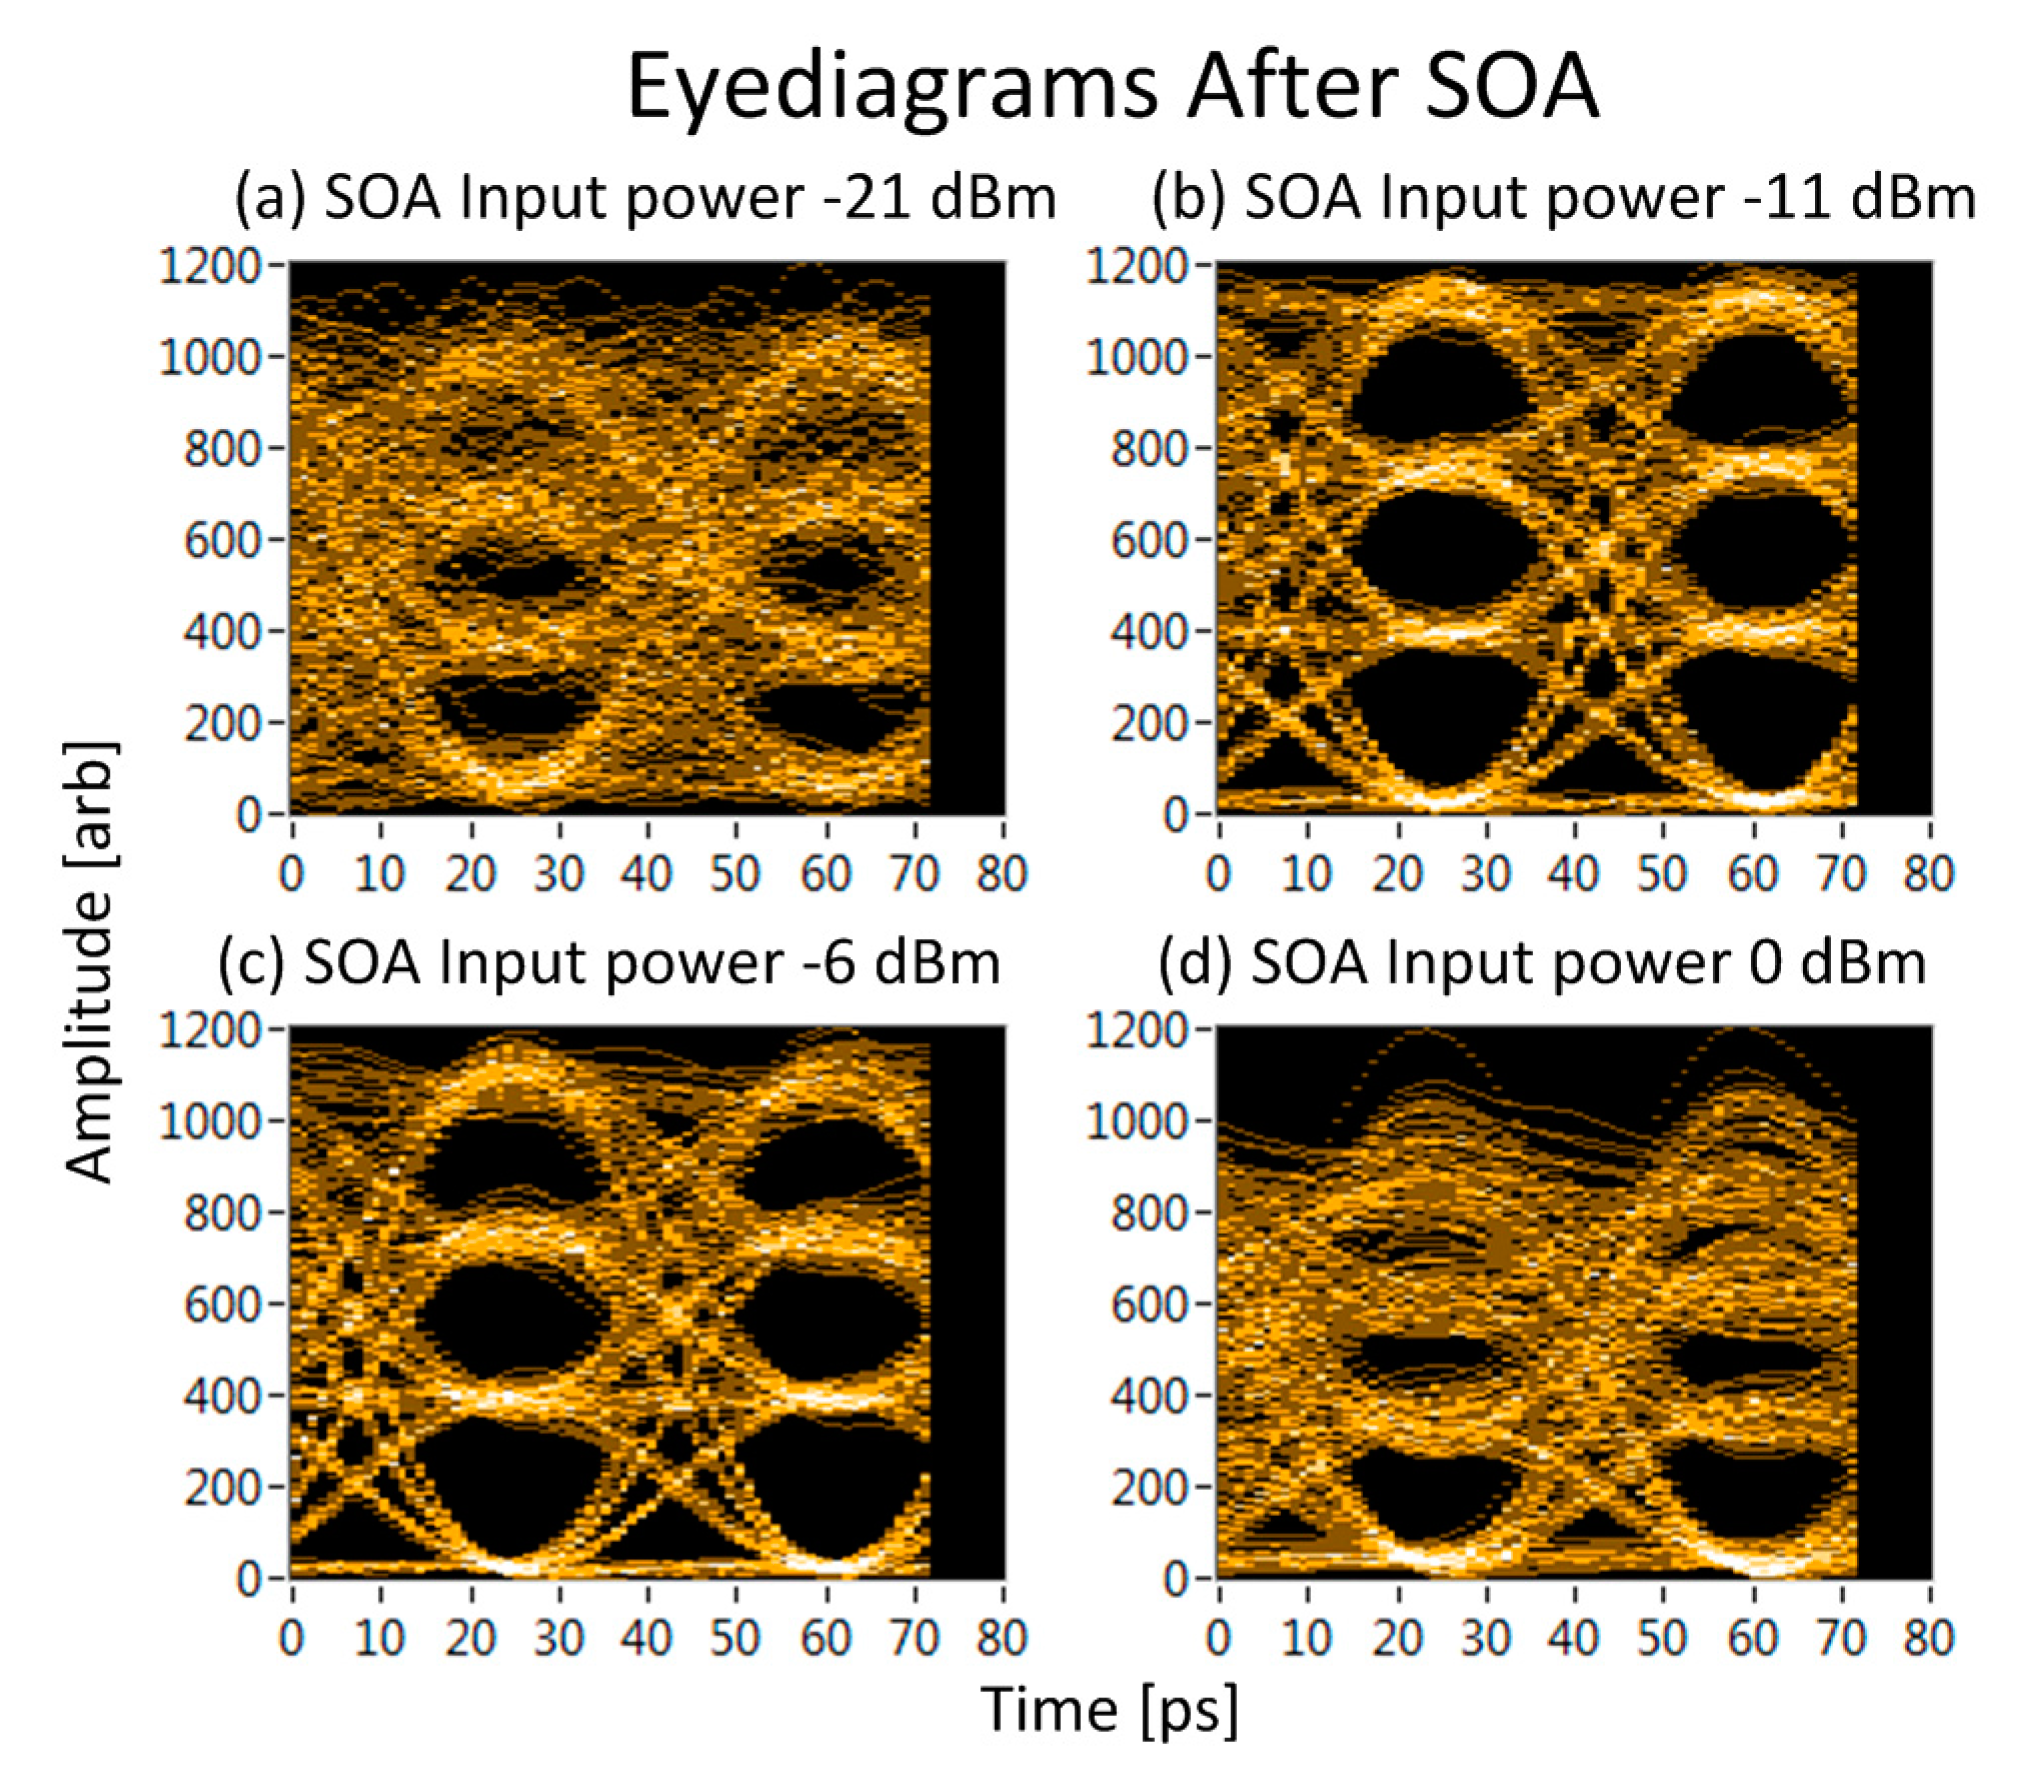
20]. We use the IPDR to explicitly quantify the improvement in the signal quality after SOA amplification. The IPDR gives the range of input powers over which the BER remains below that of the forward error correcting algorithm. The calculated IPDR is 13.55 dB for single section SOA and 16.85 dB for a multi-section SOA resulting in a 3.3 dB improvement in the IPDR. To visualize the signal quality at the output of the SOA we plot the eyediagrams of the PAM4 signal for different input powers to the multi-section SOA. In
Figure 7a, we show the eyediagram for a low input power of −21 dBm, the signal is corrupted by ASE including signal-spontaneous beat noise which is clearly worse for the stronger levels of the PAM4 signal. In
Figure 7b, we increase the SOA input power to −11 dBm and we find a clean PAM4 signal at the SOA output and no bit errors were detected for this input power. In
Figure 7c, as the power is increasing to −6 dBm, we see that signal distortion begins to occur and when the power is increased further to 0 dBm we find that the SOA gain saturation corrupts the PAM4 signal resulting in increased BER. The signal distortion at higher input power levels is due to deterministic SOA gain saturation and signal pre-distortion techniques can be applied when modulating the PAM4 signal at the transmitter in order to avoid signal distortion [
7]. The biggest source of detection errors occurs for the upper levels, as evident in
Figure 7d; and therefore increasing the separation of the upper levels of the PAM4 signal would improve the BER performance at the higher input power levels.
4. Multichannel PAM4 Amplification Results
Data needs to be multiplexed upon multiple wavelengths to provide for high bit rate connections of 200 Gbit/s and 400 Gbit/s [
2,
3,
15], and eight separate wavelengths with 28 Gbaud PAM4 signals modulated on each are required to reach 400 Gbit/s [
3]. Our SOA model can handle multiple channels, though there is no inherent wavelength dependence of the SOA gain, refractive index, and saturation power in the model. In the absence of wavelength dependence in the SOA model, we limit ourselves to just four channels. The additional channels with each detuned from each other by a sufficient amount to avoid spectral spillage into neighbouring channels and the frequency detunings must be small enough such that the entire multi-channel bandwidth is smaller than the simulation bandwidth of 1 THz. Though, typically for datacenter applications a coarse wavelength grid of 4.5 nm (~800 GHz) is used allowing for large frequency offsets from the center of each wavelength band [
21], here we concentrate on smaller channel spacings because of the limited simulation bandwidth and lack of wavelength dependent gain and gain saturation in our model. In the complex valued optical field representation the total multi-channel field is given by:
where
is the optical field of the
th channel and
is the frequency detuning of the
th channel from the central frequency channel and
is the number of channels. We concentrate on gathering BER results for one channel (results already shown in
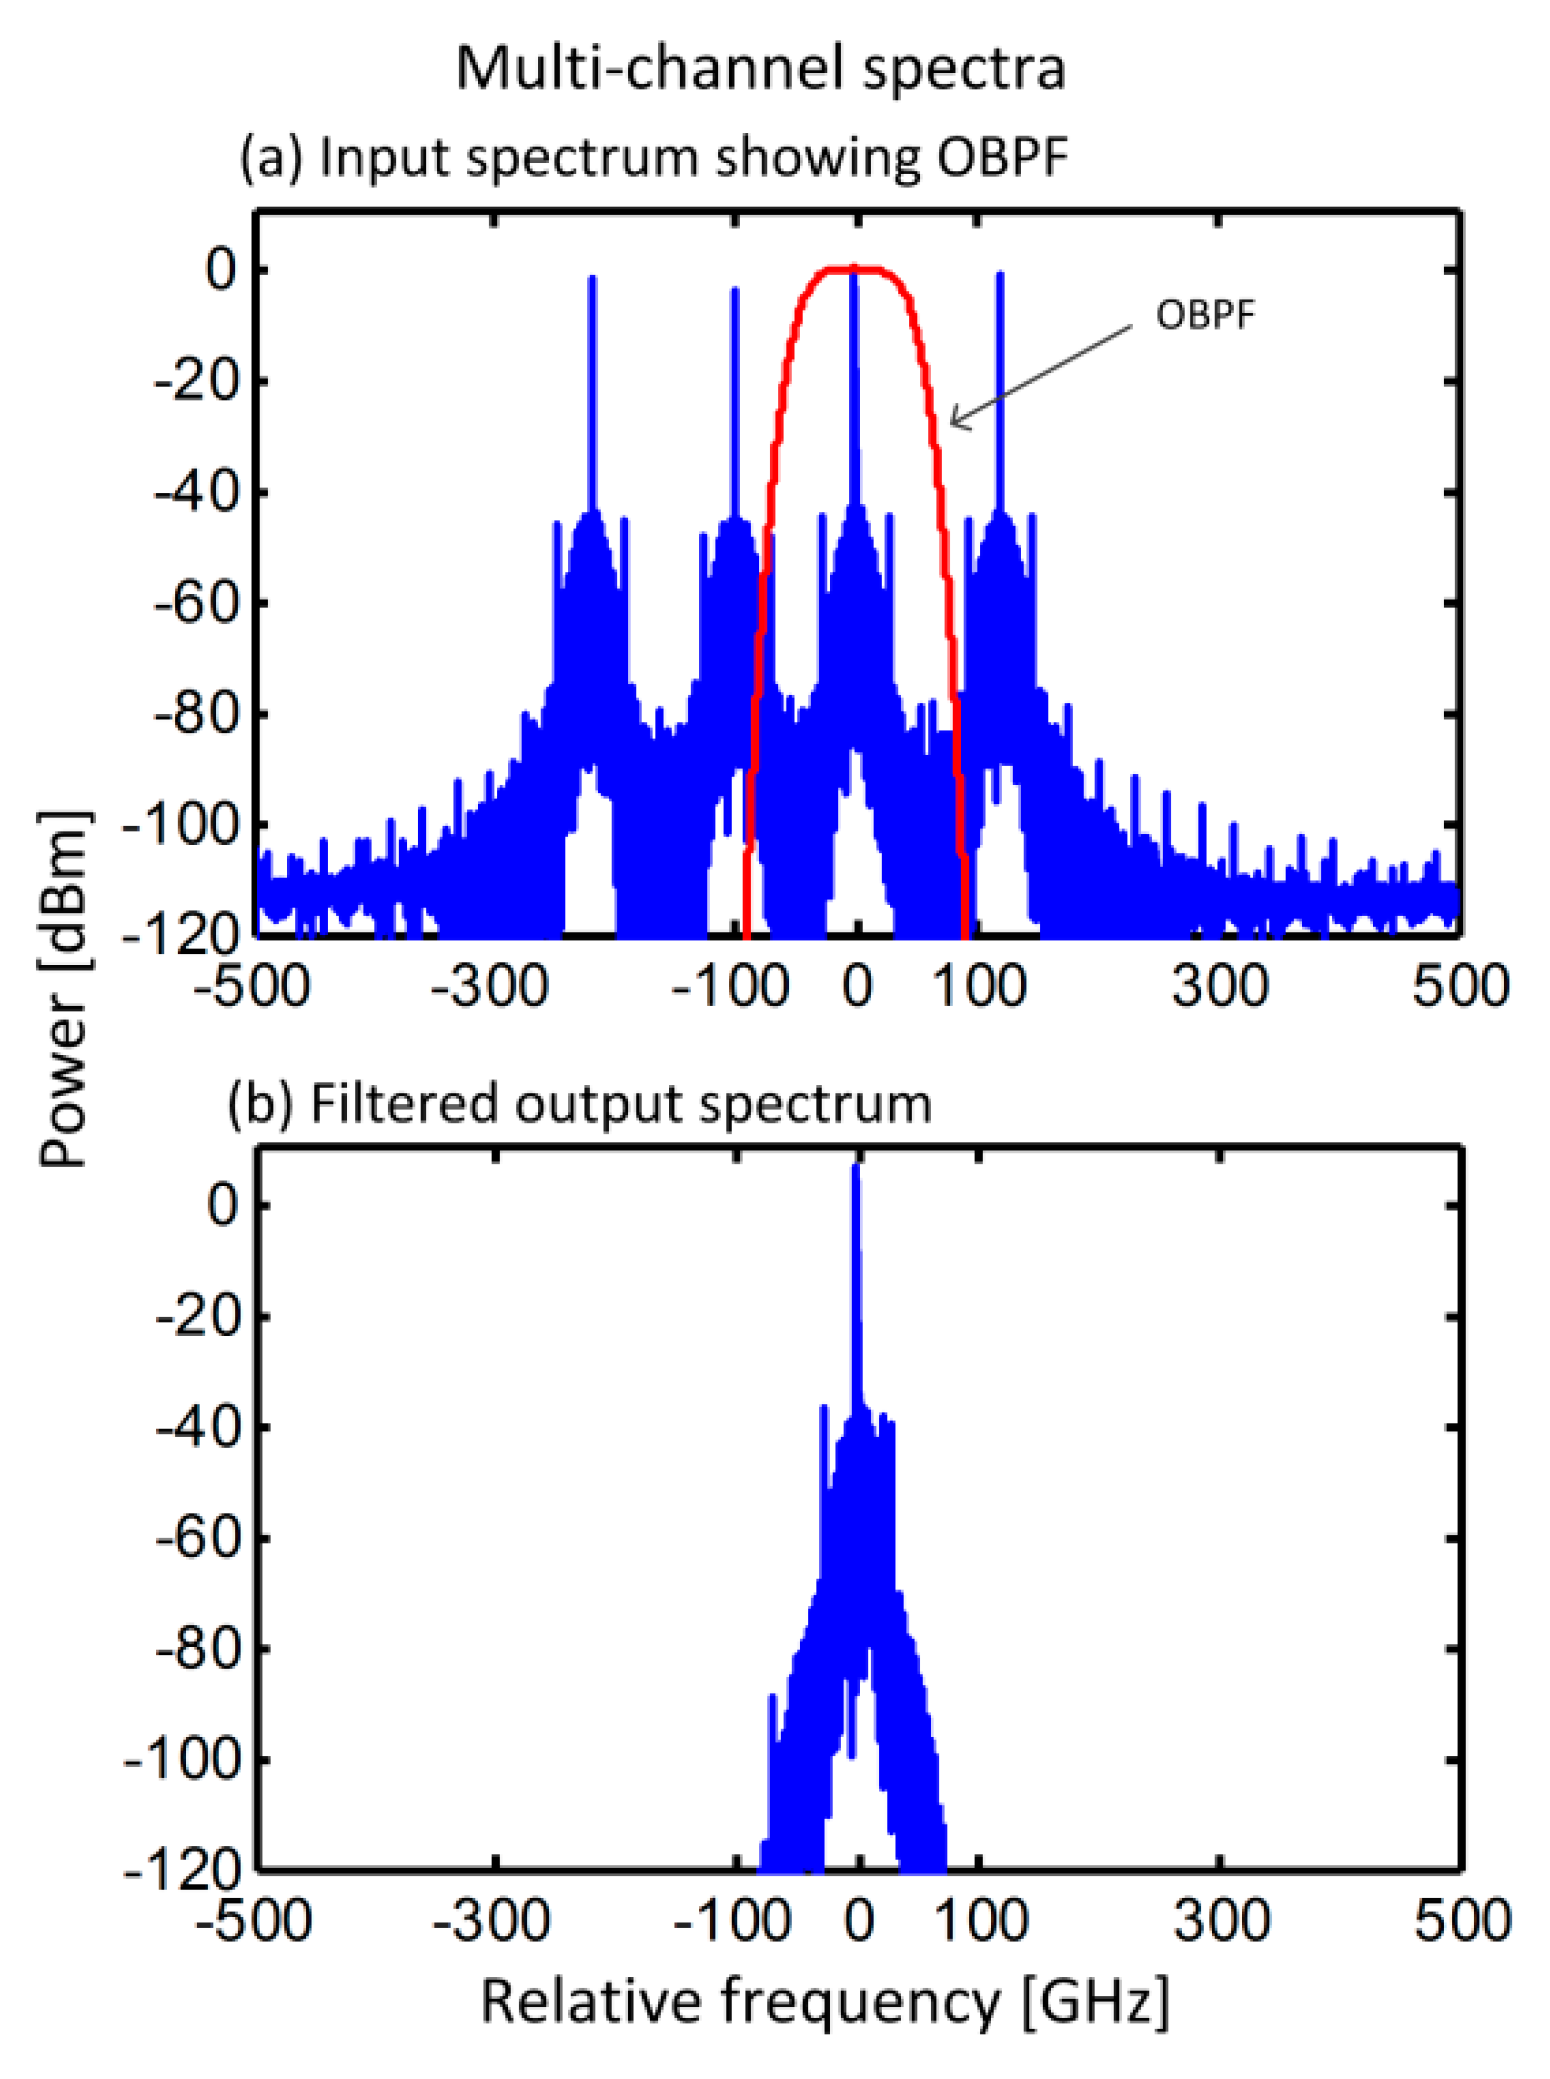
Section 3); for two channels when the detuning frequencies are 0 and 100 GHz; and for four channels when the detuning frequencies are: 0, −100, 120, and −220 GHz. The input spectrum to the SOA is shown for four channels in
Figure 8a, and each channel has an average power of 1 mW, the spectral profile of the OBPF is also shown. The filtered signal after amplification is shown in
Figure 8b to show strong rejection of neighbouring channels. These channels are well within the 1 THz simulation bandwidth with unequal channel spacings used to avoid signal impairments due to interference from four-wave mixing components. The ASE generated using (7) is already wideband over the entire simulation bandwidth and no further modifications are necessary.
We generate an optical field for one, two, and four channels using (11), a different (uncorrelated) PAM4 signal is applied to each channel and the channels are temporally delayed by a random constant delay such that the symbol transition occurring for each channel are not synchronized, i.e., both waveforms with uncorrelated symbols have non-synchronized symbol transitions, and this helps to average out the optical intensity variations and reduce the signal distortion in the SOA. The SOA gain conditions are the same as in
Section 3 for both single-section and multi-section SOAs.
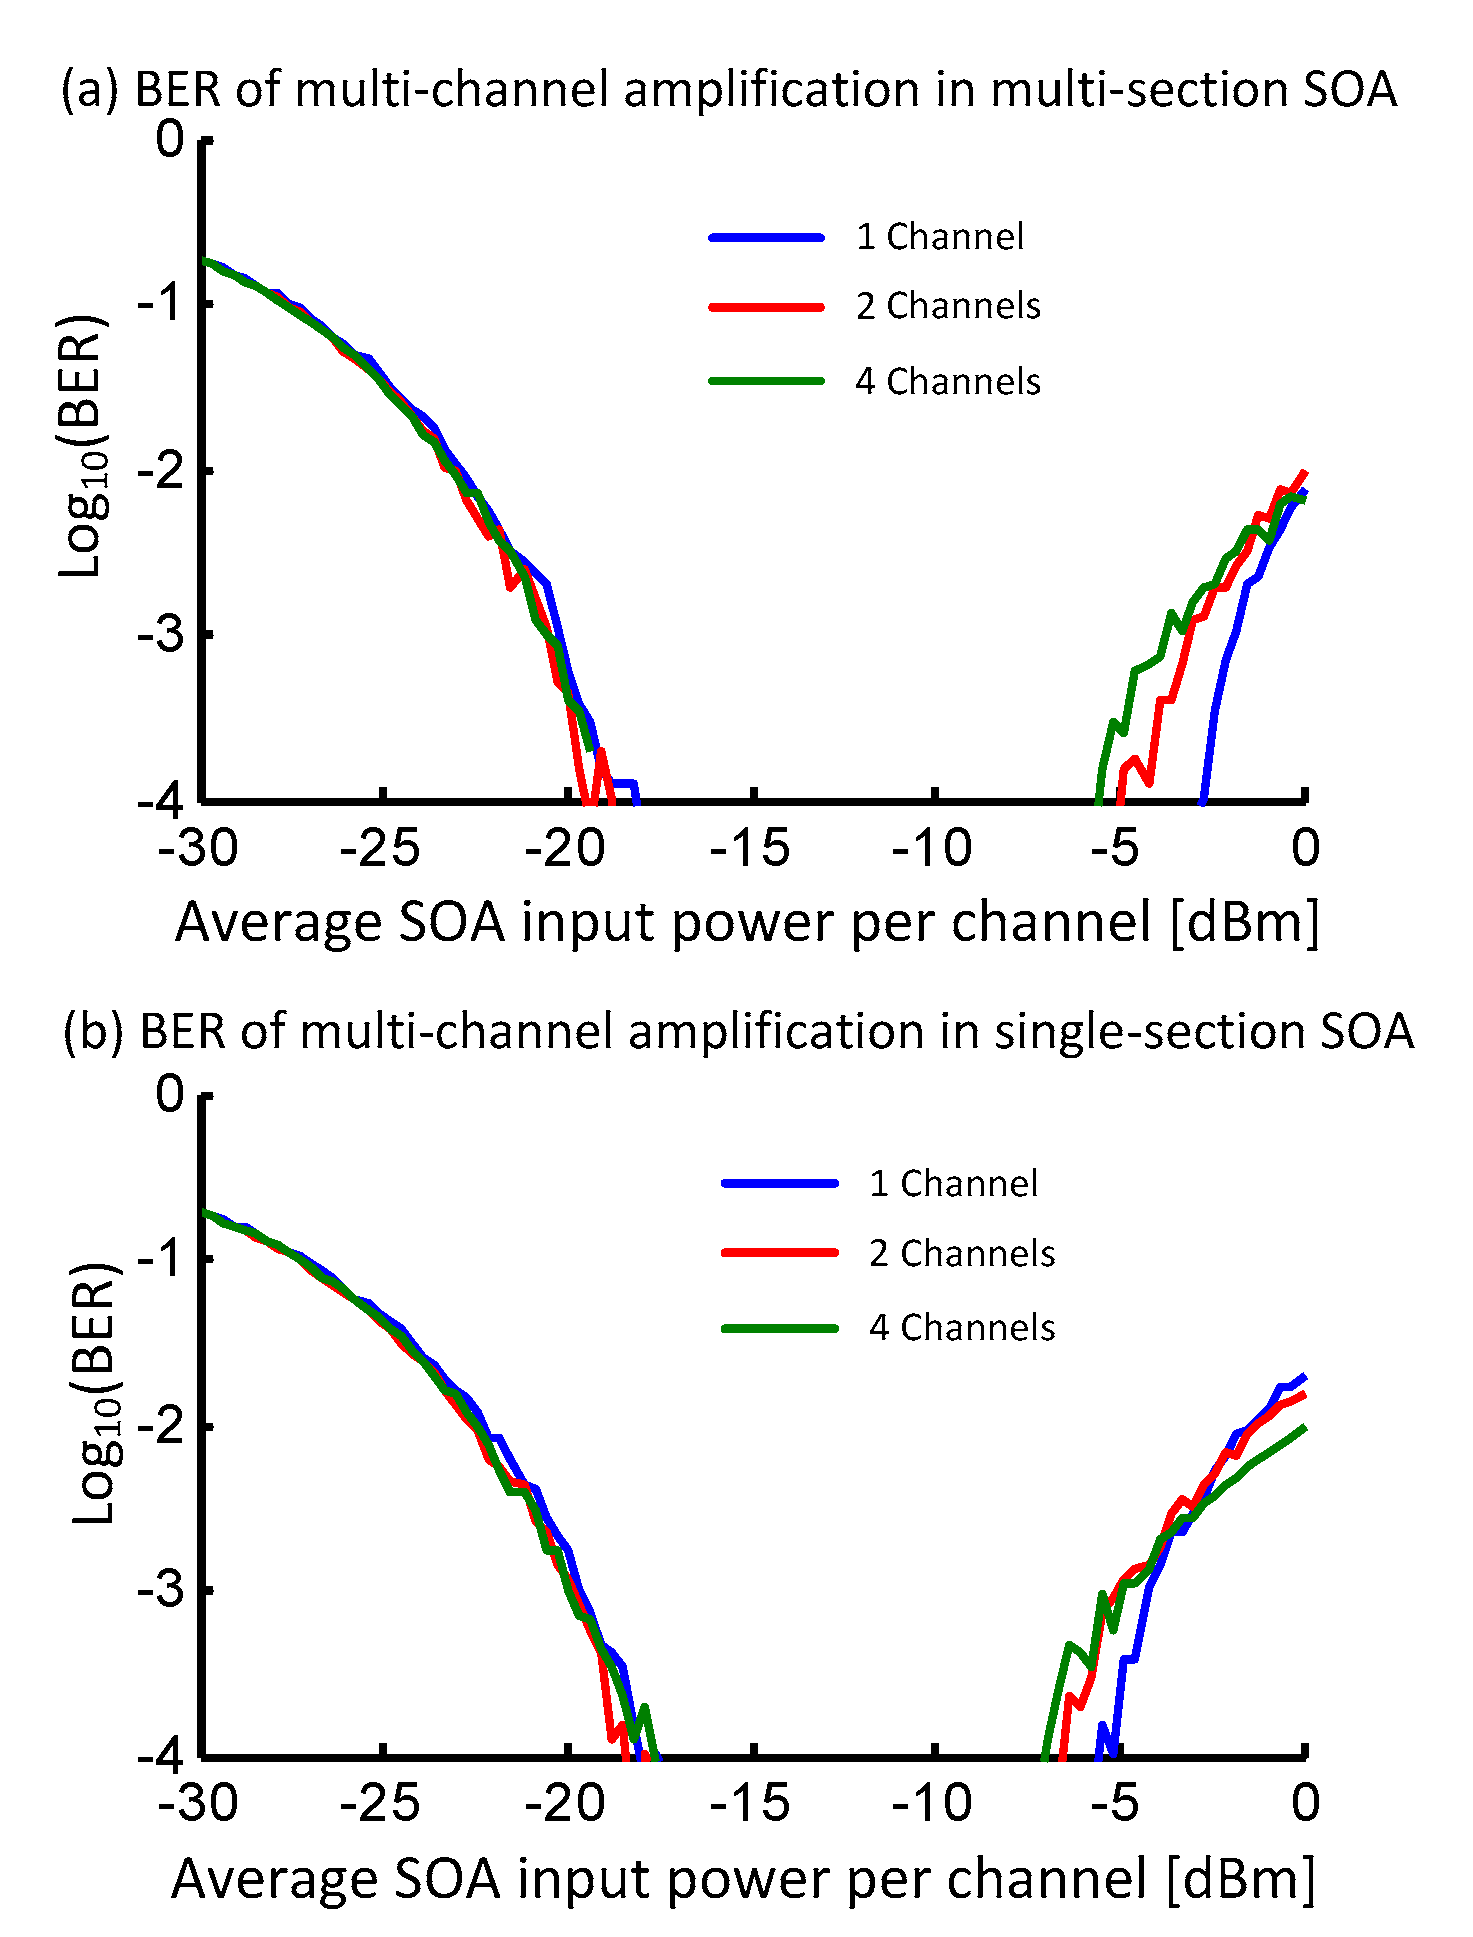
The BER results of the multi-channel amplification are shown in
Figure 9. For both SOA configurations, the BER performance is the same irrespective of the number of co-propagating channels for low input powers between −30 dBm and −18 dBm, this is unsurprising since there is no gain saturation occurring and the BER is dominated by ASE noise. When the ASE noise limits the performance, the BER of the multi-section SOA is smaller than the BER of the single-section SOA because of the lower effective NF of the multi-section SOA. Experimentally, increasing the number of co-propagating channels did not change the BER performance at low-input power levels [
15], where the BER of the central channel remained the same with no other co-propagating channels and with two other co-propagating channels. In our simulations, for the case of amplifying at higher input powers with significant gain saturation the BER worsens with increasing number of channels. There is a 3 dB reduction in the IPDR for the multi-section SOA when comparing with the amplification of four channels as opposed to amplifying a single channel; and a 2 dB reduction in the IPDR for the single-section SOA when amplifying four channels as opposed to amplifying a single channel. Nonetheless, the performance of the multi-section SOA remains better due to the larger effective saturation power of the multi-section SOA. Also from
Figure 9 we notice that there seems to be a cross-over point in the BER performance when the multi-channel BER outperforms the single channel BER; for the single section SOA this occurs at −4 dBm, and for the multi-section SOA this occurs above 0 dBm. The crossover point occurs because the power fluctuations are smoothed out due to the increased number of channels that results in reduced intensity fluctuations on individual channels. Though in comparison with the experimental results for amplifying PAM4 signals in SOA [
15] for three channel amplification: the BER performance in [
15] is worse than presented here. The channel spacings used in [
15] were much greater than those considered here and the discrepancies could be due to the inevitable wavelength dependent gain and gain saturation characteristics of SOAs. Without knowledge of the exact SOA gain saturation characteristics, the channels could be closer to the gain-peak of the SOA and therefore the saturation power would be lower such that different channels will experience a different saturation power. An experimental study for amplifying a single wavelength channel and two wavelength channel systems with only 150 GHz channel separation for various modulation formats (though PAM4 as not one of them) [
9] showed one or two dB power penalty when amplifying two channels compared to the single channel scenario, and the simulation results here are in qualitative agreement those multi-channel penalties.


