Communication

Flow Cell Coupled Dynamic Light Scattering for Real-Time Monitoring of Nanoparticle Size during Liquid Phase Bottom-Up Synthesis

1
The Netherlands Organisation for Applied Scientific Research (TNO), De Rondom 1, 5612 AP Eindhoven, The Netherlands
2
Philips Innovation Labs, High Tech Campus 11, 5656 AE Eindhoven, The Netherlands
3
Department of Applied Physics, Eindhoven University of Technology, P.O. Box 513, 5600 MB Eindhoven, The Netherlands
4
LS Instruments AG, Passage du Cardinal 1, CH-1700 Fribourg, Switzerland
5
Hasselt University, Institute for Materials Research, Inorganic and Physical Chemistry, Agoralaan Building D, B-3590 Diepenbeek, Belgium
6
Zuyd University of Applied Sciences, Nieuw Eyckholt 300, Postbus 550, 6400 AN Heerlen, The Netherlands
*
Author to whom correspondence should be addressed.
Appl. Sci. 2018, 8(1), 108; https://doi.org/10.3390/app8010108
Submission received: 18 December 2017 / Revised: 7 January 2018 / Accepted: 10 January 2018 / Published: 13 January 2018
(This article belongs to the Section Nanotechnology and Applied Nanosciences)

Abstract

:

Featured Application

A unique set-up for real-time monitoring of the size of nanoparticles during bottom-up liquid phase synthesis is presented in this article. The analysis method applied to study the size of dispersed nanoparticles during synthesis is dynamic light scattering (DLS). In contrast to conventional DLS, the DLS set-up presented in this article comprises a modulated 3D cross correlation geometry, and therefore allows accurate measurements of particle size in flow at flow rates of at least up to 17 mL∙min−1. This is essential for obtaining real-time information on the size of the dispersed nanoparticles. The DLS system could be connected to reactors of various sizes using the analysis loop presented in this article, which is coupled to a flow cell in the DLS set-up. Thus, the DLS set-up presented here is suited to study the nucleation and growth of nanoparticles in dispersion, facilitates a rational scale-up, and allows intervention in the production process of nanoparticle dispersions to minimize the number of off-spec batches.

Abstract

To tailor the properties of nanoparticles and nanocomposites, precise control over particle size is of vital importance. Real-time monitoring of particle size during bottom-up synthesis in liquids would allow a detailed study of particle nucleation and growth, which provides valuable insights in the mechanism of formation of the nanoparticles. Furthermore, it facilitates a rational scale-up, and would enable adequate intervention in the production process of nanoparticle dispersions to minimize the number of off-spec batches. Since real-time monitoring requires particle size measurements on dispersions in flow, conventional dynamic light scattering (DLS) techniques are not suited: they rely on single scattering and measure the Brownian motion of particles dispersed in a liquid. Here, we present a set-up that allows accurate measurements in real-time on flowing dispersions using a DLS technique based on modulated 3D cross-correlation. This technique uses two simultaneous light scattering experiments performed at the same scattering vector on the same sample volume in order to extract only the single scattering information common to both. We connected the reactor to a flow-cell in the DLS equipment using a tailor-made analysis loop, and successfully demonstrated the complete set-up through monitoring of the size of spherical silica nanoparticles during Stöber synthesis in a water-alcohol mixture starting from the molecular precursor tetraethyl orthosilicate.

1. Introduction

To tailor the properties of nanoparticles and composite materials comprising such nanoparticles, control of the particle size is of vital importance. Nanoparticles are used in products for a wide variety of applications ranging from performance polymers to pharmaceutics, food ingredients, cosmetics and coatings and paints [1,2,3,4,5,6]. Very often, such well-defined nanoparticles are produced in bottom-up liquid phase syntheses using e.g., redox or sol-gel type reactions. A detailed study of the nucleation and growth of such particles would provide valuable information on their mechanism of formation, and could furthermore be used for process optimization and scale up. For such a study, real-time measurements of the particle size are required. For production scale synthesis, such real-time measurements could also provide data that enable rational intervention in a production process, hence minimizing the number of off-spec batches and waste.
Dynamic Light Scattering (DLS) is the standard technique for determining the size of nanoparticles in the range of a few nanometers to a few microns dispersed in liquids [7,8]. It makes use of a laser to study the time dependent scattering of small particles in liquid dispersions. Since such particles undergo Brownian motion, the distance between the scattering particles in the liquid constantly changes, which results in a fluctuating scattering intensity [9]. Analysis of these fluctuations yields information about the average size and size distribution of the nanoparticles. Since in conventional DLS experiments no external flow is imposed on the dispersion, the fluctuating scattering intensity solely correlates to the diffusion of particles, and does not comprise translational information. It can thus be used to determine the diffusion coefficients of the particles, and from that the particle size distribution through use of the Stokes-Einstein equation. Consequently, such conventional DLS techniques do not allow for real-time measurements on flowing or moving dispersions.
DLS measurements rely on single scattering, which means that each photon should only be scattered once in the dispersion sample before it reaches the detector. Since this requires low particle concentrations, dispersion samples typically require dilution with additional solvent which is inconvenient and may even influence the state of the dispersed colloids. To overcome this, a significant amount of research was performed in the past decade focusing on suppressing multiple scattering. It showed that multiple scattering suppression in DLS measurements can e.g., be accomplished by using two lasers operating at different wavelengths, and two detectors having distinct bandpass filters to capture scattering information from each single laser. This technique is generally referred to as two-color DLS [10]. Another more simple and robust arrangement of the beam-detector pairs is possible by displacing them symmetrically in a third dimension above and below the scattering plane, which is known as the three-dimensional (3D) cross-correlation geometry [11]. Using this geometry, two scattering experiments are performed at the same time and on the same scattering volume using two beams and two detectors. The signals seen by the detectors are cross-correlated, and only photons that are scattered once will produce correlated intensity fluctuations on both detectors. In that way, the information on single scattered photons can be extracted, and used to determine that particle size distribution in turbid dispersions. However, an important drawback of this 3D technique is that each photon detector not only receives the desired information from its correspondingly positioned laser, but also undesired information from the second laser. Thus, cross-talk occurs between the two light scattering experiments. This drawback is overcome through temporal isolation of the two beam-detector pairs in modulated 3D cross-correlation DLS.
Real-time DLS measurements moreover are challenging since a flow is imposed on the dispersion in laboratory and pilot-scale reactors, e.g., through stirring or pumping. Accurate particle sizing using DLS usually necessitates a resting fluid in the measured sample [12]. In actively mixed fluids, the diffusion is overlaid by a turbulent convection which prohibits diffusion measurements.
Here, we demonstrate a set-up based on modulated 3D cross-correlation DLS, which is capable of separating the scattering information resulting from diffusional and translational motion of particles, and consequently allows flow cell coupled measurements on flowing nanoparticle dispersions [13]. In this setup, we pump a particle dispersion from the reactor through an analysis loop comprising a flow cell, and back into the reactor.
We successfully validated the set-up presented in this article through monitoring of the size of spherical silica (SiO2) nanoparticles during Stöber synthesis starting from the molecular precursor tetraethyl orthosilicate (TEOS). Conventional off-line DLS on non-moving liquid dispersions using a state of art DLS instrument, and transmission electron microscopy (TEM) are used to validate the particle size information obtained with our newly developed flow cell coupled DLS instrument.

2. Materials and Methods

2.1. Materials

Ethanol (EtOH) was obtained from Biosolve (Valkenswaard, The Netherlands) and used without further purification. Tetraethyl orthosilicate (TEOS), potassium chloride (KCl) and ammonia (NH3, 30–33% in water) were obtained from Sigma Aldrich (Zwijndrecht, The Netherlands) and used without further purification.

2.2. Synthesis

As prototypical liquid phase bottom-up nanoparticle synthesis to demonstrate the capability of our real-time monitoring set-up, we selected the Stöber synthesis of spherical silica nanoparticles. This sol-gel synthesis is performed in water-alcohol mixtures. Under ambient conditions, the particles are formed through hydrolysis of TEOS and subsequent polycondensation over a period of several hours. Two sizes of silica nanoparticles were prepared following the procedures reported by Khan et al. [14] and Sato-Berru et al. [15]. For the preparation of silica particles with a radius of approximately 20 nm [9], referred to as “small particles”, EtOH (35 mL) and NH3 (3.0 mL) were mixed, after which a mixture of TEOS (6.0 mL) in EtOH (40 mL) was added under stirring. The experiment was carried out at room temperature under magnetic stirring at 500 rpm for 5 h. For the preparation of silica particles with a radius of approx. 150 nm [10], referred to as “large particles”, EtOH (45 mL), demineralized water (5.0 mL) and NH3 (3.0 mL) were mixed for 5 minutes, after which TEOS (1.5 mL) was added. This experiment was carried out at room temperature under magnetic stirring at 500 rpm for 3 h.

2.3. Analyses

2.3.1. Flow Cell Coupled DLS for Application in Real-Time Measurements of Nanoparticle Dispersions

For flow cell coupled real-time measurements of nanoparticle dispersions, we used a DLS set-up based on the 3D cross correlation geometry, as developed by LS Instruments. This set-up comprises a laser which emits light at a wavelength of 685 nm. This light is emitted and directed at the dispersion through a polarization-maintaining optical fiber. The light scattered by the nanoparticles at 90° with respect to the incident beam, and is collected by a second optical fiber. The latter is connected to a single-photon avalanche diode (SPAD) and the signal is analyzed by a LSI Correlator (LS Instruments). In combination with a flow cell, the DLS unit equipped with LsLab software version 1.0.4.0. was used for real-time particle size measurements. To perform measurements on moving liquid dispersions, a tailored analysis loop was prepared and applied to couple the DLS instrument to a stirred 2 L double-walled glass tank reactor. The DLS instrument was integrated in the analysis loop in direct connection with the stirred tank reactor, and adapted to accommodate a flow cell including tubing material to enable real-time measurements. A direct connection of the sample cell to the reactor via a tubing system, however, could easily transmit vibrations which would affect the particle motion in the liquid. For this reason, it was necessary to decouple and reduce the vibrations sufficiently, such that the Brownian motion of particles in the measured sample volume can be detected.
Directly after the addition of precursor to the reaction mixture and start of the sol-gel reaction to form nanoparticles, the dispersion was pumped with a speed of 12.9 mL·min−1 through the DLS flow cell (type Starna, 71-F/Q/10) using a Watson pump with flexible tubing (type Inacom Tygon R3607, inner tubing diameter 2.79 mm), after which the measurement was started. The particle dispersion circulates through the flow cell back into the reaction mixture.

2.3.2. Off-Line Dynamic Light Scattering on Non-Moving Liquid Dispersion

For off-line DLS measurements on non-moving liquid dispersions, we used a Malvern Zetasizer Nano ZS (ZEN 3600, λ = 633 nm, θ = 173°, Malvern, United Kingdom) as a reference. For the measurement on non-moving dispersions, 2.0 mL was taken out of the reaction mixture and inserted in a polymer cuvette after which the cuvette is directly placed in the DLS instrument and the measurement is performed. The temperature was set to 25 °C, and the viscosity and refractive index values used were that of pure ethanol. For each measurement data were acquired during 30 s in three runs.

2.3.3. Transmission Electron Microscopy

Particle size measurements of the newly developed instrument were compared to measurements obtained through transmission electron microscopy (TEM). The dimensions and composition of the particles were determined by TEM using a JEOL ARM200F (Tokyo, Japan) operated at 80 kV. To prepare samples for analysis, 4.0 μL of the particle dispersion in ethanol was placed on a copper grid coated with carbon. The grid was placed on a filter paper to absorb liquid flowing through the perforated film, and the sample was left to dry in air for a few minutes before being stored in a plastic container prior to the TEM analysis. All images were acquired in High Angle Annular Dark Field (HAADF)—Scanning TEM mode, allowing for a clear contrast between silica and the carbon support film because of the difference in atomic number. Simultaneous energy dispersive X-ray (EDX) analysis was used to confirm the constituents of the particles.

3. Results and Discussion

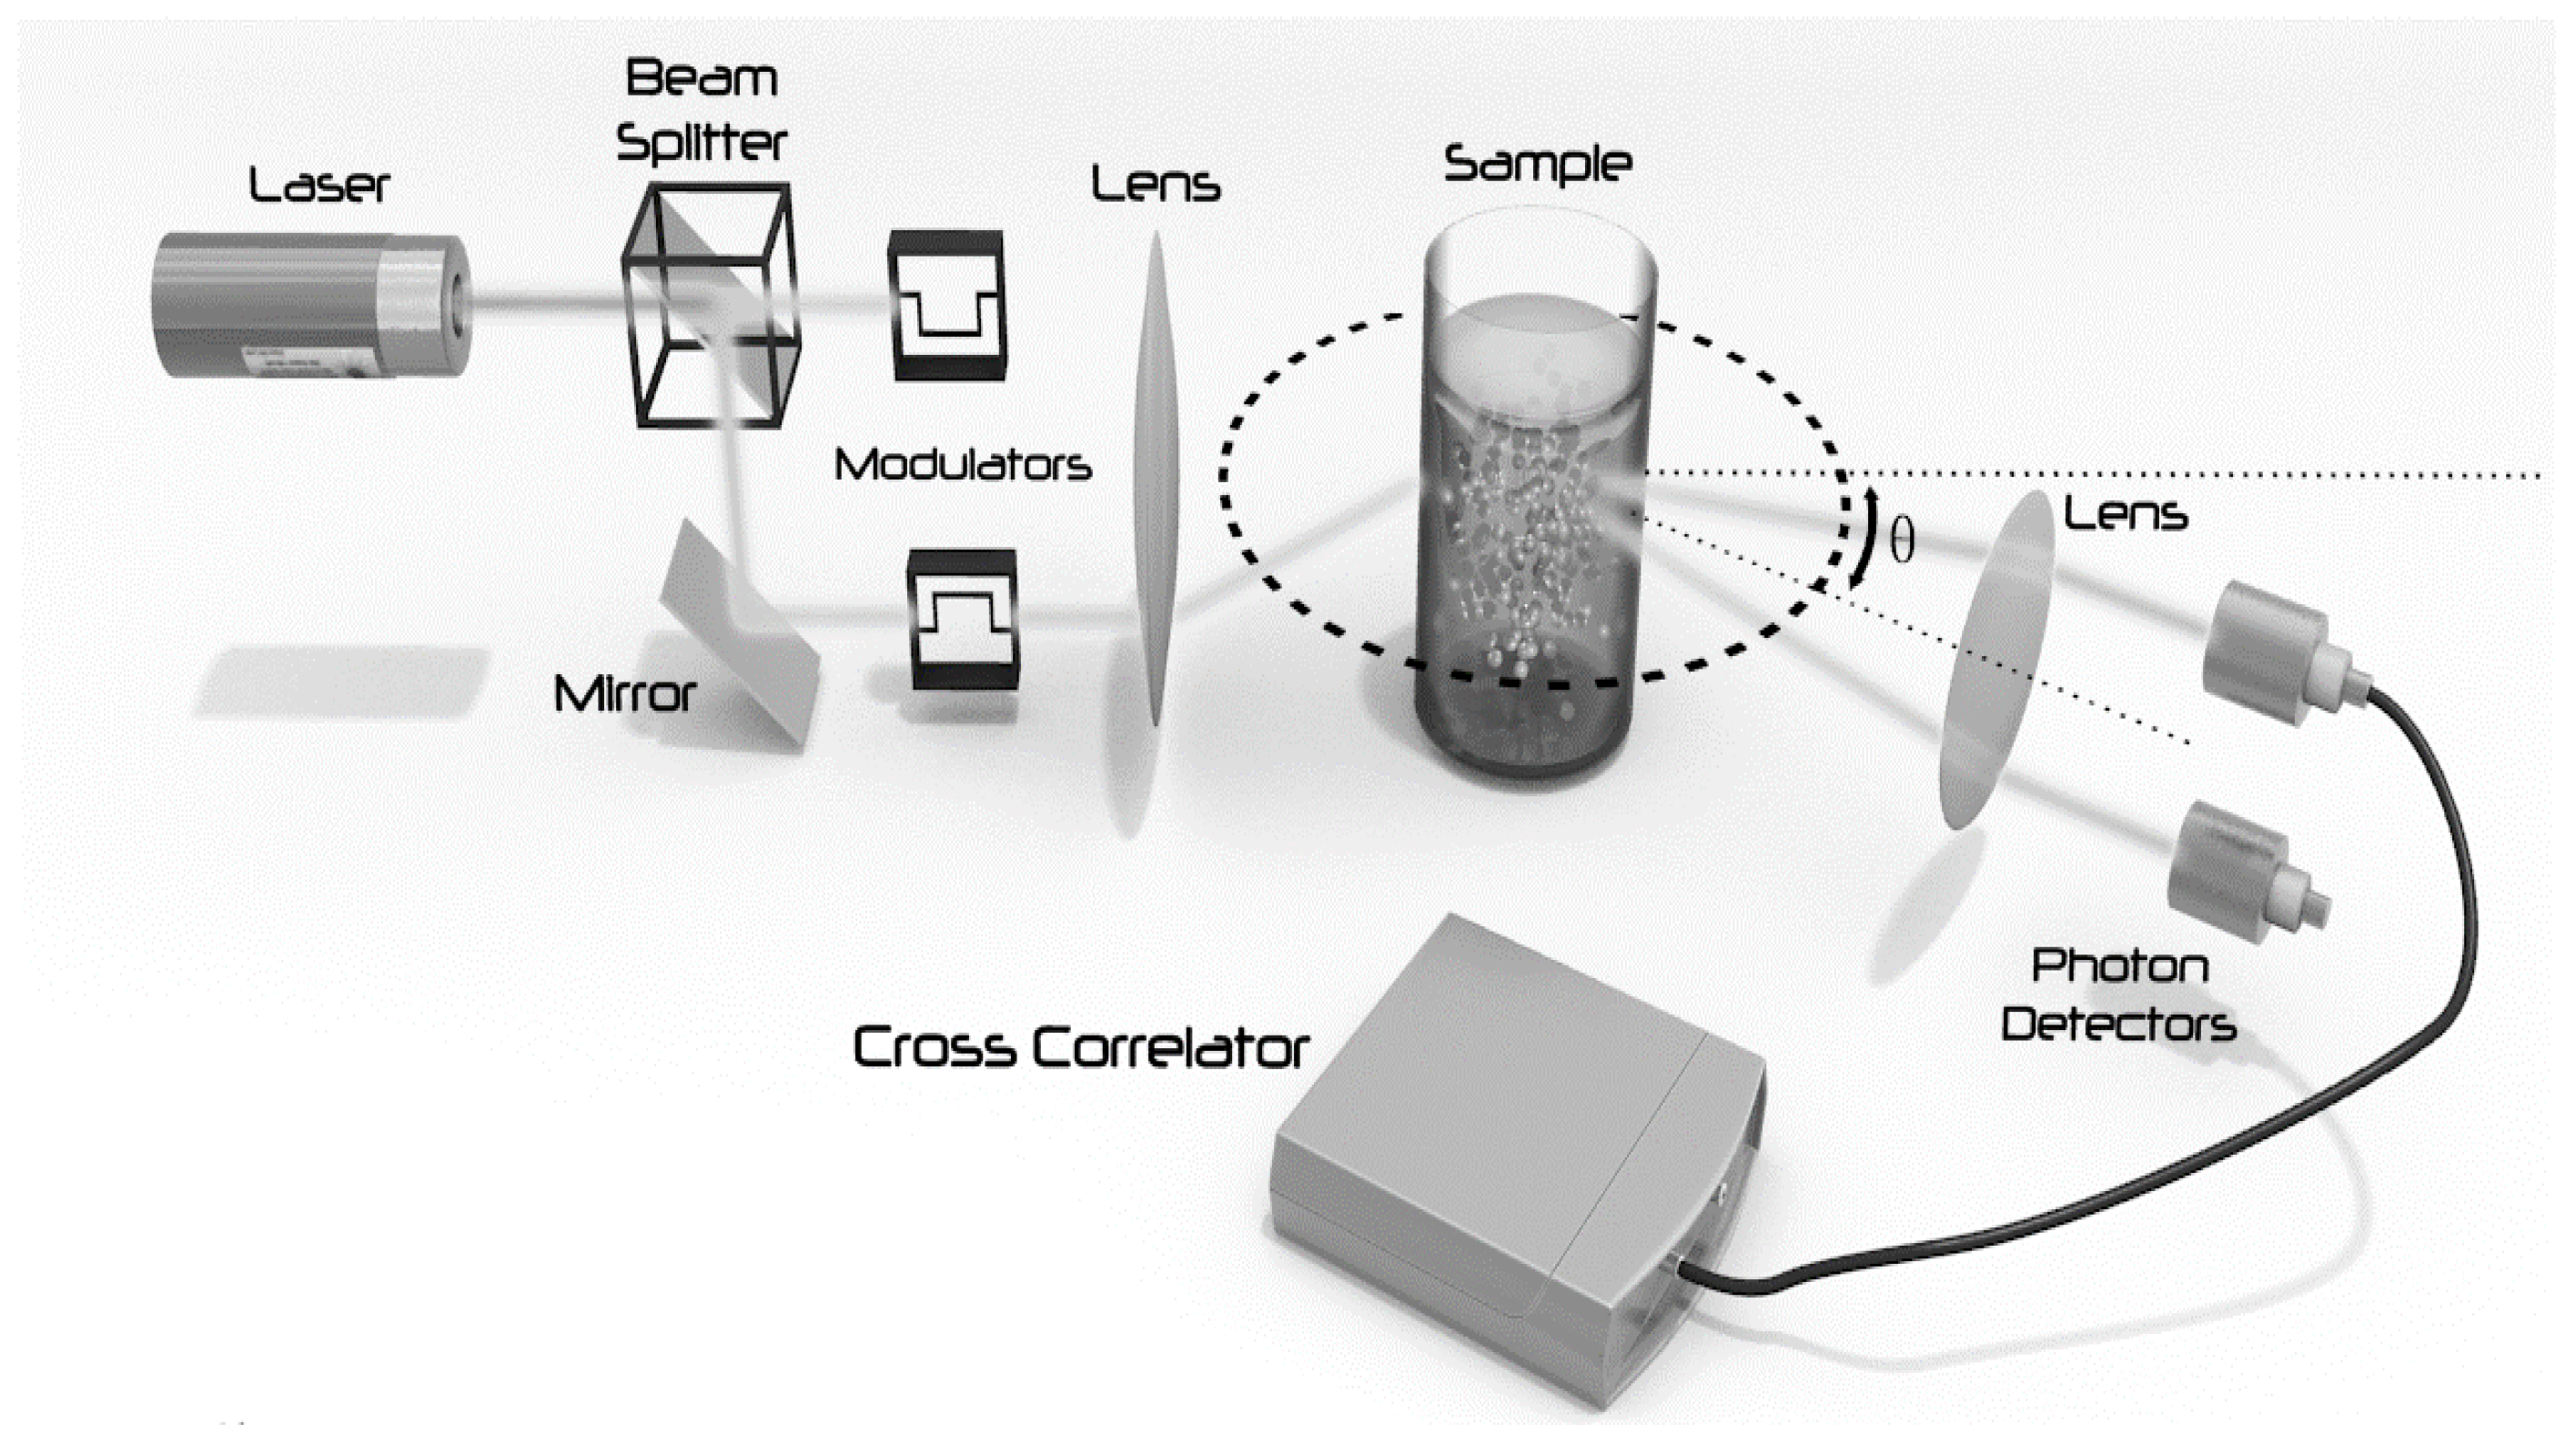
The aim of our work was to design, build and validate a set-up for flow cell coupled DLS measurements that enables real-time monitoring of the size of nanoparticles during liquid phase synthesis. For flow cell coupled real-time measurements of dispersions, we used a DLS unit equipped with the 3D cross correlation geometry (the unit is based on the commercially available NanoLab 3D, LS Instruments AG, Fribourg, Switzerland). The technology applied in this instrument is based on two simultaneous light scattering experiments performed at the same scattering vector on the same sample volume in order to extract only the single scattering information common to both (Figure 1). It enables short measurement acquisition times (dark counts <250 s−1).
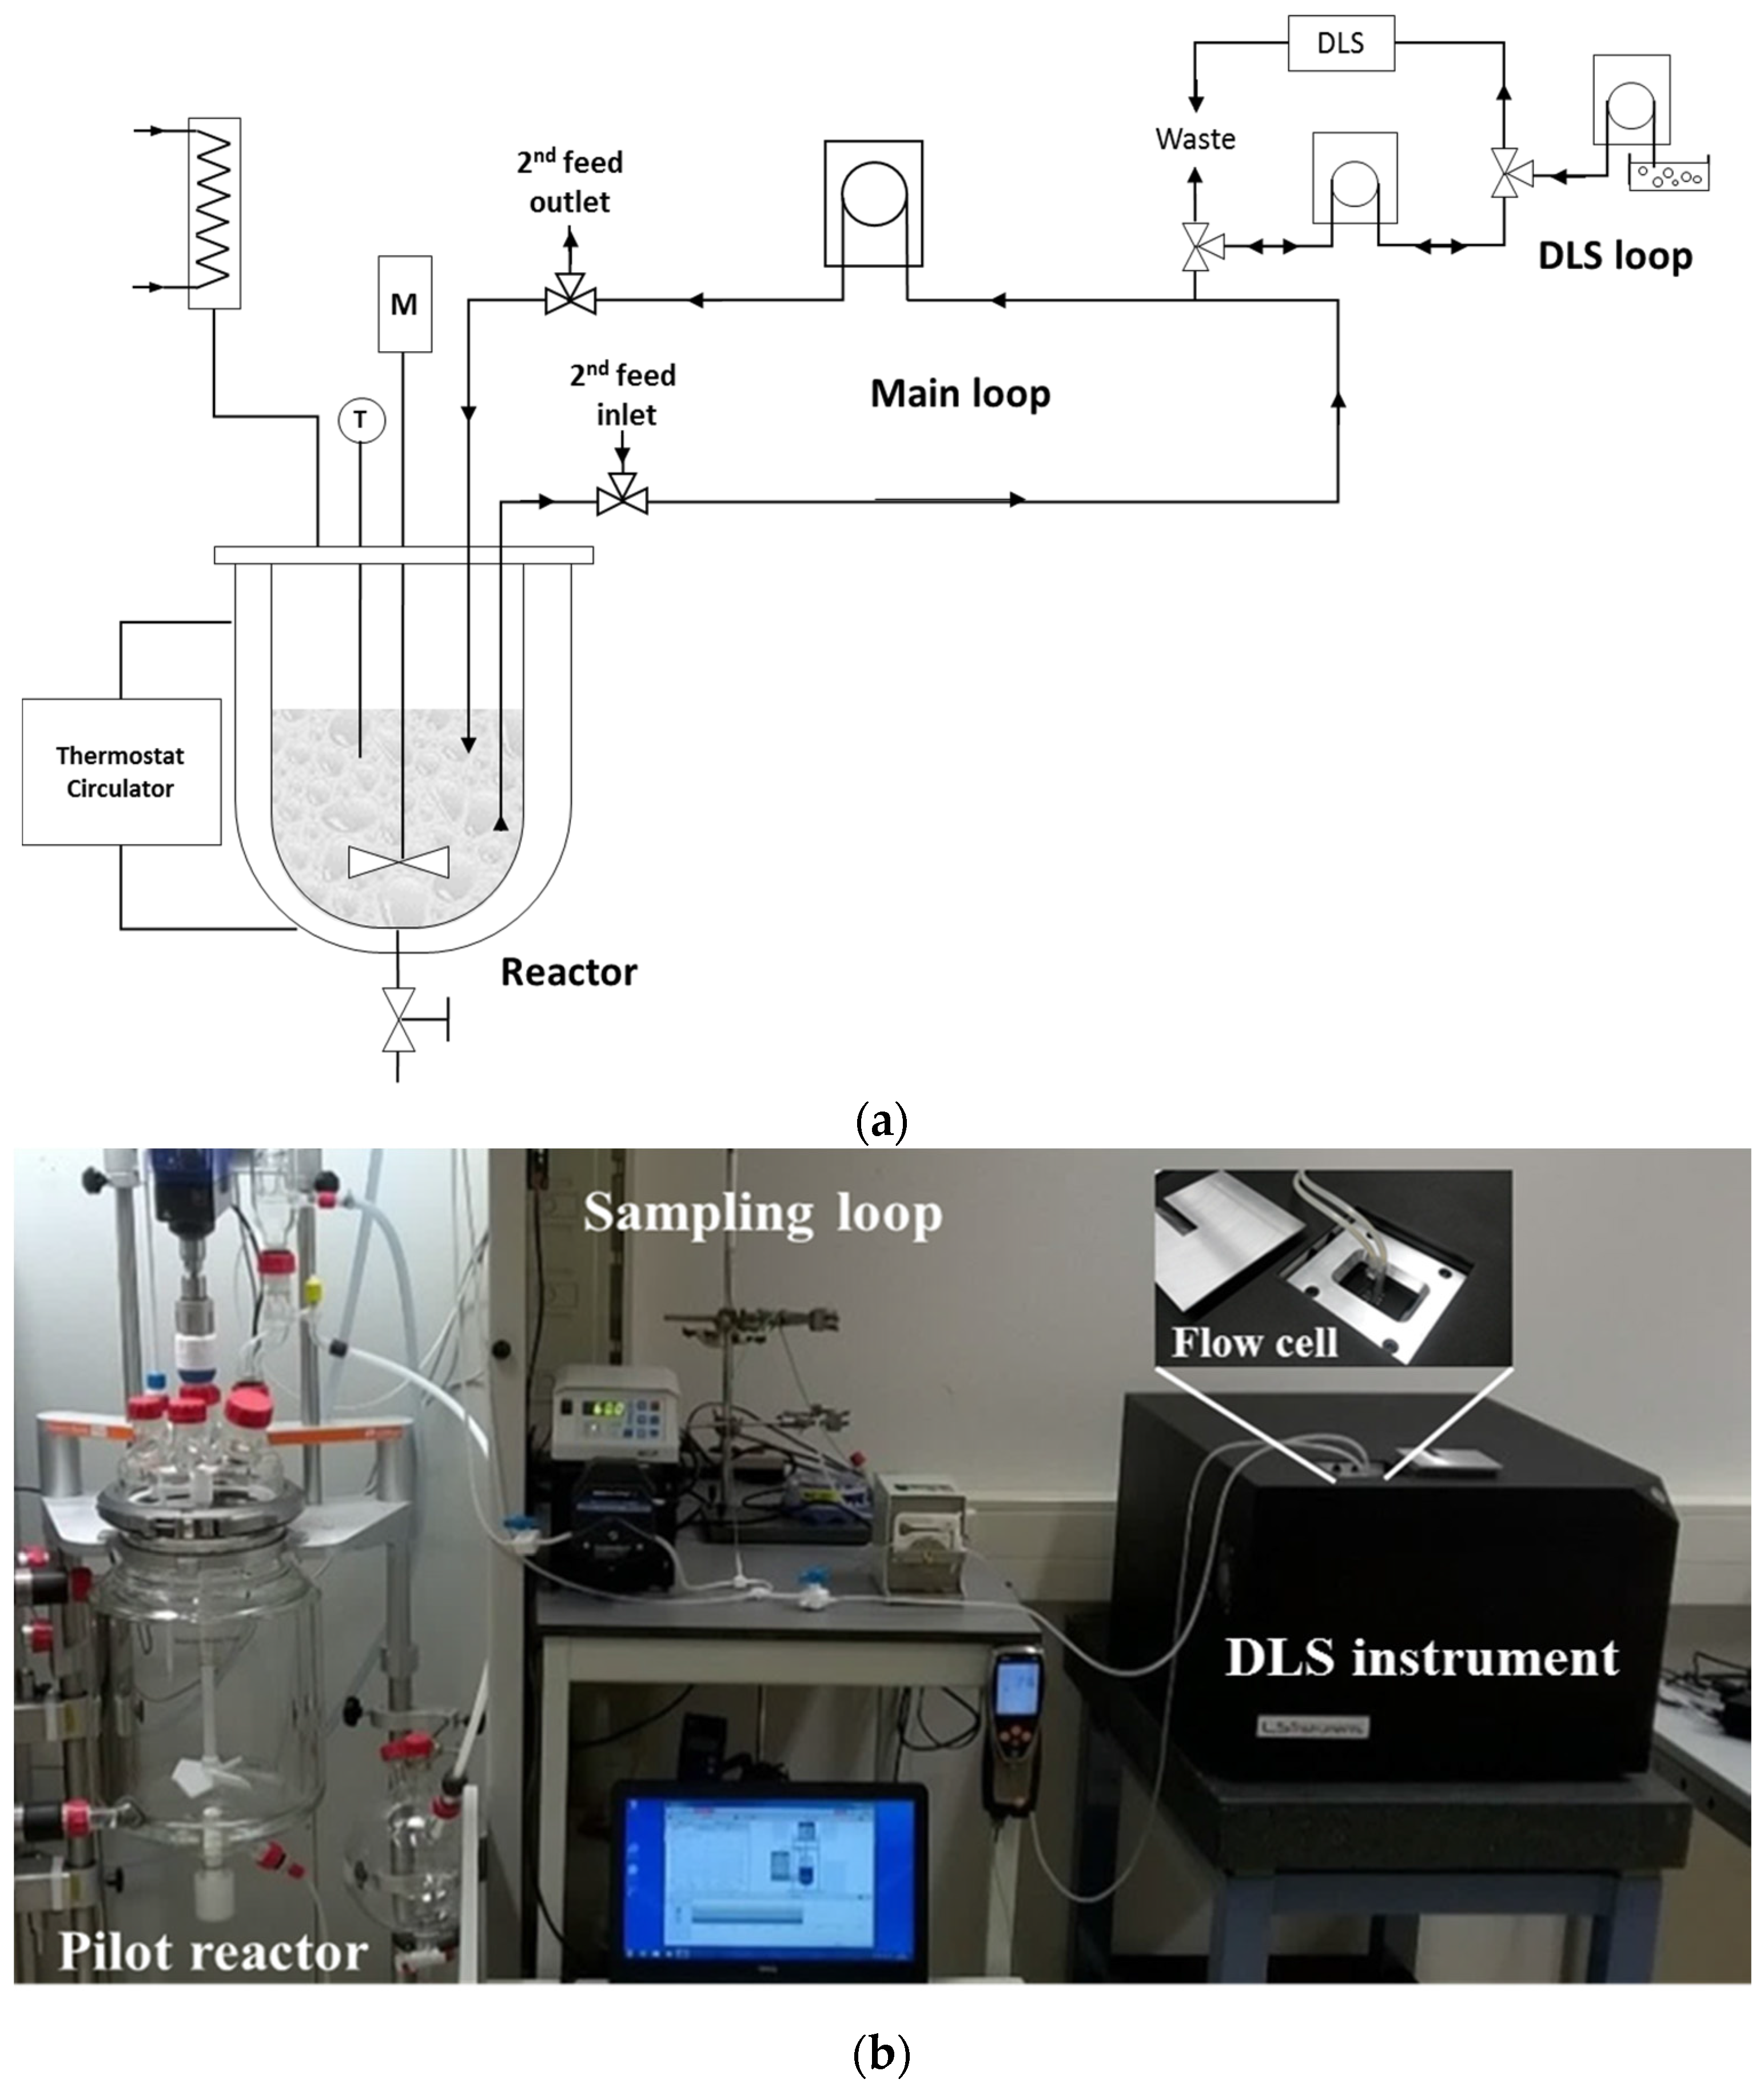
To perform measurements in stirred fluids, a custom designed analysis loop was used to couple the DLS instrument to a stirred 2 L double-walled tank reactor. The dispersion is lead to the measurement module by means of an analysis loop (Figure 2).
In the analysis loop, the reaction mixture is circulated continuously using a Watson pump with flexible tubing. The pump is placed after the cuvette to circumvent contamination of the sample with agglomerated particles due to scaling of the pump. After measurement, the DLS loop is rinsed by demineralized water to clean it before the next sample enters the measuring zone.
To validate the set-up, we started monitoring the growth of silica nanoparticles in a Stöber synthesis starting from the molecular precursor TEOS in a mixture of water, ethanol and ammonia. This is a prototypical liquid phase synthesis of nanoparticles. In this sol-gel synthesis, TEOS partially hydrolyses, and through subsequent polycondensation silica nanoparticles are formed as shown in the reaction Equations (1)–(3) [16].
Si(OC2H5)4 + xH2O → Si(OC2H5)4−x(OH)x + xC2H5OH (0 ≤ x ≤ 4)
≡Si–O–H + H–O–Si ≡ → ≡ Si–O–Si ≡ +H2O
≡Si–OC2H5 + H–O–Si≡ → ≡ Si–O–Si ≡ +C2H5OH
This process proceeds according to an aggregation-based kinetic model [17,18]. The size of the silica nanoparticles resulting from this synthesis depends amongst others on the concentration of ammonia and TEOS. The average particle size increases with increasing concentration of ammonia. The initial concentration of TEOS is inversely proportional to the size of the resulting silica nanoparticles.
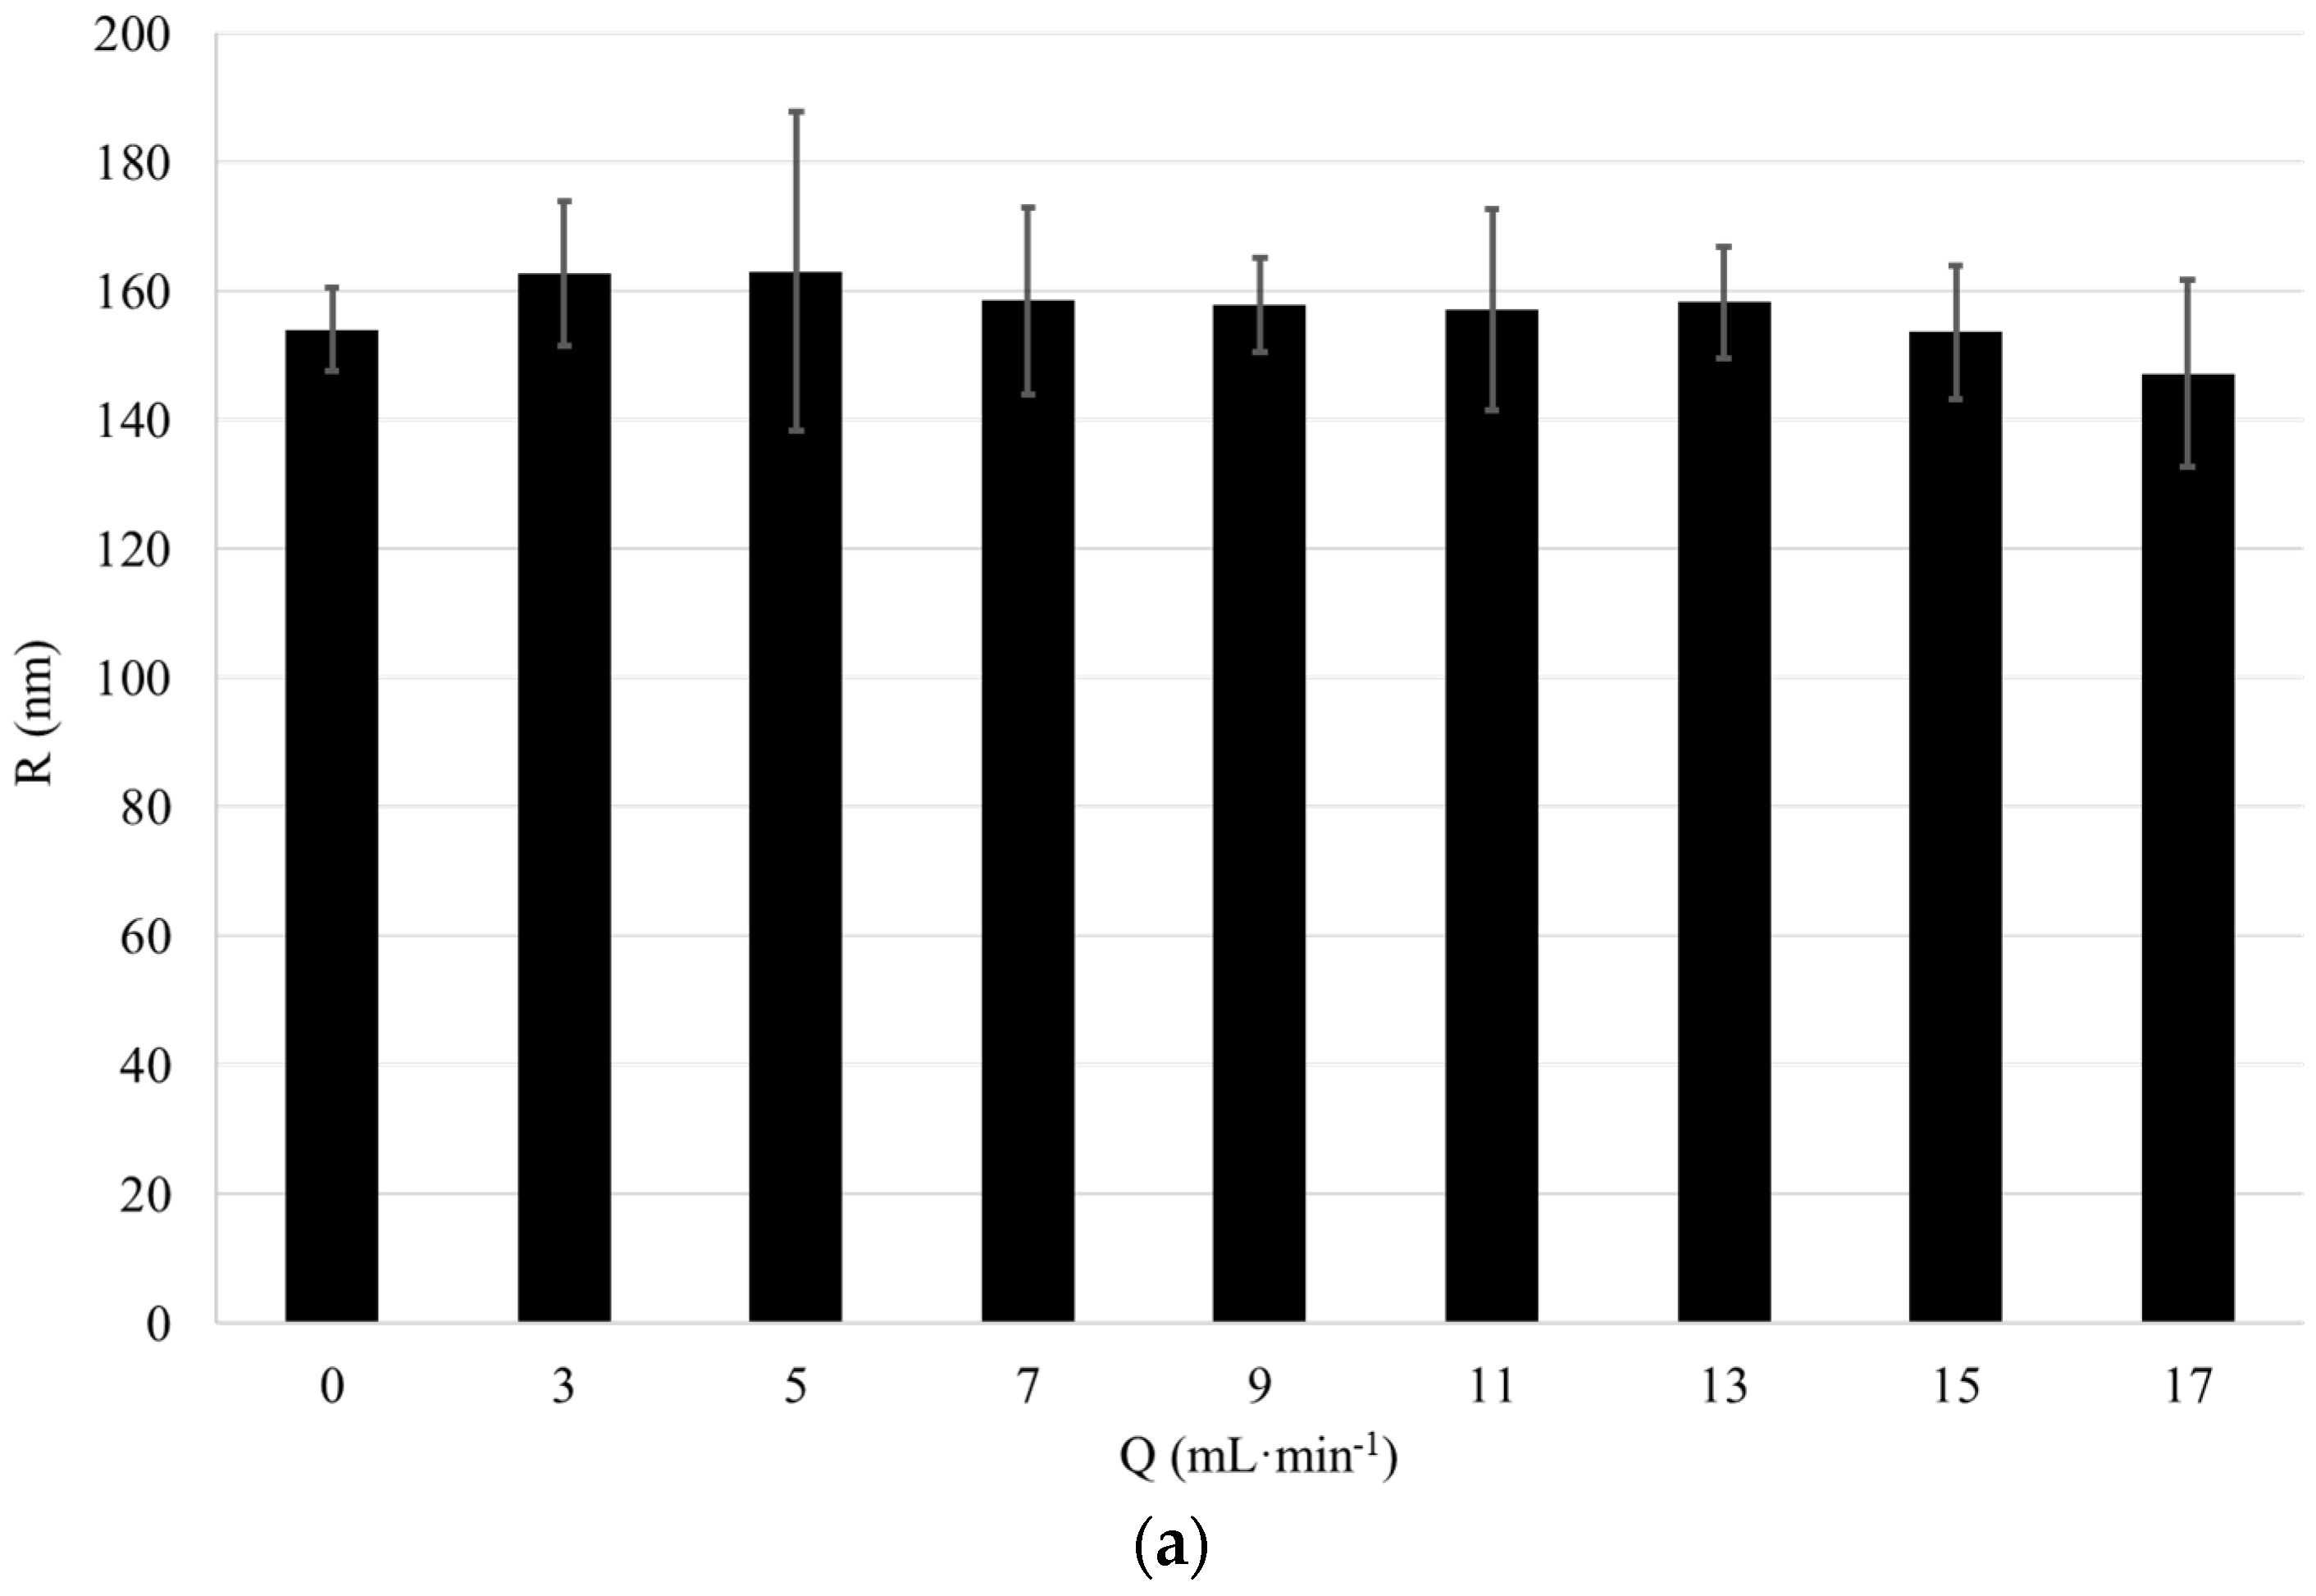
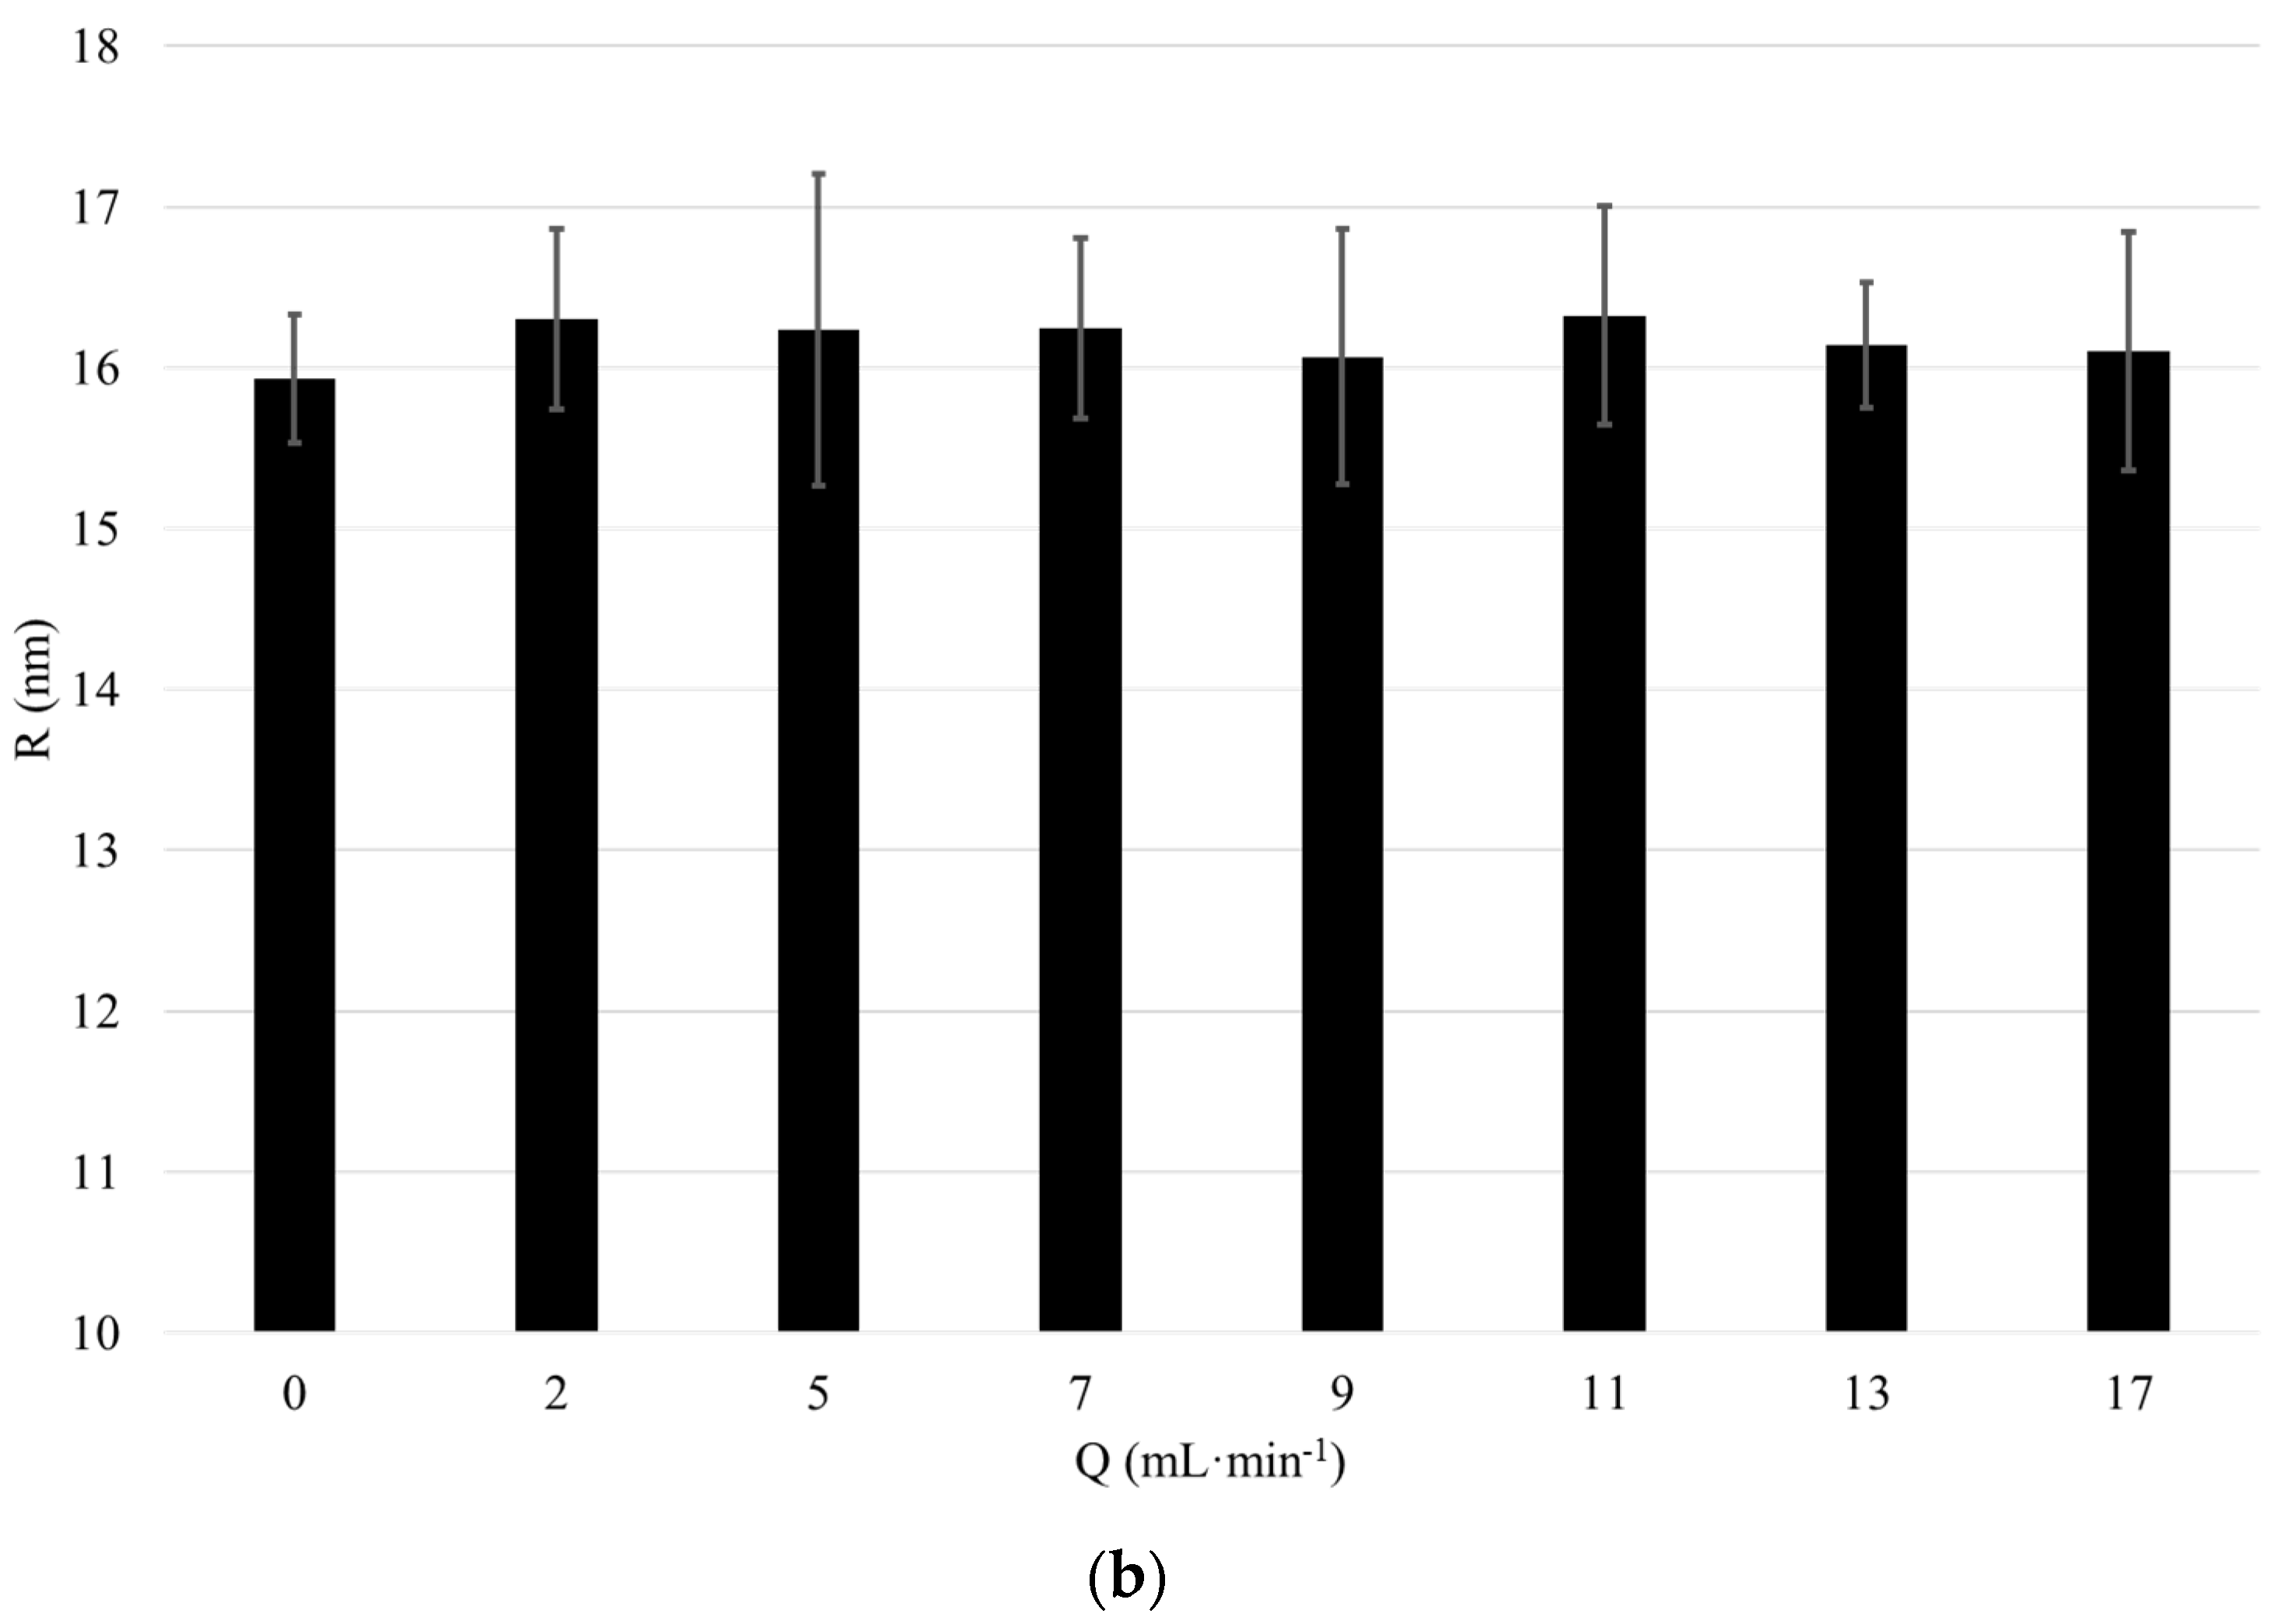
We started validating the effect of flow rate on the particle size measured in the flow-cell coupled DLS set-up with 3D cross correlation geometry. Therefore, a 1 wt-% dispersion of “large” and “small” silica particles of a radius of 157 nm and 17.6 nm, respectively, were circulated in the analysis loop comprising the DLS at flow rates Q between 0 and 17 mL·min−1. The particle radii were determined using conventional DLS. The displayed particle size is measured with the 3D cross correlation DLS whilst the dispersion was pumped through the flow cell at a defined flow rate Q between 0 and 17 mL·min−1. For each flow rate, the presented value for the particle size represents an average of ten DLS measurements (Figure 3, error bars represent standard deviation).
The average particle radius measured using conventional DLS is 157 nm for the large particles and 17.6 nm for the small particles. The average particle size measured using flow cell coupled DLS with 3D modulation is 157 nm for the large particles and 16.2 nm for the small particles. Thus, the measurement results obtained with conventional DLS and DLS with 3D cross correlation geometry performed at Q = 0 mL·min−1 are in excellent agreement. Furthermore, both for the large and small particles the particle size measured using DLS with 3D cross correlation geometry remains nearly constant for flow rates up to 17 mL·min−1. Thus, through the use of a modulated 3D cross correlation DLS instrument, we were able to accurately analyze dispersions comprising differently sized silica nanoparticles at flow rates up to 17 mL·min−1.
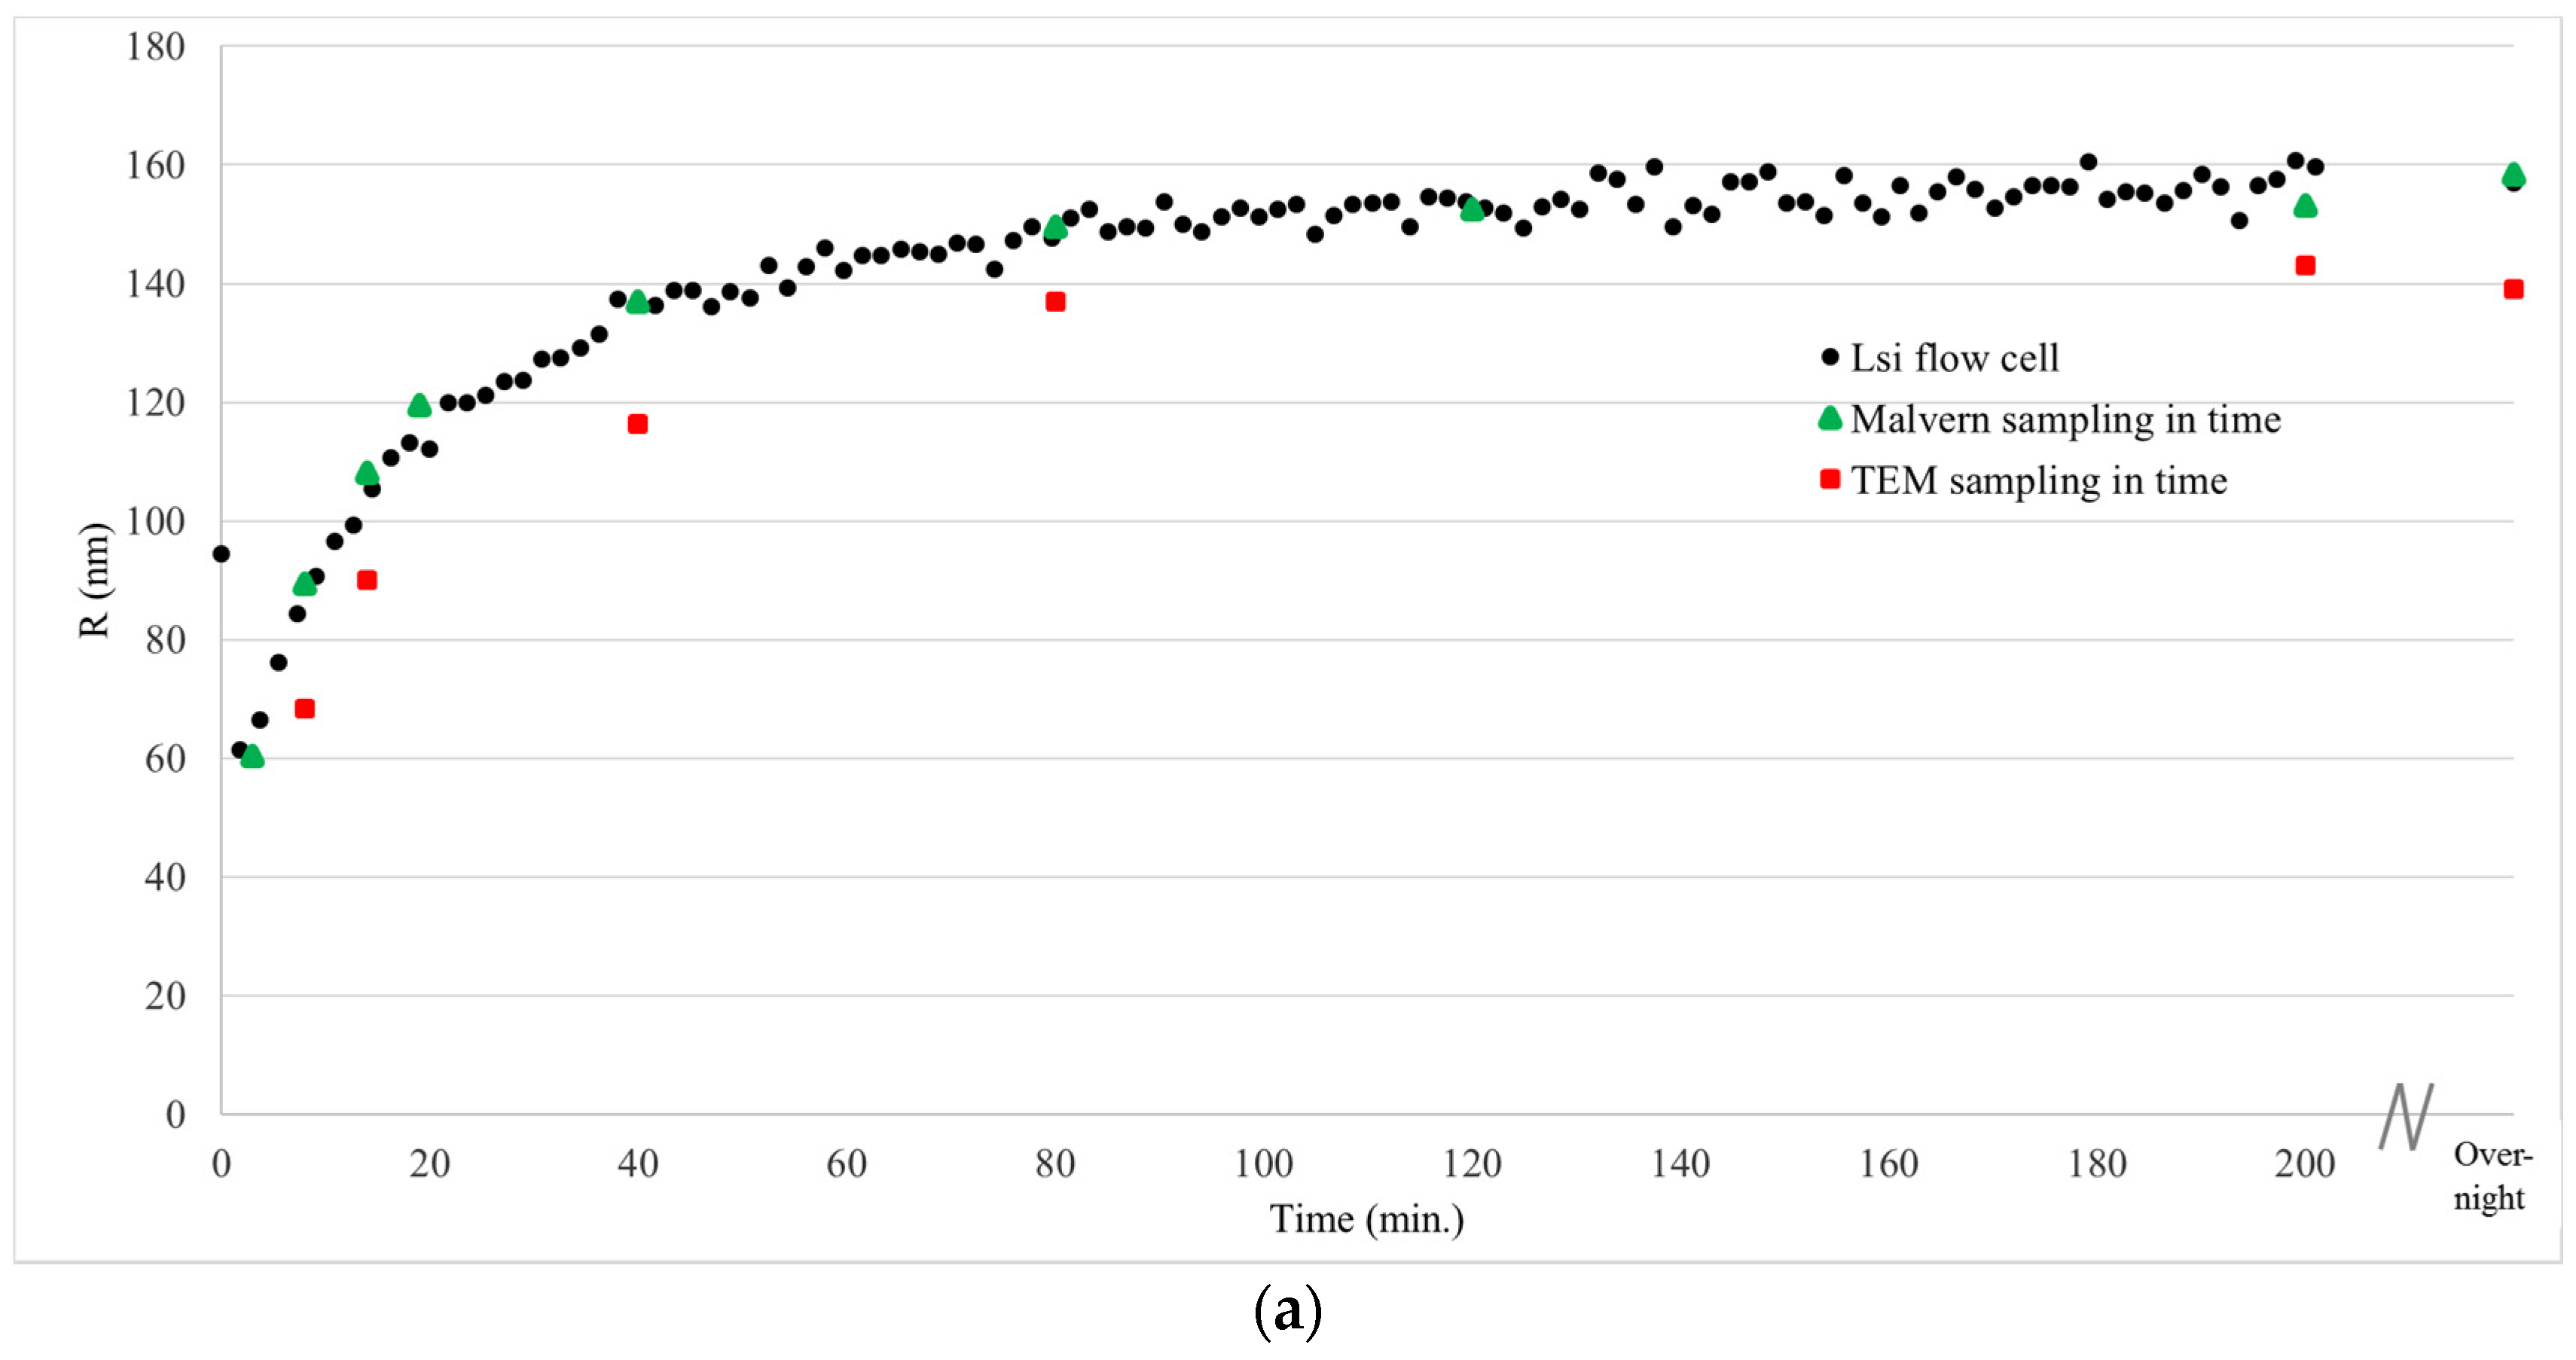
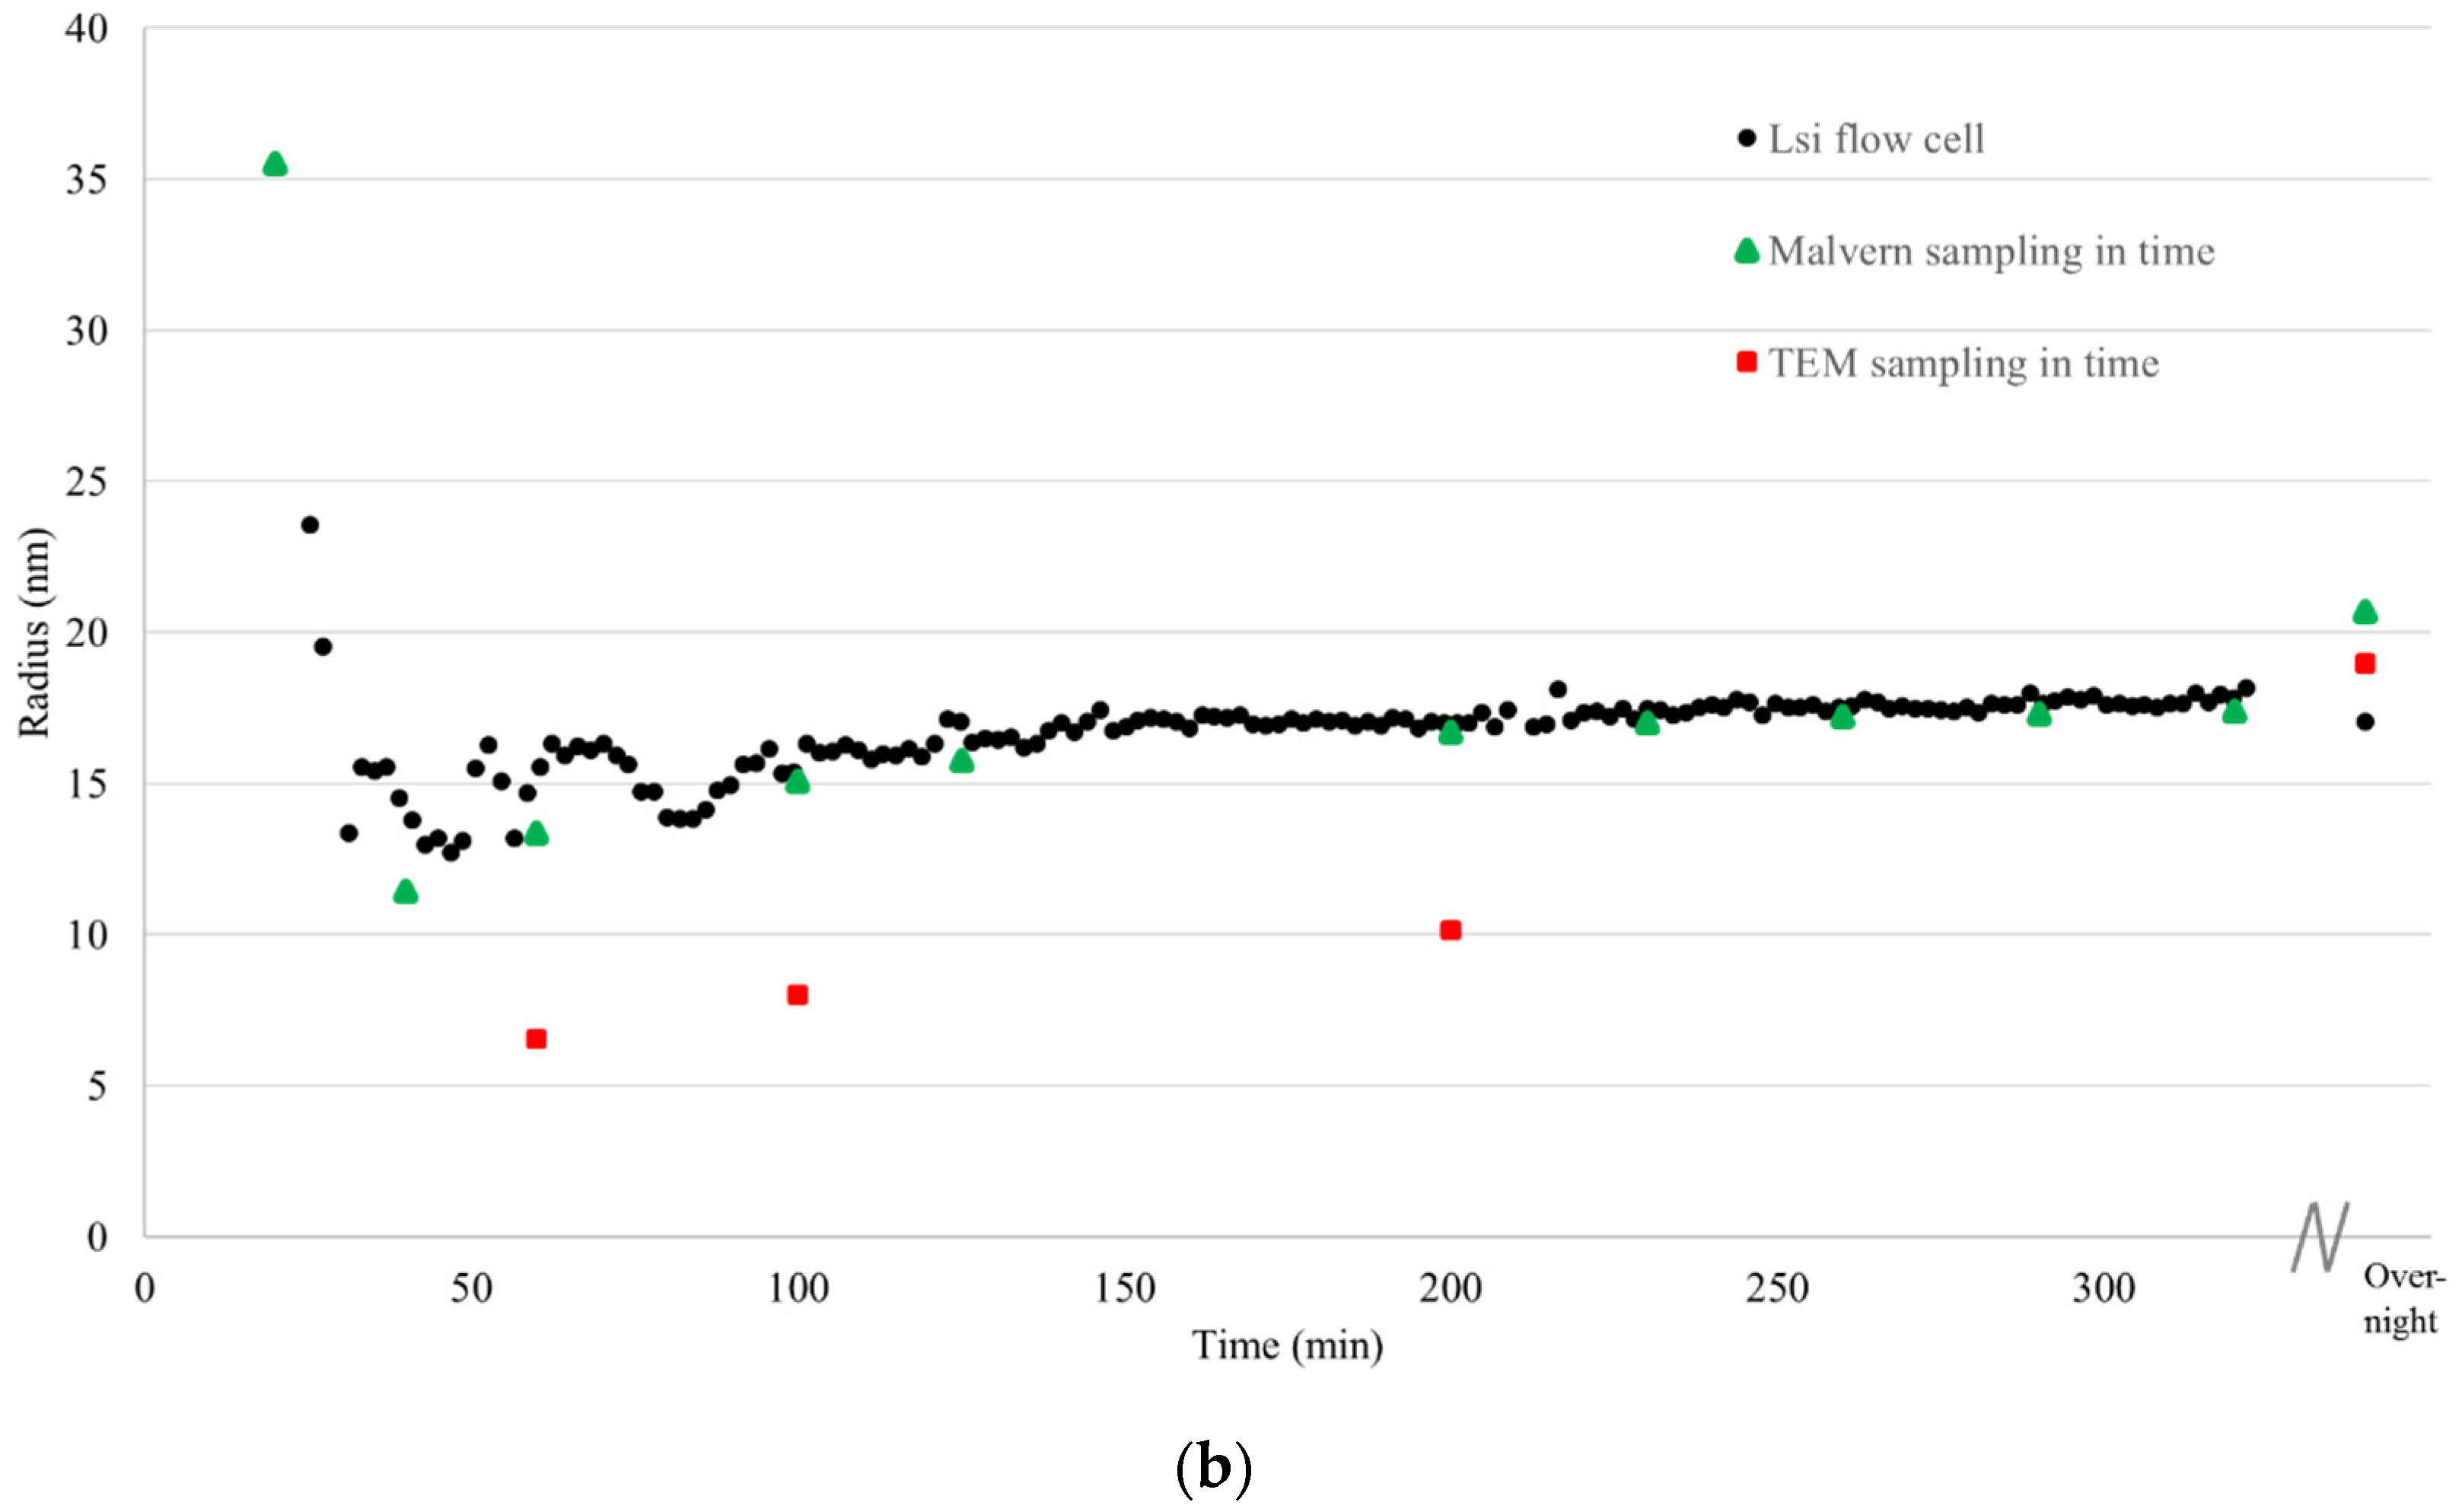
During the synthesis of the large and small silica nanoparticles, starting from the molecular precursor TEOS, the particle growth was monitored in real time using the analysis loop connected to the 3D cross correlation DLS unit (Figure 4a,b).
For comparison, also off-line DLS measurements on non-moving dispersions were performed using a state-of-art DLS instrument (Figure 4, green triangles). For that purpose, samples were taken during the reaction. Furthermore, samples were taken for TEM analysis, and immediately dried on a TEM grid after which the samples were analyzed (Figure 4, red squares). The deviation in particle size obtained using DLS between the off-line measured samples and the samples measured in flow is maximum 7%. This small deviation in particle size measured with conventional DLS on non-moving dispersions and in flow with the 3D cross correlation geometry DLS during synthesis of silica nanoparticles demonstrates that particle growth can be accurately monitored in real-time using our newly developed flow cell coupled DLS setup connected to the reactor using the analysis loop.
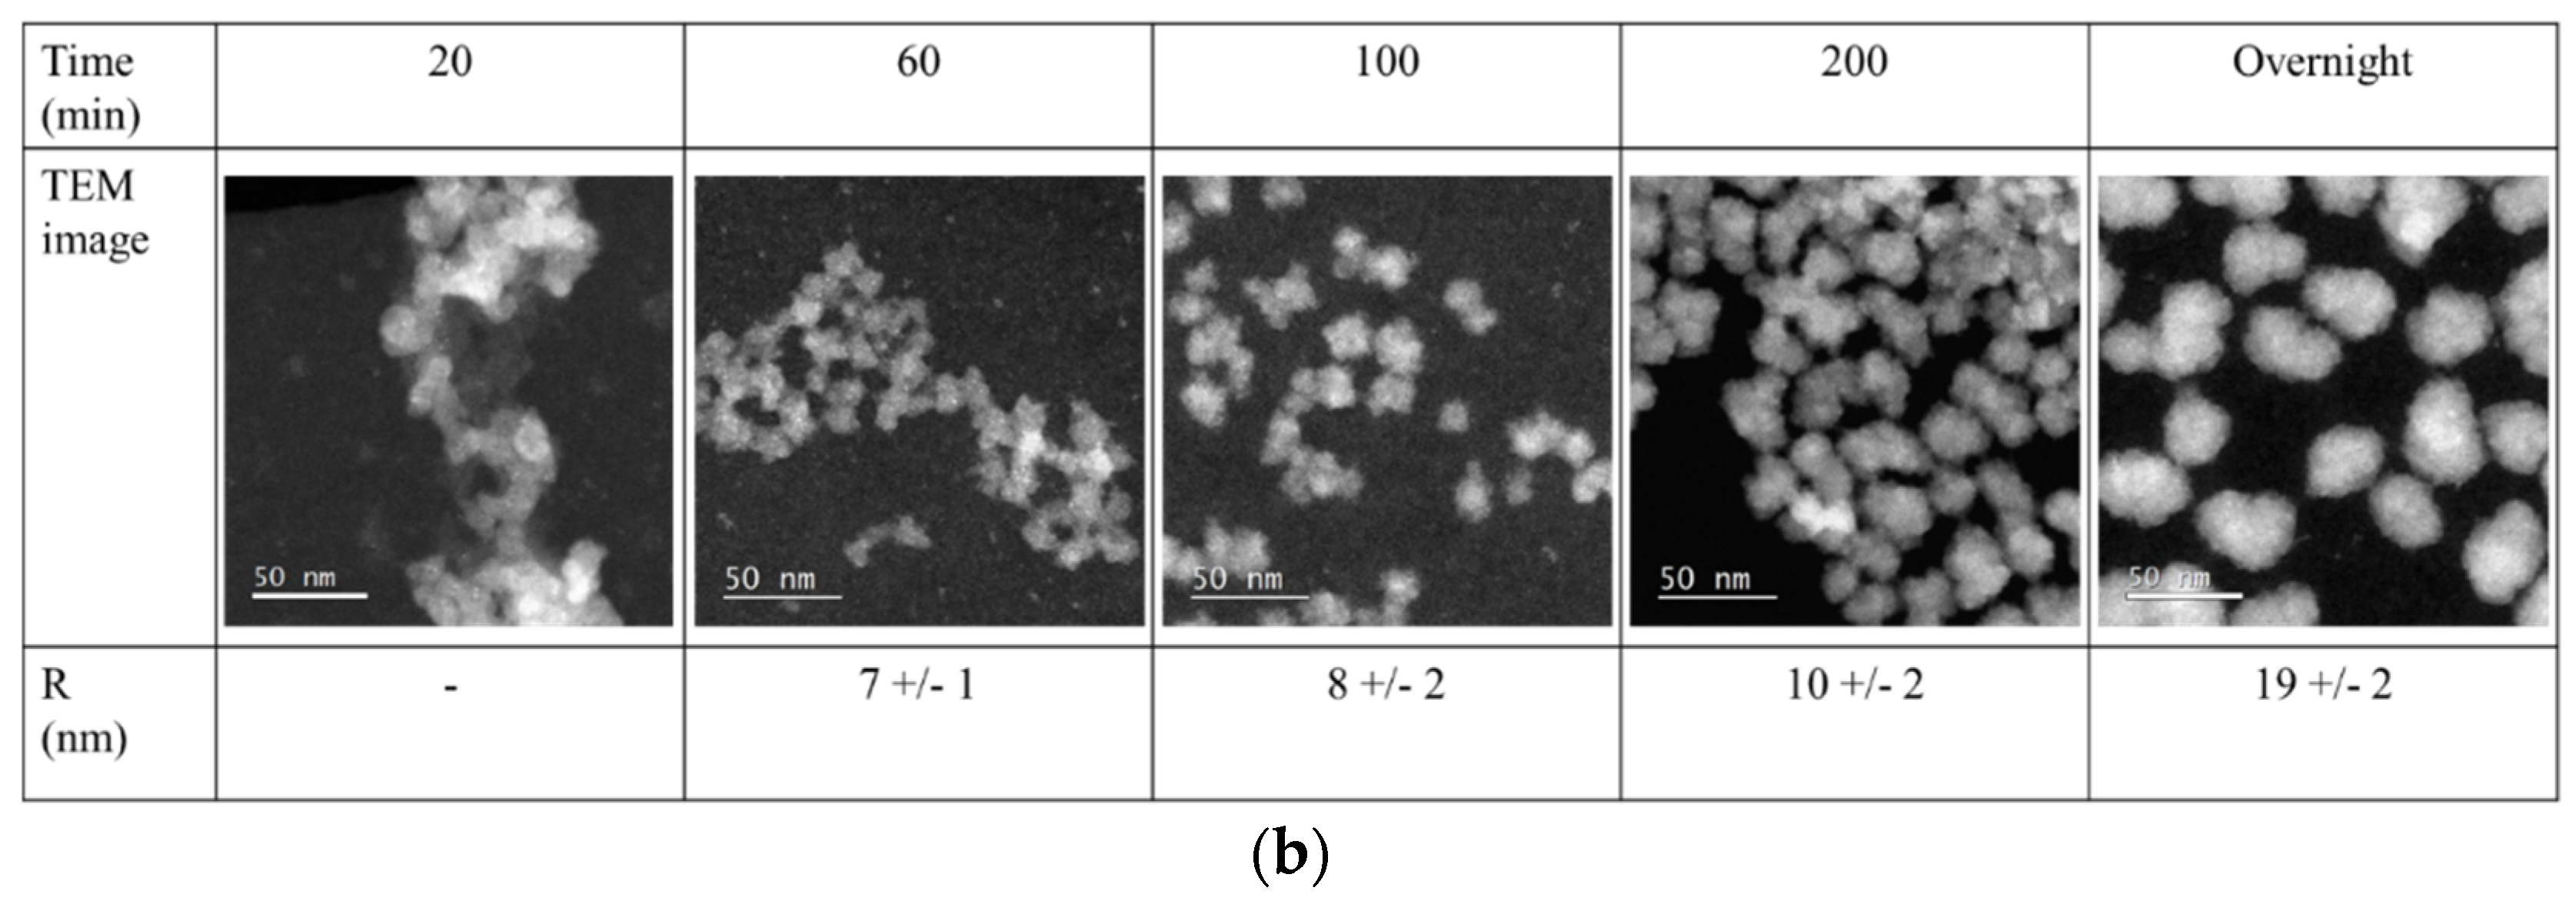
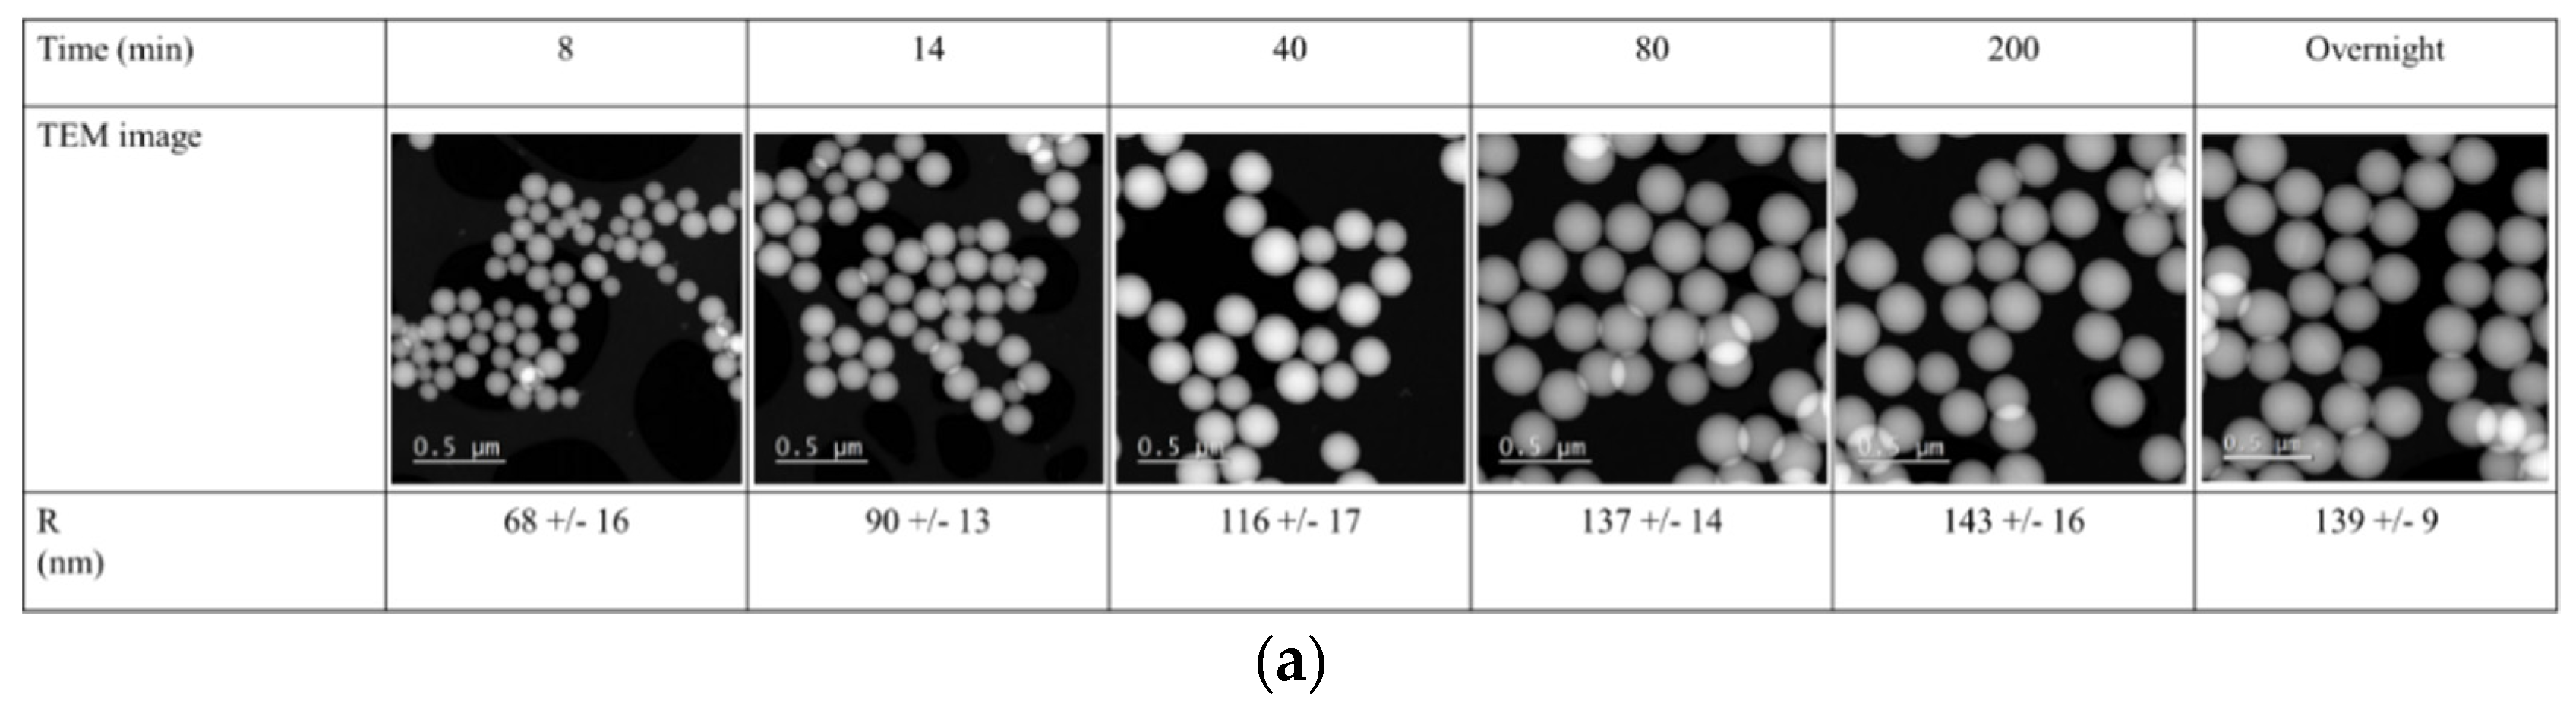
The solvodynamic radius of the particles during synthesis, obtained through DLS, was compared to particle size obtained using transmission electron microcopy (Figure 4, red squares, Figure 5).
The average particle size obtained through TEM analyses was determined through measurement of at least 25 particles per samples. The particle sizes obtained using TEM analyses were smaller than those obtained using DLS. This can be explained by the fact that through DLS the solvodynamic radius of the particle is measured, and through TEM the radius of the dry particles [19]. For the large silica particles, the radii determined through TEM were approximately 10% smaller than those obtained through DLS. For the small silica particles, this difference was significantly larger, due the strong deviation of these particles from ideal spheres (Figure 5b). In contrast to the DLS techniques presented in this article, however, TEM not only provides information on the particle size but also on its shape and architecture. In addition to size, these are also important characteristics that influence the particle’s property.

4. Conclusions

We have successfully developed a flow cell coupled DLS set-up that allows to monitor the size of nanoparticles in real-time during bottom-up liquid phase synthesis. Through the use of a modulated 3D cross correlation DLS instrument, we were able to accurately analyze dispersions comprising silica nanoparticles in water/alcohol mixtures. Through Stöber synthesis, we prepared small and large silica nanoparticles with a radius of approx. 20 nm and 150 nm, respectively. Both dispersions could be accurately analyzed using our novel flow cell coupled 3D cross correlation DLS set-up at silica concentrations of approx. 2.25 wt-% and flow rates up to 17 mL·min−1. Furthermore, we demonstrated that the particle size could be accurately monitored in real-time during Stöber synthesis of the silica spheres starting from TEOS as molecular precursor. This was confirmed by conventional off-line DLS and TEM analyses. Thus, the newly developed flow cell coupled DLS set-up enables the study of nucleation and growth of nanoparticles in bottom-up liquid phase synthesis, which provides rational input for process optimization. Furthermore, when coupled to a production sized reactor, it can help to minimize the number of off spec batches since it provides real-time information that enables rational process intervention. We expect to validate the set-up for sol-gel syntheses of nanoparticles other than silica (e.g., titania, zirconia) and redox synthesis for the production of metallic nanoparticles starting from (complex) metal salts.

Acknowledgments

This work was supported by the European Commission and is part of the EU project COPILOT which has received funding from the European H2020 program under grant agreement n° 645993. Solliance and the Dutch province of Noord Brabant are acknowledged for funding the TEM facility.

Author Contributions

N.M., P.B. and M.M. conceived and designed the experiments; R.v.E and R.S. performed the experiments; R.v.E, N.M. and P.B. analyzed the data; N.K., R.A. and M.V. contributed to the interpretation of the analyses results; N.M. and P.B. wrote the manuscript. All authors have read and approved the final manuscript.

Conflicts of Interest

The authors declare no conflict of interest.

References

  1. Black, D.L.; McQuay, M.Q.; Bonin, M.P. Laser-based techniques for particle-size measurement: A review of sizing methods and their industrial applications. Prog. Energy. Combust. Sci. 1996, 22, 267–306. [Google Scholar] [CrossRef]
  2. Buskens, P.; Burghoorn, M.; Mourad, M.; Vroon, Z. Antireflective Coatings for Glass and Transparent Polymers. Langmuir 2016, 32, 6781–6793. [Google Scholar] [CrossRef] [PubMed]
  3. Mann, D.; Chattopadhyay, S.; Pargen, S.; Verheijen, M.; Keul, H.; Buskens, P.; Möller, M. Glucose-functionalized polystyrene particles designed for selective deposition of silver on the surface. RSC Adv. 2014, 4, 62878–62881. [Google Scholar] [CrossRef]
  4. Segers, M.; Arfsten, N.; Buskens, P.; Möller, M. A facile route for the synthesis of sub-micron sized hollow and multiporous organosilica spheres. RSC Adv. 2014, 4, 20673–20676. [Google Scholar] [CrossRef]
  5. Mann, D.; Nascimento-Duplat, D.; Keul, H.; Möller, M.; Verheijen, M.; Xu, M.; Urbach, H.P.; Adam, A.J.L.; Buskens, P. The Influence of Particle Size Distribution and Shell Imperfections on the Plasmon Resonance of Au and Ag Nanoshells. Plasmonics 2017, 12, 929–945. [Google Scholar] [CrossRef] [PubMed]
  6. Mann, D.; Voogt, S.; van Zandvoort, R.; Keul, H.; Möller, M.; Verheijen, M.; Nascimento-Duplat, D.; Xu, M.; Urbach, H.P.; Adam, A.J.L.; et al. Protecting patches in colloidal synthesis of Au semishells. Chem. Commun. 2017, 53, 3898–3901. [Google Scholar] [CrossRef] [PubMed]
  7. Berne, B.J.; Pecora, R. Dynamic Light Scattering: With Applications to Chemistry, Biology, and Physics; Courier Corporation: Mineola, TX, USA, 2000; ISBN 978-0486411552. [Google Scholar]
  8. Brown, W. Dynamic Light Scattering: The Method and Some Applications; Clarendon Press: Oxford, NY, USA, 1993; ISBN 9780198539421. [Google Scholar]
  9. Pecora, R. Dynamic Light Scattering Measurement of Nanometer Particles in Liquids. J. Nanopart. Res. 2000, 2, 123–131. [Google Scholar] [CrossRef]
  10. Segrè, P.N.; Vanmegen, W.; Pusey, P.N.; Schatzel, K.; Peters, W. Hard-sphere colloidal suspensions studied by two-colour dynamic light scattering. Opt. Methods Phys. Colloid. Dispers. 1995, 104, 8–11. [Google Scholar]
  11. Block, I.D.; Scheffold, F. Modulated 3D cross-correlation light scattering: Improving turbid sample Characterization. Rev. Sci. Instrum. 2010, 81, 123107. [Google Scholar] [CrossRef] [PubMed]
  12. De Kanter, M.; Meyer-Kirshcner, J.; Viell, J.; Mitsos, A.; Kather, M.; Pich, A.; Janzen, C. Enabling the measurement of particle sizes in stirred colloidal suspensions by embedding dynamic light scattering into an automated probe head. Measurement 2016, 80, 92–98. [Google Scholar] [CrossRef]
  13. Urban, C.; Schurtenberger, P. Characterization of Turbid Colloidal Suspensions Using Light Scattering Techniques Combined with Cross-Correlation Methods. J. Colloid Interface Sci. 1998, 207, 150–158. [Google Scholar] [CrossRef] [PubMed]
  14. Khan, M.F.; Dong, H.; Chen, Y.; Brook, M.A. Low Discrimination of Charged Silica Particles at T4 Phage Surfaces. Biosens. J. 2015, 4, 125. [Google Scholar] [CrossRef]
  15. Sato-Berrú, R.; Saniger, J.M.; Flores-Flores, J.; Sanchez-Espíndola, M. Simple method for the controlled growth of SiO2 spheres. J. Mat. Sci. Eng. A 2013, 3, 237. [Google Scholar]
  16. Ibrahim, I.A.M.; Zikry, A.A.F.; Sharaf, M.A. Preparation of spherical silica nanoparticles: Stober silica. J. Am. Sci. 2010, 6, 11. [Google Scholar]
  17. Stöber, W.; Fink, A.; Bohn, E. Controlled Growth of Monodisperse Silica Spheres in the Micron Size Range. J. Colloid Interface Sci. 1968, 26, 62–69. [Google Scholar] [CrossRef]
  18. Giesche, H. Synthesis of Monodispersed Silica Powders; I. Particle Properties and kinetics. J. Eur. Ceram. Soc. 1994, 14, 189–204. [Google Scholar] [CrossRef]
  19. Meli, F.; Klein, T.; Buhr, E.; Frase, C.G.; Gleber, G.; Krumrey, M.; Duta, A.; Duta, S.; Korpelainen, V.; Bellotti, R.; et al. Traceable size determination of nanoparticles, a comparison among European metrology institutes. Meas. Sci. Technol. 2012, 23, 125005. [Google Scholar] [CrossRef]
Figure 1. Schematic representation of the dynamic light scattering (DLS) instrument equipped with 3D cross correlation geometry. Reprinted with permission from LS Instruments AG.
Applsci 08 00108 g001
Figure 2. (a) Schematic representation of the analysis loop for coupling the DLS unit to the pilot reactor system and (b) detailed photograph of the setup.
Applsci 08 00108 g002
Figure 3. Particle size measurement using the DLS with 3D cross correlation geometry of (a) “large” SiO2 nanoparticles; (b) “small” SiO2 nanoparticles at concentration of 1 wt-% and flow rates between 0 and 17 mL·min−1.
Applsci 08 00108 g003aApplsci 08 00108 g003b
Figure 4. Measurements during the synthesis process of (a) large silica particles; (b) small silica particles; the black dots represent real-time 3D cross correlation DLS measurements in flow (Q = 12.9 mL·min−1), the green triangles represent conventional DLS measurements on the respective non-moving dispersions and the red squares represent TEM measurements (solid concentrations of silica dispersions of ca. 2.25 wt-%).
Applsci 08 00108 g004aApplsci 08 00108 g004b
Figure 5. High angle annular dark field (HAADF)-STEM images of (a) large silica particles and (b) small silica particles.
Applsci 08 00108 g005aApplsci 08 00108 g005b

