Experimental and Numerical Study on the Seismic Performance of Prefabricated Reinforced Masonry Shear Walls


1
School of Civil Engineering, Harbin Institute of Technology, Harbin 150090, China
2
Key Lab of Structures Dynamic Behavior and Control of the Ministry of Education, Harbin Institute of Technology, Harbin 150090, China
3
Key Lab Smart Prevention and Mitigation of Civil Engineering Disasters of the Ministry of Industry and Information Technology, Harbin Institute of Technology, Harbin 150090, China
*
Author to whom correspondence should be addressed.
Appl. Sci. 2018, 8(10), 1856; https://doi.org/10.3390/app8101856
Submission received: 17 September 2018
/
Revised: 3 October 2018
/
Accepted: 3 October 2018
/
Published: 9 October 2018
(This article belongs to the Special Issue Emerging Construction Materials and Sustainable Infrastructure)
Abstract
:The seismic performance of prefabricated reinforced concrete block masonry shear walls (PRMSWs) was studied. Five PRMSWs were tested under cyclic loading to evaluate the effect of the axial compression ratio and the distribution of the vertical rebar on the inelastic behavior. Based on the experimental results, the lateral load capacity, failure mode, lateral drift, ductility, stiffness degradation, energy dissipation, and the seismic performance stability of the specimens were analyzed. The finite element analysis of the specimens was conducted with ABAQUS, which agreed quite well with the laboratory findings. Relevant results showed that PRMSW exhibited favorable ductility and energy dissipation. The increase of the compression ratio led to stiffer, but more brittle, inelastic behavior of the specimens that had higher flexural strength. The shear walls that had concentrated vertical rebar at the sides exhibited relatively higher load capacity and less ductility compared to the walls that had evenly distributed rebar. The inelastic lateral drift limit of the PRMSW could be assigned 1/120. The equivalent viscous damping ratio of the PRMSW was 9–13% at ultimate load. These results provide a technical basis for the design and application of the PRMSW structures.
1. Introduction
With the accelerated process of global urbanization, the construction industry has developed rapidly, and large-scale, environmental, and efficient construction is becoming more urgent in civil engineering. Prefabricated structures, based on industrialization, are a prevalent way to meet this requirement. The prefabricated structure is a structure system where the structural components are prefabricated by way of industrial production, and then assembled on-site [1], which has been used globally for its economic and environmental benefits [2,3].
The reinforced masonry shear wall (RMSW) structure is one of the most popular building forms, applied in medium- and high-rise buildings, because of its advantages in construction cost and efficiency as well as its good bearing capacity [4]. Nonetheless, it should be noted that the conventional RMSWs have some defects, due to the cleaning-hole blocks in the bottom layer of the shear wall, such as a complicated construction procedure and reduced integrity [5]. Furthermore, it is not appropriate for the trend of prefabrication and industrialization in the current construction market. Accordingly, a new type of prefabricated reinforced masonry shear wall (PRMSW) is proposed in order to overcome these shortcomings. The major structural components of PRMSW (e.g., the hollow masonry walls) are mechanized products made of concrete blocks, in factory, with the horizontal reinforcement applied according to the design requirement, and the cleaning-hole blocks are eliminated during production. After the prefabricated walls are transported to the construction site, the shear walls are lifted and assembled, with the vertical reinforcement fixed to the floor. Then, the hollow walls are fully grouted, with the blocks acting as templates. Due to industrialization and mechanized construction, this type of structural system has the advantages of small workload, low cost, excellent quality, and environmental protection [2,3,5]. It could be expected; therefore, that the PRMSW structures may have wide applications in the construction market.
The RMSW have two typical failure modes (i.e., the flexural failure and the shear failure). Compared with the relatively brittle shear failure [6,7,8], the flexural failure, which is characterized by tensile yielding of the vertical rebar and compression crushing of the wall toe, is the favored failure mode due to its ductile nature and good energy dissipation capacity [9]. Numerous studies on the seismic performance of RMSW failing in flexure have been carried out in the last few decades [10,11,12]. The effects of the axial stress, aspect ratio, and the reinforcement on the flexural behavior of RMSW were evaluated [13,14,15]. However, the seismic performance of PRMSW is seldom investigated. It is of great importance to investigate the seismic behavior of the PRMSW, and thereby promote its application in seismic areas.
The primary aim of this study was to evaluate the seismic behavior of the new type of PRMSW. Five full-scale fully-grouted prefabricated reinforced masonry walls were failure-tested under reversed cyclic loading. The test parameters were the axial compression ratio and the distribution of vertical reinforcement. The failure pattern and the hysteresis curves were obtained for all specimens, and seismic performance indexes such as the drift, displacement ductility, stiffness, energy dissipation, and equivalent viscous damping ratio were considered. The numerical simulation of the test walls was conducted with ABAQUS [16]. This study may contribute to the theoretical research and the practical engineering application of the PRMSW.
2. Experimental Program
2.1. Material Properties
The dimensions of the full and half concrete blocks were 390 mm × 190 mm × 190 mm and 190 mm × 190 mm × 190 mm (length × height × thickness), respectively. The hole ratio of the blocks was 47%, and the hole-alignment ratio was 94%. Figure 1 shows the detailed dimensions of the blocks. The mortar used in the test was mixed with weight proportions of 1.0:3.2:0.6:2.5 × 10⁻⁴ (cement, sand, water, and chemical additive, respectively). The grouted concrete of the masonry wall was mixed with weight proportions of 1.0:2.1:2.5:0.5 for cement, sand, coarse aggregate, and water, respectively. After curing for 28 days, the samples of the concrete block, mortar, grouted concrete, and grouted masonry prism were tested on a press machine according to relevant codes [17,18,19,20]. The average compressive strengths of the concrete block (f1,m), mortar (f2,m), grouted concrete (fc,m), and grouted masonry prism (fg,m) were 22.8, 21.5, 32.2, and 25.1 MPa, respectively.
The steel bars of the specimens were made of Grade Q400 steel. Tensile tests were conducted to analyze the tensile strength of the rebar in the test walls according to [21]. Three samples of each kind of rebar were tested, and the average yield strengths (fy) for the rebar with diameters of 12 and 14 mm were 393.2 MPa and 404.8 MPa, respectively.
2.2. Design and Prefabricated Construction of Test Specimens
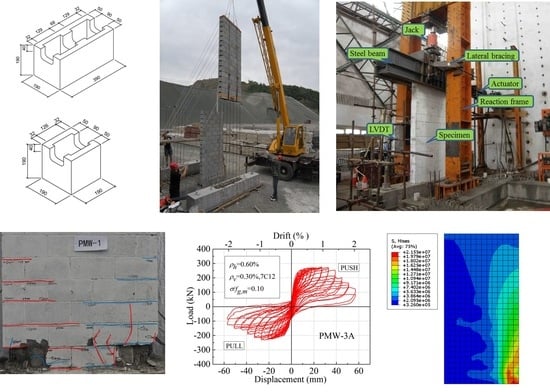
A total of five fully-grouted PRMSWs, which were designed based on Chinese Code (GB 50011-2010) [22], were constructed and tested under cyclic loading. The properties of each specimen are presented in Table 1 and Figure 2. The test walls, which were equivalent in dimensions, were denoted as PMW-1, PMW-2, PMW-3A, PMW-3B, and PMW-4, respectively. PMW denotes the prefabricated reinforced masonry shear wall. The number following PMW denotes the differing axial compression ratio and distribution of the vertical rebar. The letters A and B denote two specimens that were designed with the same test parameters with the aim to investigate the seismic performance stability of the PRMSW. For PMW-1 and PMW-3A/B, the axial load was 670 kN, and the axial compression ratio () was 0.10. PMW-2 and PMW-4 had the same axial load of 1000 kN, and a compression ratio of 0.15. Figure 2 presents the reinforcement of the specimens, which was designed based on Chinese Code (GB 50003-2011) [23] to ensure the expected bending failure of the test walls. All specimens had the same horizontal reinforcement ratio of 0.60% and vertical reinforcement ratio of about 0.30%. The horizontal reinforcement consisted of two rebar, each with a diameter of 12 mm, in every course for all specimens. The vertical reinforcement of both PMW-1 and PMW-2 involved five rebar, each with a diameter of 14 mm, that were placed in the middle cell and two cells at each end of the specimens. PMW-3A/B and PMW-4 had evenly distributed vertical rebar, each with a diameter of 12 mm, in each cell along the length of the wall.
The prefabricated construction procedures for the five specimens were as follows: First, the foundation beams, for each specimen, were constructed, and the vertical rebar, for the test walls, were fixed on each foundation beam (see Figure 3a). Second, five hollow masonry shear walls were constructed on specific foundations, by the same professional mason using hollow concrete blocks, and were fixed with special tools. Third, the five hollow walls were lifted and assembled, with the applicable foundation beam and vertical rebar, using a crane (see Figure 3b). Then, the assembled hollow walls were checked to ensure acceptable perpendicularity (see Figure 3c), and were fixed using a stretchable anchor bolt (see Figure 3d). Finally, the assembled hollow walls were fully grouted with concrete. All the walls were cured for 28 days before being tested.
2.3. Test Setup, Instrumentation, and Loading Procedure
The test setup is presented in Figure 4. Each specimen was tested under a constant axial load and a cyclic lateral load during the experiment. The axial load was executed by a 2000-kN-capacity jack to a rigid steel load beam. The reversed horizontal load was transferred from a 1000-kN-capacity hydraulic actuator, which was aligned with the centerline of the load beam. The applied vertical and lateral loads were measured by a pressure sensor and the MTS electrohydraulic testing system, respectively. The foundation beam was anchored to the laboratory floor by anchor bolts to prevent slide and uplift of the base. To avoid out-of-plane displacement of the specimens, two parallel lateral bracings were installed perpendicular to the specimens.
Figure 4 shows the external instrumentation of the specimens. The key displacements of the test walls were measured with a set of linear variable differential transformers. L1 was arranged to monitor the slide of the foundation, L2–L6 were placed along each specimen’s height to acquire the lateral deflection of the wall during the experiment, and L7 and L8 were utilized to control the uplift of the foundation beam.
Figure 5 shows the internal instrumentation of the specimens. The strain gauges were attached to the horizontal and vertical rebar of each specimen, at different locations, to investigate the stress of the reinforcement during the tests.
A mixed force and displacement-controlled loading was adopted for the loading procedure in the test. One-cycle force-controlled loading was utilized at the elastic stage of the test walls, and two-cycle displacement-controlled loading was conducted at the plastic stage of the specimens, to fully develop the damage propagation. To obtain the post-peak behavior of the PRMSW, the tests were not terminated until the lateral strength of each specimen decreased to at least 65% of the experimentally recorded maximum capacity.
3. Experimental Results
3.1. Cracking Pattern
Figure 6 shows the final cracking patterns of the test walls. The cracks caused by the force in the push and pull directions were represented by the red lines and the blue lines, respectively. It can be observed that all the test walls showed predominantly flexural behavior in the positive (right/push) and negative (left/pull) loading directions, which was characterized by the horizontal cracks in the bed joints, in the bottom courses of the wall, at a low displacement. The outmost vertical rebar yielded due to the increasing tension load, which was consistent with the measurement of the strain gauge. The block, grouted concrete, mortar, and vertical rebar cooperated well with each other to carry the lateral loads. With increasing lateral load, the test wall reached its ultimate load (maximum load), with some vertical cracking at the end blocks under compression. As the lateral displacement increased, horizontal tensile cracks clearly appeared at the bottom of the specimen, and a repeated crack opening and closing process appeared at the first bed joint of the shear wall. At the post-peak stage, progressive deterioration of the wall toes was observed, consisting of face shell spalling, grout cracking, and rebar buckling. During this period, the lateral load of the specimens decreased gradually to 85% of the ultimate load, which was defined as the failure load. At the final loading stage, grout column crumbling and vertical rebar rupturing were observed at the wall toes. The tests were not terminated until the load capacity of the specimens exhibited distinct degradation and decreased to at least 65% of the ultimate load.
3.2. Hysteresis Curve
The hysteresis curve represents the relationship of the restoring force and the lateral displacement of a shear wall under horizontal earthquake action, which is of great importance to the evaluation of the seismic performance of the shear wall. Figure 7 presents the obtained hysteresis curves of the test specimens.
In summary, each specimen, except PMW-3B, exhibited a reasonably symmetric load–displacement relationship in the push and pull directions. The asymmetric hysteretic response of PMW-3B was due to the sudden failure of a displacement sensor. In spite of this, the results of PMW-3B, recorded before the failure, were considered to be reliable for the subsequent analysis. At the beginning of the test, the restoring force of each specimen varied linearly with the imposed displacement, and the loading curve nearly overlapped the unloading curve, proving that the test walls were in the elastic stage.
As the loading displacement increased, the specimens turned to the elastic-plastic stage. In this study, PMW-1 was taken as an example to display the development of the hysteresis curves at this stage. Figure 8 presents the hysteresis loops of PMW-1 at the first yielding of vertical reinforcement, at maximum load, at about 1% drift, and at 15% strength degradation. As observed, the hysteresis loop of the specimen at yield was pretty thin, indicating poor energy dissipation. The figure shows that the area of the hysteresis loop increased obviously with the increasing displacement, which indicates a higher level of dissipated energy, especially at the post-peak stage. Meanwhile, stiffness degradation gradually occurred with the increasing lateral displacement, as observed from the flatter loading curve of each loading cycle [24]. It should be noted that obvious pinching behavior was observed during the cyclic loading, which was due to the slide occurring between the surfaces of the rebar and the cracking concrete [25].
3.3. Lateral Load Capacity
General wall behavior in the test is summarized in Table 2. As observed, with the increase of the compression ratio, the capacity of the PRMSWs with concentrated vertical rebar at the sides and with evenly distributed reinforcement exhibited about a 37% and a 30% increase, respectively. Additionally, the increasing axial load also postponed the appearance of the horizontal flexural cracks in the wall, which was more obvious in the test walls with concentrated vertical rebar at the sides. Test results also showed that PMW-1 had a 5% higher flexural strength than PMW-3A/B, while PMW-2 experienced a 10% higher lateral load capacity than PMW-4. This proved that, under the same vertical reinforcement ratio, the shear walls with concentrated vertical rebar at the sides had better flexural strength than the shear walls with evenly distributed vertical reinforcement.
4. Experimental Analysis
4.1. Envelope Curve
4.1.1. Analysis
Figure 9 illustrates the envelope curves of the test walls, which were composed of the maximum loads, in both directions at the first cycle, for each loading displacement. The figure shows that the PRMSW exhibited ductile behavior in flexural failure, which is characterized by a relatively small strength degradation with increasing displacement after reaching the ultimate load. PMW-2 and PMW-4, both which had the higher compression ratio of 0.15, experienced higher lateral load capacities but more distinct stiffness degradation and less ductility compared to PMW-1 and PMW-3A/B, both which had the lower compression ratio of 0.10. In addition, under the same axial load, the specimens with concentrated vertical reinforcement at the sides achieved relatively higher lateral strength and less ductile behavior compared to the walls with the even vertical rebar distribution. It should be noted that the envelope curves of PMW-3A and PMW-3B were almost identical, which proved the good stability of PRMSWs’ seismic performance.
4.1.2. Envelope Curve Generalization
The envelope curves of the flexural failure of the shear walls are affected by many factors, including the aspect ratio, compression ratio, reinforcement, etc. To obtain the generalized relationship and investigate the post-peak behavior of the PRMSW, the envelope curves of the specimens were simplified and normalized, and a four-line envelope curve, described by dimensionless coordinates, could be obtained through the test data.
The key points of the generalized envelope curve are the yield point, the peak point, the failure point (the point corresponding to 85% Qu in the post-peak stage), and the ultimate point (the point corresponding to 65% Qu in the post-peak stage). The exact yielding point of the shear wall is difficult to acquire from the envelope curve. According to [26,27,28], there are several methods for the definition of the yield point, which include the geometric graphic method, the first yield method, and the reduced stiffness equivalent elasto-plastic method. In this paper, the yielding point of the test walls were defined by the equivalent elasto-plastic energy method [29], as shown in Figure 10. The calculated yielding displacement of each specimen is presented in Table 3. The peak point was defined as the point of the maximum lateral load during the test. For its relatively explicit value, the peak point () was chosen as the datum point, and the envelope curves of the five PRMSWs were normalized based on the datum point.
Through the linear regression analysis of the non-dimensional envelope curves, the coordinate of the yield point A was (0.34, 0.86); the coordinate of the peak point B was (1, 1); the coordinate of the failure point C was (1.80, 0.85), and the coordinate of the ultimate point D was (2.41, 0.65). Thus, the four-line simplified envelope curve can be expressed by Equation (1), and the generalized envelope curve is illustrated in Figure 11.
where
4.2. Lateral Drift
The average lateral drift of each specimen at ultimate load (Qu) and at failure load (Q0.85u) is presented in Table 3 in Section 4.1.2. At ultimate load, specimens with an axial compression ratio of 0.10 and 0.15 had an average drift of 0.81% and 0.52%, respectively, whereas specimens with evenly distributed rebar and concentrated vertical rebar had an average drift of 0.79% and 0.55%, respectively. Test results showed that the lateral drift of the PRMSW at ultimate load decreased with the increase of axial stress, and the walls with evenly distributed rebar had a favor deformation capacity. A similar trend was found in the drift of the test walls at failure. Considering that the average drift values at failure ranged from 0.95% (1/105) to 1.40% (1/71), the PRMSW under seismic design can be assigned a specified value of inelastic drift of 1/120 (i.e., 0.83%).
4.3. Displacement Ductility
The average displacement ductility values of each specimen at ultimate load and at failure load are summarized in Table 3. Based on the generalized envelope curves of the specimens, the ductility was calculated as the ratio of a specific displacement () to the yield displacement (), where in this study was chosen to be the displacement at the ultimate load (Qu) and at the failure load (Q0.85u), respectively. The yielding displacement () was determined by the method shown in Figure 10 in Section 4.1.2.
Table 3 shows that the ductility value of the specimens at failure load varied, in a range between 4.5 and 6.2, and were, on average, 73% larger than the values at the ultimate load, which proved the favorable ductile behavior of the PRMSW failing in flexure. Additionally, the test walls with evenly distributed vertical rebar exhibited a 21% larger ductility value at failure than the specimens with local concentrated reinforcement. The increase of the compression ratio from 0.10 to 0.15 resulted in an approximately 16% decrease in the ductility value of the shear wall. The compression load had a negative influence on the shear walls’ ductility, and similar results were reported by Zhang [30] and Shedid [31].
4.4. Degradation of Stiffness
The shear walls exhibited inelastic behavior under reversed lateral cyclic loading, and the envelope curves showed that the strength and stiffness of the specimens decreased in the inelastic stage, which indicated that the walls experienced accumulated damage. In this study, secant stiffness was applied to investigate the stiffness degradation of the specimens. The secant stiffness at each loading cycle () can be defined as Equation (2):
where and are the maximum lateral loads of the first th loading cycle in the push and pull directions, respectively; and and are the displacements corresponding to and , respectively.
Figure 12 shows the relationship between the secant stiffness and the lateral displacement, as well as the drift of the specimens. During the loading process, the stiffness of all specimens decreased following a power law as the displacement increased. The initial stiffness of PMW-2 and PMW-4 was larger than that of PMW-1 and PMW-3A/B, which revealed that the initial stiffness of the shear wall increased with higher axial compression load, as reported by Ma [29]. Nonetheless, compared with PMW-1 and PMW-3A/B, PMW-2 and PMW-4 exhibited faster stiffness degradation and relatively more brittle behavior. The axial stress demonstrated a significant effect on the specimens’ stiffness. For specimens with the same compression ratio and vertical reinforcement ratio, but different distributions, the stiffness declined in a similar trend, proving that the stiffness degradation of the PRMSW was not obviously influenced by the vertical rebar distribution.
4.5. Energy Dissipation and Equivalent Viscous Damping
Energy dissipation through hysteretic damping (Ed) is an important parameter in the analysis of the seismic performance of the shear wall, since it reduces the earthquake damage, and, thereby, reduces the strength and ductility demands in the seismic design of the structure. The dissipated energy (Ed) can be calculated by the area enclosed by the hysteresis loop at each loading increment [32], as shown in Figure 13.
Dissipated energy of the specimens in each first loading cycle is shown in Figure 14a. It was observed that the dissipated energy of all specimens exhibited a similar, considerable increase with the consecutive loading displacement, which proved the favorable energy dissipation capacity of the PRMSW. It should be noted that PMW-2 exhibited the most advantageous energy dissipation capacity because the lateral capacity of PMW-2 was larger than the other specimens, due to the higher axial compression load and the concentrated vertical rebar at the sides.
The equivalent viscous damping ratio () can be used to evaluate the energy dissipation capacity of the shear wall. According to [32], the equivalent viscous damping ratio can be defined as Equation (3):
where Ed represents the aforementioned dissipated energy; Es is the elastic strain energy of the test wall, stored in an equivalent linear elastic system in one loading cycle, and can be calculated by the trilateral area (the vertically hatched area) in Figure 13.
Figure 14b presents the relationship between the equivalent viscous damping ratio and the ratio of the lateral displacement of the specimen () and the displacement corresponding to the ultimate load (). As observed, the increase of the hysteresis damping started at a displacement of about 0.5 . The equivalent viscous damping ratio ranged from 9% to 13% at the ultimate load, and ranged from about 13% to 19% at the displacement of 2 times . Figure 14b showed that the distribution of vertical rebar did not have significant influence on the hysteresis damping of the shear wall. By contrast, specimens PMW-1 and PMW-3A/B, both with a compression ratio of 0.10, exhibited approximately a 38% increase of at ultimate load than that of PMW-2 and PMW-4, both with a compression ratio of 0.15, indicating that axial compression load had an obviously detrimental effect on the equivalent viscous damping ratio of the specimens. It was inferred that the shear wall with a lower axial load exhibited more efficient energy dissipation.
5. Numerical Analysis
In this study, the seismic performance of PRMSW was investigated using the software ABAQUS. The test walls were finite element modeling and the performance of low cycle loading in the experiment was simulated by using the monotonic loading [33]. The damage process, skeleton curve, and mechanical characteristics of the shear walls were studied, and the numerical results were compared with the experimental results.
5.1. Material Constitutive Model
The concrete damaged plasticity model in ABAQUS was chosen to simulate the grouted masonry due to the similar mechanical property of masonry material with concrete [34]. The compressive stress–strain relationship of masonry proposed by Liu [35] was applied in the simulation, which was described by Equation (4):
where ; and are the peak compressive strain and the compressive strength of the grouted masonry, respectively.
With the hypothesis that the masonry would be without damage before reaching peak stress, the descending curve of the tensile stress–strain relationship was described as Equation (5):
where ; and are the peak tensile strain and the tensile strength of the grouted masonry, respectively; is the coefficient at the descending stage of the tensile stress–strain curve and . In this study, and 1.95.
To obtain an acceptable rate of convergence, the unsymmetrical matrix storage and solution scheme were used in the analysis of the concrete damaged plasticity in ABAQUS. Additionally, the concrete damaged plasticity model in ABAQUS can be applied in conjunction with the viscoplastic regularization of the constitutive equations to improve the convergence rate in the softening regime. The plastic parameters of the concrete damaged plasticity model in this study are tabulated in Table 4.
The reinforcement of the specimens was simulated by the “plasticity” model in ABAQUS, and the tensile stress–strain relationship of the rebar was described by the curve shown in Figure 15, in which , Es = 2 × 10⁵ N/mm2, and the Poisson’s ratio was 0.3.
5.2. Finite Element Model
The grouted masonry walls were modeled by C3D8R, a kind of 8-node linear reduced integration 3D solid element, and the rebar were modeled by T3D2, a kind of 2-node linear 3D truss element. The components to simulate the shear wall, reinforcement, loading beam, and foundation were created separately and assembled to a whole model. The reinforcement was embedded into the grouted masonry wall.
In the analysis, the foundation of the specimen was fixed on the ground to simulate the actual boundary condition. For loading, a uniform vertical load was firstly executed to the loading beam at the top of the wall, which has a value of 2.5 × 10⁶ N/m2 for PMW-1 and PMW-3A/B, and 3.8 × 10⁶ N/m2 for PMW-2 and PMW-4. Second, a monotonic horizontal displacement load was applied to a reference point on the loading beam to simulate the actual loading process of the test.
5.3. Simulation Results
5.3.1. Stress Distribution
The stress distribution diagrams of the specimens, at the ultimate lateral loading displacement, are shown in Figure 16. The stress of the prefabricated masonry shear wall is concentrated at the specimens’ bottom region. When the specimens reached the ultimate displacement, the maximum stress of the masonry wall occurred at the compression side of the wall, and the maximum stress of the rebar appeared at the tension side, indicating the typical damage characteristics of flexural failure. The influence of the axial compression ratio and the vertical rebar distribution on the stress of the masonry wall and the rebar can also be observed at the numerical results. The simulation phenomena basically agree well with the laboratory findings.
5.3.2. Envelope Curve
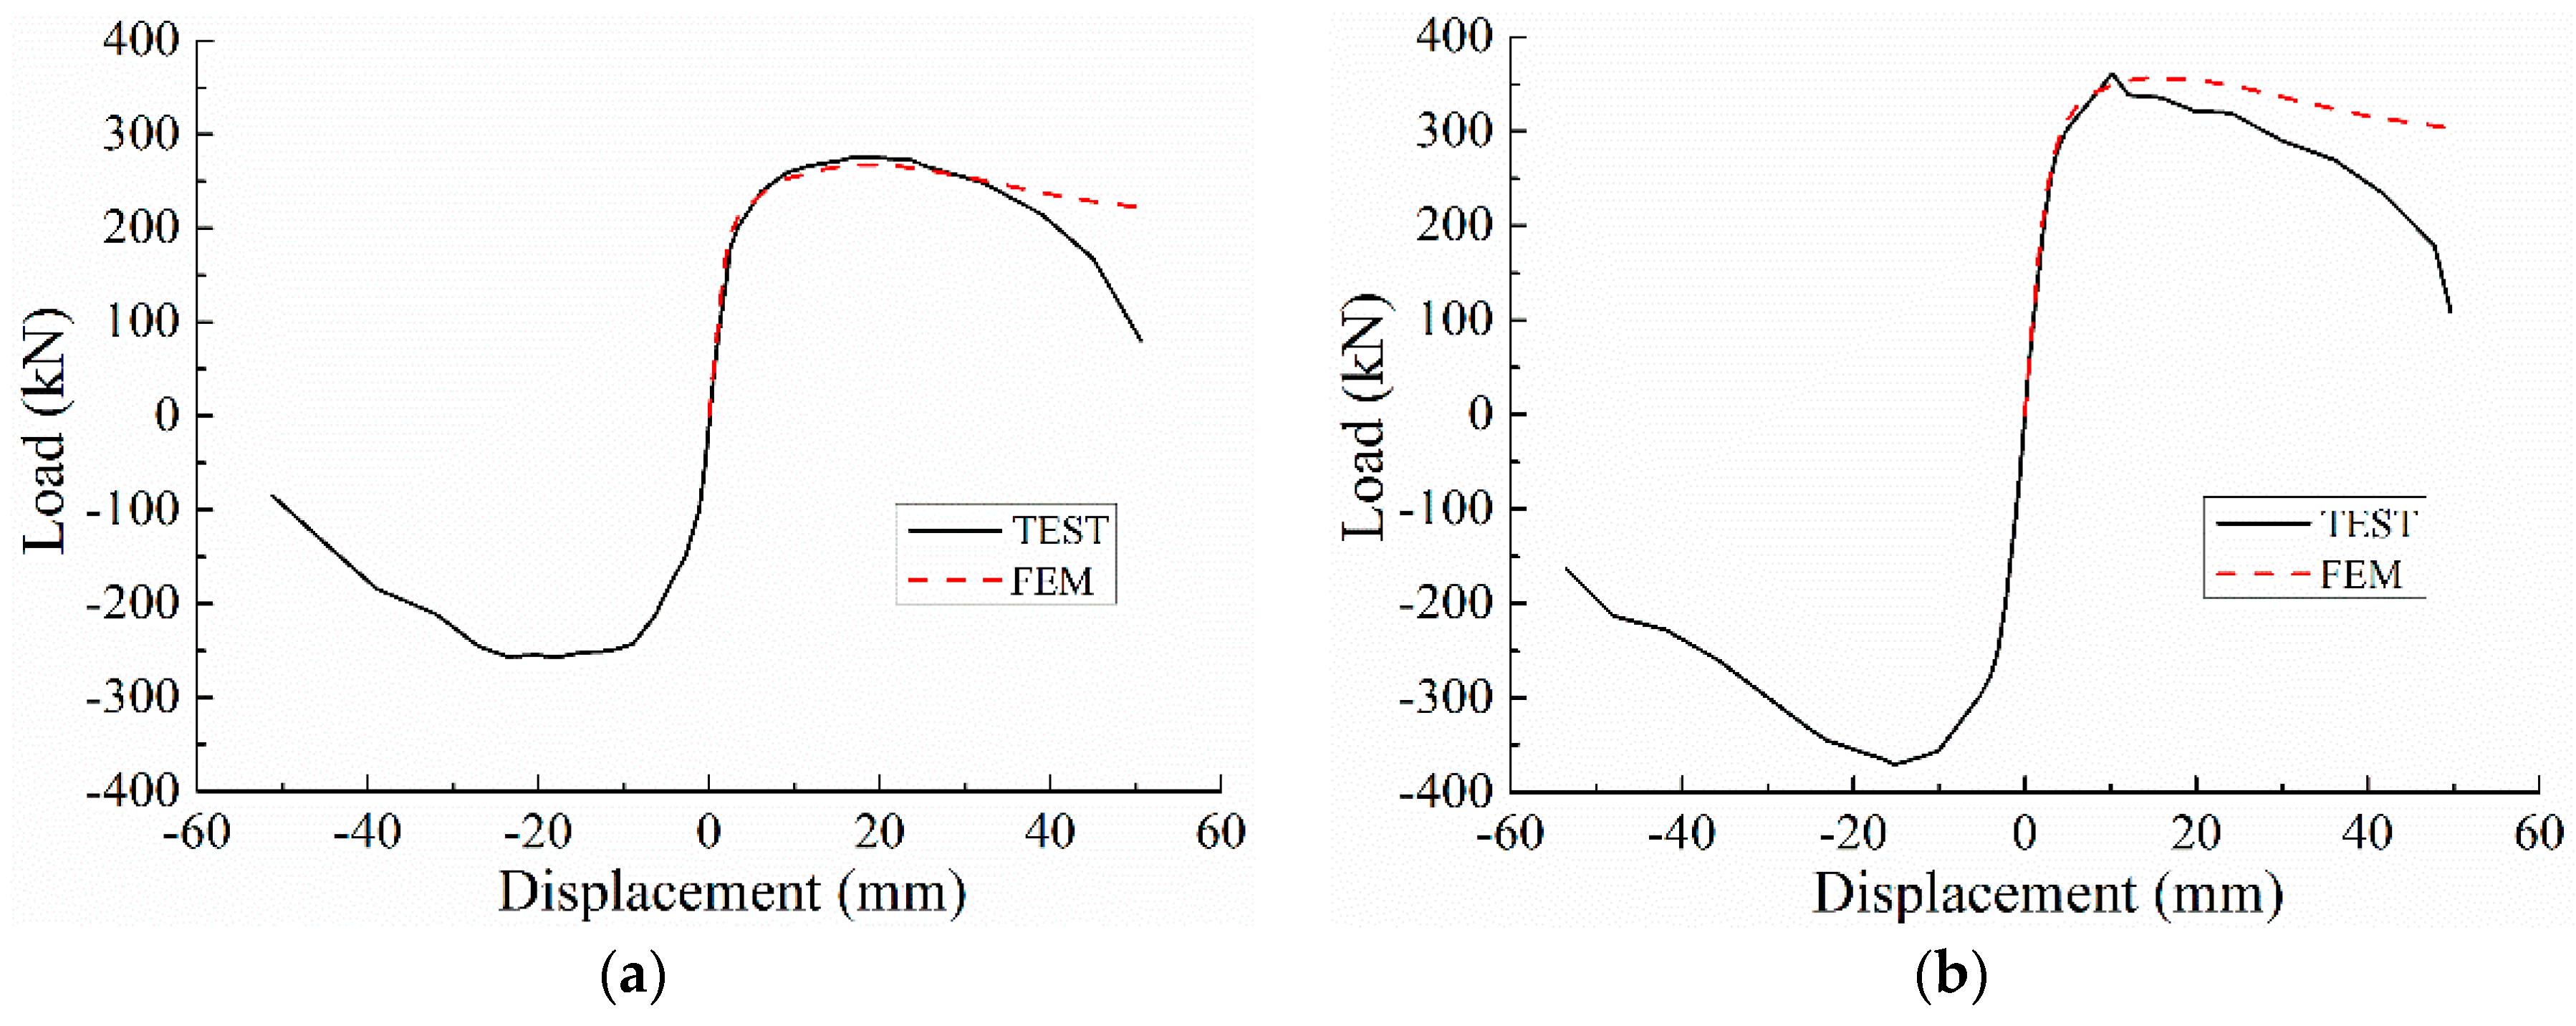
The envelope curves of the specimens, obtained by the experimental results and numerical analysis, are shown in Figure 17. It was shown that the test and the simulation results were basically consistent for the stiffness and the lateral load capacity of the PRMSWs. The slope of the descending stage in the experimental envelope curves were larger than that of the numerical curves due to the serious damage of the specimens at the final loading stage of the test, which included the wall toe crushing and the vertical rebar rupturing. In summary, the numerical envelope curves are in good agreement with the test results.
6. Summary and Conclusions
This paper presents an experimental and numerical study of the prefabricated reinforced masonry shear walls (PRMSWs). Five full-scale fully-grouted PRMSWs were tested under a reversed lateral cyclic test and simulated by ABAQUS. The seismic performance of the specimens was studied based on the failure mode, hysteresis curve, stiffness degradation, lateral drift, ductility, and energy dissipation capacity.
The main findings and conclusions of the research are summarized as follows:
- The PRMSW exhibited acceptable flexural capacities and seismic performance stability under cyclic loading.
- The distribution of the vertical rebar had an effect on the inelastic behavior of the shear wall. The specimens with concentrated vertical rebar at the sides exhibited relatively higher load capacity and less ductility compared to the walls with evenly distributed rebar, under the same vertical reinforcement ratio. Nonetheless, minimal influence from the distribution of the vertical reinforcement was found on the stiffness degradation of the PRMSW.
- Axial stress had a significant influence on the seismic performance of the PRMSW. The increase of the axial stress lead to higher flexural strength and initial stiffness but the more brittle inelastic behavior of the PRMSW.
- The PRMSW showed excellent ductile behavior in the plastic stage. The average drift values of the specimens at failure ranged from 0.95% to 1.40%, and the PRMSW under seismic design could be assigned the inelastic drift limit value of 1/120. The PRMSW exhibited favorable energy capacity, and the specimens with a lower axial stress and evenly distributed rebar exhibited a more efficient energy dissipation. The equivalent viscous damping ratio of the PRMSW was 9% to 13% at ultimate load.
- The finite element simulation of the PRMSW basically agrees well with the experimental results. The results obtained from the numerical analysis indicate that the concrete damaged plasticity model in ABAQUS can be used for the seismic performance simulation of the prefabricated reinforced masonry shear walls.
In conclusion, this paper investigated the seismic performance of the new type of PRMSW failing in flexure, and the influence of the axial stress and the distribution of vertical rebar were analyzed. It should be noted that many other parameters were not considered, such as aspect ratio, vertical reinforced ratio, and boundary conditions. Further research is needed to obtain enough data about the PRMSWs in flexural failure and shear failure with different test parameters. Additional theoretical and numerical studies have the potential to improve the research and engineering applications of the PRMSW.
Author Contributions
Formal analysis, W.X., X.Y. and B.C.; Methodology, F.W.; Writing—original draft, W.X.; Writing—review & editing, F.W.
Funding
This research received no external funding.
Acknowledgments
The research was conducted with the financial support of the National Key R&D Plan, China (Grant No. 2016YFC0701502-3).
Conflicts of Interest
The authors declare no conflict of interest.
References
- Li, J.; Wang, Y.; Lu, Z.; Li, J. Experimental Study and Numerical Simulation of a Laminated Reinforced Concrete Shear Wall with a Vertical Seam. Appl. Sci. 2017, 7, 629. [Google Scholar] [CrossRef]
- Todut, C.; Dan, D.; Stoian, V. Theoretical and experimental study on prefabricated reinforced concrete wall panels subjected to shear force. Eng. Struct. 2014, 80, 323–338. [Google Scholar] [CrossRef]
- Wu, L.; Tian, Y.; Su, Y.; Chen, H. Seismic performance of prefabricated composite shear walls reinforced by concrete-filled steel tubes. Eng. Struct. 2018, 162, 72–83. [Google Scholar] [CrossRef]
- Wang, F.L.; Zhang, X.C.; Zhu, F. Research progress and low-carbon property of reinforced concrete block masonry structures in China. In Proceedings of the 16th International Brick and Block Masonry Conference, Padova, Italy, 26–30 June 2016. [Google Scholar]
- Xu, W.; Yang, X.; Wang, F. Experimental Investigation on the Seismic Behavior of Newly-Developed Precast Reinforced Concrete Block Masonry Shear Walls. Appl. Sci. 2018, 8, 1071. [Google Scholar] [CrossRef]
- Shing, P.B.; Schuller, M.; Houskere, V.S.; Carter, E. Flexural and shear response of reinforced masonry walls. Struct. J. 1990, 87, 646–656. [Google Scholar]
- Voon, K.C.; Ingham, J.M. Experimental in-plane shear strength investigation of reinforced concrete masonry walls. J. Struct. Eng. 2006, 3, 400–408. [Google Scholar] [CrossRef]
- Hori, N.; Inoue, N.; Purushotam, D.; Nishida, T.; Kobayashi, J. Experimental and analytical studies on earthquake resisting behaviour of confined concrete block masonry structures. Earthq. Eng. Struct. D 2006, 35, 1699–1719. [Google Scholar] [CrossRef]
- Ahmadi, F.; Hernandez, J.; Sherman, J.; Kapoi, C.; Klingner, R.E.; McLean, D.I. Seismic performance of cantilever-reinforced concrete masonry shear walls. J. Struct. Eng. 2014, 140, 04014051. [Google Scholar] [CrossRef]
- Shedid, M.T.; Drysdale, R.G.; El-Dakhakhni, W.W. Behavior of fully grouted reinforced concrete masonry shear walls failing in flexure: Experimental results. J. Struct. Eng. 2008, 134, 1754–1767. [Google Scholar] [CrossRef]
- Shedid, M.T.; El-Dakhakhni, W.W. Plastic hinge model and displacement-based seismic design parameter quantifications for reinforced concrete block structural walls. J. Struct. Eng. 2014, 140, 04013090. [Google Scholar] [CrossRef]
- Ezzeldin, M.; Wiebe, L.; El-Dakhakhni, W. Seismic collapse risk assessment of reinforced masonry walls with boundary elements using the FEMA p695 methodology. J. Struct. Eng. 2016, 142, 04016108. [Google Scholar] [CrossRef]
- Ibrahim, S.K.; Suter, G.T. Ductility of concrete masonry shear walls subjected to cyclic loading. In Proceedings of the Eighth North American Masonry Conference, Austin, TX, USA, 6–9 June 1999. [Google Scholar]
- Eikanas, I.K. Behavior of Concrete Masonry Shear Walls with Varying Aspect Ratio and Flexural Reinforcement. Master’s Thesis, Washington State University, Pullman, WA, USA, 2003. [Google Scholar]
- Shedid, M.T.; El-Dakhakhni, W.W.; Drysdale, R.G. Characteristics of Rectangular, Flanged, and End-Confined Reinforced Concrete Masonry Shear Walls for Seismic Design. J. Struct. Eng. 2010, 136, 1471–1482. [Google Scholar] [CrossRef]
- Hibbitt, D.; Karlsson, B.; Sorensen, P. Abaqus/CAE User’s Manual; ABAQUS Inc.: Pawtucket, RI, USA, 2016. [Google Scholar]
- Ministry of Housing and Urban-Rural Development of the People’s Republic of China. Test Methods for Concrete Block and Brick; GB/T 4111-2013; Architecture & Industry Press of China: Beijing, China, 2013.
- Ministry of Housing and Urban-Rural Development of the People’s Republic of China. Standard Test Method for Performance of Building Mortar; JGJ/T 70-2009; Architecture & Industry Press of China: Beijing, China, 2010.
- Ministry of Housing and Urban-Rural Development of the People’s Republic of China. Standard for Evaluation of Concrete Compressive Strength; GB/T 50107-2010; Architecture & Industry Press of China: Beijing, China, 2010.
- Ministry of Housing and Urban-Rural Development of the People’s Republic of China. Standard for Test Method of Basic Mechanics Properties of Masonry; GB/T 50129-2011; Architecture & Industry Press of China: Beijing, China, 2011.
- Ministry of Housing and Urban-Rural Development of the People’s Republic of China. Guide for the Implementation of Metallic Materials at Room Temperature Tensile Test Method; GB/T 228-2010; Architecture & Industry Press of China: Beijing, China, 2010.
- Ministry of Housing and Urban-Rural Development of the People’s Republic of China. Code for Seismic Design of Buildings; GB 50011-2010; Architecture & Building Press: Beijing, China, 2010.
- Ministry of Housing and Urban-Rural Development of the People’s Republic of China. Code for Design of Masonry Structures; GB 50003-2011; Architecture & Industry Press: Beijing, China, 2011.
- Haach, V.G.; Vasconcelos, G.A.; Lourenço, P.B. Experimental Analysis of Reinforced Concrete Block Masonry Walls Subjected to In-Plane Cyclic Loading. J. Struct. Eng. 2010, 136, 452–462. [Google Scholar] [CrossRef]
- Park, Y.J.; Ang, A.H.; Wen, Y.K. Seismic damage analysis of reinforced concrete buildings. J. Struct. Eng. 1985, 111, 740–757. [Google Scholar] [CrossRef]
- Wang, W.; Wang, Y.; Lu, Z. Experimental study on seismic behavior of steel plate reinforced concrete composite shear wall. Eng. Struct. 2018, 160, 281–292. [Google Scholar] [CrossRef]
- Lu, X.L. Seismic Theory of Complex High-Rise Structures with Application; Science Press: Beijing, China, 2007. (In Chinese) [Google Scholar]
- Park, R. Ductility evaluation from laboratory and analytical testing. In Proceedings of the Ninth World Conference on Earthquake Engineering, Tokyo-Kyoto, Japan, 2–9 August 1988; pp. 605–616. [Google Scholar]
- Ma, G.; Huang, L.; Yan, L.; Kasal, B.; Chen, L.; Tao, C. Experimental performance of reinforced double H-block masonry shear walls under cyclic loading. Mater. Struct. 2017, 50, 70. [Google Scholar] [CrossRef]
- Zhang, Y.F.; Wang, Z.H. Seismic behavior of reinforced concrete shear walls subjected to high axial loading. J. Struct. Eng. 2000, 97, 739–750. [Google Scholar]
- Shedid, M.T. Ductility of Reinforced Concrete Masonry Shear Walls. Master’s Thesis, Department of Civil Engineering, McMaster University, Hamilton, ON, Canada, 2006. [Google Scholar]
- Chopra, A.K. Dynamics of Structures: Theory and Applications to Earthquake Engineering, 3rd ed.; Pearson Prentice Hall: Upper Saddle River, NJ, USA, 2007. [Google Scholar]
- Liu, W.; Cao, W.; Zhang, J.; Qiao, Q.; Ma, H. Seismic Performance of Composite Shear Walls Constructed Using Recycled Aggregate Concrete and Different Expandable Polystyrene Configurations. Materials 2016, 9, 148. [Google Scholar] [CrossRef] [PubMed]
- Karimi, A.H.; Karimi, M.S.; Kheyroddin, A.; Shahkarami, A.A. Experimental and Numerical Study on Seismic Behavior of An Infilled Masonry Wall Compared to An Arched Masonry Wall. Structures 2016, 8, 144–153. [Google Scholar] [CrossRef]
- Liu, L.; Zhang, L.; Zhai, C.; Zhai, X. Experimental Research on Grouted Concrete Block Masonry’s Constitutive Law under Plain Stress State. J. Harbin. Inst. Technol. 2007, 39, 1900–1903. [Google Scholar]
Figure 1.
Dimensions of the concrete hollow blocks (mm): (a) Full block; and (b) half block.

Figure 2.
Design of test specimens (mm).
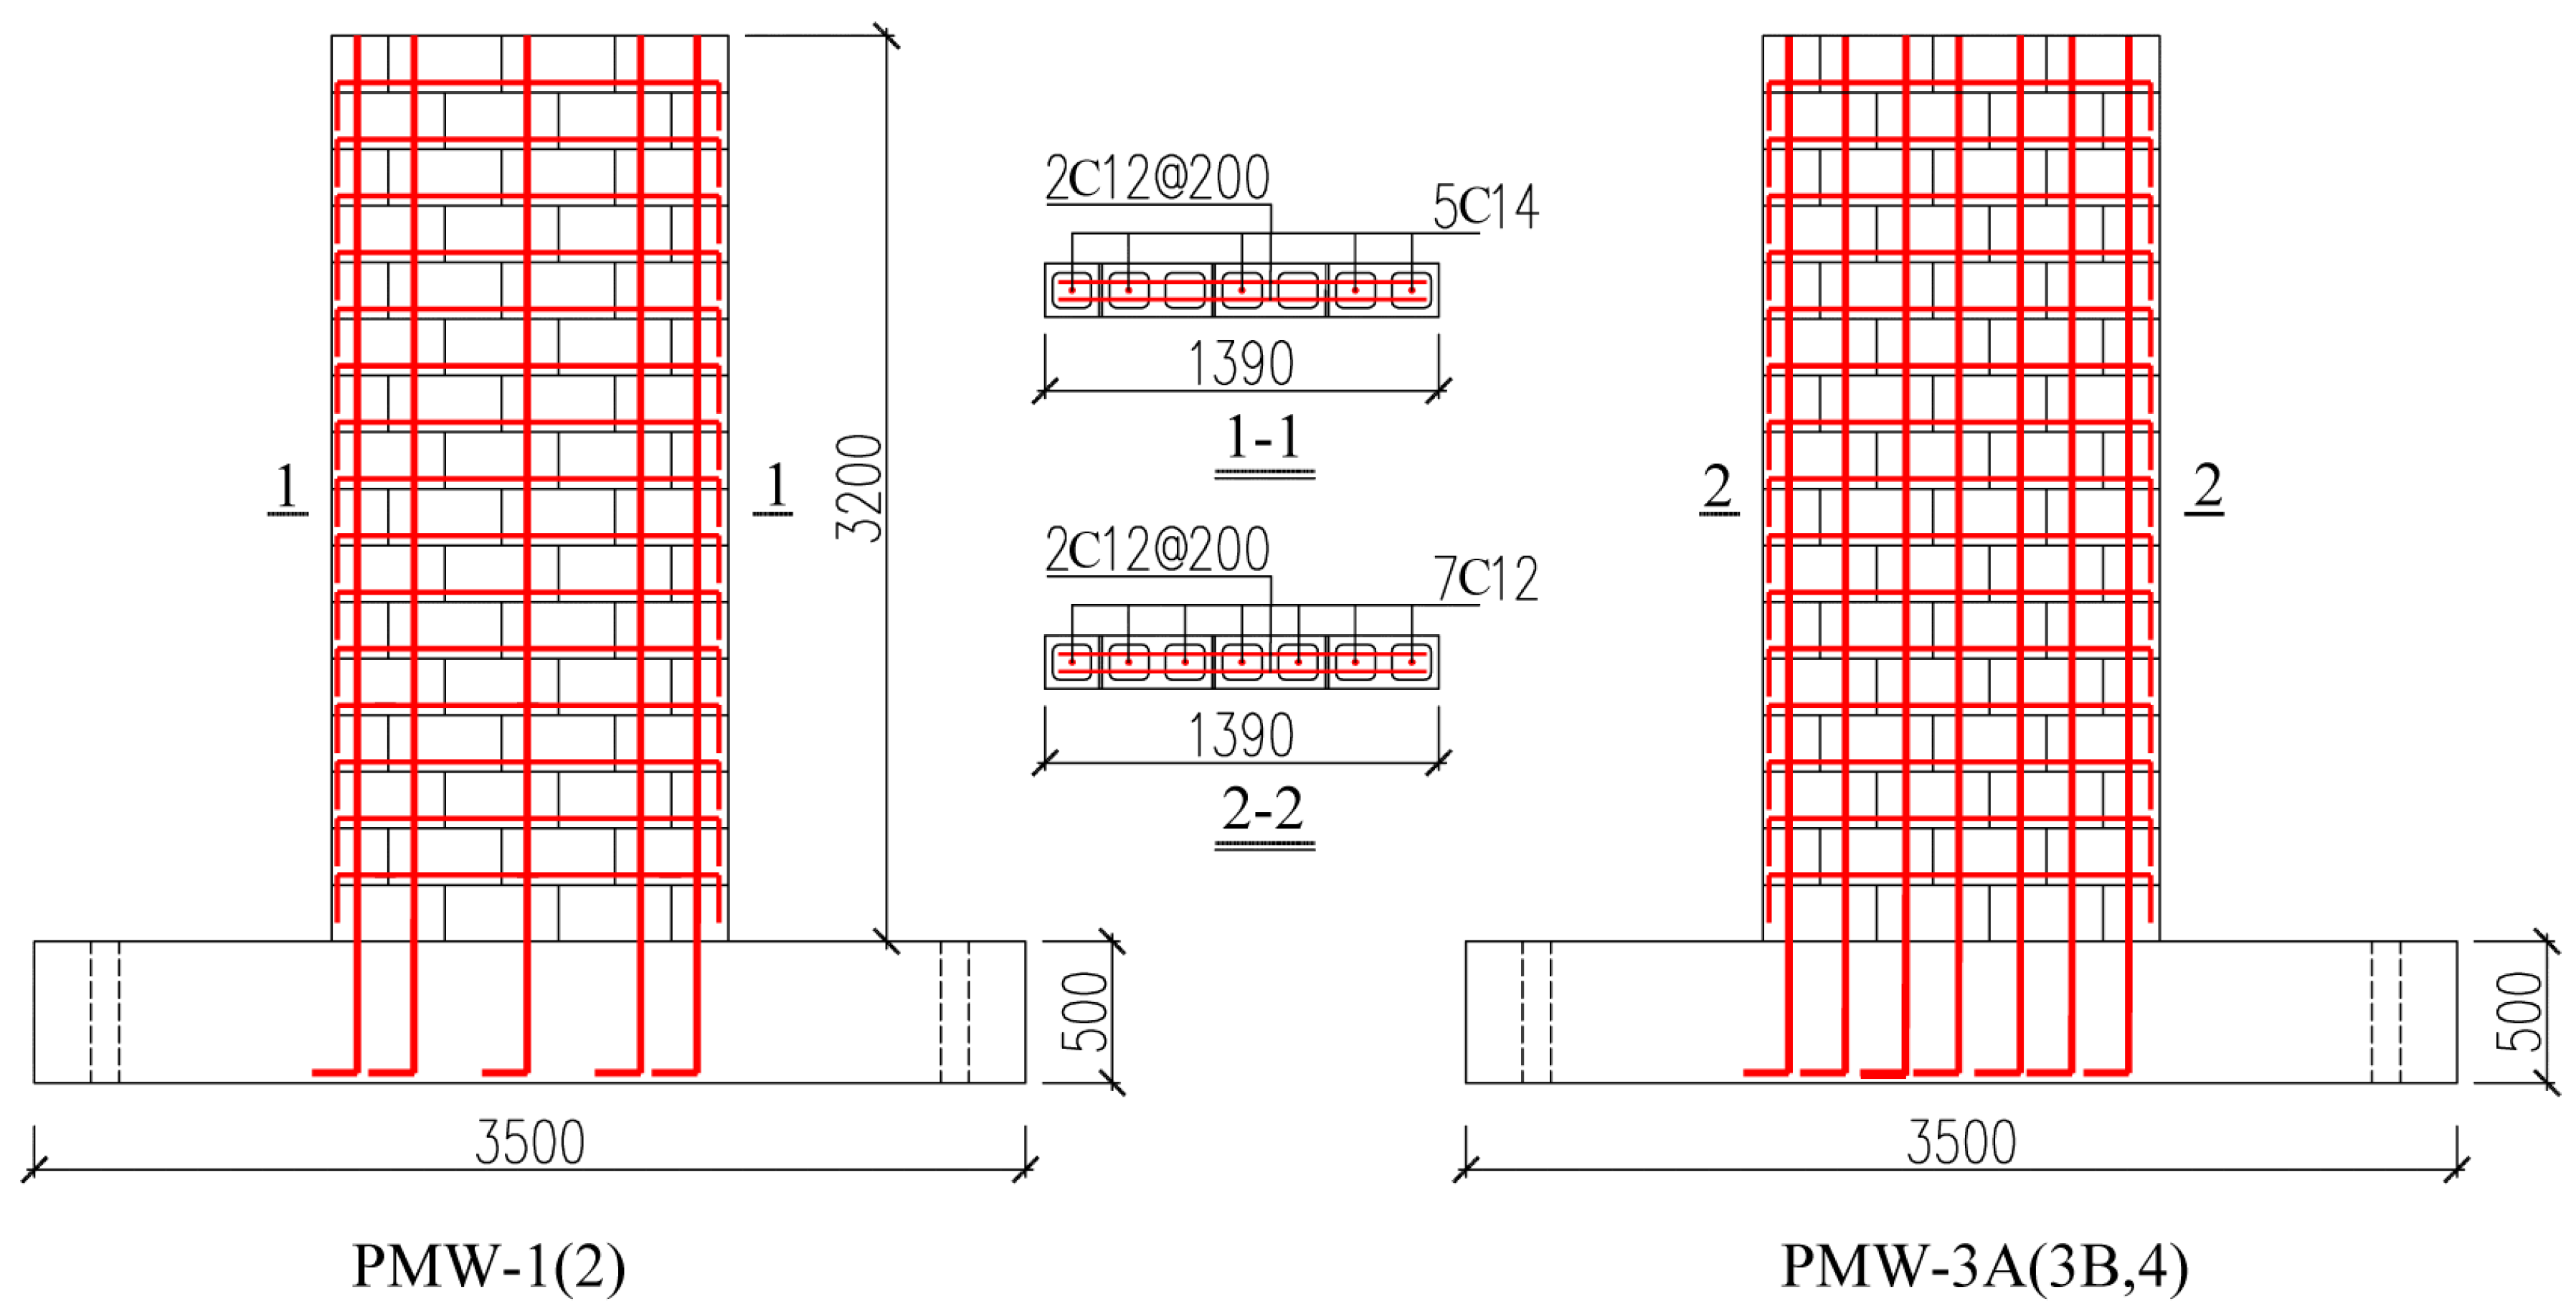
Figure 3.
Construction procedures for the prefabricated reinforced masonry shear wall (PRMSW): (a) Construction of the foundation beam and the vertical rebar; (b) lifting and assembling the prefabricated wall; (c) checking the perpendicularity of the PRMSW; and (d) the fixing of the PRMSW using a stretchable anchor bolt.

Figure 4.
Test setup and instrumentation for cyclic test: (a) Test setup; and (b) schematic diagram.
Figure 4.
Test setup and instrumentation for cyclic test: (a) Test setup; and (b) schematic diagram.

Figure 5.
The internal instrumentation for cyclic test: (a) Strain gauges of PMW-1 and PMW-2; (b) strain gauges of PMW-3A/B and PMW-4.
Figure 5.
The internal instrumentation for cyclic test: (a) Strain gauges of PMW-1 and PMW-2; (b) strain gauges of PMW-3A/B and PMW-4.
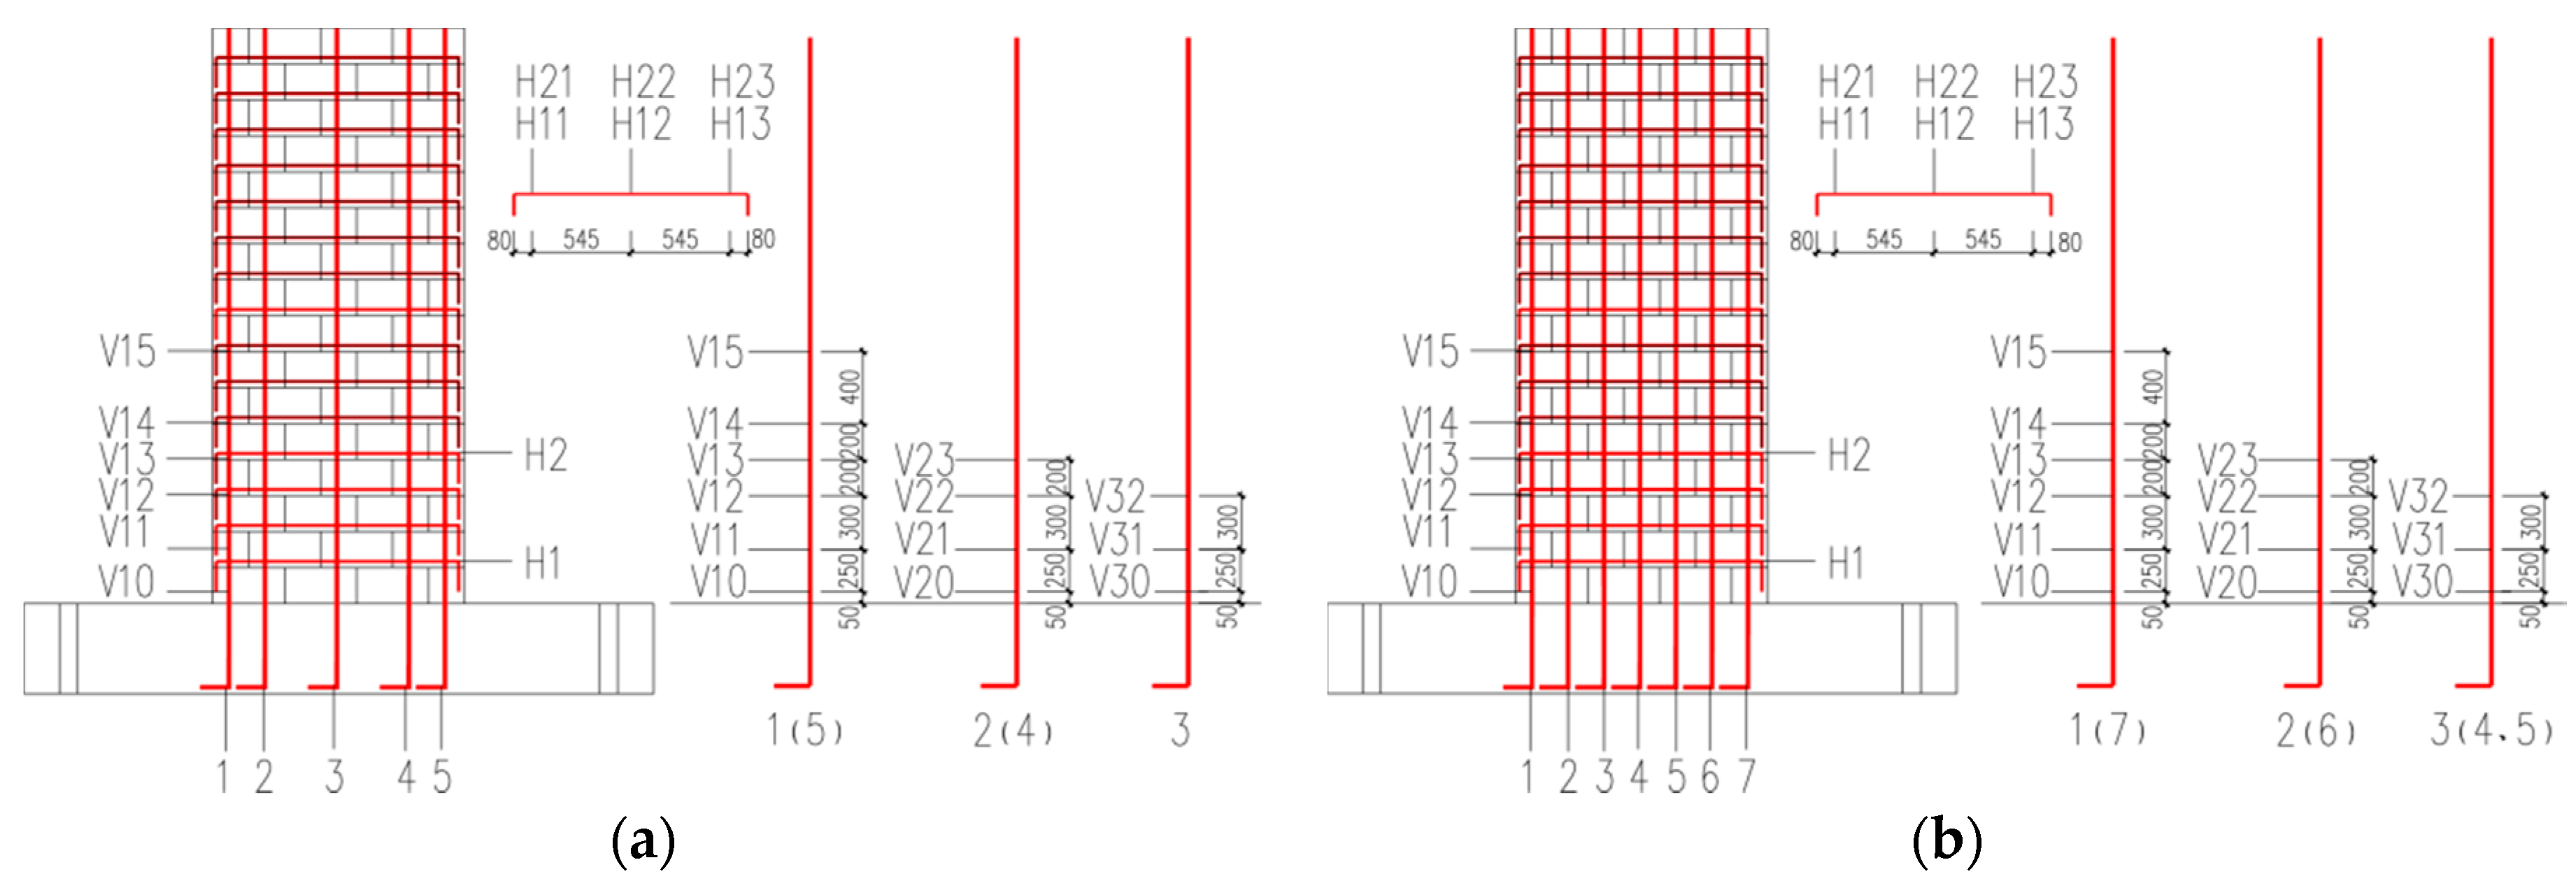
Figure 6.
Masonry wall cracking patterns: (a) PMW-1; (b) PMW-2; (c) PMW-3A; (d) PMW-3B; and (e) PMW-4.
Figure 6.
Masonry wall cracking patterns: (a) PMW-1; (b) PMW-2; (c) PMW-3A; (d) PMW-3B; and (e) PMW-4.

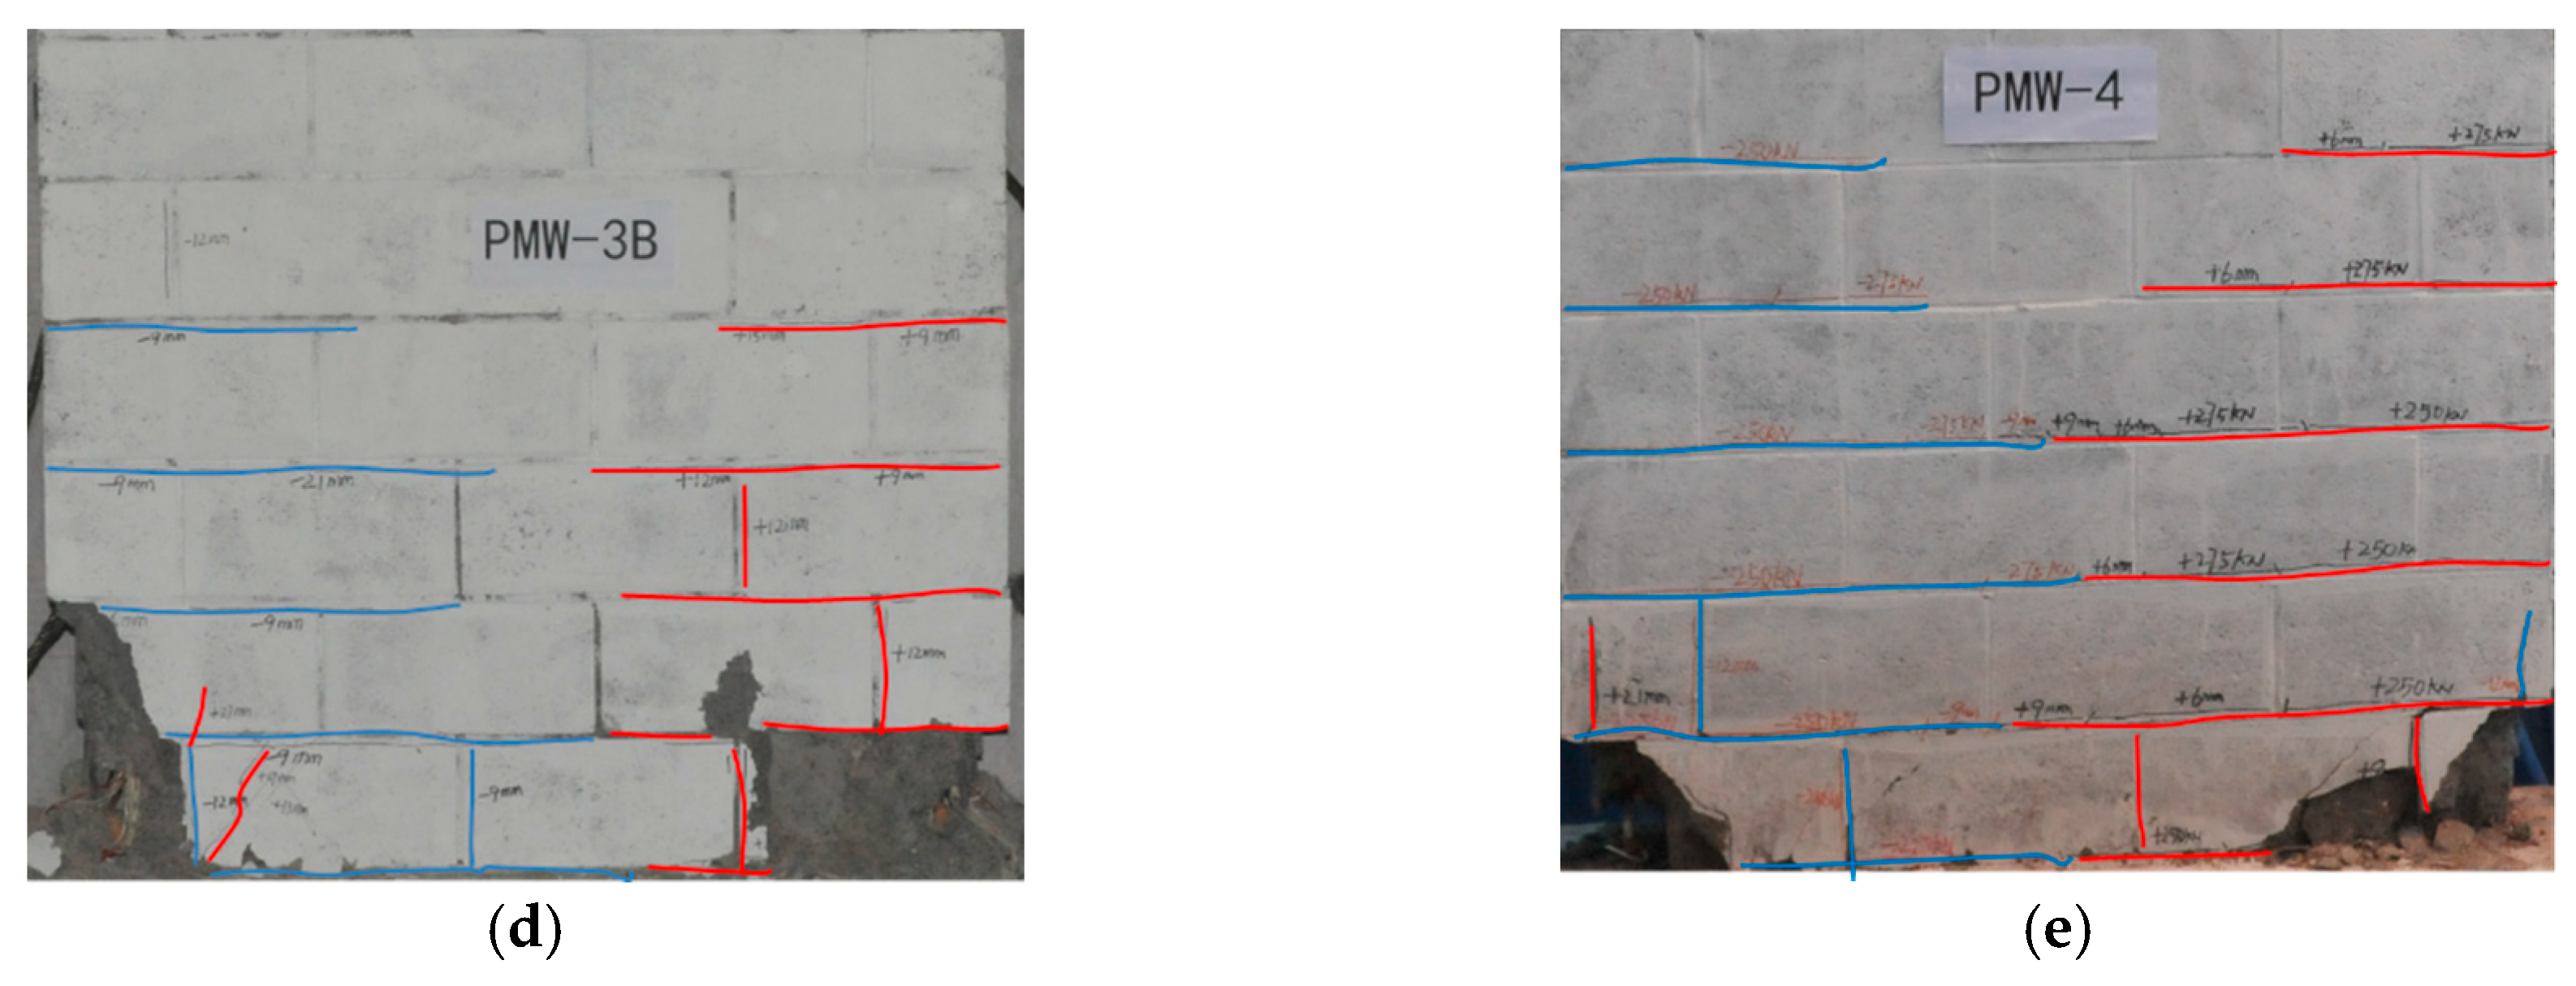
Figure 7.
Force–displacement hysteresis curves of the tested walls: (a) PMW-1; (b) PMW-2; (c) PMW-3A; (d) PMW-3B; and (e) PMW-4.
Figure 7.
Force–displacement hysteresis curves of the tested walls: (a) PMW-1; (b) PMW-2; (c) PMW-3A; (d) PMW-3B; and (e) PMW-4.
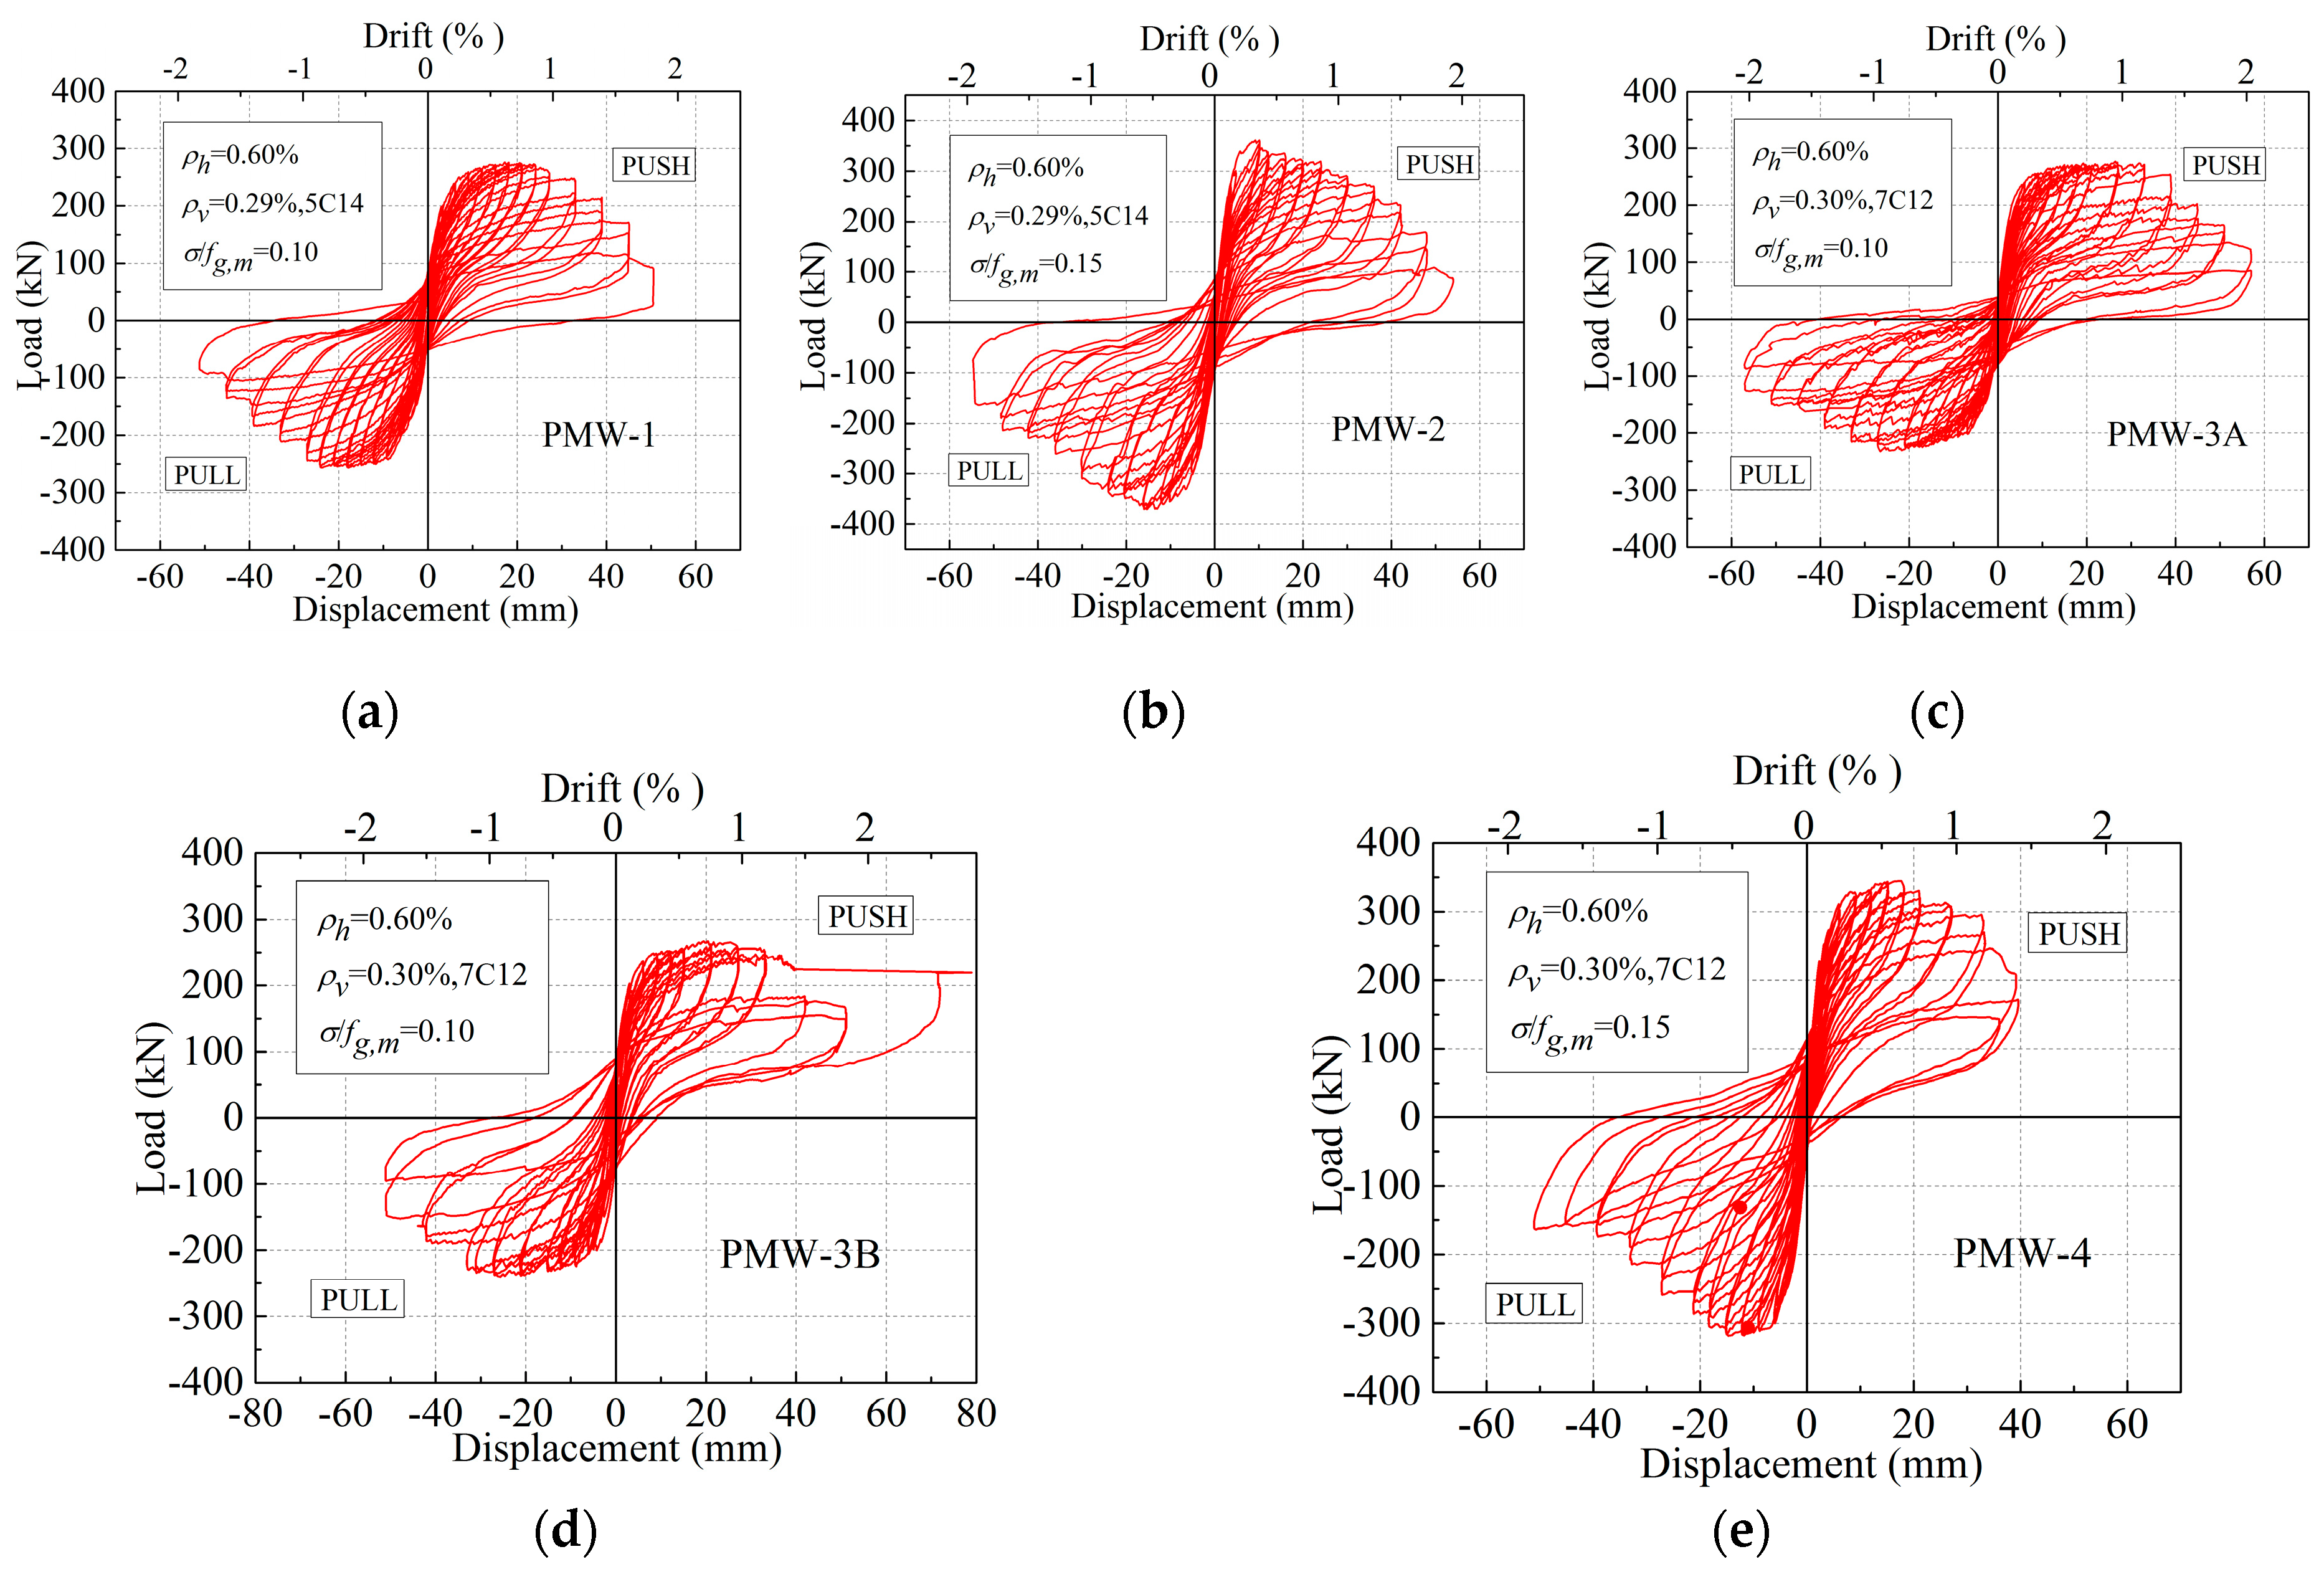
Figure 8.
Hysteresis loops of PMW-1: (a) Hysteresis loop at yielding; (b) hysteresis loop at ultimate load; (c) hysteresis loop at about 1% drift; (d) hysteresis loop at 15% strength degradation.
Figure 8.
Hysteresis loops of PMW-1: (a) Hysteresis loop at yielding; (b) hysteresis loop at ultimate load; (c) hysteresis loop at about 1% drift; (d) hysteresis loop at 15% strength degradation.
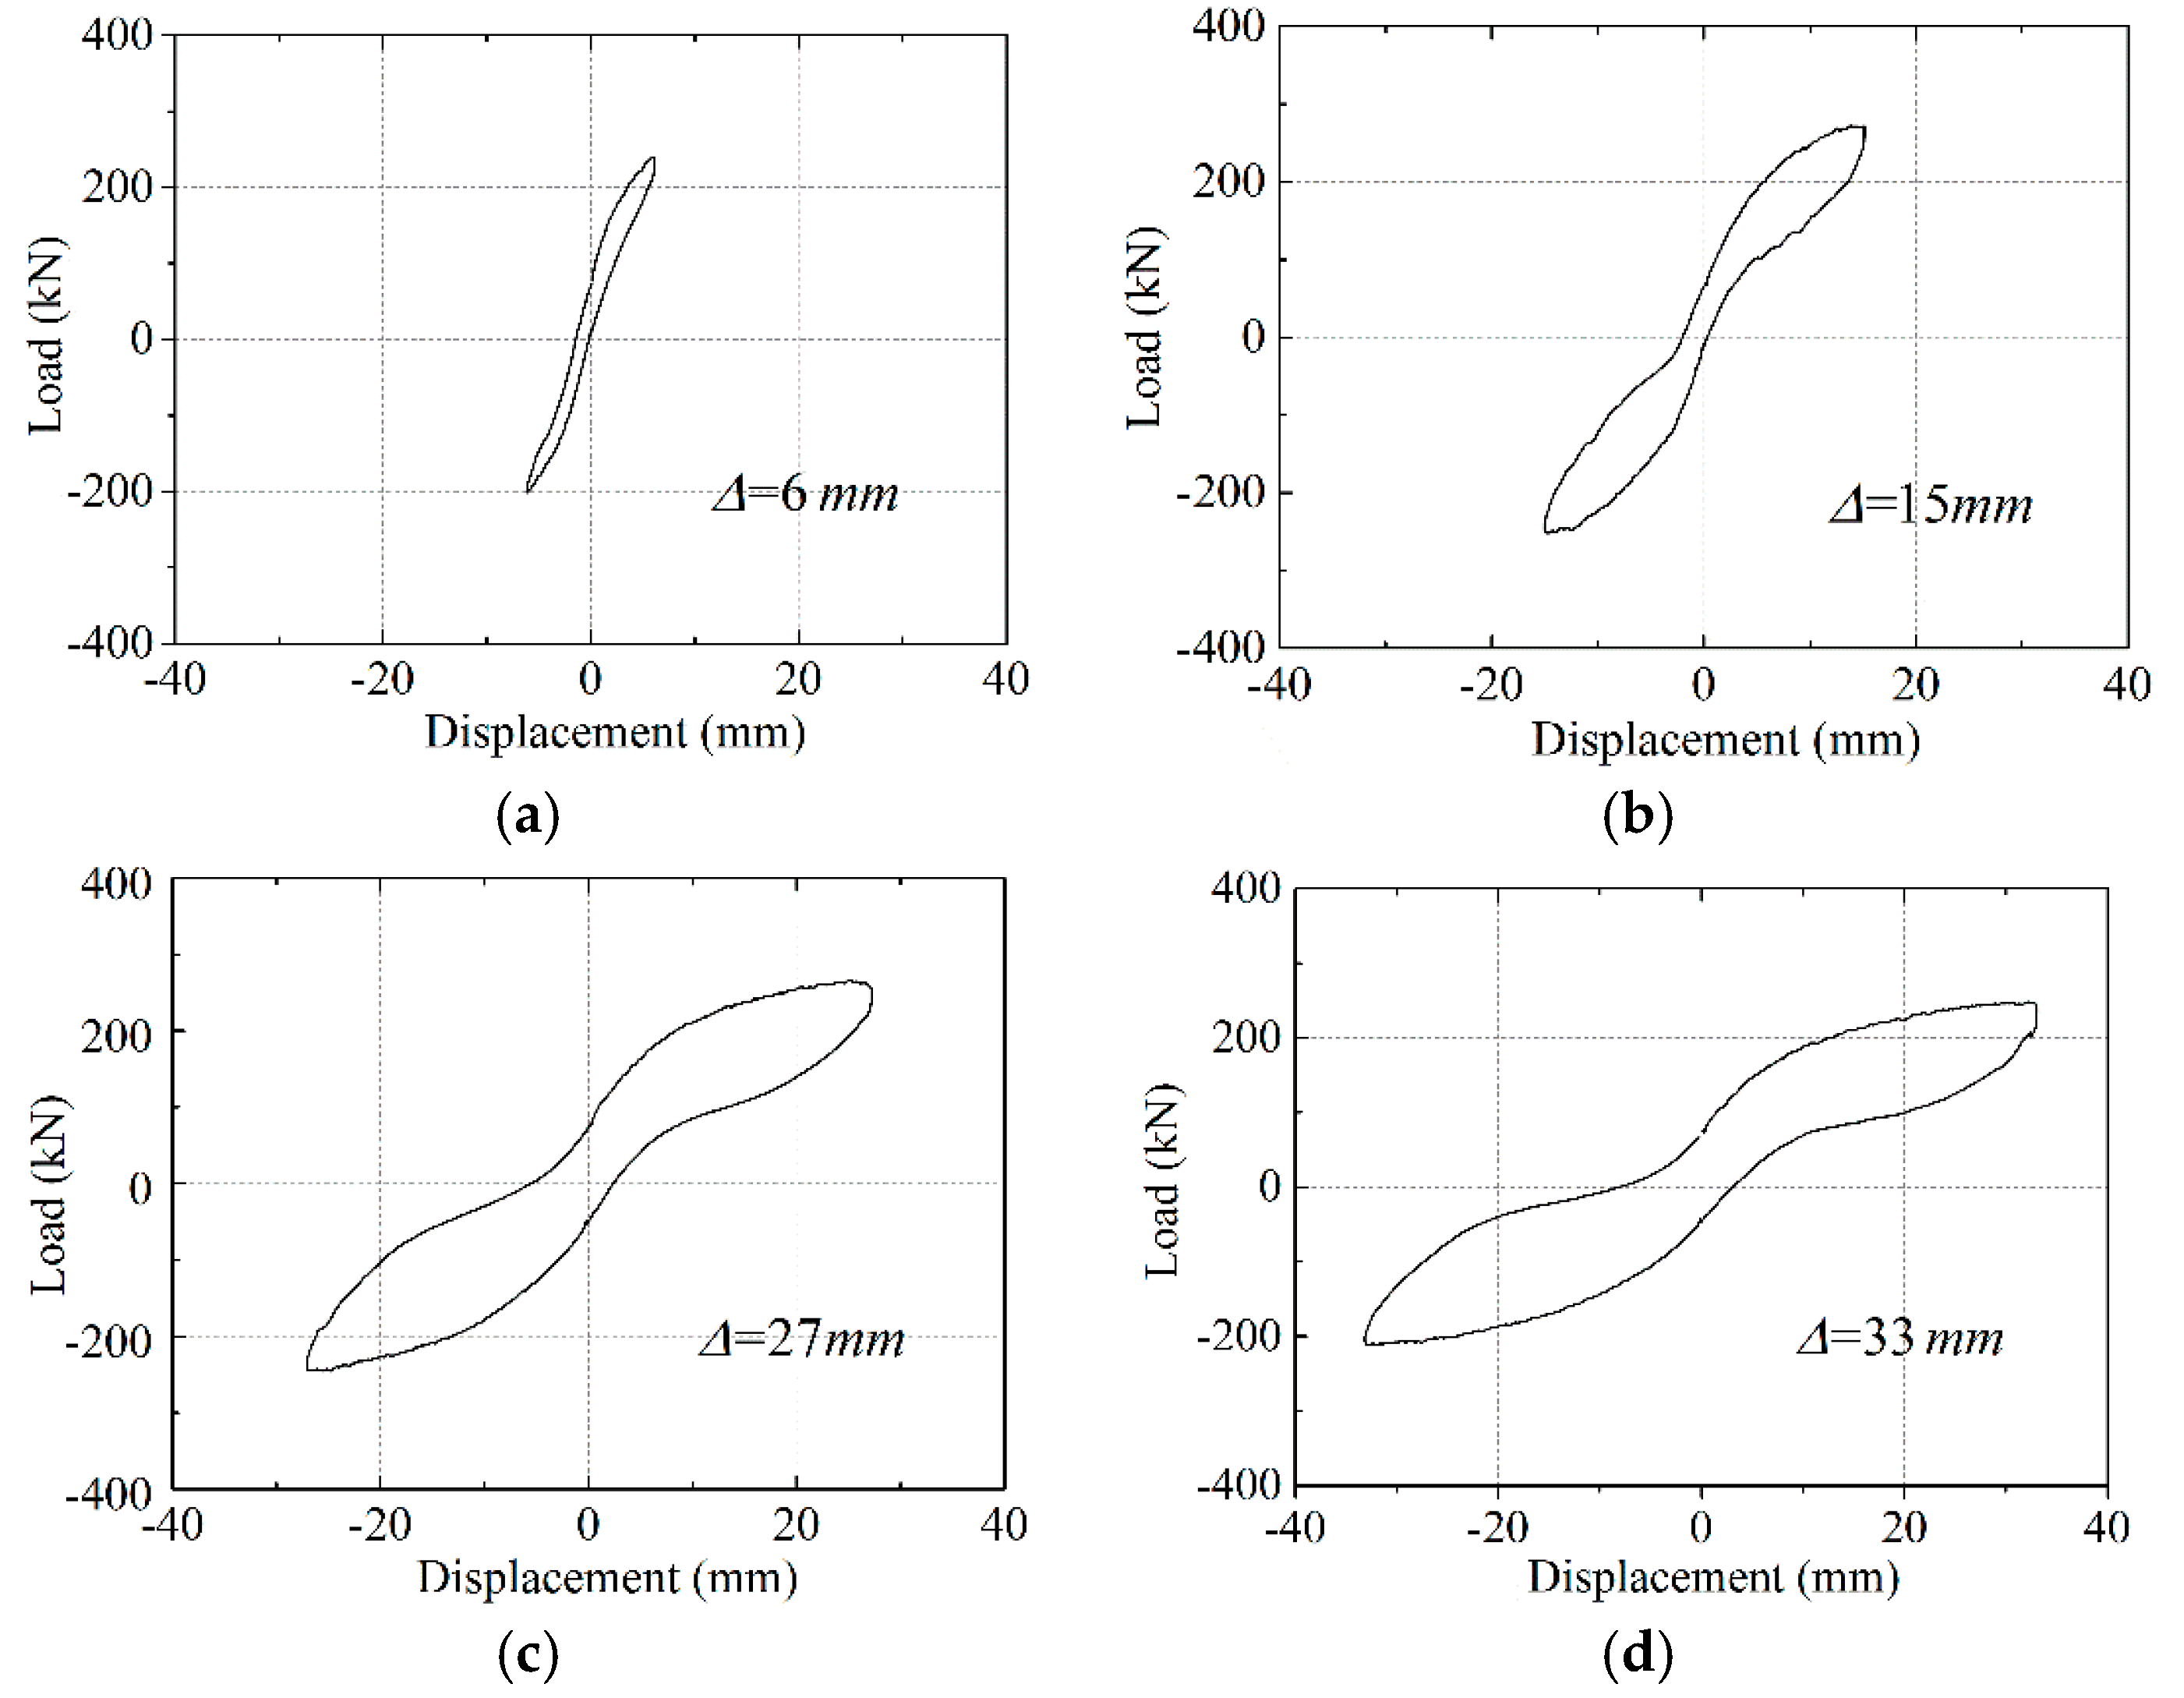
Figure 9.
Envelope curves of the test walls.
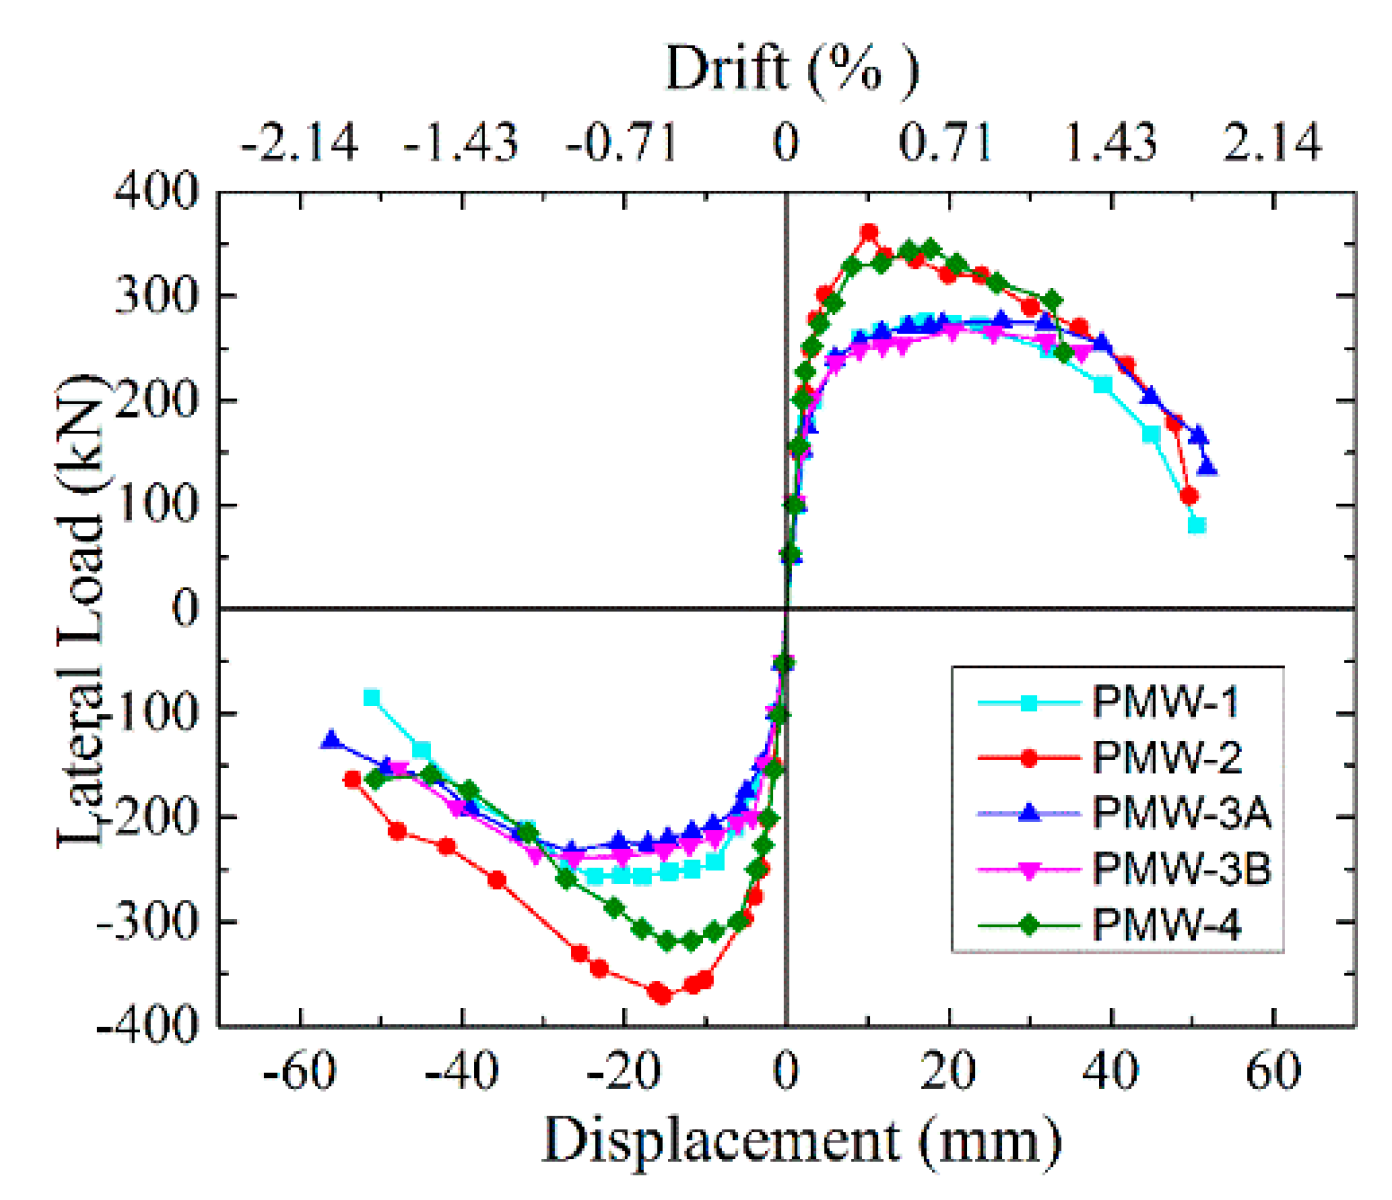
Figure 10.
Theoretical yielding point of the test walls.
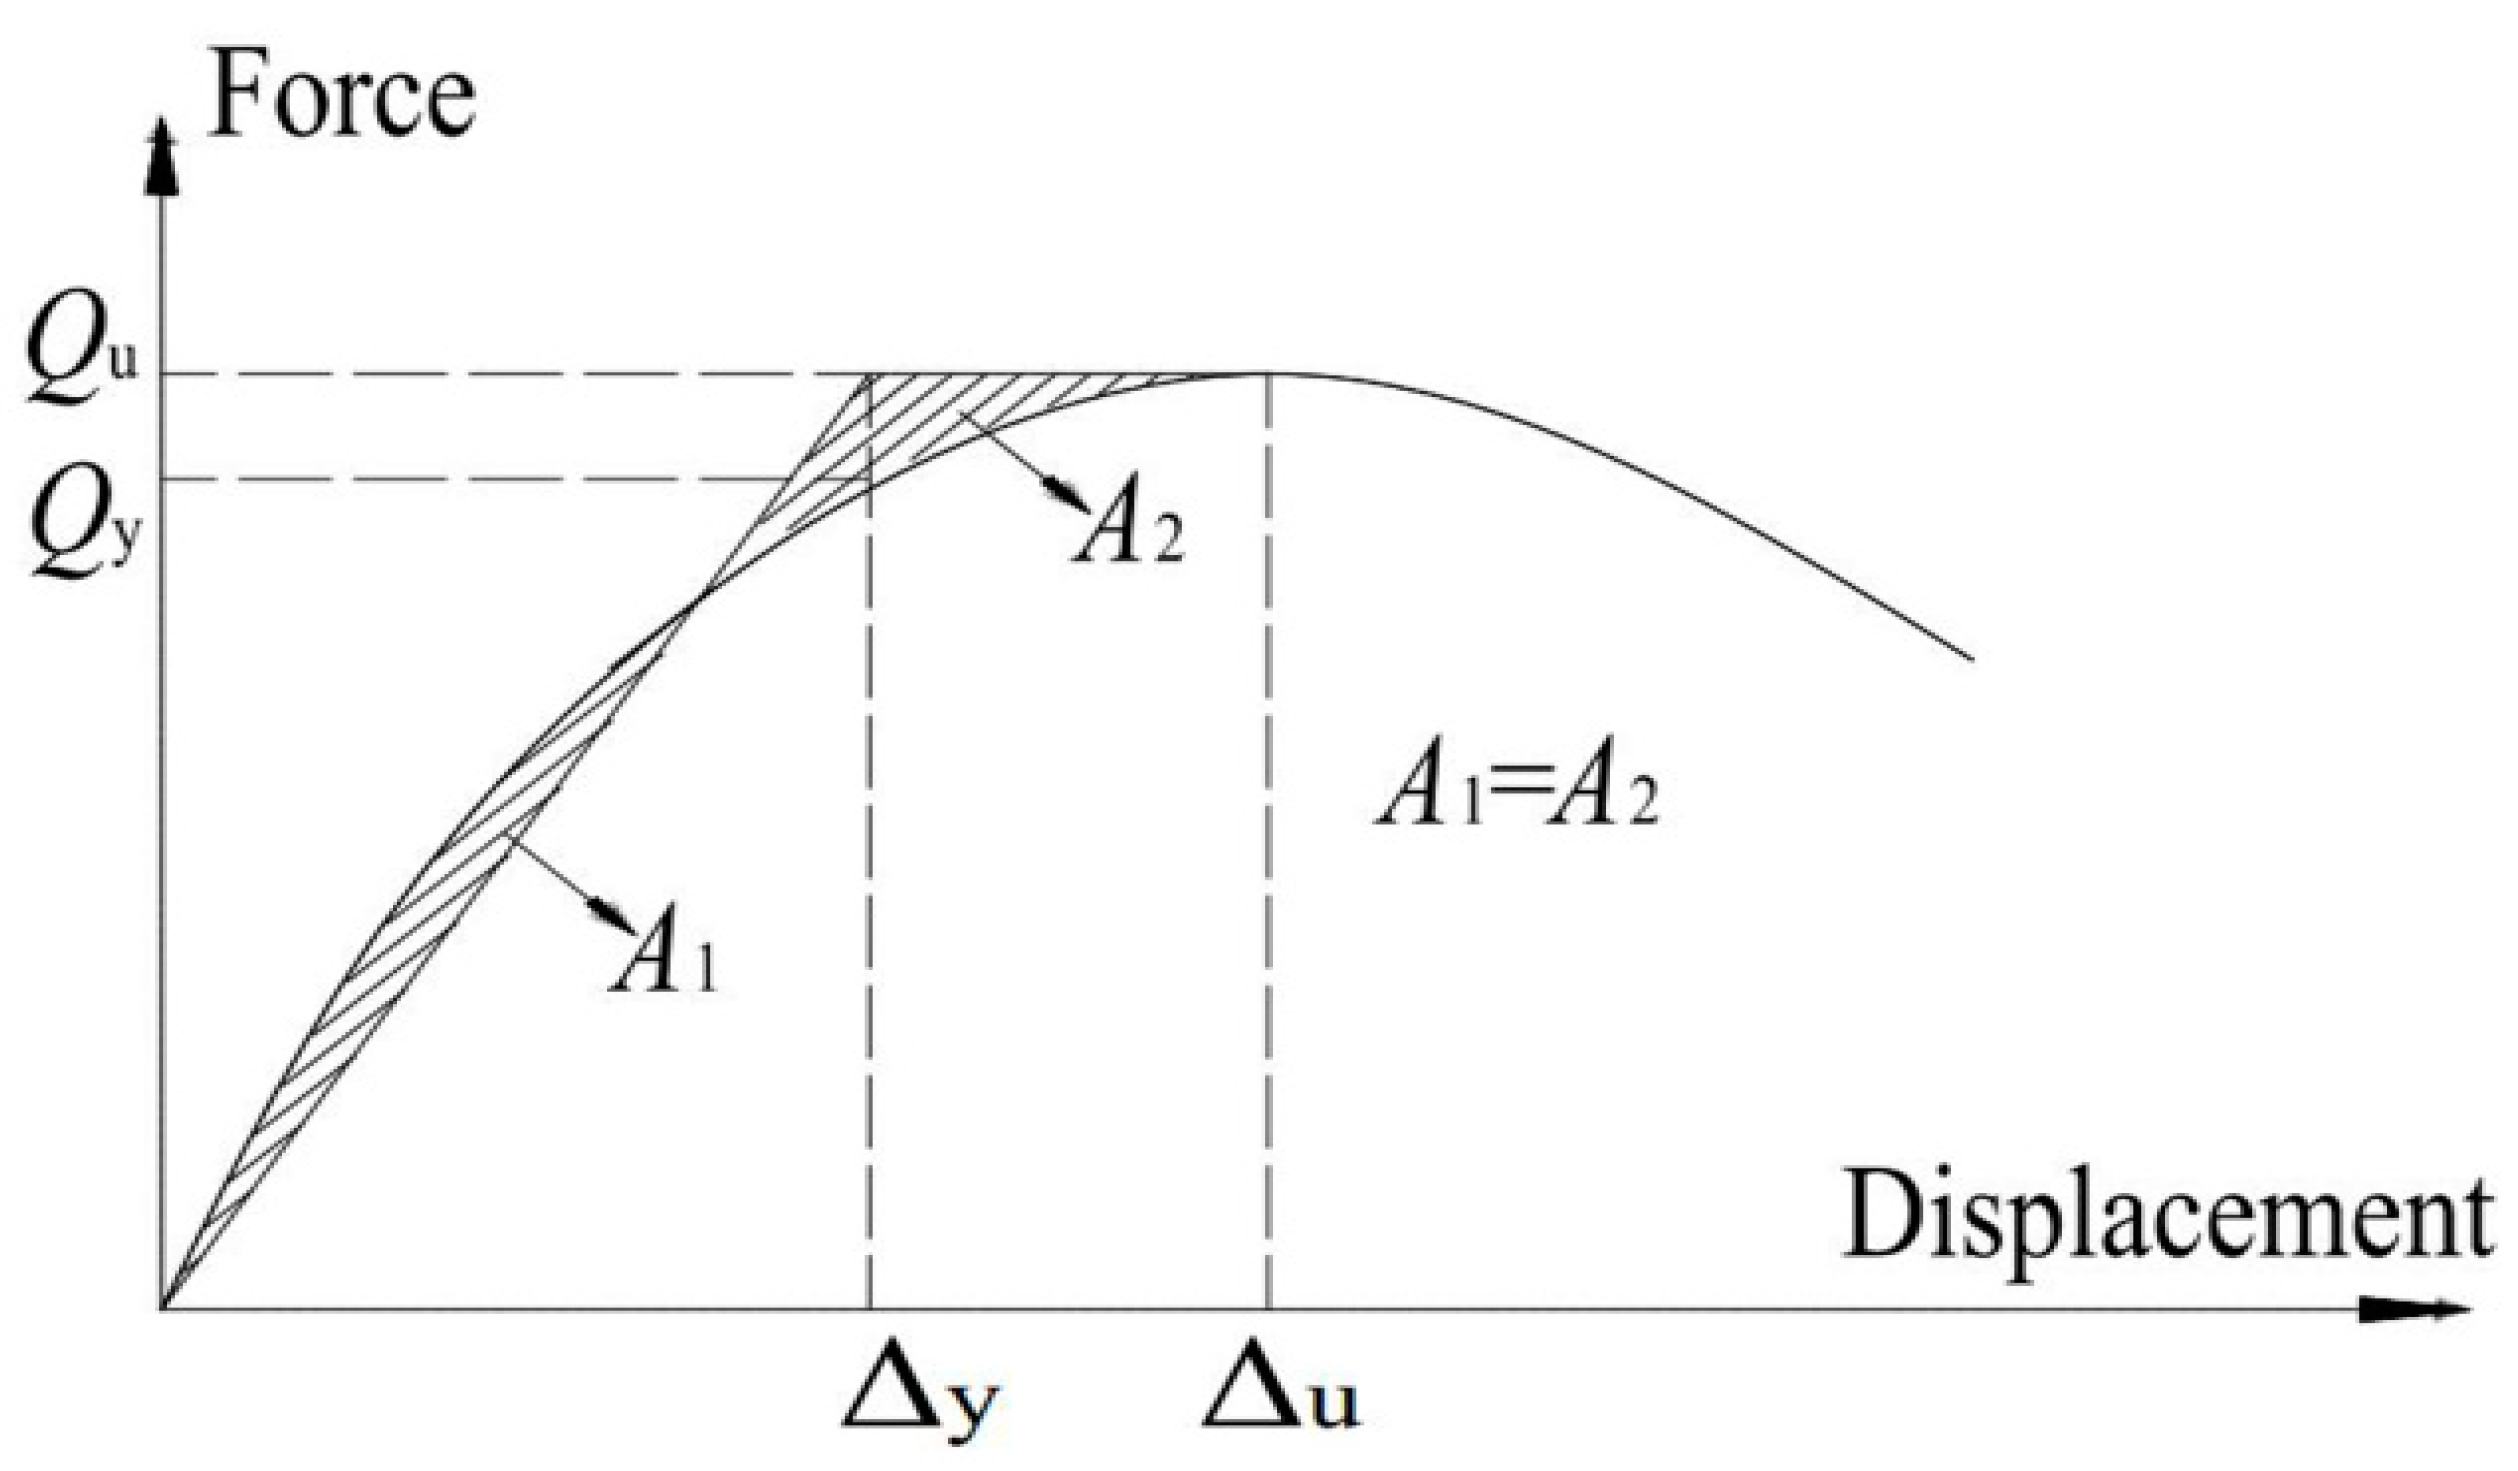
Figure 11.
The generalized four-line envelope curve of the PRMSW.

Figure 12.
Evolution of stiffness degradation of test walls.
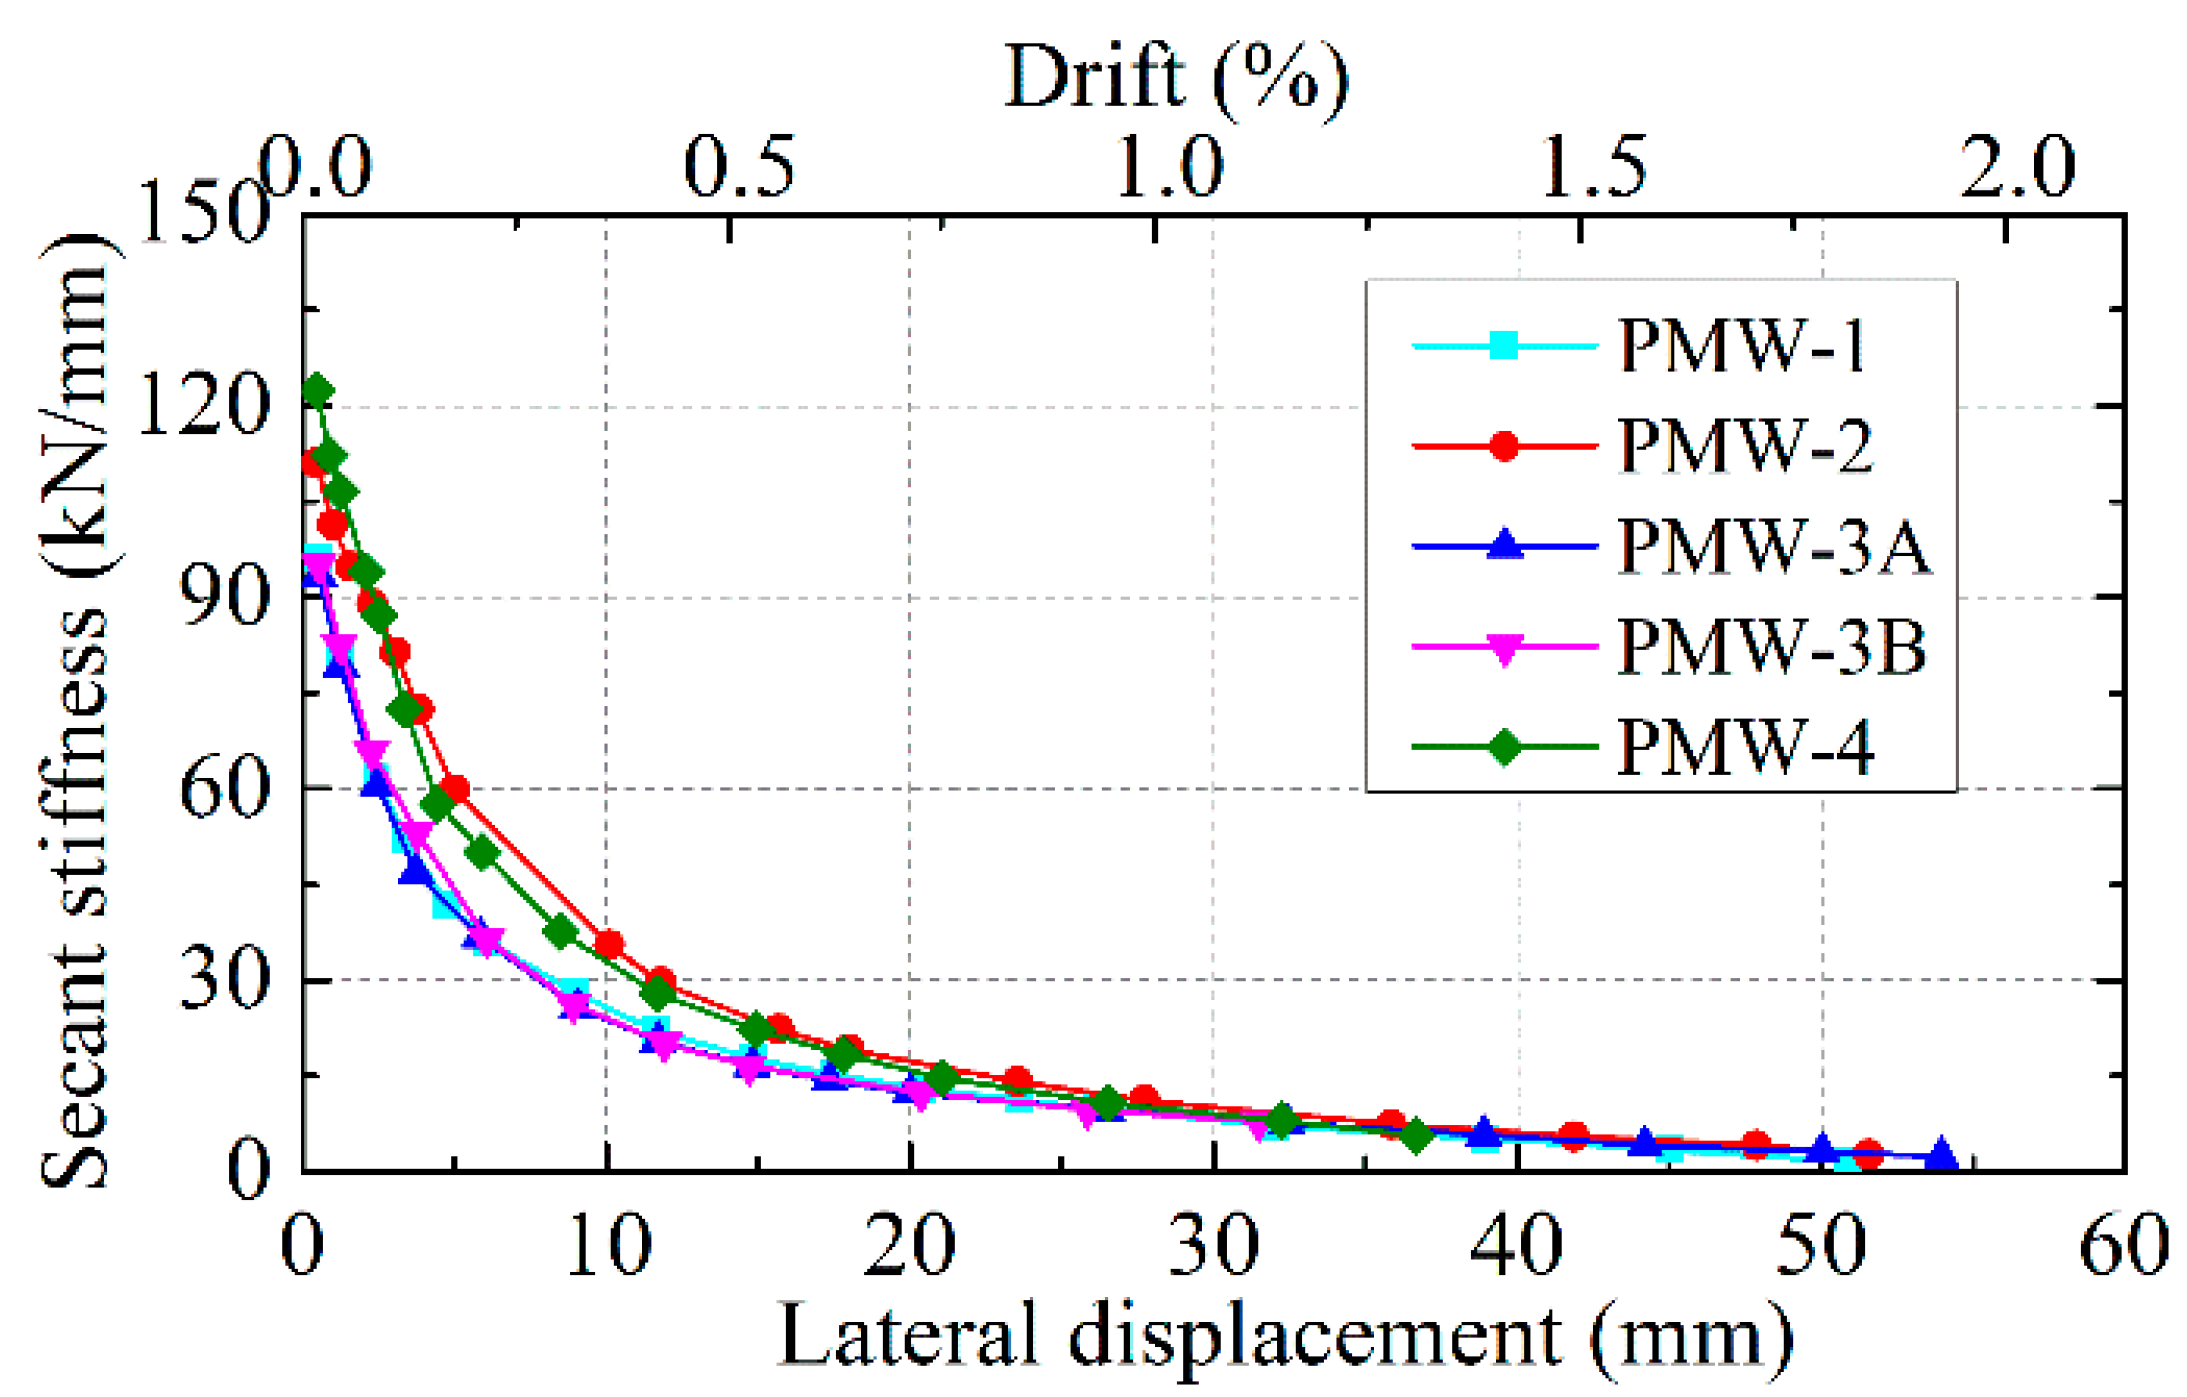
Figure 13.
Calculation of energy dissipation.

Figure 14.
Evaluation of energy dissipation: (a) Dissipated energy of the specimens; (b) the equivalent viscous damping ratio.
Figure 14.
Evaluation of energy dissipation: (a) Dissipated energy of the specimens; (b) the equivalent viscous damping ratio.
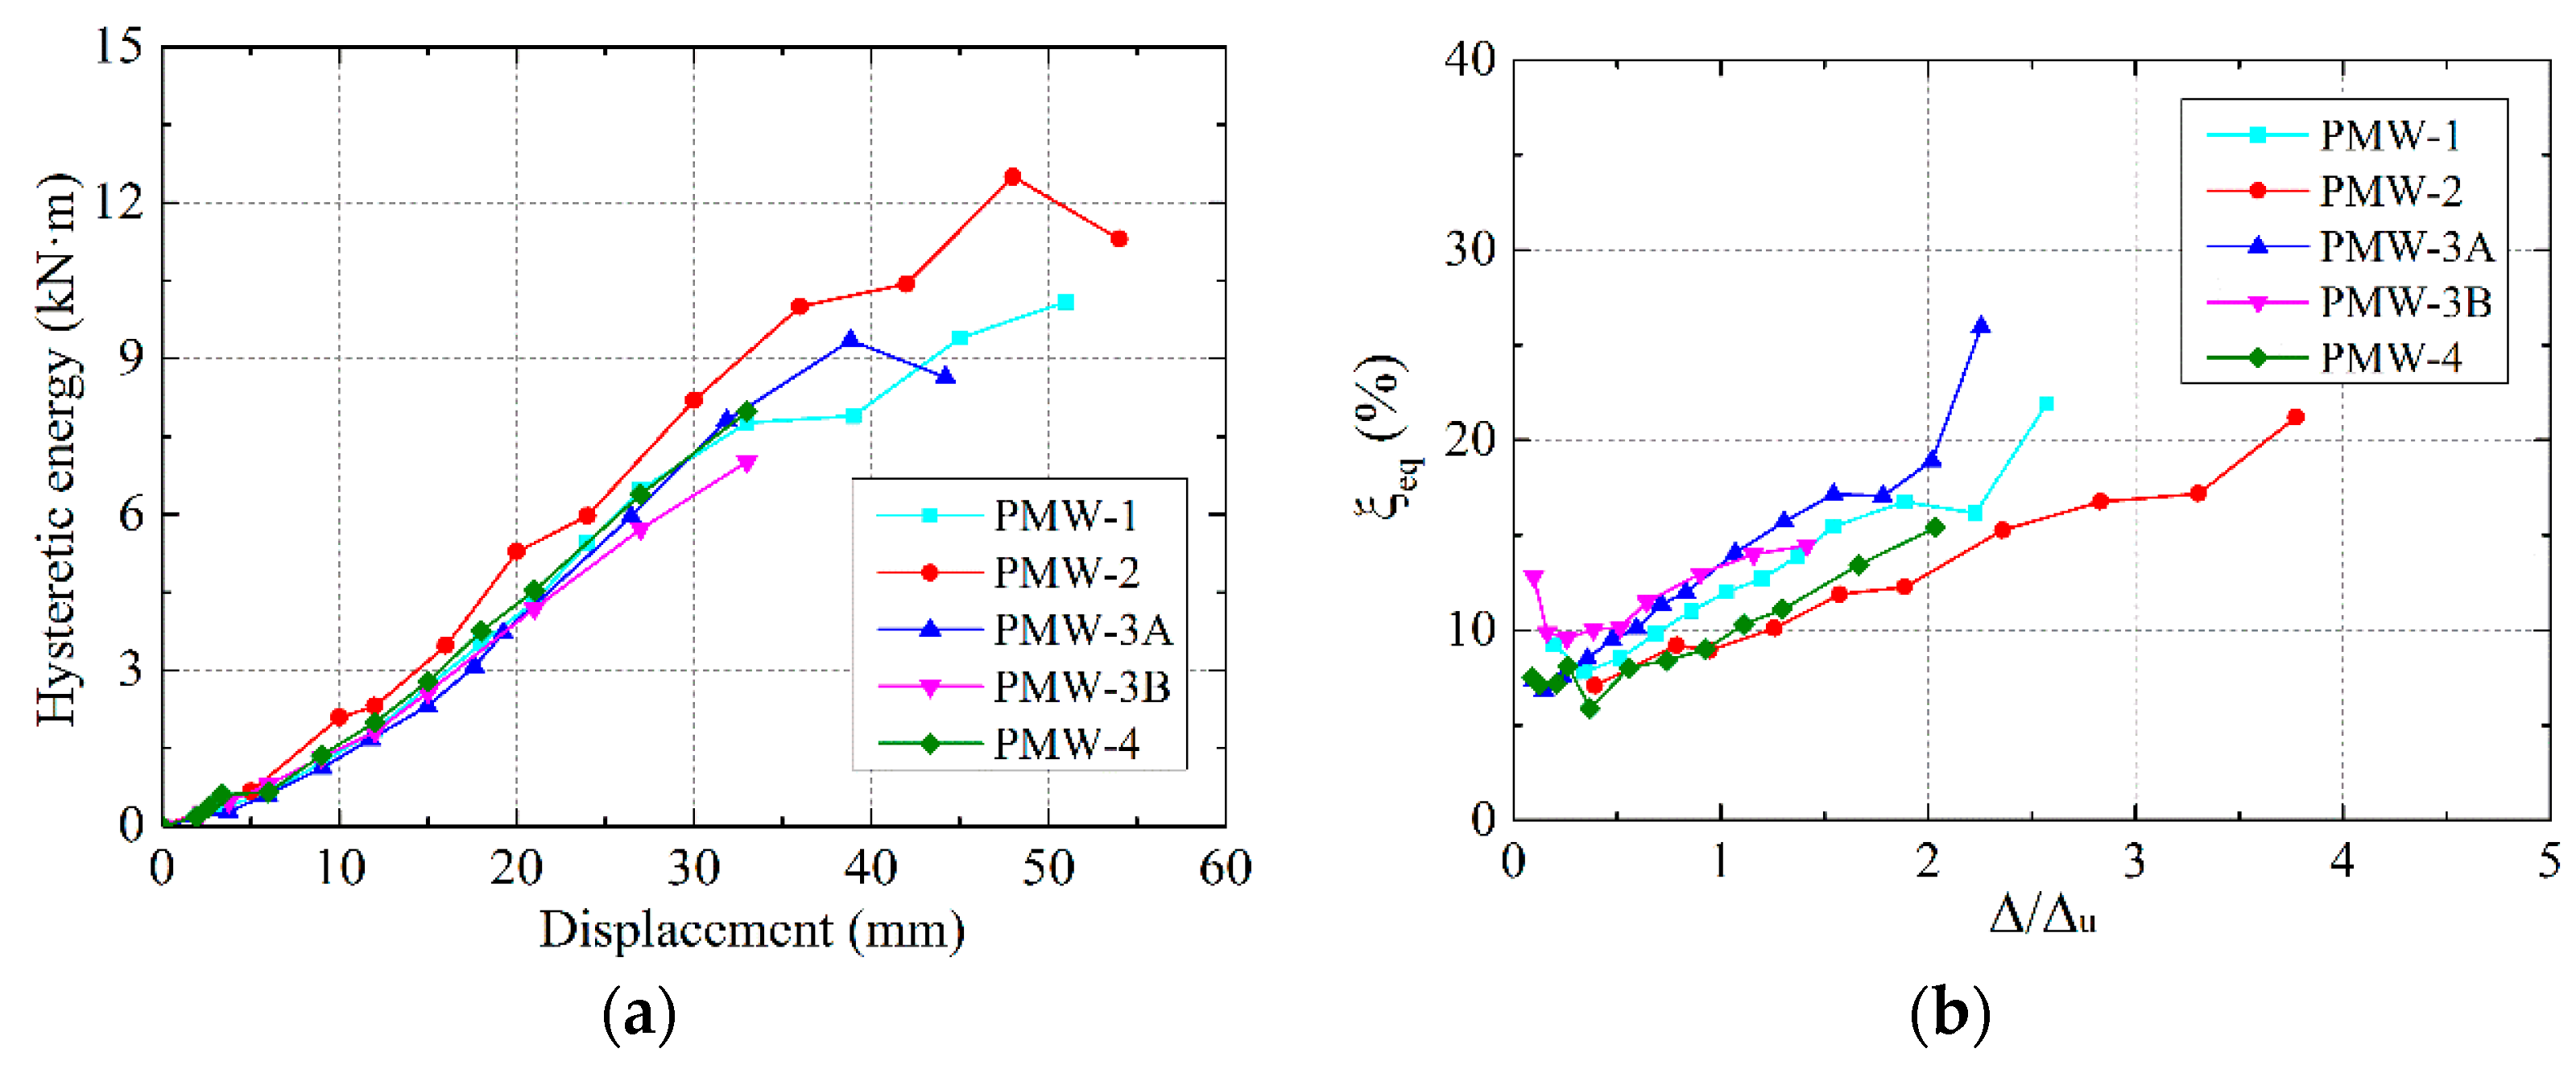
Figure 15.
Constitutive model of the steel bars.
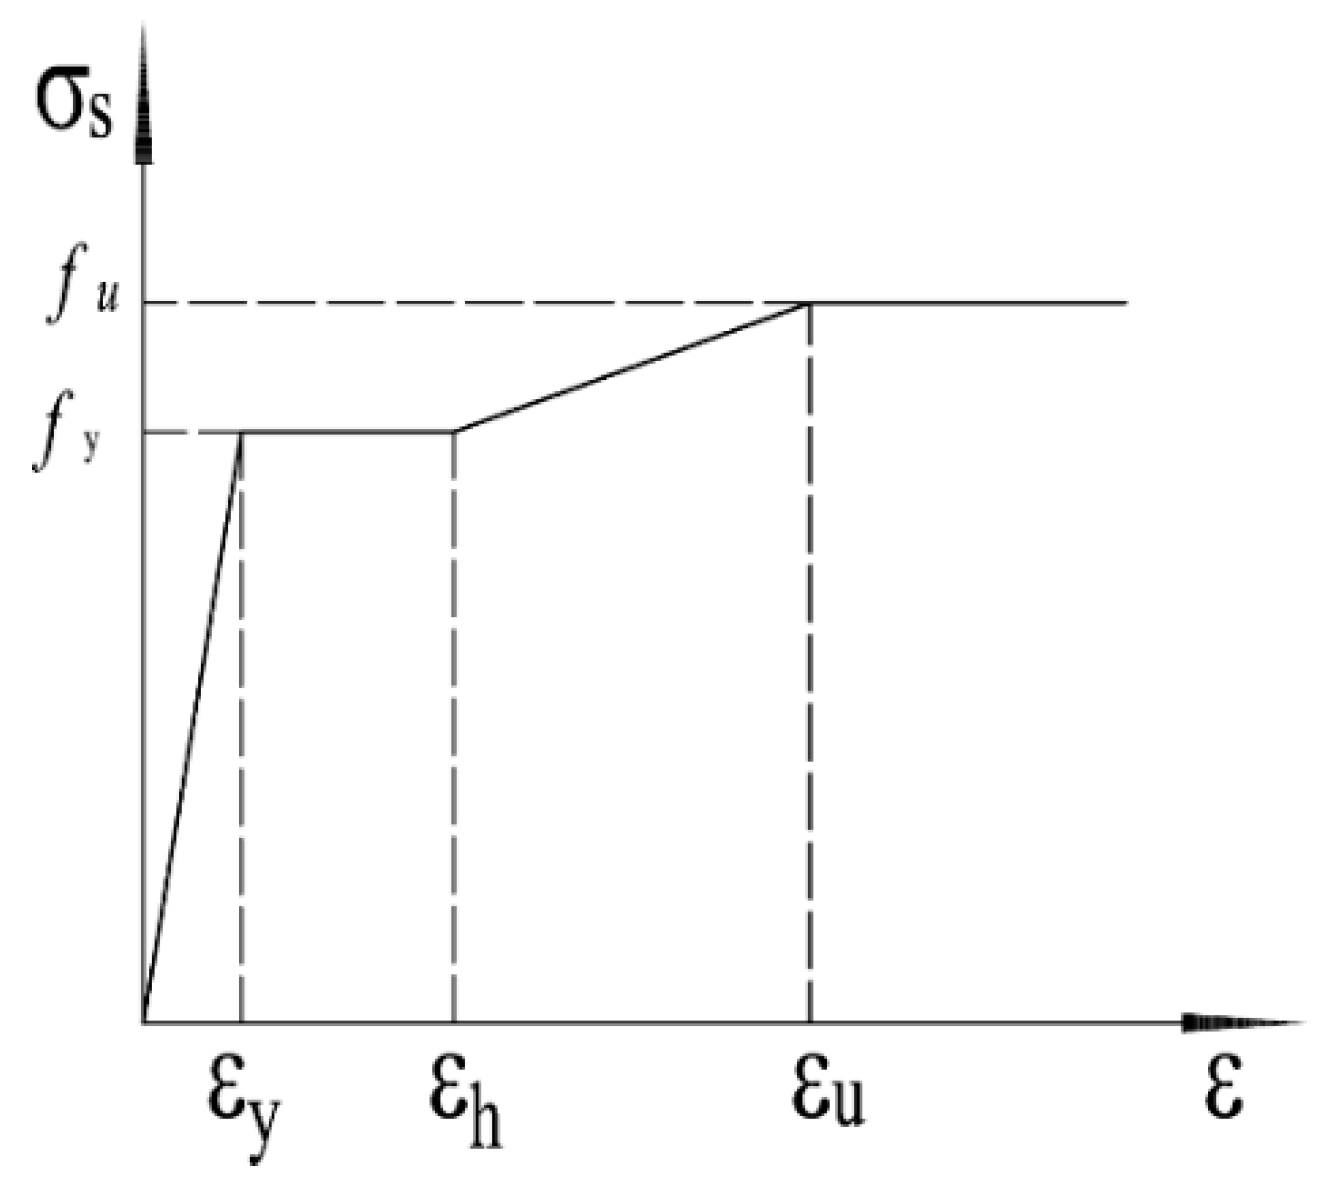
Figure 16.
Stress cloud of the specimens: (a) Masonry stress of PMW-1; (b) steel stress of PMW-1; (c) masonry stress of PMW-2; (d) steel stress of PMW-2; (e) masonry stress of PMW-3; (f) steel stress of PMW-3; (g) masonry stress of PMW-4; and (h) steel stress of PMW-4.
Figure 16.
Stress cloud of the specimens: (a) Masonry stress of PMW-1; (b) steel stress of PMW-1; (c) masonry stress of PMW-2; (d) steel stress of PMW-2; (e) masonry stress of PMW-3; (f) steel stress of PMW-3; (g) masonry stress of PMW-4; and (h) steel stress of PMW-4.

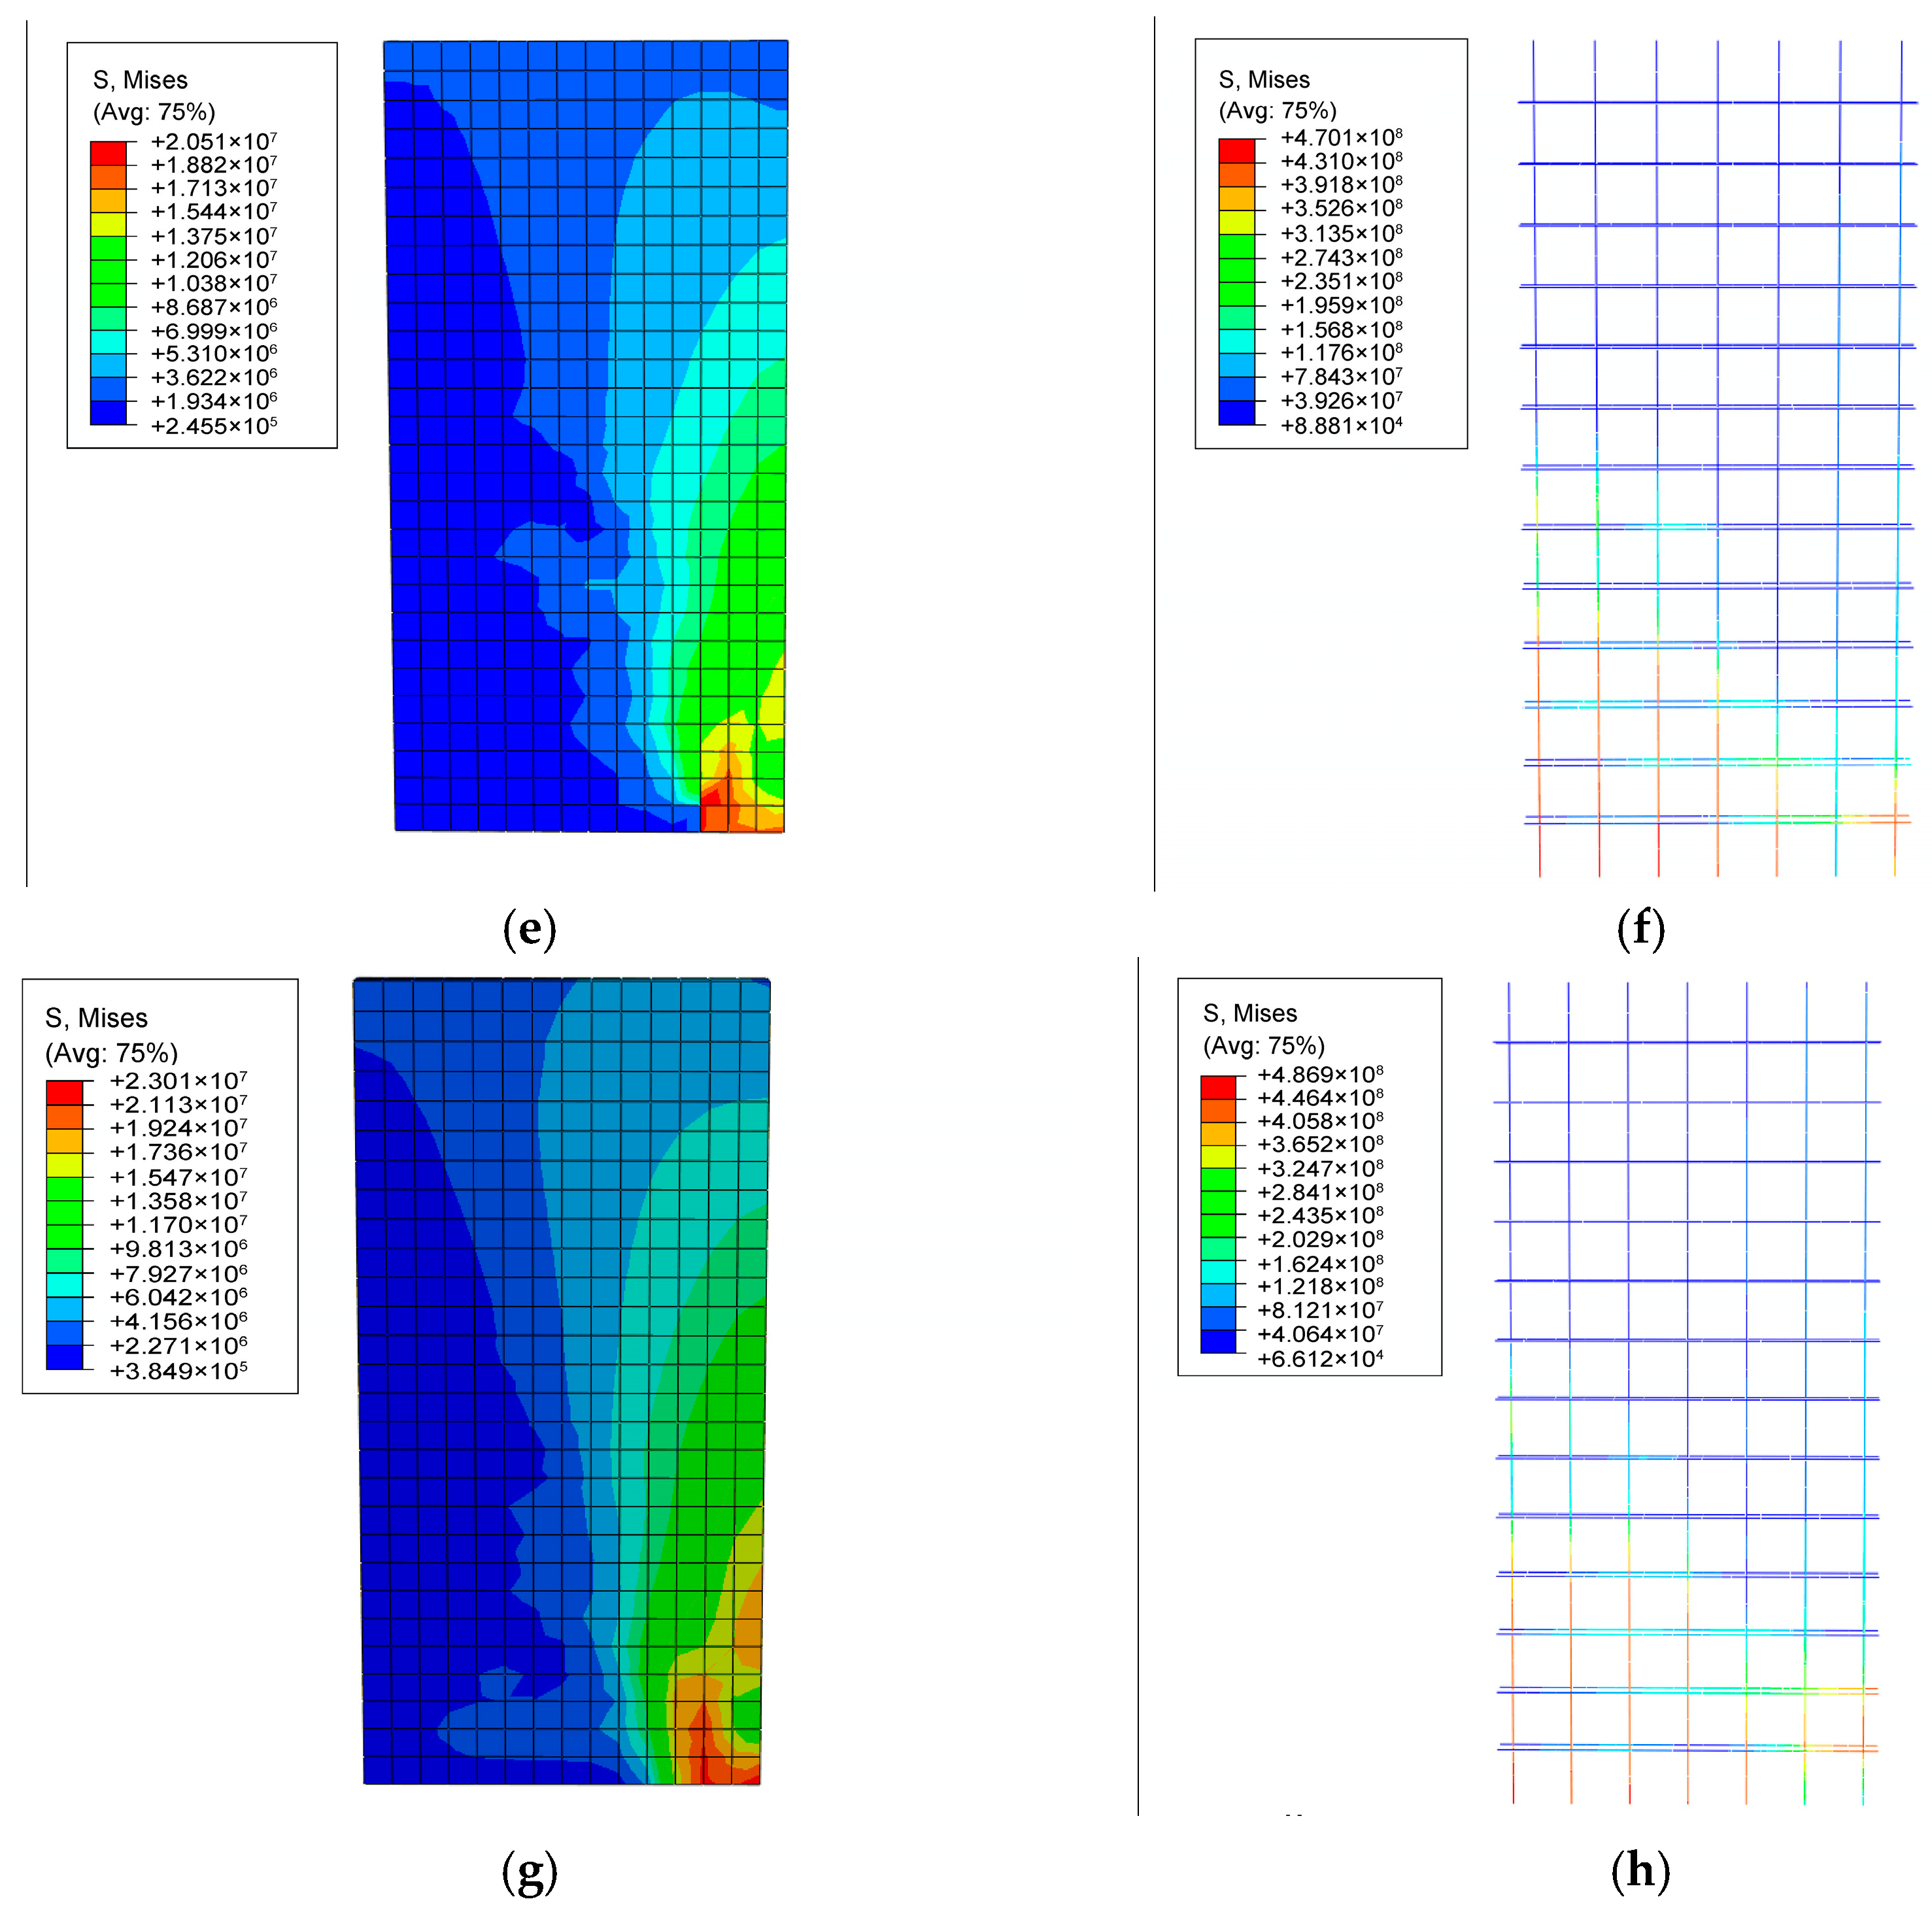
Figure 17.
Envelope curves of test results and numerical analysis: (a) PMW-1; (b) PMW-2; (c) PMW-3A/B; and (d) PMW-4.
Figure 17.
Envelope curves of test results and numerical analysis: (a) PMW-1; (b) PMW-2; (c) PMW-3A/B; and (d) PMW-4.


Table 1.
Summary of the test specimens’ details.
| Specimen | Wall Dimensions (mm) | Reinforcement | Axial Load (Compression Ratio) | |||
|---|---|---|---|---|---|---|
| (Length × Height × Thickness) | Vertical | Horizontal | ||||
| PMW-1 | 1390 × 3200 × 190 | 5C14 | 0.29% | 2C12@200 | 0.60% | 670 kN (0.10) |
| PMW-2 | 1390 × 3200 × 190 | 5C14 | 0.29% | 2C12@200 | 0.60% | 1000 kN (0.15) |
| PMW-3A | 1390 × 3200 × 190 | 7C12 | 0.30% | 2C12@200 | 0.60% | 670 kN (0.10) |
| PMW-3B | 1390 × 3200 × 190 | 7C12 | 0.30% | 2C12@200 | 0.60% | 670 kN (0.10) |
| PMW-4 | 1390 × 3200 × 190 | 7C12 | 0.30% | 2C12@200 | 0.60% | 1000 kN (0.15) |
Table 2.
Summary of test results.
| Wall | Initical Horizontal Cracking | Maximum Load | Qcr/Qu | Qu,average (kN) | Failure Mode | |||
|---|---|---|---|---|---|---|---|---|
| Qcr (kN) | (mm) | Qu (kN) | ||||||
| PMW-1 | + | 150 | 2.0 | 276 | 17.2 | 0.54 | 267 | Flexure |
| − | 150 | 2.8 | 257 | 17.8 | 0.58 | |||
| PMW-2 | + | 250 | 3.0 | 360 | 10.2 | 0.69 | 366 | Flexure |
| − | 200 | 2.3 | 371 | 15.3 | 0.54 | |||
| PMW-3A | + | 175 | 2.4 | 277 | 26.5 | 0.63 | 255 | Flexure |
| − | 150 | 2.8 | 233 | 26.5 | 0.64 | |||
| PMW-3B | + | 200 | 2.9 | 267 | 20.5 | 0.75 | 254 | Flexure |
| − | 150 | 2.5 | 240 | 26.2 | 0.63 | |||
| PMW-4 | + | 200 | 2.0 | 345 | 17.7 | 0.58 | 332 | Flexure |
| − | 200 | 2.3 | 318 | 14.7 | 0.63 | |||
Table 3.
Summary of displacement, drift, and ductility of PRMSW specimens.
| Wall | Displacement (mm) | Drift and Displacement Ductility | |||||
|---|---|---|---|---|---|---|---|
| (%) | (%) | ||||||
| PMW-1 | 6.4 | 17.5 | 33.0 | 2.7 | 0.63 | 5.2 | 1.18 |
| PMW-2 | 5.9 | 12.8 | 26.6 | 2.2 | 0.46 | 4.5 | 0.95 |
| PMW-3A | 6.4 | 26.5 | 39.3 | 4.1 | 0.95 | 6.1 | 1.40 |
| PMW-3B | 6.2 | 23.4 | 38.5 | 3.8 | 0.84 | 6.2 | 1.38 |
| PMW-4 | 5.4 | 16.2 | 28.7 | 3.0 | 0.58 | 5.3 | 1.03 |
Table 4.
The plastic parameters of the finite element model.
| Parameter | Dilation Angle | Eccentricity | K | Viscosity Parameter | |
|---|---|---|---|---|---|
| PRMSW | 37 | 0.1 | 1.16 | 0.667 | 0.0015 |
© 2018 by the authors. Licensee MDPI, Basel, Switzerland. This article is an open access article distributed under the terms and conditions of the Creative Commons Attribution (CC BY) license (http://creativecommons.org/licenses/by/4.0/).
Share and Cite
MDPI and ACS Style
Xu, W.; Yang, X.; Wang, F.; Chi, B. Experimental and Numerical Study on the Seismic Performance of Prefabricated Reinforced Masonry Shear Walls. Appl. Sci. 2018, 8, 1856. https://doi.org/10.3390/app8101856
AMA Style
Xu W, Yang X, Wang F, Chi B. Experimental and Numerical Study on the Seismic Performance of Prefabricated Reinforced Masonry Shear Walls. Applied Sciences. 2018; 8(10):1856. https://doi.org/10.3390/app8101856
Chicago/Turabian StyleXu, Weifan, Xu Yang, Fenglai Wang, and Bin Chi. 2018. "Experimental and Numerical Study on the Seismic Performance of Prefabricated Reinforced Masonry Shear Walls" Applied Sciences 8, no. 10: 1856. https://doi.org/10.3390/app8101856
Note that from the first issue of 2016, this journal uses article numbers instead of page numbers. See further details here.