Optimal Power Reserve of a Wind Turbine System Participating in Primary Frequency Control


1
Electrical Engineering Department, King Faisal University, Alahsa 31982, Saudi Arabia
2
Electrical Engineering Department, Colorado School of Mines, Golden, CO 80401, USA
*
Authors to whom correspondence should be addressed.
Appl. Sci. 2018, 8(11), 2022; https://doi.org/10.3390/app8112022
Submission received: 29 September 2018
/
Revised: 18 October 2018
/
Accepted: 18 October 2018
/
Published: 23 October 2018
(This article belongs to the Special Issue Large Grid-Connected Wind Turbines)
Abstract
:Participation of a wind turbine (WT) in primary frequency control (PFC) requires reserving some active power. The reserved power can be used to support the grid frequency. To maintain the required amount of reserve power, the WT is de-loaded to operate under its maximum power. The objective of this article is to design a control method for a WT system to maintain the reserved power of the WT, by controlling both pitch angle and rotor speed simultaneously in order to optimize the operation of the WT system. The pitch angle is obtained such that the stator current of the permanent magnet synchronous generator (PMSG) is reduced. Therefore, the resistive losses in the machine and the conduction losses of the converter are minimized. To avoid an excessive number of pitch motor operations, the wind forecast is implemented in order to predict consistent pitch angle valid for longer timeframe. Then, the selected pitch angle and the known curtailed power are used to find the optimal rotor speed by applying a nonlinear equation solver. To validate the proposed de-loading approach and control method, a detailed WT system is modeled in Matlab/Simulink (The Mathworks, Natick, MA, USA, 2017). Then, the proposed control scheme is validated using hardware-in-the-loop and real time simulation built in Opal-RT (10.4.14, Opal-RT Inc., Montreal, PQ, Canada).
1. Introduction
In power systems with less conventional generators (mainly synchronous), several functions must be added to the renewable resources to compensate for the grid requirements, such as frequency response, negative sequence, harmonics mitigation, and resynchronization and black-start ability [1].
For adjusting the frequency of a grid during frequency deviation, there are different control strategies and approaches that have been implemented and presented in the literature. These control methods can be categorized based on duration and capability with certain features and limitations [2,3,4].
The participation of wind turbines (WTs) in primary frequency control (PFC) has been discussed widely in several publications. Controllers based on rotor speed regulation or pitch angle regulation to de-load WT for PFC have been discussed in [5,6,7,8,9,10,11].
In [12,13], a coordination control was proposed between inertial, rotor speed, and pitch angle for WT, based on a doubly-fed induction generator (DFIG). This approach depends on a new classification of wind speed to select among the proposed controllers. Storing kinetic energy in the rotor shaft to be used during the PFC stage has been proposed [14,15]. An adjustable droop controller was proposed to improve PFC in WT, based on a DFIG in [7].
A design for a discrete linear quadratic Gaussian controller for PFC participation was introduced in [16,17]. Controlling WT for PFC along with energy storage systems was discussed in [18,19]. An optimization algorithm was proposed to provide a stable power reference considering wind speed prediction in [20]. This approach gives a possible range for the power reserve for a specific timeframe.
In this paper, the aim is to de-load the turbines’ power by controlling both pitch angle and rotor speed simultaneously, in order to optimize the operation of the wind turbine. The blade’s pitch angle is obtained such that the rotor speed is increased to reduce the power losses (copper losses) in the stator of the machine and the conduction losses of the converter. In addition, to avoid blade fluctuation and an excessive number of pitch operations, a wind forecast will be implemented in order to predict a consistent pitch angle that is valid for longer period. This can reduce the high wear on the pitch system by reducing the number of pitch usages over time [21]. Then, the selected pitch angle and the known curtailed power are used to find the optimal rotor speed by applying a nonlinear solver. With the variation of wind speed, the control algorithm updates the pitch angle set point adaptively. Therefore, the reference of the rotor speed must follow the variation in the pitch angle and the wind speed.
The paper is organized as follows. Section 2 presents the model of the wind turbine system and discusses the understanding of power curve for PFC. Section 3 presents the proposed de-loading approach. In Section 4, simulation and real time studies are performed to validate the proposed method. The conclusion is presented in Section 5.
2. Wind Turbine System
The system considered in this paper is direct-drive, based on PMSG. The WT system is decoupled from the power system using a back-to-back power converter. The model of the WT and PMSG used for this study are presented in [22,23,24,25]. Detailed discussion of the model will be elaborated on in the following subsections.
2.1. Understanding the Wind Power Curve for Primary Frequency Control
To understand the relationship between pitch angle and rotor speed with the response of the torque and stator current of the machine, the model of the wind turbine and PMSG should be presented first.
The wind turbine model is a function of two main variables, the pitch angle () and the rotor speed (), as given by [25]:
where is the swept area of the WT and the power coefficient is expressed as
The coefficients to were taken from [25] (), and the tip speed ratio is defined as
Here, represents the radius of the wind turbine, and represents the wind speed.
From the curve characteristics of the mechanical power Equation (1) and the power coefficient of Equation (2), the maximum power is achieved at the zero pitch angle and optimum tip speed ratio for underrated wind speed conditions. Figure 1 shows the characteristics of the wind turbine power for different pitch angles and different rotor speeds for a specific wind turbine. As the pitch angle increases, the power produced by the WT decreases. This helps identify the operating point of the WT system for de-loading purposes. In addition, the rotor speed can be used to reach a specific production of power. To implement de-loading to a WT system, the power is curtailed by a certain amount, (), using either the pitch angle or rotor speed controller. In Figure 1, the power is curtailed to (), providing a reserve power of .
The power curve can be represented in terms of rotor speed for different pitch angles for several wind speeds. This will allow us to select an optimal operating point of rotor speed and pitch angle for the purpose of PFC. Figure 1 represents a three-dimensional plot of the power curve. During regular operation of WT, the maximum power is tracked. However, for PFC, the sub-optimal operating point is selected to reserve the required power in the WT system. The output power is plotted using a flat surface, where the intersections of the two surfaces demonstrate all possible sets of pitch angles and rotor speed values that can be used.
2.2. Machine Losses and Rotor Speed
The machine considered in this paper is based on PMSG. The detailed model of the machine is presented in [23]. The equation of the electromechanical torque is given as
Assuming a round rotor type (i.e., ), the quadrature current can be given as
where is the number of poles of the machine and is the flux linkage. and represent the quadrature and direct inductance, respectively, and and represent the quadrature and direct currents of the d–q reference frame of the PMSG.
At constant power production, a higher rotor speed means lower torque. From Equation (5), it is clear that is proportional to the torque (i.e., lower torque results in lower current). This contributes to the resistive losses of the PMSG. The resistive (copper) losses in the stator equivalent circuit of the PMSG can be expressed as
where represents the stator resistance of the PMSG. The copper losses are directly related to the current of the quadrature axis and the direct axis. Thus, by controlling the quadrature current of the machine (), the resistive losses can be reduced by involving pitch angle control for PFC.
2.3. Conduction Losses of Insulated Gate Bipolar Transistor Switches
The power converter used is based on insulated gate bipolar transistor (IGBT) switches. Power losses of such switches are conduction losses and switching losses. The conduction losses occur when the switch is turned on and conducts current.
To evaluate the conduction losses of the IGBT, a voltage drop and a small resistor are added into the series with an ideal switch. The simple expression of the conduction losses is given as
where is the current crossing the IGBT switch during conducting, and and represent the voltage drop and the resistance of the switch, respectively
The conduction losses of an IGBT depends on the temperature, which causes variation of the voltage drop across the switch. Also, the loss depends on the current passing through the switch. Therefore, decreasing the current through the switch will reduce the conduction losses. The conduction losses of the semiconductor devices can be evaluated using information from the data sheet from the manufacturer, considering the thermal model of the switch.
2.4. Wind Data and Speed Prediction
Using wind speed sensor provides a reference for the power tracking controller. With the availability of wind data, a wind forecast can be implemented to predict the wind speed. This allows us to estimate the behavior of the turbine and select the optimal operating point, ensuring control stability. Using a Light Detection and Ranging (LIDAR) system improves the accuracy of the measurements of wind speed. The National Renewable Energy Lab (NREL) investigated the use of LIDAR in feedforward control in WT systems [26].
Knowledge of future wind speed can be utilized in the algorithm to enhance wind turbine operation. In the literature, there are several approaches to estimate the average of the wind speed [27]. Here, we implement the auto-regression model (AR) to generate and predict the mean of wind speed as
where and represent the current and previous data (wind speed), respectively, is the autoregressive parameter of the model, and is a Gaussian noise. The predicted wind speed is used to predict the future set points that required to maintain the reserved power for next timeframe (), as will be discussed in the next section.
Maximizing power using a speed controller is preferable during underrated wind speeds. However, in some cases the pitch controller can be involved to ensure smooth power production near rated wind speeds. In addition, combining a pitch angle controller with a speed controller can improve the efficiency of the machine, as will be discussed in the following section.
3. Proposed De-Loading Approach
The WT system considered in this paper is a direct drive configuration, where the power converter is directly connected to the machine’s stator winding. In such a system, the rotor speed is fully controlled by the converter, while the blades are controlled by a pitch angle control system.
The reserve power for PFC is achieved by controlling both pitch angle and rotor speed simultaneously, in order to optimize the operation of the WT system. The goal is to minimize the power losses in the PMSG given in (6) and (7). This is accomplished by involving a pitch angle controller during underrated wind speeds.
Initially, with the prediction of wind speed, the pitch angle is obtained such that the rotor speed is increased to reduce the power losses in the stator of the PMSG. Predicted wind speed is averaged to avoid blade fluctuation and an excessive number of pitch motor operations. Therefore, averaged pitch angle is selected to ensure consistent operation of the WT, while minimizing resistive losses of the machine.
First, the measured wind speed is averaged and used to calculate the maximum power that can be achieved by the turbine. The wind forecast is needed to estimate the maximum possible power in advance (t + k) to help reduce the number of pitch operations. For a given specific reserve power, the output power is obtained and used to determine the required pitch angle instantaneously.
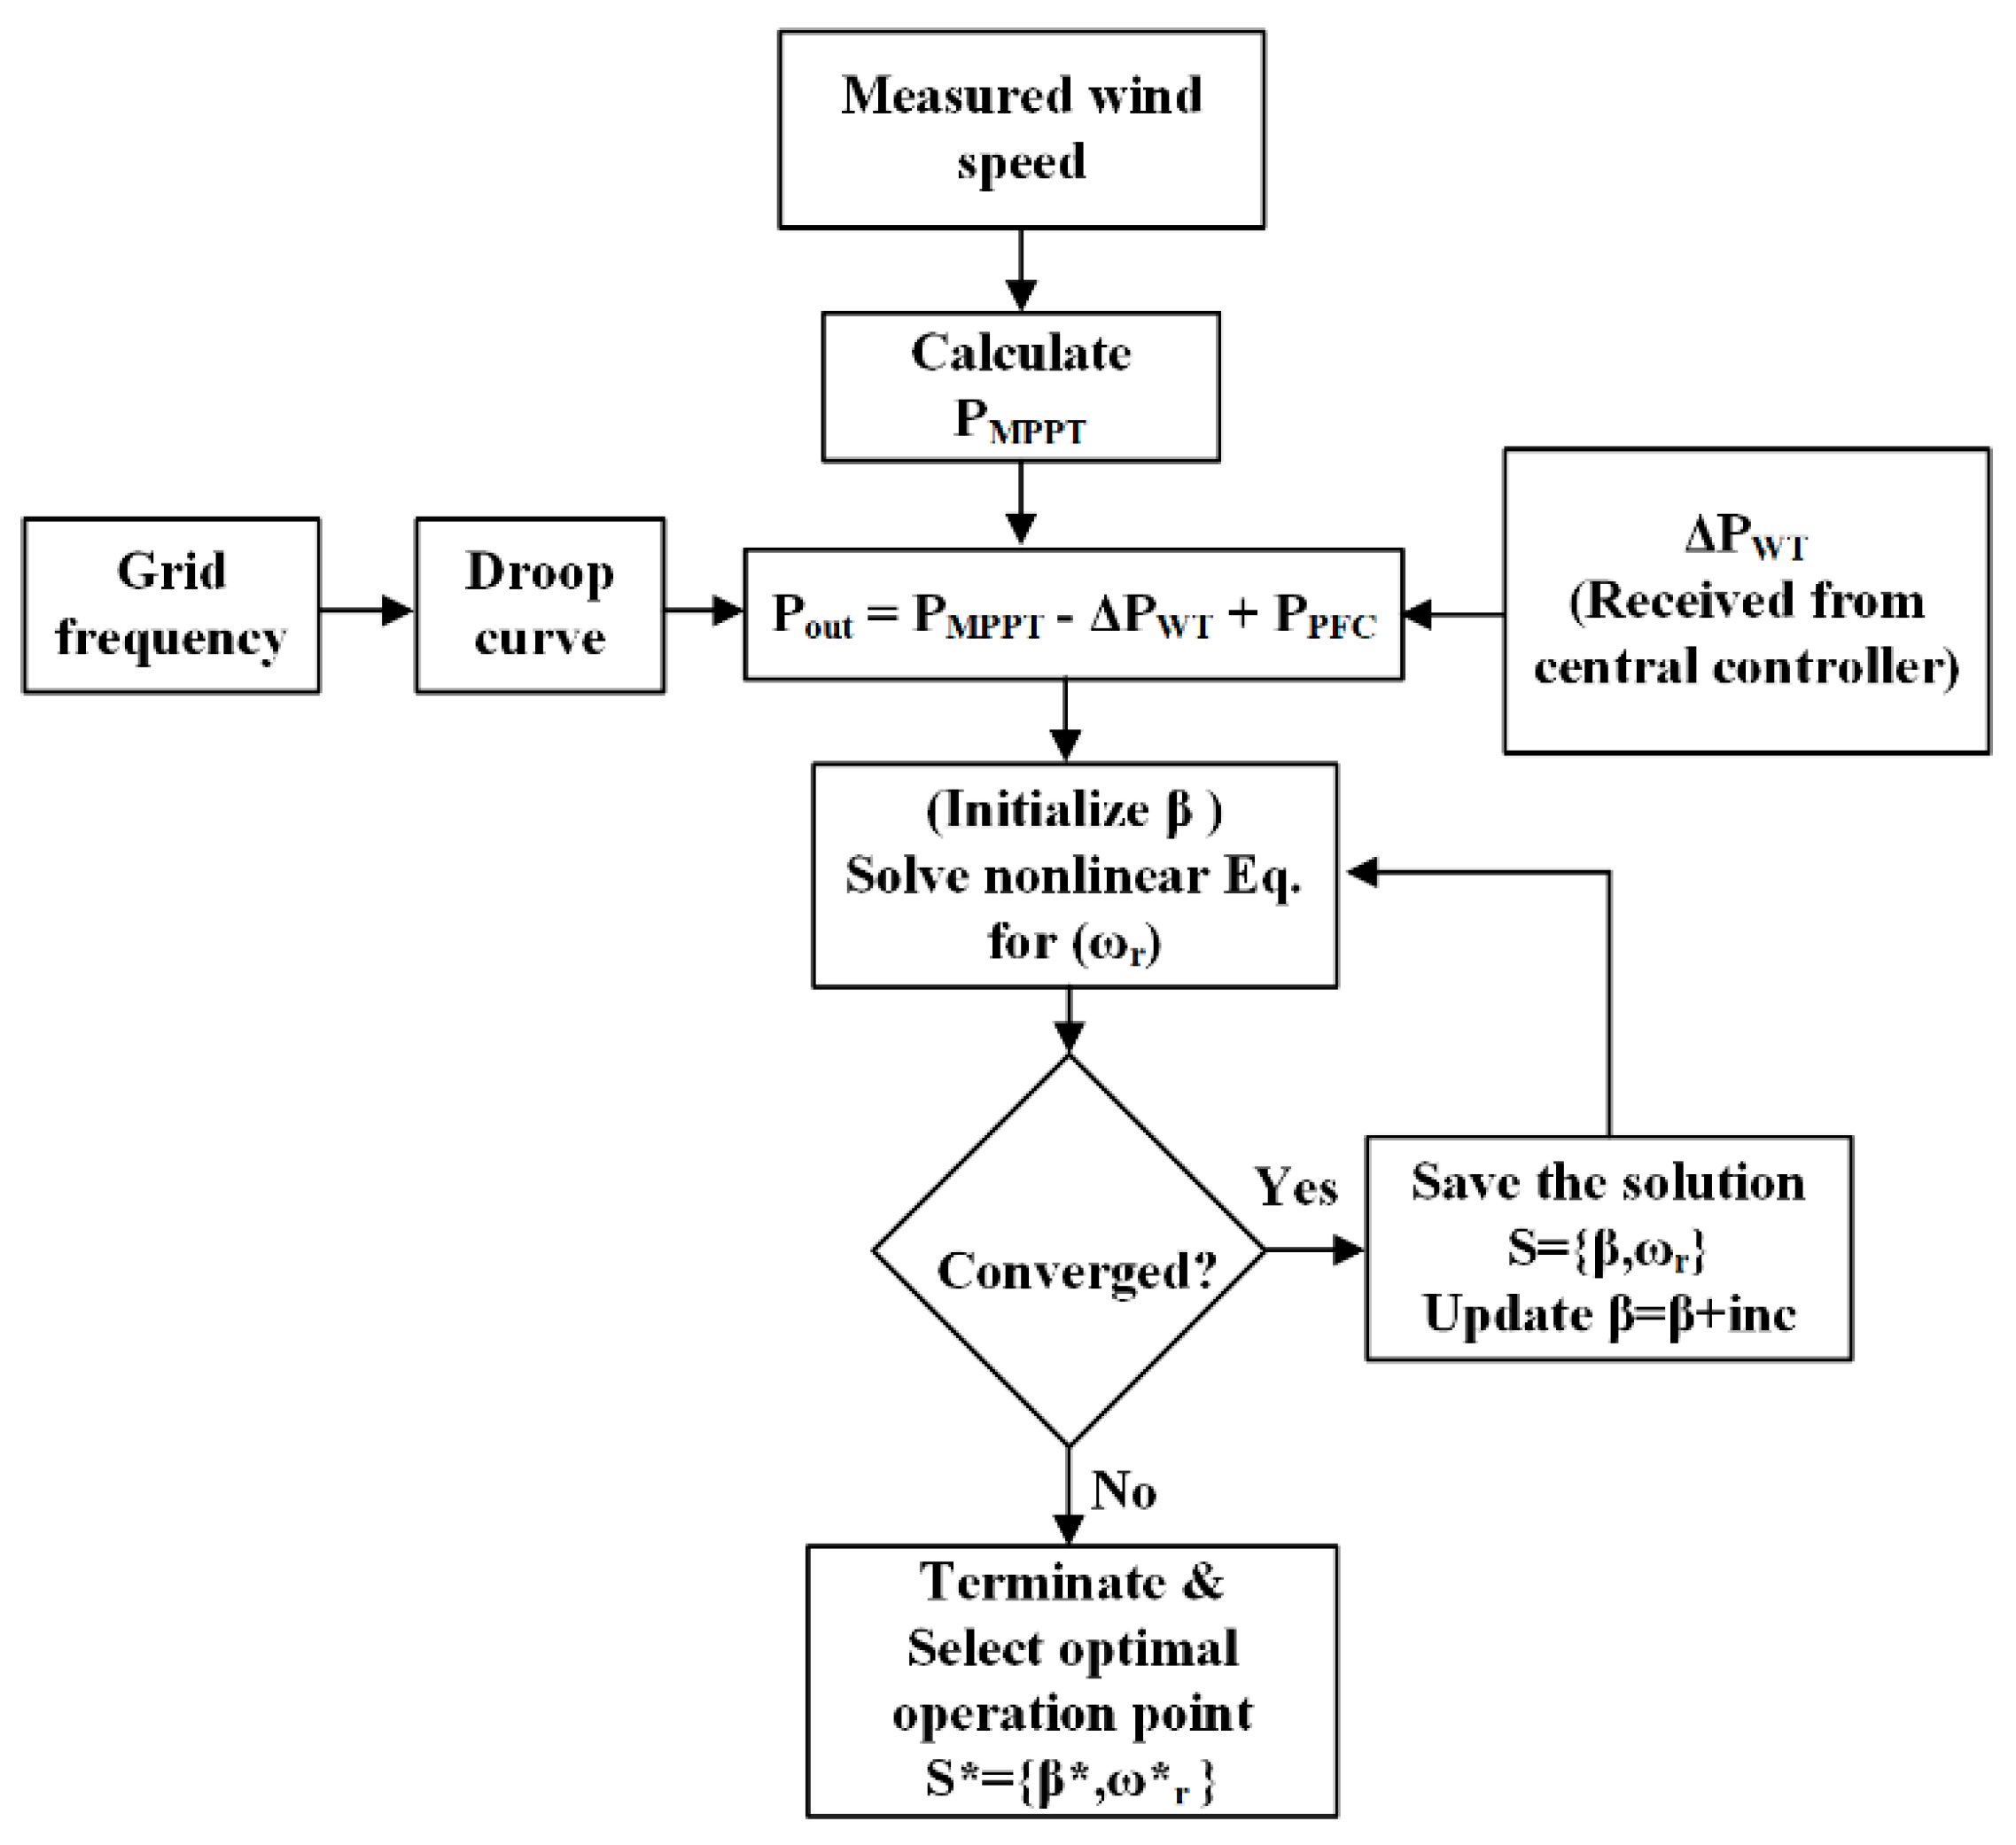
The optimum operating point of pitch angle and rotor speed is determined using the steps as follows:
- Calculate the current and future maximum available power as
- Calculate the output power aswhere is the output power of the droop curve and is the reserved power.
- Set and solve the nonlinear power equation for as:
- Increment and repeat Step 3 until .
- Select an optimal solution such that:
All solutions found by the solver in Step 3 provide the same output power as demonstrated in Figure 2. However, the optimal solution, , is selected such that pitch angle is as maximum as possible. As a result, the required rotor speed of the WT is increased and obtained by the nonlinear solver in Step 3. This will minimize the resistive power in the machine as in Equation (6) and the conduction losses in Equation (7). The algorithm must consider operation limits, such as
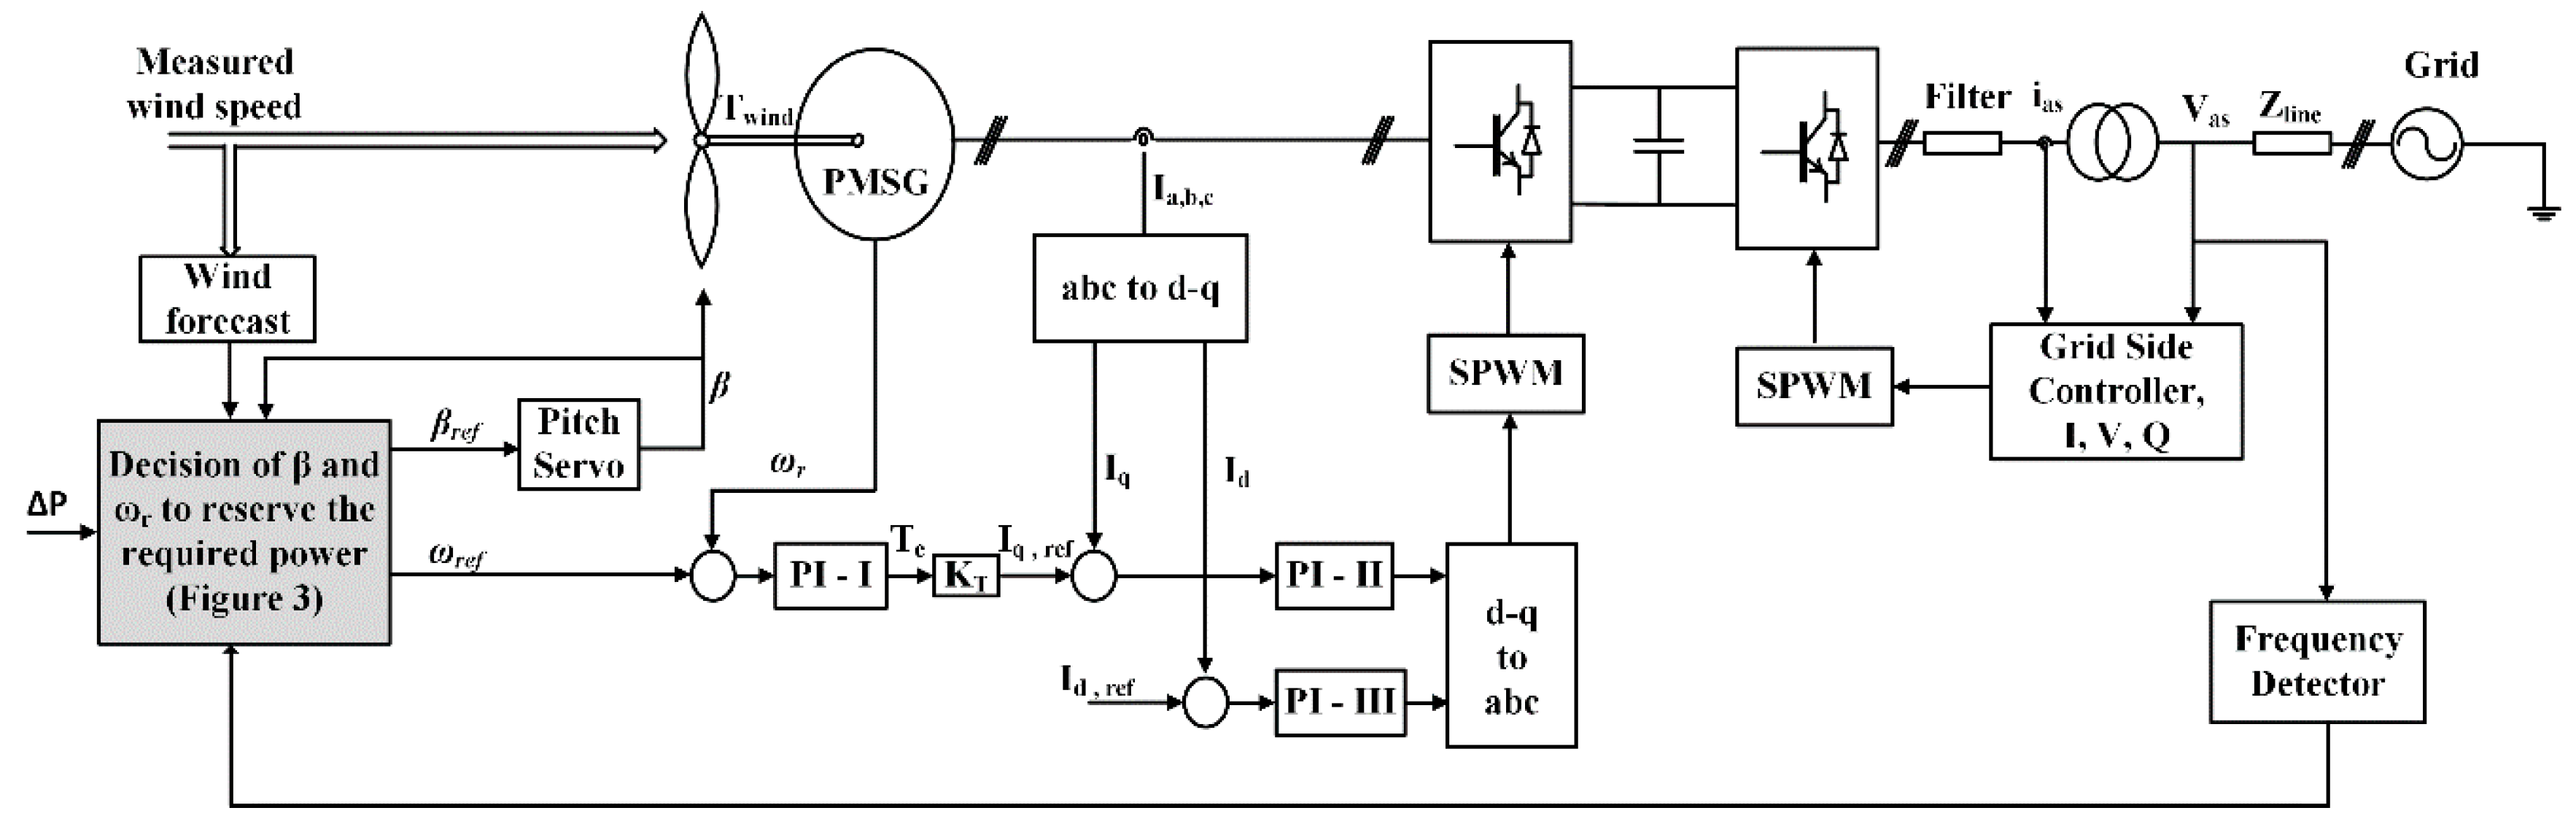
Figure 3 summarizes the algorithm used to generate the optimum operating point of pitch angle and rotor speed. Note that the output of the droop curve can be involved in the equation, in order to define the rotor speed for the amount of power necessary to be injected during a frequency drop. Otherwise, the PFC power is considered to be zero.
The proposed algorithm with the control loop is shown in Figure 4. The pitch controller is based on a conventional method, where the pitch angle is controlled considering the pitch servo transfer function [28]. The rotor speed is controlled using a designed proportional integral (PI) controller with an inner loop to control the current.
The controller must ensure a smooth and reliable response to frequency drop. Therefore, the controller is required to adjust the frequency variation by considering the output of a droop curve.
4. Simulation and Hardware-in-the-Loop Results
The parameters of the system considered in this study including WT, PMSG are presented in Table 1. The wind turbine has a nominal rotor speed of 25.88 rpm at a 12 m/s rated wind speed. The rated power of the machine and WT is 2 MW.
4.1. Simulation Studies
For simulation study, different scenarios were implemented to achieve de-loading. The first scenario was based on varying the rotor speed only, while keeping pitch angle constant. The second scenario was performed using the proposed method, but allowing pitch angle variation without wind speed forecasting. In the last scenario, the proposed de-loading method was implemented to obtain an optimal pitch angle that is valid for a longer time frame, and updating the rotor speed instantaneously.
The simulation experiment was repeated again to perform de-loading for PFC purposes. In this scenario, the pitch angle was kept constant (i.e., 0 degrees), while the de-loading was performed using a rotor speed controller. The maximum power point tracking (MPPT) was modified to track the output power by subtracting the maximum power by the required power to be reserved. Then, the reference rotor speed was calculated to provide the required reserve power.
The proposed algorithm was used to de-load the WT, in order to maintain an adequate amount of power for PFC use. In this scenario, the wind profile was assumed to be predicted by wind forecast. The averaged estimated wind speed was used to find the optimum pitch angle for a longer period. Then, the current and future wind speed is used to estimate the optimal possible pitch angle for that time frame. The rotor speed was extracted using the nonlinear relation, using Equation (10).
4.1.1. Long-Term (One Day) Simulation
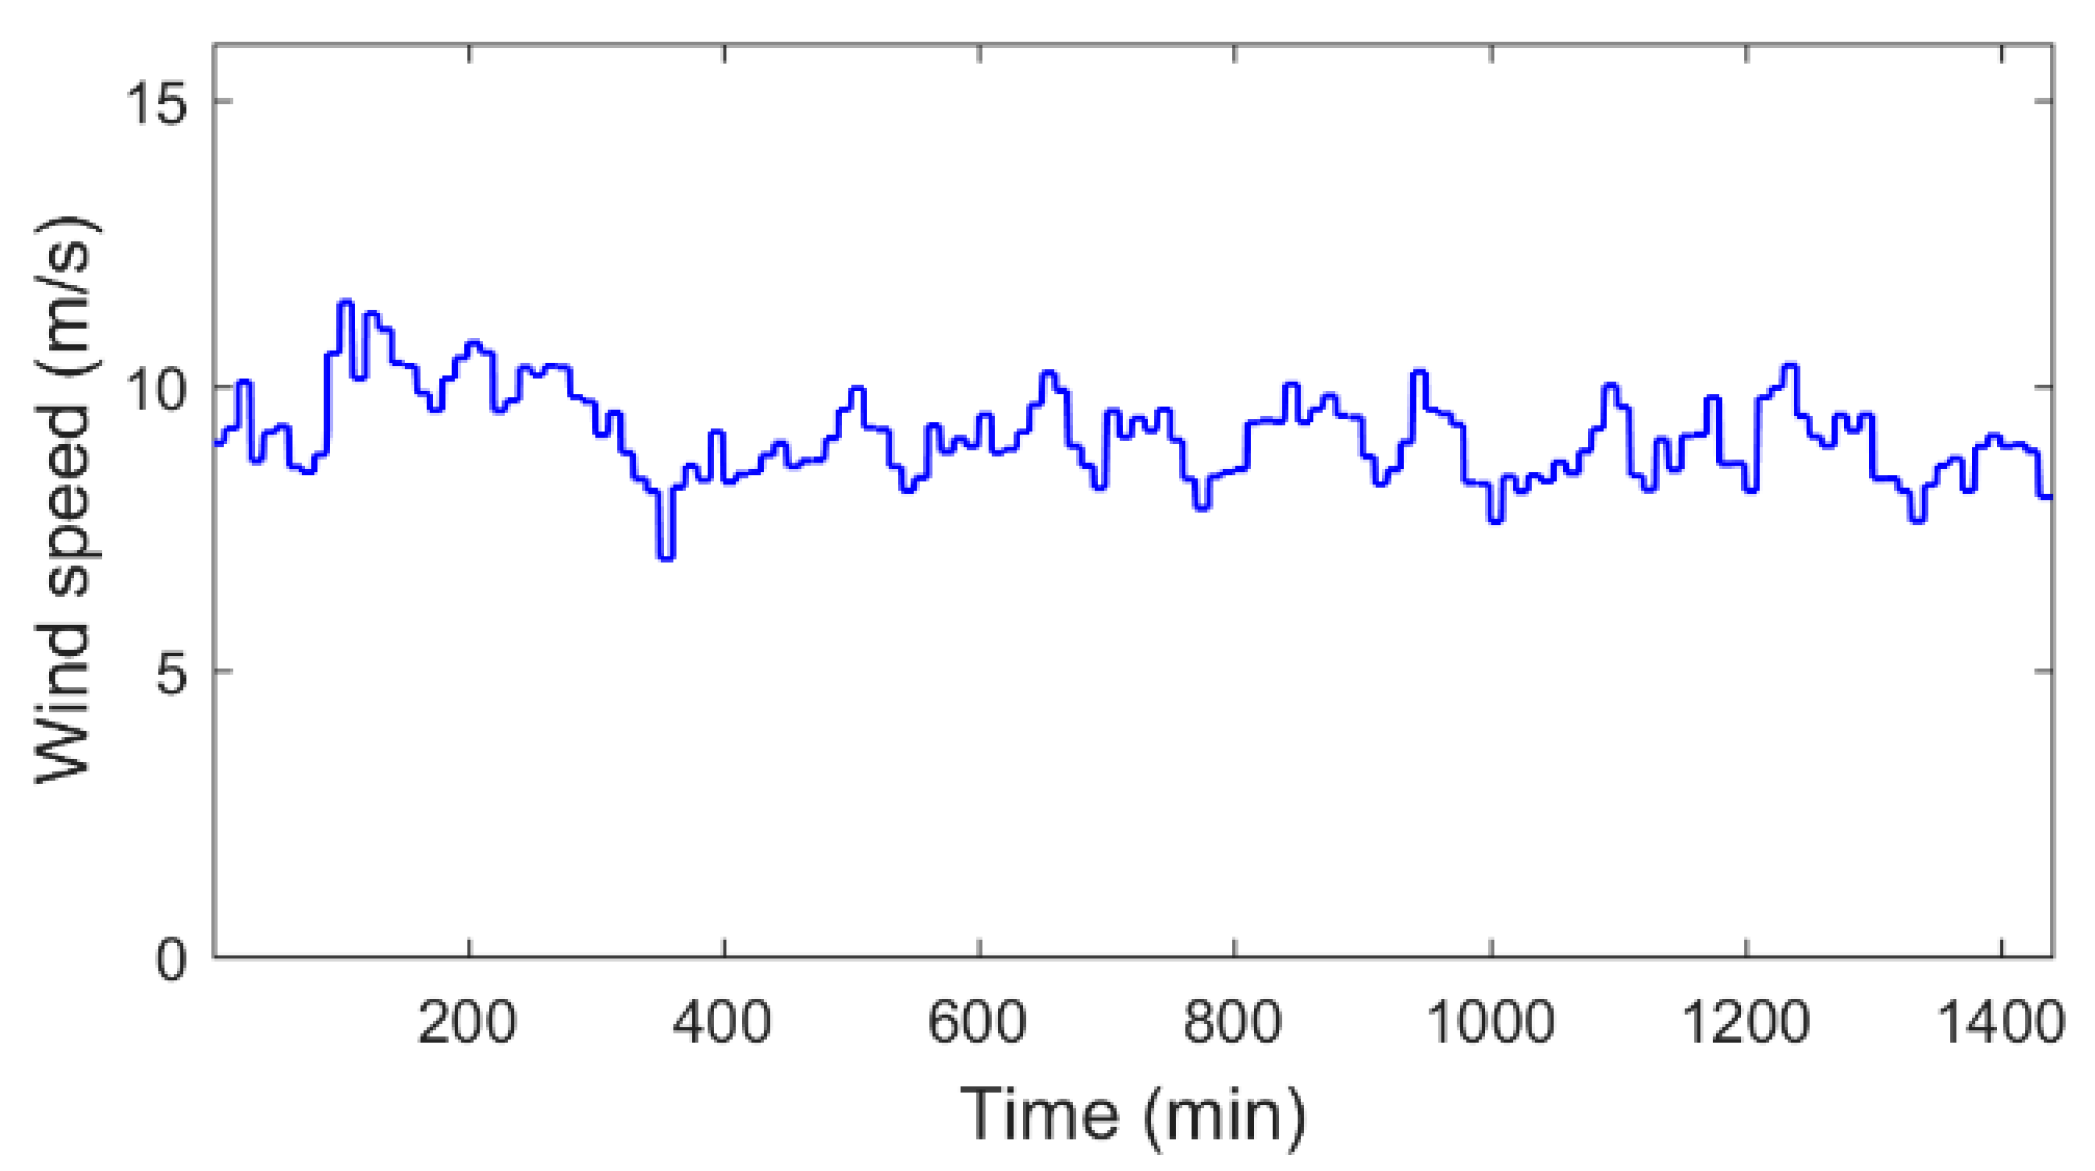
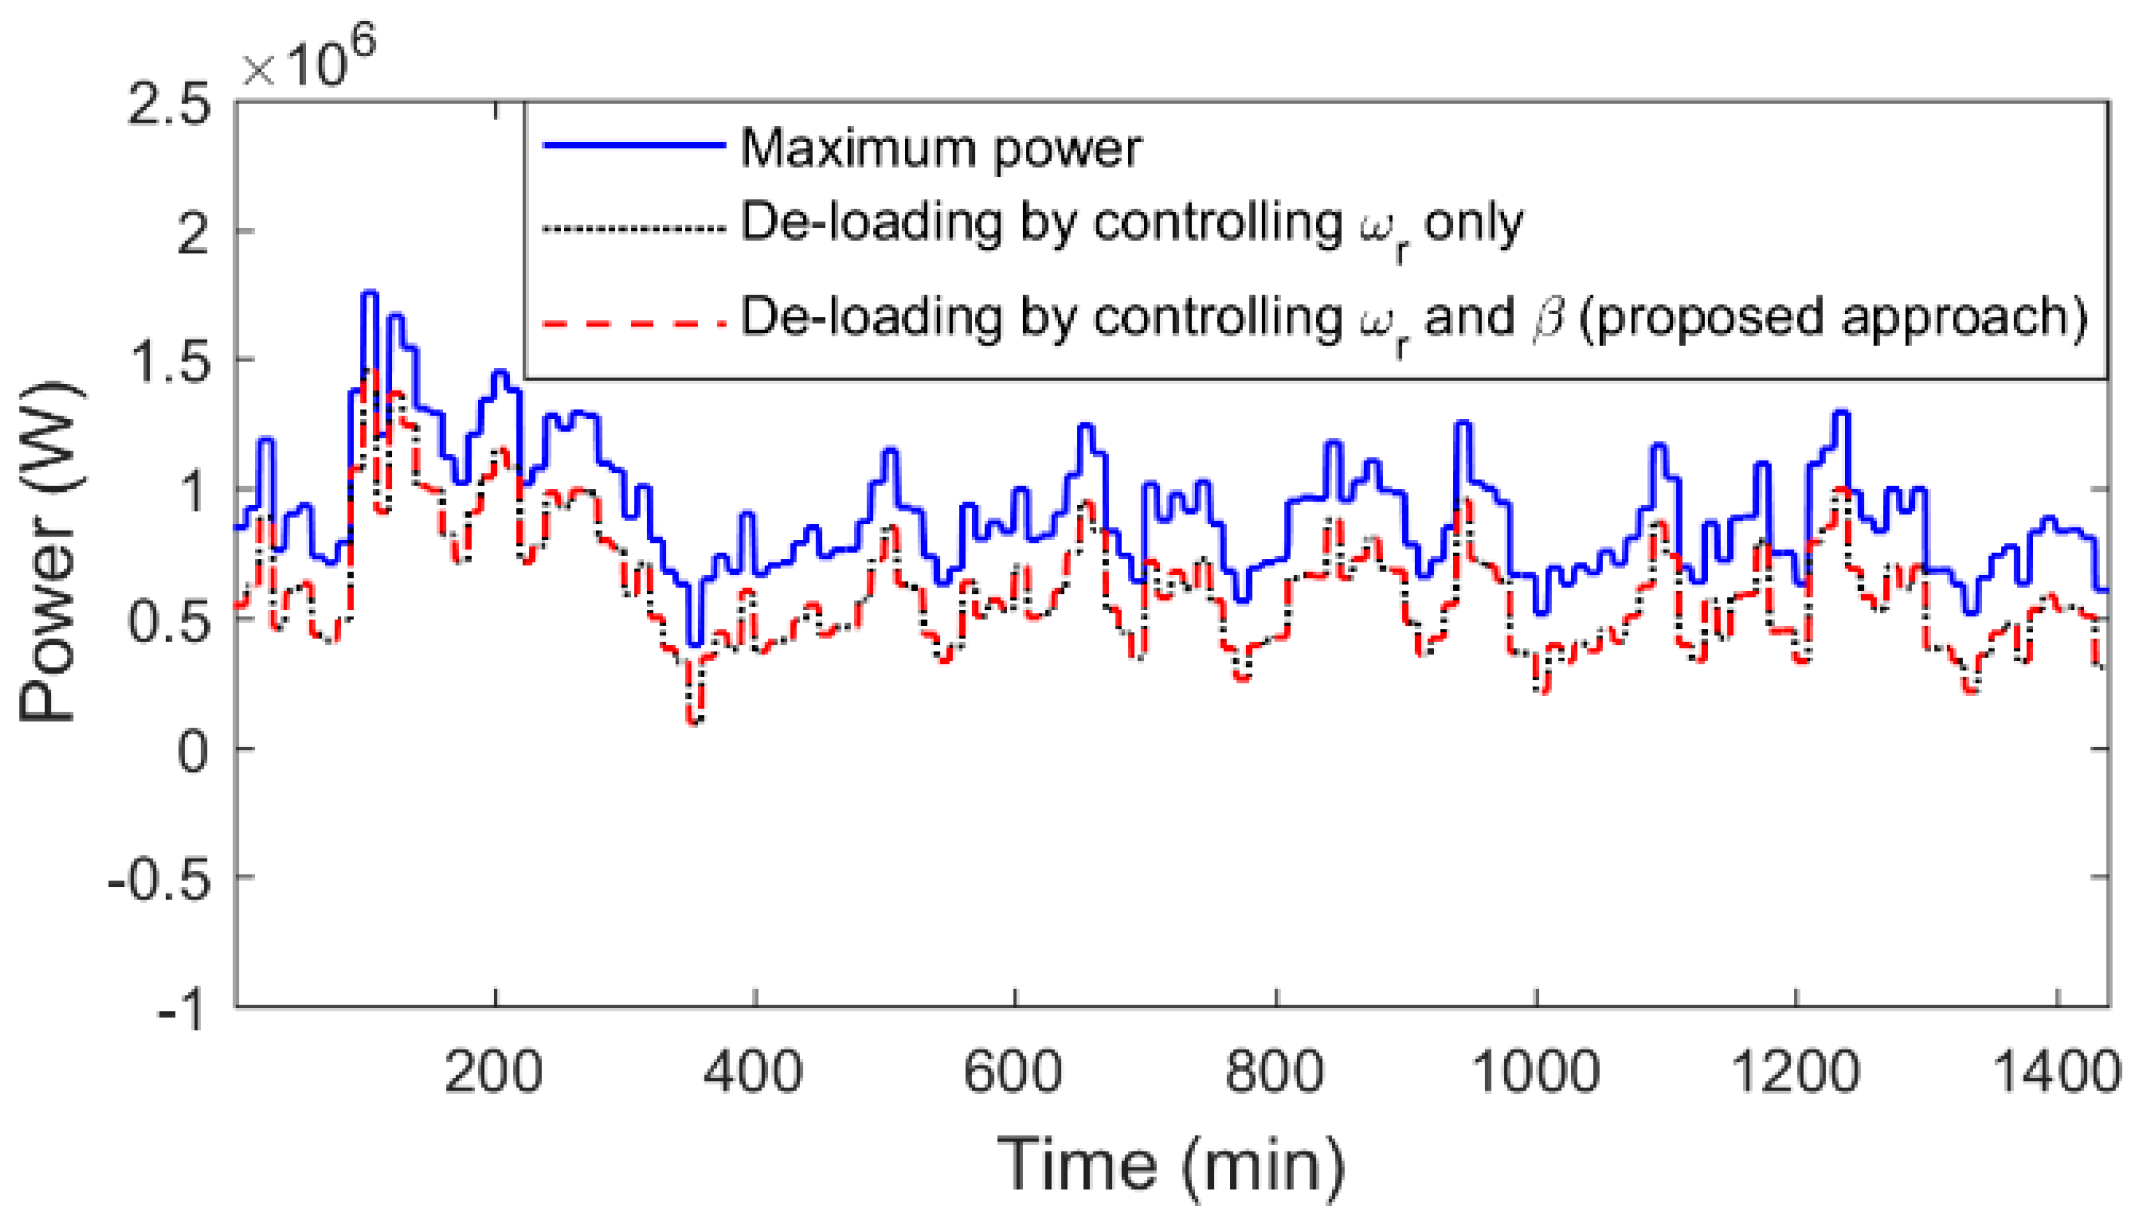
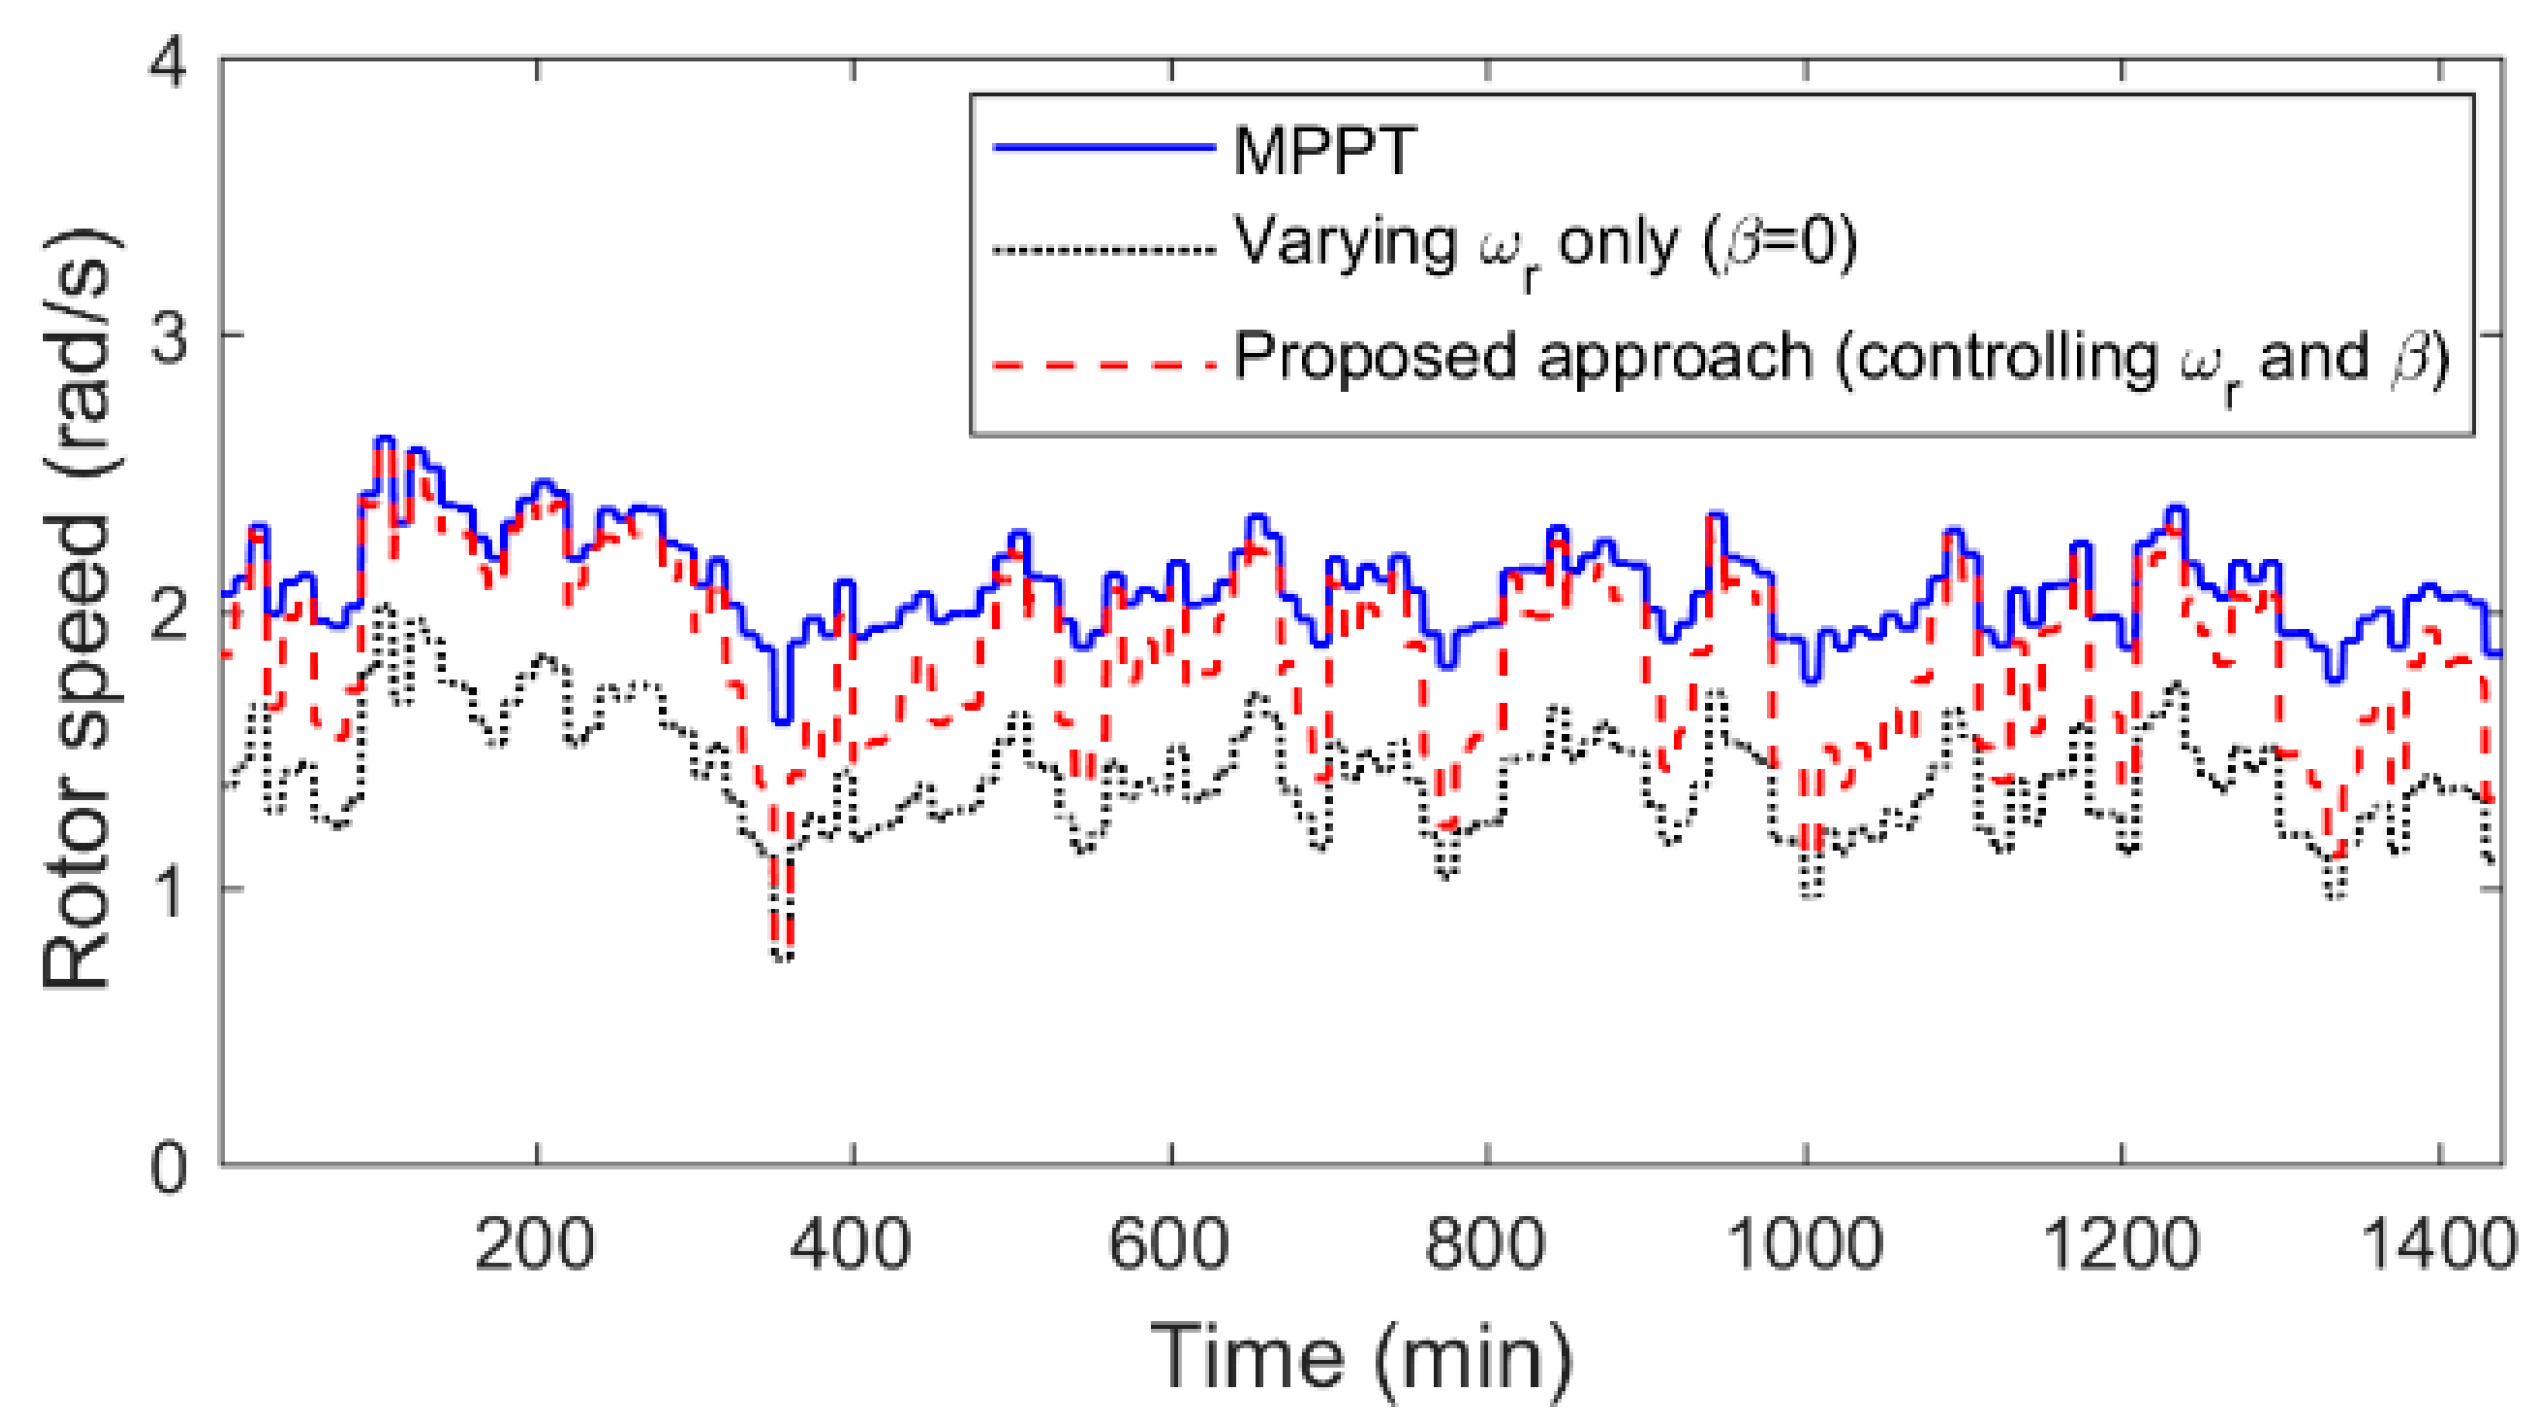
First, a simulation of one day of wind profile was performed. In this study, simplified model of the WT and PMSG were used to expedite the simulation. The wind profile used in this study is shown in Figure 5. Figure 6 shows the maximum power available and the de-loaded power. The dotted line represents the WT power achieved by rotor speed only. The WT power obtained by coordinating between rotor speed and pitch angle is presented by the dashed line. It is clear that both approaches provide the same amount of reserve power (). In this study, the reserve is fixed at 0.3 MW for all wind profiles.
Although every method gives the same reserve, the rotor speed is different, as shown in Figure 7. The rotor speed is increased by involving the pitch angle. This is because of the higher pitch angle that results in lower torque of the WT. Therefore, to maintain the same reserve, the rotor speed is increased. As a result, the quadrature current of the PMSG () is reduced, as shown in Figure 8. In this simulation, we controlled the current of the direct axis to be zero. Therefore, the only current that appears in the losses is the current of the q-axis. From Figure 8, it is clear that with a pitch angle, the current is higher for whole period considered in this simulation. Current produced by the proposed approach reduces the power losses in the stator of the machine and the conduction losses of the switch, as given in (6) and (7). In Figure 9, the pitch angle is represented using the dashed line.
The proposed strategy has the ability to utilize a wind speed forecast and predict the optimal solution. In this case, one can combine the optimal operating point of the current and future state in order to minimize the operation of the pitch angle. For the same wind profile, one model included the wind forecast and the other model did not consider the wind prediction in the decision. The pitch angle changed 82 times for the model without a forecast. In contrast, in the case where there was a wind forecast, the pitch angle changed 64 times, as shown in Figure 10. In both cases, the power produced by the WT was the same.
4.1.2. Short-Term Simulation
To test the wind system with the designed controller, a study was performed to validate the proposed method, using a detailed model of the whole system. The proposed WT system and control scheme shown in Figure 4 was modeled in Matlab/Simulink.
The aim of this short-term simulation was to validate the performance of the proposed algorithm, and examine its accuracy and response to wind variation. Therefore, the approach should give the reference for the pitch angle and rotor speed as quickly as possible.
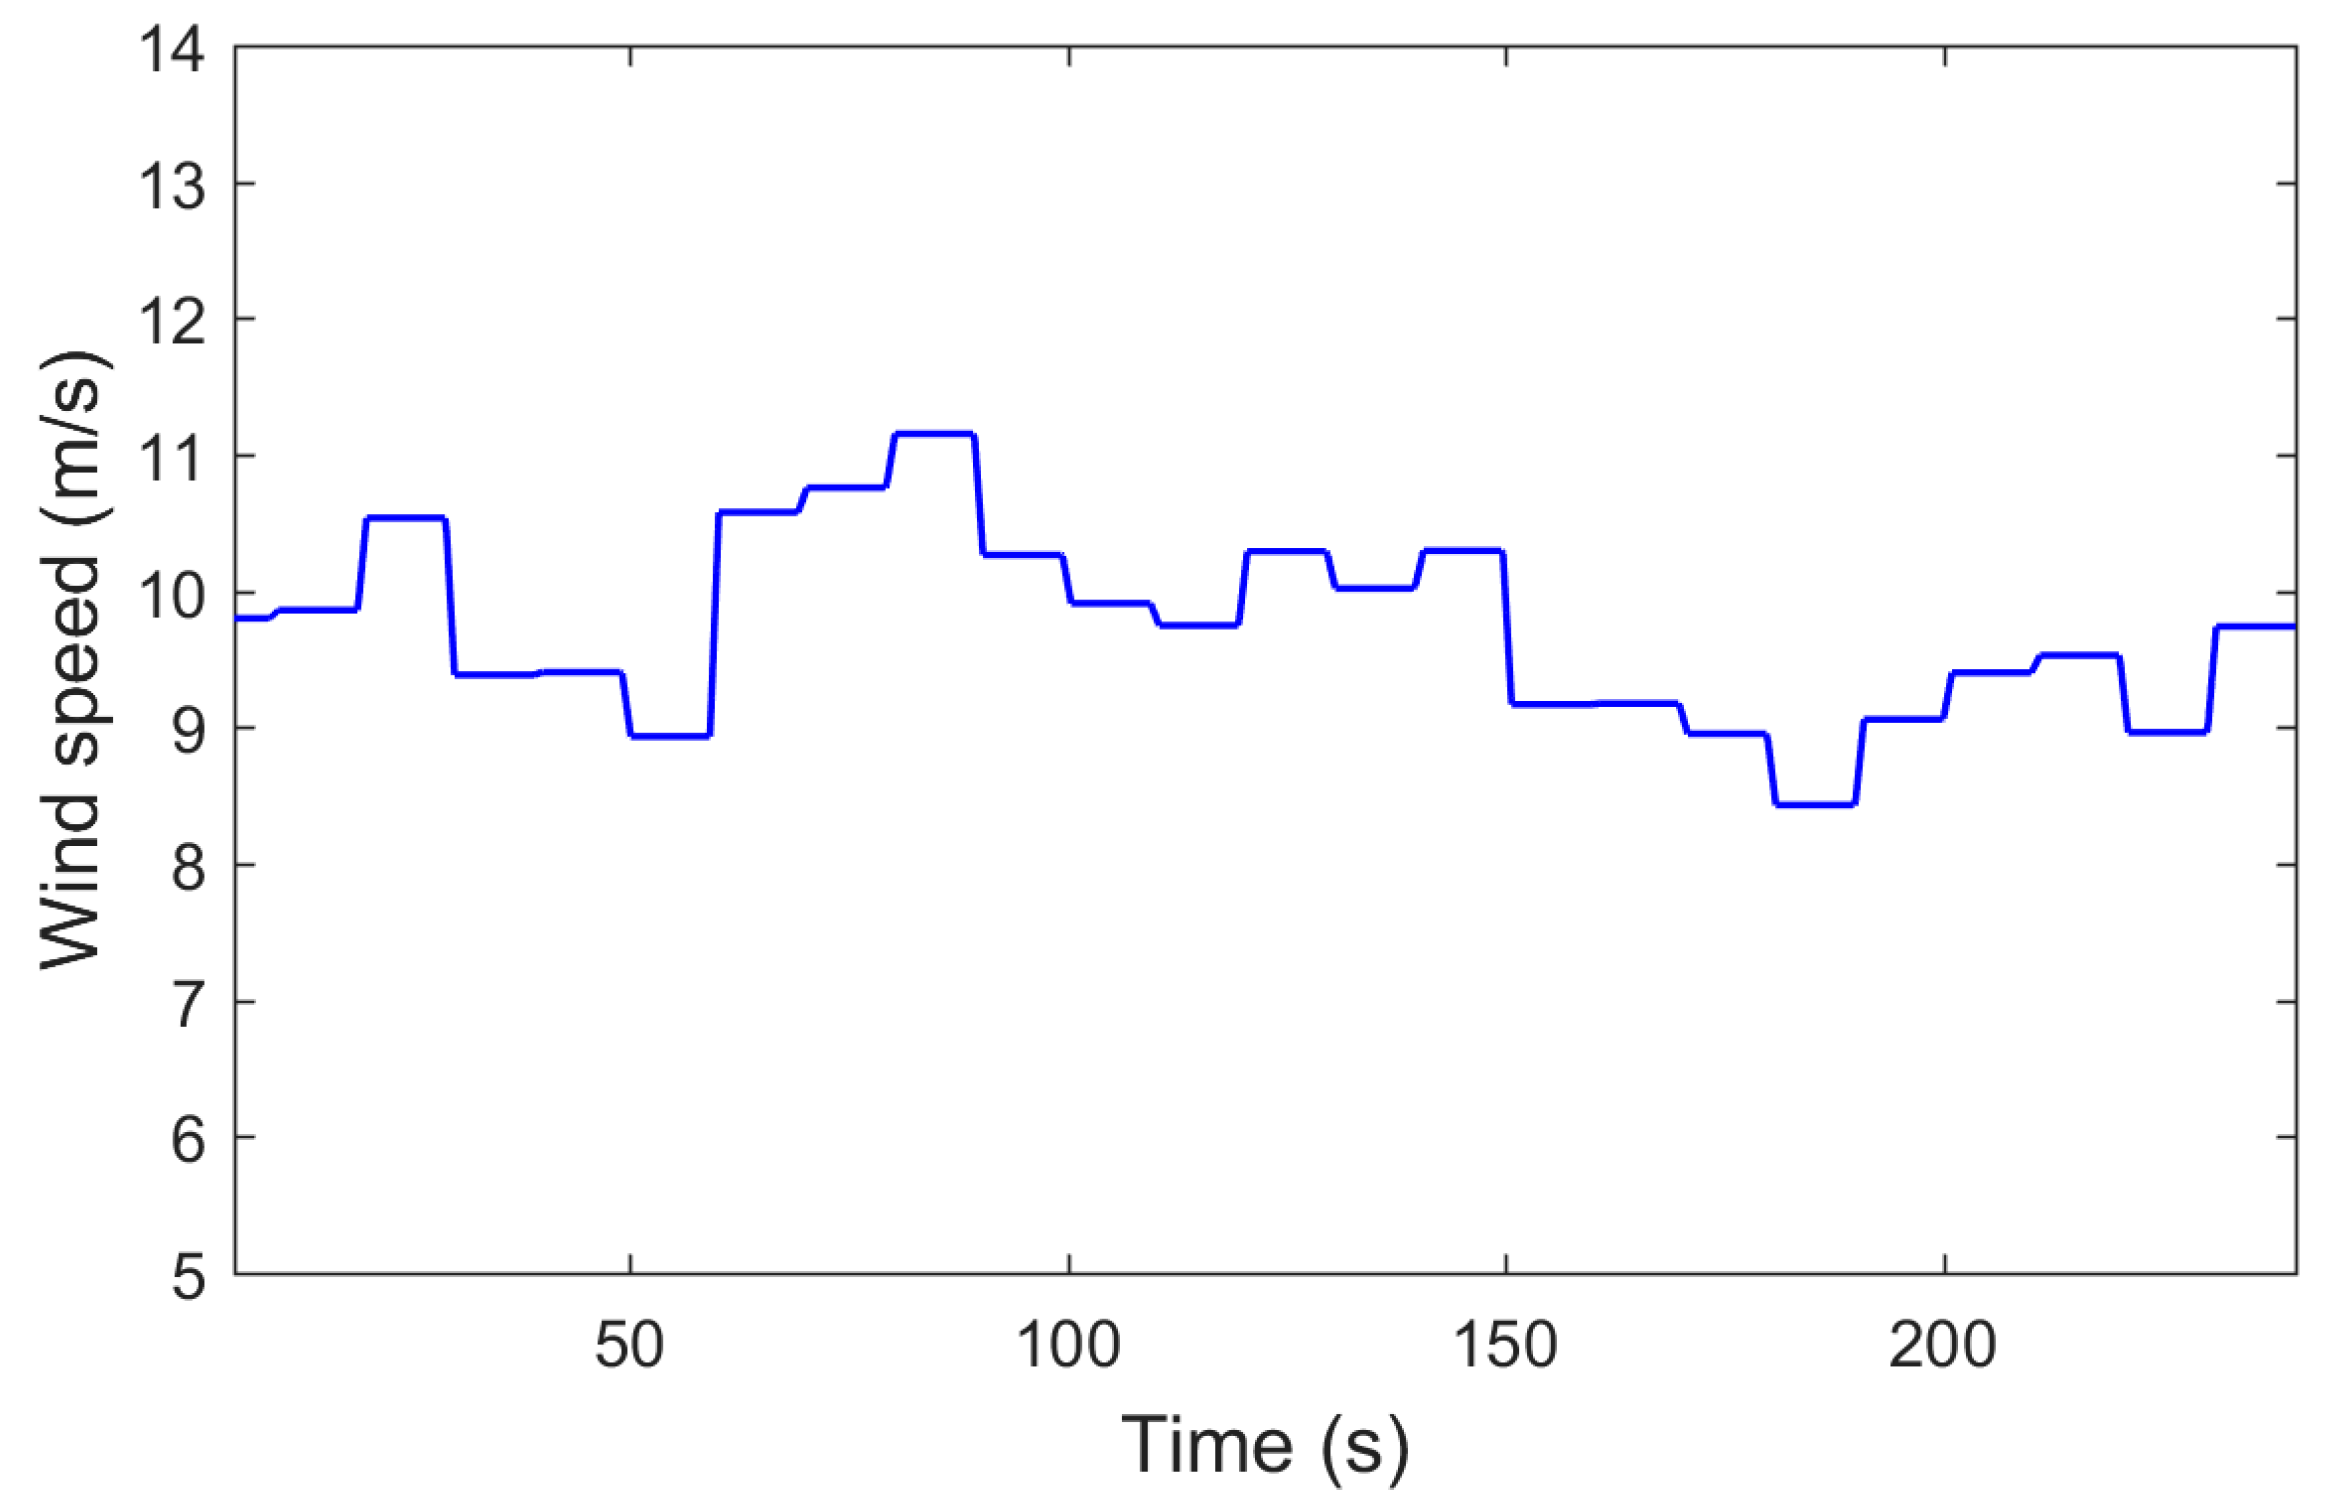
In this simulation study, the wind speed was scaled to be in seconds instead of minutes. The wind turbine system was tested with the wind profile shown in Figure 11. Like the one-day simulation, in order to demonstrate the performance of the proposed de-loading algorithm, two different approaches were performed, with different methods of de-loading. First, the rotor speed only was used as a tool to maintain the reserved power. Then, the proposed de-loading approach was implemented using the same wind profile for the purpose of comparison.
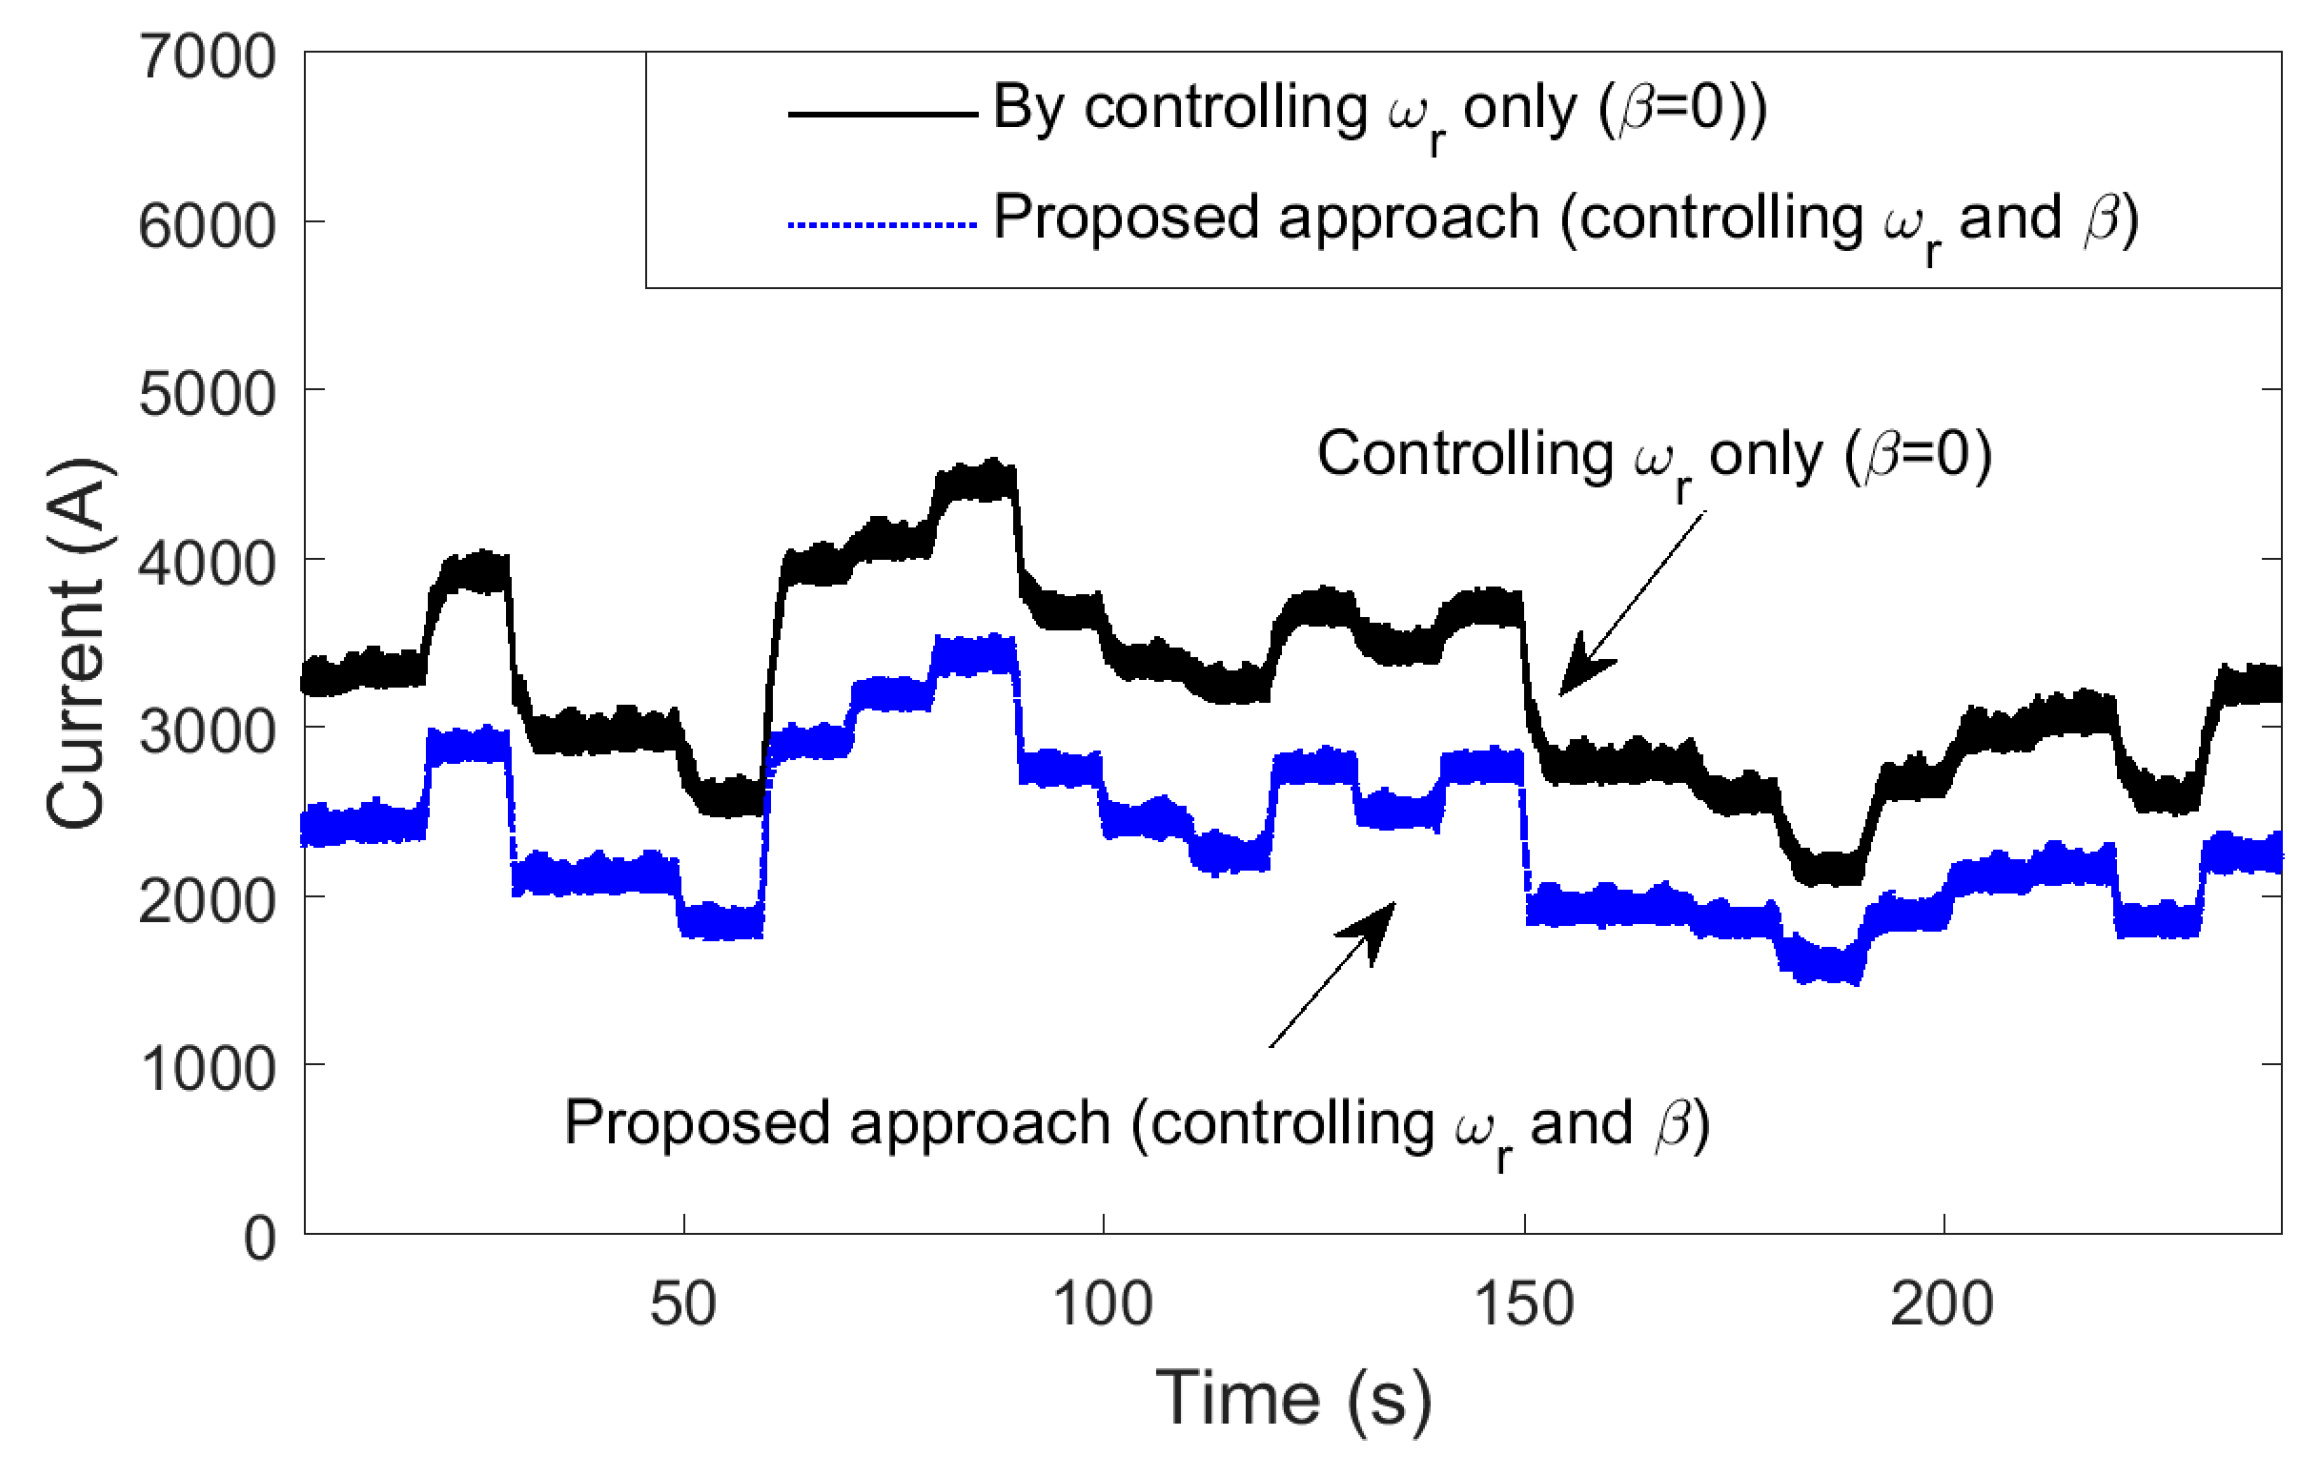
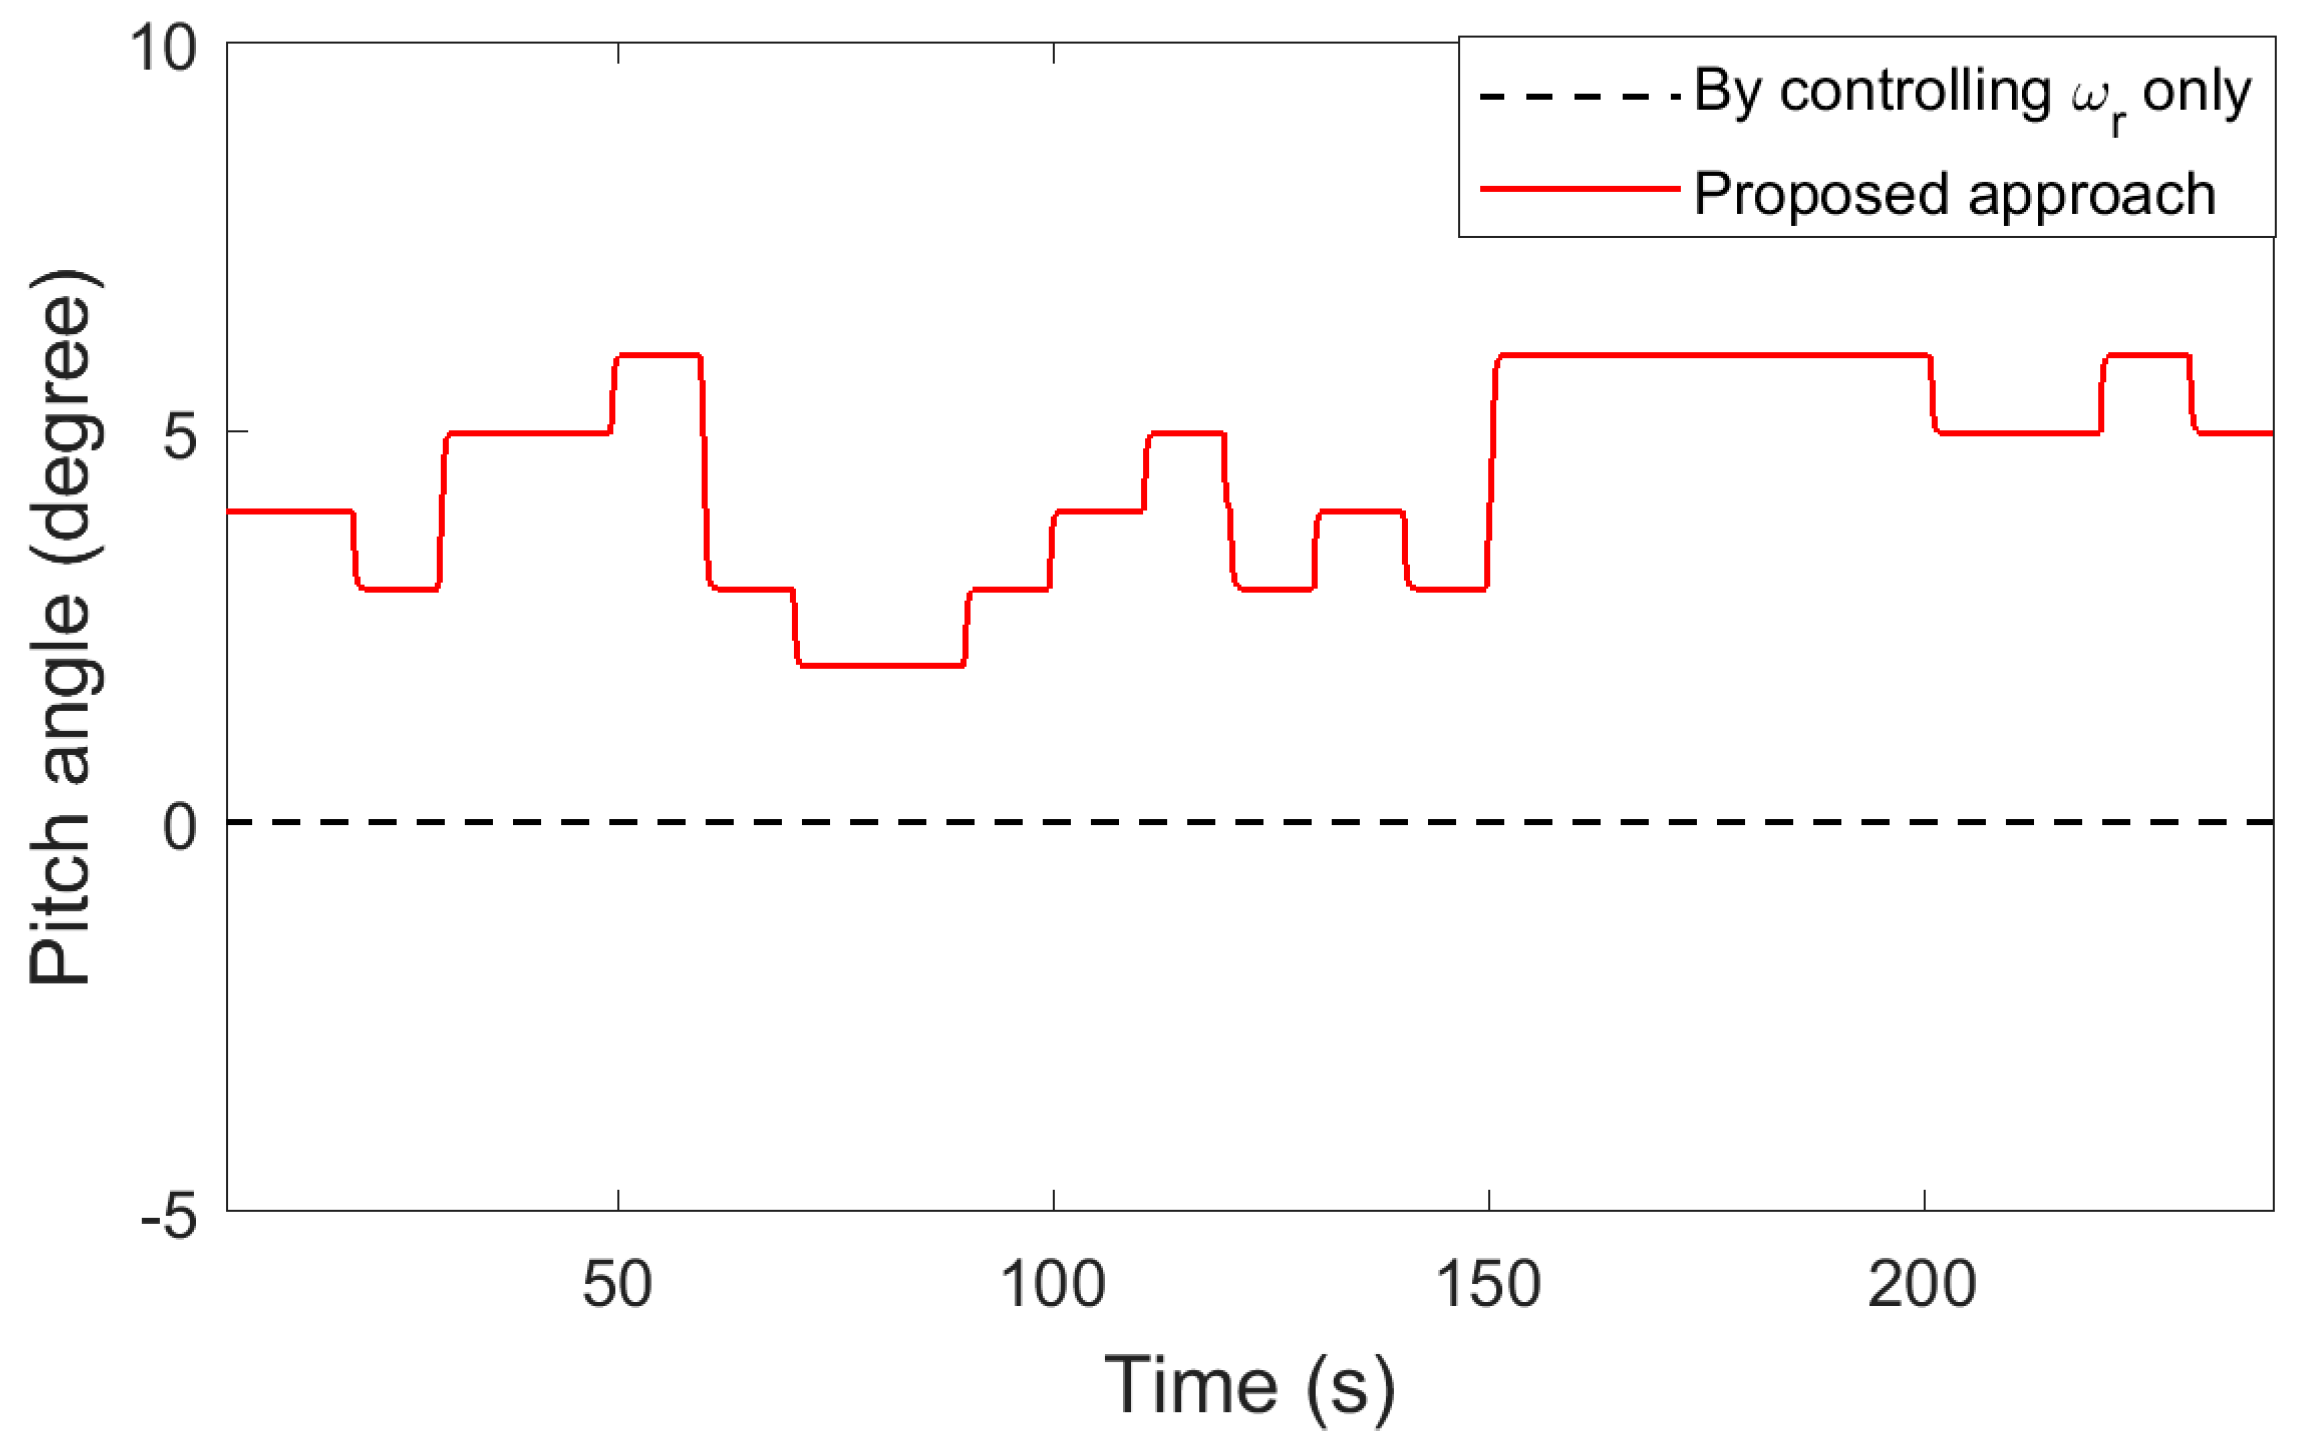
Initially, the MPPT was implemented to be used as a baseline. Then two scenarios discussed in the previous section were examined. Figure 12 shows the maximum and de-loaded power for the two methods. The rotor speed for the different methods are demonstrated in Figure 13. Both approaches provide the same amount of reserve power (). As a one-day simulation, the reserve was fixed at 0.3 MW for all wind speeds. For the rotor speed method, the rotor speed was reduced compared to the other method. This low speed results in higher stator current, as shown in Figure 14. The participation of the pitch angle controller is demonstrated in Figure 15.
The high current on the stator causes an increase in the resistive losses and conduction losses, as demonstrated in Table 2. The table presents the averaged resistive losses and conduction losses for the whole period (240 s). The resistive losses are calculated using Equation (6), where the d-axis current is controlled to be fixed at 0 A. The IGBT characteristics were taken from the ASEA Brown Boveri (ABB) data sheet that matches the rating of the WT system, (5SNA 3600E170300 HiPak IGBT module). The conduction losses were calculated using web-based software (SEMIS) developed by Plexim (Zürich, Switzerland) for ABB data-sheet characteristics, in order to consider the detailed thermal module of the converter.
4.2. Real-Time and Hardware-in-Loop Results
To validate the response and the performance of the proposed approach with the designed controllers, hardware-in-the-loop (HIL) was implemented, as shown in Figure 16. The HIL study provides a real-time benchmark to test the proposed method and the designed controllers. The WT system is modeled and compiled inside an Opal-RT real time simulator. Then, C-code was generated for the controller of the machine side converter, and was implemented inside a Texas Instruments (TI) Digital signal processor (DSP), (TI TMS230F28335).
The controller (DSP) receives the rotor speed and the machine’s current as an analog signal (fixed-sample) from Opal-RT. Then, the controller processes the signals and generates pulse width modulation (PWM) pulses to control the switches of the converter. The sampling frequency of the DSP is selected to be 9 kHz. The s-domain PI controllers were discretized using the backward Euler conversion method. The inner loop (current) controller is ensured to be faster than the outer loop (speed) controller.
In this study, the controller and proposed method was tested with the wind speed profile shown in Figure 17. Like the simulation studies, two different approaches for de-loading were implemented, using the same wind profile for comparison. A baseline of MPPT was tested first, and the maximum power was achieved. Then, the de-loading was implemented using the proposed method summarized in Figure 3, using the optimal pitch angle and rotor speed set. Then, de-loading was achieved using rotor speed only. A fixed reserve power of 0.3 MW was set for both approaches.
For consistency, the same wind speed and time frame were used for all scenarios. First, the controller received the reference to perform the MPPT. Then, the same controller was fed with a rotor reference to de-load the WT system. Finally, the reference generated by the proposed method was used to obtain the reference set points (rotor speed and pitch angle).
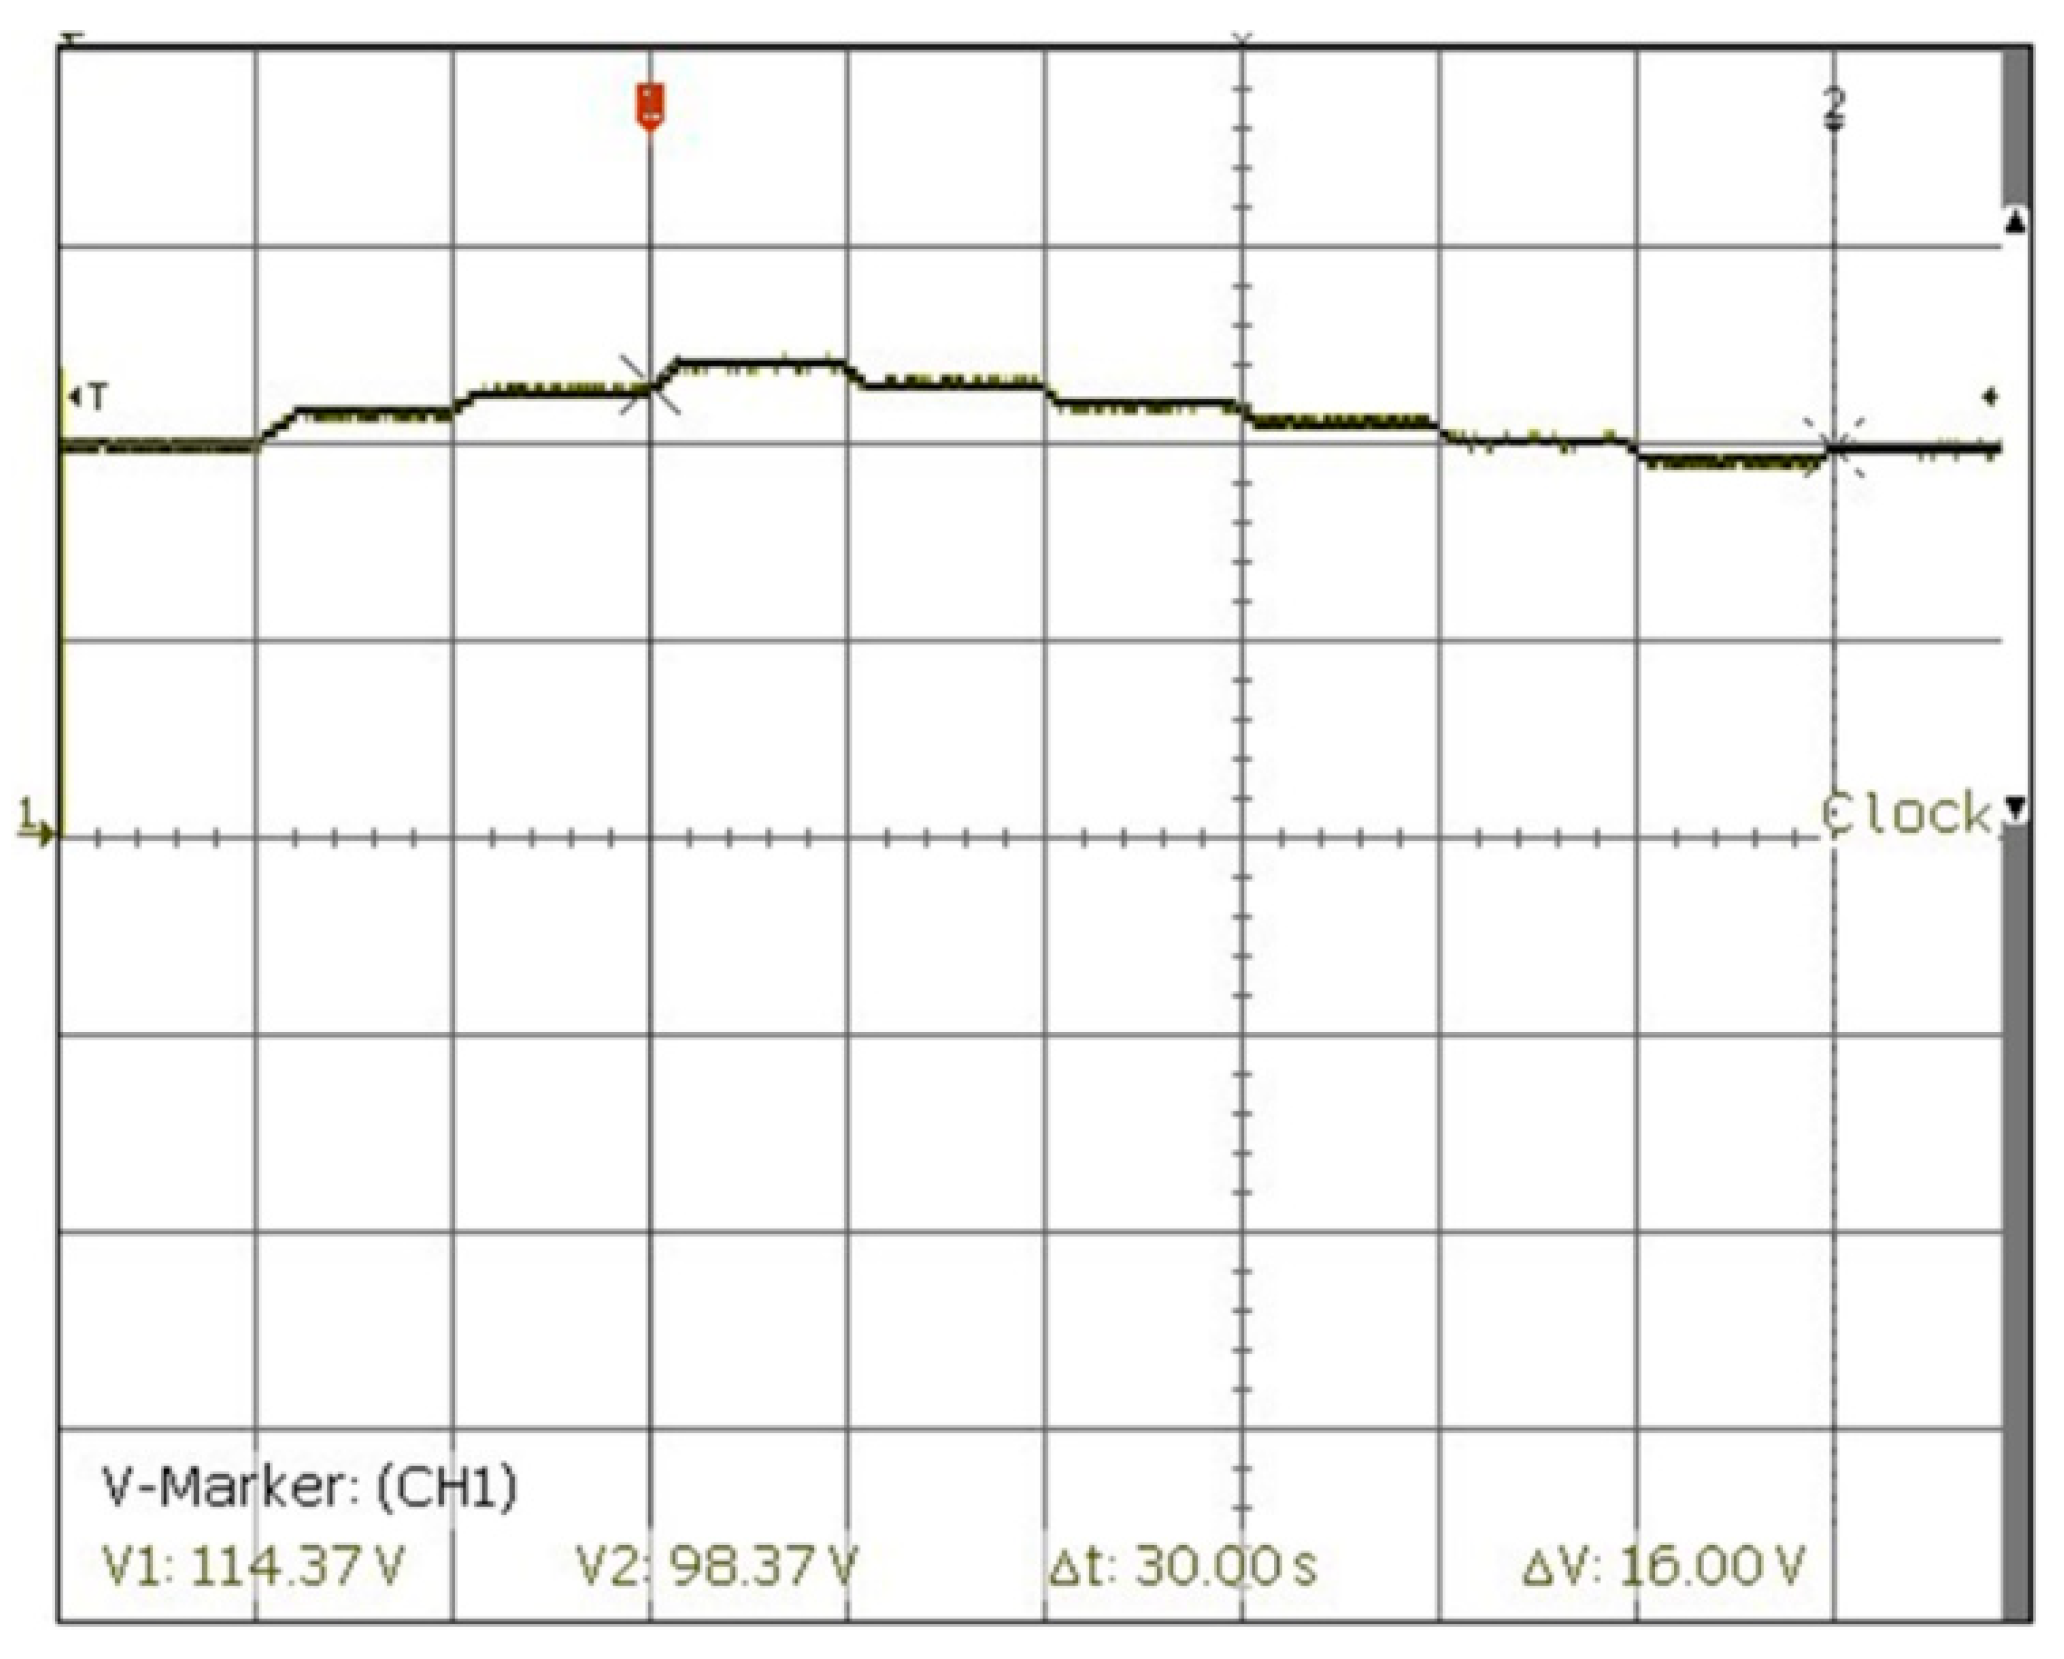
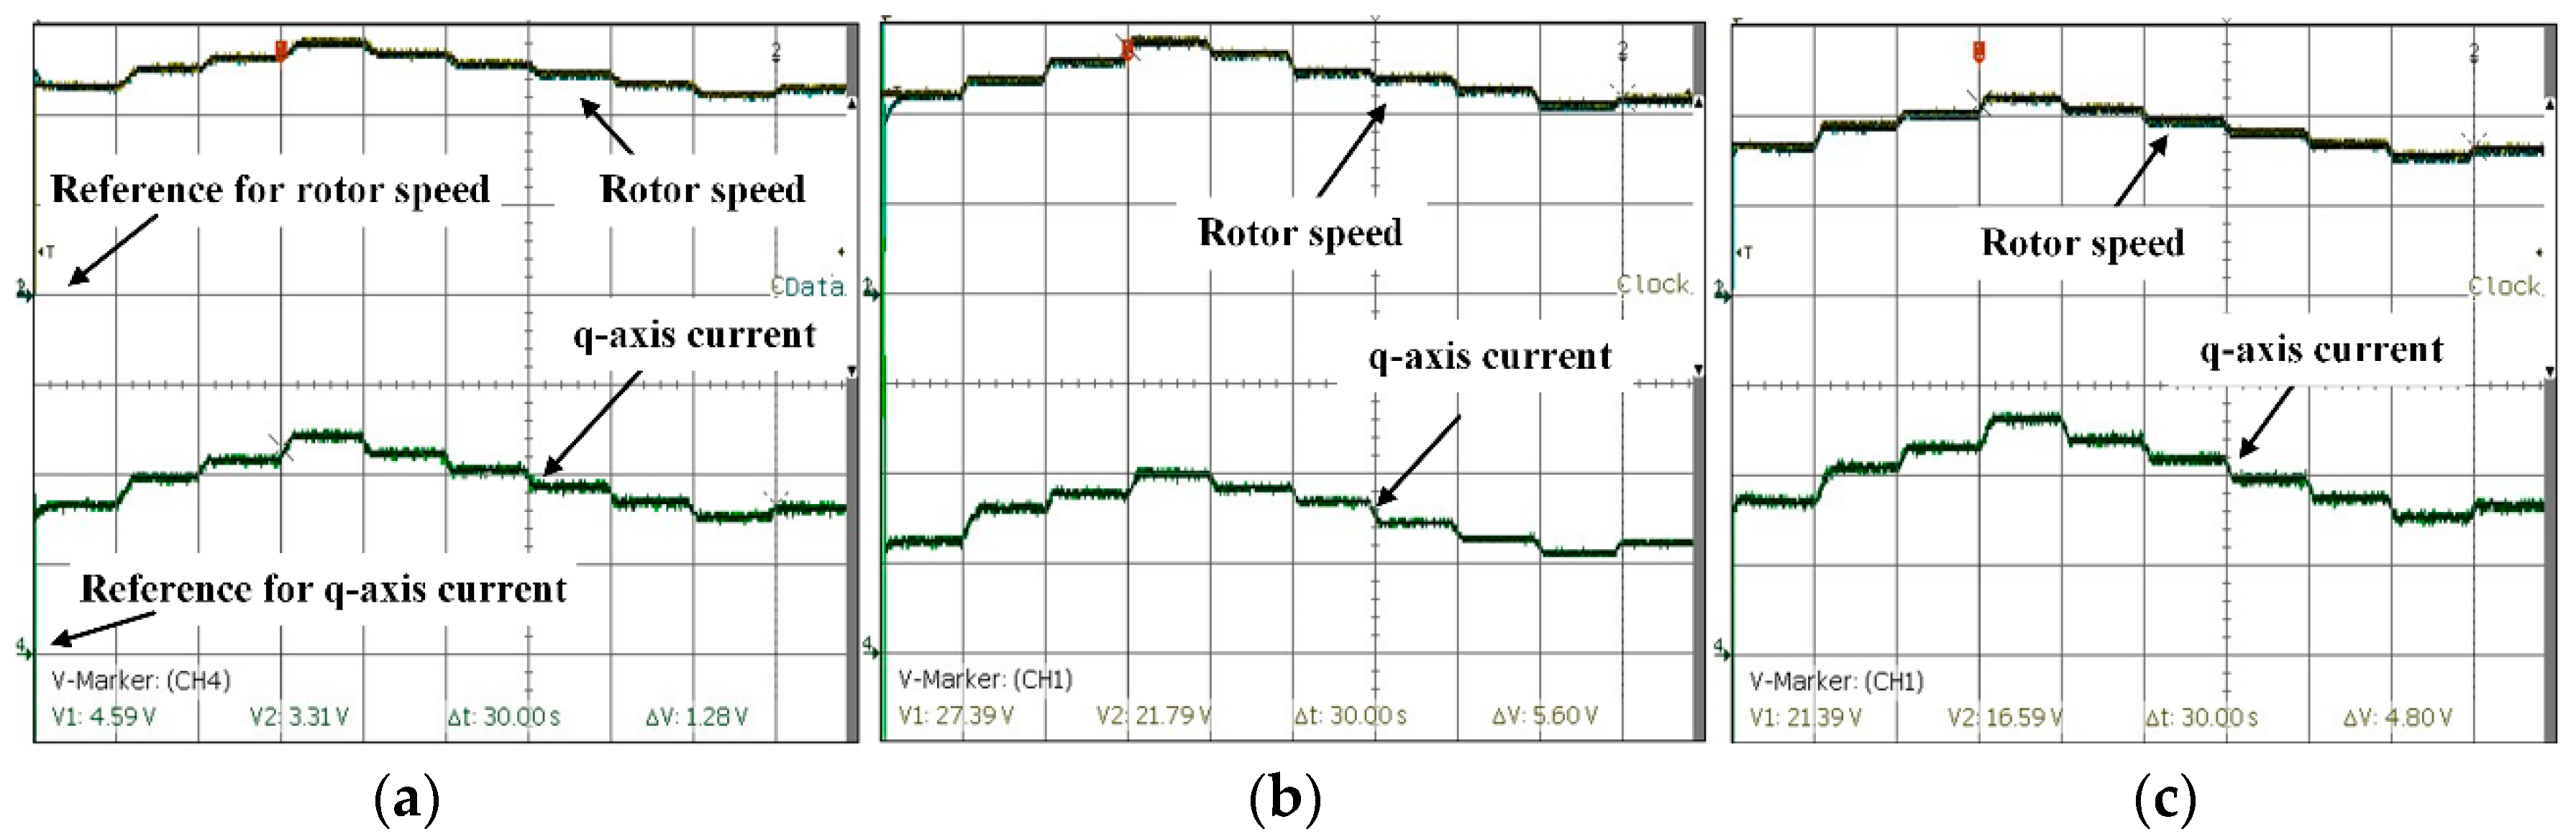
The results obtained from real time simulator and HIL are demonstrated in Figure 18, Figure 19 and Figure 20. For the proposed experimental method, the three-phase current for machine is shown in Figure 18. The rotor speed (measured and reference) and q-axis current for all cases are shown in Figure 19. It is clear that the proposed method reduces the q-axis current. As a result, the power loss is decreased. The rotor speed in the plot is in (rad/s), and the gain is 1. For instant, the rotor speed at the first 5-s time slot was 2.3 (rad/s) for the MPPT case. The rotor speed that resulted from the proposed method is 2.2 (rad/s), whereas, the rotor speed is 1.6 (rad/s) when the pitch angle is kept at 0.
The gain for the q-axis current is 2000. Therefore, the current at the MPPT case is 3400 A for the first 5-s time slot. For the proposed and fixed pitch angle methods, the currents are 2600 A and 3600 A, respectively. Figure 20 shows the power generated from the WT system. Both approaches provide the required reserve power, as can be seen from the plot. The proposed method involves a pitch angle controller, as shown in Figure 20b.
5. Conclusions
This paper is aimed to design an optimal control method for a WT system intended to provide PFC to support power system stability. The proposed method helps maintain reserve power to be used to support the stability of the power system, while reducing power losses in the WT system. The reserved power of the WT is achieved by controlling both pitch angle and rotor speed simultaneously. The main contribution of the proposed method is to reduce the current of the PMSG, and as a result, the copper losses and conduction losses are reduced. Comprehensive case studies were implemented in simulation, as well as HIL with a real-time simulator. The results showed good performance of the proposed algorithm. The method is able to maintain the required reserve power for different wind speeds. The copper losses were calculated and compared with conventional method to de-load the power of WT. In addition, the conduction losses were evaluated using web-based software developed for ABB data sheet characteristics. The copper and conduction losses were reduced significantly compared to the conventional rotor speed control method. De-loading of a WT system under its maximum capacity means that some power is not being used. Therefore, implementing this optimal strategy to a large wind farm can improve the overall power generation by reducing a significant amount of power loss.
Author Contributions
The authorship is equally shared, where M.G.S. served as the doctoral adviser for A.B. in his Ph.D. program at Colorado School of Mines.
Funding
This research received no external funding.
Conflicts of Interest
The authors declare no conflict of interest.
References
- Muljadi, E.; Gevorgian, V.; Singh, M.; Santoso, S. Understanding inertial and frequency response of wind power plants. In Proceedings of the 2012 IEEE Power Electronics and Machines in Wind Applications, Denver, CO, USA, 16–18 July 2012; pp. 1–8. [Google Scholar]
- Satpathy, G.; Mehta, A.K.; Kumar, R.; Baredar, P. An overview of various frequency regulation strategies of grid connected and stand-alone wind energy conversion system. In Proceedings of the International Conference on Recent Advances and Innovations in Engineering, ICRAIE, Jaipur, India, 9–11 May 2014. [Google Scholar]
- Motamed, B.; Chen, P.; Persson, M. Comparison of primary frequency support methods for wind turbines. In Proceedings of the 2013 IEEE Grenoble Conference PowerTech, Grenoble, France, 16–20 June 2013. [Google Scholar]
- Wang, Y.; Bayem, H.; Giralt-devant, M.; Silva, V.; Guillaud, X.; Francois, B. Methods for Assessing Available Wind Primary Power Reserve. IEEE Trans. Sustain. Energy 2015, 6, 272–280. [Google Scholar] [CrossRef]
- Singh, M.; Gevorgian, V.; Muljadi, E.; Ela, E. Variable-speed wind power plant operating with reserve power capability. In Proceedings of the 2013 IEEE Energy Conversion Congress and Exposition, Denver, CO, USA, 15–19 September 2013; pp. 3305–3310. [Google Scholar]
- Margaris, I.D.; Papathanassiou, S.A.; Hatziargyriou, N.D.; Hansen, A.D.; Sorensen, P. Frequency Control in Autonomous Power Systems with High Wind Power Penetration. IEEE Trans. Sustain. Energy 2012, 3, 189–199. [Google Scholar] [CrossRef]
- Vidyanandan, K.V.; Senroy, N. Primary Frequency Regulation by Deloaded Wind Turbines Using Variable Droop. IEEE Trans. Power Syst. 2013, 28, 837–846. [Google Scholar] [CrossRef]
- Pradhan, C.; Bhende, C. Enhancement in Primary Frequency Contribution using Dynamic Deloading of Wind Turbines. IFAC-PapersOnLine 2015, 48, 13–18. [Google Scholar] [CrossRef]
- El Mokadem, M.; Courtecuisse, V.; Saudemont, C.; Robyns, B.; Deuse, J. Experimental study of variable speed wind generator contribution to primary frequency control. Renew. Energy 2009, 34, 833–844. [Google Scholar] [CrossRef]
- Singarao, V.Y.; Rao, V.S. Frequency responsive services by wind generation resources in United States. Renew. Sustain. Energy Rev. 2016, 55, 1097–1108. [Google Scholar] [CrossRef]
- Moutis, P.; Papathanassiou, S.A.; Hatziargyriou, N.D. Improved load-frequency control contribution of variable speed variable pitch wind generators. Renew. Energy 2012, 48, 514–523. [Google Scholar] [CrossRef]
- Zhang, Z.-S.; Sun, Y.-Z.; Lin, J.; Li, G.-J. Coordinated frequency regulation by doubly fed induction generator-based wind power plants. IET Renew. Power Gener. 2012, 6, 38. [Google Scholar] [CrossRef]
- Wu, Z.; Gao, W.; Wang, J.; Gu, S. A coordinated primary frequency regulation from Permanent Magnet Synchronous Wind Turbine Generation. In Proceedings of the 2012 IEEE Power Electronics and Machines in Wind Applications, Denver, CO, USA, 16–18 July 2012; pp. 1–6. [Google Scholar]
- Žertek, A.; Member, S.; Verbi, G.; Member, S.; Pantoš, M. A Novel Strategy for Variable-Speed Wind Turbines ’ Participation in Primary Frequency Control. IEEE Trans. Sustain. Energy 2012, 3, 791–799. [Google Scholar] [CrossRef]
- Erlich, I.; Wilch, M. Primary frequency control by wind turbines. In Proceedings of the IEEE PES General Meeting, Providence, RI, USA, 25–29 July 2010; pp. 1–8. [Google Scholar]
- Camblong, H.; Nourdine, S.; Vechiu, I.; Tapia, G. Control of wind turbines for fatigue loads reduction and contribution to the grid primary frequency regulation. Energy 2012, 48, 284–291. [Google Scholar] [CrossRef]
- Camblong, H.; Vechiu, I.; Etxeberria, A.; Martinez, M.I. Wind turbine mechanical stresses reduction and contribution to frequency regulation. Control Eng. Pract. 2014, 30, 140–149. [Google Scholar] [CrossRef]
- Diaz-Gonzalez, F.; Hau, M.; Sumper, A.; Gomis-Bellmunt, O. Coordinated operation of wind turbines and flywheel storage for primary frequency control support. Int. J. Electr. Power Energy Syst. 2015, 68, 313–326. [Google Scholar] [CrossRef] [Green Version]
- Miao, L.; Wen, J.; Xie, H.; Yue, C.; Lee, W.-J. Coordinated Control Strategy of Wind Turbine Generator and Energy Storage Equipment for Frequency Support. IEEE Trans. Ind. Appl. 2015, 51, 2732–2742. [Google Scholar] [CrossRef]
- Van de Vyver, J.; de Kooning, J.D.M.; Meersman, B.; Vandoorn, T.L.; Vandevelde, L. Optimization of constant power control of wind turbines to provide power reserves. In Proceedings of the 2013 48th International Universities’ Power Engineering Conference (UPEC), Dublin, Ireland, 2–5 September 2013. [Google Scholar]
- Fleming, P.A.; Aho, J.; Buckspan, A.; Ela, E.; Zhang, Y.; Gevorgian, V.; Scholbrock, A.; Pao, L.; Damiani, R. Effects of power reserve control on wind turbine structural loading. Wind Energy 2016, 19, 453–469. [Google Scholar] [CrossRef]
- Lubosny, Z. Wind Turbine Operation in Electric Power Systems; Springer: New York, NY, USA, 2003. [Google Scholar]
- Krishnan, R. DC Motor Drives Permanent Magnet Synchronous and Brushless DC Motor Drives; Taylor & Francis Group: Thames, UK, 2010. [Google Scholar]
- Bubshait, A.S.; Simões, M.G.; Mortezaei, A.; Busarello, T.D.C. Power quality achievement using grid connected converter of wind turbine system. In Proceedings of the 2015 IEEE Industry Applications Society Annual Meeting, Addison, TX, USA, 18–22 October 2015; pp. 1–8. [Google Scholar]
- Heier, S. Grid Integration of Wind Energy Conversion Systems; John Wiley & Sons, Ltd.: Hoboken, NJ, USA, 1998. [Google Scholar]
- Dunne, F.; Simley, E.; Pao, L.Y. LIDAR Wind Speed Measurement Analysis and Feed-Forward Blade Pitch Control for Load Mitigation in Wind Turbines; National Renewable Energy Lab. (NREL): Golden, CO, USA, 2011.
- Lei, M.; Shiyan, L.; Chuanwen, J.; Hongling, L.; Yan, Z. A review on the forecasting of wind speed and generated power. Renew. Sustain. Energy Rev. 2009, 13, 915–920. [Google Scholar] [CrossRef]
- Senjyu, T.; Sakamoto, R.; Kinjo, T.; Urasaki, N.; Funabashi, T.; Fujita, H.; Sekine, H. Output power leveling of wind turbine generator by pitch angle control using adaptive control method. IEEE Trans. Energy Convers. 2006, 21, 467–475. [Google Scholar] [CrossRef]
Figure 1.
Power curve and output power versus rotor speed and pitch angle.

Figure 2.
Demonstrating all possible operating points.

Figure 3.
Proposed de-loading approach.

Figure 4.
Wind turbine system with a control loop, including the proposed de-loading method.

Figure 5.
Wind profile (long-term simulation).

Figure 6.
Mechanical power for the maximum power point tracking (MPPT) and de-loaded scenarios.

Figure 7.
Rotor speed of a wind turbine (WT).

Figure 8.
Stator current ().

Figure 9.
Pitch angle ().

Figure 10.
The pitch angle with a wind forecast and without a wind forecast.

Figure 11.
Wind profile (short-term simulation).

Figure 12.
Mechanical power for the MPPT and de-loaded scenarios (short-term simulation).

Figure 13.
Rotor speed (short-term simulation).

Figure 14.
Stator current, (short-term simulation).

Figure 15.
Pitch angle (short-term simulation).

Figure 16.
Hardware-in-the-loop implementation.

Figure 17.
Wind profile (hardware-in-the-loop).

Figure 18.
Three-phase machine current.

Figure 19.
Rotor speed and q-axis current ( gain is 2000): (a) maximum power, (b) de-loading using proposed method, and (c) de-loading by controlling rotor speed only.
Figure 19.
Rotor speed and q-axis current ( gain is 2000): (a) maximum power, (b) de-loading using proposed method, and (c) de-loading by controlling rotor speed only.

Figure 20.
Active power (gain is 1 × 10⁶) and pitch angle (gain is 2): (a) maximum power, (b) de-loading using proposed method, and (c) de-loading by controlling rotor speed only.
Figure 20.
Active power (gain is 1 × 10⁶) and pitch angle (gain is 2): (a) maximum power, (b) de-loading using proposed method, and (c) de-loading by controlling rotor speed only.


Table 1.
Wind turbine and permanent magnet synchronous generator (PMSG) Parameters.
| Wind Turbine | Values |
|---|---|
| Nominal wind speed | 12 m/s |
| Nominal output power | 2.0 MW |
| Air density | 1.225 kg/m3 |
| Wind turbine radius | 35.5 m |
| Nominal rotor speed | 25.88 rpm |
| Stator resistance of PMSG | 0.821 mΩ |
| Armature inductance of PMSG | 1.5731 mH |
| Flux linkage of PMSG | 7.8264 V.s |
| Machine side switching frequency, | 1.5 kHz |
| DC link voltage reference, | 1450 V |
Table 2.
Power losses for different scenarios.
| Losses | MPPT | Controlling Only | Proposed Approach |
|---|---|---|---|
| Resistive losses (kW) | 12.577 | 13.238 | 7.063 |
| Conduction losses (kW) | 12.77 | 12.87 | 8.13 |
© 2018 by the authors. Licensee MDPI, Basel, Switzerland. This article is an open access article distributed under the terms and conditions of the Creative Commons Attribution (CC BY) license (http://creativecommons.org/licenses/by/4.0/).
Share and Cite
MDPI and ACS Style
Bubshait, A.; G. Simões, M. Optimal Power Reserve of a Wind Turbine System Participating in Primary Frequency Control. Appl. Sci. 2018, 8, 2022. https://doi.org/10.3390/app8112022
AMA Style
Bubshait A, G. Simões M. Optimal Power Reserve of a Wind Turbine System Participating in Primary Frequency Control. Applied Sciences. 2018; 8(11):2022. https://doi.org/10.3390/app8112022
Chicago/Turabian StyleBubshait, Abdullah, and Marcelo G. Simões. 2018. "Optimal Power Reserve of a Wind Turbine System Participating in Primary Frequency Control" Applied Sciences 8, no. 11: 2022. https://doi.org/10.3390/app8112022
Note that from the first issue of 2016, this journal uses article numbers instead of page numbers. See further details here.