Photo-Assisted Hydrogen Evolution with Reduced Graphene Oxide Catalyst on Silicon Nanowire Photocathode


1
Department of Materials Science & Engineering, Chonnam National University, Gwangju 61186, Korea
2
Advanced Nano-Surface Research Group, Korea Basic Science Institute, Daejeon 34133, Korea
*
Authors to whom correspondence should be addressed.
†
These authors contributed equally to this work.
Appl. Sci. 2018, 8(11), 2046; https://doi.org/10.3390/app8112046
Submission received: 17 September 2018
/
Revised: 22 October 2018
/
Accepted: 22 October 2018
/
Published: 25 October 2018
(This article belongs to the Special Issue Nanomaterials for Solar Water Splitting)
Abstract
:Featured Application
Photoelectrochemical Cell System with Efficient and Durable Hydrogen Production.
Abstract
The silicon-based photoelectrochemical (PEC) conversion system has recently gained attention owing to its ability to provide cost-efficient and superior photoresponsive behavior with respect to other semiconductor photoelectrodes. Carbon-based co-catalysts have always been the focus of research as alternative metal-free electrocatalysts intended for hydrogen evolution reaction (HER). In particular, reduced graphene oxide (rGO), a representative carbon-derived material, has attracted much attention as a non-metal catalyst for efficient and durable HER. Herein, we deposited rGO on a silicon nanowire (SiNW) structure, which showed the highest reduction in the overpotential for HER up to date. This can be attributed to the synergistic effects of rGO and SiNW with unique anisotropic morphology, facile tuning capabilities, and scalable fabrication methods. Combined with nanostructured photocathode, rGO-deposited SiNW showed better photon to current conversion efficiency of 3.16% (half solar-to-hydrogen conversion efficiency), which is 158 times higher than that of the bare planar Si system. In light of this development, we believe that rGO-SiNW photoelectrodes will pave the way for state-of-the-art highly efficient non-metal catalysts for energy conversion technologies.

1. Introduction
The precipitous rise in worldwide energy consumption has shifted the focus of research towards finding environment-friendly energy sources [1]. The exploration of alternatives for sustainable energy production is progressing—photoelectrochemical (PEC) splitting of water is one such alternative, as it is considered a primary clean source of energy [2,3]. Hydrogen production by water splitting is crucial as a clean energy source because water splitting has zero contribution to CO2 generation [4]. Being an earth-abundant material, silicon (Si) has also gained massive attention in the area of photon-assisted light harvesting, owing to its narrow band gap, which allows the absorption of solar radiation ranging from the ultraviolet region to the visible light region [5]. At the same time, one-dimensional nanostructures demonstrate promising applications in the area of photovoltaics, owing to their remarkable high optical absorption compared with bulk and zero-dimensional materials [6,7,8,9].
However, using a silicon electrode is highly challenging due to the high overpotential required for the generation of hydrogen. Thus, developing highly efficient electrodes, which can overcome the drawbacks posed by silicon, is crucial. Various approaches, such as surface modifications considering the cost and natural abundance of the electrocatalyst, have been explored to improve the PEC response of one-dimensional silicon nanostructures, especially that of silicon nanowires (SiNWs). Owing to their narrow band structure, silicon-based photoelectrodes are employed as both photocathode and photoanode for water splitting reactions [8,10,11]. A fundamental problem observed with a low-band gap Si as a photocathode for H2 generation is that the difference between the Si valence band edge and the H+/H2 redox level is rather narrow, which limits the generated photovoltage [12,13].
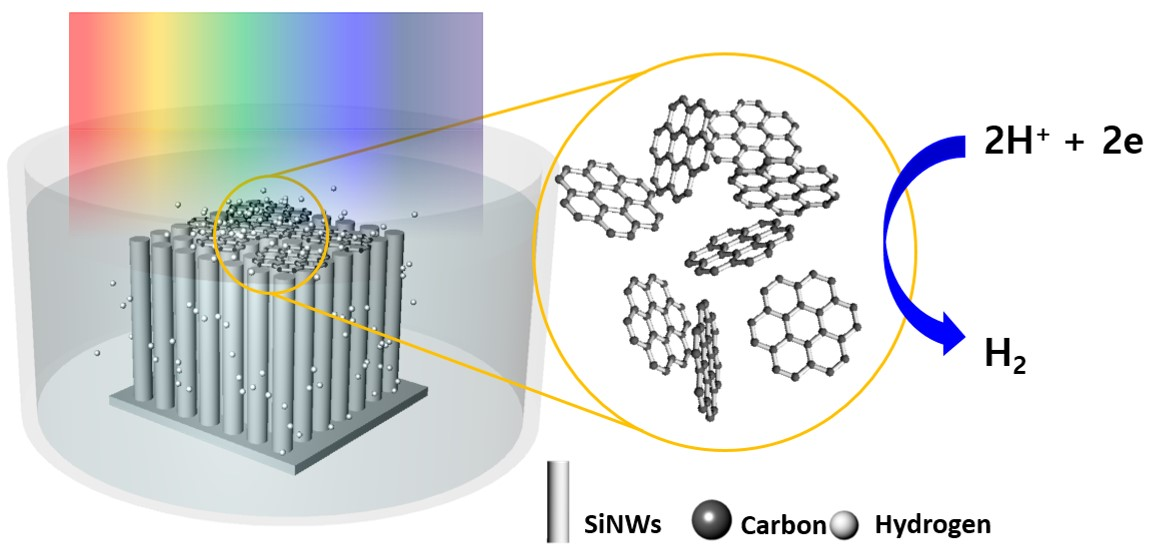
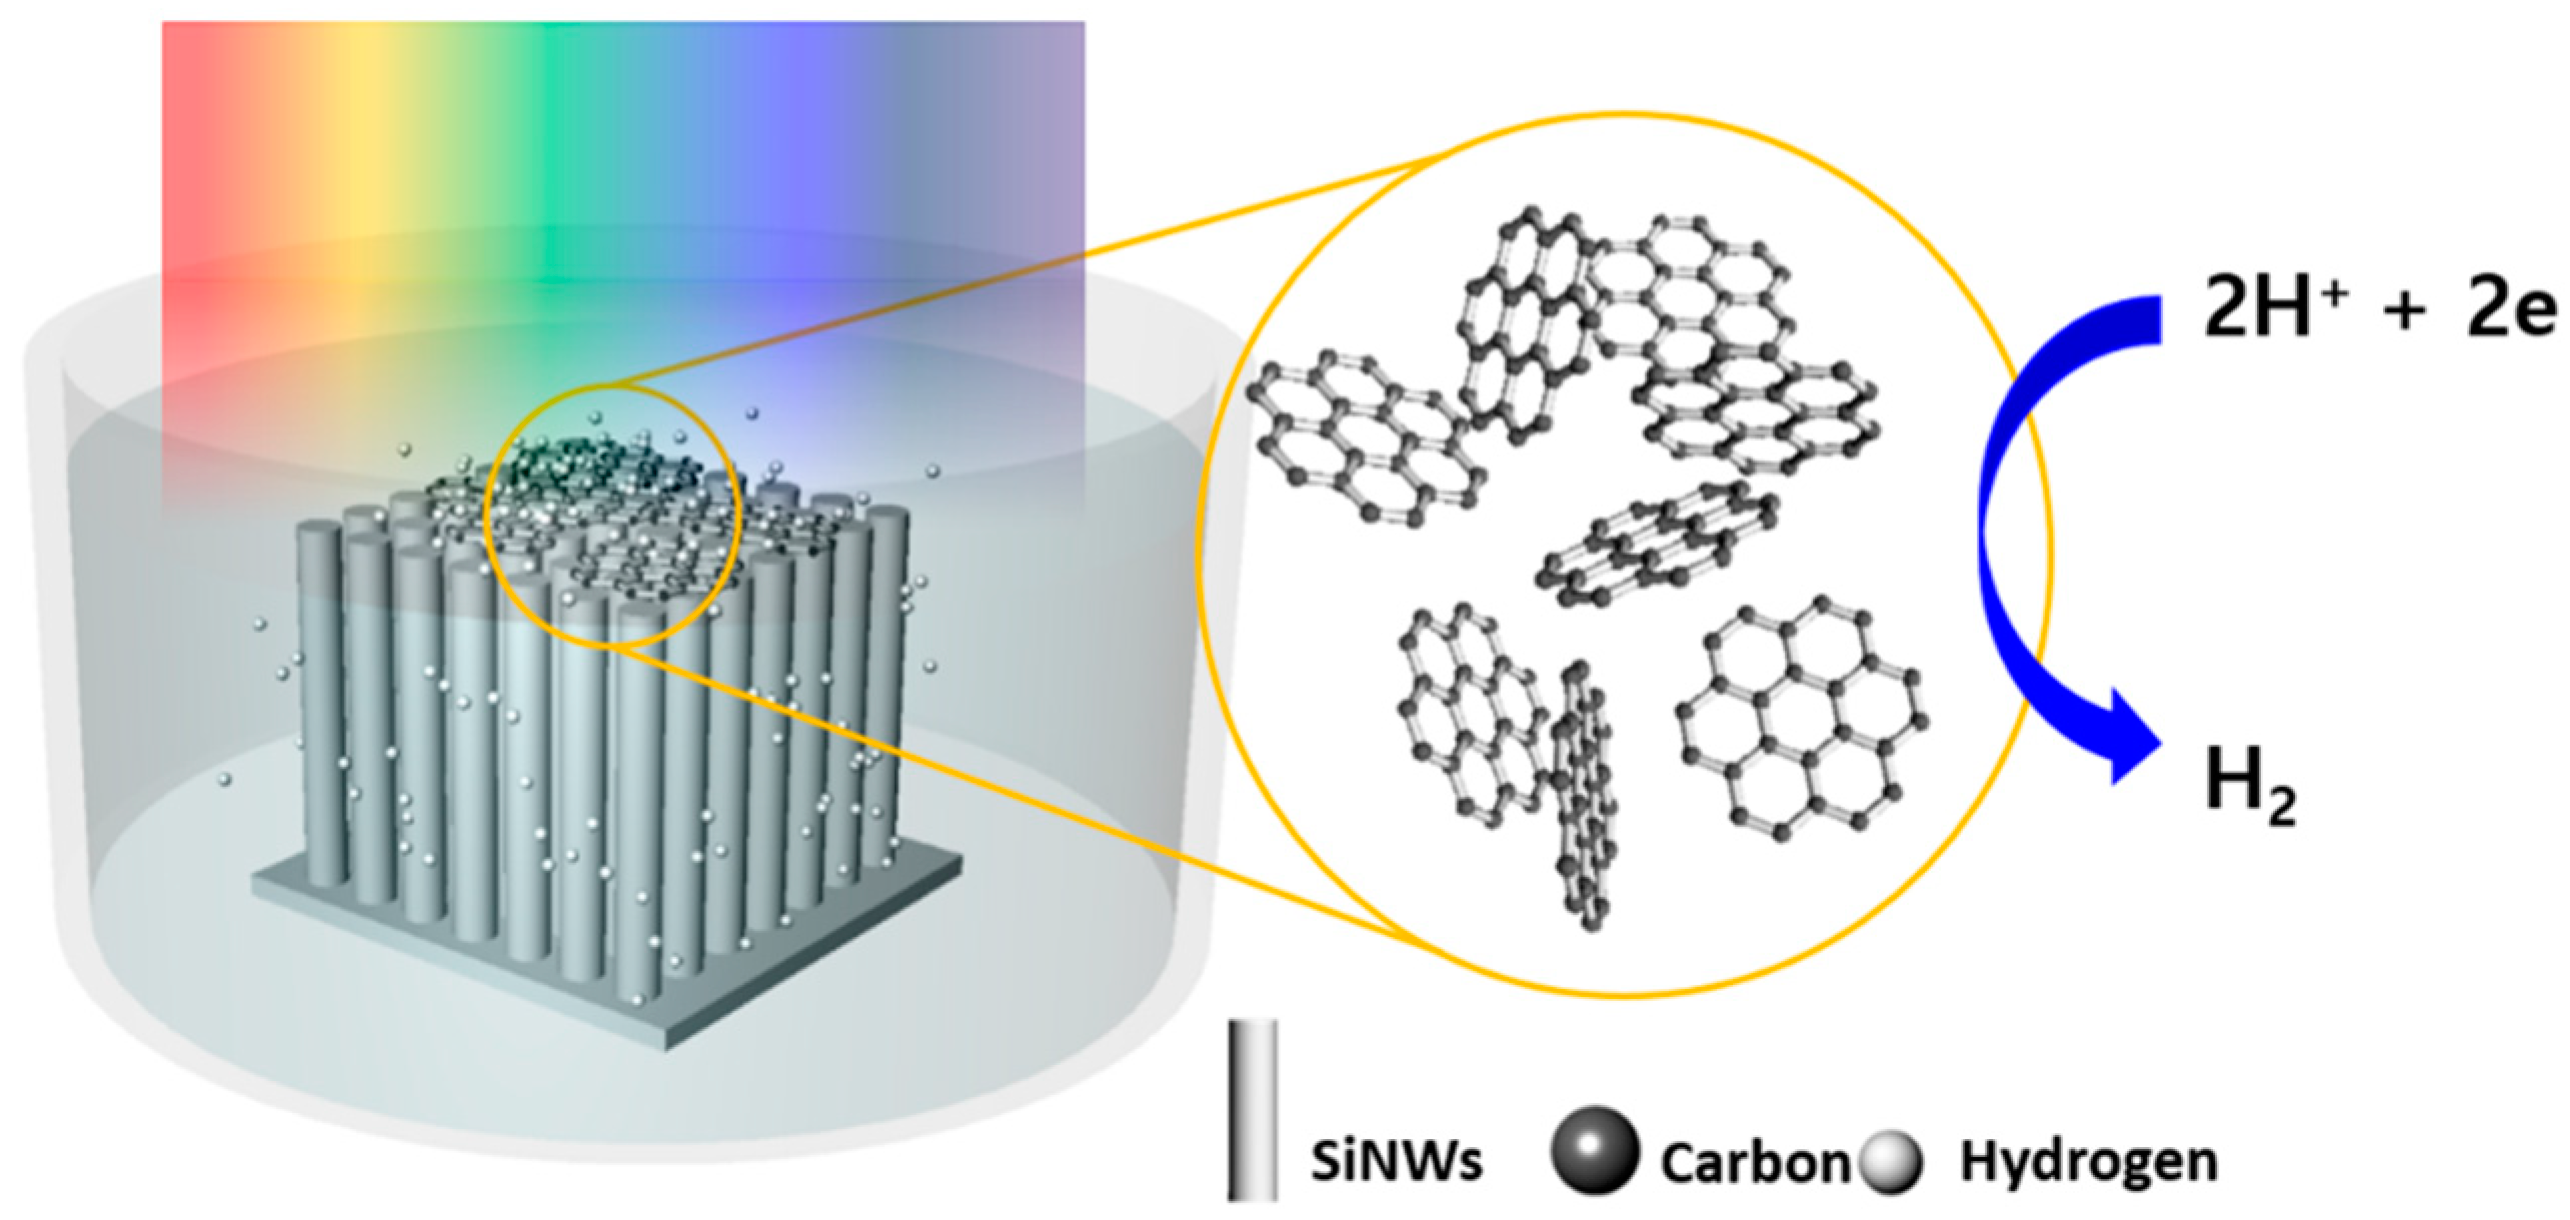
As an emerging class of two-dimensional material, graphene has attracted significant attention in numerous applications owing to its stability, higher surface area, better optical transparency, and high carrier mobility. Reduced graphene oxide (rGO), which is a carbon-based material, is often used for these applications, owing to its exceptional PEC water splitting capability and fast-interfacial charge transfer between the electrode surface and the electrolyte [14,15,16]. Considering these advantages, we used rGO as a co-catalyst for PEC water splitting reactions. Scheme 1 illustrates the functionalization of rGO on SiNW photocathode.
Herein, we report a simple, but convenient fabrication of an rGO-SiNW composite to enhance the PEC response to a hydrogen evolution reaction (HER). In order to minimize the recombination rate on the electrode surface and thus increase efficiency, we employed a SiNW structure, which contributes to higher light absorption and charge carrier collection [17,18]. The PEC performance could be further controlled by transforming the plane surface of the Si electrode to the shape of a wire. Moreover, in addition to its unique optoelectronic properties, the high surface-to-volume ratio can be advantageous for various applications. This distinctive surface property also enables the reduction of light being reflected from the surface of a planar silicon electrode. Another important factor enhancing the efficiency is the length of the Si nanowire [19,20,21]; thus, we used a 22 μm long Silicon nanowire. We also conducted studies for optimization of photoelectrode through surface treatment for a better PEC response towards HER. The cyclic voltammetry studies and the transient photo response for the Si electrode yielded large onset potential value and displayed a strong band bending for enhanced HER [18]. Considering the excellent optical absorption capability of the rGO-SiNW composite and the innumerous possibilities of chemically modifying graphene and the fabrication method followed here, we believe it is a step forward in discovering and employing new materials and synthesis approaches towards photoelectrochemical hydrogen production.
2. Materials and Methods
2.1. Synthesis of Graphene Oxide
Graphene oxide (GO) was synthesized via Hummer’s method. A mixture consisting of 5 g graphite powder and 3.8 g of NaNO3 was added into a flask, which was cooled in an ice bath. Then, 170 mL of concentrated H2SO4 was added to the flask under magnetic stirring. An oxidizing agent (KMnO4), 22.5 g was added gradually into the flask over a period of 1 h, following which it was maintained for 2 h with continuous stirring. The ice bath was removed, and the flask filled with this mixture was vigorously stirred. After 5 days, the color of graphite changed to a brown-colored viscous slurry. Subsequently, 300 mL of aqueous de-ionized water was added into the flask and stirred over 1 h. Later, 5 mL of 30 wt.% H2O2 was added into the mixture and continuously stirred for 2 days. Finally, the mixture was rinsed several times with de-ionized water using a centrifuge at 6000 rpm and dialyzed for 7 days. Graphene oxide powder was obtained by a rotary vacuum evaporator system. Graphene oxide powder was placed in the center of the petri dish with tissue wetted by 2 mL of hydrazine, and heated up to 80 °C for 20 min. The brown-color GO then formed reduced graphene oxide (rGO).
2.2. Fabrication of Silicon Nanowire Structure
A boron-doped p-type single crystalline Si wafer was purchased from Namkang (with a thickness of 500 μm, diameter 4 inch, resistivity of 10–15 Ωcm, (100) orientation). AgNO3 powder with a purity of 99.5% and 48–51 wt.% hydrogen fluoride (HF) were purchased from Sigma Aldrich, while a 70 wt.% concentrated nitric acid solution was purchased from Daejung Chemical (Seoul, Korea, 2018). Silicon wafers were cut to pieces with dimensions of 8 × 8 mm2 and cleaned with acetone, 2-propanol, and deionized water for 10 min each using a bath sonicator. To etch and form the nanowire structure on the planar silicon surface, a 20 mL aqueous solution of AgNO3 (0.679 g, 0.02 M) and HF (5 M) were used. Finally, to remove impurities from Si surface, the Si nanostructure was carefully cleaned prior to photoelectrochemical cell measurement. Excess Ag remnants that could possibly contaminate the electrode surface during the electroless etching were completely washed by 70% nitric acid solution for two h to minimize Ag contaminants. No metal contamination (Ag residue) was confirmed by high-resolution energy-dispersive X-ray spectroscopy mapping.
2.3. Preparation of rGO-SiNW Photocathode
For ohmic contacts between the backside of the silicon wafer and the copper wire, a gallium indium eutectic alloy (Kojundo Chemical Inc., Tokyo, Japan, 2018) was used with silver paste. To protect and insulate the backside of the silicon wafer, epoxy (Loctite Hysol 9460) was used, except for the illumination area (0.25 cm2) of the front side of the silicon. rGO were transferred onto the SiNW surface via drop casting method followed by a drying process to evaporate the remaining aqueous solution. The loading amount of rGO was varied from 0.2 mg to 1 mg to find an optimized loading amount onto the Si surface.
2.4. Electrochemical Measurements
Electrochemical measurements were performed using a three-electrode cell (CHI 7008E, CH Instruments, Inc., Austin, TX, USA, 2018). A Pt wire and a graphite rod served as the counter electrode and Ag/AgCl electrode was used as the reference electrode. The reference electrode was carefully calibrated with respect to the reversible hydrogen electrode (RHE) in 1 M of aqueous perchloric acid solution with high purity hydrogen saturation at 25 °C. The RHE was calibrated as −0.201 V vs. the reference electrode. A 100 W xenon lamp was used as a light source for solar irradiation with a light intensity of 100 mW/cm2 (air mass 1.5 global (AM 1.5 G) condition glass filter). A rotating disk electrode (RDE, Pine Inc., Salisbury, NC, USA, 2018) measurement was performed using a glassy carbon (GC) tip (diameter of 5 mm) to evaluate electrocatalytic performance of rGO catalyst. The RDE measurement was carried out at a rotating speed of 1000 rpm with a scan rate of 10 mV/s.
3. Results and Discussion
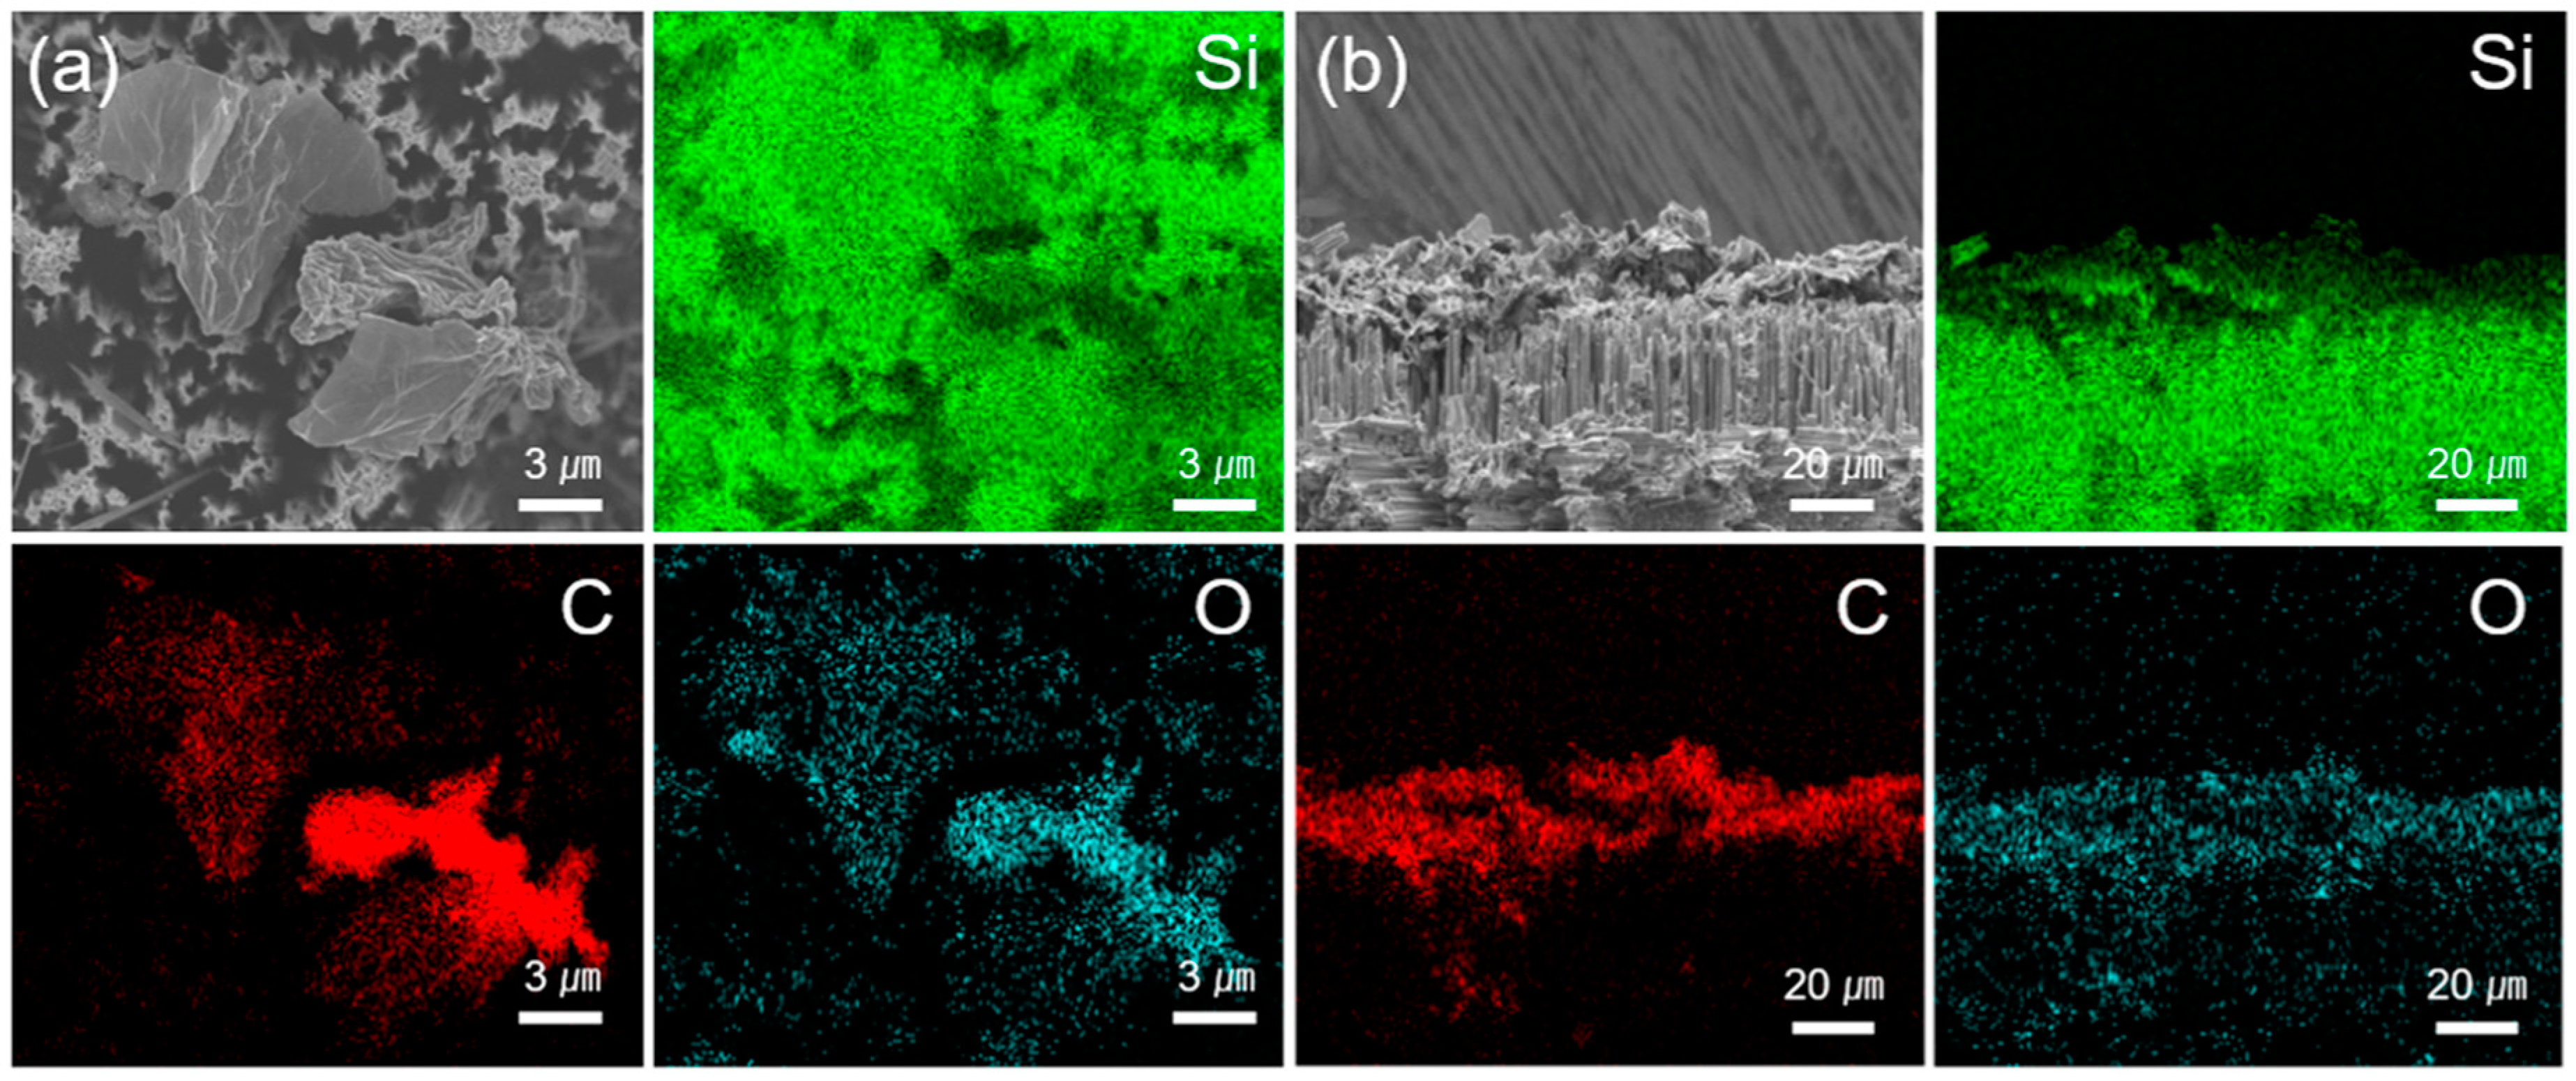
A silicon nanowire (SiNW) structure was fabricated by the metal-catalyzed electroless chemical etching method. The length of the nanowire was controlled by controlling the etching time. Figure 1 shows the Scanning Electron Microscope (SEM) images of SiNW photoelectrode deposited with reduced graphene oxide (rGO), and energy-dispersive X-ray spectroscopy (EDS) shows the presence of each element on the photoelectrode. The elements of silicon, oxygen and carbon make up the constituents of rGO, which was deposited uniformly on the SiNW photoelectrode through the EDS image. Cross-sectional SEM images also showed uniform coating of rGO on the SiNW with average length of 22 μm.
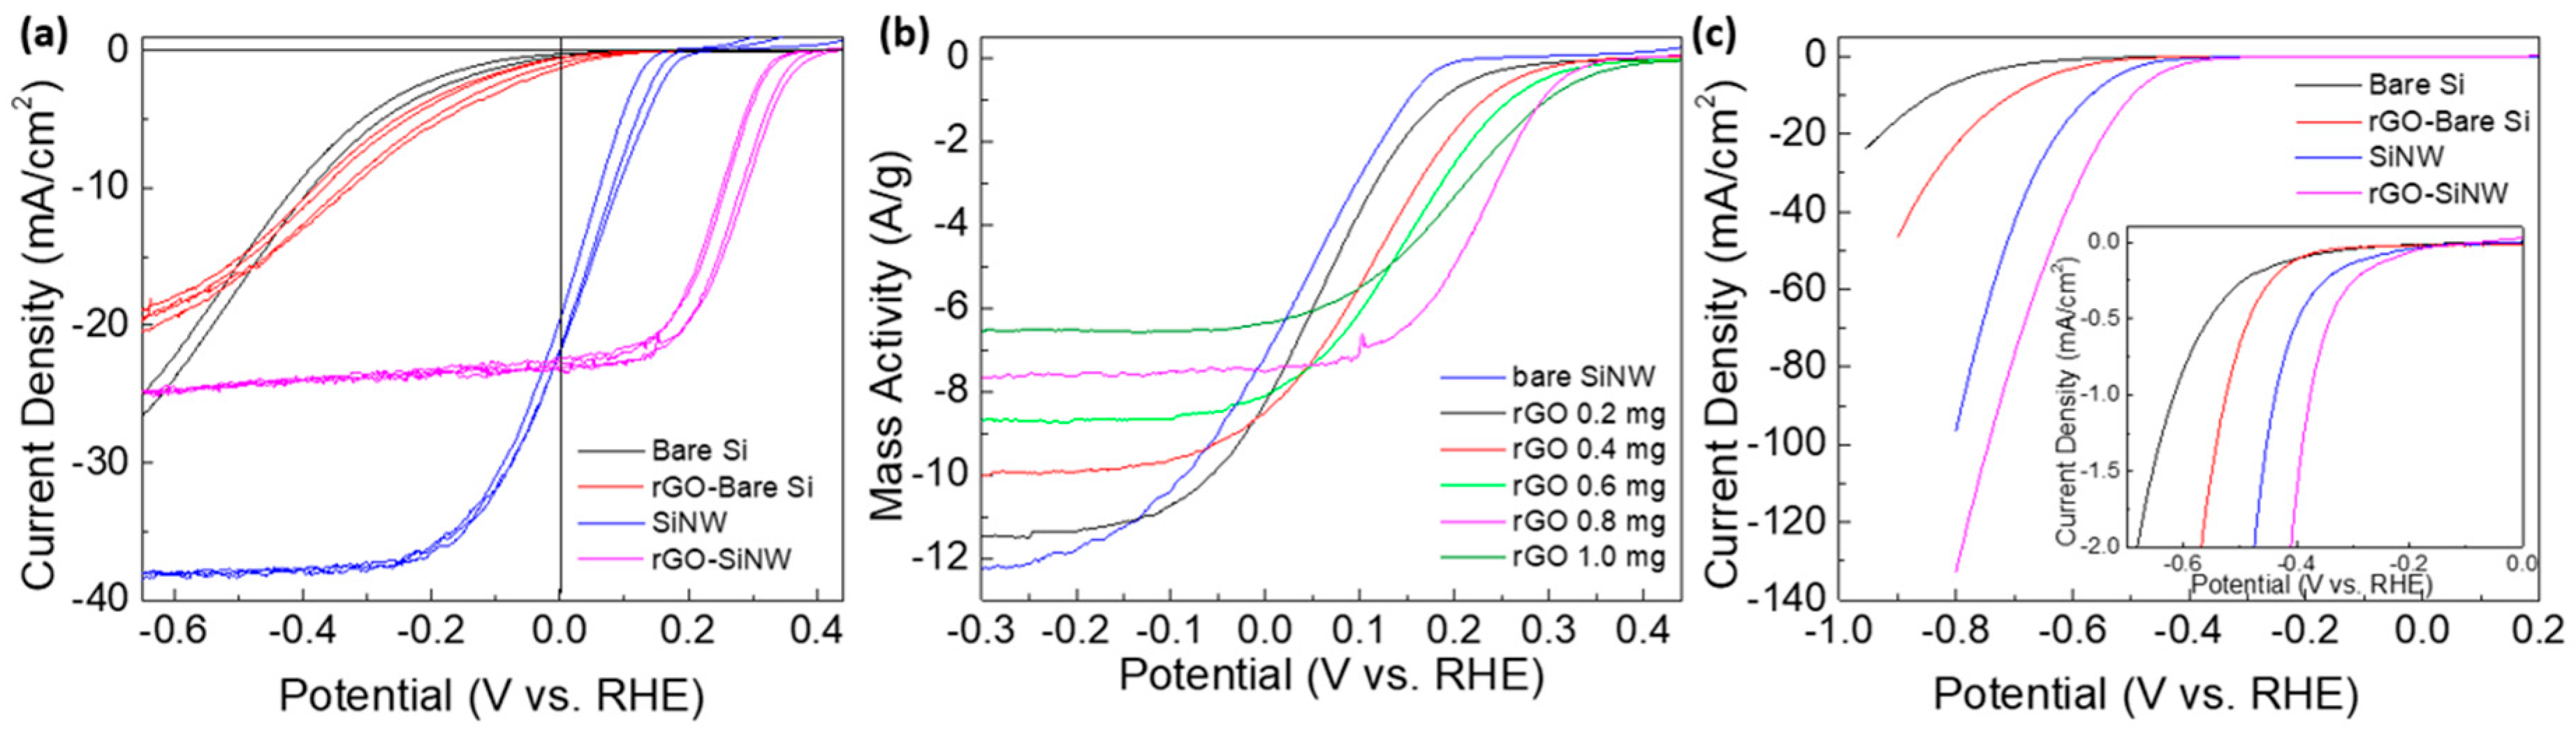
To provide more insights into the photocathodic efficiency of the SiNW photoelectrode, the inherent current density was measured in the potential window ranging from 0.4 V to −0.7 V vs. RHE using a three-electrode cell. In our measurement setup, a 300 W Xe lamp was used with a light intensity of 100 mW/cm2 and the light passed through an air mass 1.5 global filter, in 1 M of aqueous perchloric acid (HClO4) under acidic condition (pH = 0). In Figure 2, a voltammogram with a linear sweep under light illumination is presented, which shows the current density according to the specific applied potential. First, the reductive current density starts to increase from a specific point as the applied potential increased negatively. The current density saturates at a higher applied potential, which typically is described as limiting current density or saturation current density. The onset potential is better described as a potential at which a sharp increase in current density (−1 mA/cm2) is observed. The onset potential of SiNW electrode under illumination is 0.179 V vs. RHE, while bare planar silicon electrode only shows −0.106 V vs. RHE. (Figure 2 and Table 1). Saturation current density also increased when surface nanostructuring was implemented. The saturation current density of SiNW showed 38.2 mA/cm2, which is approximately 1.2 times higher than that of bare planar Si (32.8 mA/cm2). To calculate the solar-to-hydrogen conversion efficiency (STH), the concept of applied bias photon-to-current efficiency (ABPE) was introduced, according to the following equation [22,23]:
where jph is the photocurrent density obtained under the applied potential Vb, Vredox is the redox potential required for hydrogen production (0 V vs. RHE), Vbias is the applied external bias potential that is typically necessary to achieve reasonable photocurrents, and Plight is the intensity of the applied incident light under AM 1.5 G conditions (100 mW/cm2). Half STH can be defined as the STH in the 3-electrode cell system, which is also the maximized value of ABPE and can also be calculated using the following equation [23]:
where jsc is the current density at the reversible potential (the density at the 0 V vs. RHE), Voc is the potential at the zero-current density (the open circuit potential), and FF is the fill factor in the J-E curve in the 4-quadrant region. In principle, same photoelectrode materials, despite the difference in surface structures, show similar open circuit potential (Voc). Bare Si and SiNW showed an almost same value for Voc, indicative that no other metal residue participated during the photoelectrochemical measurements. Consequently, the SiNW electrode system exhibited 46 times higher half STH compared to bare planar Si electrode, which mainly contributes to the enhanced current density (Table 1). The enhanced current density, including limiting current density, is better explained by increased surface area by surface nanostructuring. The nanowire structure in turn increases the current density of the Si photocathode, thus increasing the number of effective reaction sites on the illuminated surface. Moreover, the reduced reflection also increases the possibility of enhanced incident light collection. It is well known that the bare planar Si reflects about 25% of the incident light [24]; however, the nanostructured surface decreases photon absorption significantly due to the its low reflectance. Thus, the SiNW structure electrode exhibits a higher light-trapping effect, which contributes to a higher photon-to-current conversion efficiency than that of bare planar Si electrode. Moreover, orthogonalization reduces the recombination rate between the electron-hole pair, generated at the photoelectrode. The nanowire structure has a relatively shorter horizontal length compared with its length in the vertical direction, and this structure enables the generated minority carrier (electrons) to move faster in the lateral direction of the electrode and to collide with a proton in the electrolyte to produce hydrogen. Consequently, the potential for the water splitting reaction approaches the theoretical value with a decreased kinetic barrier for hydrogen generation, resulting in the increased onset potential, as shown in Figure 2a. Under dark conditions, the onset potential for the bare planar Si electrode was −0.656 V vs. RHE and SiNW electrode exhibits −0.448 V vs. RHE. It is noteworthy to mention that the degree of onset potential shift from bare Si to SiNW in both light and dark conditions is almost the same (approximately 0.2 V vs. RHE). From the results, the photovoltage of bare Si and SiNW electrodes are 0.55 V vs. RHE and 0.62 V vs. RHE respectively, which indicate that with the nanowire structure, an increased photovoltage under both light and dark conditions and a decrease in the kinetic barrier for hydrogen production is observed. rGO catalyst further enhances the PEC property of the Si photocathode. Figure 2 shows the photoelectron-catalytic performance of rGO on SiNW toward HER. The onset potential of rGO deposited on the SiNW photocathode is 0.326 V vs. RHE, which is significantly higher than that of the bare SiNW photoelectrode (0.147 V vs. RHE). When the rGO co-catalyst was deposited on the Si photoelectrode, Voc slightly increased up to 0.04 V for rGO-bare planar Si and 0.08 V for rGO-SiNW, respectively. In the dark condition, the difference in the overpotential between rGO-SiNW and SiNW was 66 mV. The saturation current density of rGO-SiNW somewhat decreased (25 mA/cm2), compared to the bare SiNW, which is attributed to the light hindrance by opaque rGO. To further study the effect of loading amount on rGO, we varied the loading amount of rGO and found that 0.8 mg of rGO showed the best efficiency for photoelectrochemical response. (Figure 2b). It is also important to mention that as the loading amount of rGO increased, the saturation current density invariably decreased.
ABPE = [jph (mA/cm2) × (Vredox − Vb) (V)/Pin(mW/cm2)]AM1.5G × 100(%)
Half STH= [|jsc|(mA/cm2) × (Voc) (V) × FF/Pin (mW/cm2)]AM1.5G × 100(%)
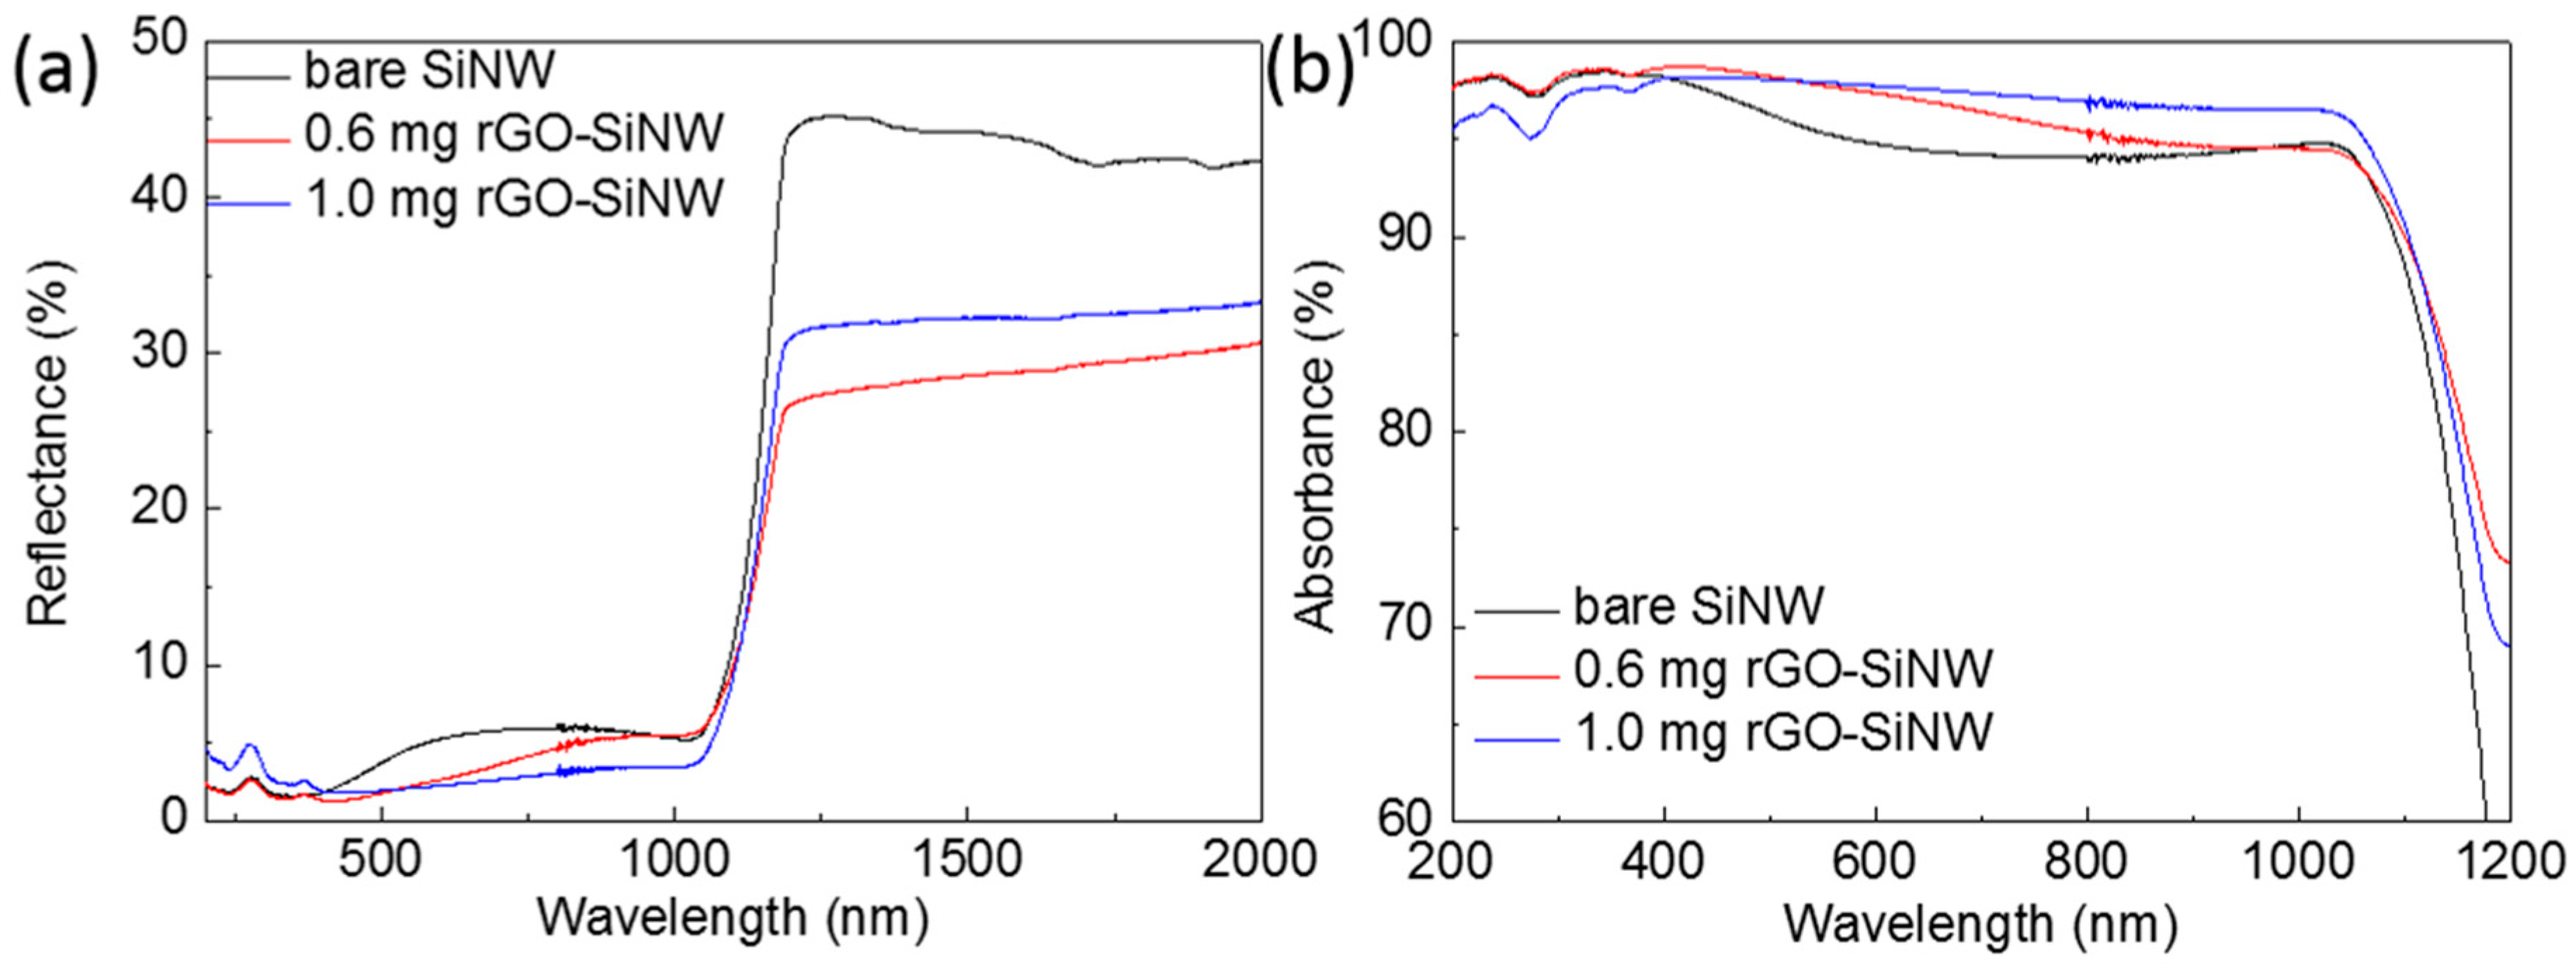
To gather more details on the optical reflection property of SiNW and rGO functionalized SiNW, we measured optical reflectance in the wavelength range of 200–2000 nm with SiNW as control. As displayed in Figure 3, when SiNW is fabricated on rGO-SiNW, the light reflectance is much lesser than compared to bare SiNW. The reflectance of rGO on SiNW and bare SiNW is almost 2% and 6% in the visible light region. This low reflectance can be attributed to the increased loading amount of rGO; thus, we believe that rGO absorbs a part of the incident light and reduces the absorption of light on the Si photoelectrode, which is followed by a decrease in current density with an increase in the loading amount of rGO. To clarify the absorption property, we also measured absorbance (Figure 3b) on applying the following equation [25]:
assuming that transmittance is almost zero in the visible region, since rGO-SiNW happens to be a non-transparent wafer type sample. Nevertheless, the catalytic activity of rGO co-catalyst highly increased to a positive onset potential; eventually, the overall solar-to-current conversion efficiency increased on the introduction of rGO co-catalyst. rGO-deposited SiNW showed better photon to current conversion efficiency of 3.16%, which is 3.47 times higher than that of bare SiNW (Table 1). As a result, rGO works as an effective HER co-catalyst on the Si electrode, owing to the synergistic effects between rGO and SiNW, and is solely responsible for the improved photocatalytic performance.
Absorbance (%) = 1 − Transmittance − Reflectance
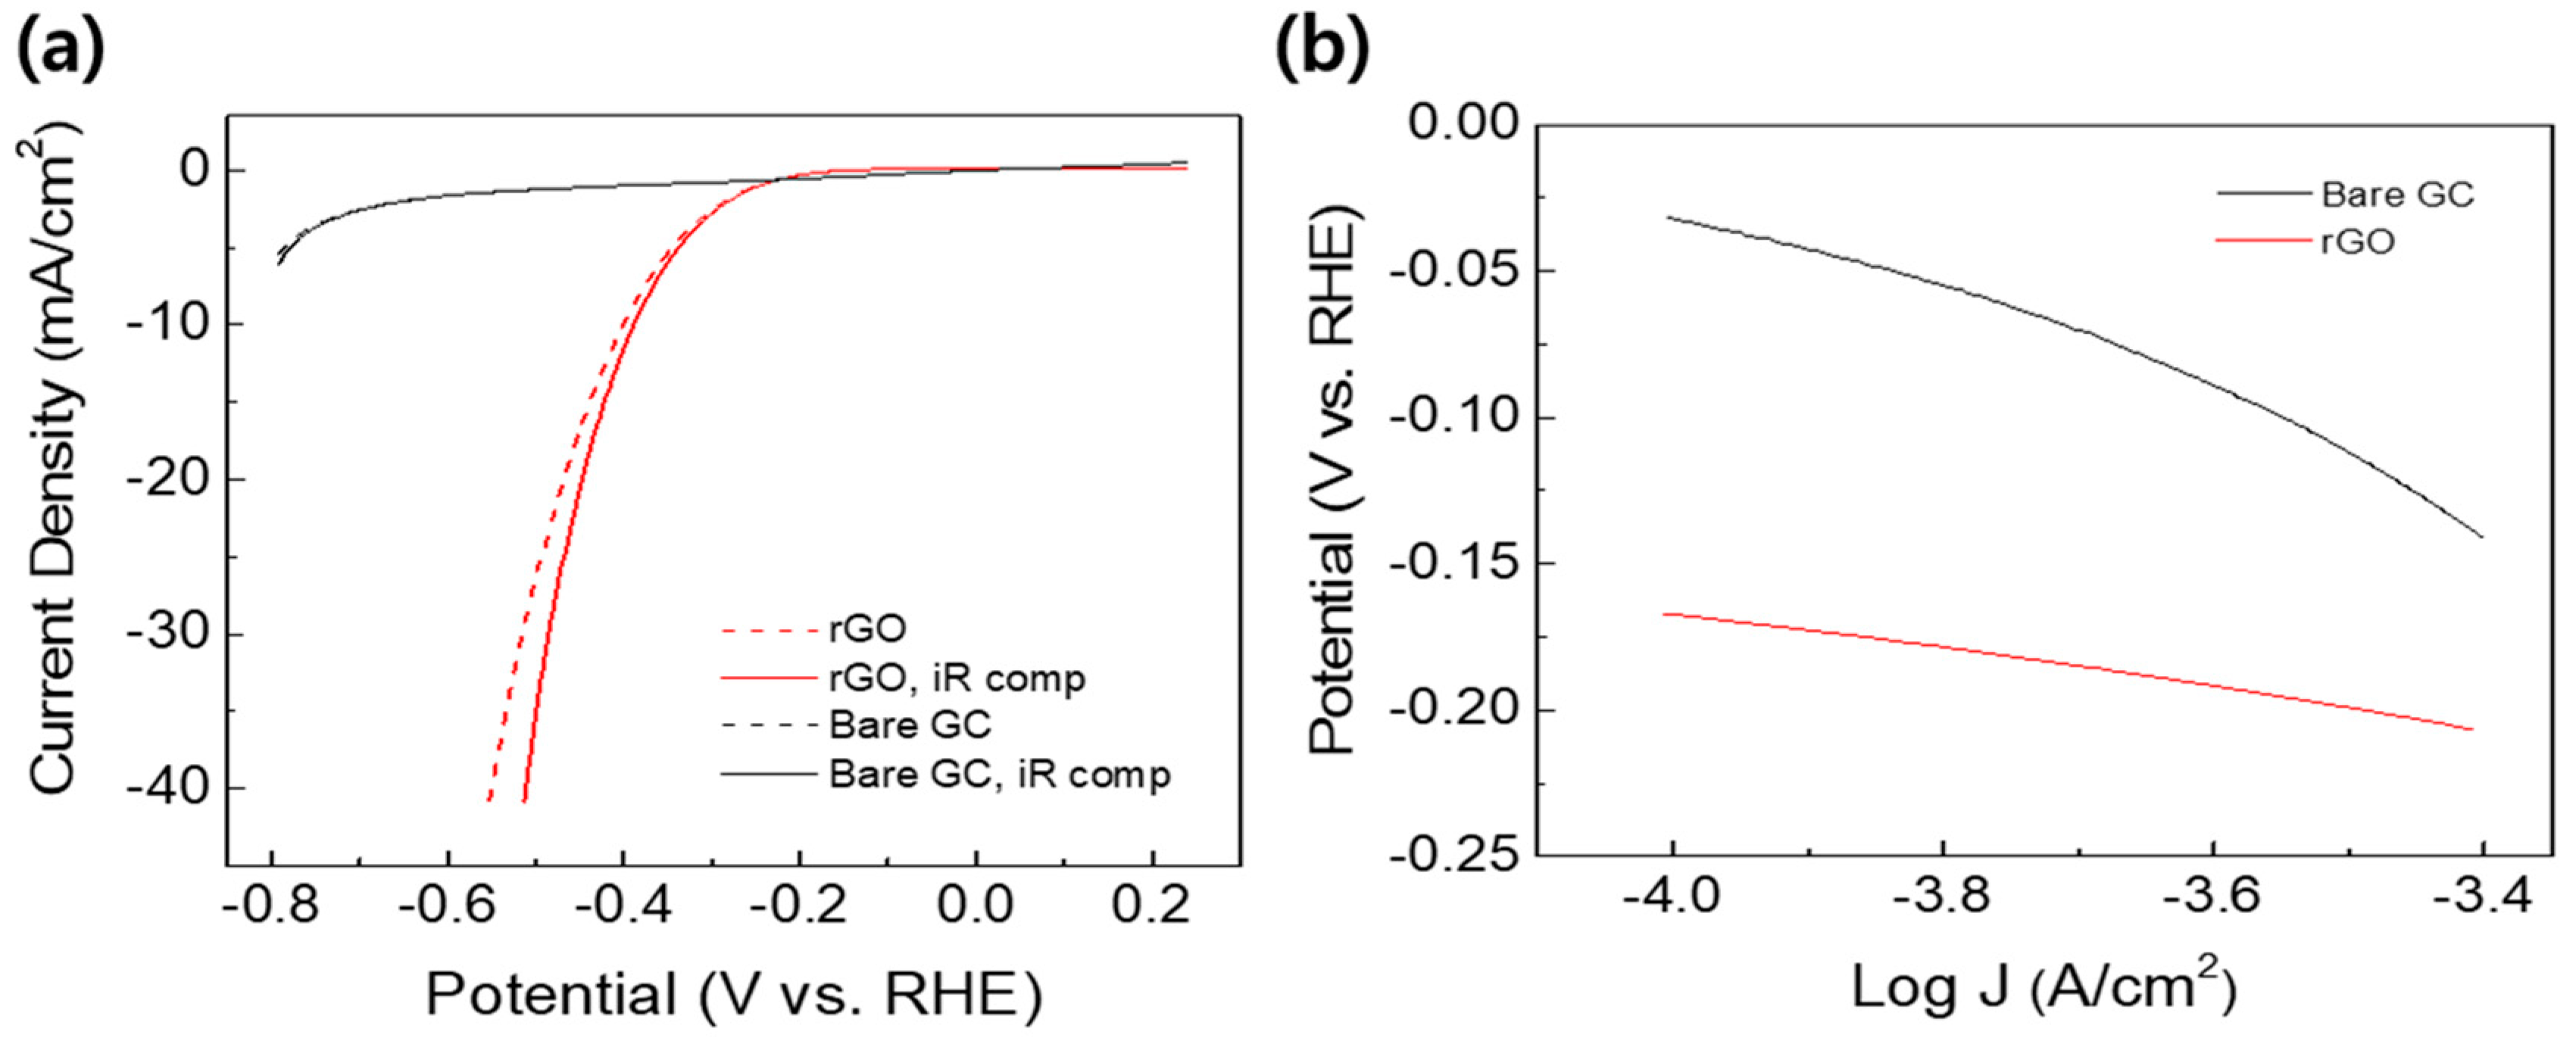
To provide a deeper understanding of the electrocatalytic activity of the rGO catalyst, capacitance studies were performed using a rotating disk electrode (RDE) system, as shown in Figure 4. A catalyst ink comprising rGO was drop-casted on to the glassy carbon (GC) tip. The significant rise in the current density at the same potential for rGO on GC compared to that of the bare GC can be attribute to the electrochemically active catalyst (rGO), which can further improve the water splitting efficiency towards HER. When considering the resistance between electrolyte and the electrode interface, it is necessary to consider internal resistance (iR) compensation. Following iR compensation, the onset potential of rGO decreased significantly. To study the catalytic effects of rGO, Tafel plots for rGO-SiNW were obtained, as shown in Figure 4b. The Tafel slope provides the appropriate pathways suitable for HER [26]:
H3O+ + e− → Hads + H2O Volmer reaction
Hads + H3O → H2 + H2O Heyrovsky reaction
Hads + Hads → H2 Tafel reaction
In the above process, Hads is the absorbed H, (4) is a discharge step (the Volmer reaction), (5) is the desorption of the H-atom (the Heyrovsky reaction), and (6) is the recombination step (the Tafel reaction). If the recombination of Hads is the rate determining step for the hydrogen evolution (the Tafel reaction), the measured Tafel slope was 30 mV per decade. In the Tafel reaction, the Hads coverage on the surface is almost 1 (θH = 1). If the electrochemical desorption step (the Heyrovsky reaction) can be regarded as the rate-determining step here, a Tafel slope of 40–118 mV per decade is measured, which is dependent on the value observed for θH (θH = 0 to 1). The Tafel slope of 45 mV. per decade in our work indicates that the kinetics of the HER on the rGO catalyst was found to follow the Heyrovsky reaction.
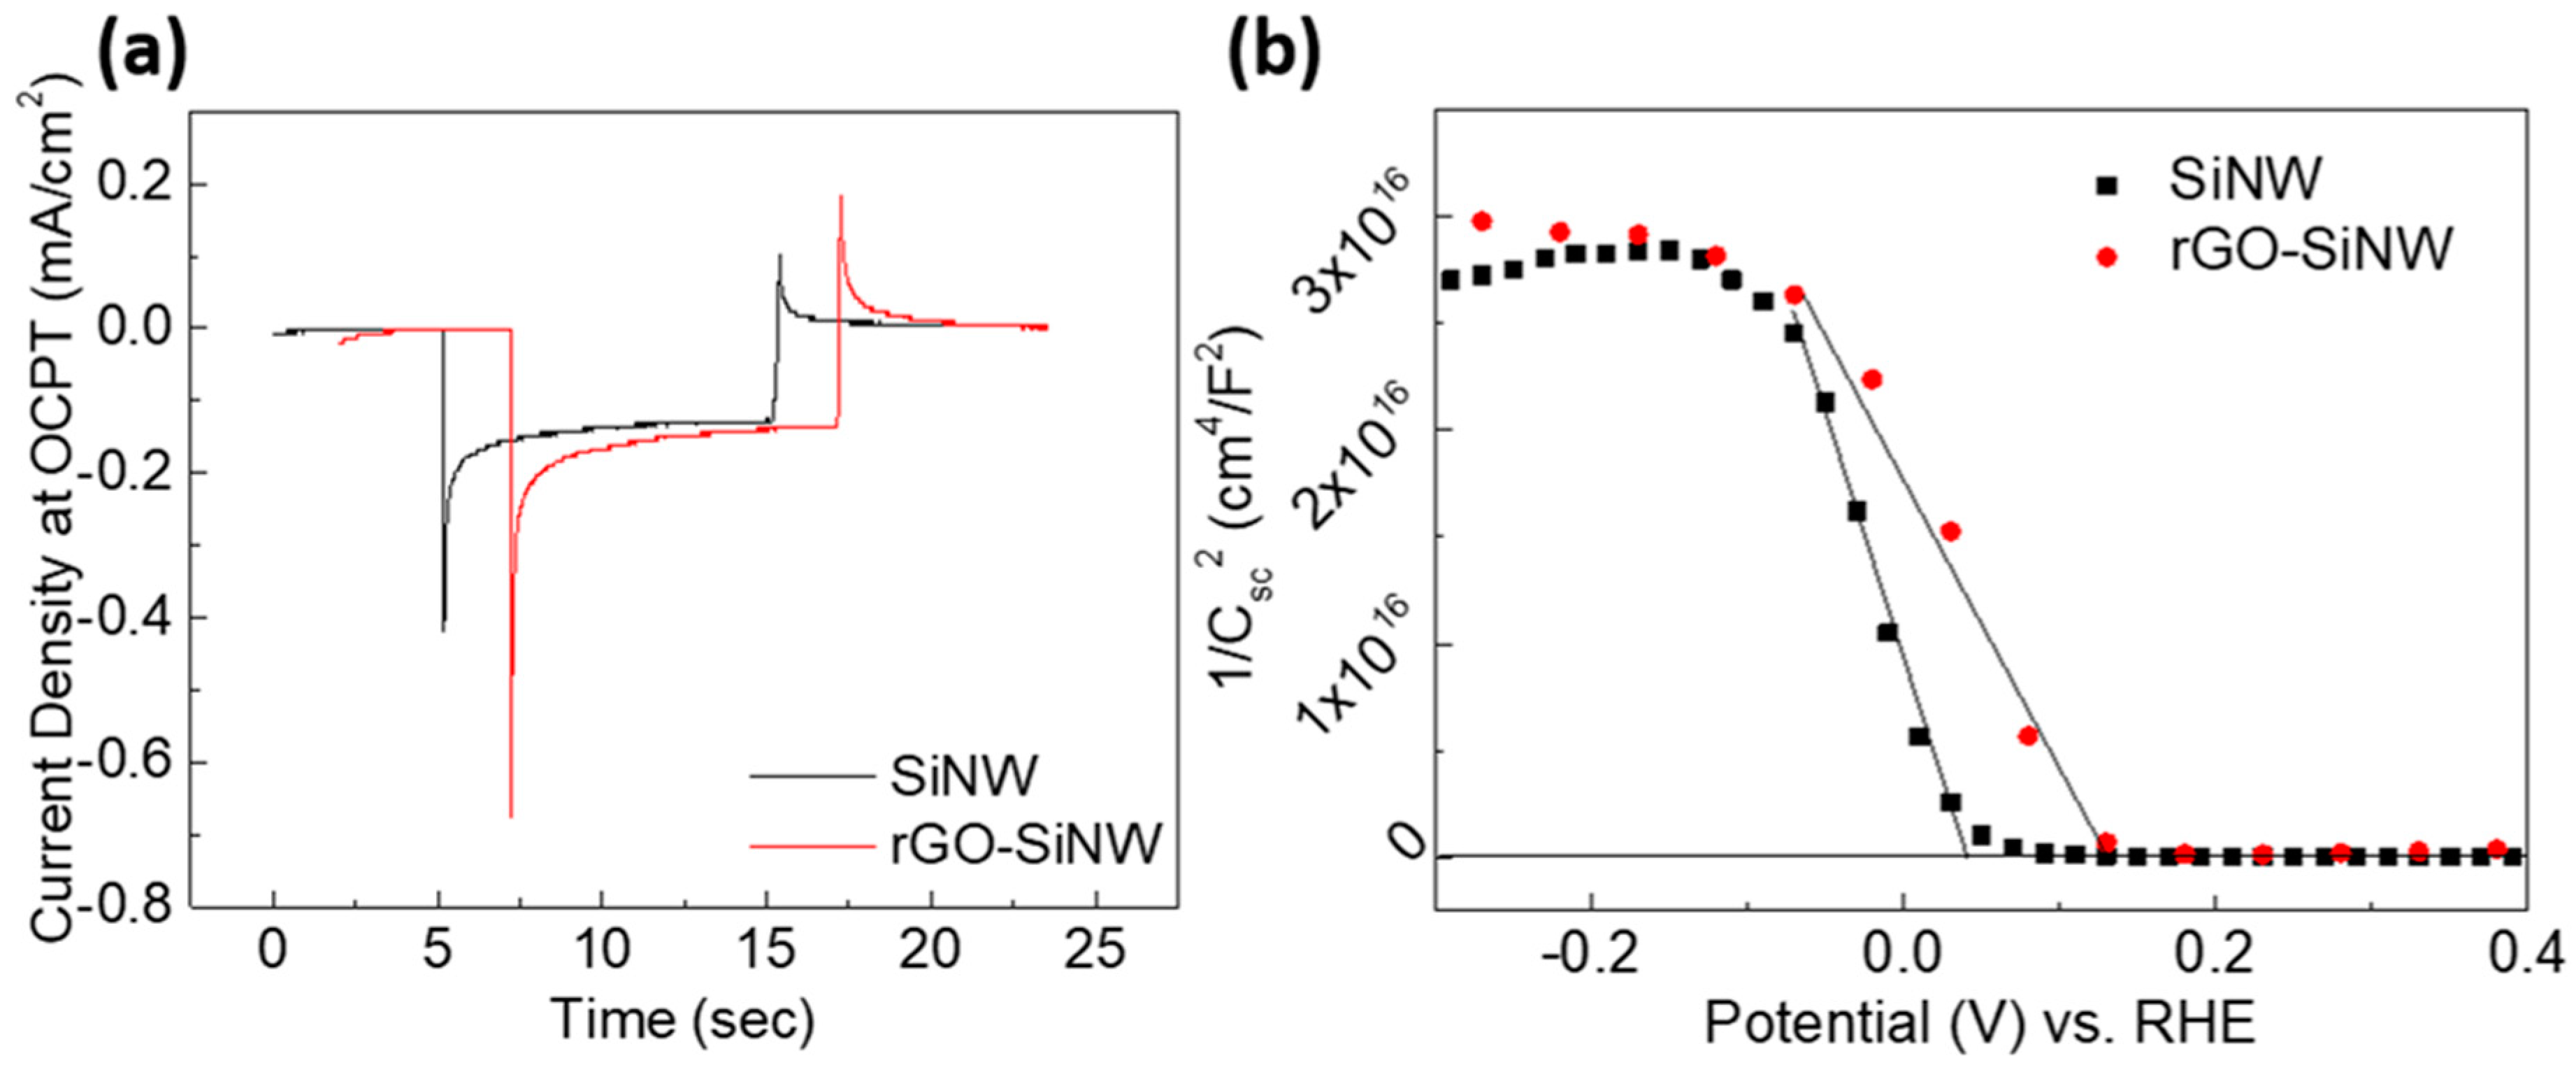
Comprehensive electrochemical measurements on the rGO-SiNW system also show the efficient roles of the rGO catalyst (as shown in Figure 5). The transient photoelectrochemical behavior of the rGO-SiNW is also dependent on limiting the illumination time range. Figure 5a shows the transient photoresponse of the rGO-SiNW and bare SiNW electrode. With a 10-s interval, the light was turned on and off, while the potential was maintained at open circuit potential (OCPT) vs RHE. As shown in Figure 5a, the initial rise in the photocurrent density (Jin) was 0.70 mA/cm2 for rGO-SiNW and 0.45 mA/cm2 for SiNW, respectively, caused by the abrupt turning on of the light source. After taking the peak, the current density saturated at a certain point called the saturated photocurrent density (Jst). Under illumination, the value of Jst was 0.19 mA/cm2 for the rGO-SiNW, which is higher than that of bare SiNW. This shows that fewer carriers were trapped and that less recombination occurred at the surface state of the electrode surface. Simultaneously, when the light was turned off, the current density showed a shift in the direction opposite to Jin, which was designated as Joff. The Joff values of the rGO-SiNW and SiNW electrodes were 0.18 mA/cm2 and 0.16 mA/cm2, respectively.
Capacitance measurements also showed that the rGO catalyst is much more effective for electrochemical hydrogen production. Potential sweep ranging from 0.4 V to −0.3 V vs. RHE under the dark condition, as shown in Figure 5b, and the flat band potential was calculated using the Mott-Schottky equation [27]:
where Csc is the capacitance in space charge region, E is the applied potential, Efb is the flat band potential that can be determined from the extrapolation to zero capacitance (Figure 5b), k is the Planck constant, T is the temperature, e is the electron charge, ε is the dielectric constant of the Si semiconductor (photoelectrode), ε0 is the permittivity of the free space, N is the hole acceptor concentration for the p-type Si semiconductor, calculated from the slope in the figure plot shown above. On the basis of these relations, rGO-SiNW exhibits an Efb of 0.128 V vs. RHE, which is 88 mV higher than the Efb for the bare SiNW. The higher Efb indicates that the band bending near the depletion of the semiconductor at the electrode/electrolyte interface is higher. Based on this equation, the magnitude of the band bending (Eb) is equals to E − Efb [28]. The band bending at the boundary between the electrode surface and electrolyte accelerates for rapid separation of charge carriers and increase in recombination of protons to generate hydrogen [29].
1/Css2 = 2(E − Efb − kT/e)/(eεε0N)
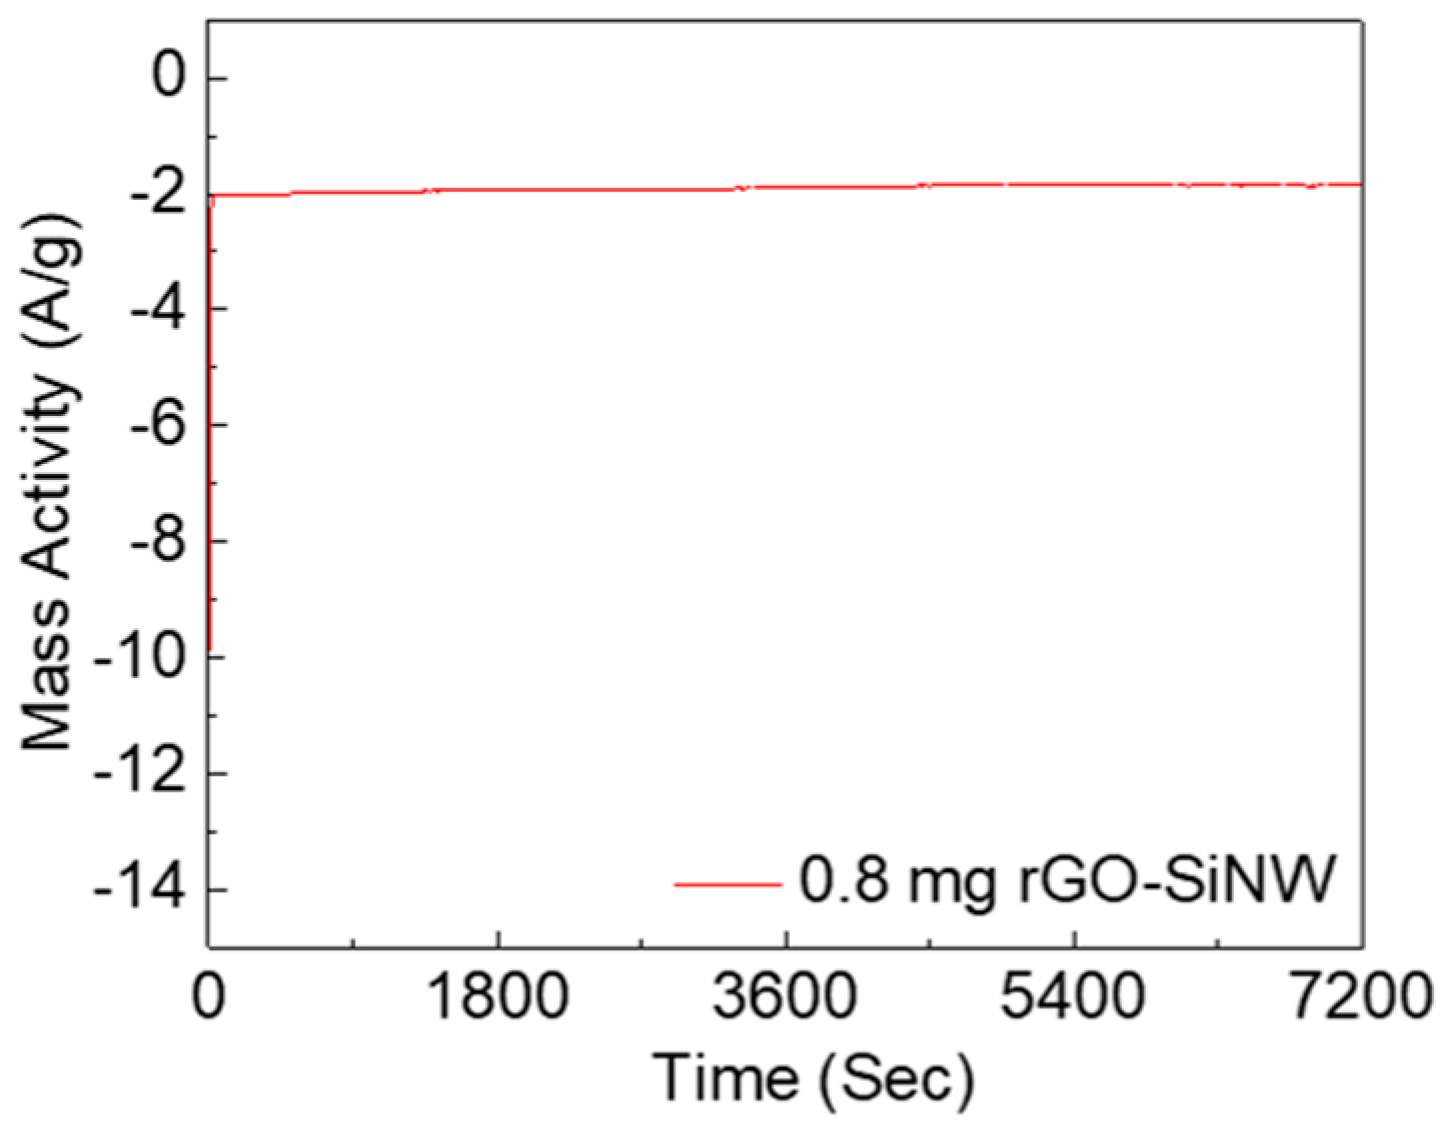
To sum up, the results of the capacitance and transient photoresponse measurements substantiate that the rGO-SiNW system is highly active in terms of decrease in recombination of charge carriers, and reduces the energy barrier for HER along the electrode/electrolyte interface. The long-term stability test of the 0.8 mg rGO-SiNW was implemented for 2 h at 0.25 V vs. RHE, showing a stable current density, as shown in Figure 6. The photocathode maintains a current density of approximately −2 A/g and more than 92% of the current, even after 2 h. Our stability testing result implies that the rGO co-catalyst efficiently suppresses the degradation of photoelectrochemical performance.
4. Conclusions
In conclusion, we fabricated reduced graphene oxide (rGO) co-catalyst on the silicon nanowire (SiNW) photocathode system. The surface nanostructuring of the SiNW photocathode showed an enhanced property for hydrogen evolution reaction (HER). Moreover, deposition of rGO co-catalyst on the SiNW showed 158 times higher conversion efficiency than that of bare planar Si without any co-catalyst and also indicated 3.47 times higher efficiency than bare SiNW, respectively. As a result, rGO displayed remarkable catalytic activity, meant for photoelectrochemical HER on SiNW photocathodes. We believe that the optimization of interface engineering between the co-catalyst and the photoelectrode in this study will pave the way to realize metal-free carbon-based catalysts with high efficacy for effectual solar-driven hydrogen fuel production.
Author Contributions
Conceptualization, U.S. and J.M.; Methodology, U.S.; Validation, U.S. and J.M.; Formal Analysis, Y.S.; Investigation, U.S.; Resources, U.S.; Data Curation, U.S.; Writing-Original Draft Preparation, Y.S. and J.J.; Writing—Review & Editing, J.J., U.S., and J.M.; Visualization, Y.S.; Supervision and Project Administration, J.M. and U.S.
Funding
This research was supported by the Basic Science Research Program through the National Research Foundation of Korea funded by the Ministry of Science and ICT (NRF-2017M3A7B4049176, 2018R1C1B6001267, and 2018R1A5A1025224).
Acknowledgments
Following is result of a study on the “Leaders in INdustry-university Cooperation+” Project, supported by the Ministry of Education and National Research Foundation of Korea.
Conflicts of Interest
The authors declare no conflicts of interest.
References
- Chu, S.; Cui, Y.; Liu, N. The path towards sustainable energy. Nat. Mater. 2016, 16, 16. [Google Scholar] [CrossRef] [PubMed]
- Turner, J.A. Sustainable Hydrogen Production. Science 2004, 305, 972–974. [Google Scholar] [CrossRef] [PubMed]
- Popczun, E.J.; McKone, J.R.; Read, C.G.; Biacchi, A.J.; Wiltrout, A.M.; Lewis, N.S.; Schaak, R.E. Nanostructured nickel phosphide as an electrocatalyst for the hydrogen evolution reaction. J. Am. Chem. Soc. 2013, 135, 9267–9270. [Google Scholar] [CrossRef] [PubMed]
- Ni, M.; Leung, M.K.H.; Leung, D.Y.C.; Sumathy, K. A review and recent developments in photocatalytic water-splitting using TiO2 for hydrogen production. Renew. Sustain. Energy Rev. 2007, 11, 401–425. [Google Scholar] [CrossRef]
- Cook, T.R.; Dogutan, D.K.; Reece, S.Y.; Surendranath, Y.; Teets, T.S.; Nocera, D.G. Solar energy supply and storage for the legacy and nonlegacy worlds. Chem. Rev. 2010, 110, 6474–6502. [Google Scholar] [CrossRef] [PubMed]
- Warren, S.C.; Voïtchovsky, K.; Dotan, H.; Leroy, C.M.; Cornuz, M.; Stellacci, F.; Hébert, C.; Rothschild, A.; Grätzel, M. Identifying champion nanostructures for solar water-splitting. Nat. Mater. 2013, 12, 842. [Google Scholar] [CrossRef] [PubMed] [Green Version]
- Wang, X.; Peng, K.Q.; Pan, X.J.; Chen, X.; Yang, Y.; Li, L.; Meng, X.M.; Zhang, W.J.; Lee, S.T. High-performance silicon nanowire array photoelectrochemical solar cells through surface passivation and modification. Angew. Chem. Int. Ed. 2011, 50, 9861–9865. [Google Scholar] [CrossRef] [PubMed]
- Oh, I.; Kye, J.; Hwang, S. Enhanced photoelectrochemical hydrogen production from silicon nanowire array photocathode. Nano Lett. 2011, 12, 298–302. [Google Scholar] [CrossRef] [PubMed]
- Di, J.; Yan, C.; Handoko, A.D.; Seh, Z.W.; Li, H.; Liu, Z. Ultrathin two-dimensional materials for photo- and electrocatalytic hydrogen evolution. Mater. Today 2018, 21, 749–770. [Google Scholar] [CrossRef]
- Hou, Y.; Abrams, B.L.; Vesborg, P.C.K.; Björketun, M.E.; Herbst, K.; Bech, L.; Setti, A.M.; Damsgaard, C.D.; Pedersen, T.; Hansen, O.; et al. Bioinspired molecular co-catalysts bonded to a silicon photocathode for solar hydrogen evolution. Nat. Mater. 2011, 10, 434–438. [Google Scholar] [CrossRef] [PubMed] [Green Version]
- Warren, E.L.; McKone, J.R.; Atwater, H.A.; Gray, H.B.; Lewis, N.S. Hydrogen-evolution characteristics of Ni–Mo-coated, radial junction, n+p-silicon microwire array photocathodes. Energy Environ. Sci. 2012, 5, 9653–9661. [Google Scholar] [CrossRef]
- Seger, B.; Laursen, A.B.; Vesborg, P.C.K.; Pedersen, T.; Hansen, O.; Dahl, S.; Chorkendorff, I. Hydrogen production using a molybdenum sulfide catalyst on a titanium-protected n+p-silicon photocathode. Angew. Chem. Int. Ed. 2012, 51, 9128–9131. [Google Scholar] [CrossRef] [PubMed]
- Ong, W.-J.; Tan, L.-L.; Ng, Y.H.; Yong, S.-T.; Chai, S.-P. Graphitic carbon nitride (g-C3N4)-based photocatalysts for artificial photosynthesis and environmental remediation: Are we a step closer to achieving sustainability? Chem. Rev. 2016, 116, 7159–7329. [Google Scholar] [CrossRef] [PubMed]
- Huang, Z.; Zhong, P.; Wang, C.; Zhang, X.; Zhang, C. Silicon nanowires/reduced graphene oxide composites for enhanced photoelectrochemical properties. ACS Appl. Mater. Interfaces 2013, 5, 1961–1966. [Google Scholar] [CrossRef] [PubMed]
- Meng, H.; Fan, K.; Low, J.; Yu, J. Electrochemically reduced graphene oxide on silicon nanowire arrays for enhanced photoelectrochemical hydrogen evolution. Dalton Trans. 2016, 45, 13717–13725. [Google Scholar] [CrossRef] [PubMed]
- Khan, A.H.; Ghosh, S.; Pradhan, B.; Dalui, A.; Shrestha, L.K.; Acharya, S.; Ariga, K. Two-dimensional (2D) nanomaterials towards electrochemical nanoarchitectonics in energy-related applications. Bull. Chem. Soc. Jpn. 2017, 90, 627–648. [Google Scholar] [CrossRef]
- Hu, L.; Chen, G. Analysis of optical absorption in silicon nanowire arrays for photovoltaic applications. Nano Lett. 2007, 7, 3249–3252. [Google Scholar] [CrossRef] [PubMed]
- Sim, U.; Moon, J.; An, J.; Kang, J.H.; Jerng, S.E.; Moon, J.; Cho, S.-P.; Hong, B.H.; Nam, K.T. N-doped graphene quantum sheets on silicon nanowire photocathodes for hydrogen production. Energy Environ. Sci. 2015, 8, 1329–1338. [Google Scholar] [CrossRef]
- Garnett, E.; Yang, P. Light trapping in silicon nanowire solar cells. Nano Lett. 2010, 10, 1082–1087. [Google Scholar] [CrossRef] [PubMed]
- Tian, B.; Zheng, X.; Kempa, T.J.; Fang, Y.; Yu, N.; Yu, G.; Huang, J.; Lieber, C.M. Coaxial silicon nanowires as solar cells and nanoelectronic power sources. Nature 2007, 449, 885. [Google Scholar] [CrossRef] [PubMed]
- Zhu, J.; Yu, Z.; Burkhard, G.F.; Hsu, C.-M.; Connor, S.T.; Xu, Y.; Wang, Q.; McGehee, M.; Fan, S.; Cui, Y. Optical absorption enhancement in amorphous silicon nanowire and nanocone arrays. Nano Lett. 2009, 9, 279–282. [Google Scholar] [CrossRef] [PubMed]
- Chen, Z.; Jaramillo, T.F.; Deutsch, T.G.; Kleiman-Shwarsctein, A.; Forman, A.J.; Gaillard, N.; Garland, R.; Takanabe, K.; Heske, C.; Sunkara, M.; et al. Accelerating materials development for photoelectrochemical hydrogen production: Standards for methods, definitions, and reporting protocols. J. Mater. Res. 2010, 25, 3–16. [Google Scholar] [CrossRef]
- Walter, M.G.; Warren, E.L.; McKone, J.R.; Boettcher, S.W.; Mi, Q.; Santori, E.A.; Lewis, N.S. Solar water splitting cells. Chem. Rev. 2010, 110, 6446–6473. [Google Scholar] [CrossRef] [PubMed]
- Oh, J.; Deutsch, T.G.; Yuan, H.-C.; Branz, H.M. Nanoporous black silicon photocathode for H2 production by photoelectrochemical water splitting. Energy Environ. Sci. 2011, 4, 1690–1694. [Google Scholar] [CrossRef]
- Ingle, J.D., Jr.; Crouch, S.R. Spectrochemical Analysis; Prentice Hall: Upper Saddle River, NJ, USA, 1988. [Google Scholar]
- Allen, J.; Bard, L.R.F. Electrochemical Methods: Fundamentals and Applications; John Wiley & Sons, Inc.: Hoboken, NJ, USA, 2001. [Google Scholar]
- Bott, A.W. Electrochemistry of Semiconductors. Curr. Sep. 1998, 17, 87–91. [Google Scholar]
- Gelderman, K.; Lee, L.; Donne, S.W. Flat-Band potential of a semiconductor: Using the Mott–Schottky equation. J. Chem. Educ. 2007, 84, 685. [Google Scholar] [CrossRef]
- Lewis, N.S. A quantitative investigation of the open-circuit photovoltage at the semiconductor/liquid interface. J. Electrochem. Soc. 1984, 131, 2496–2503. [Google Scholar] [CrossRef]
Scheme 1.
The structure of reduced graphene oxide (rGO) on silicon nanowire photocathode.

Figure 1.
Surface characterization of rGO-SiNW sample. (a) Top view scanning electron microscope (SEM) image of reduced graphene oxide (rGO) on the silicon nanowire (SiNW) structure and corresponding Energy-dispersive X-ray Spectroscopy (EDS) elemental mapping describing the presence of Si, C, and O. (b) Cross-sectional SEM image of rGO on SiNW and corresponding EDS elemental mapping describing the presence of Si, C, and O.

Figure 2.
Photocurrent density-voltage characteristics of bare Si, SiNW and rGO-SiNW photocathodes. (a) Photo electrochemical responses for bare Si, SiNW, rGO functionalized SiNW and rGO-bare planar Si electrode. Different lines of the same color represent repeat measurements at the same condition. (b) Mass activity results according to the loading amount of rGO on SiNW. (c) Polarization curves for bare Si, rGO-bare Si, SiNW and rGO functionalized SiNW under dark condition.

Figure 3.
Optical measurements of bare SiNW and rGO-SiNW samples. (a) reflectance and (b) absorbance measurements of bare SiNW and representative rGO functionalized SiNW with different loading amounts.
Figure 3.
Optical measurements of bare SiNW and rGO-SiNW samples. (a) reflectance and (b) absorbance measurements of bare SiNW and representative rGO functionalized SiNW with different loading amounts.

Figure 4.
Electrochemical activity of bare GC electrodes on a rotating disk electrode system. (a) Cyclic voltammograms for bare GC, rGO on carbon electrodes and the CV data ohmic drop (iR) compensation are also plotted (dash curves). (b) Tafel plots derived from CV data in (a).
Figure 4.
Electrochemical activity of bare GC electrodes on a rotating disk electrode system. (a) Cyclic voltammograms for bare GC, rGO on carbon electrodes and the CV data ohmic drop (iR) compensation are also plotted (dash curves). (b) Tafel plots derived from CV data in (a).

Figure 5.
Electrochemical activity of SiNW and rGO-SiNW. (a) The transient curve of the photocurrent from SiNW and rGO-SiNW when the light was turned on and off at the open circuit potential region (OCPT). (b) Mott-Schottky plot from capacitance measurement.
Figure 5.
Electrochemical activity of SiNW and rGO-SiNW. (a) The transient curve of the photocurrent from SiNW and rGO-SiNW when the light was turned on and off at the open circuit potential region (OCPT). (b) Mott-Schottky plot from capacitance measurement.

Figure 6.
Chronoamperometric operation of 0.8 mg rGO-SiNW photocathode at the potential of 0.25 V vs. RHE.
Figure 6.
Chronoamperometric operation of 0.8 mg rGO-SiNW photocathode at the potential of 0.25 V vs. RHE.


Table 1.
Summary of the experimental data of co-catalyst on Si and Glassy Carbon (GC) electrode.
| Electrode | Onset Potential [E(V) at −1 mA/cm2] | E(V) at −5 mA/cm2 | E(V) at −10 mA/cm2 | Potential at the Zero Current Density (Voc) [E(V) at 0 mA/cm2] | Current Density at Reversible Potential vs. RHE (Jsc) [mA/cm2 at 0 V vs. RHE] | Fill Factor (FF) | Half Solar-to-Hydrogen Conversion Efficiency (half STH) (%) | |
|---|---|---|---|---|---|---|---|---|
| Under illumination (p type Si) | Planar Si | −0.106 | −0.295 | −0.401 | 0.40 | −0.293 | 0.17 | 0.02 |
| Si NW | 0.179 | 0.133 | 0.09 | 0.42 | −22.0 | 0.10 | 0.91 | |
| rGO-planar Si | −0.018 | −0.217 | −0.354 | 0.44 | −0.619 | 0.11 | 0.03 | |
| rGO-SiNW | 0.326 | 0.275 | 0.239 | 0.50 | −23.152 | 0.27 | 3.16 | |
| Under dark condition (n+ type Si) | Planar Si | −0.656 | −0.771 | −0.843 | ||||
| Si NW | −0.448 | −0.527 | −0.571 | |||||
| rGO-planar Si | −0.579 | −0.663 | −10.04 | |||||
| rGO-SiNW | −0.382 | −0.434 | −0.47 | |||||
| Photovoltage | Planar Si | 0.55 | ||||||
| Si NW | 0.627 | |||||||
| rGO-planar Si | 0.561 | |||||||
| rGO-SiNW | 0.708 | |||||||
| RDE analysis | Bare GC | −0.397 | −0.778 | |||||
| rGO-GC | −0.25 | −0.345 | −0.389 |
© 2018 by the authors. Licensee MDPI, Basel, Switzerland. This article is an open access article distributed under the terms and conditions of the Creative Commons Attribution (CC BY) license (http://creativecommons.org/licenses/by/4.0/).
Share and Cite
MDPI and ACS Style
Sim, Y.; John, J.; Moon, J.; Sim, U. Photo-Assisted Hydrogen Evolution with Reduced Graphene Oxide Catalyst on Silicon Nanowire Photocathode. Appl. Sci. 2018, 8, 2046. https://doi.org/10.3390/app8112046
AMA Style
Sim Y, John J, Moon J, Sim U. Photo-Assisted Hydrogen Evolution with Reduced Graphene Oxide Catalyst on Silicon Nanowire Photocathode. Applied Sciences. 2018; 8(11):2046. https://doi.org/10.3390/app8112046
Chicago/Turabian StyleSim, Yelyn, Jude John, Joonhee Moon, and Uk Sim. 2018. "Photo-Assisted Hydrogen Evolution with Reduced Graphene Oxide Catalyst on Silicon Nanowire Photocathode" Applied Sciences 8, no. 11: 2046. https://doi.org/10.3390/app8112046
Note that from the first issue of 2016, this journal uses article numbers instead of page numbers. See further details here.