Evaluation of Eco-Efficiency of Two Alternative Agricultural Biogas Plants


1
Department of Commodity Science and Ecology of Industrial Products, Faculty of Commodity Science, Poznań University of Economics and Business, 61-875 Poznań, Poland
2
Department of Standardized Management Systems, Faculty of Commodity Science, Poznań University of Economics and Business, 61-875 Poznań, Poland
*
Author to whom correspondence should be addressed.
Appl. Sci. 2018, 8(11), 2083; https://doi.org/10.3390/app8112083
Submission received: 6 September 2018
/
Revised: 25 October 2018
/
Accepted: 26 October 2018
/
Published: 28 October 2018
(This article belongs to the Section Environmental Sciences)
Abstract
:Implementation of the circular economy is one of the priorities of the European Union, and energy efficiency is one of its pillars. This article discusses an effective use of agri-food industry waste for the purposes of waste-to-energy in biogas plants. Its basic objective is the comparative assessment of the eco-efficiency of biogas production depending on the type of feedstock used, its transport and possibility to use generated heat. The environmental impact of the analysed installations was assessed with the application of the Life Cycle Assessment (LCA) methodology. Cost calculation was performed using the Levelized Cost of Electricity (LCOE) method. The LCA analysis indicated that a biogas plant with a lower level of waste heat use where substrates were delivered by wheeled transport has a negative impact on the environment. The structure of distributed energy production cost indicates a substantial share of feedstock supply costs in the total value of the LCOE ratio. Thus, the factor affecting the achievement of high eco-efficiency is the location of a biogas plant in the vicinity of an agri-food processing plant, from which the basic feedstock for biogas production is supplied with the transmission pipeline, whereas heat is transferred for the needs of production processes in a processing plant or farm.
1. Introduction
Implementation of circular economy is one of the priorities of the European Union (EU), which is reflected in the package of actions for this area presented in 2015 [1]. Two years later, the report on the measures undertaken was published [2]. In this context, the role of waste-to-energy in the circular economy was emphasised and the support for research and innovation, which contributes to bringing advanced energy-efficient technologies to the market, was declared [3]. The idea of the circular economy is based on closing the product life cycle through the use of waste in the consecutive production cycle (from “cradle to cradle”).
Waste-to-energy constitutes one of the elements of the circular economy. Considering the product life cycle, it is the last option after reuse, refurbishing, and recycling. Nevertheless, in the life cycle of many products (also at early stages), waste is generated which undergoes the electricity and heat recovery process. Waste-to-energy, in the context of processing agricultural residues and agri-food industry waste in agricultural biogas plants, is a part of energy recovery. This article contributes to the discussion on the effective use of this type of waste for the purposes of waste-to-energy in biogas plants.
Many factors determine an efficient operation of a biogas plant. From the environmental and economic point of view, the feedstock of substrates and their transport is a very important issue, while the optimisation of these processes determines the benefits that may result from the waste-to-energy process. Therefore, it is worth stressing that the subject undertaken in this article is important not only in terms of searching for effective solutions for the circular economy, but also in the context of the necessity to diversify sources and methods of energy acquisition. In the case of Poland, the compliance with the EU requirements assuming 15% of the share of energy from renewable sources in the total gross energy consumption [4] will be possible mainly as a result of the development of the agricultural biogas plant market. In the draft document, National Energy Policy until 2050, biomass and biogas are recognised as the most important sources of renewable energy production [5]; Poland has considerable biomass resources provided by the extensively developed Polish agriculture and agri-food industry [6].
The literature on this subject richly illustrates the environmental benefits arising from biogas production in biogas plants (e.g., [7,8,9,10,11]). However, a question arises as to what is the most optimum variant of the biogas plant, which would guarantee a more effective performance of this type of installation, both in terms of environmental and economic issues. In this paper, studies focusing on the comparative assessment of the eco-efficiency of the biogas production process are presented, depending on the type of the feedstock used, its transport and possibility to use generated heat. On their basis, a variant of agricultural biogas installation was selected, the implementation of which may be recommended within the construction of the circular economy, of which energy efficiency is one of the pillars. The indicator determined in this article may be used for the purposes of the assessment of the environmental and economic energy unit and may potentially represent the additional measure describing the energy management system in enterprises.
2. Materials and Methods
2.1. Study Subject
Two agricultural biogas plants operating in Poland were selected as the subjects of this study; they were designated as "Biogas Plant A” and "Biogas Plant B” for the purposes of this analysis. The subjects were selected so that they differ in terms of the installed capacity, type of feedstock and method of its transport, heat utilisation method, and handling of digestate (Table 1). They also reflect the installed capacity of installations operating in Poland.
2.2. Objective of the Study
The principal objective of the undertaken studies was the comparative assessment of the environmental and economic effectiveness of the waste-to-energy process from substrates containing fractions of agricultural waste. Intermediate objectives include:
- The identification and assessment of negative and positive environmental impacts associated with the process of waste-to-energy from substrates containing fractions of agricultural waste;
- The assessment of production costs of energy originating from renewable sources, based on the example of the analysed biogas plants.
2.3. Life Cycle Assessment
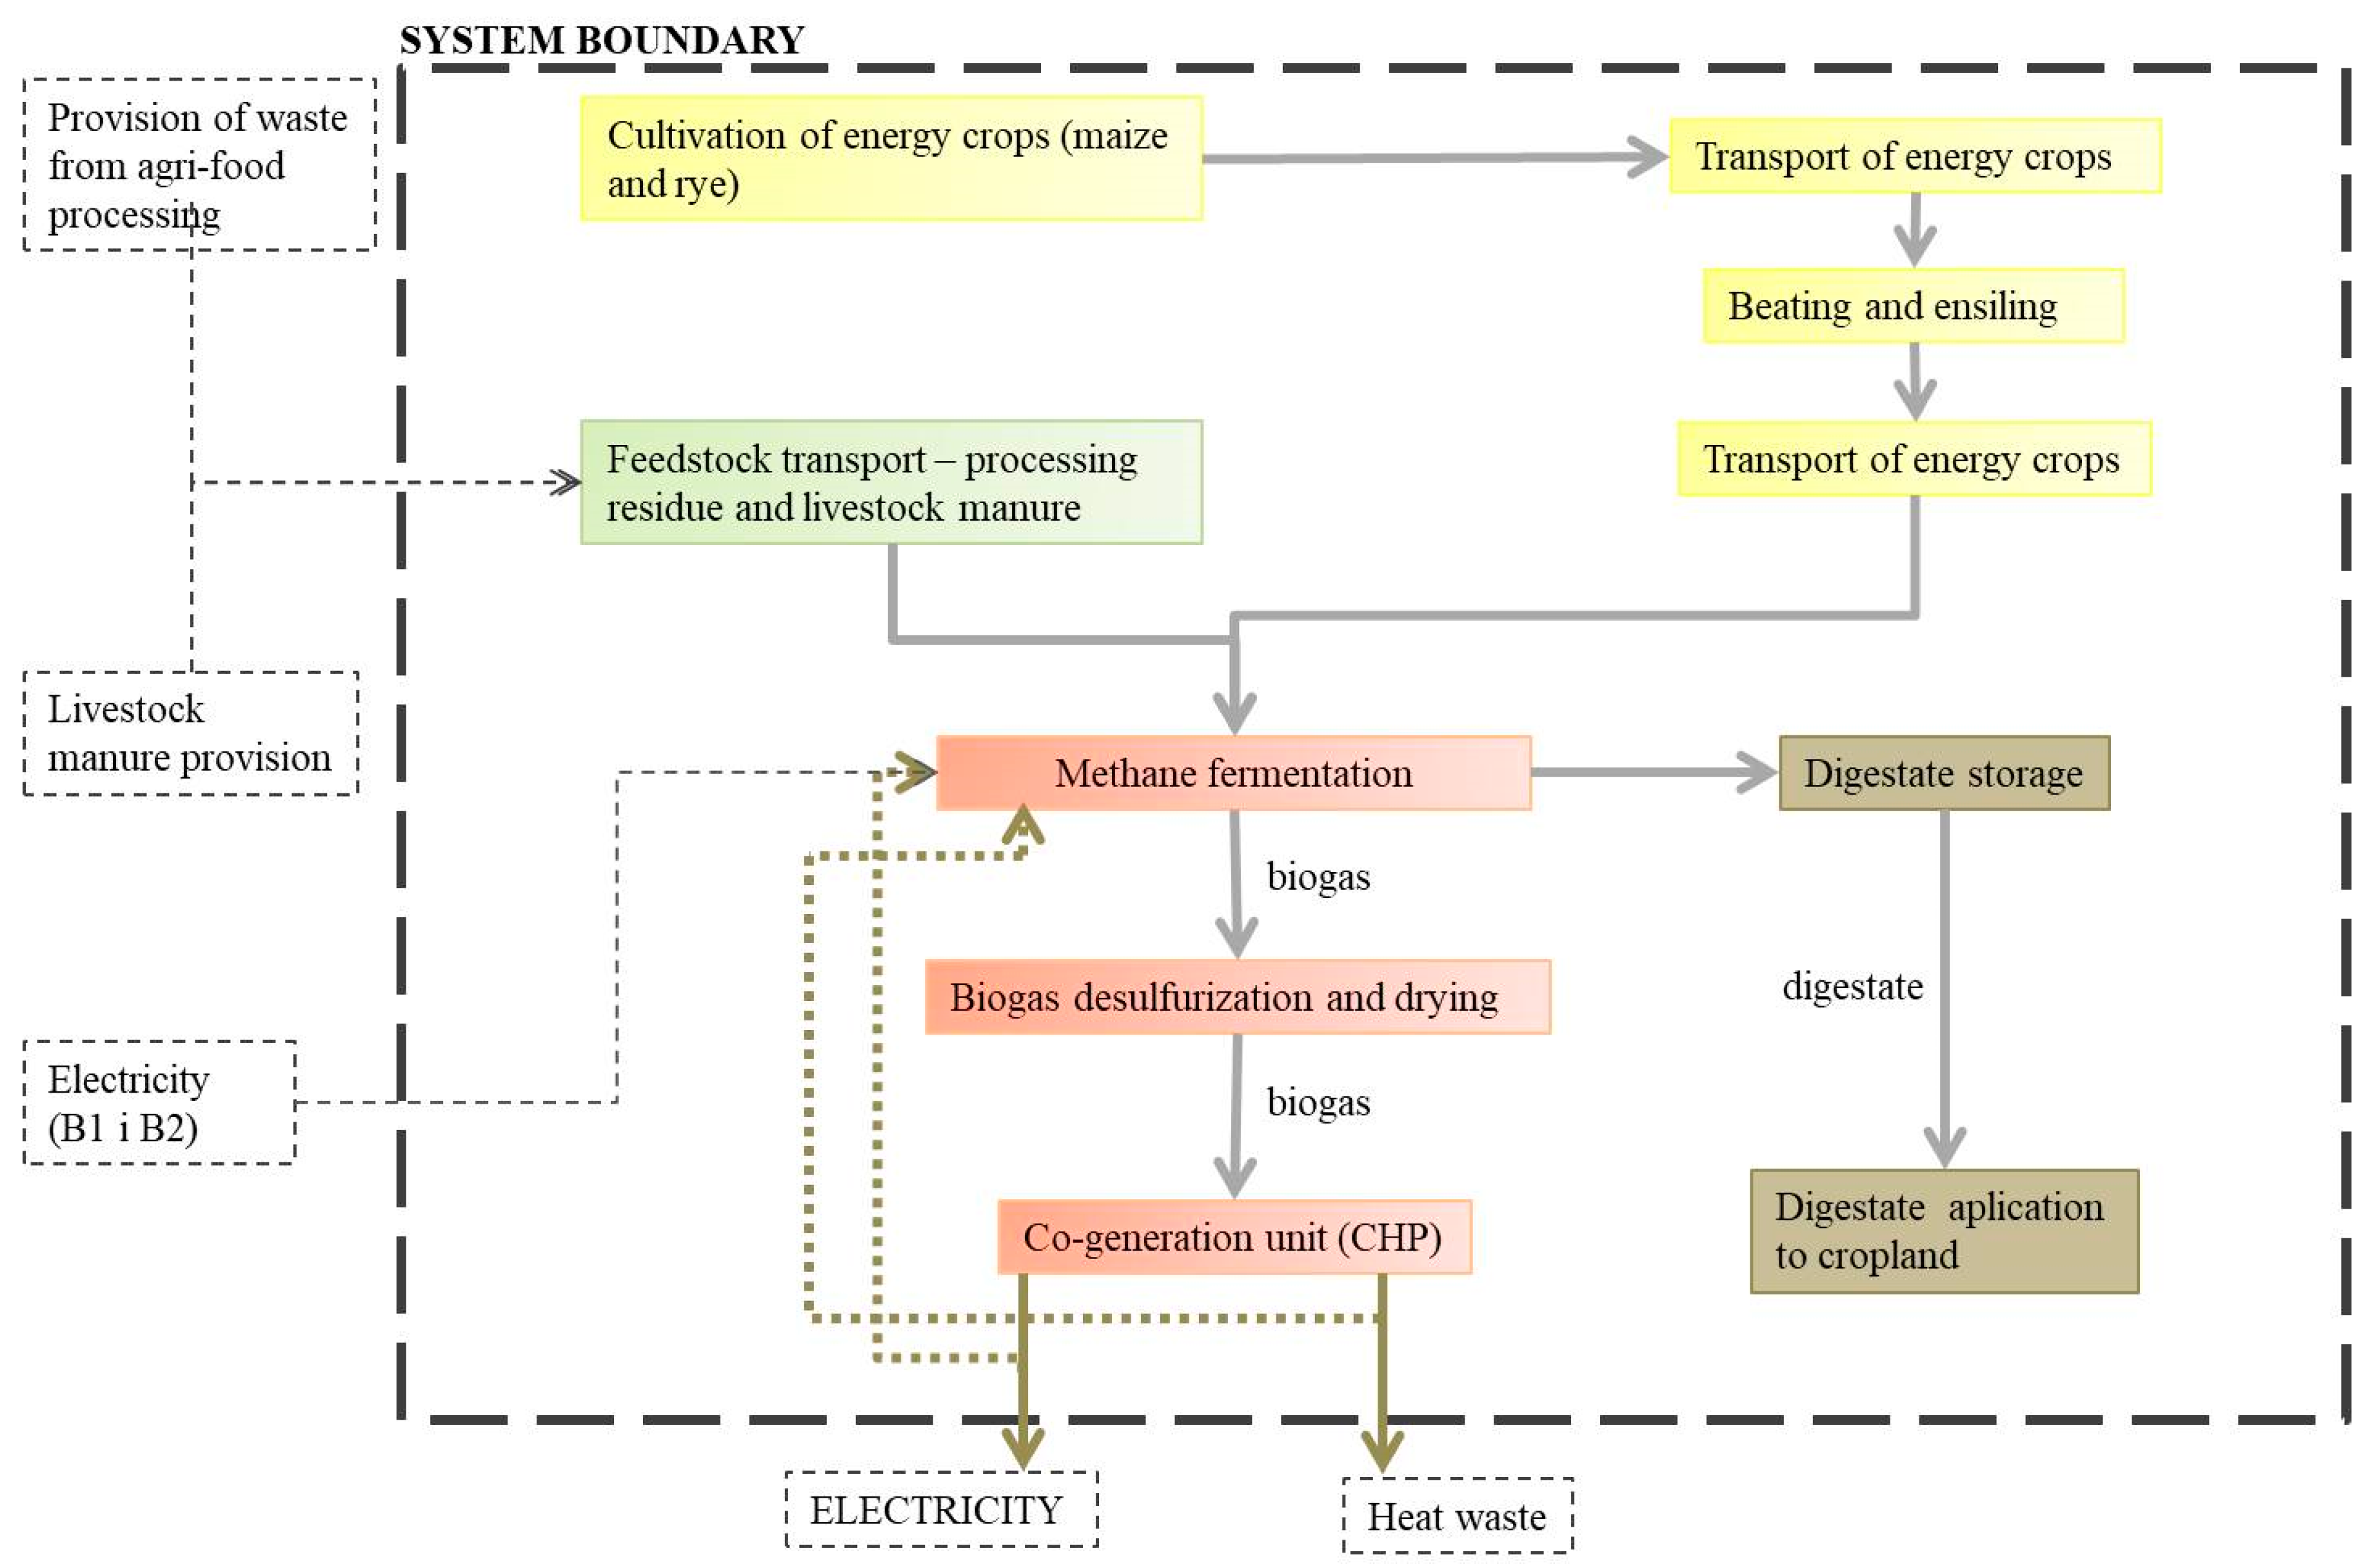
The assessment of environmental impacts was performed with the use of the Life Cycle Assessment (LCA) methodology based on ISO 14040-44 and with the use of the Impact 2002+ method [12]. The functional unit was defined as biogas combustion in the quantity enabling the production of 1 MWh of electricity with standard parameters in the biogas plant, similar to the works of Lijó et al. [13,14], because the main function of the studied biogas plants is the supply of electricity to the national grid or directly to the agri-food industry. Heat and digestate are by-products of the process. Calculations of the environmental impact are based on real data from biogas plant operators. The data from the Ecoinvent database were used only for analysis related to the production of trucks, their operation stage, and the amount of emissions from the combustion of diesel fuel. The data regarding the cultivation of energy crops were collected on the basis of empirical data as well as literature data and values included in the Ecoinvent database. The eco-balance data were collected for separated unit processes implemented within a modern mesophilic fermentation technology (Figure 1). The system boundaries included energy crops, providing feedstock including transport, energy production, storage and application of distiller. The construction and demolition of biogas plants, as well as the generation of waste substrates, were excluded from the studies.
2.4. Levelized Cost of Electricity
Calculation of costs was performed with the use of the Levelized Cost of Electricity (LCOE) method, taking into account the discount rate at a level of 6% according to EU recommendation [15]:
where:
- PMWh—amount of compensation for electricity production fixed throughout the life cycle (determined level of support);
- MWh—quantity of electricity produced in t-year [MWh]; a fixed value was assumed;
- (1 + r)−t—discount rate in t-year;
- Capitalt—total investment costs in t-year;
- OMt—operating and maintenance costs in t-year;
- Ft—fuel costs in t-year;
- Ct—CO2 emission costs in t-year;
- Dt—costs of plant liquidation and waste utilisation in t-year.
The LCOE method was chosen due to the fact that it is most widely used in EU countries using the feed-in tariff system. It allows the comparison of all energy generation costs from various sources, created by various technologies during their entire lifecycle. The normalised LCOE assessment methodology was developed by the U.S. Energy Information Administration (EIA) [16], one of the most important independent American institutions. The distributed cost of energy production represents the minimum price at which the sum of discounted revenues is equal to the sum of discounted costs, taking into account investment costs incurred on the construction, operating and financial costs, and the cost of equity incurred in a given period of installation life cycle. The LCOE method reflects the general technological and financial risk; it represents the real investment cost associated with the production of electricity on regulated monopoly electricity markets with regulated prices [15]. Equation (2) indicates the equality between the present value of the discounted income and the current value of the discounted costs, taking into account investment expenditures [15]. It should be emphasised that it is not the amount of energy produced that is discounted, but the income obtained from the sale of a certain amount of energy during a given year, i.e., the economic value of the energy produced.
2.5. Eco-Efficiency Analysis
According to the definition presented in ISO 14045, eco-efficiency is an “aspect of sustainability relating the environmental performance of a product system to its product system value” [17]. The product system value can be assessed from different perspectives, including, for example, functional, monetary, or aesthetic aspects. Therefore, within the framework of the conducted analysis, an eco-efficiency indicator was determined that can be described by the relation [18]:
where:
- IEE(x)—eco-efficiency indicator of product system x;
- LCA(x)—environmental indicator of product system x;
- LCA(y)—environmental indicator of product system y;
- LCOE(x)—cost indicator of product system x;
- LCOE(y)—cost indicator of product system y.
Product systems x and y represent objects that are compared in terms of eco-efficiency. Therefore, the IEE indicator presents the normalised value and its value for the particular product system is estimated in relation to other one. Thus, it must not indicate a zero value. The presented eco-efficiency assessment algorithm allows the determination of the dimensionless index that includes at the same time environmental impacts and costs assigned to an identical functional unit which facilitates the interpretation. Equation (3) allows both positive and negative values of the analysed aspects to be taken into account.
3. Results
3.1. Life Cycle Assessment
The results of the computations are presented in relation to the defined functional unit in the following order: (1) the total environmental impact of examined biogas plants; and (2) the impact of individual operational stages of the examined biogas plants, with special emphasis on stages with the highest values of cumulative eco-indicator. A positive value of the eco-indicator means a negative environmental impact (environmental burden), while a negative value means an environmental benefit; the higher the positive result of the eco-indicator, the higher the negative environmental impact, and the higher the negative result of the eco-indicator, the higher the environmental benefit.
The analysis of the results of the conducted studies demonstrated that Biogas Plant A generates a negative environmental impact. The value of the eco-indicator for this type of installation amounts to 2.02 Pt. On the other hand, Biogas Plant B demonstrates a negative eco-indicator value of −0.25 Pt, which means that it generates favourable environmental effects during its operation (Table 2). The environmental benefit gained in the Biogas Plant B results from the fact that the positive environmental impact associated with its operation exceeds appearing related burdens. It is associated not only with the organisation of waste-to-energy stage in this installation but also with a significant limitation of wheeled transport of raw materials.
In the case of Biogas Plant A, the highest impact was recorded for the damage category associated with human health. At the same time, for Biogas Plant B, the environmental impact on all damage categories is expressed in negative values of the eco-indicator (Table 2). Thus, Biogas Plant A generates environmental burden in all the analysed damage categories, whereas Biogas Plant B fully balances the environmental damages under consideration. The largest change within the value of the eco-indicator was observed for the depletion of natural resources category, which means that avoiding the extraction of fossil fuels as a result of waste-to-energy in Biogas Plant B is the most favourable environmental effect associated with this installation as compared to the operation of Biogas Plant A.
Results at a level of the so-called damage category may be further specified through their breakdown into fifteen impact categories (Figure 2). While comparing individual impact categories, it was recognised that Biogas Plant A is responsible for almost all negative environmental impacts considered within these categories. In the scope of the terrestrial acid subcategory (ecosystem quality category) 12% of negative impacts occur for Biogas Plant B, and it is actually the only category in which an adverse environmental impact for this biogas plant was demonstrated. For the other three categories, respiratory organics, land occupation and mineral extraction, the negative impact is marginal and represents around 1% for each. This is mainly the result of the fact that the digestate in Biogas Plant B is stored in an open lagoon, which generates ambient air emissions of ammonia and residual methane. The value of the eco-indicator for the digestate storage stage for Biogas Plant B amounts to 59.65 mPt/1 MWh (Table 3). Moreover, Biogas Plant B potentially results in avoiding many environmental damages generated by Biogas Plant A. The greatest positive effects were observed in the case of the subcategories, aquatic eutrophication (category ecosystem quality), followed by global warming (category climate change), non-carcinogens (category human health), and non-renewable energy (category resources).
The results of the studies explicitly indicate that the stage of providing the feedstock is mainly responsible for environmental burdens of Biogas Plant A, comprising mainly transport of raw materials, particularly in liquid form with a low dry mass and low biogas efficiency. In the case of Biogas Plant B, where liquid raw materials are transported by a gravitation pipeline, the negative impact is mitigated (Table 3). On the other hand, in both analysed biogas plants, the stage of energy production and application of the digestate to cropland shows a favourable environmental impact. The favourable environmental impact of the digestate application to cropland is associated with a possibility to limit the application of mineral fertilisers to cropland and related emission, mainly at the stage of production of these fertilisers, in exchange for the application the digestate with natural fertiliser properties. The negative values of the eco-indicator for the energy production stage, indicating favourable environmental effects, result from the substitutive character between electricity and heat generated in the biogas plant and the energy produced in the conventional power plant or co-generation plant. Biogas Plant A demonstrates a smaller favourable impact (by 34.94 mPt/1 MWh). Biogas Plant A uses only 25% of the generated heat for its own needs (ambient air emission makes up the remaining part). Biogas Plant B has a much higher level of heat use (75%). In the case of Biogas Plant B, part of the generated heat is managed for its own needs for the purpose of the heating of tanks and social and office rooms of the biogas plant, whereas the remaining part is sold in the form of steam to a neighbouring distillery. The type of feedstock used—more precisely, the indicator of biogas productivity for the specific substrate—also affects the differences in the eco-indicator results. This indicator is estimated based on the content of dry mass and organic dry mass in the specific quantity of the substrate. Thus, the more liquid the substrate, the lower the productivity. This means that in order to obtain the same quantity of biogas a much higher volume of slurry (biogas productivity amounts to approximately 36 m3/Mg of a substrate) than maize silage (230 m2/Mg of a substrate) has to be provided. Therefore, in the case of Biogas Plant A, the limitation of slurry used in favour of maize silage would result in considerable limitation of wheeled transport and a reduction of the related adverse environmental impact. However, the fact should be highlighted that for the proper operation of the biogas plant in the mesophilic fermentation technology the dry mass content in the fermentation chamber must amount to approximately 12%. Therefore, it is impossible to replace all liquid substrates with substrates with high biogas productivity.
3.2. Levelized Cost of Electricity
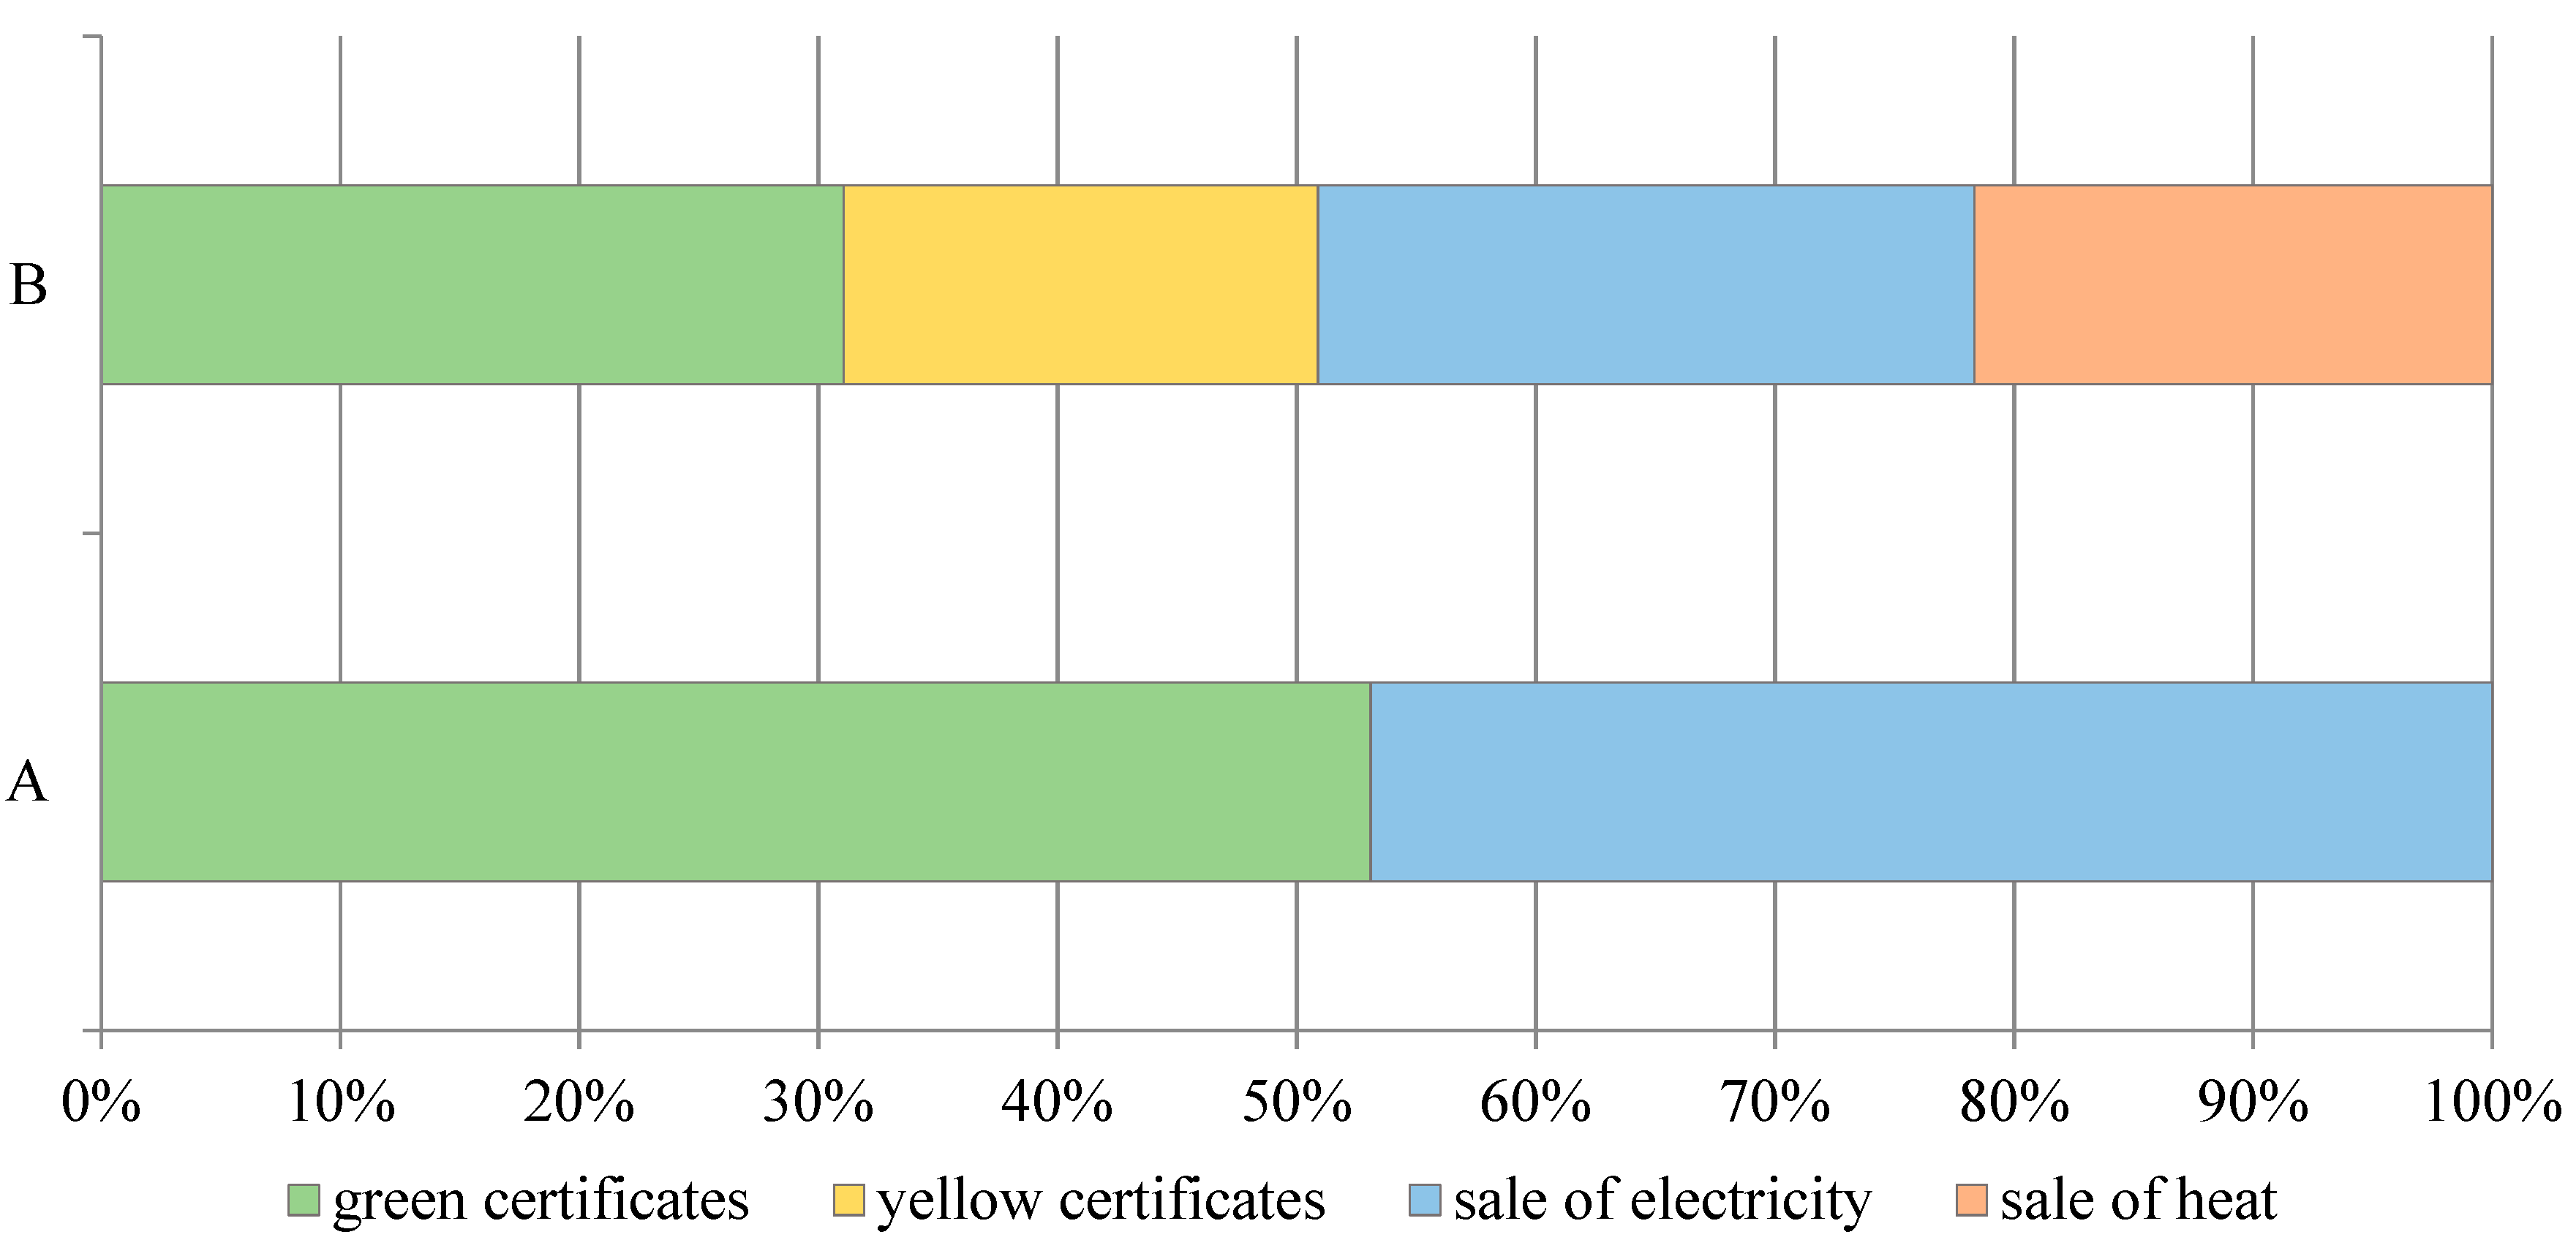
The structure of revenues in an agricultural biogas plant consists mainly of revenues from the sale of electricity to external customers and revenues from the disposal of property rights to certificates of origin of energy from renewable sources (Figure 3). It was Polish legal regulations, which were in force until 2015. This research was conducted based on data from the year 2014. It was a subsidiary system based on the sale of property rights to the origin of energy from renewable sources, the so-called “green certificates”. Furthermore, producers of renewable energy were entitled to obtain “yellow certificates” in the case of the high-energy co-generation of energy and heat. Companies dealing with electrical power and selling it to the final consumers were obliged to purchase electrical power from renewable energy sources. On the other hand, feedstock substrates required for the appropriate performance of the fermentation process represent the main source of variable operating costs (Figure 4). Together with the costs related to the transport of substrates, these make up almost 50% of all operating costs.
The results of the calculation of the distributed energy production cost in the LCOE life cycle are presented in Table 4. The costs of producing 1 MWh of electricity in Biogas Plant A are almost two times higher than those for Biogas Plant B.
The structure of the LCOE ratio indicates that the use of generated heat has the strongest impact on the decrease of LCOE ratio (Figure 5). Moreover, variable operating costs have a significant impact on the value of the distributed electricity production cost, more precisely, the application of cheap waste raw materials instead of costly silage of energy crops. On the other hand, in both Biogas Plants A and B, investment costs have a comparable share in the total value of the LCOE ratio.
3.3. Eco-Efficiency Analysis
The integrated eco-efficiency indicator for both study objects was determined based on the results of the cumulative LCA ratio and the LCOE ratio, being a measure of the costs of producing 1 MWh of electricity. The energy unit demonstrating a lower value of the IEE indicator should be assessed as more favourable in terms of eco-efficiency. The results of the calculations indicate that the value of the integrated IIn measure for Biogas Plant B is over eight times lower than for Biogas Plant A, and amounts to 0.22. The results of the eco-efficiency analysis are presented below (Table 5).
4. Determinants of Environmental Efficiency of Agricultural Biogas Plants—Discussion
In the literature of the subject, LCA studies for biogas plants operating based on maize silage are mainly presented. The use of energy crops, including their cultivation, is treated as the "hotspot" of the entire life cycle of biogas installations [19]. The results of environmental burdens of the electricity production process in the co-generation system from biogas where maize silage is the only feedstock into the fermentation process were compared to the environmental impact of power plants operating based on non-renewable fuel [19]. The studies presented in this paper indicate that the waste-to-energy process is more effective in circumstances when maize silage does not comprise the predominant part of the feedstock, but rather a less significant fraction, besides waste from the agri-food industry. This is a very important remark from the circular economy point of view, because the main assumption of this idea is to minimise the consumption of primary raw materials and provide an effective (from an environmental and economic point of view) waste management. Therefore, the presented research results can be used to formulate recommendations and solutions to guarantee high energy efficiency, which is an element of the circular economy. In the presented study, it was also indicated that the method of providing feedstock for the methane fermentation process is a very important aspect of the environmental efficiency of a biogas plant. Literature sources report that the provision of the feedstock, including its long-distance transport, results in the highest environmental burden of agricultural biogas plants [20]. According to Huopana et al. [21], the distance over which a feedstock is transported influences the potential of global warming, particularly in the case where biomass with a low potential for biogas production is the substrate. On the other hand, according to Boulamanti et al. [22], transport constitutes a considerable environmental burden also for other types of raw materials with higher dry mass parameters. Furthermore, authors of earlier studies [10] have recognised that agricultural biogas plants have a favourable impact on the environment only in cases when a biogas plant is located at a maximum distance of 20 km from the cropland of maize cultivated for energy purposes. All of these issues found confirmation in the studies performed.
The conducted LCA analysis indicates that the highest negative environmental impact in the case of Biogas Plant A is associated with the feedstock provision stage. In the case of Biogas Plant A, the wheeled transport of substrates to fermentation tanks is the major burden for the environment at this stage. The environmental aspects related to transport comprise interventions which mainly contribute to respiratory disorders triggered by effects of inorganic compounds (in the human health category), global warming (in the climate change category), and renewable energy use (in the resources category). The high values of eco-indicators obtained in the three specified impact categories suggest that the combustion of fossil fuel during wheeled transport and the use of agricultural machines is the factor contributing to the highest environmental burdens of agricultural biogas plant operation.
In the case of Biogas Plant B, a significant limitation of wheeled transport and its replacement by the gravitation pipeline during dosing of the majority of substrates has an impact on obtaining much lower values of the eco-indicator in those categories. The sale of heat energy to external customers is also an important factor influencing the eco-efficiency of a biogas plant. Biogas Plant B, which has the possibility to sell heat energy, demonstrates a lower environmental impact than Biogas Plant A, which does not have this possibility at the moment. Therefore, a noticeable dependence between the quantity of heat used and the level and nature of environmental impacts exists; the higher the heat utilisation level, the greater the impact on the reduction of environmental burdens. Chevalier and Meunier [10] confirmed that the use of heat produced in co-generation during electricity production from biogas has a favourable impact on lowering of the global warming potential and depletion of natural resources. Moreover, they indicated the possibility to achieve additional effects with the use of heat in tri-generation [10] (tri-generation means the simultaneous production of electrical or mechanical energy, heat and usable cold in co-generation, which allows the reduction of the quantity of primary energy required to produce each of these three forms in separate installations). Additionally, Hartmann [23] proved that minimising fossil fuel utilisation through the use of waste heat generated in the process of biogas combustion in the co-generation system contributes to favourable environmental effects.
Sensitivity Analysis
The sensitivity analysis of selected results for the “business as usual” (BAU) variant of Biogas Plant B was carried out by using the comparative method in the assumption of feedstock type. The BAU business variant was modified in three different ways. It was assumed that the amount of energy produced will not change; therefore, only the mass of substrates was changed with regard to the same amount of methane produced in the BAU variant. In the B1 variant, maize silage was used instead of livestock manure; in the B2 variant, potato pulp was used instead of maize silage; while in the B3 variant, potato pulp and distiller were used instead of maize silage. The highest environmental impact was observed for B3, where potato pulp was used instead of maize silage and distiller residues (Figure 6). When comparing the B2 variant with BAU, it can be noticed that the replacement of maize silage with potato pulp does not significantly increase the environmental impact of Biogas Plant B. This is related to the fact that the supply of maize silage to the fermentation tank requires the use of wheeled transport for this purpose (agricultural tractor). In option B2, replacing the maize silage with potato pulp did not change the way of transport or the length of the road. The reduction of the environmental impact can only be fulfilled in the case of the substitution of wheeled transport by pipeline transport. The environmental impact of variant B1 in the case of replacing the distiller with maize silage also increases the negative environmental impact. However, these are not significant differences, because for the maize silage, the dry organic matter content and biogas productivity index are much higher than for other substrates.
5. Conclusions
On the basis of the studies performed, it was recognised that Biogas Plant B demonstrates a significantly higher environmental efficiency than Biogas Plant A. Thus, in terms of the eco-efficiency analysis, Biogas Plant B is a more favourable version of the agricultural biogas plant. Observed differences in the values of the integrated eco-efficiency indicator result from the operation of the analysed biogas plants. The major factor resulting in the negative environmental impact of Biogas Plant A is the method of transport of pig slurry to the biogas plant. Another factor affecting the environmental and economic efficiency of Biogas Plant A is the low level of management of the generated heat.
On the other hand, Biogas Plant B is an example of a good organisation of the waste-to-energy process, especially in the scope of acquisition of substrates and heat sales to the external customer. On this basis, it is possible to conclude that an important aspect determining the operation of the biogas plant is its location, most favourably in the vicinity of the agri-food processing plant, where raw materials for the production of biogas are supplied by the transmission pipeline, whereas heat in the opposite direction is transmitted for the needs of production processes in the manufacturing plant or a farm. Therefore, Biogas Plant B can be a good example for the future of other planned biogas installations. This way, a reduction in the number of conventional power plants, an effective use of waste and heat, and the reduction of energy crop cultivation can be fulfilled.
Thus, while analysing in integrated terms the environmental and economic effects resulting from the functioning of the analysed agricultural biogas plants, it can be noticed that the factors influencing the environmental impact and the distributed production cost mainly include the high level of produced heat use, the application of waste substrates which are mostly supplied with pipelines, and the limitation of wheeled transport of the remaining substrates through locating the biogas plants in the vicinity of an agri-food plant or a farm. Thus, the circular economy idea is fulfilled; therefore, if there is no transport over long distances, i.e., if the biogas plant is located at the processing plant and there is no need for transport over long distances. Therefore, this is the factor that should be taken into account in terms of building the model of circular economy since it may become a determinant of efficient operation of waste-to-energy installation.
Author Contributions
Conceptualization, M.M., K.J.L. and Z.F.; methodology, M.M., K.J.L. and Z.F.; software, M.M. and K.J.L.; validation, M.M. and K.J.L.; formal analysis, M.M. and K.J.L.; investigation, M.M.; resources, M.M.; data curation, M.M. and K.J.L.; writing—original draft preparation, M.M. and K.J.L.; writing—review and editing, K.J.L. and Z.F.; visualization, M.M.; supervision, Z.F.; project administration, M.M. and Z.F.; funding acquisition, Z.F.
Funding
This research received no external funding.
Acknowledgments
We would like to thank our colleague Anna Lewandowska for her useful input in discussion on methodology used in this research article. Financial support for this publication was provided by the Poznań University of Economics and Business. The authors are also grateful to the biogas plants' owners and operators for providing the data for this study.
Conflicts of Interest
The authors declare no conflict of interest.
References
- European Commission. Communication from the Commission to the European Parliament, the Council, the European Economic and Social Committee and the Committee of the Regions, Closing the Loop—An EU Action Plan for the Circular Economy. 2015. Available online: https://eur-lex.europa.eu/legal-content/en/TXT/?uri=CELEX%3A52015DC0614 (accessed on 28 August 2018).
- European Commission. Report from the Commission to the European Parliament, the Council, the European Economic and Social Committee and the Committee of the Regions on the Implementation of the Circular Economy Action Plan. 2017. Available online: ec.europa.eu/environment/circular-economy/implementation_report.pdf (accessed on 28 August 2018).
- European Commission. Report from the Commission to the European Parliament, the Council, the European Economic and Social Committee and the Committee of the Regions, The Role of Waste-to-Energy in the Circular Economy. 2017. Available online: https://eur-lex.europa.eu/legal-content/EN/TXT/?uri=CELEX%3A52014DC0398R%2801%29 (accessed on 28 August 2018).
- European Commission. Communication from the Commission to the European Parliament, the Council, the European Economic and Social Committee and the Committee of the Regions, a Policy Framework for Climate and Energy in the Period from 2020 to 2030. 2014. Available online: https://eur-lex.europa.eu/legal-content/EN/TXT/?uri=COM%3A2014%3A15%3AFIN (accessed on 28 August 2018).
- Project of Polish Energy Policy until 2050, Ministry of Economy 2015. Available online: https://eur-lex.europa.eu/LexUriServ/LexUriServ.do?uri=COM:2014:0015:FIN:EN:PDF (accessed on 5 August 2018).
- Muradin, M.; Foltynowicz, Z. Potential for Producing Biogas from Agricultural Waste in Rural Plants in Poland. Sustainability 2014, 6, 5065–5074. [Google Scholar] [CrossRef] [Green Version]
- Igliński, B.; Buczkowski, R.; Iglińska, A.; Cichosz, M.; Piechota, G.; Kujawski, W. Agricultural biogas plants in Poland: Investment process, economic and environmental aspects, biogas potential. Renew. Sustain. Energy Rev. 2012, 16, 4890–4900. [Google Scholar] [CrossRef]
- Vorbrodt-Strzałka, K.; Pikoń, K. Environmental impacts associated with production and utilization of agricultural biogas. Arch. Waste Manag. Environ. Prot. 2013, 15, 1–12. [Google Scholar]
- Börjesson, P.; Berglund, M. Environmental system analysis of biogas systems—Part II: The environmental impact of replacing various reference systems. Biomass Bioenergy 2007, 31, 326–344. [Google Scholar] [CrossRef]
- Chevalier, C.; Meunier, F. Environmental assessment of biogas co- or tri-generation units by life cycle analysis methodology. Appl. Therm. Eng. 2005, 25, 3025–3041. [Google Scholar] [CrossRef]
- Muradin, M. Ecological and Economics Determinants of Operating Rural Biogas Plant. Ph.D. Thesis, University of Economics, Poznań Poland, March 2018. [Google Scholar]
- Jolliet, O.; Margini, M.; Charles, R.; Humbert, S.; Payet, J.; Rebitzer, G.; Rosenbaum, R. IMPACT 2002+: A new life cycle impact assessment methodology. Int. J. Life Cycle Assess. 2003, 8, 324. [Google Scholar] [CrossRef]
- Lijó, L.; Lorenzo-Toja, Y.; González-García, S.; Bacenetti, J.; Negri, M.; Moreira, M.T. Eco-efficiency assessment of farm-scaled biogas plants. Renew. Energy 2017, 237, 146–155. [Google Scholar] [CrossRef] [PubMed]
- Lijó, L.; González-García, S.; Bacenetti, J.; Moreira, M.T. The environmental effect of substituting energy crops for food waste as feedstock for biogas production. Energy 2017, 137, 1130–1143. [Google Scholar] [CrossRef]
- Projected Costs of Generating Electricity. International Energy Agency, Nuclear Energy i Organization for Economic Co-operation and Development. 2015, pp. 27–28. Available online: https://www.oecd-nea.org/ndd/pubs/2015/7057-proj-costs-electricity-2015.pdf (accessed on 5 August 2018).
- Levelized Cost of Electricity and Levelized Avoided Cost of Electricity Methodology Supplement. Energy Information Administration. Available online: https://www.eia.gov/renewable/workshop/gencosts/pdf/methodology_supplement.pdf (accessed on 15 October 2018).
- PN-EN ISO 14045:2012, Environmental Management—Eco-Efficiency Assessment of Product Systems—Principles, Requirements and Guidelines. p. 5. Available online: https://www.iso.org/standard/43262.html (accessed on 28 August 2018).
- Joachimiak-Lechman, K. The Modification of the Life Cycle Assessment Methodology in the Context of Small and Medium-Sized Enterprises. Ph.D. Thesis, University of Economics, Poznań Poland, October 2016. [Google Scholar]
- Bacenetti, J.; Sala, C.; Fusi, A.; Fiala, M. Agricultural anaerobic digestion plants: What LCA studies pointed out and what can be done to make them environmentally sustainable. Appl. Energy 2016, 179, 669–686. [Google Scholar] [CrossRef]
- Bacenetti, J.; Lovaralli, D.; Ingrao, C.; Tricase, C.; Negri, M.; Fiala, M. Assessment of the influence of energy density and feedstock transport distance on the environmental performance of methane from maize. Bioresour. Technol. 2015, 193, 256–265. [Google Scholar] [CrossRef] [PubMed]
- Huopana, T.; Song, H.; Kolehmainen, M.; Niska, H. A regional model for sustainable biogas electricity production: A case study from a Finnish province. Appl. Energy 2013, 102, 676–686. [Google Scholar] [CrossRef]
- Boulamanti, A.K.; Donida Maglio, S.; Giuntoli, J.; Agostini, A. Influence of different practices on biogas sustainability. Biomass Bioenergy 2013, 30, 149–161. [Google Scholar] [CrossRef]
- Hartmann, J.K. Life-Cycle-Assessment of Industrial Scale Biogas Plants. Ph.D. Thesis, Department for Agricultural Science, Georg-August-Universitat Gottingen, Gottingen, Germany, 2006. Available online: https://d-nb.info/982240473/34 (accessed on 28 August 2018).
Figure 1.
System boundary of the electricity production from agricultural biogas in the examined agricultural biogas plants [11].
Figure 1.
System boundary of the electricity production from agricultural biogas in the examined agricultural biogas plants [11].

Figure 2.
Environmental effects of the biogas plan operation expressed as impact categories.

Figure 3.
Structure of revenues in the analysed agricultural biogas plants.

Figure 4.
Structure of operating costs in the analysed agricultural biogas plants.

Figure 5.
Structure of Levelized Cost of Electricity (LCOE) of the analysed agricultural biogas plants.
Figure 5.
Structure of Levelized Cost of Electricity (LCOE) of the analysed agricultural biogas plants.

Figure 6.
Sensitivity analysis for Biogas Plant B—changes in the type of feedstock.


Table 1.
The most important parameters of the tested agricultural biogas plants.
| Discriminant | Biogas Plant A | Biogas Plant B |
|---|---|---|
| Feedstock quantity [Mg/year] | 36,517 | 27,905 |
| Feedstock | Livestock manure (40.6%) Maize silage (59.4%) | Maize silage (3.4%) Rye silage (7.8%) Distiller (38.8%) Livestock manure (50%) |
| Feedstock transport | Wheeled | Transmission (liquid) and wheeled (solid) |
| Capacity installed | 1.0 MW | 0.526 MW |
| Performance time [h/year] | 8100 | 8000 |
| Quantity of biogas generated [m3/year] | 4,169,760 | 2,195,639 |
| Quantity of electricity generated [MWh/year] | 7861 | 4193 |
| Quantity of heat generated [MWh/year] | 7769 | 5132 |
| Quantity of heat used [MWh/year] | 1470 | 4393 |
| Total efficiency (electricity and heat) [%] | 51 | 88 |
| Distiller quantity [Mg/year] | 35,515 | 26,025 |
| Distiller application | No separation, fertilising of cropland | Mechanical separation, fertilising of cropland and cow litter (dry fraction) |
Table 2.
Negative and positive environmental impact of the examined biogas plants expressed as weighted results of damage category indicators.
Table 2.
Negative and positive environmental impact of the examined biogas plants expressed as weighted results of damage category indicators.
| Damage Category | Eco-Indicator Value [Pt/1 MWh] | |
|---|---|---|
| A | B | |
| Human health | 0.66 | −0.04 |
| Ecosystem quality | 0.17 | −0.00 |
| Climate changes | 0.57 | −0.1312 |
| Resources | 0.62 | −0.09 |
| TOTAL VALUE | 2.02 | −0.25 |
Table 3.
Negative and positive environmental impact of the analysed biogas plants expressed as a result of cumulative eco-indicator, broken down into stages of a biogas plant operation.
Table 3.
Negative and positive environmental impact of the analysed biogas plants expressed as a result of cumulative eco-indicator, broken down into stages of a biogas plant operation.
| Stages of Operation | Maize Cultivation | Rye Cultivation | Providing Feedstock | Energy Production | Digestate Storage | Digestate Application |
|---|---|---|---|---|---|---|
| [mPt/1 MWh] | ||||||
| A | 404.12 | - | 1905.79 | −276.21 | 0.01 | −18.66 |
| B | 2.67 | 8.82 | 2.58 | −311.15 | 59.65 | −16.40 |
Table 4.
Specification of the LCOE ratio value for the analysed agricultural biogas plants.
| Biogas Plant | A | B |
| LCOE (Euro/MWh) | 120.2 | 65.6 |
Table 5.
Values of eco-efficiency indicators of the analysed agricultural biogas plants.
| LCOE [Euro/MWh] | LCA [Pt/MWh] | IEc | IEn | IIn | |
|---|---|---|---|---|---|
| A | 120.2 | 2.02 | 0.65 | 1.13 | 1.78 |
| B | 65.6 | −0.24 | 0.35 | −0.13 | 0.22 |
© 2018 by the authors. Licensee MDPI, Basel, Switzerland. This article is an open access article distributed under the terms and conditions of the Creative Commons Attribution (CC BY) license (http://creativecommons.org/licenses/by/4.0/).
Share and Cite
MDPI and ACS Style
Muradin, M.; Joachimiak-Lechman, K.; Foltynowicz, Z. Evaluation of Eco-Efficiency of Two Alternative Agricultural Biogas Plants. Appl. Sci. 2018, 8, 2083. https://doi.org/10.3390/app8112083
AMA Style
Muradin M, Joachimiak-Lechman K, Foltynowicz Z. Evaluation of Eco-Efficiency of Two Alternative Agricultural Biogas Plants. Applied Sciences. 2018; 8(11):2083. https://doi.org/10.3390/app8112083
Chicago/Turabian StyleMuradin, Magdalena, Katarzyna Joachimiak-Lechman, and Zenon Foltynowicz. 2018. "Evaluation of Eco-Efficiency of Two Alternative Agricultural Biogas Plants" Applied Sciences 8, no. 11: 2083. https://doi.org/10.3390/app8112083
Note that from the first issue of 2016, this journal uses article numbers instead of page numbers. See further details here.