Nonlinear Ultrasonic Detection Method for Delamination Damage of Lined Anti-Corrosion Pipes Using PZT Transducers


1
School of Mechanical & Automotive Engineering, South China University of Technology, Guangzhou 510641, China
2
Shenzhen Zhongji Intelligent Technology Co., Ltd., Shenzhen 518000, China
*
Author to whom correspondence should be addressed.
Appl. Sci. 2018, 8(11), 2240; https://doi.org/10.3390/app8112240
Submission received: 20 October 2018
/
Revised: 4 November 2018
/
Accepted: 8 November 2018
/
Published: 14 November 2018
(This article belongs to the Special Issue Structural Damage Detection and Health Monitoring)
Abstract
:Featured Application
The delamination detection of lined anti-corrosion pipes.
Abstract
Lined anti-corrosion pipes are widely used in oil and gas, petrochemical, pharmaceutical industries. However, defects, especially delamination, may occur in the production and service of pipes which result in safety accidents. Based on nonlinear ultrasonic theory, this paper studied the delamination detection method using the nonlinear harmonics for lined anti-corrosion pipes. The response characteristics of the anti-corrosion pipe were obtained through a sweep sine response experiment and the preferred excitation frequency was determined. The Wavelet Packet transform and Hilbert–Huang transform is applied for signal process and feature extraction. Then, a series of experiments were carried out and the results were analyzed and discussed. The results showed that a second-order and third-order nonlinear coefficient increased with the delamination damage. The amplitude of second-harmonic is much stronger than the third-order one. The mean squared error of the nonlinear coefficient, which was processed by Wavelet Packet transform and Hilbert–Huang transform, is smaller than wavelet packet transform and Discrete Fourier transform or processed only Hilbert–Huang transform. The higher harmonics can describe the change of delamination damage, which means that the nonlinear ultrasonic detection method could use for damage detection of anti-corrosion pipe. The nonlinear higher-harmonic is sensitive to delamination damage. The nonlinear ultrasonic method has the potential for damage detection for lined anti-corrosion pipes.
1. Introduction
The pipeline is one of the most important transportation means in oil and gas, petrochemical, and pharmaceutical industries [1,2,3,4]. Due to their excellent performance in extreme environments, lined anti-corrosion pipes are the most widely used [5]. The lined anti-corrosive pipe is a metal–nonmetal composite pipe that is composed of an anti-corrosive liner and an outer steel layer. It has both the mechanical strength of the metal material and the wear resistance, corrosion resistance and high temperature resistance of the liner materials. The lined anti-corrosion pipelines are widely used in harsh environments and its processing procedure is complex. Therefore, various defects may occur during the production, installation, and serve, such as delamination, pinhole and wrinkle defect. Especially, the delamination damage leads to a reduction in stiffness and strength, and it is not easy to detect [6]. Therefore, detection of delamination damage for lined anti-corrosion pipes has great significance to ensure the normal operation of the pipes.
In industrial production, the vacuuming test method is often used. It is decided whether the delamination damage exists in lined anti-corrosion pipes by sealing the two ends of the pipeline to be tested and extracting the air in the pipes to vacuum and observe the surface of the lining plastic pipe [7,8]. Although this method is effective, it may cause damage to the pipe. The pipes are normally inspected before installation and it is very costly to inspect the serve pipelines. In nondestructive testing methods, infrared thermal wave testing and the ultrasonic testing method are commonly used in the detection of delamination defects. The infrared thermal wave testing method has the advantages of direct perception, non-contact and large detection area [9]. For example, Cotič et al. [10] applied the infrared thermography method to investigate the detectability of the delamination and void in concrete, and found that the delamination with 2 mm thickness beneath 20–30 mm of plaster could be detected. Ellenberg et al. [11] achieved rapid evaluation of the delamination size and location using infrared imagery for a bridge deck. In addition, pipeline monitoring using active thermography with a fiber optical sensor has been investigated [12,13,14], and some literature demonstrated that coded-excitation with low-power heating source is an effective solution to avoid damage [15,16,17,18]. However, the method has not been yet tried on pipes as a possible future application, and infrared thermal wave testing is difficult to detect deeper defects.
Ultrasonic testing methods mainly include ultrasonic echo detection and ultrasonic guided wave detection. For an ultrasonic echo detection method, for example, Benammar et al. [19] applied split spectrum processing and the expectation maximization algorithm to process the ultrasonic echo signal of the delamination in carbon fiber-reinforced polymer composite. Karabutov et al. [20] evaluated the delamination and void damage in carbon fiber-reinforced plastic using the ultrasonic attenuation coefficient of laser ultrasonic. Park et al. [21] scanned the composites to detect the delamination damage using laser ultrasonic techniques. However, to achieve the scanning of the test object, the ultrasonic echo testing method has a very high demand of the testing device. The ultrasonic guided wave detection includes a linear ultrasonic guided wave and a nonlinear ultrasonic guided wave method. For a linear ultrasonic guided wave method, for example, Na et al. [22] detected the delamination damage of reinforced concrete using lamb wave to evaluate the interface bonding condition between steel bar and concrete. Bingham et al. [23] analyzed the quantitative information of delamination damage for large diameter pipe coatings using lamb wave. Lam et al. [6] developed a delamination detection system for glass fiber-reinforced epoxy composite beam by receive the ultrasonic lamb wave using a fiber Bragg grating as a sensing transducer. However, the linear ultrasonic guided wave detection method is not efficient for detecting small delamination damage.
The nonlinear ultrasonic guided wave enabled detection method is sensitive to small damage and incipient damage relative to a linear ultrasonic method [24]. In solid materials, due to the irregularity of the self-lattice arrangement and the discontinuity of the contact interface, linear and nonlinear features may exist inside the material. With a linear excitation signal, not only linear response but also nonlinear response will occur inside the material [25]. There is a nonlinear response caused by nonlinear features. By measuring the nonlinearity of the material, the relevant damage information can be obtained, and the damage detection of the material can be realized. Hirsekorn et al. [26] assessed the quality of composite with delamination damage using a nonlinear variable including second-order nonlinearity coefficient, third-order nonlinearity coefficient and distortion factor. Delrue et al. [27] simulated the delamination damage of composite based on the nonlinear ultrasonic method, and the position, shape, depth and orientation of delamination were investigated by a finite element model. Mandal et al. [28] combined the finite element analysis and nonlinear ultrasonic technique to detect the delamination damage with a different size for a stiffened aluminum plate. Yelve et al. [29] analyzed the effect of debonding damage to the nonlinearity, which resulted in incorrect detection results. Hong et al. [30,31,32] studied the feasibility of damage detection of plastic pipe and glass curtain walls through nonlinear ultrasonic techniques. However, there is still little research of delamination detection for lined anti-corrosion pipes.
On the other hand, Lead Zirconate Titanate Transducer (PZT) has been extensively used in ultrasonic structural health monitoring and nondestructive testing for their excellent actuation and sensing capacity [33,34,35,36,37]. Yang et al. [38] developed a reusable PZT transducer for monitoring initial hydration and structural health of concrete. Luo et al. [39] assessed the interfacial strength of concrete filled fiber reinforced polymer tube using PZT transducers. Parvasi et al. [40] applied the time reversal technique to evaluate loosened bolted joints based on the actuation and sensing capacity of PZT transducers. Huo et al. [41] utilized the PZT transducers as the actuator and sensor to detect the pre-load status of rock bolts. Zhu et al. [42] presented a rapid detection and location method for pipeline leakage utilizing PZT as transducers. In addition, PZT-transducer enabled ultrasonic/stress wave methods have been used to detect debonding and a separation type of damage in various structures [43,44,45,46,47]. Xu et al. [48] developed a PZT enabled active sensing method to detect the steel and concrete debonding in Concrete Filled Steel Tubes (CFST). Jiang et al. [49] investigated the detection of debonding between fiber reinforced polymer bar and concrete structure using piezoceramic transducers and wavelet packet analysis. For composite structures, PZTs are also actively studied to detect the interlayer delamination [50,51,52]. Therefore, PZT were utilized as the transducer to excite and to sense the ultrasonic wave in the paper.
Delamination damage is a common failure form of lined anti-corrosion pipes. With the expansion of delamination damage, the anti-corrosive liner will rupture and the outer steel layer will corrode, which results in accidents. Therefore, the detection of delamination damage for anti-corrosion pipes is very necessary. In this paper, a nonlinear ultrasonic testing method is developed for delamination detection of lined anti-corrosion pipes. This paper is organized as follows. First, theoretical fundamentals of nonlinear ultrasonic are present. Second, the experimental setup is established and experiments are carried out. Then, analysis is conducted and the experimental results are discussed. Finally, the paper presents a brief summary.
2. Methodology
2.1. Theoretical Fundamental of Nonlinear Ultrasonic
The lined anti-corrosion pipe is composed of a metal layer (galvanized steel) and the non-metallic layer (polyethylene) that belongs to a solid-solid composite material. When ultrasonic wave propagates in the pipes, if there is damage, the interaction between ultrasonic wave and damage will produce nonlinear effects. The received signal includes not only the fundamental frequency, but also higher-harmonics that could be used to evaluate the nonlinearity of the pipes. A schematic illustration of a nonlinear ultrasonic method for damage detection of anti-corrosion pipes is shown in Figure 1.
The three-dimensional nonlinear elastic wave equation of lined anti-corrosion pipe can be described as [25]:
where is displacement of microelement, and are the lame coefficients, and is the material density. Because of the complexity of the actual wave propagation mode, it is very difficult to solve the equation mathematically. The equation can be simplified as the one-dimensional nonlinear elastic wave equation:
where is the axial strain. Retaining the second-order nonlinear terms, Equation (2) can be rewritten as:
According to the wave theory, with one excitation signal, the solution can be assumed as:
where is linear displacement, is the displacement caused by nonlinearity, and is nonlinear coefficient. If the displacement caused by nonlinearity is a micro-perturbation, then , and the change caused by the nonlinearity has little effect on the energy of linear vibration.
When the excitation signal is a single frequency cosine, without considering the attenuation of ultrasonic waves, and can be expressed as:
Then, Equation (4) can be expressed as:
where is the amplitude of fundamental frequency, is angular frequency, and is wave number. It can see that, when transmitting a signal with frequency , the received signal contains not only the fundamental component of frequency but also the second harmonic with frequency 2.
Usually, Equation (5) is abbreviated as:
where represents the amplitude of the nonlinear component. The amplitude of the second harmonic is directly proportional to the nonlinear coefficient, the amplitude of the fundamental wave and the propagation distance. When there is a nonlinear effect in the solid medium, the energy of the fundamental signal leaks to higher-harmonics.
For a given , , the nonlinear coefficient can be expressed as:
Considering the attenuation of ultrasonic waves, Equations (5) and (6) can be expressed as:
The corresponding nonlinear coefficient can be expressed as:
According to Equations (9) and (12), when the propagation distance x is a constant, the nonlinear coefficient is proportional to the ratio of the second harmonic amplitude to the square of the fundamental amplitude. Therefore, the second-order nonlinear coefficient is usually expressed as:
In the above process, only the second-order nonlinearity is considered and the third-order nonlinearity and other high-order terms are omitted. If the second-order and third-order nonlinearity are considered simultaneously, the solution to wave equation contains not only the fundamental and second-order harmonic but also the third-order harmonic. The derivation of the third harmonic is similar to the second harmonic. Similarly, the third-order nonlinear coefficient can be obtained by the following equation:
where is the amplitude of the third harmonic.
In the damage detection of Lined anti-corrosion pipes, the delamination damage existing in the pipes will cause the change of nonlinearity in the pipe. Nonlinear coefficients can be used to characterize the nonlinearity in materials. Therefore, the damage state in the pipes can be evaluated by measuring and analyzing the nonlinear coefficients.
2.2. Signal Processing Based on Wavelet Packet Transform (WPT)
Because of the dispersion and multimode characteristics of ultrasonic waves and the effect of damages in pipes [53,54], the receiving signals are very complex. Therefore, wavelet packet transform (WPT) was used to analyze the receiving signal and feature extraction [55].
For a given scaling function and wavelet function, the dual scale equations are defined as [56]:
where is a set of integers, and and are a pair of conjugate filters that satisfy the relation .
From Equation (15), a signal can be expanded according to the wavelet packet basis function:
where is wavelet packet decomposition coefficient, that is wavelet packet transform:
In the damage detection of anti-corrosion pipes, the receiving signal can be decomposed by l-layer WPT, and 2l subsets are obtained. Each subset represents the wavelet packet decomposition coefficient in a frequency band. Then, the wavelet packet energy of each subset can be calculated by
where is the mth wavelet packet decomposition coefficient of the ith subset.
The wavelet packet energy of the frequency band indicates the strength of the band in the signal. The wavelet packet energy of subsets is calculated after the WPT. The frequency band with larger wavelet packet energy is extracted as signal characteristics to reduce noise and interference.
2.3. Feature Extraction Based on Hilbert–Huang Transform (HHT)
Hilbert–Huang Transform is a time-frequency analysis method presented by Huang et al. [57]. This method is suitable for non-stationary signals. HHT contains two processing processes: Empirical mode decomposition (EMD) and Hilbert Transform (HT). EMD decomposes a complex signal into a series of Intrinsic Mode Function (IMF). Then, Hilbert Transform is used to obtain the instantaneous frequency and amplitude. The Hilbert spectrum obtained by this method has a high time-frequency resolution. In addition, each IMF component obtained by EMD has a clear physical meaning, and the processed signal retains the local characteristics of the original signal.
The decomposed component of EMD must satisfy two conditions so as to be considered as IMFs. First, the difference between the number of extrema and zero crossings is less than or equal to 1. Second, the mean value of the envelope determined by local maxima and local minima must equal zero.
The specific process of HHT (EMD and HT) are as follows:
Step 1: For an original signal , the local maxima and local minima are computed and upper and lower envelop are obtained by connected them using a cubic spline, respectively.
Step 2: The mean of the upper and lower envelop is calculated and is subtracted from the original signal :
If satisfies the conditions of the IMF definition, then is the first IMF component, and let . Otherwise, is replaced by and repeat the previous process k times until meet the IMF conditions, and let .
Step 3: After the first IMF is found, the residue is calculated by subtracted from the :
Step 4: Take as the new data, repeat step 1, step 2 and step 3, and obtain the nth IMF component and nth residue , until the residue becomes too small or a monotonic function.
Step 5: For each IMF component , Hilbert Transform is performed as follows:
where P is the Cauchy principal value.
Step 6: Coupling and , a signal can be obtained [58]:
where and are instantaneous amplitude and instantaneous phase. Instantaneous frequency can be obtained by derivation of the instantaneous phase:
Step 7: The time-frequency distribution of amplitude is called Hilbert spectrum and is expressed as:
Step 8: The Hilbert marginal spectrum is obtained by integrating the Hilbert spectrum:
According to the Hilbert marginal spectrum, the amplitude of the fundamental frequency, second-order harmonic and third-order harmonic can be obtained. Then, the nonlinear coefficient can be calculated to evaluate the damage state.
2.4. Delamination Evaluation of the Nonlinear Ultrasonic Detection Method
According to the theoretical foundation and the processing approach introduced above, the specific evaluation process of the lined anti-corrosion pipes is as follows. The schematic illustration of the evaluation process is shown in Figure 2:
- Step 1: The excitation frequency was determined through a sweep experiment.
- Step 2: The experimental setup was established and a set of experiments were carried out.
- Step 3: The receiving signal was collected 10 times to reduce the experimental random error, and a trip filter and ideal band-pass filter was used to reduce the low-frequency and high-frequency interference.
- Step 4: The wavelet packet energy was calculated after WPT and the wavelet packet coefficient containing feature frequency components was reconstructive as the new feature signal to reduce the noise.
- Step 5: The HHT was used to feature extraction. Hilbert marginal spectrum is obtained by integrating the Hilbert spectrum.
- Step 6: The second-order and third-order nonlinear coefficient was calculated to evaluate the damage state.
- Step 7: A comparison of the processing process with or without WPT and HHT was performed to verify the effectiveness of the method.
3. Experimental Setup
The nonlinear ultrasonic harmonic testing system was established to carry out a series of experiments. The instrumentation consisted of a function generator (Agilent 33522B, Palo Alto, Santa Clara County, CA, USA), an amplifier (TREK2100HF, Trek Inc., New York, NY, USA), and a data acquisition card (TDEC PCI-20614, Chengdu, CN) installed in the host of the high-performance PC. The diagram of the instrumentation is shown in Figure 3.
In the experiment, an excitation signal was generated by the function generator. The generated signal is too weak to drive the transducer T. Therefore, the amplifier was used to amplify the excitation signal, and the amplified signals were used to drive the transducer T to produce an ultrasonic wave. The generated ultrasonic wave propagated along the pipe and was received by the receiving transducer R. Finally, the received signal was sent to the high-performance PC for processing and analysis.
The experimental object is a lined anti-corrosion pipe that is mainly composed of a metal layer (galvanized steel) and a non-metallic layer (polyethylene). The thickness of the steel and PE layer are 3.5 mm and 1.5 mm. The lined and outer diameters are 77 mm and 82 mm, respectively. With the advantages of small dimensions and easy installation via surface bonding [59,60], PZTs in the form of patches have been widely used structural health monitoring applications to generate and to detect stress/ultrasonic waves [61,62,63,64]. Surface bonded PZT patches enable both the active-sensing based methods [65,66,67] and impedance-based methods [68,69]. In this research, PZT patches were adopted to enable the active sensing method. Two PZT patches were bonded at the surface of the metal layer as the excitation transducer T and receiving transducer R. The resonant frequency of the PZTs is 2 MHz. The diameter is 10 mm and thickness is 1 mm. Two PZTs were bonded on the same line of the pipe using the Leaftop 9903 AB adhesive (Shenzhen, CN). The distance between the excitation transducer T and the receiving transducer R is 200 mm. The distance between the excitation transducer T and the end of the pipe is 220 mm. The lined anti-corrosion pipe with PZTs is shown in Figure 4.
4. Experiments and Analyses
4.1. Frequency Response Characteristics of Anti-Corrosion Pipes
When ultrasonic waves propagate in the pipes, the interaction between fundamental frequency and damage leads to the generation of higher-harmonics. This is a kind of leakage of energy. The energy of fundamental frequency is leaked to higher-harmonics in the propagation of ultrasonic wave. Therefore, usually the amplitude of higher-harmonics is lower than the fundamental frequency. To obtain an obvious result of the nonlinear effect, a sweep signal from 0 kHz to 500 kHz is performed to obtain the response characteristics. The sweep time is 1 s, and the amplitude of sweep signal is 1 V. The sweep sine responses are shown in Figure 5.
Figure 5 shows that frequency response of the anti-corrosion pipe is stronger from 130 kHz to 250 kHz, and the strongest response is at 159.6 kHz. Therefore, the excitation frequency was 80 kHz, and the frequency of second-order harmonic was 160 kHz which almost has the strongest response, and the third-order harmonic was 240 kHz.
In the damage detection experiment, the excitation signal was a string of sine wave with 6 V, and the excitation time was 0.001 s. The excitation signal was amplified 50 times through the amplifier. The sampling rate is 20 MHz. The galvanized steel pipe and polyethylene pipe were firmly bonded together. The side view of the anti-corrosive pipe is shown in Figure 6. The delamination damage was made by stripping the polyethylene-layer of the galvanized steel pipe. In the experiments, six types of delamination damages with lengths of 0 mm, 4 mm, 8 mm, and 12 mm, 16 mm, and 20 mm were investigated. The width of all damages is 40 mm. The delamination damage length was increased from 0 mm to 20 mm. For a damage state, the data collection was completed and the delamination damage length was increased to perform the next round of the data collection. The schematic illustration of delamination damage is shown in Figure 7.
4.2. Signal Processing Based on Wavelet Packet Transform
The received signal always contains a lot of noise and interference. Preprocessing is required before the feature extraction. A trap filter was used to filter the noise of 50 Hz power frequency. An ideal band-pass filter was used to reduce the low-frequency and high-frequency interference. The cutoff frequencies were 50 kHz and 300 kHz, which contain the fundamental frequency, second-order and third-order harmonics’ components. The filtered signal was decomposed into a 32-frequency band through a 5-layer WPT with a db8 wavelet packet. The wavelet packet energy of each frequency band was calculated for the decomposed signal. The wavelet packet energy of undamaged pipe is shown in Figure 8.
The sampling rate is 20 MHz, and the Nyquist sampling frequency is 10 MHz. Each frequency band contains the information of 10/32 = 0.3125 MHz. From Figure 8, the wavelet packet energy of the first frequency band (0–312.5 kHz) is much higher than the other frequency bands. The wavelet packet energy of the first frequency band accounts for 95.79% of the total wavelet packet energy. The main information of a signal is contained in the first frequency band. Therefore, the wavelet packet decomposition coefficient that contains the feature frequency components is used to further the analysis.
4.3. Damage Evaluation Using Hilbert–Huang Transform
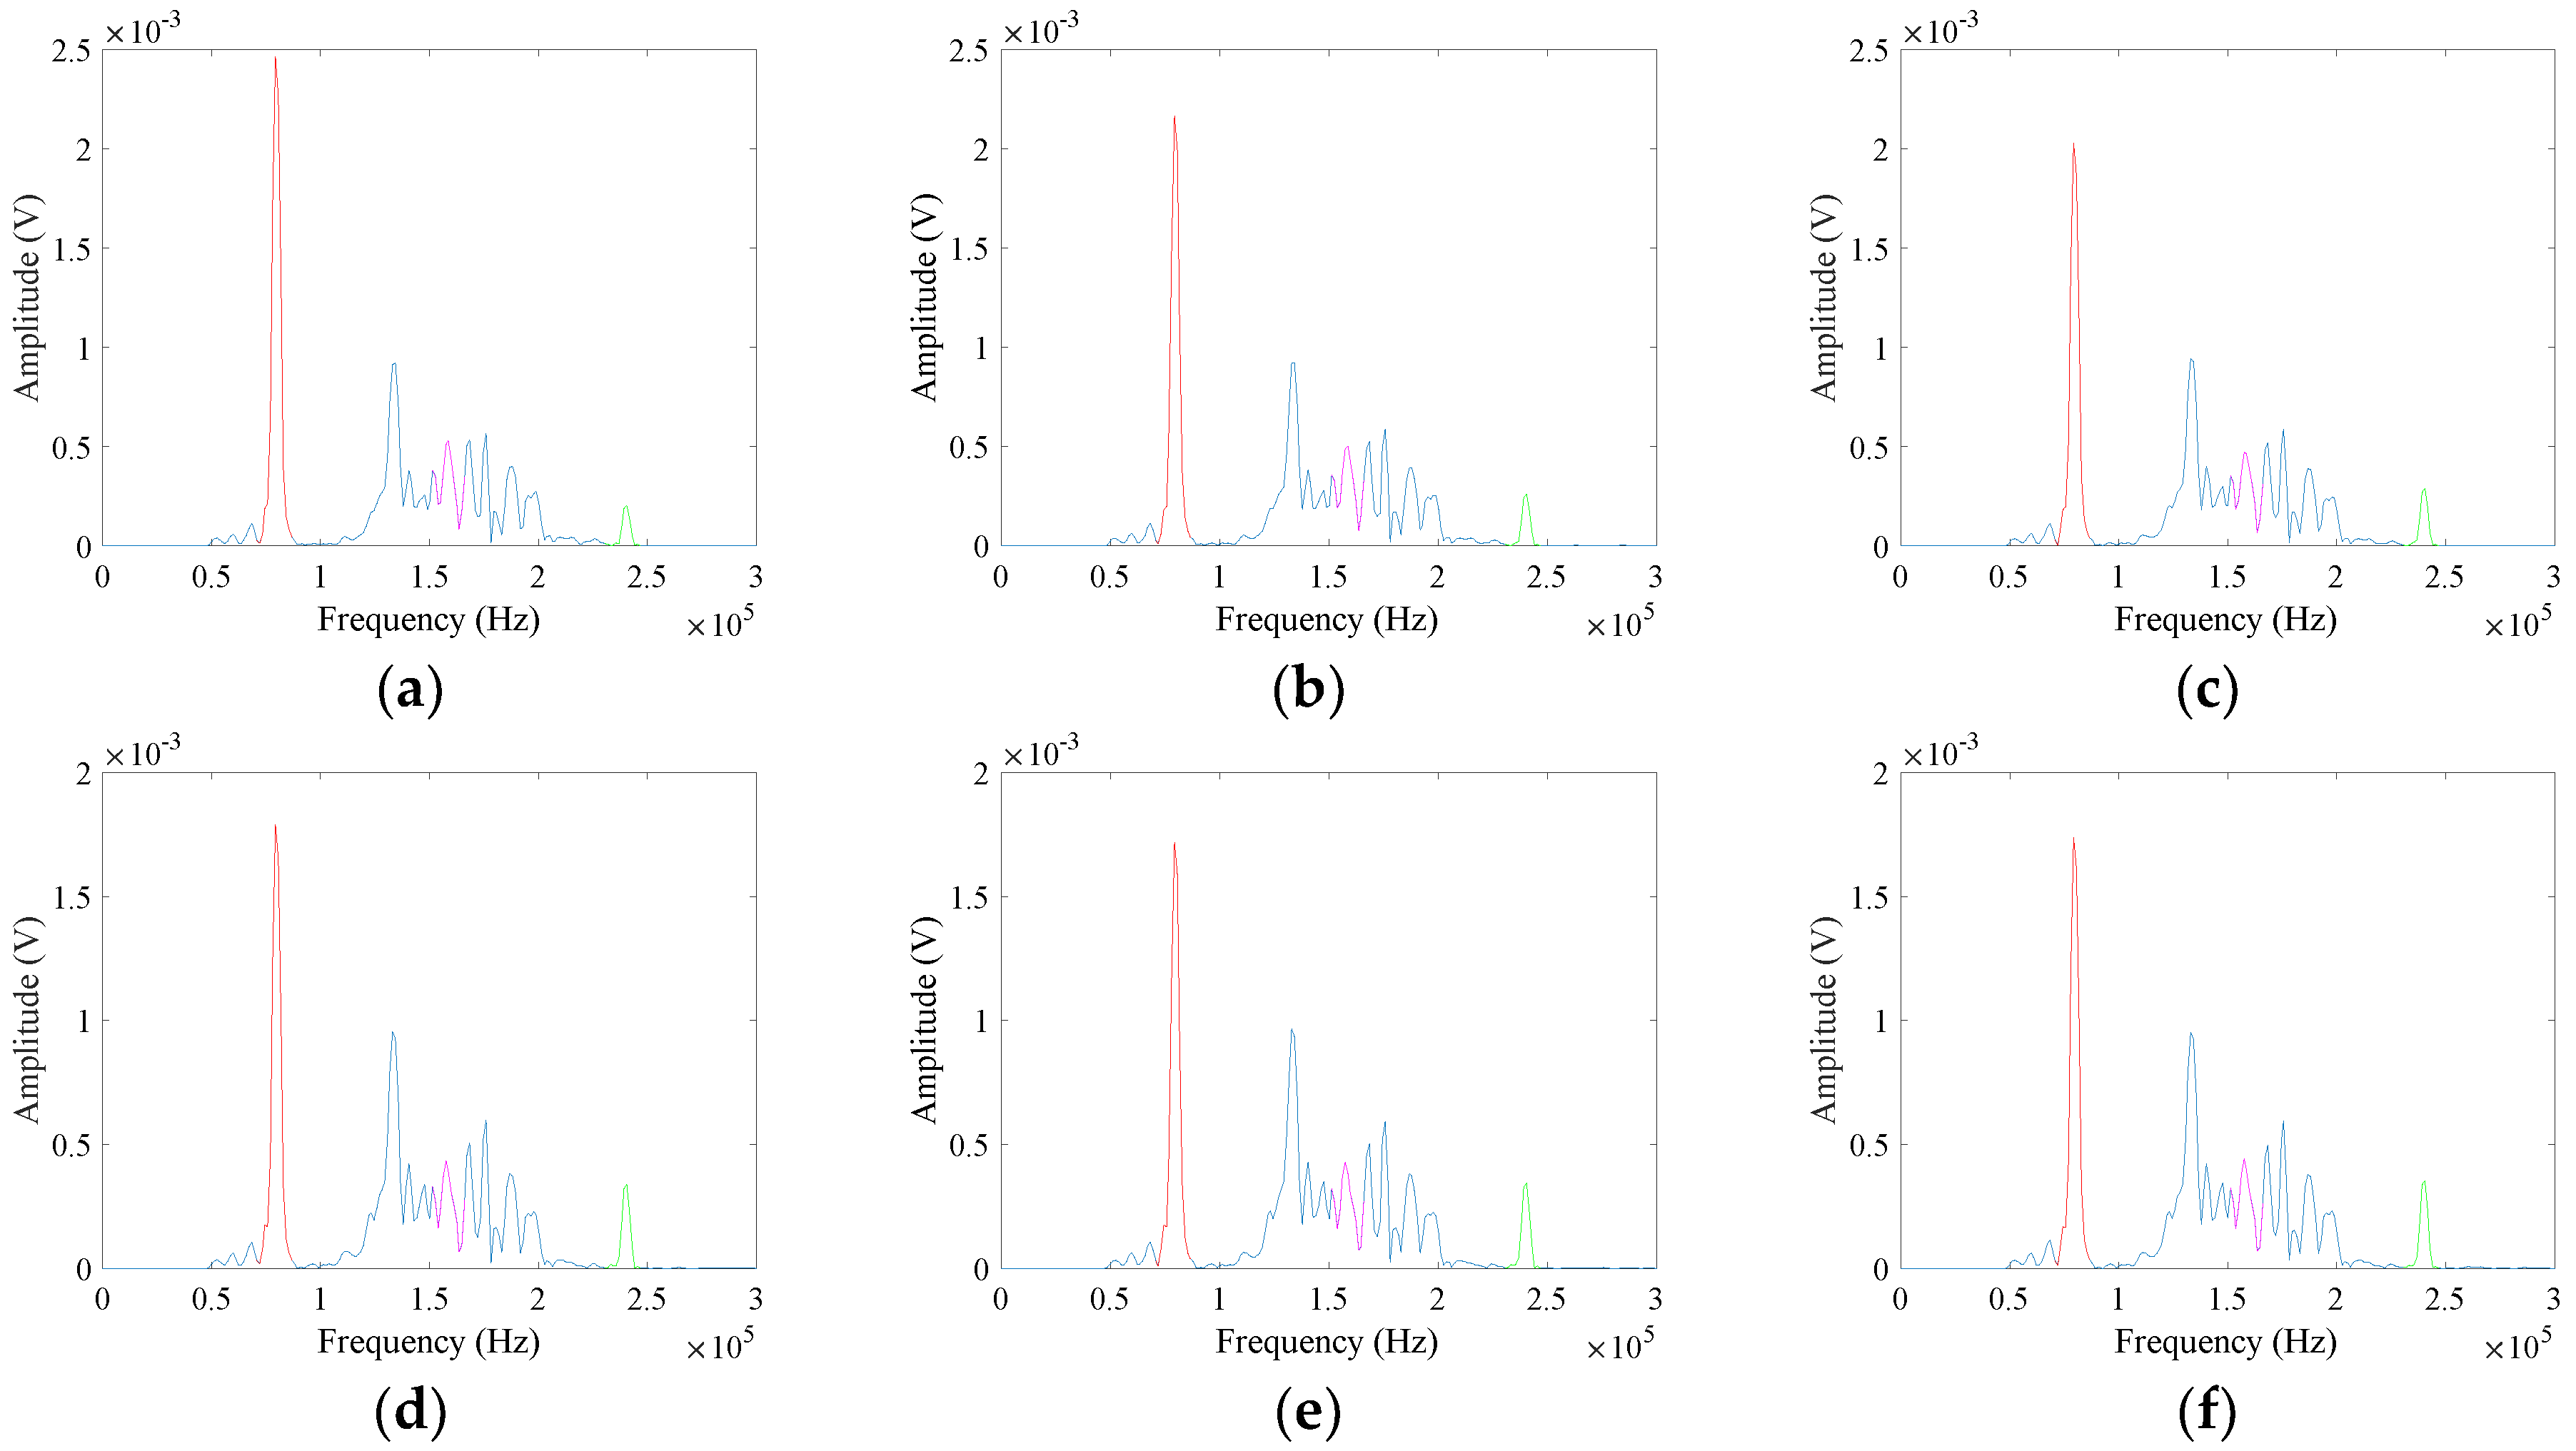
HHT, as a combination of EMD and HT, can be used for non-stationary signals to obtain the instantaneous frequency. The Hilbert marginal spectrum statistically represents the cumulative amplitude distribution of each frequency point. If there is energy of a certain frequency in the signal, it means that there must be a vibration wave of that frequency. In other words, the Hilbert marginal spectrum can reflect the actual frequency component of the signal more accurately. After the wavelet packet transform, HHT was applied to preprocessed signal. The IMFs of the EMD are shown in Figure 9. The signal was decomposed into six IMFs and residues. Then, HT was performed for each IMF and residue. The Hilbert marginal spectrum of different delamination damages was obtained by integrating Hilbert spectrum and is shown in Figure 10.
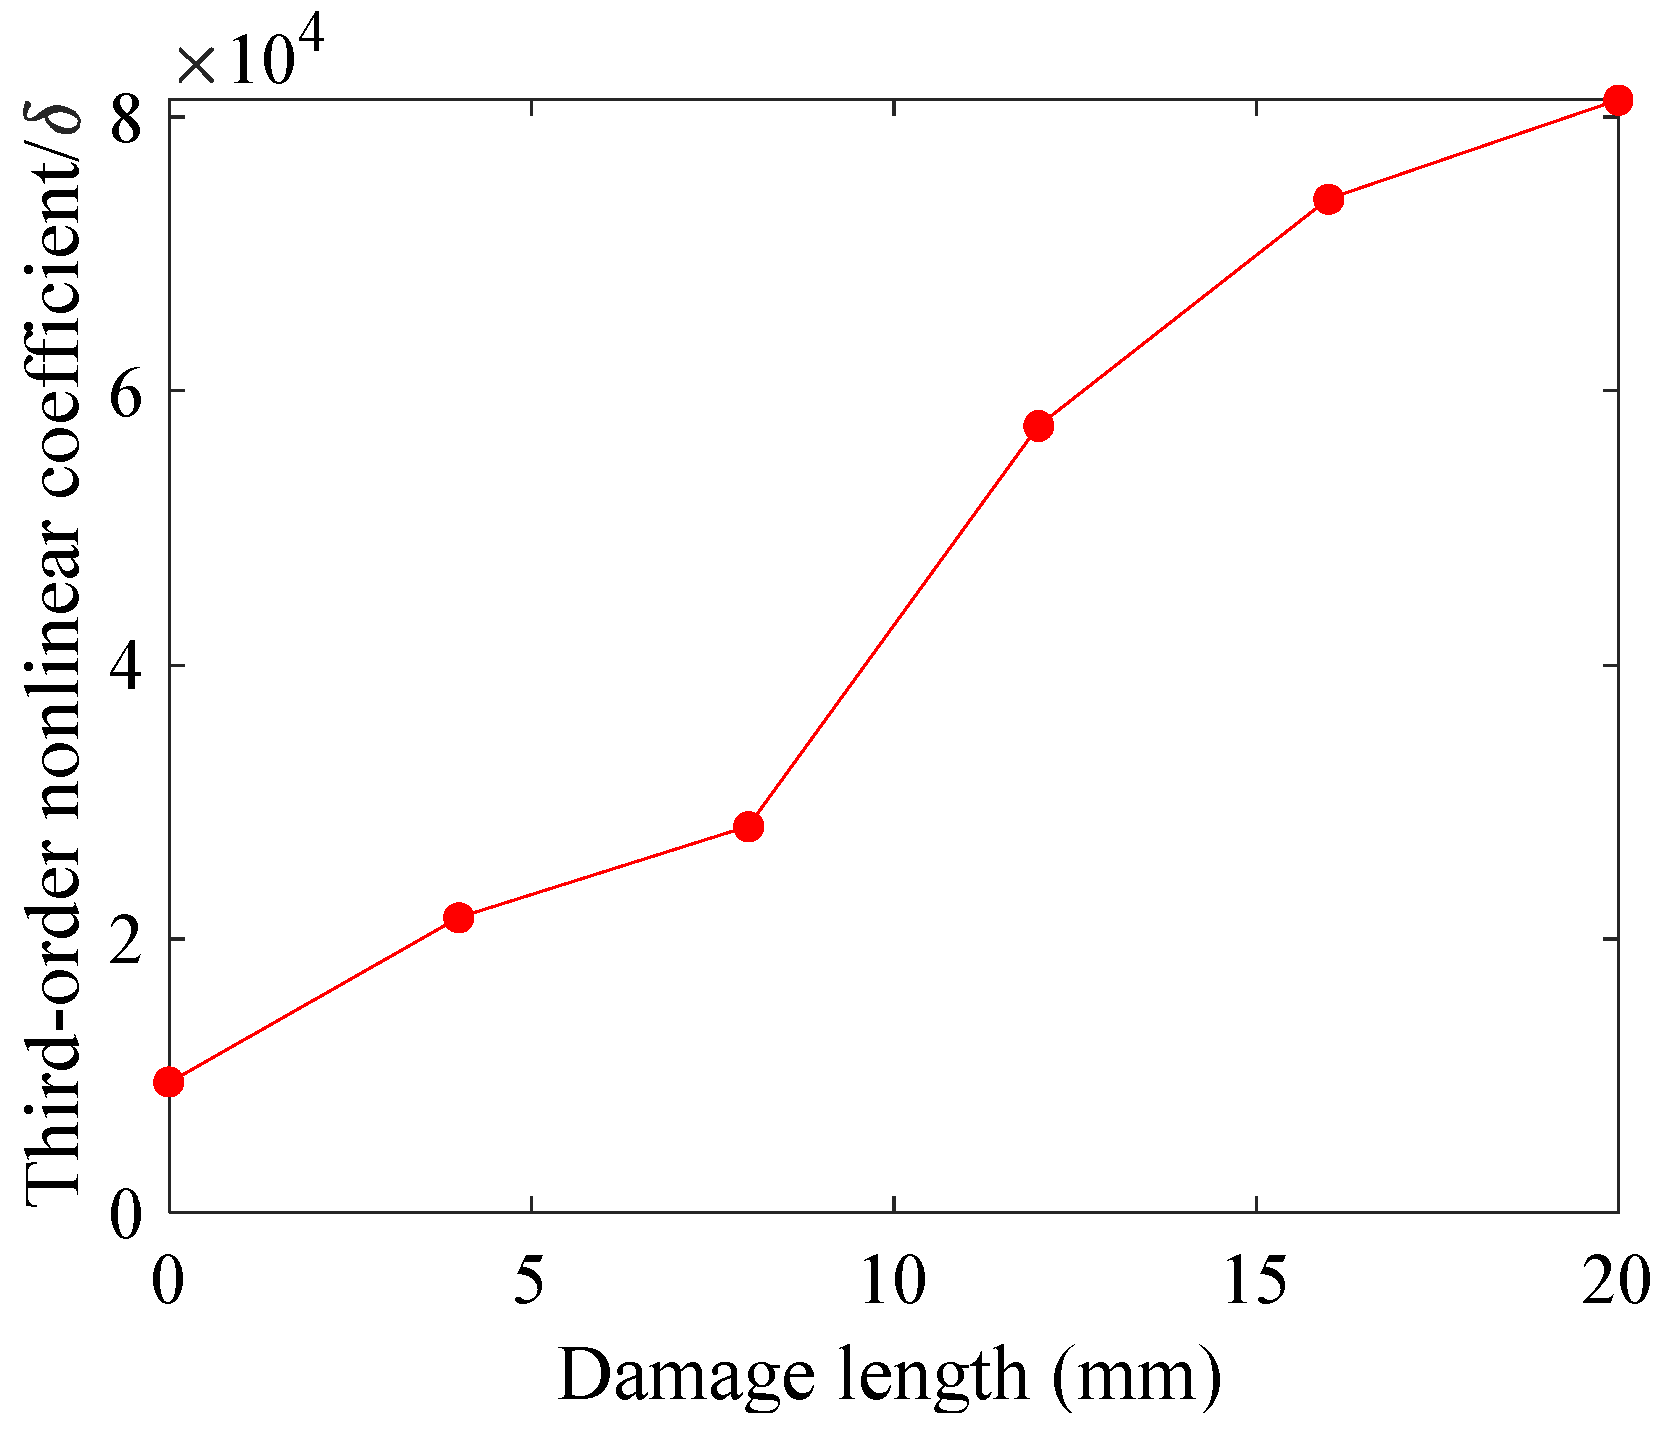
In Figure 10, the red, magenta and green lines represent the component of the fundamental frequency (80 kHz), the second-order harmonic (160 kHz) and the third-order harmonic (240 kHz). From Figure 10, the fundamental frequency is the main component of the signals. The amplitude of the fundamental frequency is the highest, and the second-order harmonic is obvious. The amplitude of the third-order harmonic is very smaller than fundamental frequency and second-order harmonic. The amplitude of the fundamental frequency decreased slightly with the increase of delamination damage. The change of the second-order harmonic amplitude is not obvious with the increase of delamination damage. The amplitude of the third-order increased slightly with the increase of delamination damage. In fact, with the increase of delamination damage, the nonlinear effect in the pipe increases. The energy released from the fundamental frequency to the higher-harmonics will increase. According to the obtained Hilbert marginal spectrum, the nonlinear coefficient was calculated. The changing curves of second-order and third-order nonlinear coefficients with the increase of delamination damage are shown in Figure 11 and Figure 12.
The variation trend of the second-order and third-order nonlinear coefficient is similar. When there is no delamination length, the second-order and third-order nonlinear coefficient were lowest. The nonlinear coefficient is increased greatly when the damage occurs, especially the second-order nonlinear coefficient. Then, with the increase of delamination damage, the second-order and third-order nonlinear coefficient are increased. The nonlinear coefficient increased with the delamination damage, which indicated that a nonlinear coefficient could describe the change of damage.
4.4. Validation of the Nonlinear Ultrasonic Harmonic Detection Method Based on HHT
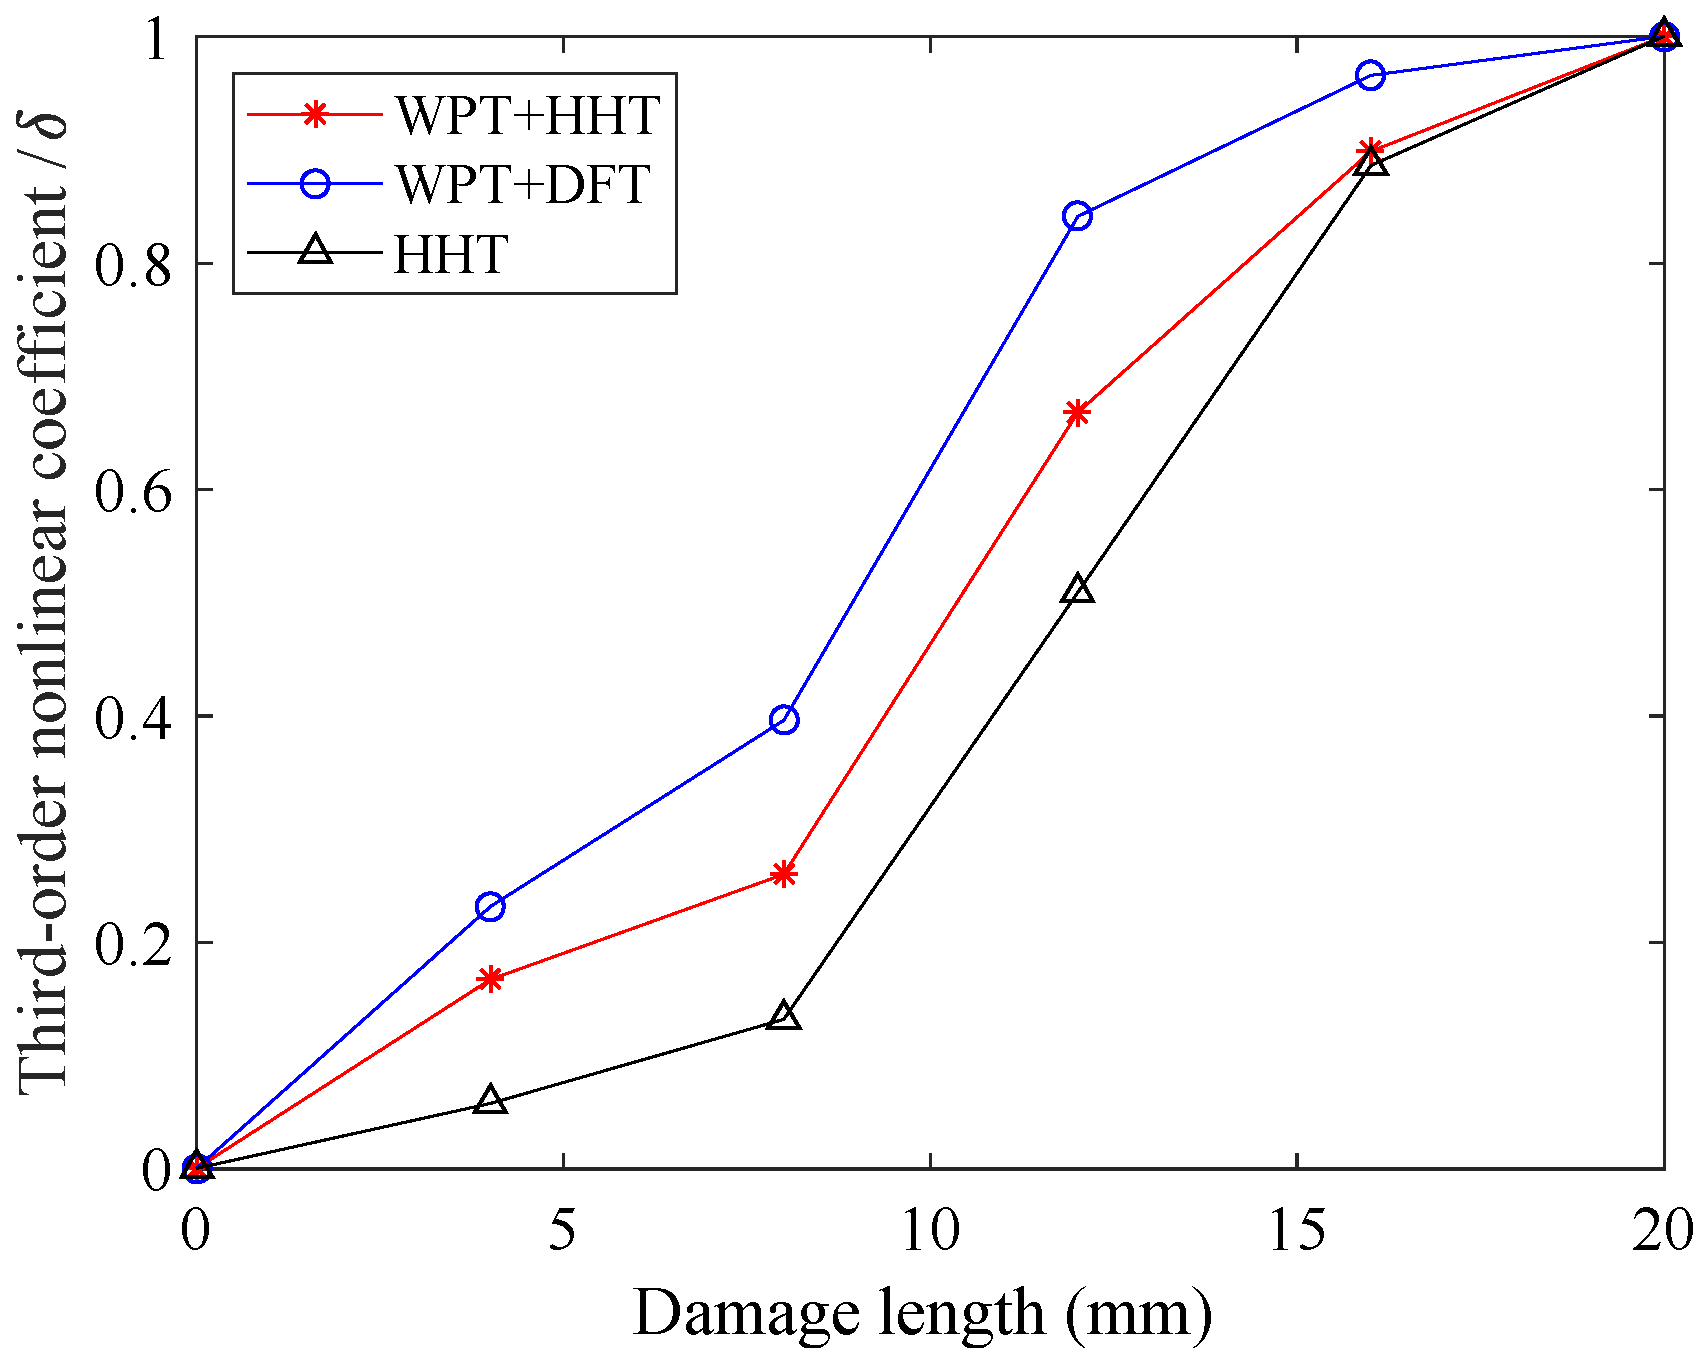
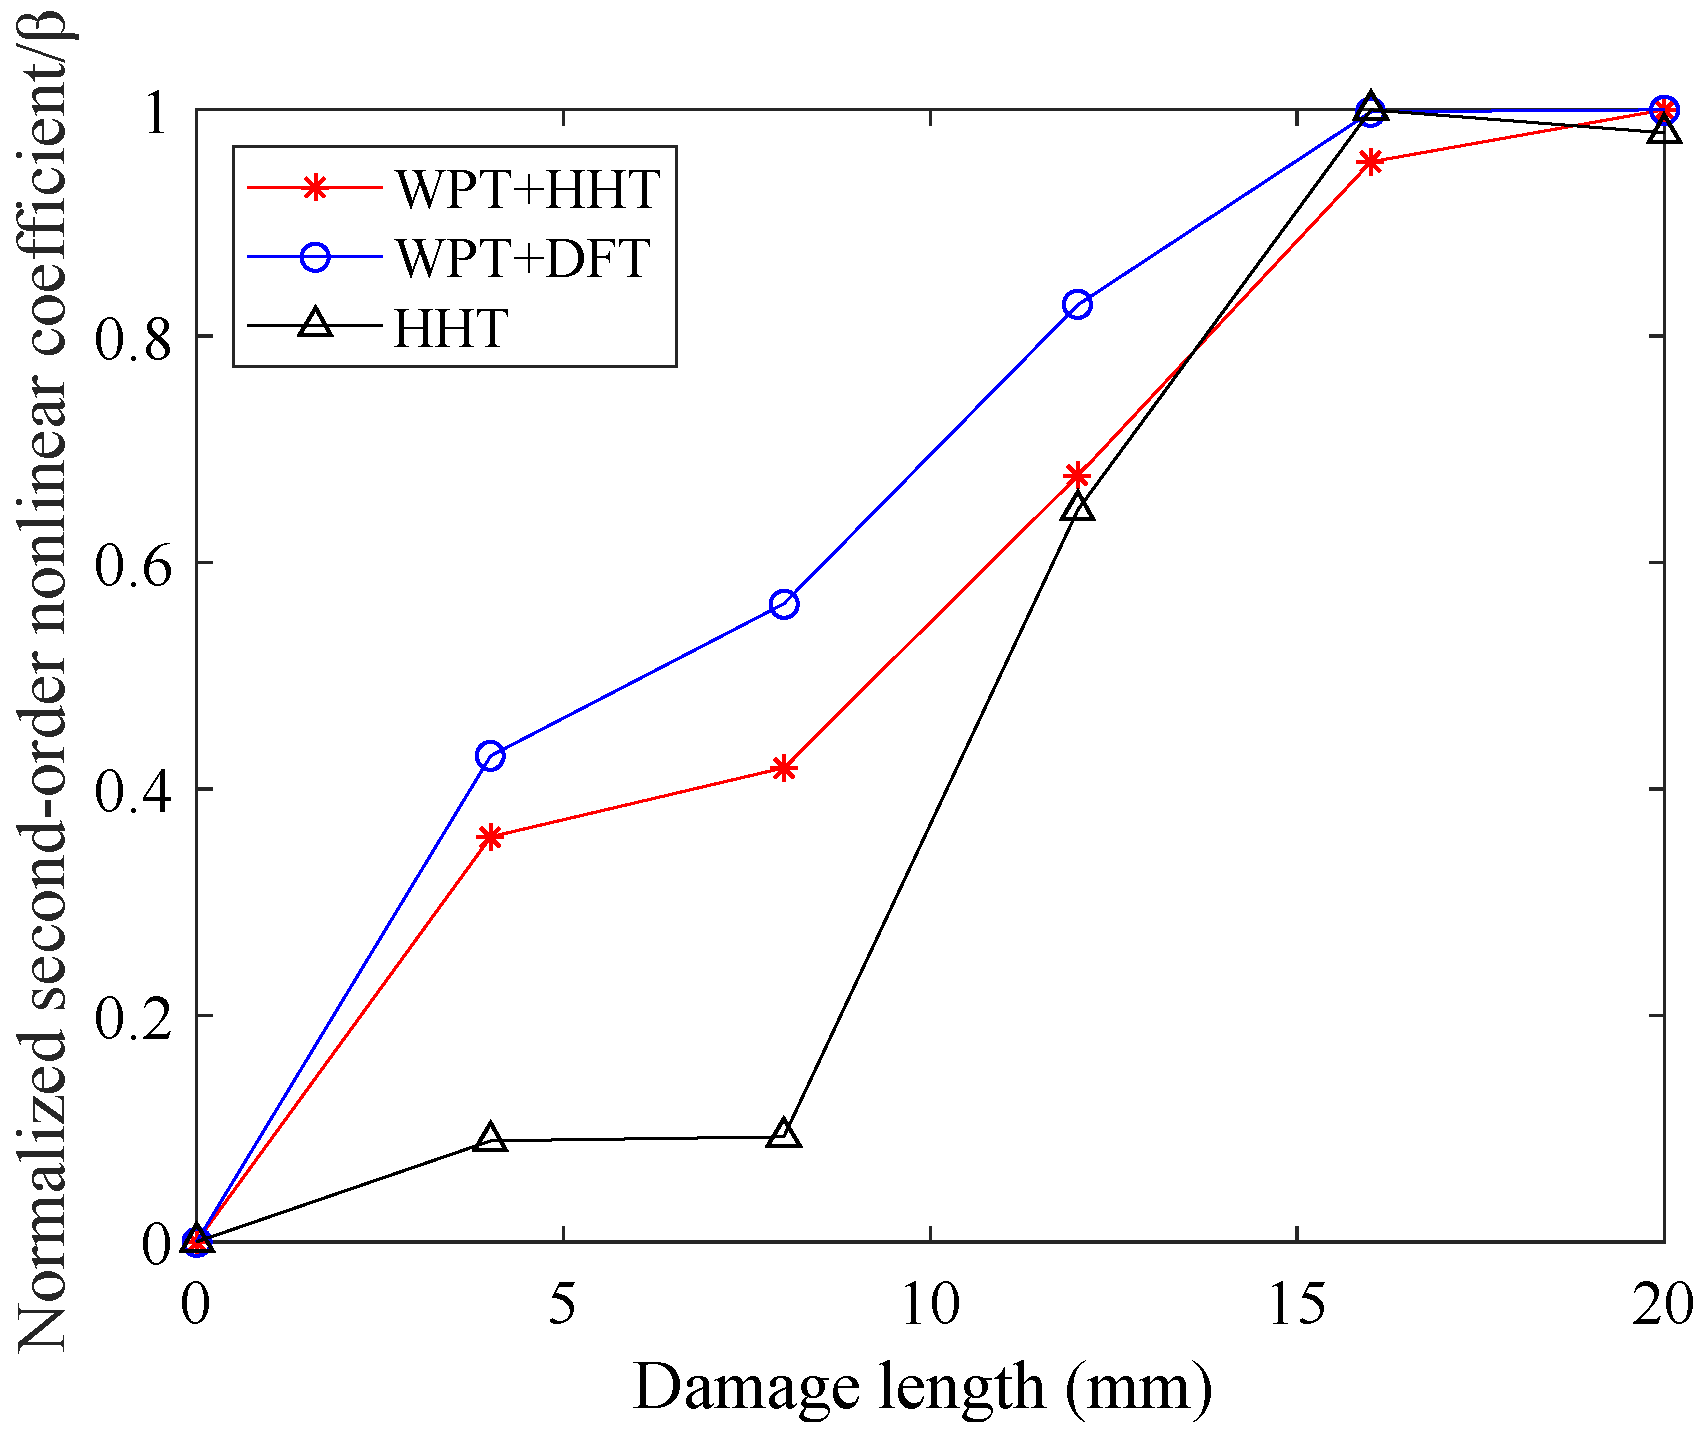
In the nonlinear ultrasonic detection method, WPT and HHT were used to process the signals. To verify the effectiveness of the method, a comparison of the processing process with or without WPT and HHT used was performed. The Discrete Fourier transform (DFT) was used to calculate the nonlinear coefficient for the signal processed by WPT only. The spectrum processed by WPT+DFT and HHT of different delamination damages are shown in Figure 13 and Figure 14. The amplitude of the fundamental frequency also decreased slightly with the increase of delamination damage. The amplitude of second-order harmonic is buried in the surrounding frequency component. The amplitude of the third-order harmonic that was processed by WPT+DFT has a growing trend with the increase of delamination damage. Because of the difference of the nonlinear coefficient obtained by different methods, the detection results were normalized by min-max normalization.
The changing curves of the normalized second-order and third-order nonlinear coefficient are shown in Figure 15 and Figure 16. The nonlinear coefficient resulted being increased with the delamination damage, except for the second-order nonlinear coefficient which was processed by HHT, had a negative growth at 16 mm. The second-order nonlinear coefficient which was processed by WPT+DFT grows evenly at first, but the second-order nonlinear coefficient of 16 mm and 20 mm is very close, which is difficult to distinguish. The growth rate of the second-order nonlinear coefficient that was processed by HHT is quite different, which is unfavorable to the characterization of the damage. The growth rate of the second-order nonlinear coefficient that was processed by WPT+HHT increased evenly compared to WPT+DFT and HHT. The growth rate of the third-order nonlinear coefficient that was processed in all three ways increased evenly. To further compare three processing methods, the mean squared error (MSE) was calculated. The MSE of three processing process is shown in Table 1. The MSE of a nonlinear coefficient that was processed by WPT+HHT was much less than WPT+DFT and HHT. The MSE of the third-order nonlinear coefficient is smaller than a second-order nonlinear coefficient. The result obtained by using WPT+HHT was found to be the best one.
5. Conclusions
In this paper, a nonlinear ultrasonic detection method is developed for delamination detection in lined anti-corrosion pipes. The effectiveness of the method is verified by the theories and experiments. When ultrasonic wave propagated in the pipes, higher-harmonics will be generated for the nonlinear effect that can be used for damage detection. The amplitude of the fundamental frequency is the highest and decreased slightly with the increase of delamination damage, which indicated the leakage of fundamental frequency energy. The amplitude of second-harmonic is much stronger than the third-order one. The nonlinear coefficient increased with the delamination damage. The nonlinear coefficient can be used to assess the delamination state of the lined anti-corrosion pipes. The wavelet packet energy has a good effect on noise reduction. It is verified that the marginal spectrum of HHT has a better detection result compared with DFT. In summary, the nonlinear coefficient can characterize the damage state, and the nonlinear ultrasonic harmonic method has the potential for damage detection for lined anti-corrosion pipes. This method lays a foundation for the nonlinear ultrasonic damage detection of lined anti-corrosion pipes.
Author Contributions
All authors have made a substantial contribution to this study. X.H. conceived and designed the method of this research. Y.L. contributed to the experiments, data analysis and the writing of the paper. X.L. contributed the writing of the paper. Z.L. and Z.H. provided a lot of useful advice and contributed the experiments.
Funding
This research was funded by the Guangdong Province Science and Technology project under Grant No. 2017B030305001 and No. 2017B010118002, Guangzhou Science and Technology project under Grant No. 201607010171, No. 201704020052 and No. 201802020031, General Administration Quality Supervision, Inspection and Quarantine of the People’s Republic of China Science and Technology project under Grant No. 2017QK064 and Foshan Science and Technology project under Grant No. 2016AG100255
Conflicts of Interest
The authors declare no conflict of interest.
References
- Martínez-Palou, R.; de Lourdes Mosqueira, M.; Zapata-Rendón, B.; Mar-Juárez, E.; Bernal-Huicochea, C.; de la Cruz Clavel-López, J.; Aburto, J. Transportation of heavy and extra-heavy crude oil by pipeline: A review. J. Pet. Sci. Eng. 2011, 75, 274–282. [Google Scholar] [CrossRef]
- Jiang, T.; Ren, L.; Jia, Z.; Li, D.; Li, H. Application of FBG based sensor in pipeline safety monitoring. Appl. Sci. 2017, 7, 540. [Google Scholar] [CrossRef]
- Ren, L.; Jia, Z.G.; Li, H.N.; Song, G. Design and experimental study on FBG hoop-strain sensor in pipeline monitoring. Opt. Fiber Technol. 2014, 20, 15–23. [Google Scholar] [CrossRef]
- Ramirez, S.; Carreon, H.; Carreon, M.; Salazar, M.; Bejar, L.; Medina, A. Study of the Precipitation Process in Aging Steel Pipeline Weldments by Thermoelectric Power Means. Appl. Sci. 2018, 8, 1489. [Google Scholar] [CrossRef]
- Jardin, A.; Liu, S.; Pavone, D.; Cocault-Duverger, V. Study on Corrosion Resistant Alloy Lined Pipe Delamination. In The 28th International Ocean and Polar Engineering Conference, Sapporo, Japan, 10–15 June 2018; International Society of Offshore and Polar Engineers: Sapporo, Japan, 2018. [Google Scholar]
- Lam, P.M.; Lau, K.T.; Ling, H.Y.; Su, Z.; Tam, H.Y. Acousto-ultrasonic sensing for delaminated GFRP composites using an embedded FBG sensor. Opt. Lasers Eng. 2009, 47, 1049–1055. [Google Scholar] [CrossRef]
- Watson, C.; Low, G. System for testing liners. U.S. Patent Application No. 20040211245, 28 October 2004. [Google Scholar]
- Barnes, S. Pipe Lining Leak Testing Methods and Apparatus. U.S. Patent Application No. 20180231168, 16 August 2018. [Google Scholar]
- Bagavathiappan, S.; Lahiri, B.B.; Saravanan, T.; Philip, J.; Jayakumar, T. Infrared thermography for condition monitoring—A review. Infrared Phy. Technol. 2013, 60, 35–55. [Google Scholar] [CrossRef]
- Cotič, P.; Kolarič, D.; Bosiljkov, V.B.; Bosiljkov, V.; Jagličić, Z. Determination of the applicability and limits of void and delamination detection in concrete structures using infrared thermography. NDT E Int. 2015, 74, 87–93. [Google Scholar] [CrossRef]
- Ellenberg, A.; Kontsos, A.; Moon, F.; Bartoli, I. Bridge Deck delamination identification from unmanned aerial vehicle infrared imagery. Autom. Constr. 2016, 72, 155–165. [Google Scholar] [CrossRef]
- Zhao, X.; Li, W.; Song, G.; Zhu, Z.; Du, J. Scour monitoring system for subsea pipeline based on active thermometry: Numerical and experimental studies. Sensors 2013, 13, 1490–1509. [Google Scholar] [CrossRef] [PubMed]
- Zhao, X.; Li, W.; Zhou, L.; Song, G.; Ba, Q.; Ho, S.C.M.; Ou, J. Application of support vector machine for pattern classification of active thermometry-based pipeline scour monitoring. Struct. Control Health Monit. 2015, 22, 903–918. [Google Scholar] [CrossRef]
- Zhao, X.; Li, W.; Zhou, L.; Song, G.B.; Ba, Q.; Ou, J. Active thermometry based DS18B20 temperature sensor network for offshore pipeline scour monitoring using K-means clustering algorithm. Int. J. Distrib. Sens. Netw. 2013, 9, 852090. [Google Scholar] [CrossRef]
- Tuli, S.; Mulaveesala, R. Defect detection by pulse compression in frequency modulated thermal wave imaging. Quantit. InfraRed Thermogr. J. 2005, 2, 41–54. [Google Scholar] [CrossRef]
- Mulaveesala, R.; Tuli, S. Theory of frequency modulated thermal wave imaging for nondestructive subsurface defect detection. Appl. Phys. Lett. 2006, 89, 191913. [Google Scholar] [CrossRef]
- Laureti, S.; Sfarra, S.; Malekmohammadi, H.; Burrascano, P.; Hutchins, D.A.; Senni, L.; Maldague, X.P.V.; Ricci, M. The use of pulse-compression thermography for detecting defects in paintings. NDT E Int. 2018, 98, 147–154. [Google Scholar] [CrossRef]
- Laureti, S.; Silipigni, G.; Senni, L.; Tomasello, R.; Burrascano, P.; Ricci, M. Comparative study between linear and non-linear frequency-modulated pulse-compression thermography. Appl. Opt. 2018, 57, D32–D39. [Google Scholar] [CrossRef] [PubMed]
- Benammar, A.; Drai, R.; Guessoum, A. Detection of delamination defects in CFRP materials using ultrasonic signal processing. Ultrasonics 2008, 48, 731–738. [Google Scholar] [CrossRef] [PubMed]
- Karabutov, A.A.; Podymova, N.B. Quantitative analysis of the influence of voids and delaminations on acoustic attenuation in CFRP composites by the laser-ultrasonic spectroscopy method. Compos. Part B Eng. 2014, 56, 238–244. [Google Scholar] [CrossRef]
- Park, B.; An, Y.K.; Sohn, H. Visualization of hidden delamination and debonding in composites through noncontact laser ultrasonic scanning. Compos. Sci. Technol. 2014, 100, 10–18. [Google Scholar] [CrossRef]
- Na, W.B.; Kundu, T.; Ehsani, M.R. Lamb waves for detecting delamination between steel bars and concrete. Comput.-Aided Civ. Infrastruct. Eng. 2003, 18, 58–63. [Google Scholar] [CrossRef]
- Bingham, J.; Hinders, M. Lamb wave detection of delaminations in large diameter pipe coatings. Open Acoust. J. 2009, 2, 75–86. [Google Scholar] [CrossRef]
- Chillara, V.K.; Lissenden, C.J. Review of nonlinear ultrasonic guided wave nondestructive evaluation: Theory, numerics, and experiments. Opt. Eng. 2015, 55, 011002. [Google Scholar] [CrossRef]
- Jiao, J.; Sun, J.; Wu, B.; He, C. A frequency-mixing nonlinear ultrasonic technique for micro-crack detection. Acta Acust. 2013, 6, 002. [Google Scholar]
- Hirsekorn, S.; Rabe, U.; Arnold, W. Characterization and evaluation of composite laminates by nonlinear ultrasonic transmission measurements. In Proceedings of the European Conference on NDT (ECNDT), Berlin, Germany, 25–29 September 2006. [Google Scholar]
- Delrue, S.; Van Den Abeele, K. Three-dimensional finite element simulation of closed delaminations in composite materials. Ultrasonics 2012, 52, 315–324. [Google Scholar] [CrossRef] [PubMed]
- Mandal, D.D.; Wadadar, D.; Banerjee, S. Health Monitoring of Stiffened Metallic Plates Using Nonlinear Wave Interaction and Embedded PZT Transducers. In Vibration Engineering and Technology of Machinery, Proceeding of Mechanisms and Machine Science, 15 August 2015; Sinha, J.K., Ed.; Springer: Cham, Switzerland, 2015. [Google Scholar]
- Yelve, N.P.; Mitra, M.; Mujumdar, P.M. Higher harmonics induced in Lamb wave due to partial debonding of piezoelectric wafer transducers. NDT E Int. 2014, 63, 21–27. [Google Scholar] [CrossRef]
- Hong, X.; Liu, Y.; Lin, P.; Xu, W. Interfacial Adhesion–Strength Detection of Structural Silicone Sealant for Hidden Frame–Supported Glass Curtain Wall Based on Nonlinear Ultrasonic Lamb Wave. J. Aerosp. Eng. 2018, 31, 04018047. [Google Scholar] [CrossRef]
- Hong, X.; Liu, Y.; Liufu, Y.; Lin, P. Debonding Detection in Hidden Frame Supported Glass Curtain Walls Using the Nonlinear Ultrasonic Modulation Method with Piezoceramic Transducers. Sensors 2018, 18, 2094. [Google Scholar] [CrossRef] [PubMed]
- Hong, X.; Lin, X.; Yang, B.; Li, M. Crack detection in plastic pipe using piezoelectric transducers based on nonlinear ultrasonic modulation. Smart Mater. Struct. 2017, 26, 104012. [Google Scholar] [CrossRef] [Green Version]
- Park, G.; Farrar, C.R.; di Scalea, F.L.; Coccia, S. Performance assessment and validation of piezoelectric active-sensors in structural health monitoring. Smart Mater. Struct. 2006, 15, 1673. [Google Scholar] [CrossRef]
- Kong, Q.; Robert, R.H.; Silva, P.; Mo, Y.L. Cyclic crack monitoring of a reinforced concrete column under simulated pseudo-dynamic loading using piezoceramic-based smart aggregates. Appl. Sci. 2016, 6, 341. [Google Scholar] [CrossRef]
- Yin, H.; Wang, T.; Yang, D.; Liu, S.; Shao, J.; Li, Y. A smart washer for bolt looseness monitoring based on piezoelectric active sensing method. Appl. Sci. 2016, 6, 320. [Google Scholar] [CrossRef]
- Hong, X.; Zhou, J.; Huang, G.; Ni, L. Synergetic damage recognition approach for messenger wire in icing environment using piezoceramic transducers. Measurement 2018, 122, 522–531. [Google Scholar] [CrossRef]
- Xiaobin, H.; Jianxi, Z.; Peisong, L.; Guojian, H. An imaging method for the covered damage region of strand wire based on dual time reversal using piezoceramic transducers. Smart Mater. Struct. 2017, 26, 104005. [Google Scholar] [CrossRef] [Green Version]
- Yang, Y.; Divsholi, B.S.; Soh, C.K. A reusable PZT transducer for monitoring initial hydration and structural health of concrete. Sensors 2010, 10, 5193–5208. [Google Scholar] [CrossRef] [PubMed]
- Luo, M.; Li, W.; Hei, C.; Song, G. Concrete infill monitoring in concrete-filled FRP tubes using a PZT-based ultrasonic time-of-flight method. Sensors 2016, 16, 2083. [Google Scholar] [CrossRef] [PubMed]
- Parvasi, S.M.; Ho, S.C.M.; Kong, Q.; Mousavi, R.; Song, G. Real time bolt preload monitoring using piezoceramic transducers and time reversal technique—A numerical study with experimental verification. Smart Mater. Struct. 2016, 25, 085015. [Google Scholar] [CrossRef]
- Huo, L.; Wang, B.; Chen, D.; Song, G. Monitoring of pre-load on rock bolt using piezoceramic-transducer enabled time reversal method. Sensors 2017, 17, 2467. [Google Scholar] [CrossRef] [PubMed]
- Zhu, J.; Ren, L.; Ho, S.C.; Jia, Z.; Song, G. Gas pipeline leakage detection based on PZT sensors. Smart Mater. Struct. 2017, 26, 025022. [Google Scholar] [CrossRef]
- Lee, S.J.; Sohn, H.; Hong, J.W. Time reversal based piezoelectric transducer self-diagnosis under varying temperature. J. Nondestruct. Eval. 2010, 29, 75–91. [Google Scholar] [CrossRef]
- Xu, B.; Li, B.; Song, G. Active debonding detection for large rectangular CFSTs based on wavelet packet energy spectrum with piezoceramics. J. Struct. Eng. 2012, 139, 1435–1443. [Google Scholar] [CrossRef]
- Jiang, T.; Kong, Q.; Wang, W.; Huo, L.; Song, G. Monitoring of grouting compactness in a post-tensioning tendon duct using piezoceramic transducers. Sensors 2016, 16, 1343. [Google Scholar] [CrossRef] [PubMed]
- Wu, F.; Chang, F.K. Debond detection using embedded piezoelectric elements in reinforced concrete structures-part I: Experiment. Struct. Health Monit. 2006, 5, 5–15. [Google Scholar] [CrossRef]
- Zeng, L.; Parvasi, S.M.; Kong, Q.; Huo, L.; Li, M.; Song, G. Bond slip detection of concrete-encased composite structure using shear wave based active sensing approach. Smart Mater. Struct. 2015, 24, 125026. [Google Scholar] [CrossRef]
- Xu, B.; Zhang, T.; Song, G.; Gu, H. Active interface debonding detection of a concrete-filled steel tube with piezoelectric technologies using wavelet packet analysis. Mech. Syst. Signal Process. 2013, 36, 7–17. [Google Scholar] [CrossRef]
- Jiang, T.; Kong, Q.; Patil, D.; Luo, Z.; Huo, L.; Song, G. Detection of debonding between fiber reinforced polymer bar and concrete structure using piezoceramic transducers and wavelet packet analysis. IEEE Sens. J. 2017, 17, 1992–1998. [Google Scholar] [CrossRef]
- Okafor, A.C.; Chandrashekhara, K.; Jiang, Y.P. Delamination prediction in composite beams with built-in piezoelectric devices using modal analysis and neural network. Smart Mater. Struct. 1996, 5, 338. [Google Scholar] [CrossRef]
- Hamey, C.S.; Lestari, W.; Qiao, P.; Song, G. Experimental damage identification of carbon/epoxy composite beams using curvature mode shapes. Struct. Health Monit. 2004, 3, 333–353. [Google Scholar] [CrossRef]
- Sohn, H.; Park, G.; Wait, J.R.; Limback, N.P.; Farrar, C.R. Wavelet-based active sensing for delamination detection in composite structures. Smart Mater. Struct. 2003, 13, 153. [Google Scholar] [CrossRef]
- Li, Z.; Liu, B.; Li, L.; Sun, D. Life prediction of relay based on wavelet packet transform and rbf neural network. Trans. China Electrotech. Soc. 2015, 30, 233–240. [Google Scholar]
- Hou, Q.; Ren, L.; Jiao, W.; Zou, P.; Song, G. An improved negative pressure wave method for natural gas pipeline leak location using FBG based strain sensor and wavelet transform. Math. Probl. Eng. 2013. [Google Scholar] [CrossRef]
- Du, G.; Kong, Q.; Zhou, H.; Gu, H. Multiple cracks detection in pipeline using damage index matrix based on piezoceramic transducer-enabled stress wave propagation. Sensors 2017, 17, 1812. [Google Scholar] [CrossRef] [PubMed]
- Du, G.; Kong, Q.; Lai, T.; Song, G. Feasibility study on crack detection of pipelines using piezoceramic transducers. Int. J. Distrib. Sens. Netw. 2013, 9, 631715. [Google Scholar] [CrossRef]
- Huang, N.E.; Shen, Z.; Long, S.R.; Wu, M.C.; Shih, H.H.; Zheng, Q.; Yen, N.-C.; Tung, C.C.; Liu, H.H. The empirical mode decomposition and the hilbert spectrum for nonlinear and non-stationary time series analysis. Proc. Math. Phys. Eng. Sci. 1998, 454, 903–995. [Google Scholar] [CrossRef]
- Lu, Y.; Oruklu, E.; Saniie, J. Application of Hilbert-Huang transform for ultrasonic nondestructive evaluation. In Proceedings of the 2008 IEEE Ultrasonics Symposium, Beijing, China, 2–5 November 2008; pp. 1499–1502. [Google Scholar]
- Pai, P.F.; Wen, B.; Naser, A.S.; Schulz, M.J. Structural vibration control using PZT patches and non-linear phenomena. J. Sound Vib. 1998, 215, 273–296. [Google Scholar] [CrossRef]
- Song, G.; Qiao, P.Z.; Binienda, W.K.; Zou, G.P. Active vibration damping of composite beam using smart sensors and actuators. J. Aerosp. Eng. 2002, 15, 97–103. [Google Scholar] [CrossRef]
- Soh, C.K.; Tseng, K.K.; Bhalla, S.; Gupta, A. Performance of smart piezoceramic patches in health monitoring of a RC bridge. Smart Mater. Struct. 2000, 9, 533. [Google Scholar] [CrossRef]
- Huo, L.; Wang, F.; Li, H.; Song, G. A fractal contact theory based model for bolted connection looseness monitoring using piezoceramic transducers. Smart Mater. Struct. 2017, 26, 104010. [Google Scholar] [CrossRef]
- Park, S.; Yun, C.B.; Roh, Y.; Lee, J.J. Health monitoring of steel structures using impedance of thickness modes at PZT patches. Smart Struct. Syst. 2005, 1, 339–353. [Google Scholar] [CrossRef]
- Wang, F.; Huo, L.; Song, G. A piezoelectric active sensing method for quantitative monitoring of bolt loosening using energy dissipation caused by tangential damping based on the fractal contact theory. Smart Mater. Struct. 2017, 27, 015023. [Google Scholar] [CrossRef] [Green Version]
- Feng, Q.; Kong, Q.; Jiang, J.; Liang, Y.; Song, G. Detection of Interfacial Debonding in a Rubber–Steel-Layered Structure Using Active Sensing Enabled by Embedded Piezoceramic Transducers. Sensors 2017, 17, 2001. [Google Scholar] [CrossRef] [PubMed]
- Wang, T.; Song, G.; Liu, S.; Li, Y.; Xiao, H. Review of bolted connection monitoring. Int. J. Distrib. Sens. Netw. 2013, 9, 871213. [Google Scholar] [CrossRef]
- Wang, T.; Song, G.; Wang, Z.; Li, Y. Proof-of-concept study of monitoring bolt connection status using a piezoelectric based active sensing method. Smart Mater. Struct. 2013, 22, 087001. [Google Scholar] [CrossRef]
- Wang, F.; Ho, S.C.M.; Huo, L.; Song, G. A Novel Fractal Contact-Electromechanical Impedance Model for Quantitative Monitoring of Bolted Joint Looseness. IEEE Access 2018, 6, 40212–40220. [Google Scholar] [CrossRef]
- Shao, J.; Wang, T.; Yin, H.; Yang, D.; Li, Y. Bolt looseness detection based on piezoelectric impedance frequency shift. Appl. Sci. 2016, 6, 298. [Google Scholar] [CrossRef]
Figure 1.
Schematic illustration of a nonlinear ultrasonic method for anti-corrosion pipes.
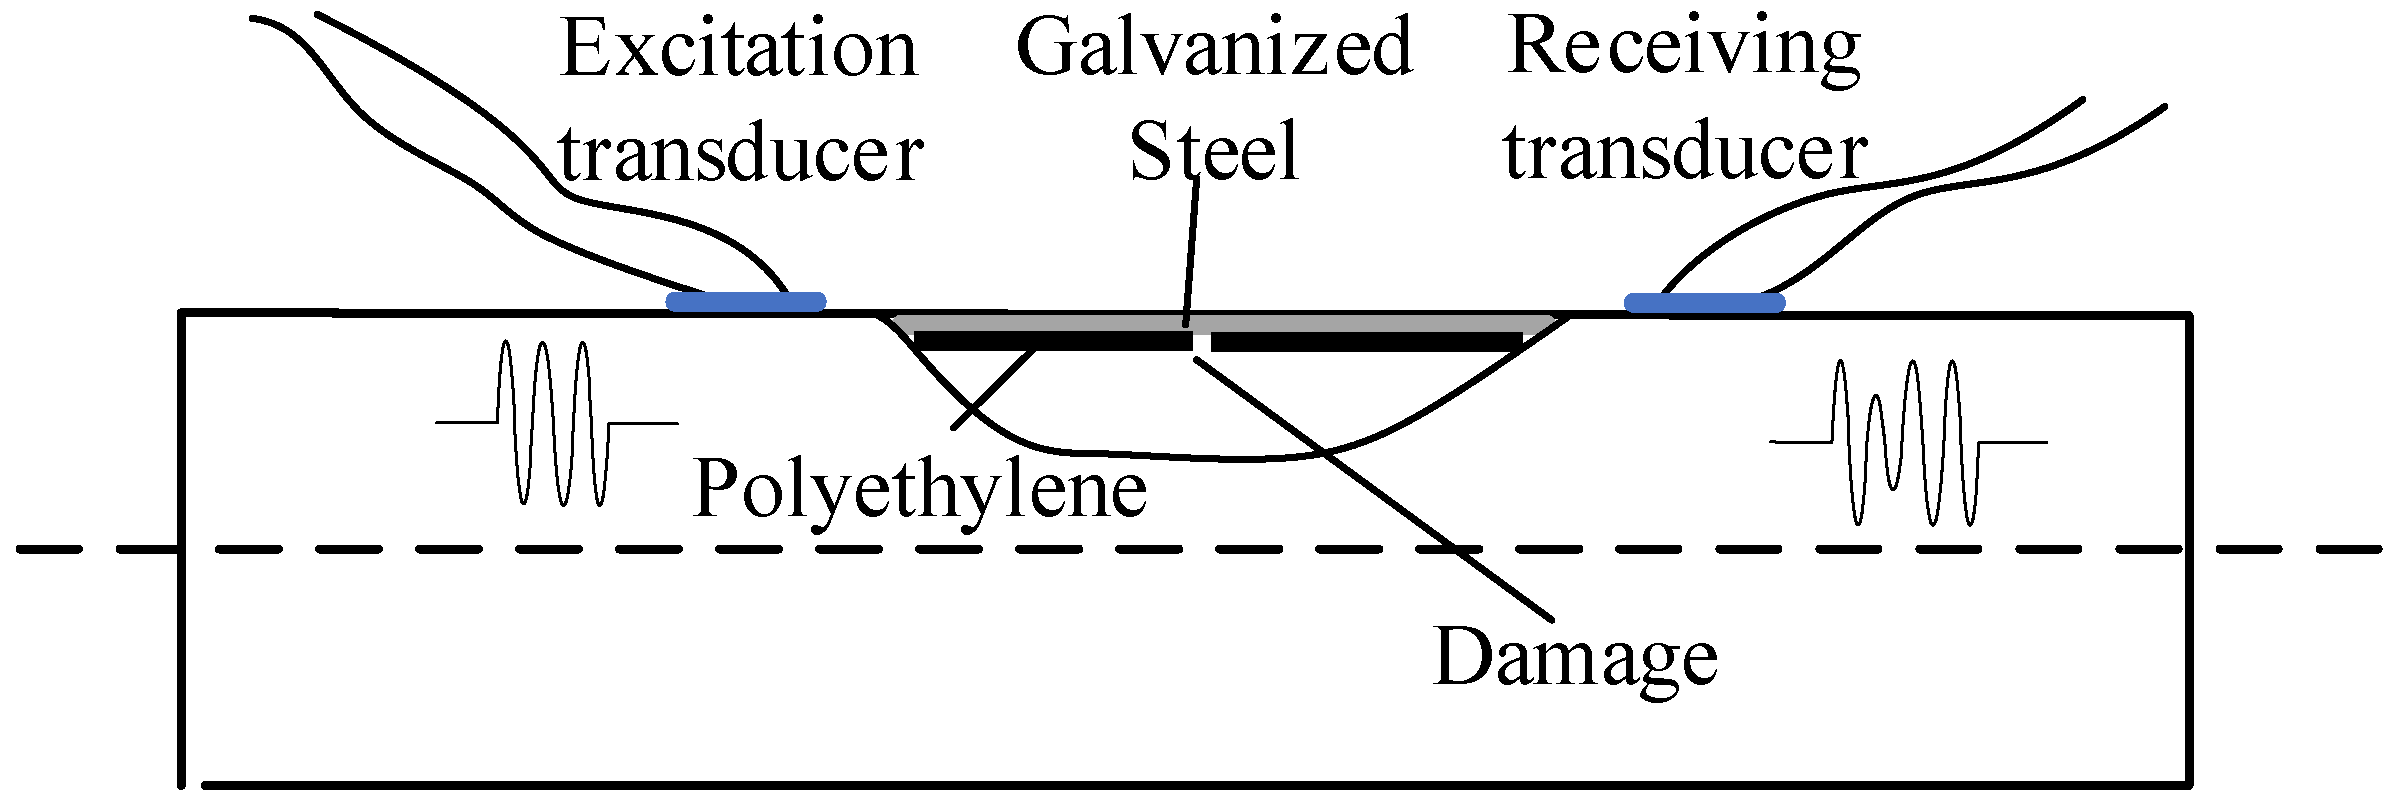
Figure 2.
The schematic illustration of the evaluation process for lined anti-corrosion pipes.
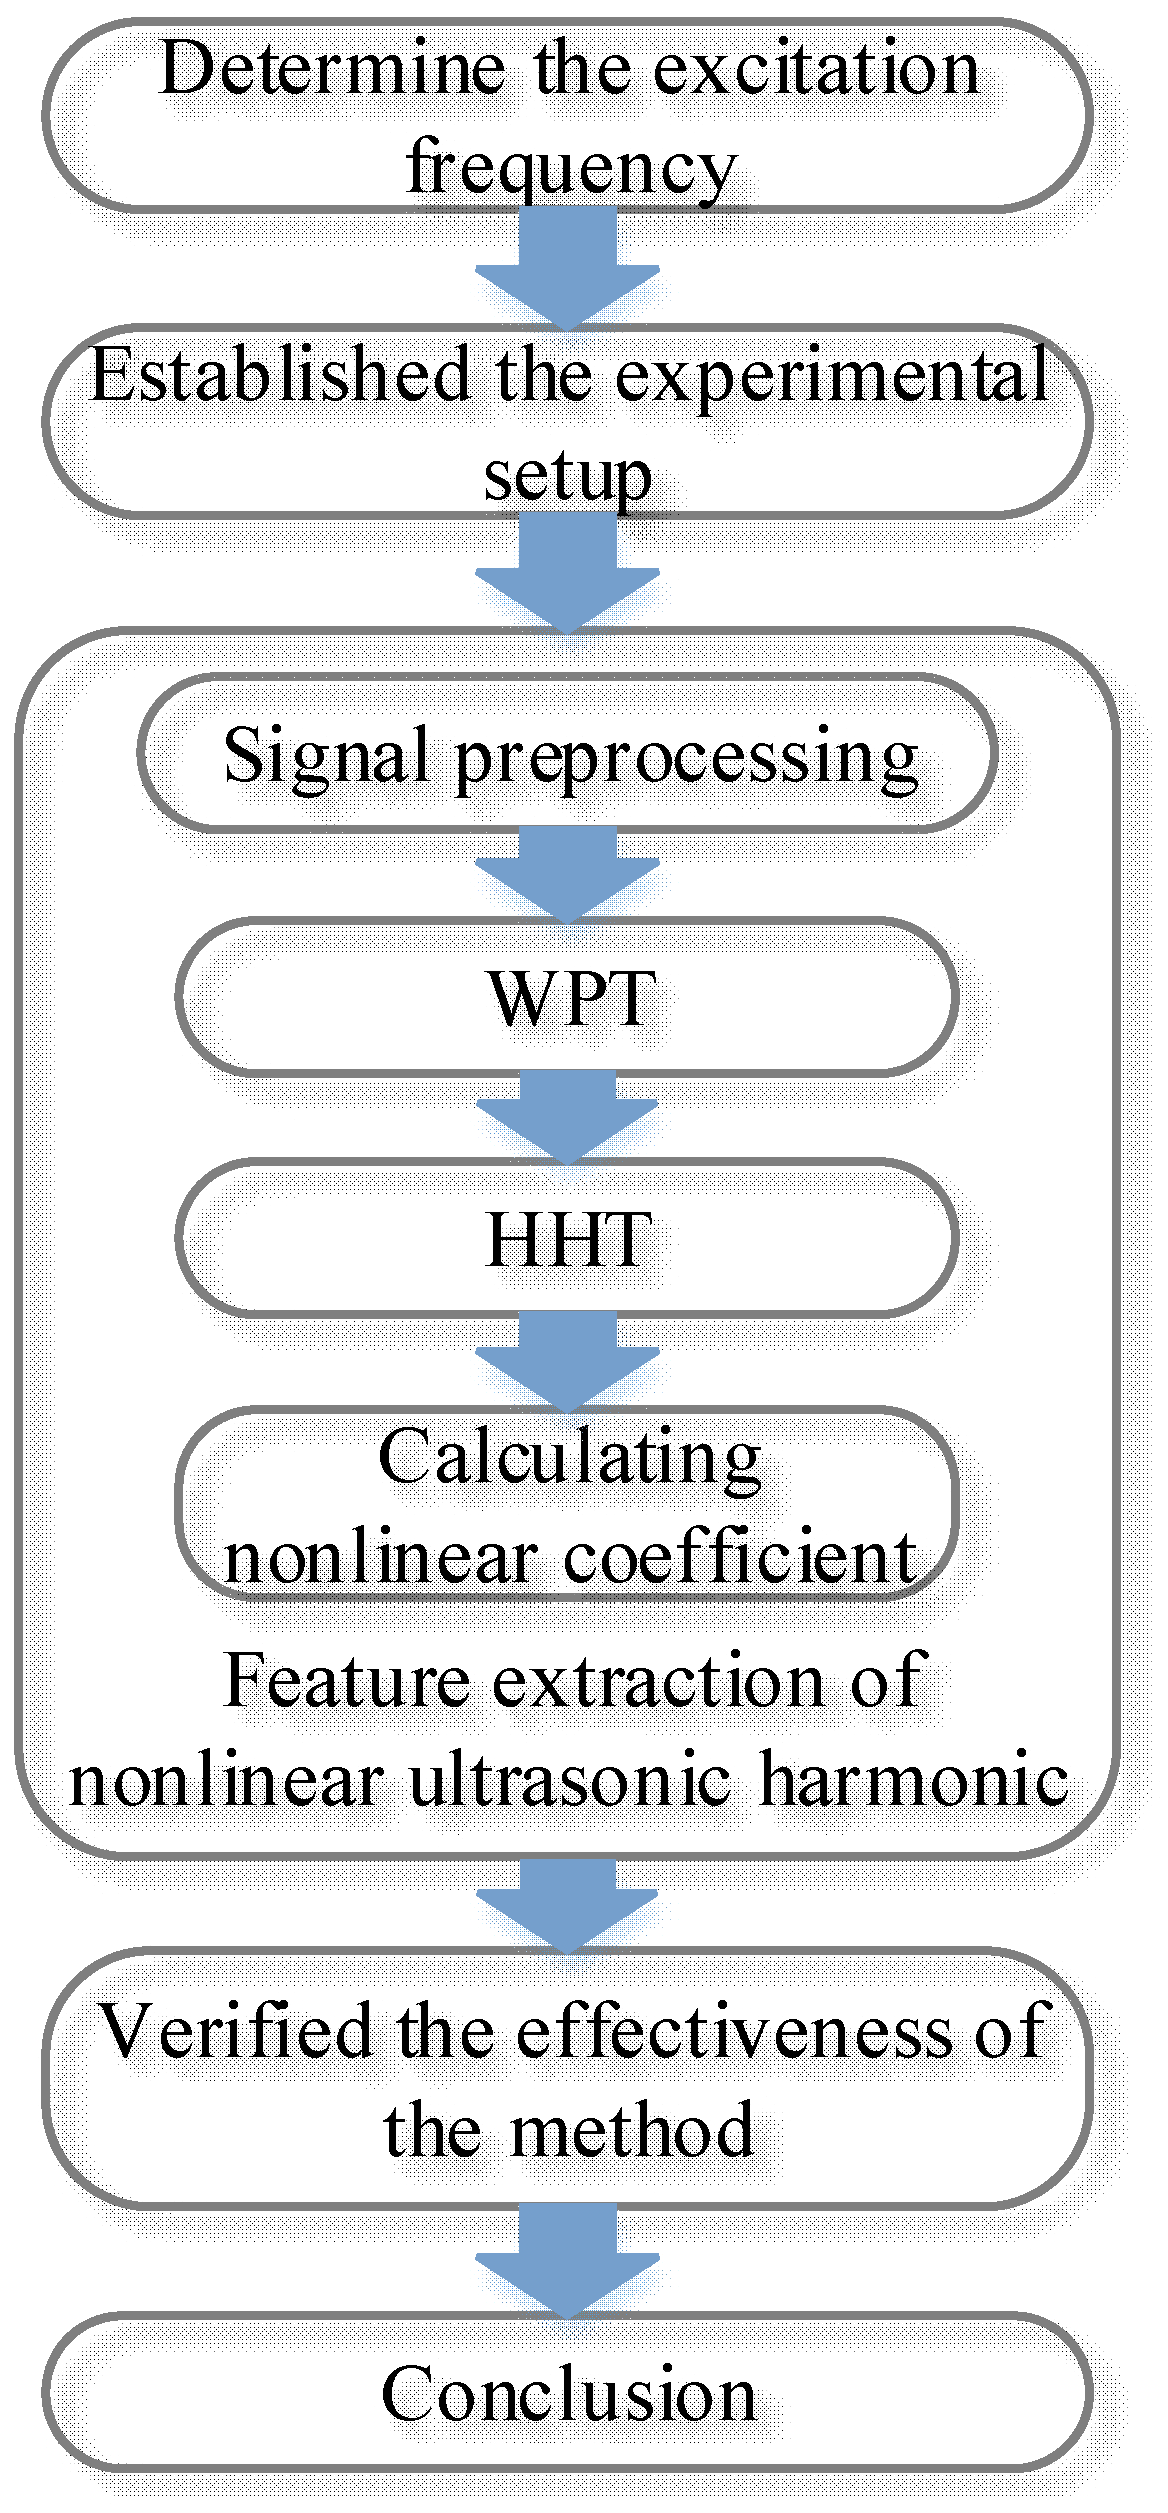
Figure 3.
Instrumentation setup.
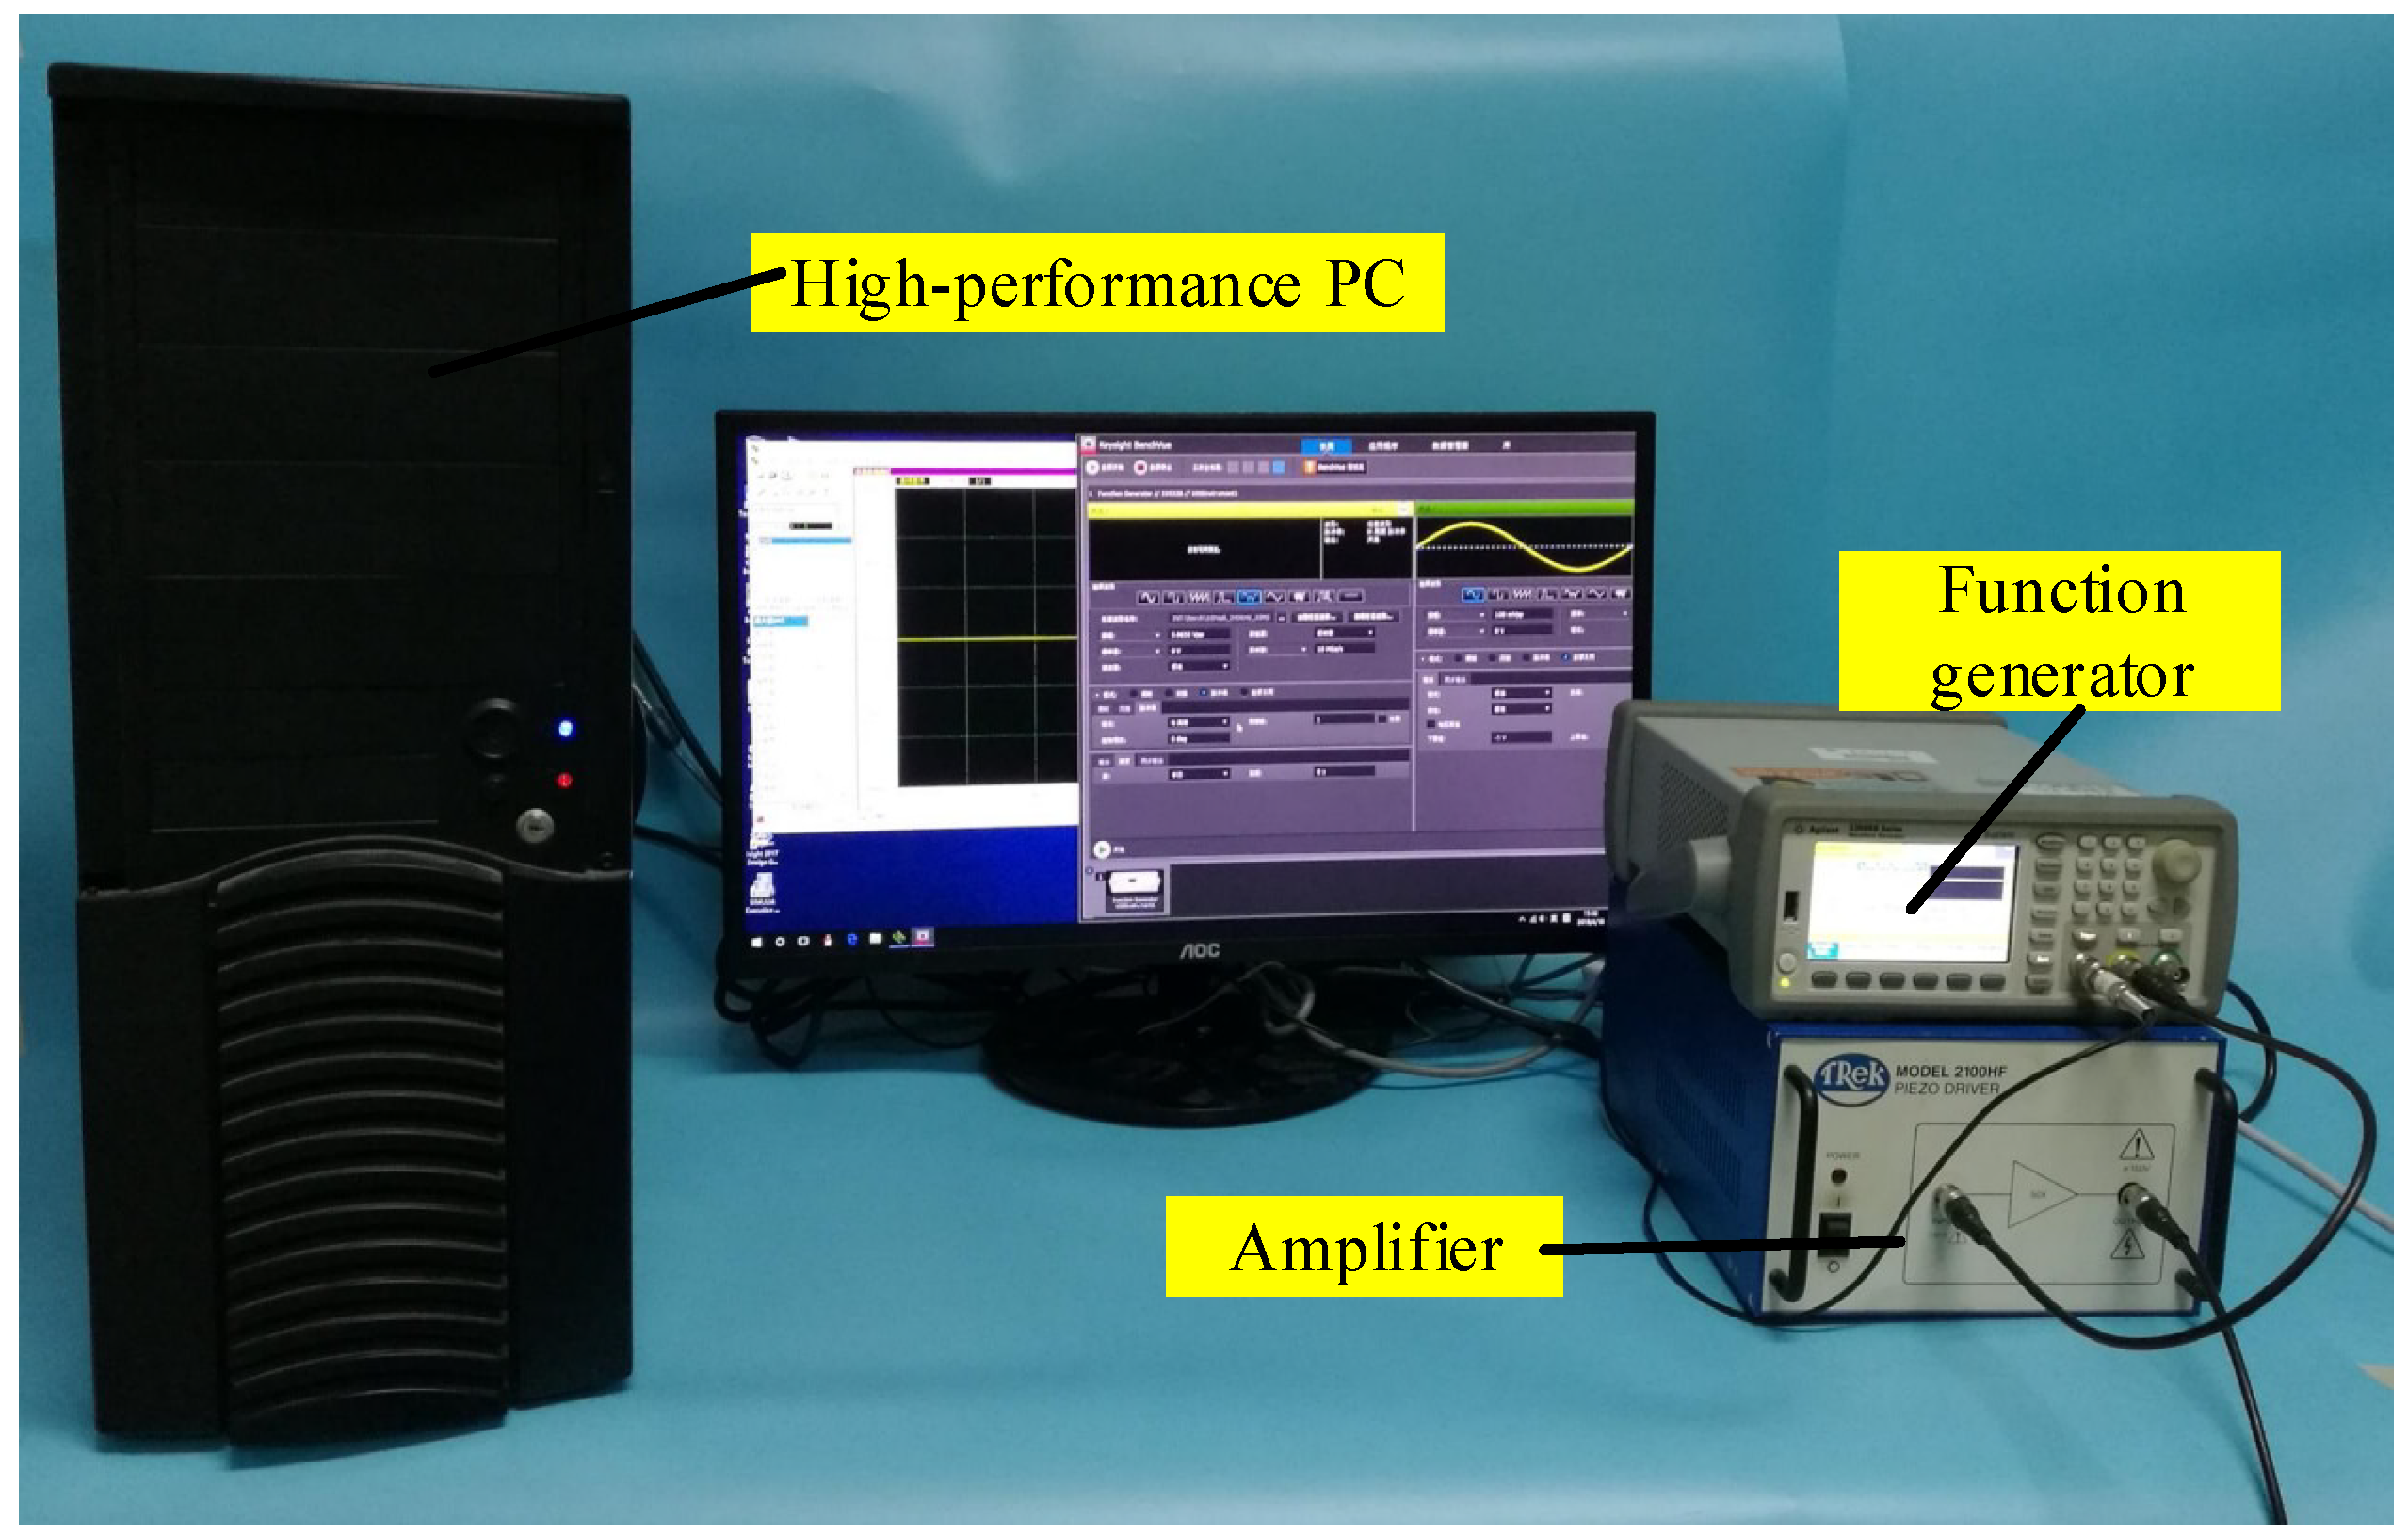
Figure 4.
Lined anti-corrosion pipes with Lead Zirconate Titanate Transducer (PZT). T and R stands for excitation transducer and receiving transducer respectively.
Figure 4.
Lined anti-corrosion pipes with Lead Zirconate Titanate Transducer (PZT). T and R stands for excitation transducer and receiving transducer respectively.
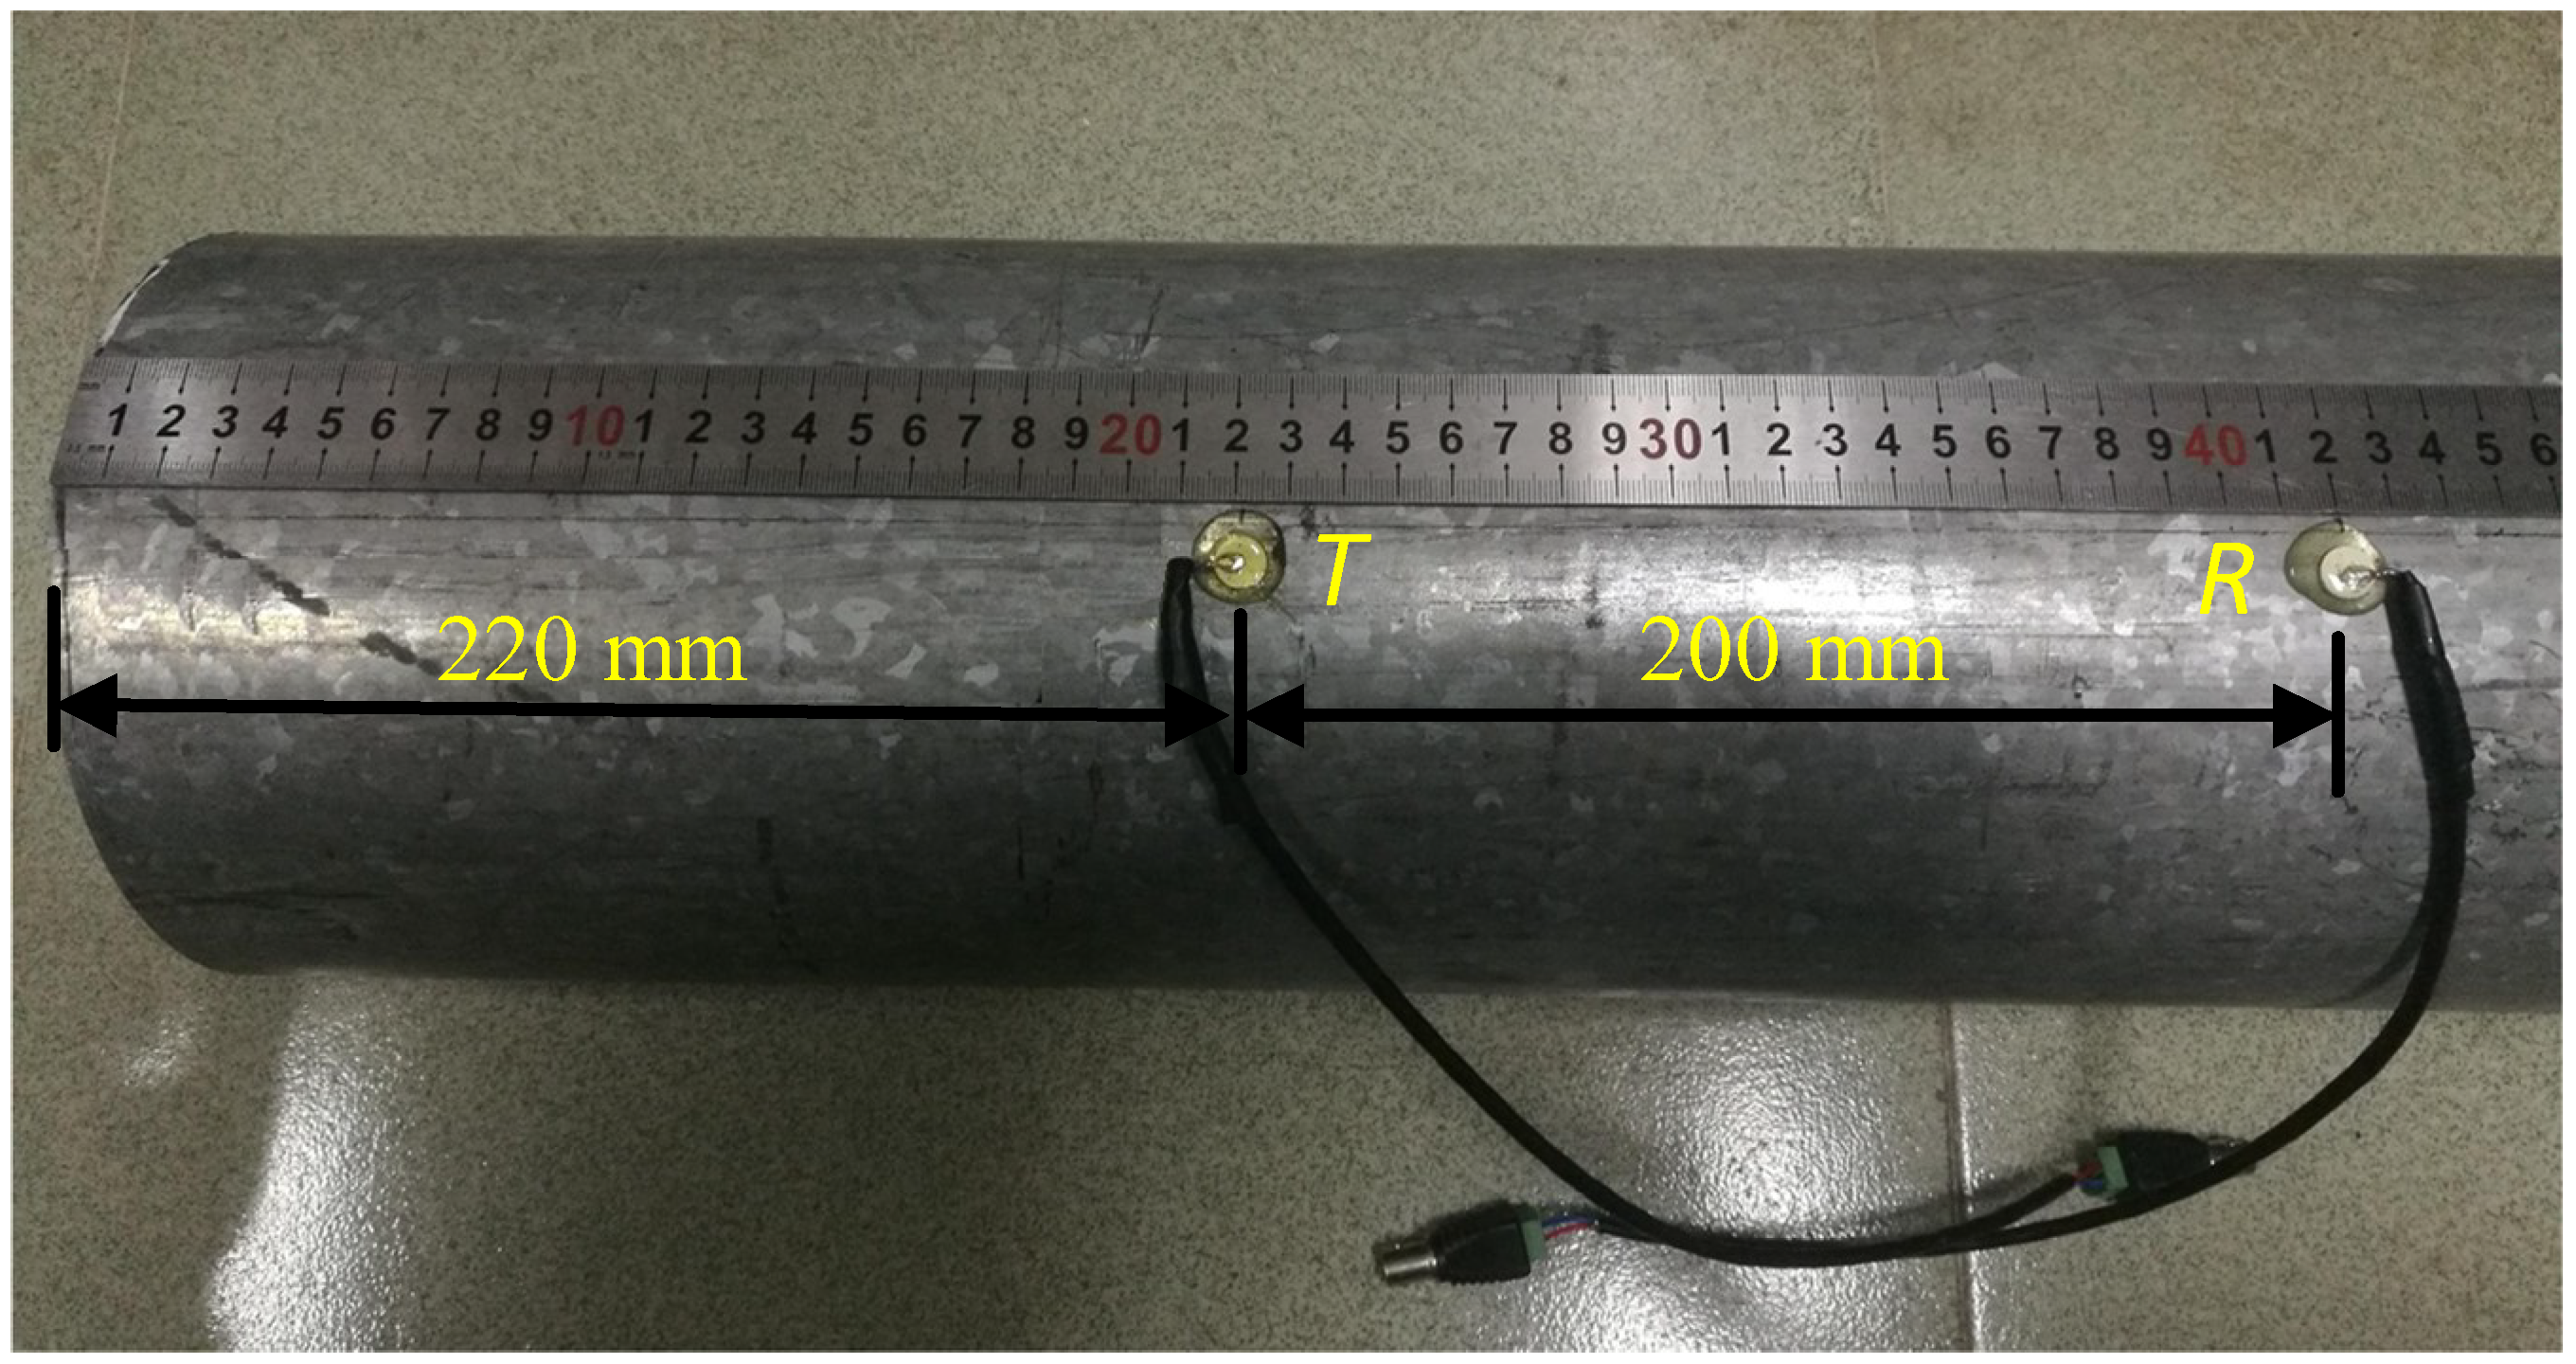
Figure 5.
The received sweep signals. (a) time-domain; (b) frequency-domain.
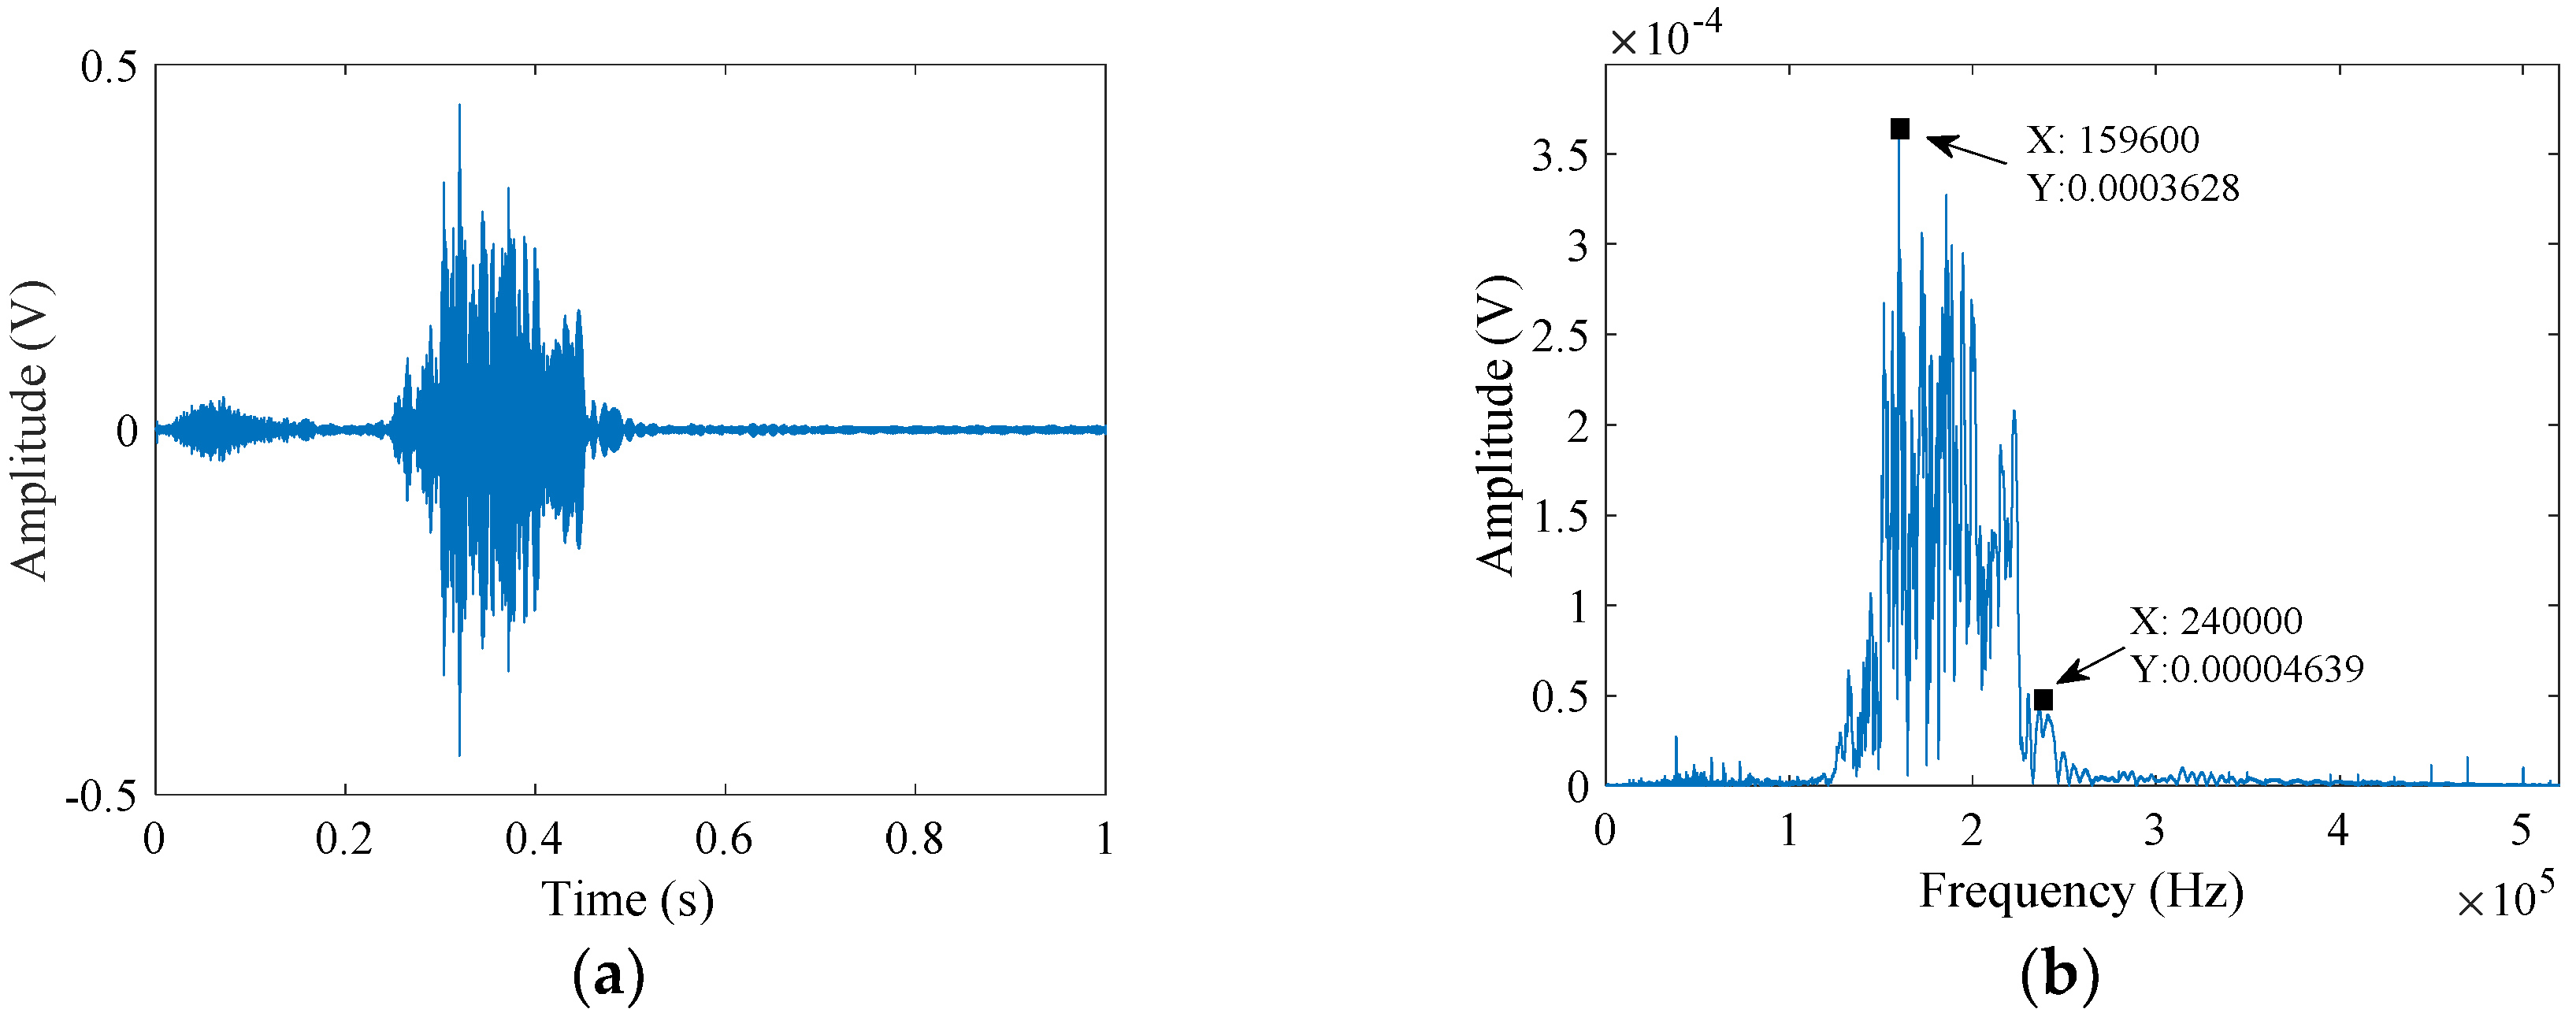
Figure 6.
Side view of the anti-corrosive pipe.
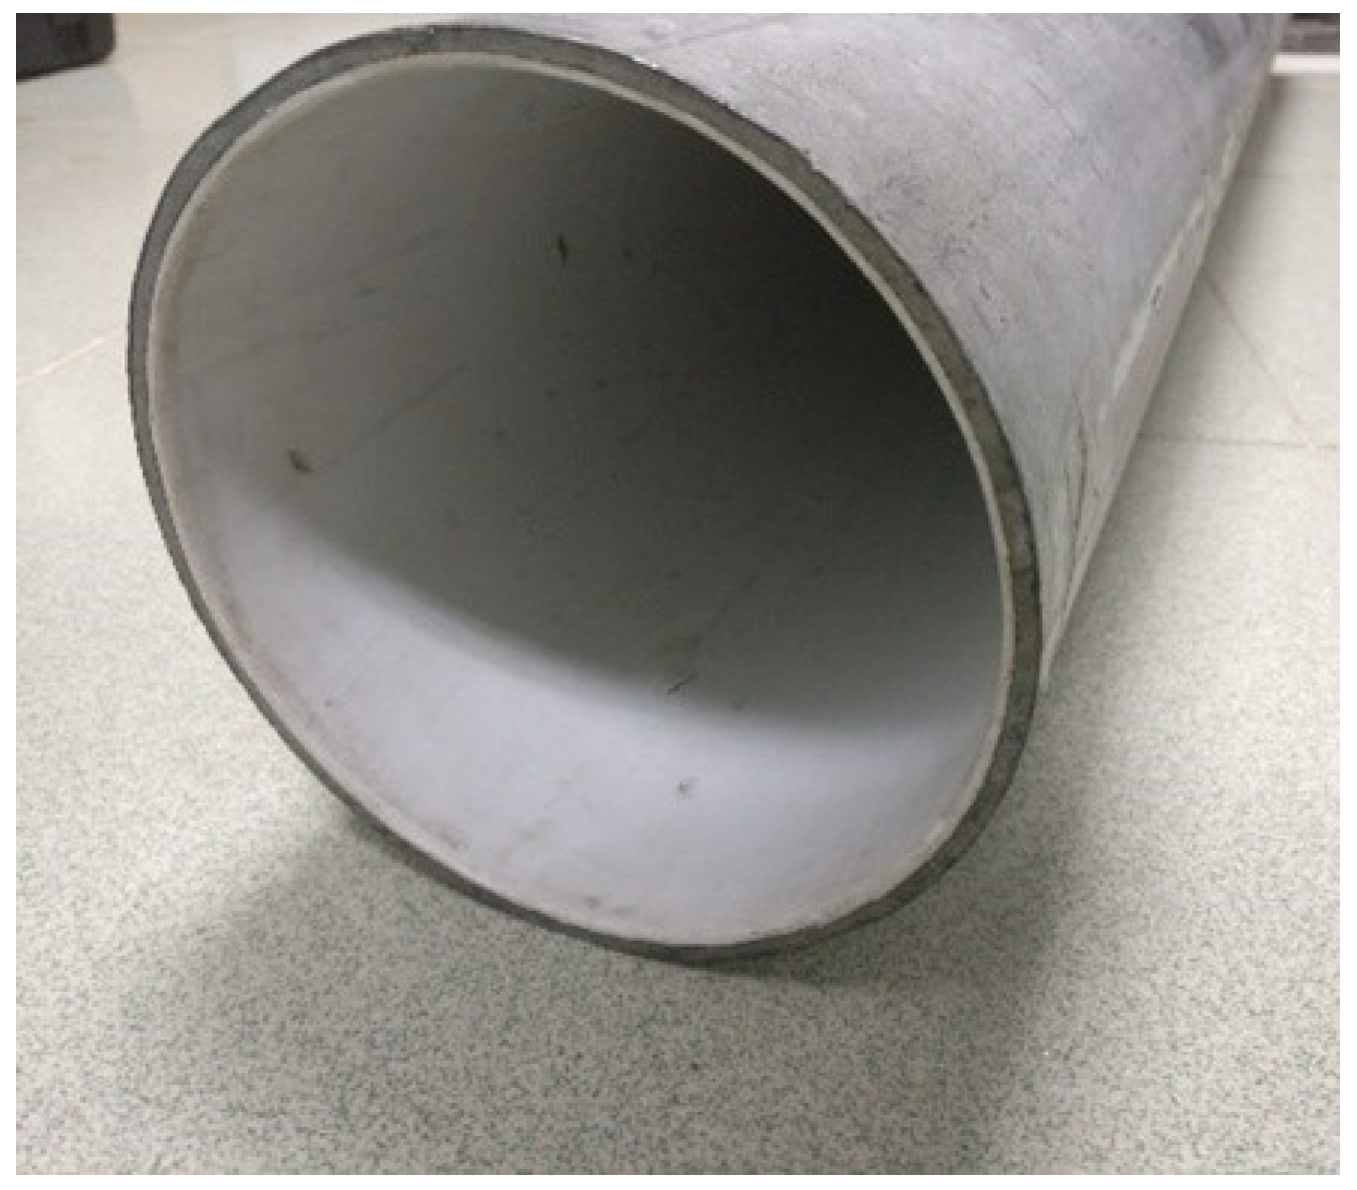
Figure 7.
Schematic illustration of delamination damage. T and R stands for excitation transducer and receiving transducer respectively.
Figure 7.
Schematic illustration of delamination damage. T and R stands for excitation transducer and receiving transducer respectively.

Figure 8.
Wavelet packet energy of the undamaged pipe.
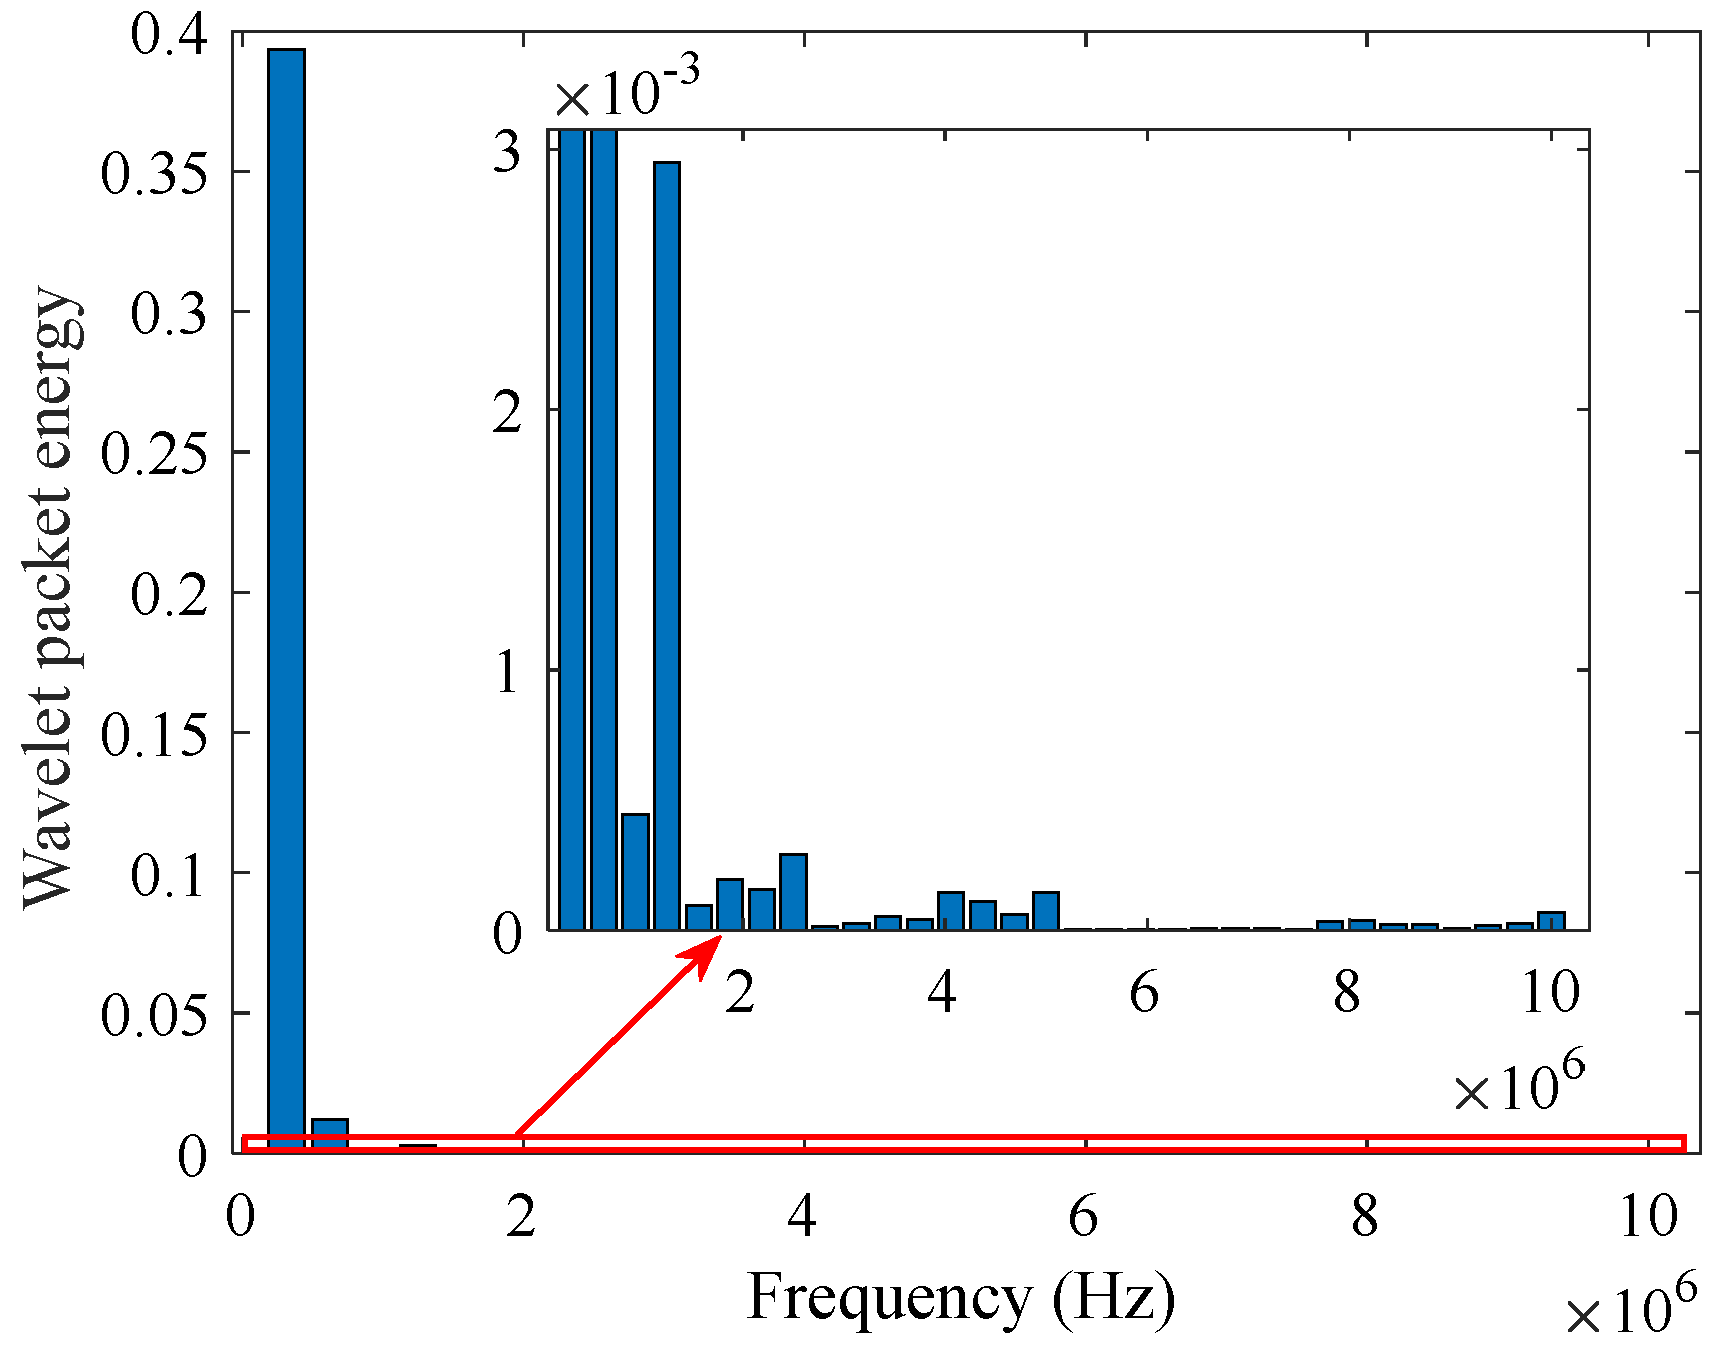
Figure 9.
Intrinsic Mode Functions (IMF) of the preprocessed signal.
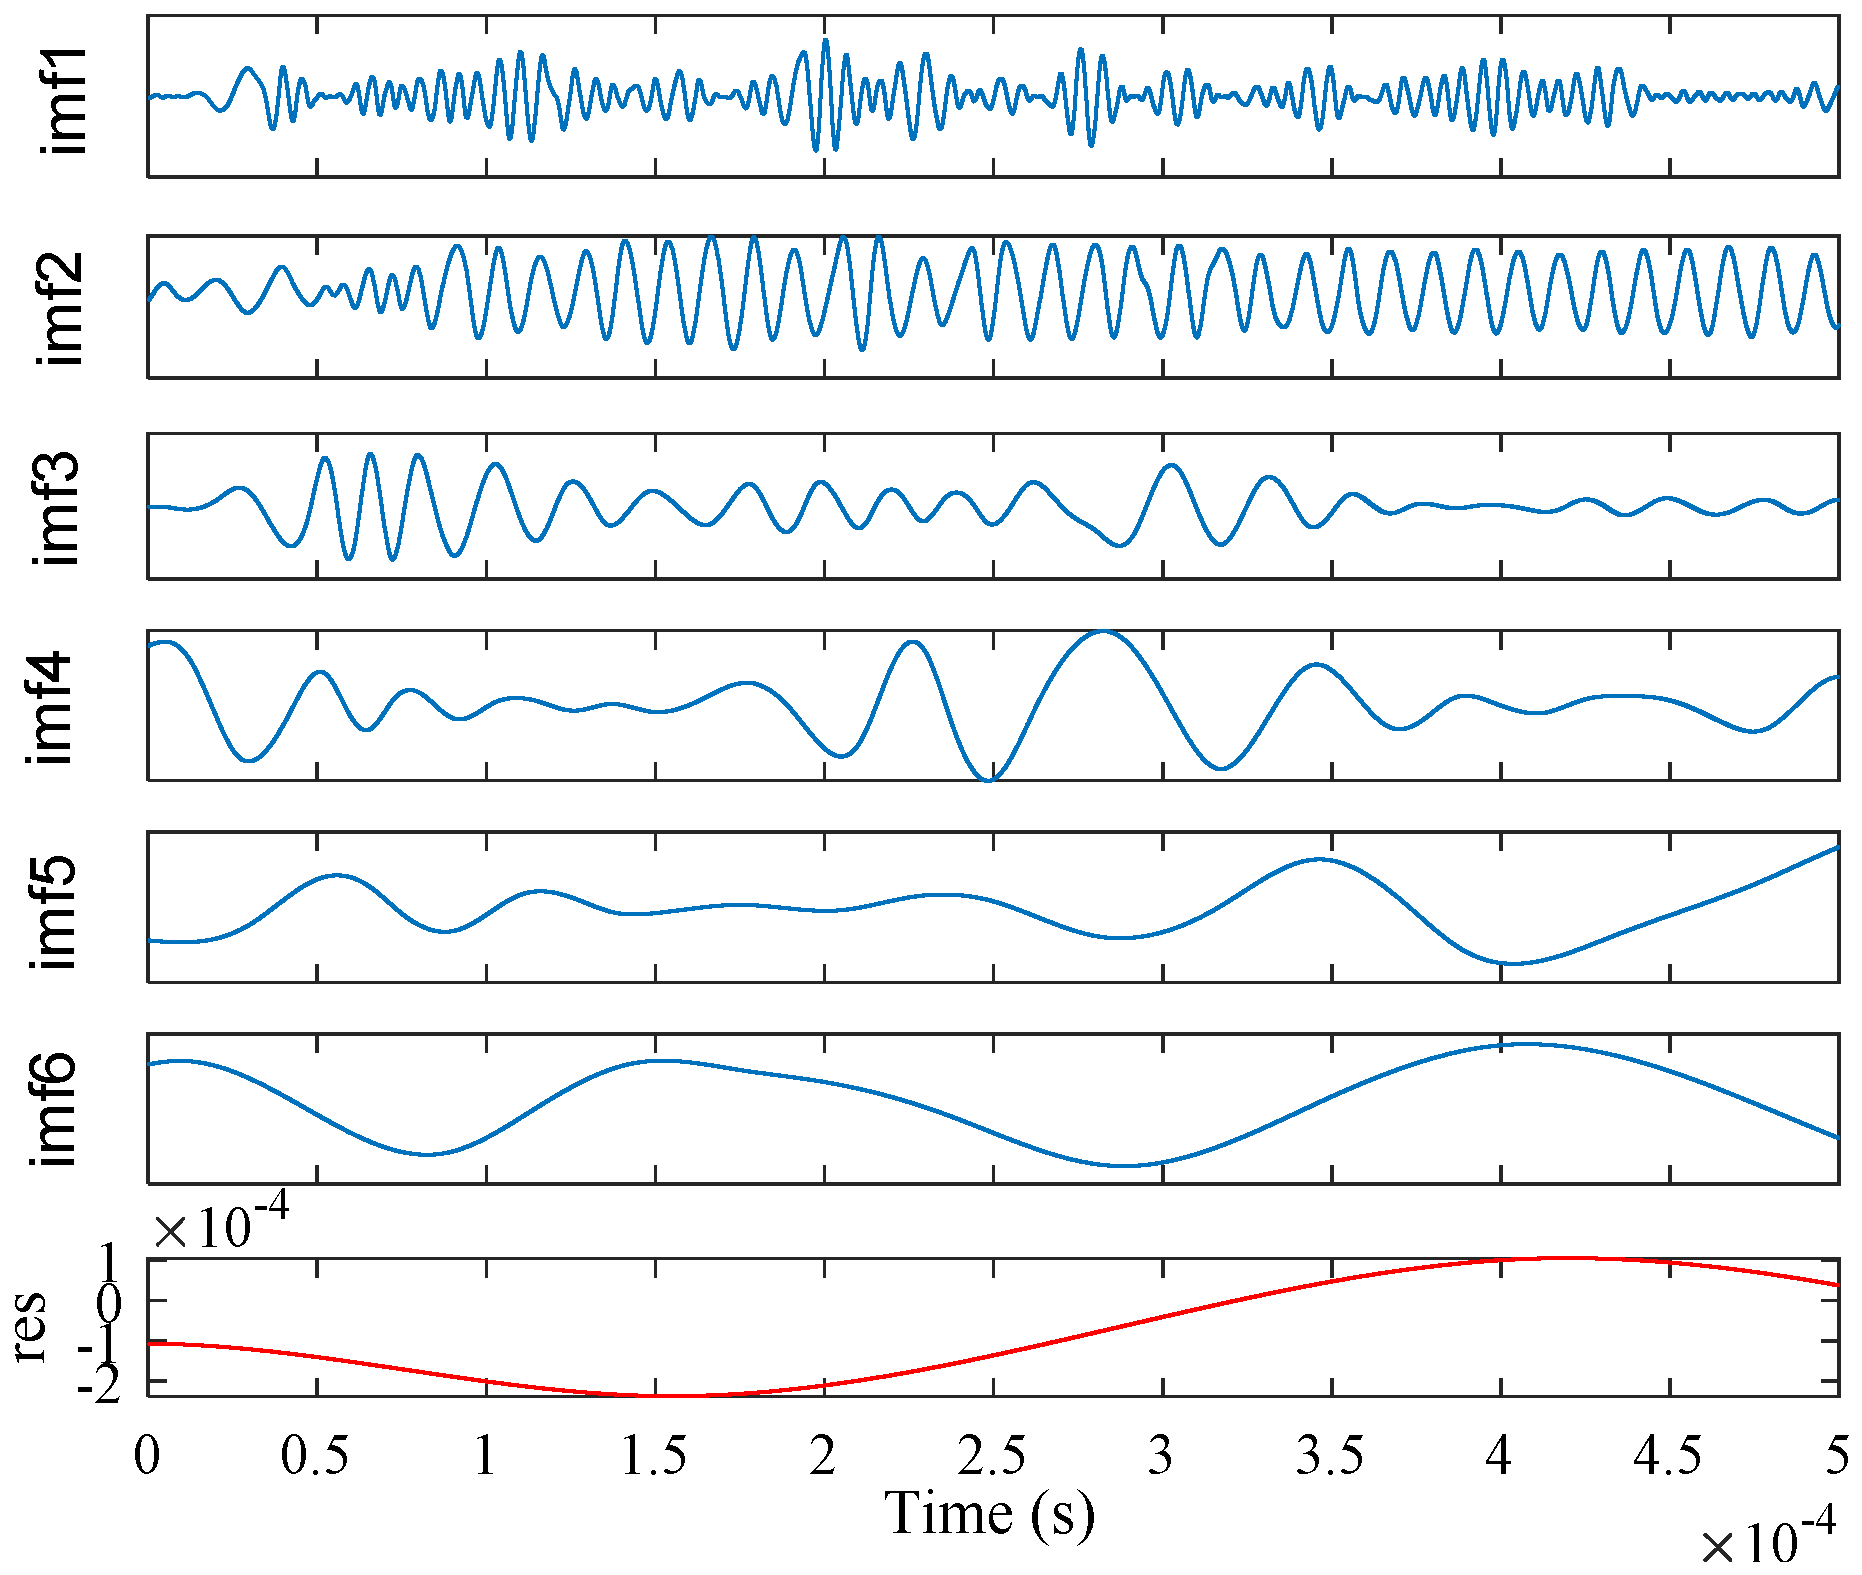
Figure 10.
Hilbert marginal spectrum processed by WPT+HHT of different delamination damages. (a) 0 mm; (b) 4 mm; (c) 8 mm; (d) 12 mm; (e) 16 mm; (f) 20 mm.
Figure 10.
Hilbert marginal spectrum processed by WPT+HHT of different delamination damages. (a) 0 mm; (b) 4 mm; (c) 8 mm; (d) 12 mm; (e) 16 mm; (f) 20 mm.
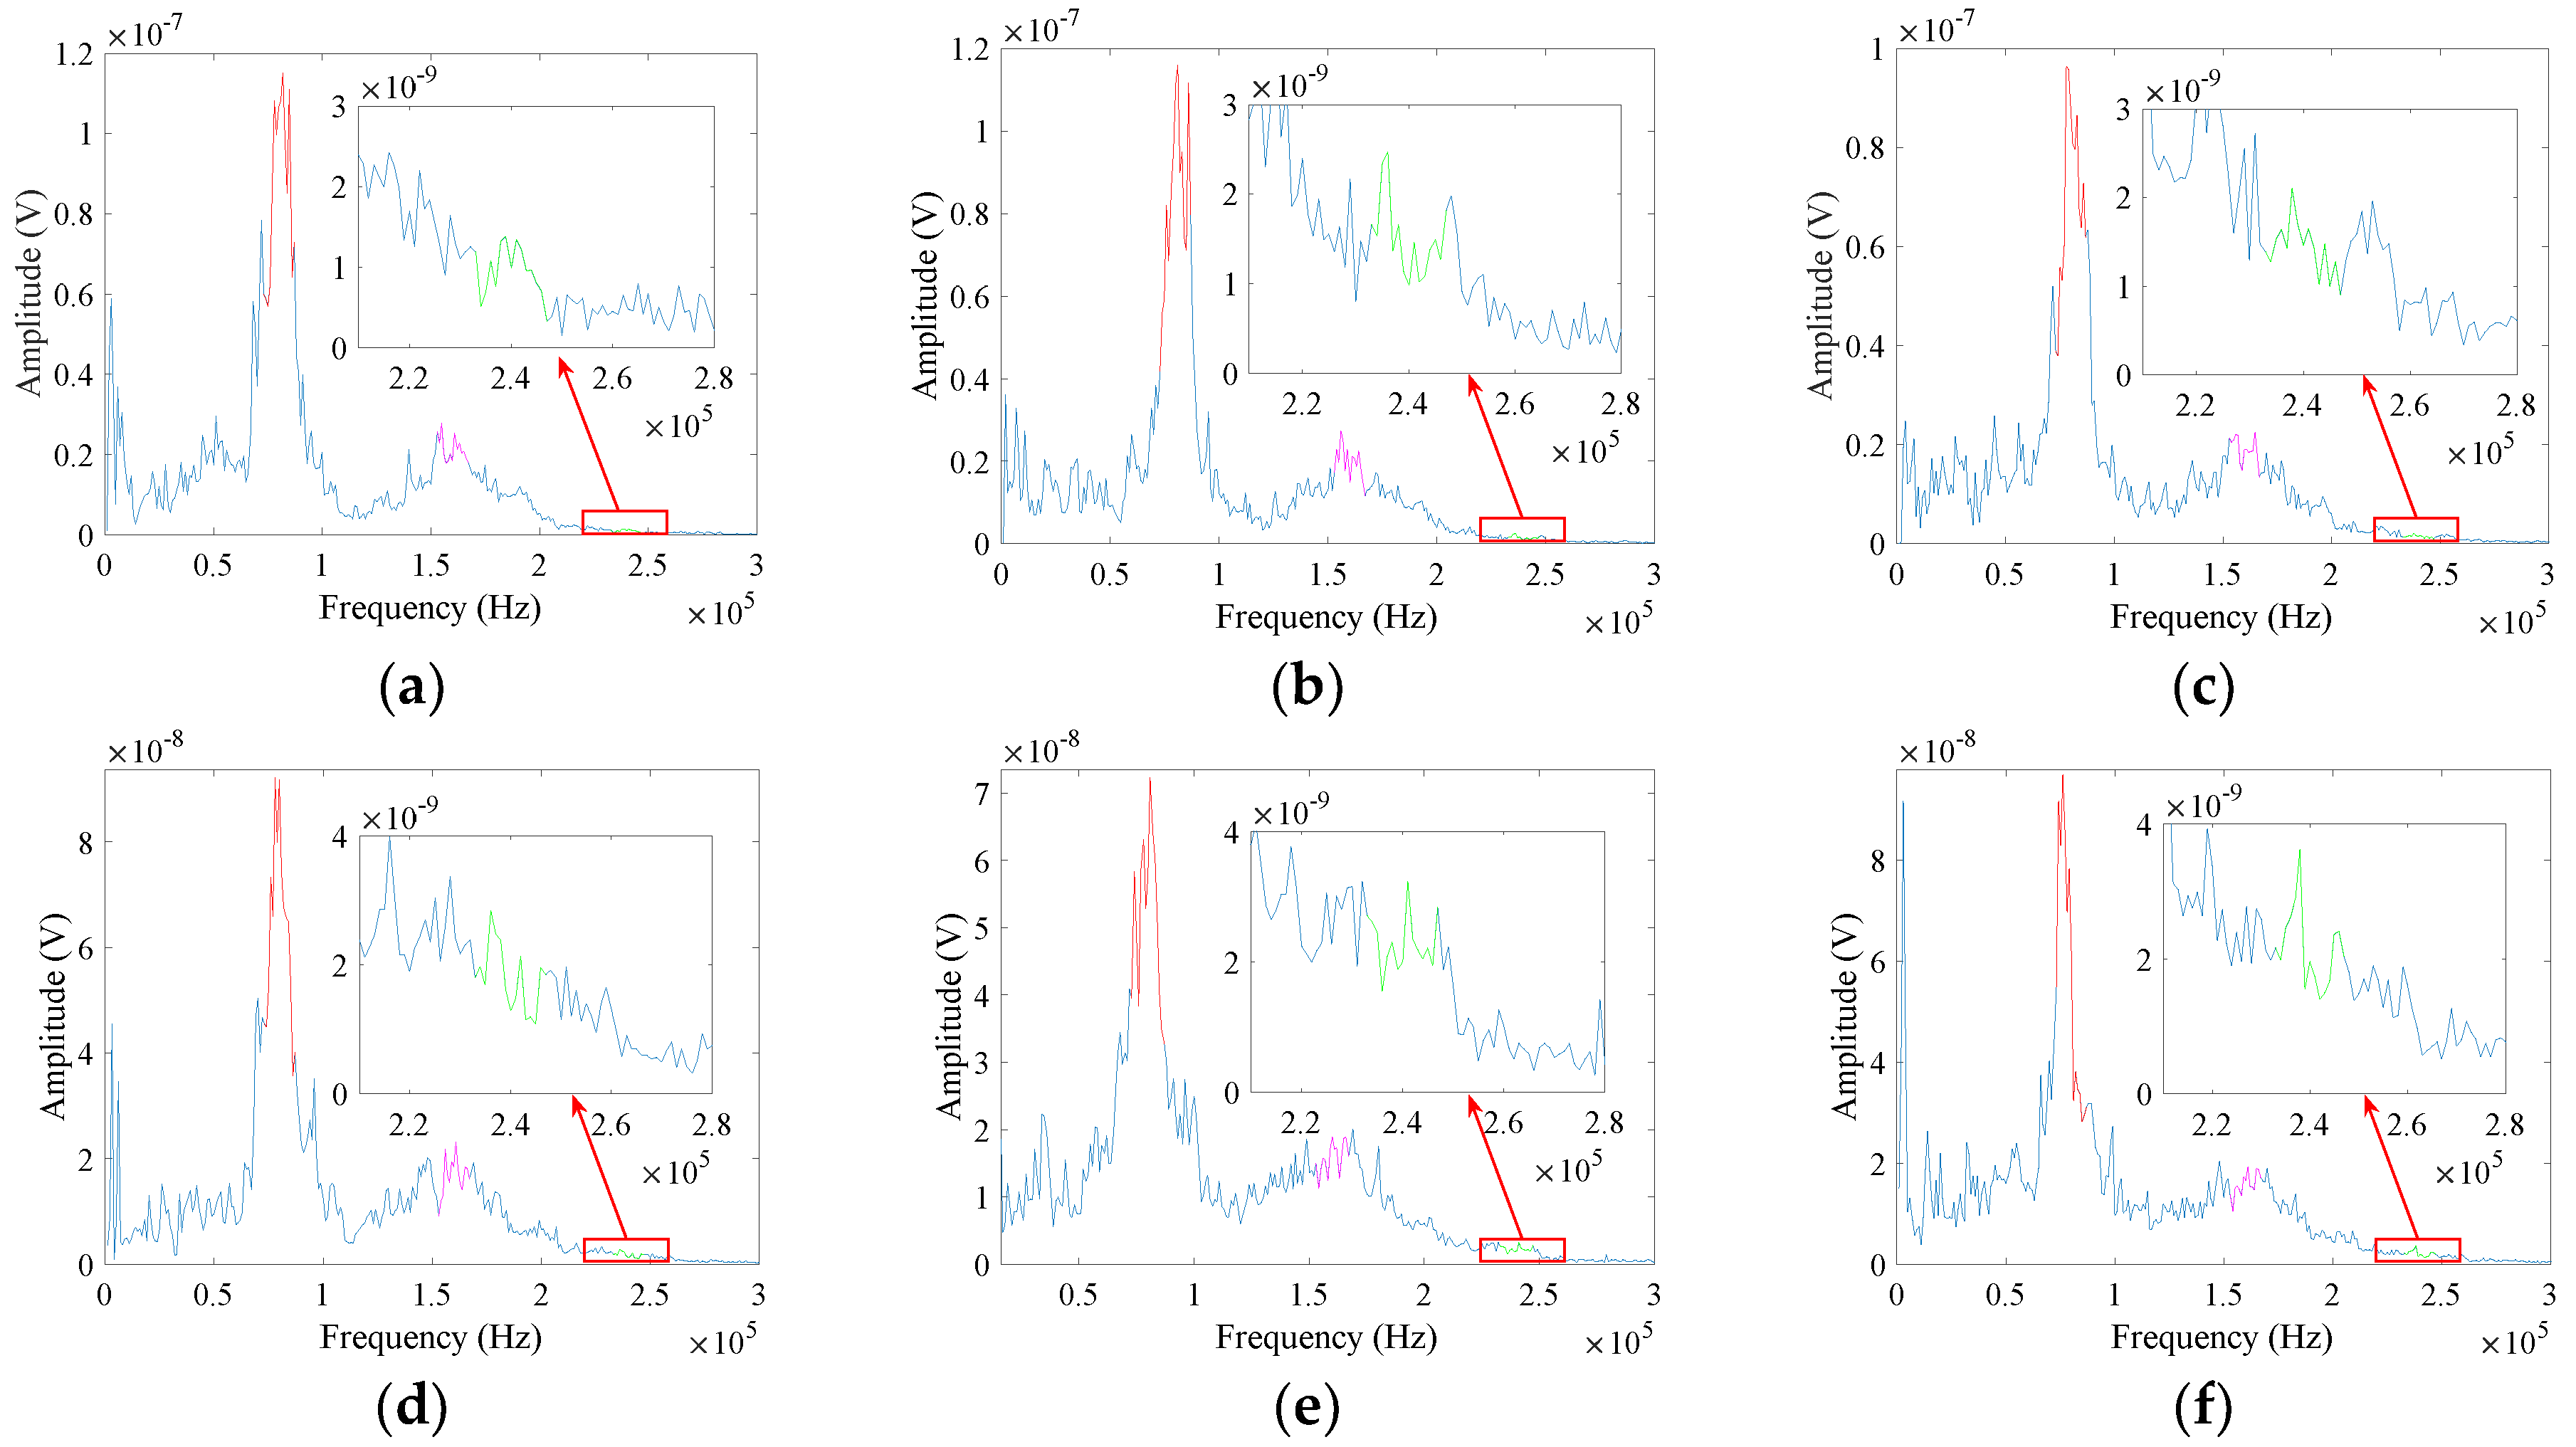
Figure 11.
The changing curves of the second-order nonlinear coefficient.
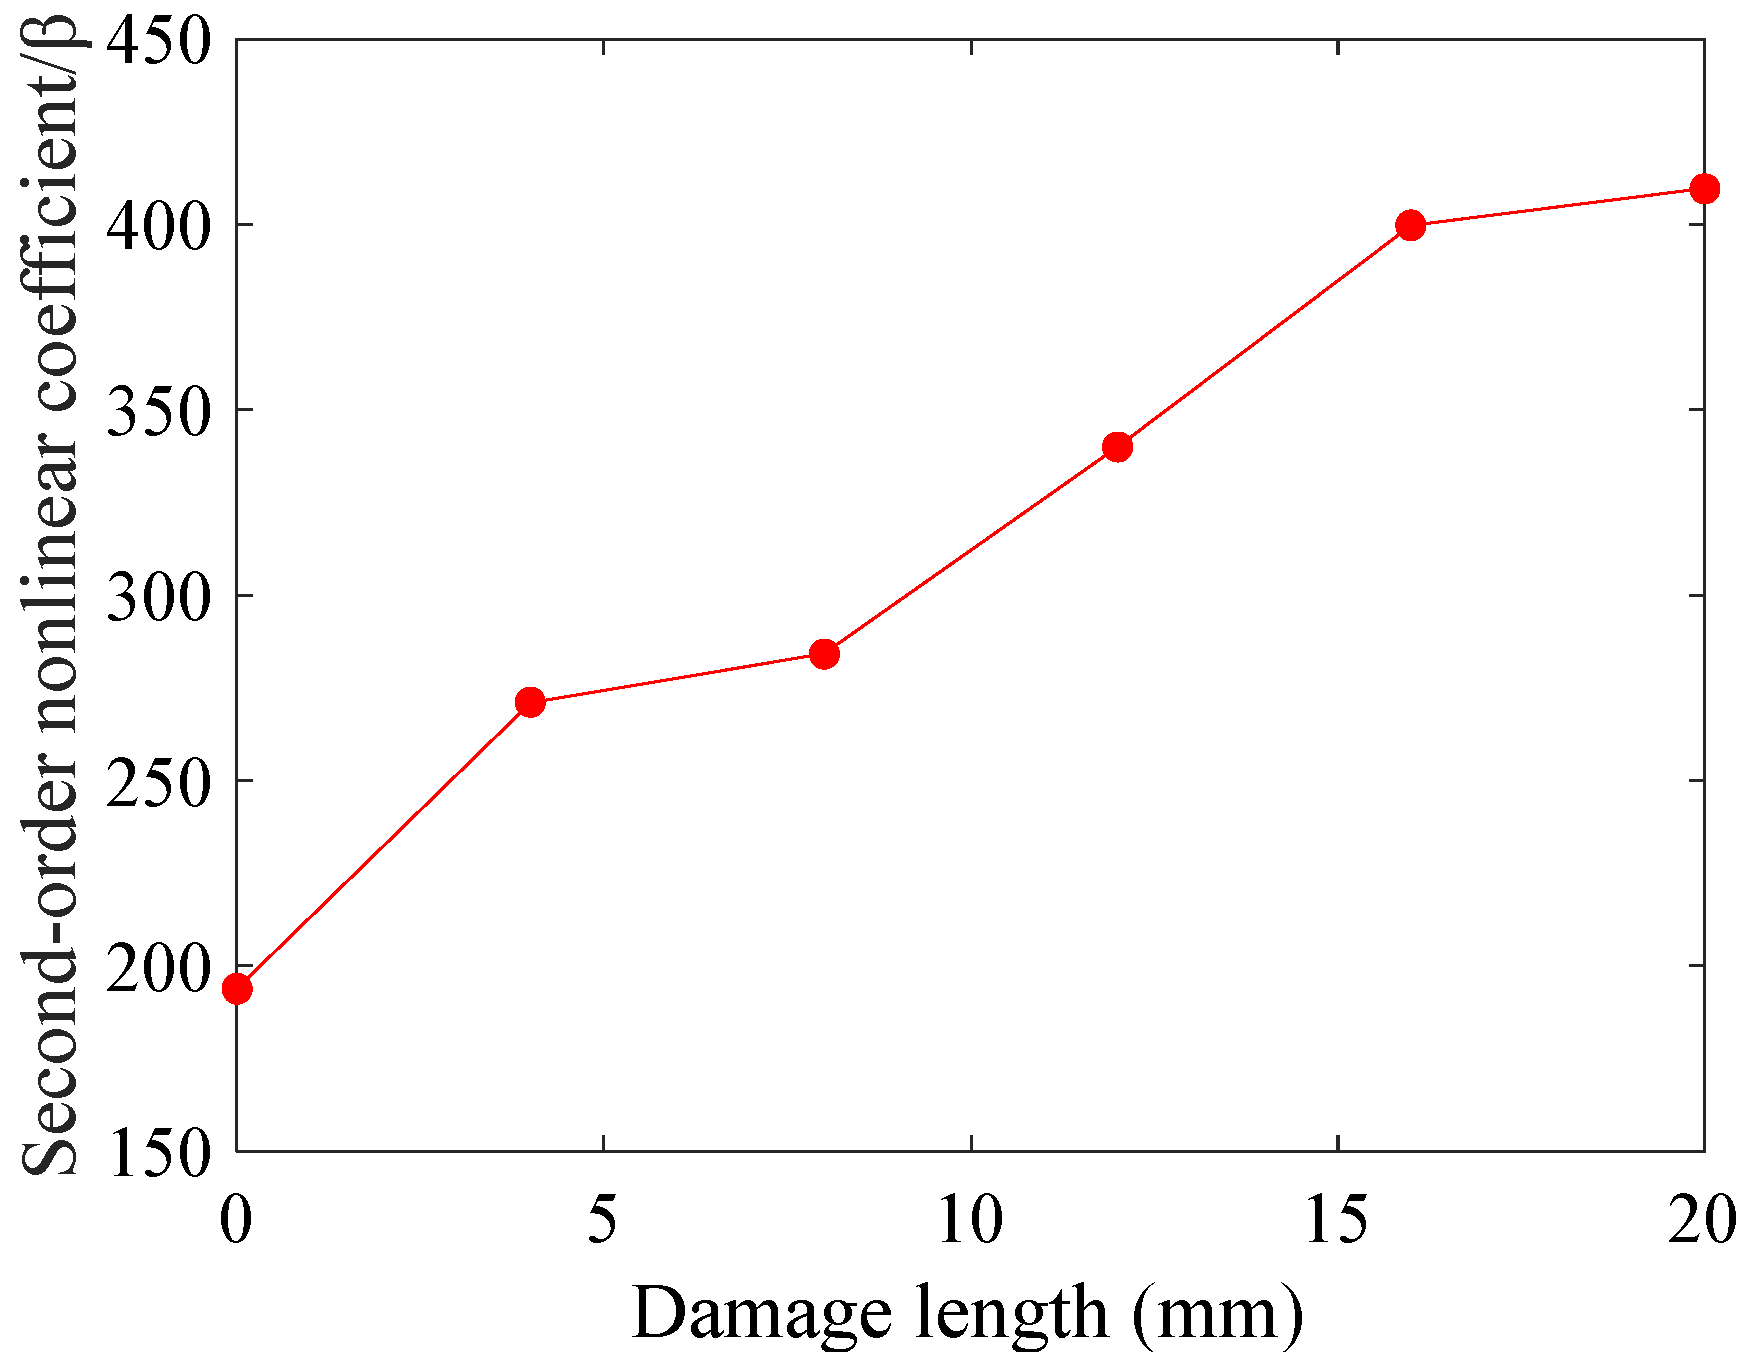
Figure 12.
The changing curves of the third-order nonlinear coefficient.

Figure 13.
Marginal spectrum processed by WPT+DFT of different delamination damages. (a) 0 mm; (b) 4 mm; (c) 8 mm; (d) 12 mm; (e) 16 mm; (f) 20 mm.
Figure 13.
Marginal spectrum processed by WPT+DFT of different delamination damages. (a) 0 mm; (b) 4 mm; (c) 8 mm; (d) 12 mm; (e) 16 mm; (f) 20 mm.

Figure 14.
Marginal spectrum processed by HHT of different delamination damages. (a) 0 mm; (b) 4 mm; (c) 8 mm; (d) 12 mm; (e) 16 mm; (f) 20 mm.
Figure 14.
Marginal spectrum processed by HHT of different delamination damages. (a) 0 mm; (b) 4 mm; (c) 8 mm; (d) 12 mm; (e) 16 mm; (f) 20 mm.
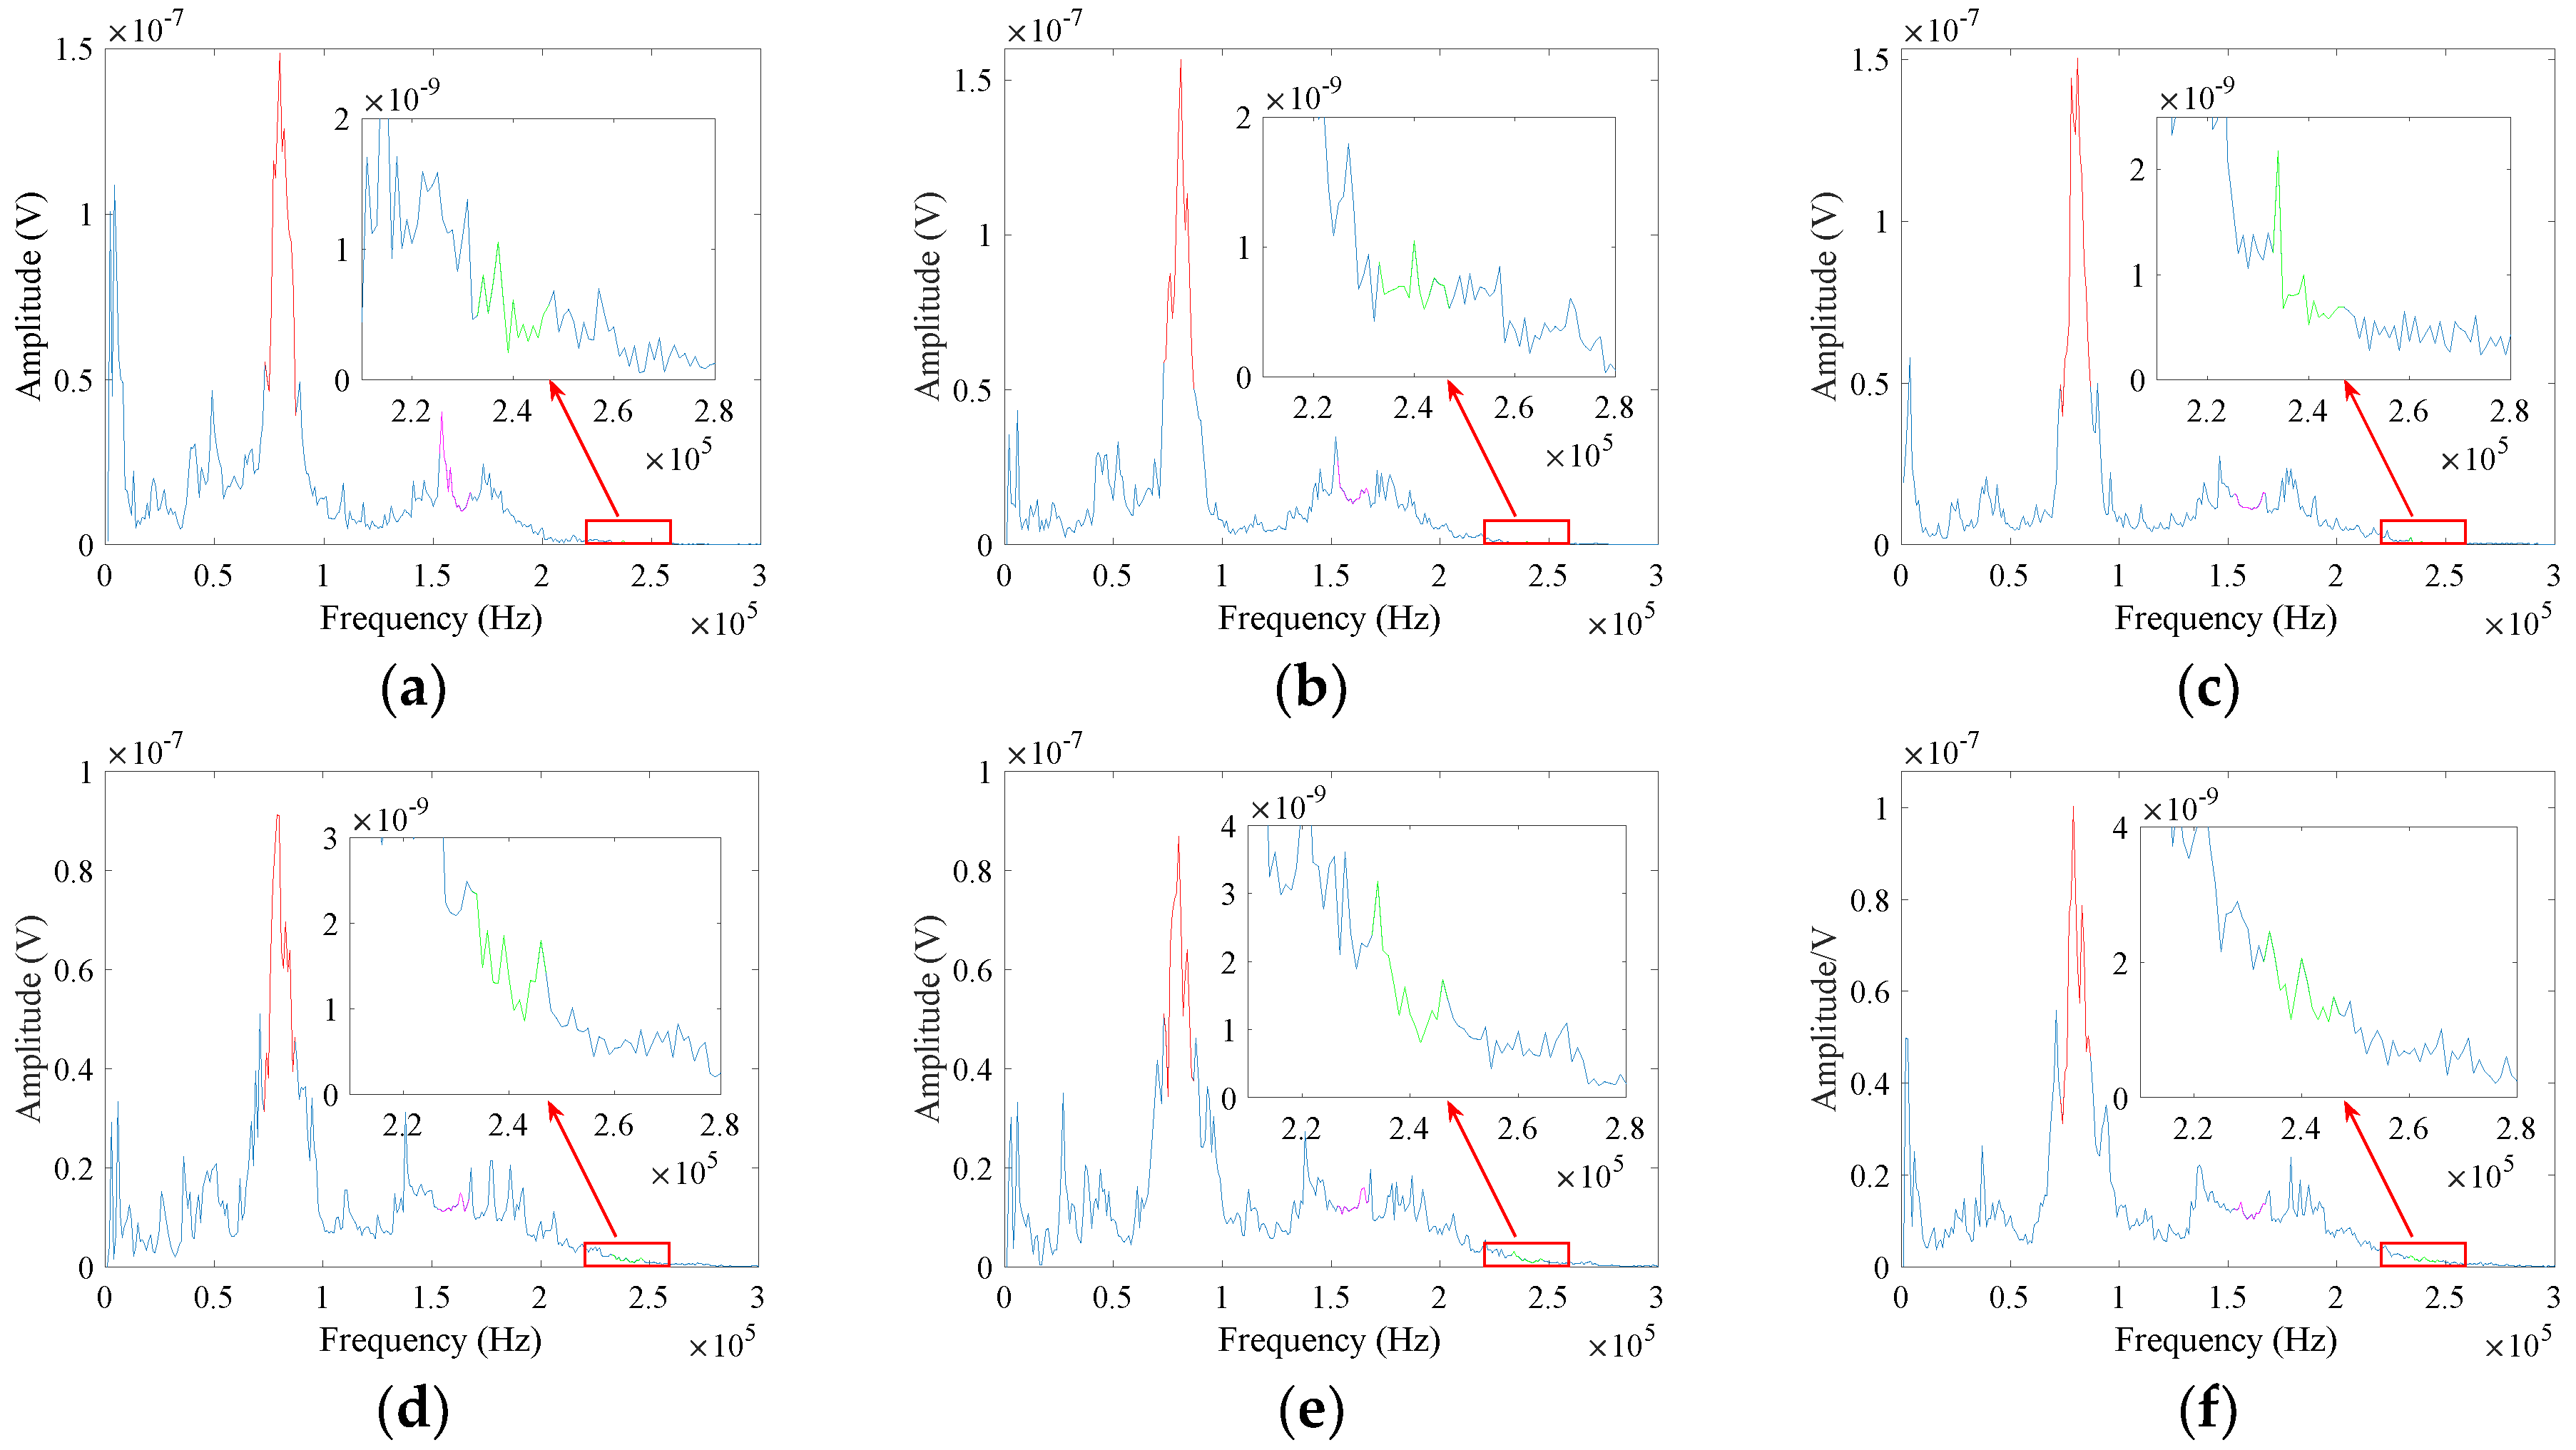
Figure 15.
The changing curves of a normalized second-order nonlinear coefficient.

Figure 16.
The changing curves of a normalized third-order nonlinear coefficient.

Table 1.
Mean squared error of different processing processes.
| Processing Process | WPT+DFT | HHT | WPT+HHT |
|---|---|---|---|
| Normalized second-order nonlinear coefficient | 0.1366 | 0.1141 | 0.0680 |
| Normalized third-order nonlinear coefficient | 0.0737 | 0.0978 | 0.0565 |
© 2018 by the authors. Licensee MDPI, Basel, Switzerland. This article is an open access article distributed under the terms and conditions of the Creative Commons Attribution (CC BY) license (http://creativecommons.org/licenses/by/4.0/).
Share and Cite
MDPI and ACS Style
Hong, X.; Liu, Y.; Lin, X.; Luo, Z.; He, Z. Nonlinear Ultrasonic Detection Method for Delamination Damage of Lined Anti-Corrosion Pipes Using PZT Transducers. Appl. Sci. 2018, 8, 2240. https://doi.org/10.3390/app8112240
AMA Style
Hong X, Liu Y, Lin X, Luo Z, He Z. Nonlinear Ultrasonic Detection Method for Delamination Damage of Lined Anti-Corrosion Pipes Using PZT Transducers. Applied Sciences. 2018; 8(11):2240. https://doi.org/10.3390/app8112240
Chicago/Turabian StyleHong, Xiaobin, Yuan Liu, Xiaohui Lin, Zongqiang Luo, and Zhenwei He. 2018. "Nonlinear Ultrasonic Detection Method for Delamination Damage of Lined Anti-Corrosion Pipes Using PZT Transducers" Applied Sciences 8, no. 11: 2240. https://doi.org/10.3390/app8112240
Note that from the first issue of 2016, this journal uses article numbers instead of page numbers. See further details here.