Metrology Data-Based Simulation of Freeform Optics


1
Karlsruhe Institute of Technology, Institute for Automation and Applied Informatics, Hermann-von-Helmholtz-Platz 1, 76344 Eggenstein-Leopoldshafen, Germany
2
Department of Integrated Systems Engineering, The Ohio State University, 1971 Neil Ave, Columbus, OH 43210, USA
*
Author to whom correspondence should be addressed.
Appl. Sci. 2018, 8(12), 2338; https://doi.org/10.3390/app8122338
Submission received: 31 October 2018
/
Revised: 16 November 2018
/
Accepted: 19 November 2018
/
Published: 22 November 2018
(This article belongs to the Special Issue Precision Dimensional Measurements)
Abstract
:This paper describes the approach to use measurement data to enhance the simulation model for designing freeform optics. Design for manufacturing of freeform optics is still challenging, since the classical tolerancing procedures cannot be applied. In the case of spherical optics manufacturing, tolerances are more or less isotropic, and this relationship is lost in case of freeform surfaces. Hence, an accurate performance prediction of the manufactured optics cannot be made. To make the modeling approach as accurate as possible, integration of measured surface data of fabricated freeform optics in the modeling environment is proposed. This approach enables performance prediction of the real manufactured freeform surfaces as well as optimization of the manufacturing process. In our case study this approach is used on the design of an Alvarez-optics manufactured using a microinjection molding (µIM) process. The parameters of the µIM process are optimized on the basis of simulation analysis resulting in optics, with a performance very close to the nominal design. Measurement of the freeform surfaces is conducted using a tactile surface measurement tool.
1. Introduction
With the advancement of modern precision optical fabrication technologies, freeform optical components can be manufactured with a sufficiently high accuracy [1,2]. Under this condition, a spherical surface is not anymore the only choice in current optical design. Due to their enlarged degrees of freedom and strong possibilities of aberration correction, optical freeform surfaces are increasingly used in different fields of application, including vehicle lighting [3,4] or ophthalmic applications [5,6,7,8] as well as beam expanders [9]. From the geometrical viewpoint, an optical freeform surface has non-rotationally symmetric features, while from the aspect of fabrication and design, an optical freeform surface is regarded as an optical surface that leverages a third independent axis during the fabrication process to form the optical surface with as-designed non-symmetric features [10]. Both viewpoints reveal the basic feature of the non-rotational symmetry of optical freeform surfaces, which is a challenge for the optical community. Surface shapes of freeform optics range from weak deviations from spherical surface to surface shapes without any symmetries [10], e.g., Alvarez-optics [11] or optics using mutual rotation of two helically formed surfaces for tuning of the focal length [12,13,14,15,16,17,18,19].
Since deviations in position and shape of freeform surfaces cannot be expressed by traditional classification of rotational symmetric surfaces, the classical tolerancing procedures cannot be used in designing and manufacturing freeform optics [20], hence a performance estimation of real manufactured optical subsystems is not possible using the conventional approach of a tolerance analysis [21]. Standardization bodies address these problems by adapting the existing standards to freeform optics [22]. In [23], the option to use a fit of the surface form deviation to determine surface form errors of real manufactured surfaces is explicitly mentioned.
Quality of optical surfaces can be evaluated and characterized using a variety of measures: Root mean square (RMS) errors as well as peak to valley (PV) errors are used to describe low-spatial frequency (LSF) errors, power-spectra density analysis can be used to analyze mid-spatial frequency (MSF) errors like spokes or ripples [24,25]. Based on these figures the manufacturing accuracy can be characterized but no conclusions can be drawn regarding the optical performance in the case where freeform optics are used in a manufactured subsystem. To be able to use optical simulation for performance prediction of a manufactured system, the optical simulation model has to be enhanced by means of measurement data of the manufactured freeform surfaces [26,27].
In addition, the performance prediction based on a model enhancement by means of metrology data can be used to optimize manufacturing parameters. In particular, this might be useful to improve the performance of freeform optics designed-for-manufacture by low-cost mass fabrication methods such as replication technologies (like µIM) [28]. As a result, mass fabrication methods can compete with highly precise and more expensive single-part manufacturing processes, such as ultraprecision diamond machining.
We propose the use of measured surface data of fabricated freeform optics in the modeling environment to make the modeling approach as accurate as possible. Due to the non-symmetric shape of optical freeform surfaces, the manufacturing tolerances are usually not isotropic as it is assumed for spherical optics. For this reason, the analyzation of the measured surface data of the real, manufactured optics is of great interest. This approach allows predicting the optical performance of the real manufactured freeform surfaces.
In this paper, a method is demonstrated to use metrology data to enhance the model to be able to predict the optical performance of the manufactured system. The article is organized as follows: Section 2 describes the manufacture of the freeform optics by µIM. In Section 3, analysis and model enhancement by means of metrology data from the manufactured freeform optics are demonstrated. The paper closes with conclusions in Section 4.
2. Manufacture of the Freeform Optics
The manufacture of the freeform optics was conducted using a µIM-replication process. The initial Alvarez-surface is described by Equation (1).
z(x, y) = 0.01958x2y + 0.00629y3,
µIM has the potential to fabricate optical components with low cycle times, usually ranging from seconds to minutes. In the first step, a molding tool, i.e., a negative form of the component, must be produced. In mold design, shrinkage compensation and placement of runners and vents have to be considered. Manufacturing parts in small dimensions frequently leads to a freezing of the melt due to the disadvantageous surface to volume ratio, thus representing a particular challenge in µIM. Simulating the mold flow can prevent this problem: information about the impact of different process parameters can be gathered and used to optimize the molding process.
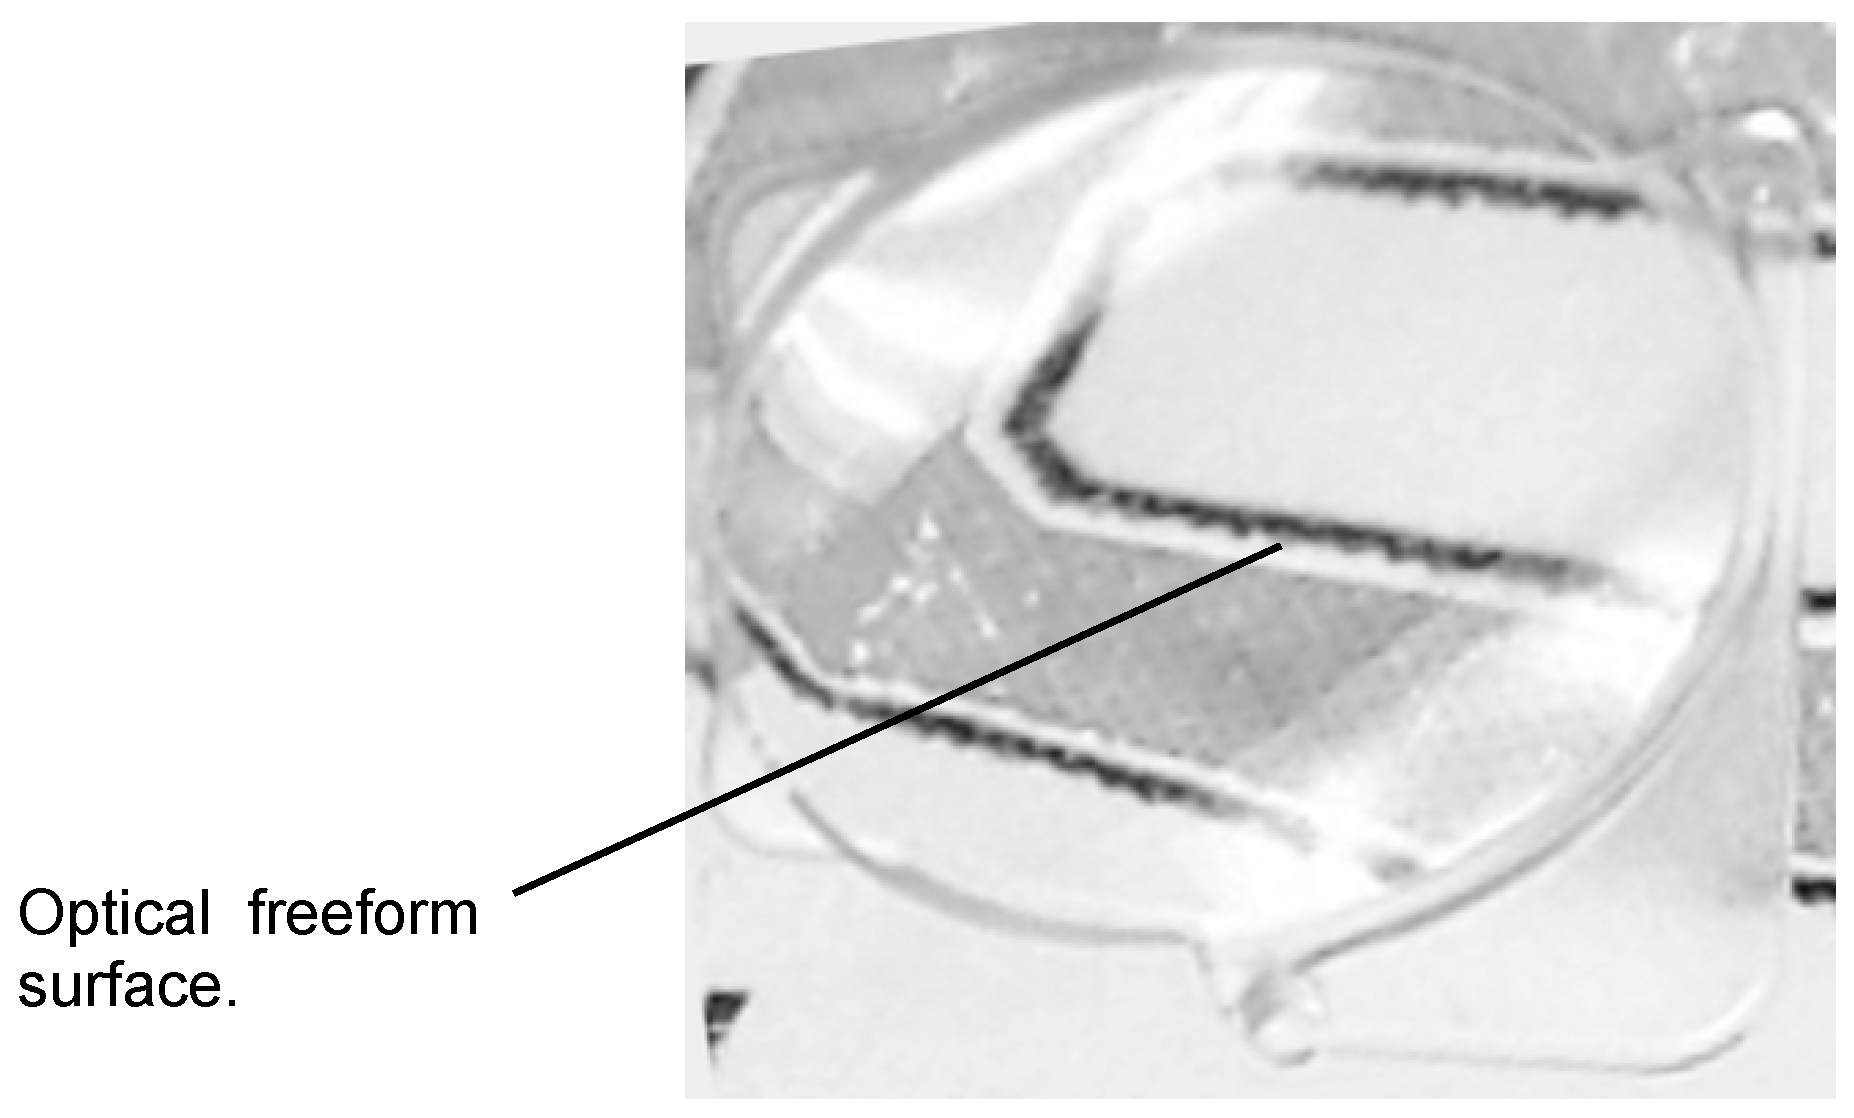
A set of injection molding simulation experiments was carried out to form a basis to design the mold and to derive the process parameters [29]. On the basis of these simulation experiments, molding tools were fabricated by which the freeform optics was molded. Figure 1 depicts a photograph of a freeform lens manufactured by the µIM process.
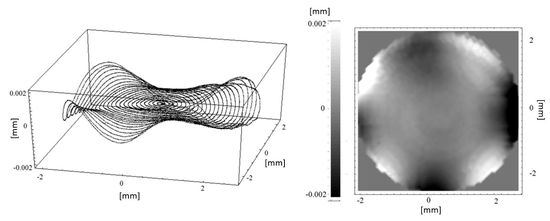
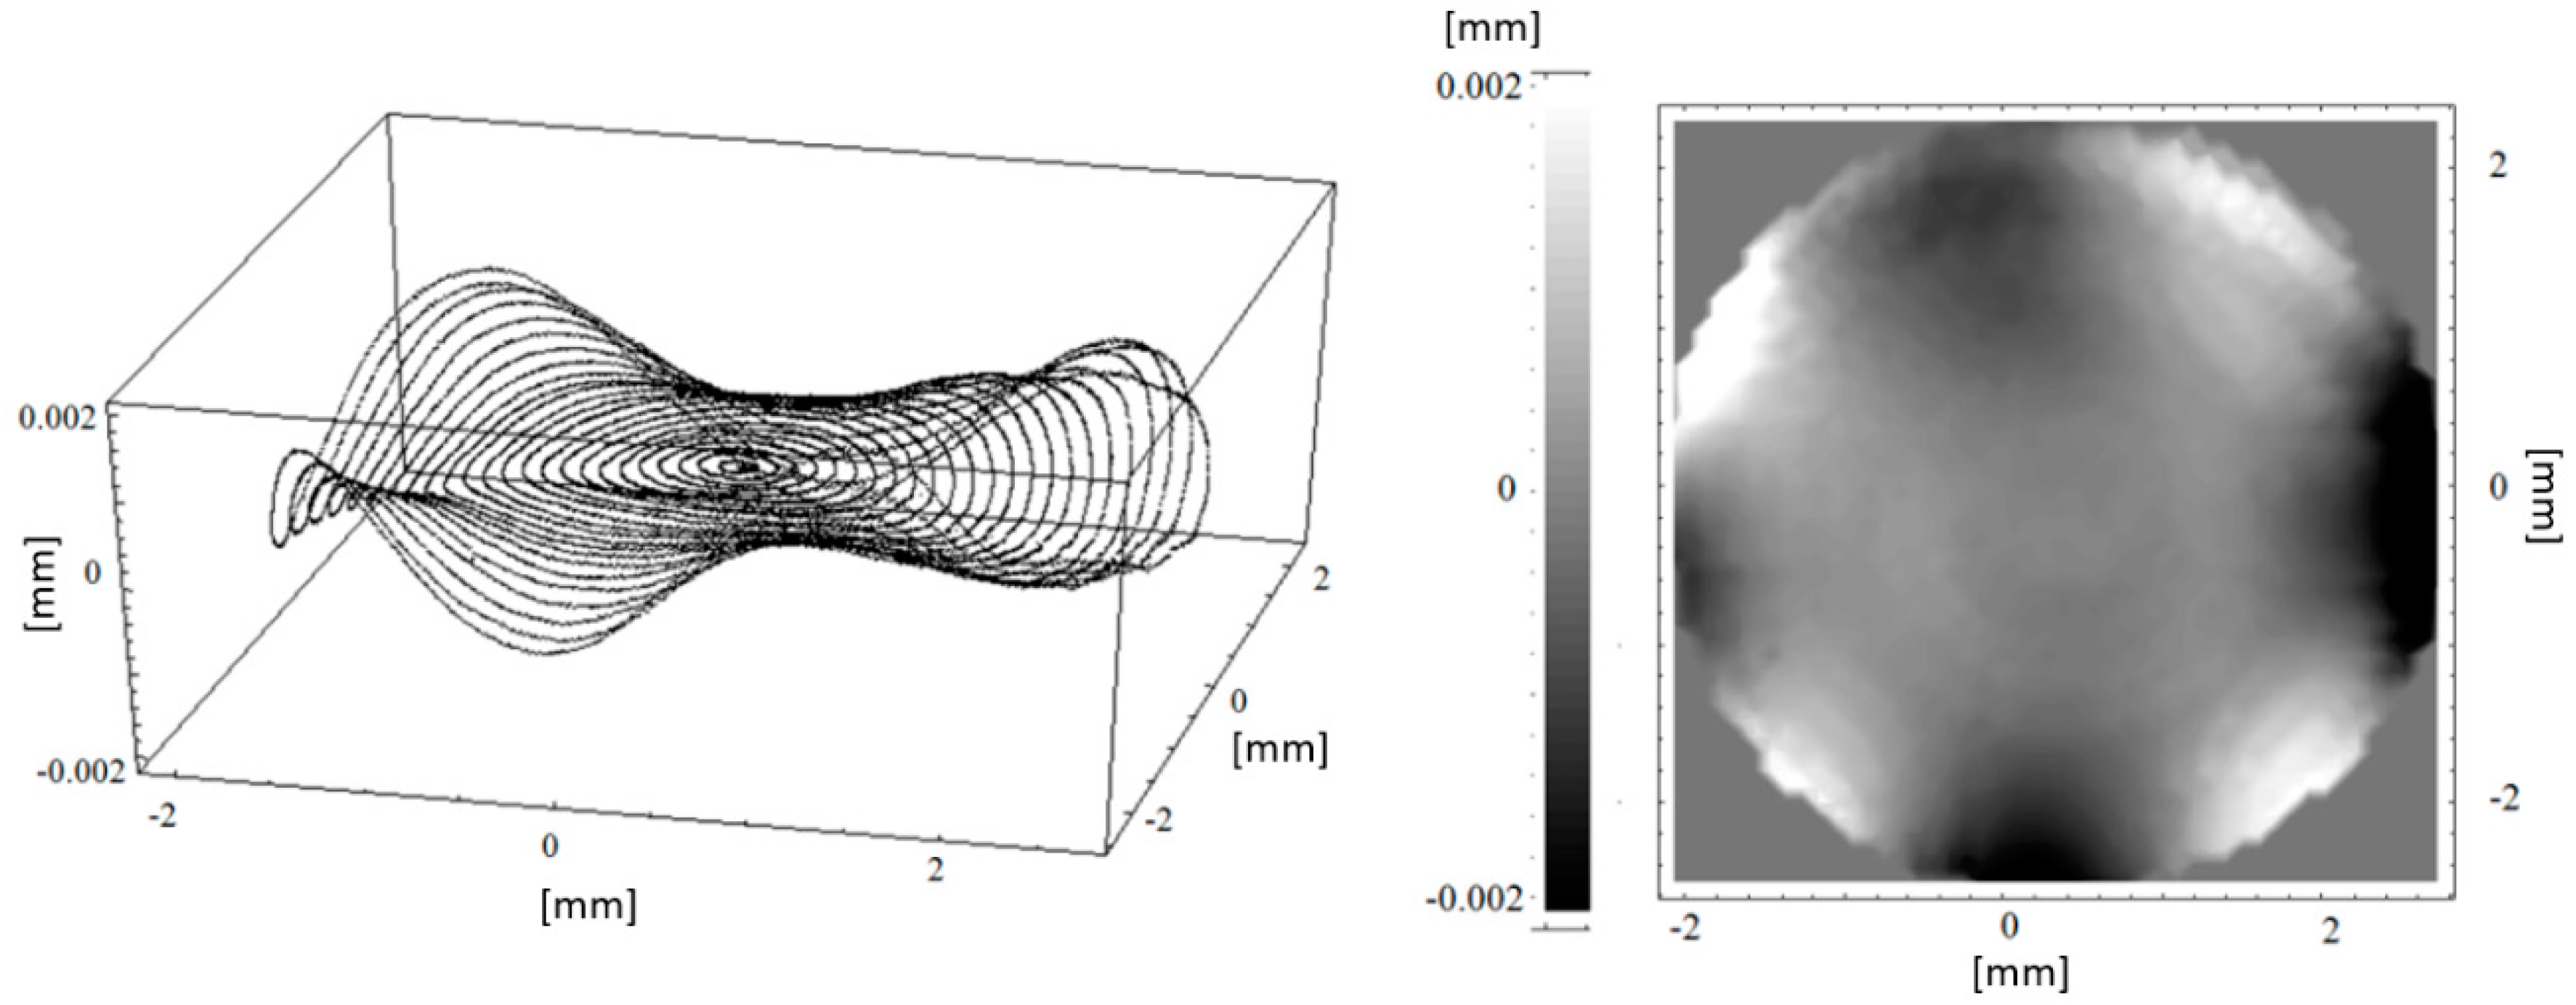
An atomic scale profiler was used to measure the manufactured surfaces. The profiler used was a Panasonic UA3P with a resolution of ±0.1 µm at an inclination angle of 70°. The measurement range was adjusted to φ5 mm. Measurements were conducted on concentric circles, the spatial frequency was set to 48 cyc/aperture, resulting in a radial distance of 0.1 mm. One measurement consists of 50,000 measurement points. The measurement was targeted to detect the surface form deviation error, which is an LSF error. To analyze MSF errors linear scanning of the sample would be the preferred procedure. One advantage of conducting the measurement on radial paths is avoidance of a device oscillation. Figure 2 depicts the residuals in lens sag based on a reduced data set on a 48 × 48 grid (2304 measurement points), plotted along the measurement path (left) and as a contour plot (right). High residues are found at the coordinates near {2 mm, 2 mm} and {2 mm, −2 mm}. Otherwise, the surface looks notably smooth. Some non-uniformly distributed pits can be observed, interpreted as artifacts caused by the tactile measuring process.
3. Analysis and Results
Analysis of the metrology data results in an averaged RMS value of 0.85 µm and an averaged PV value of 8.1 µm. Using RMS and PV residuals to evaluate the optical surface quality, it is obvious, that the smaller an RMS value is, the better the nominal geometry of the surface is resembled. The same holds for PV: the higher the PV value the larger the maximum deviation between measured and nominal surface. However, neither of the two values describe the optical performance due to geometrical deviations. It is not possible to derive how this surface deviation will affect the system’s optical performance. The absolute PV value of 8.1 µm seems to be very small for a 5 mm clear aperture. The same is true for the RMS error below 1 µm. In the event of spherical optics, no one would expect the optical performance to decrease significantly due to these small values. However, using freeform optics an estimation of the impact of geometrical deviations becomes less intuitive.
To analyze the effect of geometric deviations due to the manufacturing processes, the simulation model has to be enhanced by measured surface data. This approach enables simulation and performance analysis of the real manufactured geometry. The surface fit on the measuring points was conducted by means of a polynomial equation, since the nominal surface is also described by a polynomial. The use of higher order polynomial terms is due to the complexity of freeform optics. Surface generation using fourth order polynomials achieved better results than an approximation of the surface based on spline interpolation [20]. Optical surfaces were often fitted by means of Zernike polynomials. Zernike polynomials offer the advantage to describe directly low frequency errors and hence, can be used as direct measure of optical aberrations. Since the individual Alvarez lens part has no meaningful optical effect, optical aberrations cannot be assigned to the individual surfaces directly. Hence, the advantage of using Zernike polynomials does not exist. Alvarez optics generate its optical effect only in conjunction with a second element. Determination of form deviations of freeform surfaces by means of a surface fit is conform to the modified ISO-10110 standard [23].
Table 1 depicts the functions generated by means of the surface fit, the RMS error between the manufactured surface and the fitted function, and the mean error of the surface fit. The mean error as well as the RMS error are small enough to allow a representation of the manufactured optics by the fitted surface function given in Table 1. The simulation model now is enhanced by means of the fitted surface function. A performance simulation based on the enhanced model allows for a comparison of the optical performance with the originally designed nominal freeform surfaces. To quantify the optical performance, the modulation transfer function (MTF) was applied as criterion. The MTF is an accepted criterion to quantify the optical imaging quality of lenses or lens systems [29].
The performance of the manufactured Alvarez-optics was tested in an existing setup in context of the development of the Artificial Accommodation System [8]. The AAS features a modular concept, where housing as well as optical surfaces integrated in the housing is used for different varifocal principles. Originally, the housing is designed for an optical subsystem using a lens moveable along the optical axis to adjust the focal length. Hence, the rear-side optics is a negative aspheric lens. Combining this rear-side optics with an Alvarez-optics, an aspherical inset lens has to be designed to add a positive refraction power to the negative lens of the rear side. The optical performance of the assembly containing the Alvarez-optics suffers from the adaptation of the existing setup. This strategy leads to a degradation of the imaging quality, which can be observed by relatively poor values of the MTF. Nevertheless, this setup is suitable to evaluate our approach to enhance the optical simulation model by means of measurement surface data. The MTF of the central field was calculated using the nominal surface of the Alvarez-optics and the fitted function corresponding to the µIM process. Five different settings of the varifocal optics were used in the calculation corresponding to different states of refraction power, respectively. Table 2 depicts the MTF of the fitted functions with respect to the nominal values and the central field. The optical subsystem used suffers from a dependency of the imaging quality (depicted by the MTF value) on the adjustment of focal length. This effect can be observed in the nominal design as well as for the manufactured optics. The injection-molded optics shows a non-acceptable decline in performance in particular at the infinite focus length.
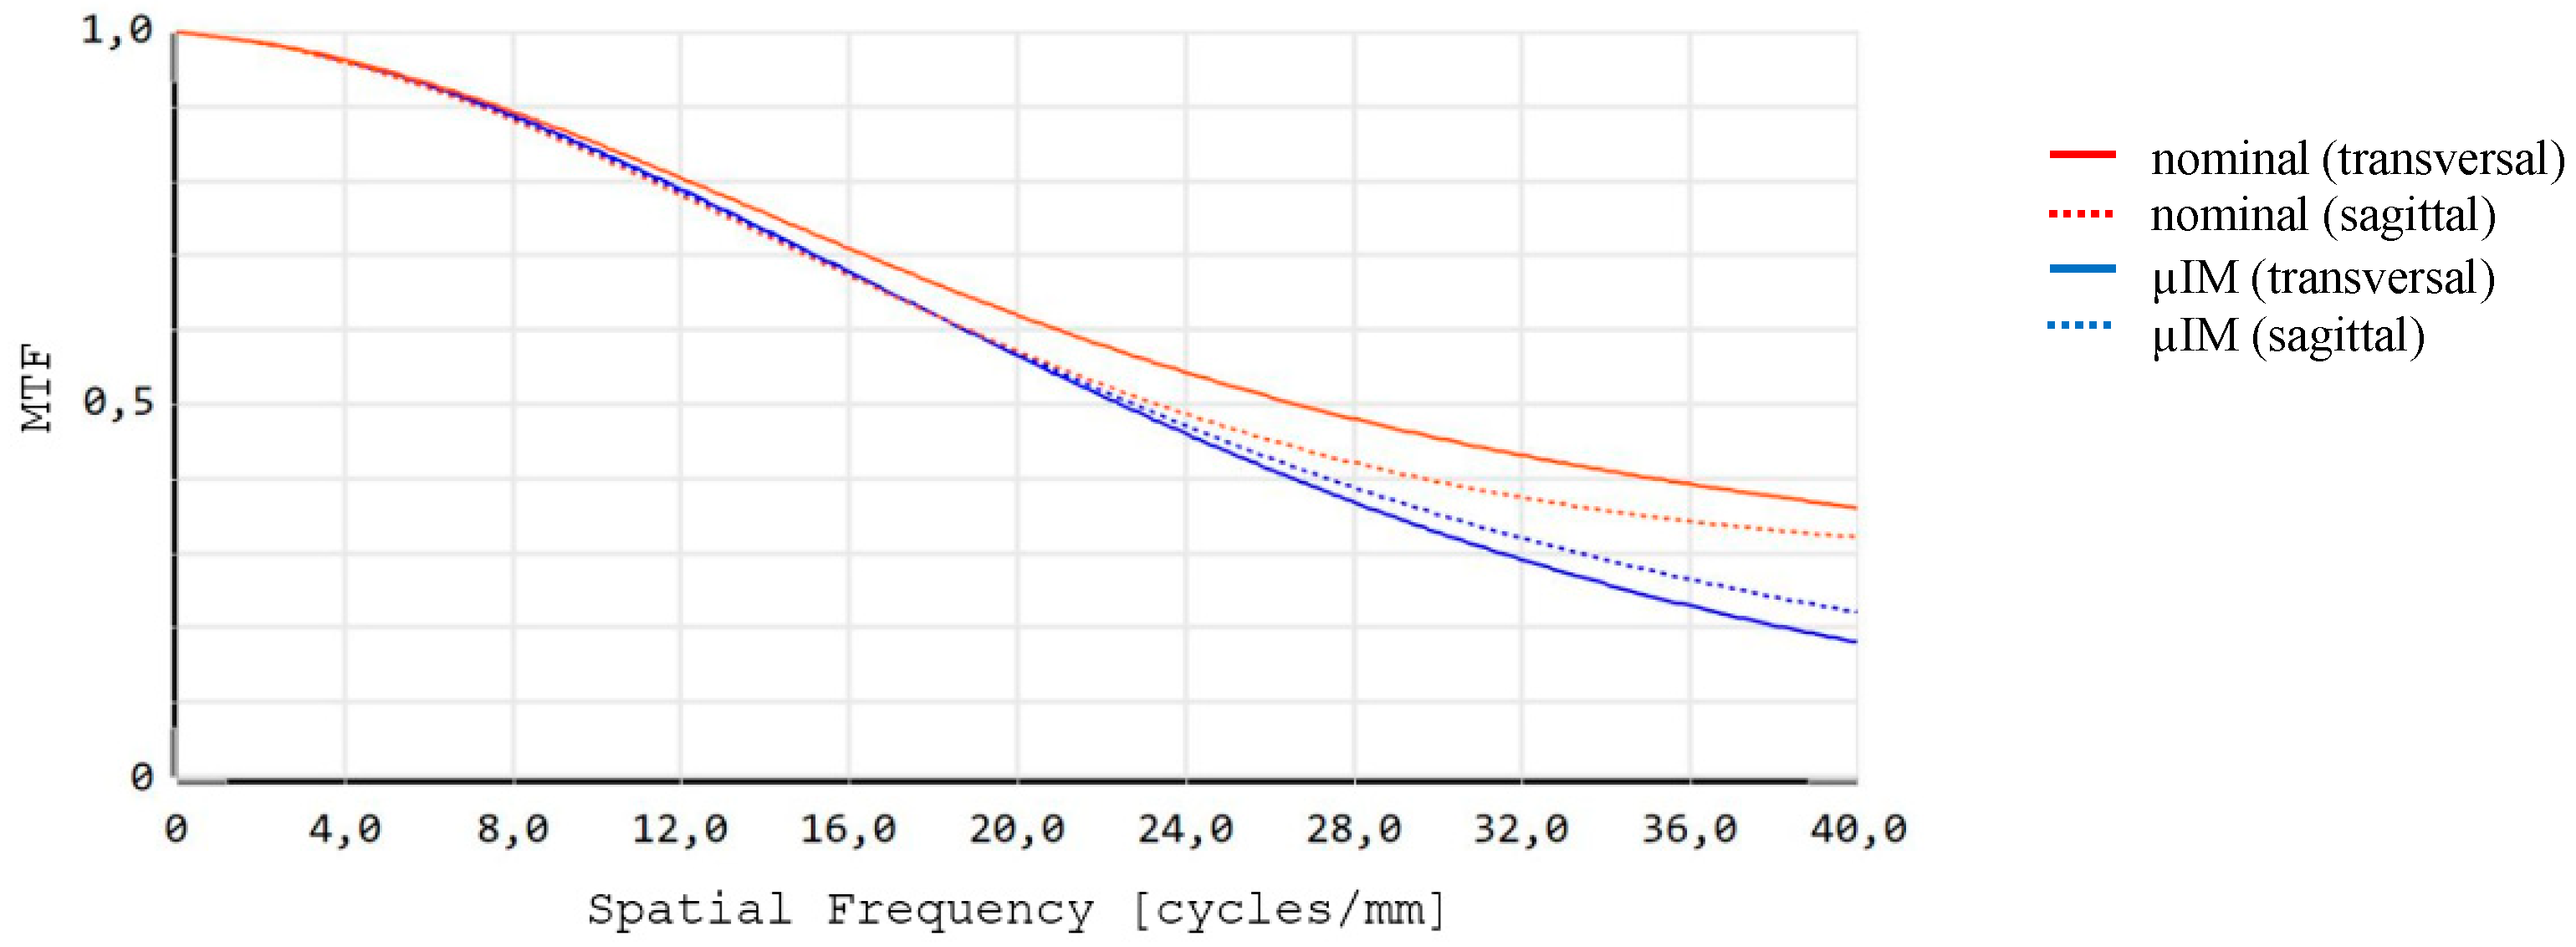
Figure 3 shows the graph of the MTF. Again, the central field is displayed in an adjustment of an infinite focal length. The splitting of the curves in two parts is due to the non-rotationally symmetric shape of the freeform optics. The transversal part is shown as solid line; the sagittal part is represented as dashed line. The red curves describe the MTF of the nominal design, the blue curves represent the MTF of the simulation based on the measurement data of the manufactured Alvarez-optics. The reduced MTF of the manufactured optics is caused by geometrical part deformation occurring in the µIM process. An uneven refractive index distribution may also contribute to the poor MTF. An optimization of the µIM process was conducted to compensate for these two limiting factors. Optimization of the molding process lead to different settings of the process parameters and is described in detail in [28]. Figure 4 presents RMS and PV values of intermediate states of the optimization for four samples, respectively. The initial setting is depicted as “original”. Several corrections led eventually to the final process settings (µIM/comp) featuring a smooth characteristic over all four samples. Based on the µIM/comp-process, modified Alvarez-optics were manufactured.
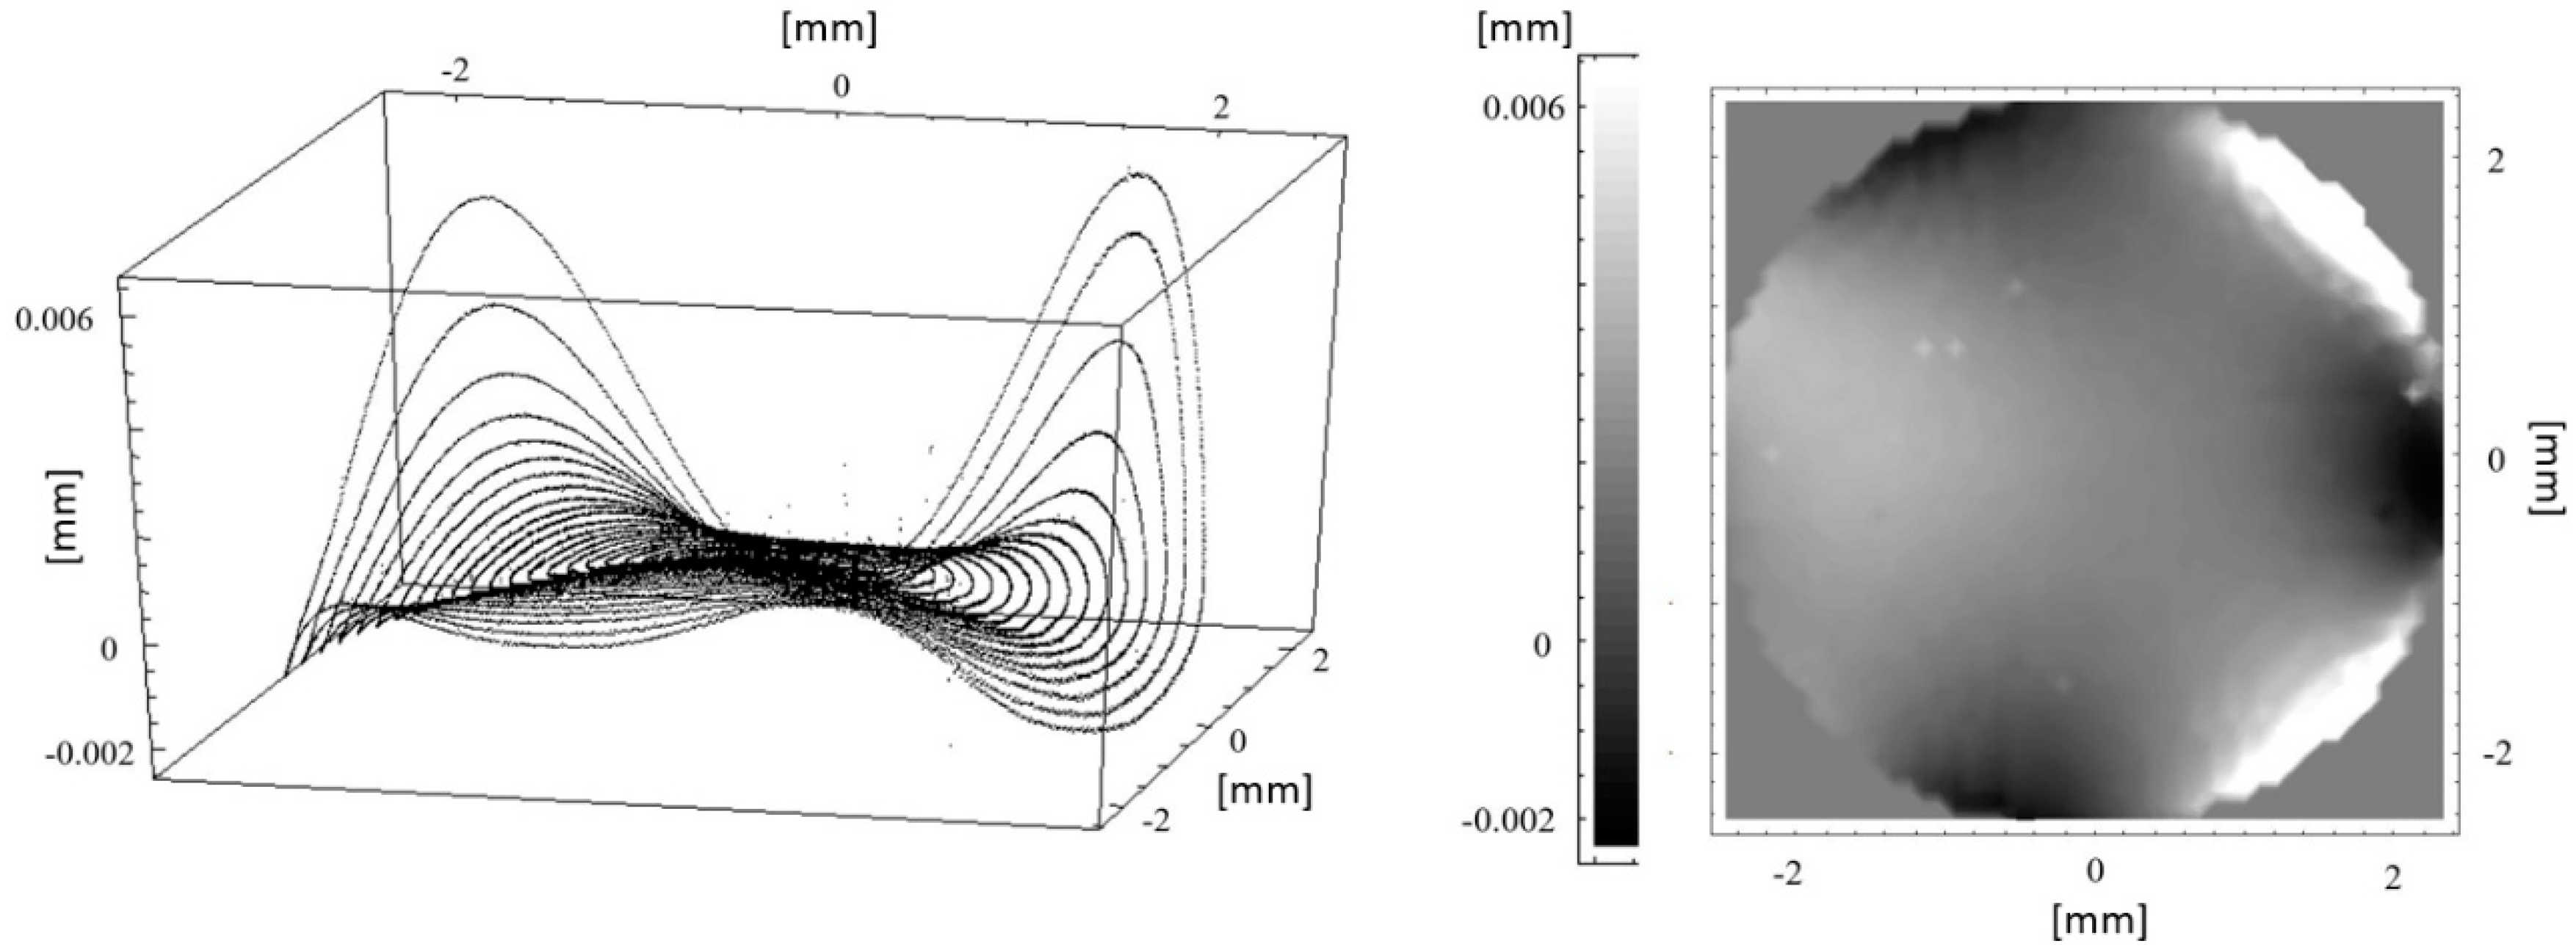
Figure 5 shows the surface residuals for the compensated Alvarez-lens parts manufactured by means of the µIM/comp-process.
Noticeable is the smooth surface. The improvement of the surface form deviation can be seen clearly by comparing Figure 2 and Figure 5. Of course, this aspect can also be seen regarding the PV and RMS errors, resulting in 4.1 µm and 0.34 µm, respectively. Figure 6 shows the PV and RMS value of the Alvarez-surface manufactured by the two microinjection molding processes. The improvement of the compensated surface manufactured by means of the µIM/comp-process is obvious.
To see if the optical performance of the freeform optics manufactured by the µIM/comp-process meets the criterion to preserve the MTF of the nominal Alvarez-optics, the measured surfaces were used to simulate the performance of the compensated Alvarez-optics. The approach used is the same as described in case of the µIM process. Table 3 depicts the function used in the enhanced model.
Table 4 shows the resulting, simulated MTF based on the surface representation shown in Table 3 compared again with the nominal surface.
The results presented in Table 4 show that the optics manufactured using the µIM/comp-process performs very closely to the nominal value. The deviations in performance are as small as 2% in maximum. The effect of improvement of the MTF by means of the µIM/comp-process can also be observed in Figure 7 showing the graphs of the simulated MTFs for the different molding processes (µIM and µIM/comp) in comparison with the nominal optics. The graphs are depicted for the central field and an allocation of infinite focal length.
It is of no doubt that the values of RMS and PV are very useful to describe surface form deviations and are of importance in the characterization of manufacturing quality. This research was designed to show that PV and RMS errors alone are not sufficient to enable statements of the optical performance of freeform optics. In the example shown even surface accuracies of 8.1 µm PV and 0.85 µm RMS do not meet the performance requirements for a clear aperture of 5.0 mm. This was shown in case of the uncompensated microinjection-molded freeform optics (see Figure 3). Using metrology data to enhance the model offers the possibility to predict reasonably the expected optical performance of a manufactured freeform optics.
4. Conclusions
Freeform optics can be seen as an enabling technology since they allow completely new designs of optical systems. Classical optical components have a rotational symmetric shape. The tolerances are therefore describable by simple parameters, e.g., radius. Since freeform optics are lacking symmetry, such simple tolerance parameters cannot be found. This makes the estimation of shape tolerances nearly impossible as well as the estimation of the impact of manufacturing tolerances on the optical performance. Doubtless, the use of PV and RMS data is very important to characterize and analyze the manufactured optics with respect to quality and accuracy of the manufacturing processes. However, a performance prediction of a fabricated optical system using freeform optics renders to be impossible if only based on PV and RMS data. For performance prediction of the manufactured freeform optics in an optical system, we propose the use of measurement data of the manufactured parts to enhance the optical model. The enhanced model will better resemble the real system hence simulation results can also be used to improve process optimization.
The approach was shown using Alvarez-optics as freeform surfaces. As manufacturing process, a µIM process was used. It turned out, that freeform surfaces with seemingly insignificant PV and RMS values could cause severe effects on the optical performance. This was shown for a freeform optics with a 5 mm clear aperture by way of simulation of an enhanced model. Optimization of the µIM process leads to improved optics with a maximum deviation of only 2% from the nominal MTF values. These results show that enhancing the simulation model by means of metrology data will allow for performance prediction of the optical system. This approach can also be used to evaluate and optimize process parameters to improve the parts manufactured.
Author Contributions
I.S. developed the conceptualization of the design approach as well as the underlying methodology. Furthermore, he performed the optical simulation and formal analysis as well as the validation. He also wrote the original draft. A.Y.Y. conceived and designed the advanced microinjection molding process, did investigations with respect to the manufacturing parameters, manufactured the Alvarez-optics, and acquired funding. U.G. conceived the system integration of the optics, acquired funding, administrated the project, and contributed the respective text passages as well as reviewing and editing of the complete draft.
Funding
German Federal Ministry of Education and Research (BMBF) (16SV5472K).
Acknowledgments
The work presented in this paper was conducted under the KD OptiMi2 programme (grant no. 16SV5472K), subtopic B “Fabrication of housing shells & measurement data” funded by the German Federal Ministry of Education and Research. The authors would also like to acknowledge Likai Li from the Ohio State University for his support in manufacturing of the freeform optics and Erik Beckert and Ralf Steinkopf from Fraunhofer-Institut für Angewandte Optik und Feinmechanik (IOF) for surface measurement. Furthermore, we acknowledge support by Deutsche Forschungsgemeinschaft and Open Access Publishing Fund of Karlsruhe Institute of Technology.
Conflicts of Interest
The authors declare no conflict of interest. The funders had no role in the design of the study; in the collection, analyses, or interpretation of data; in the writing of the manuscript, or in the decision to publish the results.
References
- Fang, F.Z.; Zhang, X.D.; Weckenmann, A.; Zhang, G.X.; Evans, C. Manufacturing and measurement of freeform optics. CIRP Ann.–Manuf. Technol. 2013, 62, 823–846. [Google Scholar] [CrossRef]
- Owen, J.D.; Davies, M.A.; Schmidt, D.; Urruti, E.H. On the ultra-precision diamond machining of chalcogenide glass. CIRP Ann.–Manuf. Technol. 2015, 64, 113–116. [Google Scholar] [CrossRef]
- Chen, F.; Wang, K.; Qin, Z.; Wu, D.; Luo, X.; Liu, S. Design method of high-efficient LED headlamp lens. Opt. Express 2010, 18, 20926–20938. [Google Scholar] [CrossRef] [PubMed]
- Hsieh, C.; Li, Y.; Hung, C. Modular design of the LED vehicle projector headlamp system. Appl. Opt. 2013, 52, 5221–5229. [Google Scholar] [CrossRef] [PubMed]
- Focus on Vision. Available online: http://www.focus-on-vision.org/en/adjustable-glasses (accessed on 26 September 2018).
- Barbero, S.; Rubinstein, J. Power-adjustable sphero-cylindrical refractor comprising two lenses. Opt. Eng. 2013, 52, 063002. [Google Scholar] [CrossRef]
- Simonov, A.N.; Vdovin, G.; Rombach, M.C. Cubic optical elements for an accommodative intraocular lens. Opt. Express 2006, 14, 7757–7775. [Google Scholar] [CrossRef] [PubMed]
- Sieber, I.; Martin, T.; Gengenbach, U. Robust Design of an Optical Micromachine for an Ophthalmic Application. Micromachines 2016, 7, 85. [Google Scholar] [CrossRef] [PubMed]
- Duerr, F.; Thienpont, H. Analytic design of a zoom XY-beam expander with freeform optical surfaces. Opt. Express 2015, 23, 30438–30447. [Google Scholar] [CrossRef] [PubMed]
- Ye, J.; Chen, L.; Li, X.; Yuan, Q.; Gao, Z. Review of optical freeform surface representation technique and its application. Opt. Eng. 2017, 56, 110901. [Google Scholar] [CrossRef]
- Alvarez, L.W.; Humphrey, W.E. Variable-Power Lens and System. U.S. Patent 3,507,5651, 21 April 1970. [Google Scholar]
- Bernet, S.; Ritsch-Marte, M. Adjustable refractive power from diffractive moiré elements. Appl. Opt. 2008, 47, 3722–3730. [Google Scholar] [CrossRef] [PubMed]
- Bernet, S.; Harm, W.; Ritsch-Marte, M. Demonstration of focus-tunable diffractive Moiré-lenses. Opt. Express 2013, 21, 6955–6966. [Google Scholar] [CrossRef] [PubMed]
- Harm, W.; Bernet, S.; Ritsch-Marte, M.; Harder, I.; Lindlein, N. Adjustable diffractive spiral phase plate. Opt. Express 2015, 23, 413–421. [Google Scholar] [CrossRef] [PubMed]
- Busch, S.F.; Balzer, J.C.; Bastian, G.; Town, G.E.; Koch, M. Extending the Alvarez-Lens Concept to Arbitrary Optical Devices: Tunable Gratings, Lenses, and Spiral Phase Plates. IEEE Trans. Terahertz Sci. Technol. 2017, 7, 320–325. [Google Scholar] [CrossRef]
- Grewe, A.; Fesser, P.; Sinzinger, S. Diffractive array optics tuned by rotation. Appl. Opt. 2017, 56, A89–A96. [Google Scholar] [CrossRef]
- Sieber, I.; Martin, T.; Stiller, P. Tunable refraction power by mutual rotation of helical lens parts. Proc. SPIE 2017, 10375, 103750L. [Google Scholar]
- Sieber, I.; Stiller, P.; Moser, D.; Gengenbach, U. Design-for-manufacture of a varifocal rotation optics. Proc. SPIE 2018, 10690, 106901B. [Google Scholar] [CrossRef]
- Sieber, I.; Stiller, P.; Gengenbach, U. Design studies of varifocal rotation optics. Opt. Eng. 2018. [Google Scholar]
- Sieber, I.; Li, L.; Gengenbach, U.; Beckert, E.; Steinkopf, R.; Yi, A. Optical performance simulation of free-form optics for an eye implant based on a measurement data enhanced model. Appl. Opt. 2016, 55, 6671–6679. [Google Scholar] [CrossRef] [PubMed]
- Sieber, I. Comprehensive modeling and simulation of micro-optical subsystems. Proc. SPIE 2012, 8550, 855002. [Google Scholar]
- ISO 10110, Optics and Photonics–Preparation of Drawings for Optical Elements and Systems. Available online: www.iso.org (accessed on 26 September 2018).
- Youngworth, R.N.; Kiontke, S.R.; Aikens, D.M. Implementing ISO standard-compliant freeform component drawings. Opt. Eng. 2016, 55, 071205. [Google Scholar]
- Filhaber, J. Artificial Large optics: Mid-spatial-frequency errors: The hidden culprit of poor optical performance. LaserFocusWorld, 8 August 2013. [Google Scholar]
- Youngworth, R.N.; Stone, B.D. Simple estimates for the effects of mid-spatial-frequency surface errors on image quality. Appl. Opt. 2000, 39, 2198–2209. [Google Scholar] [CrossRef] [PubMed]
- Sieber, I.; Rübenach, O. Integration of measurement data in the comprehensive modelling approach. Proc. SPIE 2013, 8884, 88841F. [Google Scholar]
- Li, L.; Raasch, T.W.; Sieber, I.; Beckert, E.; Steinkopf, R.; Gengenbach, U.; Yi, A.Y. Fabrication of Microinjection Molded Miniature Freeform Alvarez Lenses. Appl. Opt. 2014, 53, 4248–4255. [Google Scholar] [CrossRef] [PubMed]
- Li, L.; Sieber, I.; Beckert, E.; Steinkopf, R.; Yi, A.Y. Design and fabrication of microinjection molded miniature freeform alvarez lenses. In Proceedings of the ASPE/ASPEN Summer Topical Meeting, Kohala Coast, HI, USA, 26–27 June 2014; pp. 13–16. [Google Scholar]
- Smith, G.H. Practical Computer-Aided Lens Design; Willmann-Bell: Richmond, VA, USA, 1998; pp. 157–170. ISBN 0-943396-57-3. [Google Scholar]
Figure 1.
Freeform lens manufactured by the µIM process.

Figure 2.
Surface residuals with regard to the nominal surface: plotted on the concentric measuring path (left), contour plot (right).
Figure 2.
Surface residuals with regard to the nominal surface: plotted on the concentric measuring path (left), contour plot (right).

Figure 3.
MTF of the manufactured optics compared with the nominal design.

Figure 4.
RMS and PV-values of intermediate states of the process optimization for four samples, respectively. “original” means the initial setting.
Figure 4.
RMS and PV-values of intermediate states of the process optimization for four samples, respectively. “original” means the initial setting.

Figure 5.
Surface residuals of the freeform optics manufactured using the µIM/comp-process (data set on a reduced 48 × 48 grid). Left: plotted on the concentric measuring path; right: Contour plot.
Figure 5.
Surface residuals of the freeform optics manufactured using the µIM/comp-process (data set on a reduced 48 × 48 grid). Left: plotted on the concentric measuring path; right: Contour plot.

Figure 6.
PV and RMS values of the individual optics manufactured. Left: µIM; right: µIM/comp.

Figure 7.
MTF derived with the compensated injection-molded freeform optics included (green) in comparison with Figure 3.
Figure 7.
MTF derived with the compensated injection-molded freeform optics included (green) in comparison with Figure 3.


Table 1.
Fitted function and its parameters. RMS and mean error describe the fit accuracy with respect to the measured data.
Table 1.
Fitted function and its parameters. RMS and mean error describe the fit accuracy with respect to the measured data.
| Surface Functionz (x,y) = a1 x4 + a2 x3y + a3 x2y2 + a4 xy3 + a5 y4 + a6 x3 + a7 x2y + a8 xy2 + a9 y3 + a10 x2 + a11 xy + a12 y2 + a13 x + a14 y | ||||
|---|---|---|---|---|
| Injection-Molded Surface | Parameter | RMS [µm] | Mean Error [1 × 10⁻¹⁶ µm] | |
| a1 = 1.139 × 10⁻⁴ a5 = −8.416 × 10⁻⁵ a7 = 0.01832 a8 = −9.148 × 10⁻⁵ a9 = 6.636 × 10⁻³ | a10 = 1.335 × 10⁻⁴ a11 = 2.688 × 10⁻⁴ a12 = 1.184 × 10⁻⁴ a14 = 2.915 × 10⁻³ | 0.105 | −1.28 | |
Table 2.
Modulation transfer function (MTF) of the manufactured optics compared with the nominal design (central field, evaluated at 40 cyc/mm).
Table 2.
Modulation transfer function (MTF) of the manufactured optics compared with the nominal design (central field, evaluated at 40 cyc/mm).
| Focal Length [m] | MTF Nominal | MTF Manufactured | Relative MTF [%] |
|---|---|---|---|
| ∞ | 0.34 | 0.2 | 59 |
| 4 | 0.49 | 0.43 | 88 |
| 0.667 | 0.66 | 0.64 | 97 |
| 0.364 | 0.63 | 0.54 | 86 |
| 0.263 | 0.55 | 0.43 | 78 |
Table 3.
Function of the fitted point clouds as well as the RMS and mean errors showing the accuracy of the fit.
Table 3.
Function of the fitted point clouds as well as the RMS and mean errors showing the accuracy of the fit.
| Surface Functionz (x, y) = a1 x4 + a2 x3y + a3 x2y2 + a4 xy3 + a5 y4 + a6 x3 + a7 x2y + a8 xy2 + a9 y3 + a10 x2 + a11 xy + a12 y2 + a13 x + a14 y | ||||
|---|---|---|---|---|
| Surface | Parameter | RMS [µm] | Mean Error [1 × 10⁻¹⁶ µm] | |
| µIM/comp | a1 = −3.182 × 10⁻⁶ a2 = −3.180 × 10⁻⁵ a3 = −1.482 × 10⁻⁴ a5 = 5.137 × 10⁻⁵ a6 = −1.911 × 10⁻⁵ a7 = 0.0195 | a8 = 6.796 × 10⁻⁵ a9 = 6.396 × 10⁻³ a10 = 1.335 × 10⁻⁴ a11 = 1.235 × 10⁻⁴ a12 = 8.923 × 10⁻⁵ a13 = −1.675 × 10⁻⁵ a14 = 1.235 × 10⁻⁴ | 0.147 | −0.85 |
Table 4.
MTF of the manufactured optics compared with the nominal design (central field, evaluated at 40 cyc/mm).
Table 4.
MTF of the manufactured optics compared with the nominal design (central field, evaluated at 40 cyc/mm).
| Focal Length [m] | MTF Nominal | MTF µIM/Comp | Relative MTF µIM/Comp [%] |
|---|---|---|---|
| ∞ | 0.34 | 0.34 | 100 |
| 4 | 0.49 | 0.47 | 98 |
| 0.667 | 0.66 | 0.65 | 98 |
| 0.364 | 0.63 | 0.63 | 101 |
| 0.263 | 0.55 | 0.55 | 100 |
© 2018 by the authors. Licensee MDPI, Basel, Switzerland. This article is an open access article distributed under the terms and conditions of the Creative Commons Attribution (CC BY) license (http://creativecommons.org/licenses/by/4.0/).
Share and Cite
MDPI and ACS Style
Sieber, I.; Yi, A.Y.; Gengenbach, U. Metrology Data-Based Simulation of Freeform Optics. Appl. Sci. 2018, 8, 2338. https://doi.org/10.3390/app8122338
AMA Style
Sieber I, Yi AY, Gengenbach U. Metrology Data-Based Simulation of Freeform Optics. Applied Sciences. 2018; 8(12):2338. https://doi.org/10.3390/app8122338
Chicago/Turabian StyleSieber, Ingo, Allen Y. Yi, and Ulrich Gengenbach. 2018. "Metrology Data-Based Simulation of Freeform Optics" Applied Sciences 8, no. 12: 2338. https://doi.org/10.3390/app8122338
Note that from the first issue of 2016, this journal uses article numbers instead of page numbers. See further details here.