Dispersion and Pressure Sensitivity of Carbon Nanofiber-Reinforced Polyurethane Cement

1
School of Civil Engineering, North Forestry University, Harbin 150040, China
2
Architecture and Civil Engineering School, Qiqihar University, No. 42, Wenhua Street, Qiqihar 161006, China
*
Author to whom correspondence should be addressed.
Appl. Sci. 2018, 8(12), 2375; https://doi.org/10.3390/app8122375
Submission received: 3 November 2018
/
Revised: 20 November 2018
/
Accepted: 20 November 2018
/
Published: 24 November 2018
(This article belongs to the Special Issue New Materials and Techniques for Environmental Science)
Abstract
:The sensitivity of carbon nanofiber polyurethane cement (CNFPUC) was evaluated to determine whether the cement can act as an intelligent reinforcement material. The percolation thresholds at different polymer-to-cement ratios were determined through experimentation. Taking a specific carbon nanofiber (CNF) content of the percolation zone, several CNFPUC mixtures with different poly-ash ratios and silica fume contents were made. They were then sampled from the mixture and poured into a hexahedron CNFPUC test block; the coefficient of variation of resistance and the piezoresistive characteristics under axial load were examined and the blocks were examined by scanning electron microscope. The sensitivity of the CNFPUC mixture was evaluated via the resistance variation coefficient of a sample hexahedron. For different CNF dosages, the critical value of the variation coefficient was used to assess the sensitivity characteristic by fitting the conic curve. These findings may provide a novel and simple method for determining the sensitivity of CNFPUC mixtures.
1. Introduction
Two-component non-aqueous reactive polyurethane (PU) is mainly composed of polyols and isocyanates, which are used as cementitious materials. Adding cement into PU leads to polyurethane cement (PUC), which has the advantages of high compressive strength, excellent fluidity, environmental friendliness, low weight and easy construction. Therefore, PUC has been gradually applied for the reinforcement of highways and bridges and in the construction industry [1,2,3,4,5].
With the progression of science and technology, people are demanding higher functionality of building structures, in hopes of improving the carrying capacity and deformation capacity of structures through a strengthening process while monitoring and diagnosing the health of the structure in real-time [6,7,8,9]. In the past, the cement base was the main research object in the domain of intelligent materials and polymer base was rarely used as a reinforcement material [10,11]. By adding carbon nanofiber (CNF) to PUC reinforcement materials, a carbon nanocarbon fiber polyurethane cement material (CNFPUC) could be made and thus, the fluidity of the mixture could be improved, with the advantages of low density, high specific modulus, high specific strength, high conductivity, thermal stability, compact structure and so forth [12,13,14]. Not only is CNFPUC used as a structural reinforcement material, it also has the conductive properties necessary to satisfy engineering application requirements. By monitoring the resistivity change in CNFPUC, it is possible to understand the internal damage development process of CNFPUC and achieve self-induction of stress and strain. Moreover, by utilizing the super bond ability of concrete and CNFPUC and the plane cross-section assumption of a reinforced rear beam and deformation coordination of the columns, the functions of self-perception, self-diagnosis and self-monitoring of components can be realized, which may allow for early prediction of damage and defects, thereby reducing the loss of life and property of the masses [15,16].
Owing to the high specific surface area and aspect ratio of carbon nanofiber, the Vander Waals force between CNF leads to fiber winding and agglomeration, resulting in poor dispersion and the production of weak areas in the matrix [17,18]. However, the conductive effect of CNFPUC is influenced by the worst section in terms of the CNF dispersion or the section having the least amount of fibers due to poor fiber dispersion, which may critically reduce the effectivity of CNF and electrical conductivity in the PU Matrix [19]. Thus, the sensitivity of CNFPUC as a functional material is weakened. The degree of uniform dispersion of CNF is a key factor for the sensitivity of CNFPUC as a functional material.
So far, with the exception of scanning electron microscope (SEM) observation used for estimating the dispersion effect, there is no uniform criterion to evaluate the dispersion and its effect on the material. Currently, the main methods for evaluating the dispersion of carbon nanofiber in the cement matrix include: the fresh mix method, hardening specimen resistance method and hardening specimen section morphology method.
The fresh mix slurry method involves taking approximately the same quantity of samples from different parts of the fresh mix, calculating the coefficient of variation of the carbon fiber and analyzing the dispersion of carbon fibers in the matrix. This method can quantitatively evaluate the dispersion uniformity of carbon fibers in different mixtures by using the dispersion coefficient. However, it can only reflect the degree of fiber dispersion in the mixture before molding and cannot reflect the dispersion of carbon fibers in hardened specimens; therefore, it is not suitable for the dispersion discrimination of a polymer matrix. The hardening specimen section morphology method [20] involves observation of the morphology of a specimen’s cross section using a scanning electron microscope and the exploration of carbon fiber dispersion; however, this method cannot reflect the dispersion of carbon fiber macroscopically owing to the limitation of sampling location and quantity and the high cost of testing. The hardening specimen resistance method [19,21] indirectly infers the dispersion of fibers in the carbon fiber cement matrix composites by calculating the coefficient of variation of resistance in each samples set. Although the dispersion status of carbon fibers in different hardened specimens can be qualitatively estimated using this method, it is impossible to predict the dispersion of carbon fiber in a single sample. Therefore, more samples are needed in each group, which makes the process more expensive.
Ozyurt [22] reported that the uniform dispersion of fibers in steel fiber reinforced concrete specimens could be evaluated using the alternating current (AC) impedance method and the coefficient of variation of the ratio of conductivity to the matrix conductivity of composites could be calculated, which may characterize the dispersion of conductive fibers in concrete columns. Nevertheless, there must be a double arcing phenomenon in the AC impedance spectrum, which presents a significant limitation. Z. Wang et al. [23] suggested that the dispersion effect of fiber can be quantitatively evaluated using computed tomography (CT), albeit with high cost. There is currently an urgent need to establish a more essential and quantitative relationship between the microstructure and properties of materials, to further understand the conductivity of materials and guide the design of new materials.
In this study, we attempted to improve the hardening specimen resistance method and combined it with the fresh mix paste method and the section morphology method. Samples having the same quantity were obtained from different parts of mixed CNFPUC and subsequently developed into hexahedron specimens; then the coefficient of variation of the hexahedron resistance was used to judge the dispersion of CNF. Further, we observed the distribution of CNF in the PU matrix by using the SEM method and discriminated the dispersion degree of CNF in PU in the entire CNFPUC mixture. By comparing the piezoresistive characteristics of the CNFPUC, we explored the relationship between the coefficient of variation of hexahedron resistance and the sensitivity of the CNFPUC in the elastic loading process under different ratios of polymer to silicon-ash and silica fume content. In case of differences in the CNF dosage, the critical value of the sampling coefficient variation could be used to judge the sensitivity of the CNF by fitting the conic curve, which provides a simple and convenient method for evaluating the sensitivity of the CNFPUC mixtures.
2. Materials and Methods
2.1. Materials
The cement was 42.5 ordinary Portland cement produced by the Harbin Yatai cement factory (Harbin, China). The composition of the cement is presented in Table 1. The specific surface area was 360 m2/kg by blaine method and the remaining of 45 μm was 6.32%. The polyisocyanate was produced by Wanhua Chemical Group Co., Ltd. in Shanghai and the polyol for this study was produced by Linuo Chemical Group Co., Ltd. in Zibo of Shandong Province. The carbon nanofibers were manufactured by Nanjing Xianfeng Nanomaterials Technology Co., Ltd. (Nanjing, China) (see Table 2). The Silica fume is provided by the Xinlei Mineral Powder Processing Plant in Xingtang county of Shijiazhuang, China (see Table 3).
2.2. Preparation of CNFPUC Specimen
First, the CNF was dried to a constant weight at 120 °C, to remove the moisture absorbed during storage. Next, the surface of the CNF underwent oxidation treatment, in which they were immersed in a mixture of concentrated sulfuric acid and concentrated nitric acid (1:3 by volume) for 2 h and subsequently washed in clear water and dried at 120 °C. Using a high precision electronic scale (Diheng Electronics Co., Ltd., Shenzhen, China) (accurate to 0.001 g), the CNF was accurately weighed, added into the prepared polyol and dispersed by the scientz-750f ultrasonic dispersion instrument (Ningbo Xinzhi) for 1 h at 60 °C. Second, the polyols mixed with the CNF was dewatered at 120 °C for 2 h (vacuum degree was 0.1 MPa) and rapidly added into the weighing cement; next, they were dried at 200 °C for 2 h. Subsequently, they were put into the JJ-5 type planetary cement mortar mixer (Construction Engineering Test equipment Co., Ltd., Wuxi, China) at a low speed rotation for 30 s; later the isocyanate was added evenly and stirred at a high speed for 60 s and silica fume was slowly added in a stirring process. Finally the stirred CNFPUC was poured into the mold coated with a few mold-release agents. Continuous vibration was needed during the molding process in order for the bubbles to gather and escape. After 24 h, the mold was knocked out and cured at room temperature for 3 days. The experimental temperature was 14–17 °C and the relative humidity was 30–50%.
2.3. Static Resistivity Measurement Method
Measurement
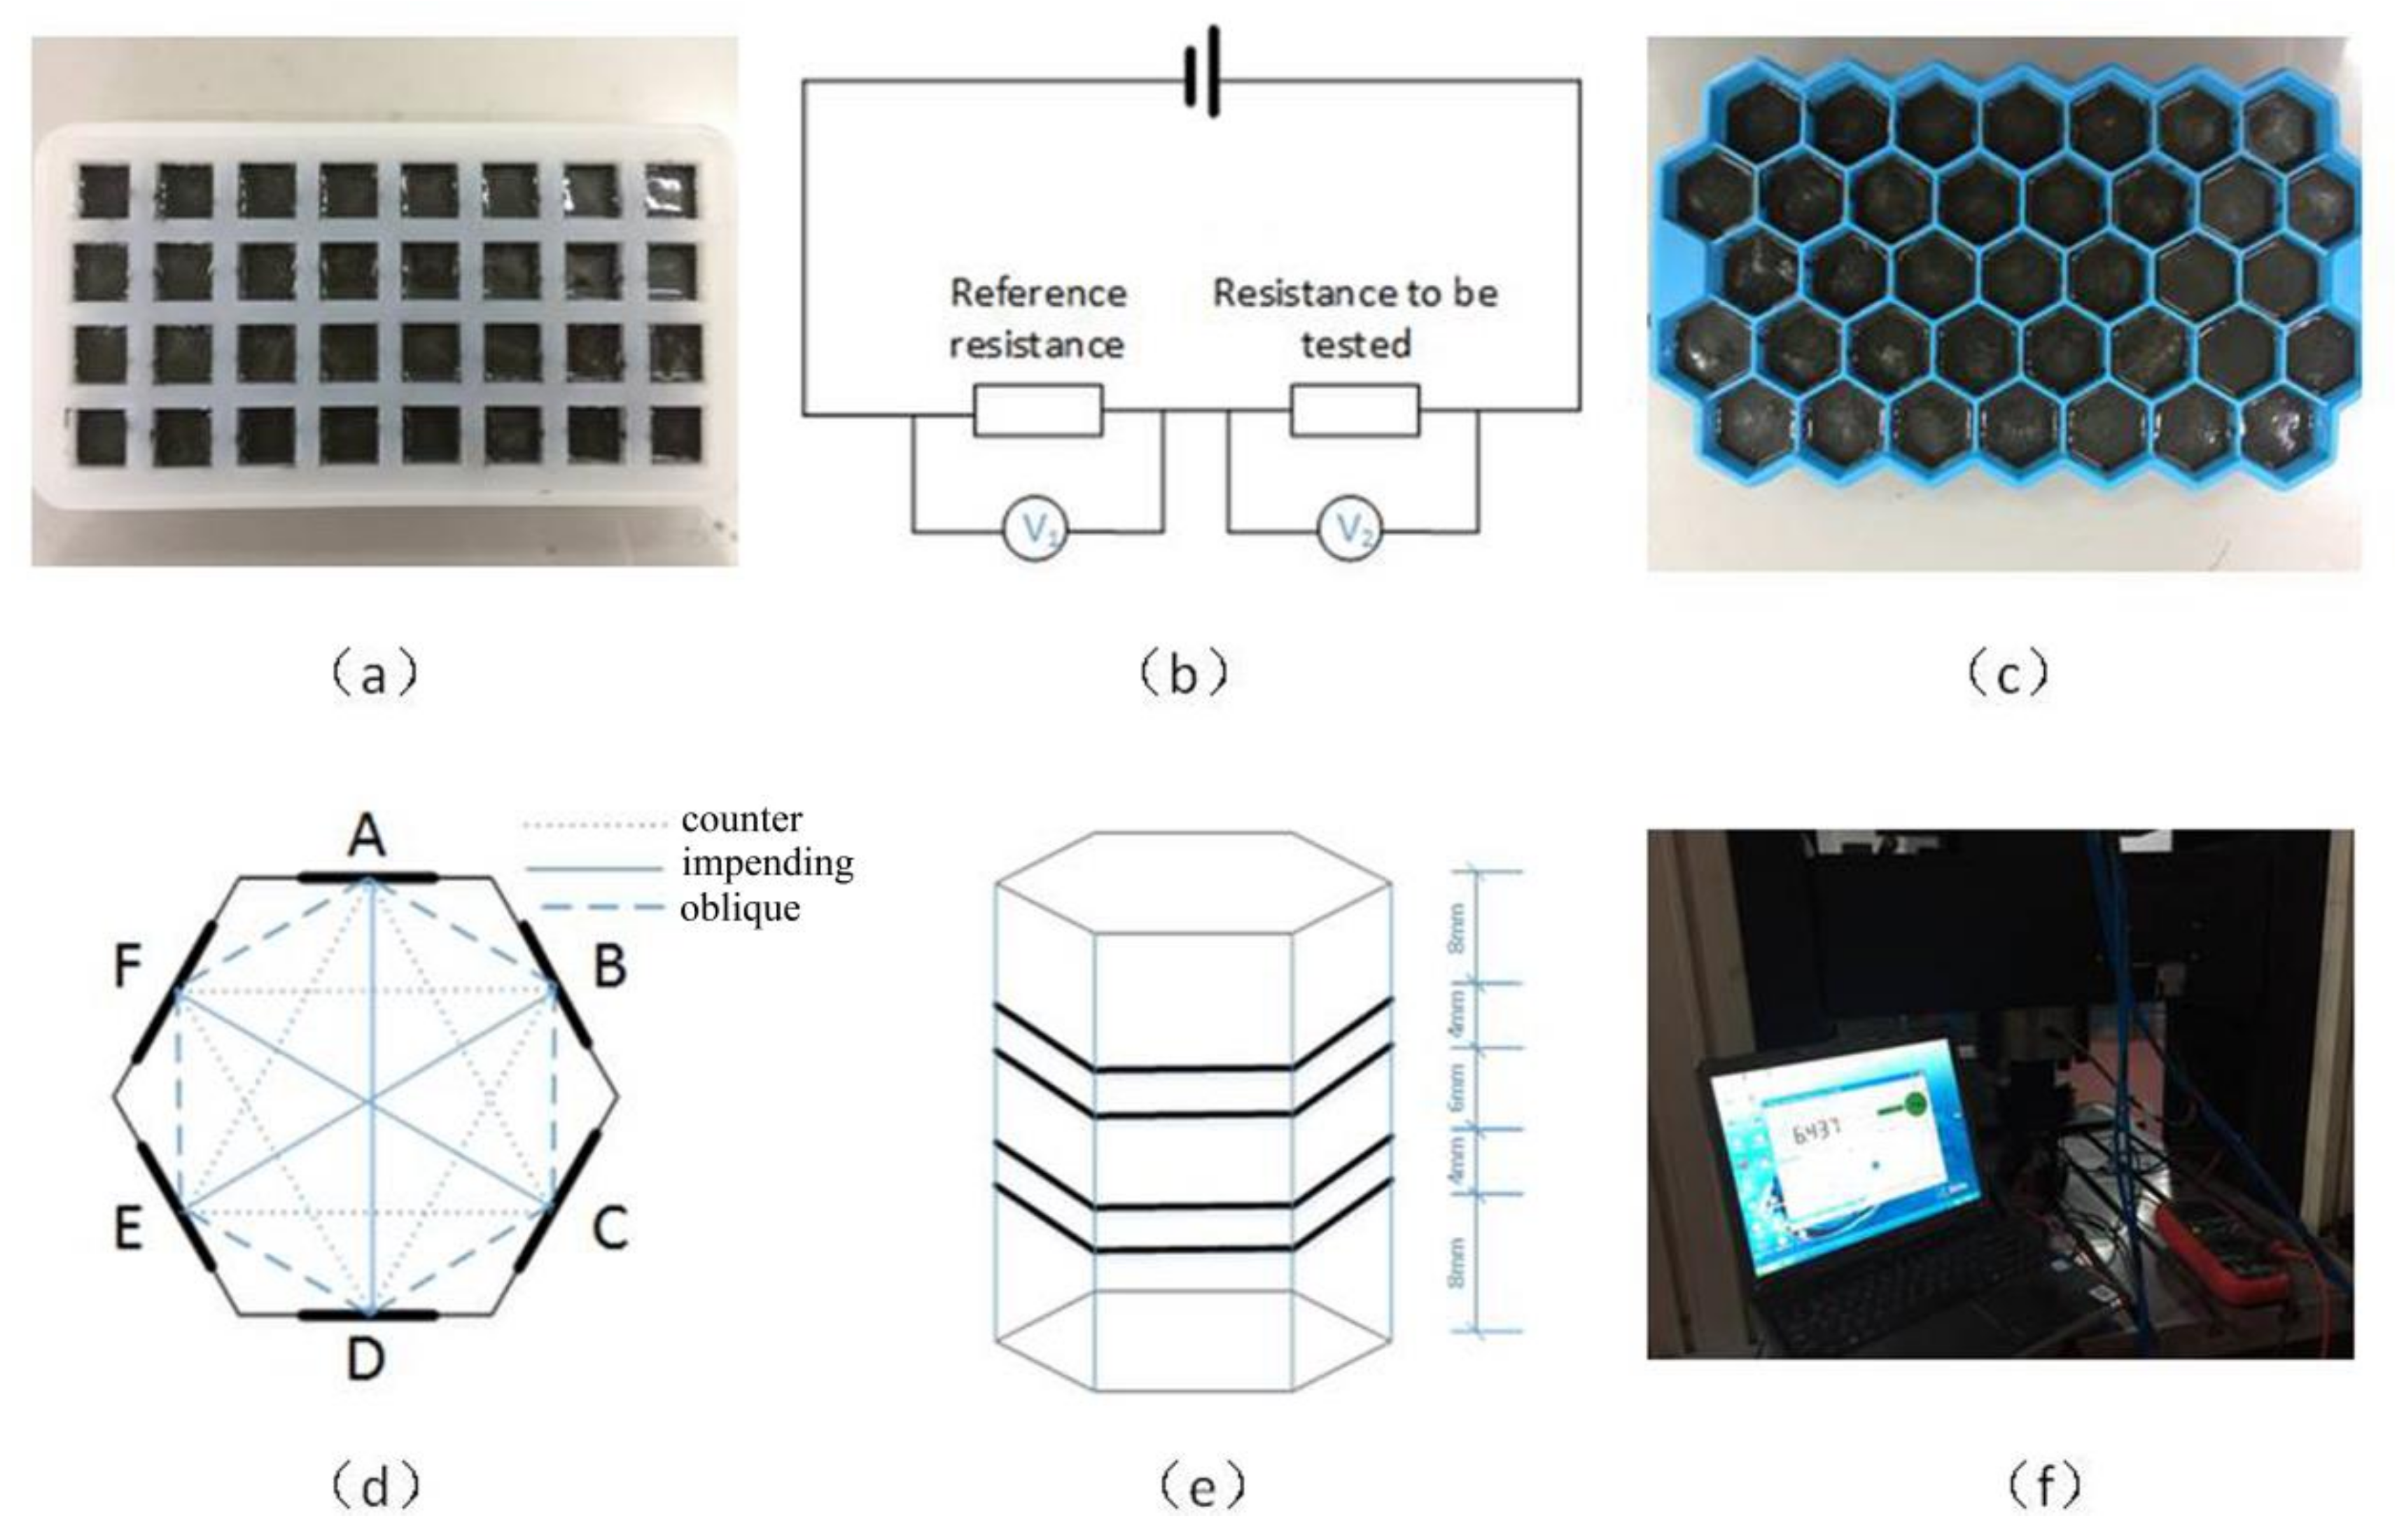
In this study, the percolation threshold of the CNFPUC composite was determined by the percolation curve of the resistivity and the fiber content. To ensure that the fluidity of the CNFPUC satisfied engineering requirements, the collapse degree of CNFPUC was controlled to be approximately 80 mm by adjusting the poly-ash ratio [24] (polyol, isocyanate, cement and mass ratio). The surface of the cured specimen was polished to remove the dirt and oxide layer of the surface and the two parallel surfaces of the specimen were required to be polished and leveled. Next, we coated 1mm thick conductive silver glue and pasted the electrode, which is a 10 mesh copper mesh (size: 12 mm × 20 mm) and it was fixed using conductive tape. Subsequently, the specimen’s static resistivity was tested. The size of the specimen as shown in Figure 1a is 17 mm × 17 mm × 17 mm.
To avoid the formation of a partition inside the material and to maintain the integrity of the specimen, a static resistivity test was performed using the two-electrode reference resistance method [25], so that the influence of contact resistance on the test could be eliminated (shown in Figure 1b). UT61E digital multimeter (Dongguan Youlide Technology Co., Ltd., Dongguan, China) was used to record the voltage at both ends of the test specimen, which was supplied by 60 V and 5 A adjustable direct current (DC) power. The resistance value of the specimen was calculated using Formula (1). To reduce the polarization effect of the resistance test, the sample was dried in an oven (Hong bang technology co., Ltd., Shanghai, China) at 40 °C for 24 h before the test, with the test voltage of 0.3 V supplied by the DC power supply. Before the test, the sample was electrified for 20 min until the voltages at the two ends of the sample were stable. The data was then collected.
Rx: Resistance to be tested; Rn: Reference resistance; Ux: Voltage at both ends of the resistance to be measured; UN: Reference resistance voltage.
ρ = RS/L is calculated resistivity, where L is the distance between two electrodes (m), S is the cross-sectional area of the specimen perpendicular to the L direction (m2) and R is the measured resistance (Ω). The average test results were taken for each group of six samples.
2.4. Preparation of Hexahedron Resistance Coefficient of Variation Test Block and Resistance Testing
The seepage curve of the CNFPUC was obtained using the above mentioned experiments. In the percolation region of the CNF, we selected a certain dosage of CNF for which the error due to the polarization effect was minimized. The mixture of CNFPUC was obtained by changing the ratio of the polycement and silica fume instead of partial cement under a CNF content of 4%. The different gathering ratios and the corresponding number of samples are listed in Table 4. We investigated the effect of the CNF dispersion on the coefficient of variation of hexahedron resistance. The coefficient of variation of hexahedron resistance is used to assess the uniformity of CNF dispersion. A previous study has shown that the mixing time, feeding sequence, stirring intensity and aspect ratio of the fibers affect the dispersion of the fibers [26]. Therefore, during the preparation of the hexahedron test blocks, these four factors are kept uniform, which is helpful in evaluating the degree of dispersion of CNF by the resistance variation coefficient method.
Three hexahedron test blocks under each mixing ratio were constructed (see Figure 1c) by obtaining different samples of the mixture from the top, middle and bottom. The side length and height of the hexahedron were 15 mm and 30 mm, respectively and the hexahedron was pasted on the six sides of the electrode. The method was the same as described in Section 2.3. The electrode size was 40 mm × 8 mm. The two electrode methods were used to measure the resistance of the sample by using a UT61E digital multimeter, which is shown in Figure 1d. The remaining mixture was made into cubic blocks with an edge of 100 mm, with each group consisting of three cubic blocks and 10 mesh copper mesh electrodes with a size of 20 mm (the two outer electrodes were 70 mm apart and the two electrodes were 30 mm apart).
2.5. Pressure Sensitive Test
After the above mentioned hexahedron test block’s static opposite edge, oblique edge and front edge were subjected to the three direction resistance tests, the six side reticular electrodes were removed and the angle grinder was used to completely polish the conductive silver glue on the residual side; the surface was then repeatedly wiped with alcohol. As shown in Figure 1e, a conductive silver powder adhesive was applied evenly with a width of approximately 1mm at the four sections of the hexahedron. When the conductive adhesive cured at room temperature, the copper hoop fixed on the conductive adhesive acted as an electrode.
The three hexahedron and cube samples in each group were subjected to a pressure sensitivity test using the four-electrode method [27,28,29,30,31]. As shown in Figure 1f, the test power was supplied by 60 V and 5 A adjustable DC regulated power supply and a UT61E digital multimeter monitored the voltage change during loading and unloading in real time. Using the formula ρ = RS/L, the resistivity of the specimen was calculated. A WDW-500 universal testing machine produced by Changchun Kexin Test Instrument Co., Ltd. (Changchun, China) was used as the loading equipment and the maximum load and loading rate could read up to 500 kN and 1 mm/min, respectively. Resistance strain gauges were installed on both sides of the test piece. The strain was measured using the static data acquisition system (DH3817) produced by Jiangsu Donghua testing Technology Co., Ltd. (Taizhou, China) The strain, pressure and voltage changes during loading (unloading) of the CNFPUC test block were recorded throughout the process. To eliminate the influence of CNFPUC internal voids on the pressure sensitivity, the cyclic loading can be applied to the specimen in advance in order to compact the voids [32].
3. Results and Discussions
3.1. CNFPUC Seepage Curve and Threshold
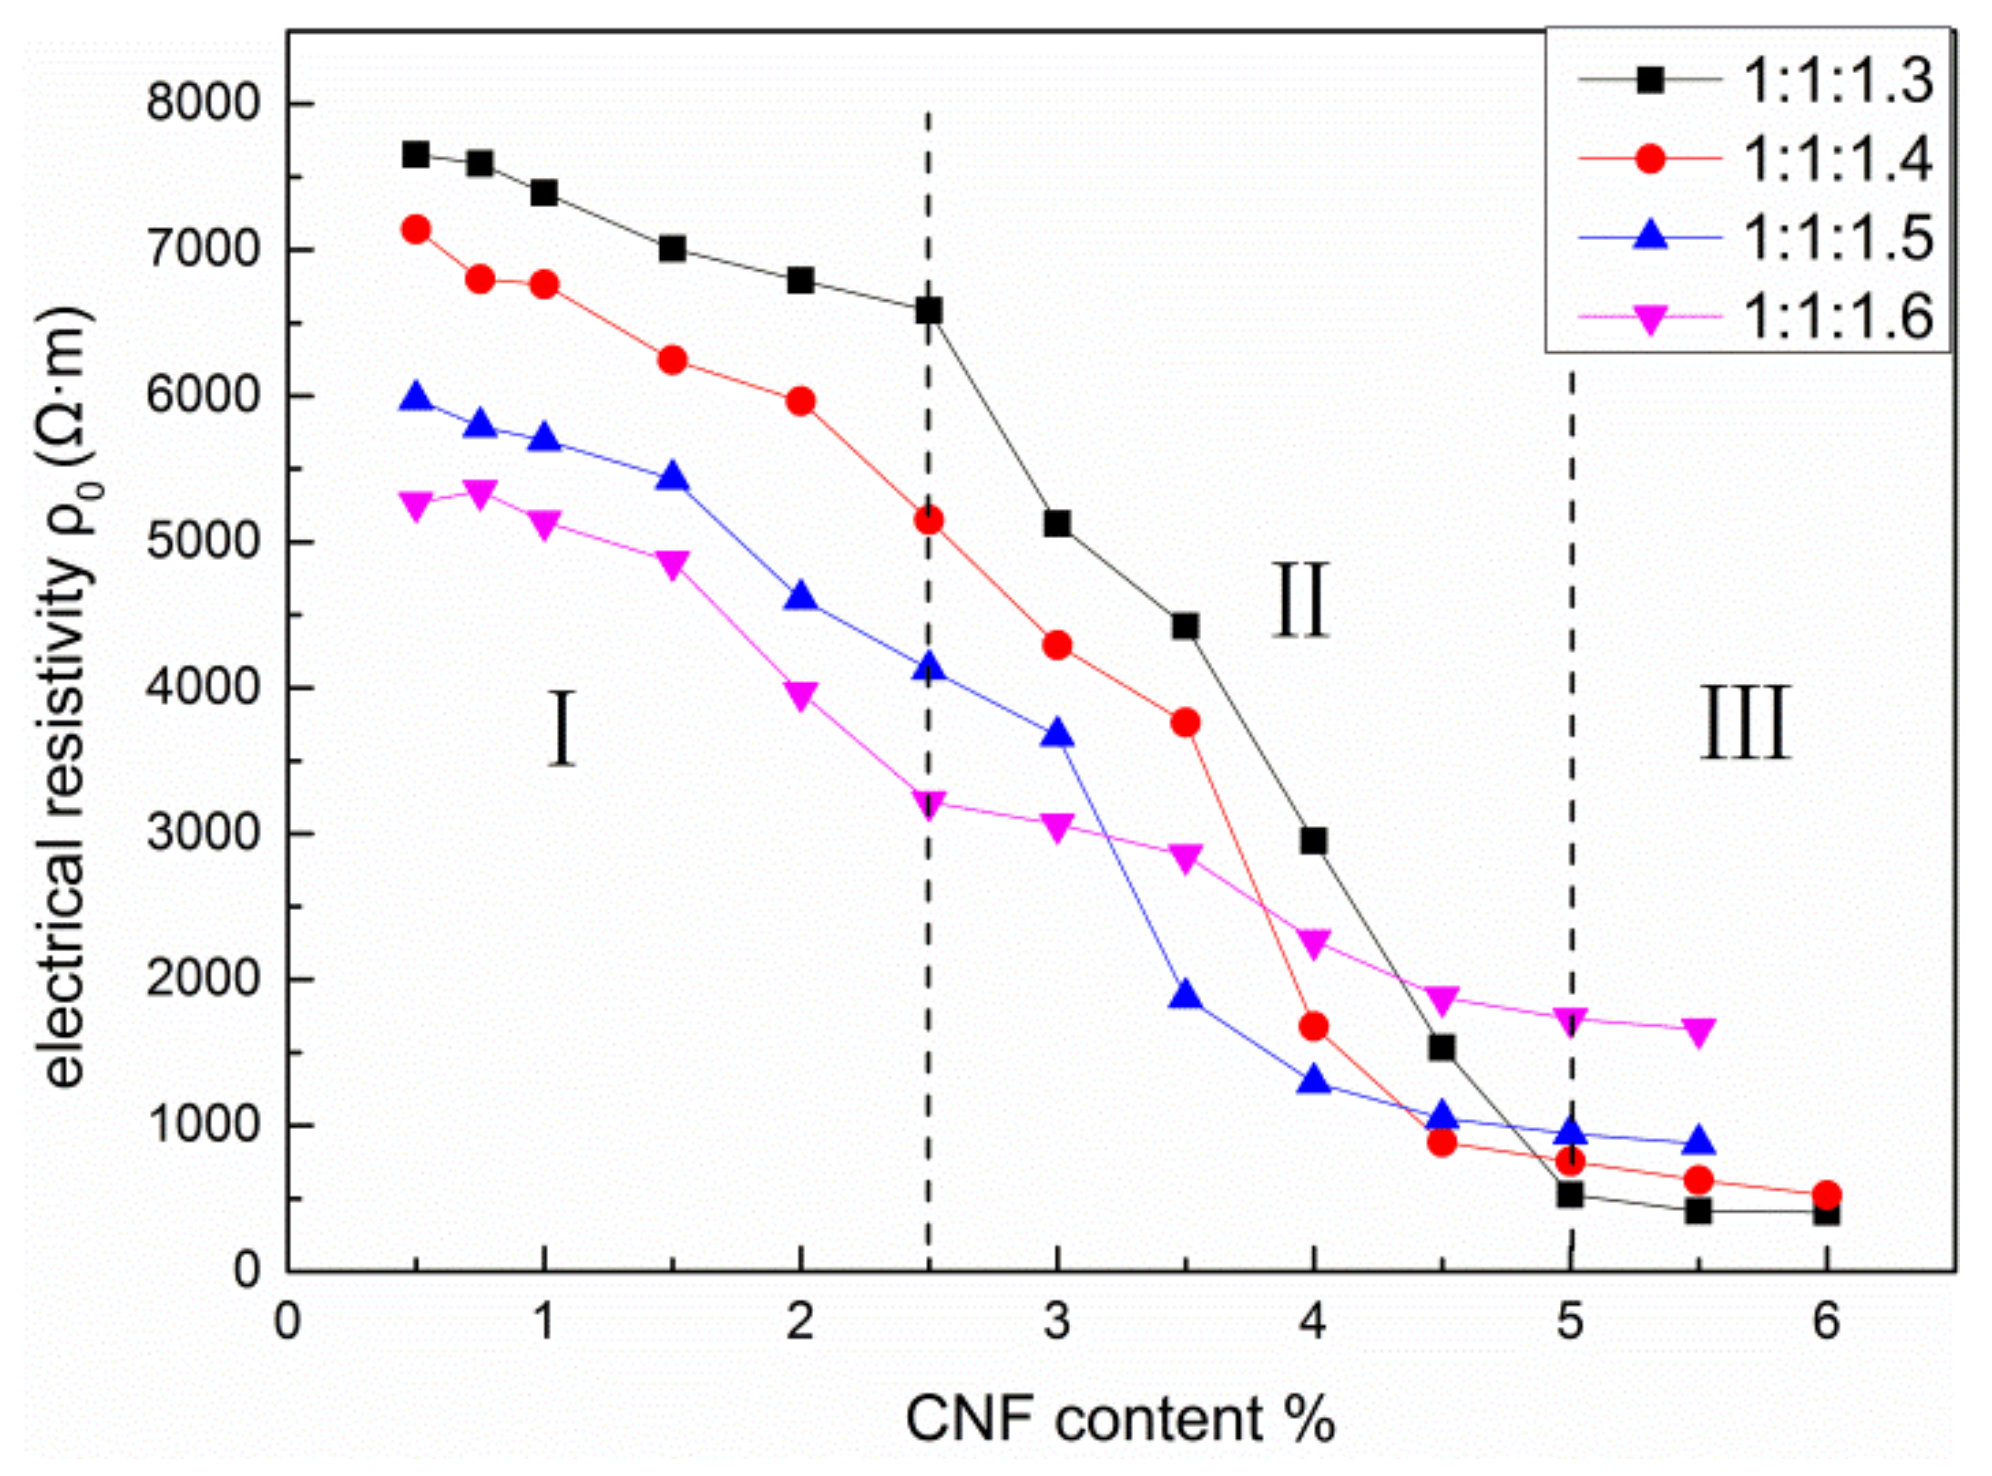
The seepage curve of the CNFPUC obtained from the test is shown in Figure 2. The relationship between the resistivity and the CNF content appeared to have the form of an inverted “s” curve, which could be divided into three zones:
(1) Unpercolated zone—I
When the content of the CNF added to the polymer was low, the CNF particles were coated with insulating polymers. They had random, isolated and discontinuous distributions in the matrix phase. The average distance between them was large and there were only a few contact opportunities. The electrons could migrate in the gap between the conductive particles dispersed in the matrix and produce the phenomenon of conduction. The resistivity of the CNFPUC material was controlled primarily by the continuous matrix phase, corresponding to the insulation of the polymer matrix and the conductivity was a result of primarily the “tunnel effect.” At this time, the resistance of the composite material was essentially the same as that of the matrix phase.
(2) Seepage zone—II
With an increase in the CNF content, the average distance between the CNF in the composites decreased gradually and their contact probability increased. Within a narrow range of CNF concentrations, the CNF particles formed chained or grape-like pathways which overlapped with one another and formed a “conductive channel.” At this time, the conduction had both a “tunnel effect” and “channel effect.” The resistivity decreased in the geometric series and the composite material changed from an insulator to semiconductor or conductor.
(3) Percolation zone—III
A higher content of CNF in the composite meant that the conductive network was more complex, the density was higher and a lower resistivity was determined by the conductive network. The conductivity of the CNFPUC network was equivalent to that of CNF forming a conductive network in PU and then encapsulating cement particles, forming conductive channels around and between them. The forming of a conductive network of CNFPUC could be equated with CNF forming a conductive network in PU and then wrapping around the cement particles, forming a conductive channel around the network and the gap. A large number of interpenetrating conductive networks appeared in the material and subsequently, the conductive network was completed. Even if the amount of CNF continued to increase, the resistivity of the CNFPUC did not change significantly. The equivalent circuit of the CNFPUC composite is shown in Figure 3.
On the basis of the above mechanism, the percolation curve shows that the resistivity of the CNFPUC decreases with an increase in the CNF content. In unpercolated zone I, when the content of CNF was low, a larger amount of ash was beneficial to the dispersion of CNF and the resistivity was lower. With an increase in the CNF incorporation, in percolation zone II, the resistivity decreased rapidly; the dispersion difficulty first occurred for low poly-ash ratio sample and the decreasing rate accelerated with an increase in the ratio of polymer to cement. In percolation zone III, the resistivity tended towards stability and did not change with the content of CNF.
The conducting process of CNFPUC in the percolation zone was extremely sensitive to the microstructure of the percolation network. On one hand, the increase in the CNF content or compressive stress would lead to a considerable change in the interfiber tunnel gap and its distribution; on the other hand, the probability of fiber lapping would increase. However, in the percolation zone, the continuous conduction path formed by the complete overlap of CNF appeared in the percolation system and the conductive network was essentially perfect. With a further increase in the CNF, the resistance change rate was small under compressive stress. In addition, the excessively large content of CNF resulted in the inferior performance of CNFPUC. Moreover, the manufacturing cost of CNF increased with the content of CNF, which was an unnecessary waste. Therefore, to obtain high sensitivity, the content of CNF should be controlled in the percolation zone.
3.2. Coefficient of Variation of Hexahedron Resistance-Cv
The coefficient of variation of the resistance of each set of specimens Cv can be found using Formula (2).
CV—Coefficient of variation of resistance for each set of specimens; Ri—Resistance of specimen i; —Average resistance per set of specimens; n—Number of specimens per group. According to the directionality of the current, the coefficient of variation of resistance in the three directions (opposite, oblique and imminent) of each set of specimens can be obtained (Cv1, Cv2 and Cv3). The conduction mechanism of CNFPUC in the percolation zone originates from the overlap between the CNF. For example, the CNF is in ideal condition of complete dispersion and homogeneity of the PU Matrix. Therefore, CV can be used to judge the degree of dispersion of the CNF in the PU matrix. The weight of CV occupied by Cv1, Cv2 and Cv3 is calculated as follows:
(1) Counter resistance
As shown in Figure 4a, ρ, The resistance between A and D is = 1.2ρ. The resistance effective area is .
(2) Impending resistance
(3) Oblique resistance
As shown in Figure 4c, because , , therefore, + , because and = 2.3094, therefore, , R = 0.8. The resistance effective area is .
The effective area ratio of the opposite, oblique and impending resistances is 24:21:23. Taking the effective area of the hexagonal resistor as the weight of the coefficient of variation of resistance and taking the coefficient of variation as the final resistance for each mix ratio [33,34], the total resistance coefficient of variation CV = 0.35Cv1 + 0.31Cv2 + 0.34Cv3. The results are presented in Table 5.
3.3. Piezoresistive Sensitivity
The sensitivity coefficient of the sensor is a key factor in judging the signal intensity of sensor monitoring. The sensitivity coefficient of the sensor can be defined as k, which is related to the strain value ε expressed for , where . The univariate linear fitting of the relationship between FCR and ε is shown in Figure 5. According to the above test, when the strain of the CNFPUC material is not more than 50% of the limit strain, the resistivity change-strain relationship of the CNFPUC material is in the linear elastic stage.
We know from the definition of the sensitivity coefficient that the sensitivity coefficient of the CNFPUC specimen is the slope of the fitting line in the diagram multiplied by 1000 (Table 6). The sensitivity coefficient of the ordinary resistance strain gauge is only approximately 2.06, which shows that the sensitivity of CNFPUC is 40–300 times that of the strain gauge.
3.4. Sensitivity Error between the Sampling Hexahedron and Corresponding Mixture
Considering the influence of the strength grade on the size effect [35,36], the sensitivity of the mixture is generally lower than that of sampling hexahedron; however, the sensitivity error is kept within 10%. When the sensitivity is greater than 500, the error is controlled within 5%. Therefore, the sensitivity can be judged by the coefficient of variation of the resistance of the sample hexahedron specimen and the variances of the entire mixture can be evaluated. Although the change in the initial resistivity is different between the embedding method and the paste method, there is little difference in the descending slope (sensitivity) [37]. The sensitivity error between the sample hexahedron and the corresponding mixture is given in Table 7.
3.5. Relationship between the Coefficient of Variation and Sensitivity of Resistance
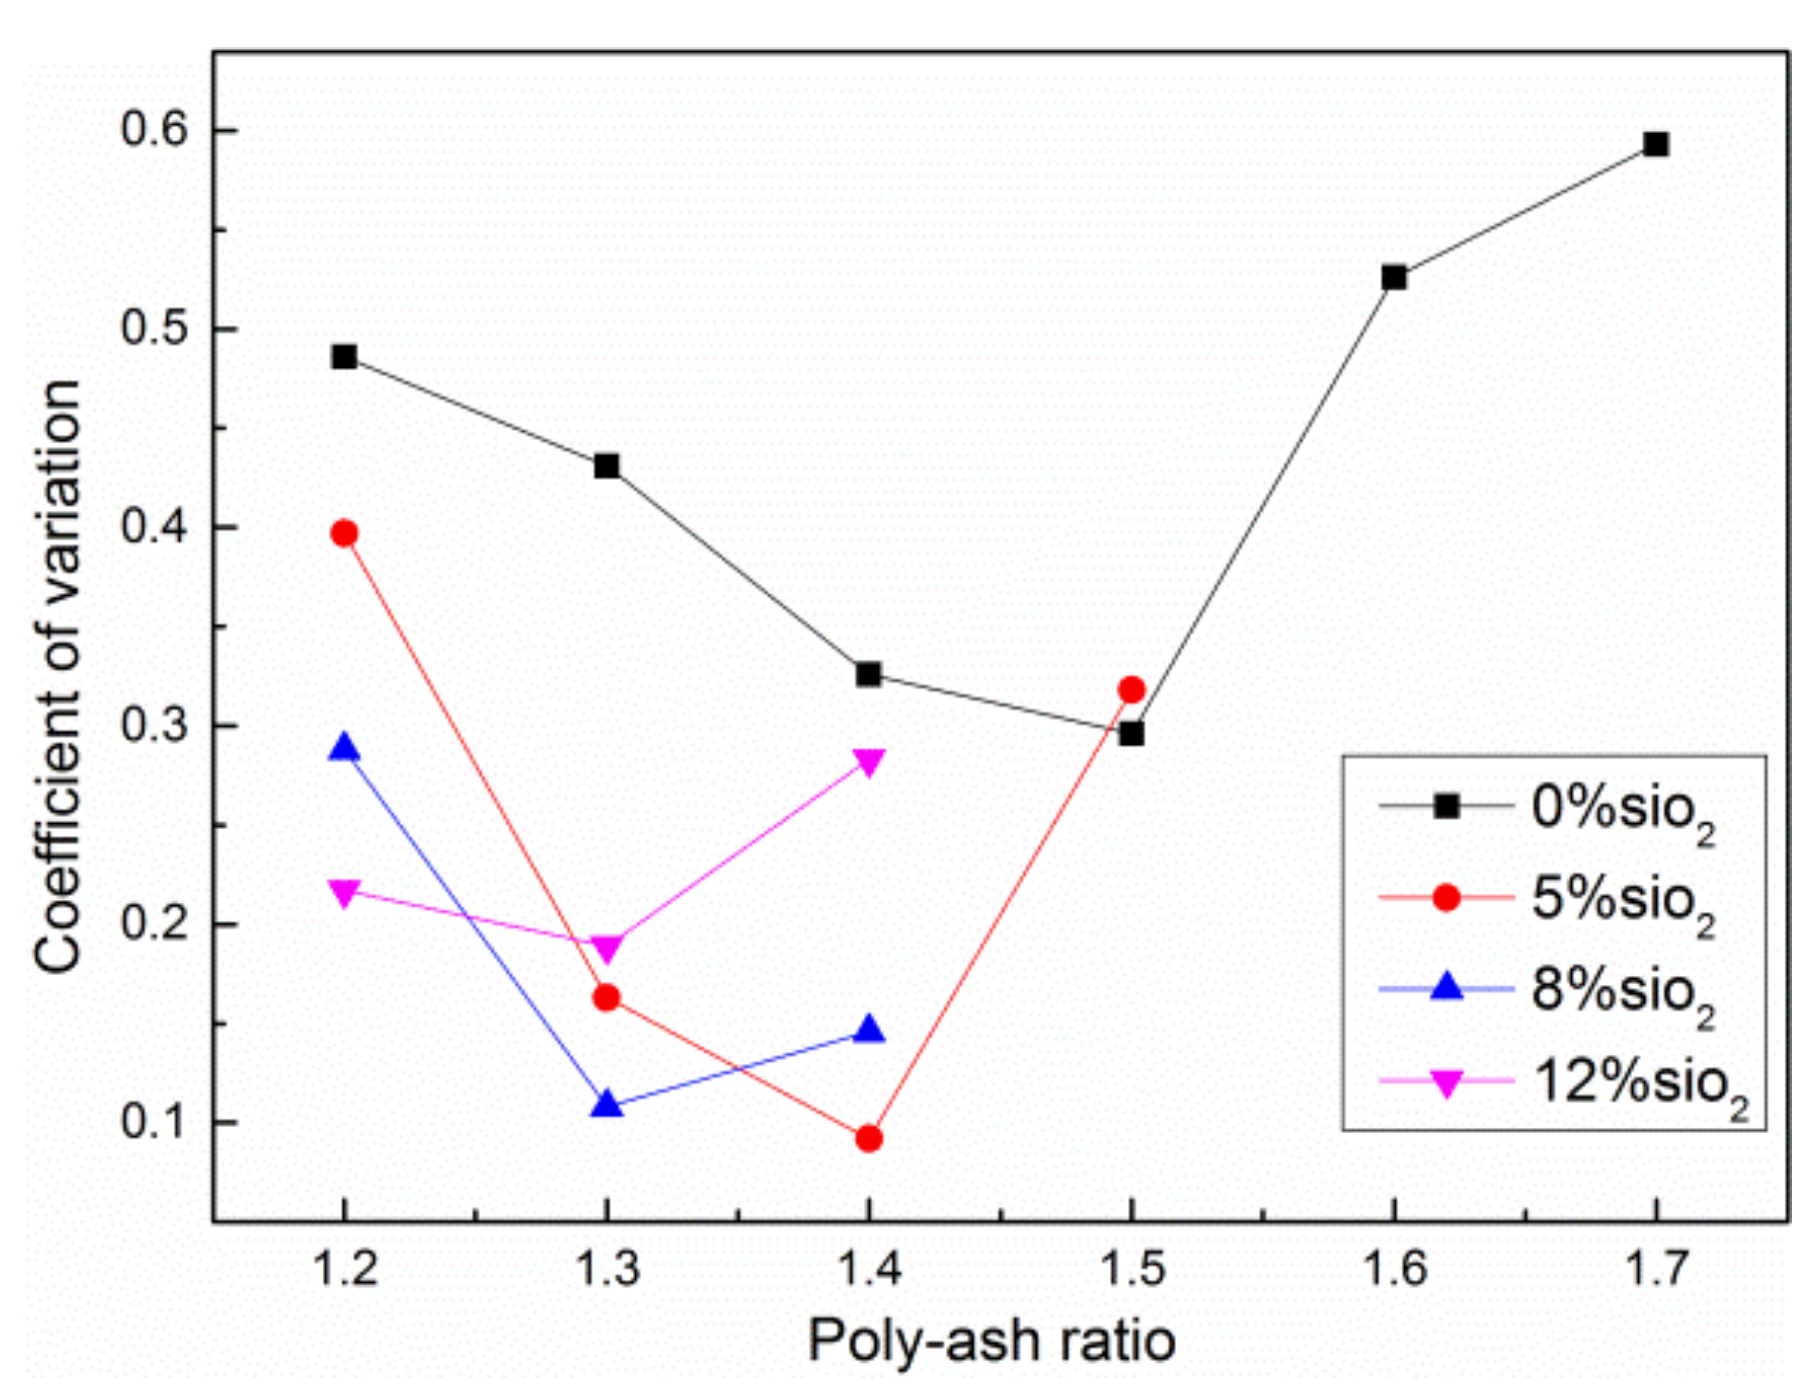
In theory, the sensitivity of polymer-based materials will be obviously changed owing to change in the degree of fiber dispersion. The addition of the silica fume can effectively reduce the coefficient of variation of CNFPUC, increasing its sensitivity coefficient and making the piezoresistive effect of CNFPUC more pronounced in the elastic stage. For the case in which the content of CNF is 4%, the relationship between the ratio of aggregate to cement, coefficient of variation and sensitivity are shown in Figure 6 and Figure 7. It can be determined that:
- (1)
- When the ratio of polymer to cement is 1:1:1.2, the sensitivity coefficient increases with the addition of silica fume.
- (2)
- When the ratio of polymer to cement is 1:1:1.3 or 1:1:1.4, the sensitivity coefficient increases first and then decreases with the addition of silica fume. The minimum value of Cv is attained and the sensitivity coefficient reaches its maximum value. The maximum uniform dispersion of CNF in CNFPUC occurs and the sensitivity of stress perception is the highest.
- (3)
- When the ratio of polymer to cement is higher than 1:1:1.5, the sensitivity coefficient decreases significantly with the addition of the silica fume.
- (4)
- When the content of silica fume is free, the sensitivity coefficient first increases and then decreases with increase in the polymer ash ratio. When the ratio of the polymer to cement is 1:1:1.5, the sensitivity coefficient reaches its maximum value.
The sensitivity coefficient and resistivity variation coefficient of the CNFPUC specimen exhibit an obvious one-to-one correspondence. When the content of CNF is in the percolation region and constant, the coefficient of variation of CNFPUC resistivity calculated using the hexahedron is smaller, a higher the sensitivity coefficient corresponds to a pronounced effect of self-induction in the elastic compression stage. The coefficient of variation of resistivity of the hexahedron can reflect the sensitivity of the hexahedron after compression.
The dispersion of CNF is closely related to the ratio of polymer to cement and the quantity of silica fume (SF) used in place of the cement, which directly affects the sensitivity of the CNFPUC. The silica fume particles are tiny glass spheres, with an average particle size of 0.1–0.2 μm, which is 1/100–1/50 of the cement particle size [38,39]. Under the same poly-ash ratio and a replacement of some cement particles with SF, the particle size of the SF and CNF are similar. The Vander Waals force between the CNF can be reduced and the dispersion of CNF can be increased owing to the friction between the SF aggregate and CNF [40]. In addition, according to the double seepage theory, the SF aggregates are added to the CNFPUC. Because of its small particle size and large specific surface area, the SF aggregates can not only fill the space between cement particles they can also infiltrate between the CNF particles. In this manner, the CNF, cement particles and SF can form a compact packing structure with a desirable setting configuration and a self-compact stacking system. The uniformity of CNF dispersion can be improved and the CNF is squeezed by the aggregate, which reduces the spacing between the CNF. In addition, the pozzolanic effect of the silica fume can improve the interface between the fiber and polymer, thereby improving the long-term stability of the material properties. However, when the content of SF is excessively high, the plastic viscosity and yield shear stress of the paste are high and the CNF is considerably restricted by the surrounding environment in the process of dispersion. Therefore, the uniformity of CNF dispersion is low, which leads to the high resistivity of the specimen and a large dispersion of the resistivity of the specimen.
The inhomogeneity of the CNF dispersion results in a decrease in the effective area and an increase in the resistivity of the CNFPUC conductive channel. Figure 8 shows the SEM images of samples obtained from two different parts of CP1.6. Image a shows that the CNF produced local clusters and image b shows that the local CNF is distributed exiguously. This means that the dispersion of CNF in CNFPUC was poor and the dispersion of CNF was not uniform. Figure 9 shows an SEM image of CP1.4-5 distributed uniformly without obvious agglomeration.
In the percolation zone, the CNFPUC conduction was based primarily on the quantum tunneling theory or the fiber pull-out and insertion theory. The degree of dispersion of the conductive particles depends on whether the particles could form a three-dimensional conductive network in the matrix. This was a decisive factor that affected the electrical conductivity of the sample. Because the average particle size of CNF is only 150–200 nm, which represents a fine glass sphere with excellent lubricity, the friction between the CNF and PU, CNF and cement and silica fume particles are reduced in the piezoresistive test. Therefore, the conducting particles are more likely to move relative to one another. In the linear elastic range, when the test block begins to load, the internal microcracks gradually close. At the same time, the overlap probability of the CNF conductive network in CNFPUC is increased and the rate of change of the resistance decreases with an increase in the compressive stress.
It can be seen that the resistance of CNFPUC materials changes distinctly with the change in the fiber dispersion degree. Under the condition that the conductive filler is not increased, the dispersion of the nanocarbon fiber is more uniform and the formed conductive network is more perfect, with a higher sensitivity coefficient of the material.
3.6. Determination of the Optimal Mixture Ratio and Sensitivity of CNF
When the CNF content is the same, a more uniform dispersion of CNF will correspond to a high conductivity utilization ratio. Moreover, the conductive network of CNFPUC is more perfect and thus, the strain sensing ability of the composite material is better. Because of the large length and diameter of the CNF and owing to the low resistance to dispersion of CNF in the matrix, a larger ratio of polymer to cement means that the CNF find it easier to accumulate in a ball form during stirring. When the cement ratio is excessively small and the fluidity of the mixture is low, the friction resistance owing to the fiber movement increases. Therefore, the fiber cannot disperse evenly but it is more prone to clustering and breaking. Therefore, the dispersion of CNF has an optimal ratio of aggregates to ash, as shown in Table 8.
As shown in the SEM image and Figure 8 and Figure 9, when the CNF content is 4% and the coefficient of variation is less than 0.35, the dispersion effect of the CNF is better and the sensitivity is more than 500. In this work, a sensitivity of 500 is used as the reference index of the varistor characteristics. When the sensitivity is greater than 500, the pressure sensitivity exerts a reasonable effect. Using the method of calculating the sensitivity and the coefficient of variation when the CNF dosage is 4%, the critical value of the coefficient of variation can be calculated for the case in which the CNF is introduced with other additives. At the same time, the curve of quadratic polynomial is synthesized as shown in Figure 10. The initial rising speed of the curve is fast and the curve then tends to be flat. It can be determined that when the amount of CNF is low, a better dispersion effect (smaller coefficient of variation) may satisfy the sensitivity requirement. When the content of CNF is greater than 4%, the conductive network has been essentially formed; however, because of the large specific surface area and aspect ratio of the CNF, dispersion does not occur easily and the curve tends to be smooth. Therefore, according to the fitted quadratic curve, in the range of percolation curves II and III, the dispersion effect of CNF in the PU matrix can be verified according to the average value of the coefficient of variation of the measured hexahedron and subsequently, the sensitivity of the CNFPUC can be judged to satisfy the engineering needs.
4. Conclusions
In this study, CNF was added to a newly developed PUC structurally reinforced composite material, making it a self-sensing, self-monitoring intelligent reinforcement material. The dispersion of CNF was evaluated according to the coefficient of variation of the hexahedron resistance. At the same time, the SEM observation method was used to verify the sensitivity of the CNFPUC mixture as an intelligent induction material. The following conclusions were drawn:
- (1)
- Seepage curves of CNFPUC composites under different poly-ash ratios were established and the percolation interval of the CNF content as the concentration of conductive filler for CNFPUC composites was determined.
- (2)
- Under the condition of equal CNF content in a percolation interval, the same amount of samples were obtained from different parts of the CNFPUC mixture in the upper, middle and lower parts to construct a hexahedron test block. The coefficient of variation of the hexahedron resistance can be used to judge the dispersion effect of the CNF in the PU matrix with different poly-ash ratios and silica fume contents.
- (3)
- The dispersion effect of CNF in the PU matrix determines the varistor characteristics of CNFPUC as a smart material. The addition of the silica fume can effectively reduce the variation coefficient of hexahedron CNFPUC, increase its sensitivity coefficient and make the piezoresistive effect of CNFPUC more pronounced in the elastic stage.
- (4)
- Using sensitivity of 500 as the reference index for varistor characteristics, a quadratic curve between the concentration of CNF conductive filler and the coefficient of variation of the hexahedron resistance of CNFPUC composite was established. The dispersion effect of CNFPUC composite CNF can be evaluated and the sensitivity of CNFPUC can be determined. This can provide a new and simple method for determining the sensitivity of a CNFPUC mixture.
Author Contributions
N.Y. and Q.S. conceived the study; N.Y. and K.Z. performed the experiments; N.Y. analyzed the data; N.Y. and Q.S. wrote the main manuscript text; and all authors approved the final manuscript.
Funding
This research was funded by the Social Development Project of Qiqihar Science and Technology Bureau (SFGG-201701) and Scientific Research Project of Qiqihar University, No. 135309122.
Conflicts of Interest
The authors declare no conflict of interest.
References
- Zhang, K.; Sun, Q. Experimental Study of Reinforced Concrete T-Beams Strengthened with a Composite of Prestressed Steel Wire Ropes Embedded in Polyurethane Cement (PSWR–PUC). Int. J. Civ. Eng. 2018, 16, 1109–1123. [Google Scholar] [CrossRef]
- Hussain, H.K.; Liu, G.W.; Yong, Y.W. Experimental study to investigate mechanical properties of new material polyurethane–cement composite (PUC). Constr. Build. Mater. 2014, 50, 200–208. [Google Scholar] [CrossRef]
- Hussain, H.K.; Zhang, L.Z.; Liu, G.W. An experimental study on strengthening reinforced concrete T-beams using new material poly-urethane-cement (PUC). Constr. Build. Mat. 2013, 40, 104–117. [Google Scholar] [CrossRef]
- Zhang, K.; Sun, Q. Strengthening of a Reinforced Concrete Bridge with Polyurethane-cement Composite (PUC). Open Civ. Eng. J. 2016, 10, 768–781. [Google Scholar]
- Jeon, E.B.; Ahn, S.K.; Lee, I.G.; Koh, H.I.; Park, J.; Kim, H.S. Investigation of mechanical/dynamic properties of carbon fiber reinforced polymer concrete for low noise railway slab. Compos. Struct. 2015, 134, 27–35. [Google Scholar] [CrossRef]
- Erdem, S.; Hanbay, S.; Blankson, M.A. Self-sensing damage assessment and image-based surface crack quantification of carbon nanofibre reinforced concrete. Constr. Build. Mater. 2017, 134, 520–529. [Google Scholar] [CrossRef]
- Ding, Y.; Chen, Z.; Han, Z.; Zhang, Y.; Pacheco-Torgal, F. Nano-carbon black and carbon fiber as conductive materials for the diagnosing of the damage of concrete beam. Constr. Build. Mater. 2013, 43, 233–241. [Google Scholar] [CrossRef] [Green Version]
- Chen, M.; Gao, P.; Geng, F.; Zhang, L.; Liu, H. Mechanical and smart properties of carbon fiber and graphite conductive concrete for internal damage monitoring of structure. Constr. Build. Mater. 2017, 142, 320–327. [Google Scholar] [CrossRef]
- Chu, H.Y.; Chen, J.K. The Experimental Study on the Correlation of Resistivity and Damage for Conductive Concrete. Cem. Concr. Compos. 2016, 67, 12–19. [Google Scholar] [CrossRef]
- Eftekhari, M.; Mohammadi, S. Multiscale dynamic fracture behavior of the carbon nanotube reinforced concrete under impact loading. Int. J. Impact Eng. 2016, 87, 55–64. [Google Scholar] [CrossRef]
- Ahn, S.; Jeon, E.B.; Koh, H.I.; Kim, H.S.; Park, J. Identification of stiffness distribution of fatigue loaded polymer concrete through vibration measurements. Compos. Struct. 2016, 136, 11–15. [Google Scholar] [CrossRef]
- Veraagullo, J.; Chozasligero, V.; Portillorico, D.; Garcíacasas, M.J.; Gutiérrezmartínez, A.; Mieresroyo, J.M.; Grávalosmoreno, J. Mortar and Concrete Reinforced with Nanomaterials; Springer: Berlin/Heidelberg, Germany, 2009; pp. 383–388. [Google Scholar]
- Qiao, P.; Zhang, L.; Chen, F.; Chen, Y.; Shan, L. Fracture characterization of Carbon fiber-reinforced polymer-concrete bonded interfaces under four-point bending. Eng. Fract. Mech. 2011, 78, 1247–1263. [Google Scholar] [CrossRef]
- Irshidat, M.R.; Al-Saleh, M.H. Effect of using carbon nanotube modified epoxy on bond–slip behavior between concrete and FRP sheets. Constr. Build. Mater. 2016, 105, 511–518. [Google Scholar] [CrossRef]
- Wang, W.; Wu, S.; Dai, H. Fatigue behavior and life prediction of carbon fiber reinforced concrete under cyclic flexural loading. Mater. Sci. Eng. A 2006, 434, 347–351. [Google Scholar] [CrossRef]
- Al-Abdwais, A.H.; Al-Mahaidi, R.S.; Al-Abdwais, A.H.; Al-Mahaidi, R.S.; Al-Abdwais, A.H.; Al-Mahaidi, R.S. Bond properties between carbon fibre reinforced polymer (CFRP) textile and concrete using modified cement-based adhesive. Constr. Build. Mater. 2017, 154, 983–992. [Google Scholar] [CrossRef]
- Szeląg, M. Mechano-Physical Properties and Microstructure of Carbon Nanotube Reinforced Cement Paste after Thermal Load. Nanomaterials 2017, 7, 267. [Google Scholar] [CrossRef] [PubMed]
- Al-Rub, R.K.A.; Tyson, B.M.; Yazdanbakhsh, A.; Grasley, Z. Mechanical Properties of Nanocomposite Cement Incorporating Surface-Treated and Untreated Carbon Nanotubes and Carbon Nanofibers. J. Nanomech. Micromech. 2012, 2, 1–6. [Google Scholar] [CrossRef]
- Wang, H.; Gao, X.; Wang, R. The influence of rheological parameters of cement paste on the dispersion of carbon nanofibers and self-sensing performance. Constr. Build. Mater. 2017, 134, 673–683. [Google Scholar] [CrossRef]
- Song, Y.S.; Youn, J.R. Influence of dispersion states of carbon nanotubes on physical properties of epoxy nanocomposites. Carbon 2005, 43, 1378–1385. [Google Scholar] [CrossRef]
- Fu, X.; Lu, W.; Chung, D.D.L. Improving the Strain-Sensing Ability of Carbon Fiber-Reinforced Cement by Ozone Treatment of the Fibers 1. Cem. Concr. Res. 1998, 28, 183–187. [Google Scholar] [CrossRef]
- Ozyurt, N.; Mason, T.O.; Shah, S.P. Correlation of fiber dispersion, rheology and mechanical performance of FRCs. Cem. Concr. Compos. 2007, 29, 70–79. [Google Scholar] [CrossRef]
- Wang, Z.; Gao, J.; Ai, T.; Jiang, W.; Zhao, P. Quantitative evaluation of carbon fiber dispersion in cement based composites. Constr. Build. Mater. 2014, 68, 26–30. [Google Scholar] [CrossRef]
- Sassani, A.; Ceylan, H.; Kim, S.; Gopalakrishnan, K.; Arabzadeh, A.; Taylor, P.C. Influence of mix design variables on engineering properties of carbon fiber-modified electrically conductive concrete. Constr. Build. Mater. 2017, 152, 168–181. [Google Scholar] [CrossRef]
- Han, B.; Ou, J. Embedded piezoresistive cement-based stress/strain sensor. Sens. Actuators A Phys. 2007, 138, 294–298. [Google Scholar] [CrossRef]
- Han, B.G.; Guan, X.C.; Ou, J.P. Application of ultrasound for preparation of carbon fiber cement-based composites. Mater. Sci. Technol. 2009, 17, 368–372. [Google Scholar]
- Chung, D.D.L. Carbon materials for structural self-sensing, electromagnetic shielding and thermal interfacing. Carbon 2012, 50, 3342–3353. [Google Scholar] [CrossRef]
- Ding, Y.; Han, Z.; Zhang, Y.; Aguiar, J.B. Concrete with triphasic conductive materials for self-monitoring of cracking development subjected to flexure. Compos. Struct. 2016, 138, 184–191. [Google Scholar] [CrossRef] [Green Version]
- Wang, S.; Chung, D.D.L. Self-sensing of flexural strain and damage in carbon fiber polymer-matrix composite by electrical resistance measurement. Carbon 2006, 44, 2739–2751. [Google Scholar] [CrossRef]
- Wen, S.; Chung, D.D.L. Defect dynamics of cement paste under repeated compression studied by electrical resistivity measurement. Cem. Concr. Res. 2001, 31, 1515–1518. [Google Scholar] [CrossRef]
- Wen, S.; Chung, D.D.L. Self-sensing of flexural damage and strain in carbon fiber reinforced cement and effect of embedded steel reinforcing bars. Carbon 2006, 44, 1496–1502. [Google Scholar] [CrossRef]
- Goldfeld, Y.; Ben-Aarosh, S.; Rabinovitch, O.; Quadflieg, T.; Gries, T. Integrated self-monitoring of carbon based textile reinforced concrete beams under repeated loading in the un-cracked region. Carbon 2016, 98, 238–249. [Google Scholar] [CrossRef]
- Smith, A.D.; Niklaus, F.; Paussa, A.; Vaziri, S.; Fischer, A.C.; Sterner, M.; Forsberg, F.; Delin, A.; Esseni, D.; Palestri, P. Electromechanical Piezoresistive Sensing in Suspended Graphene Membranes. Nano Lett. 2013, 13, 3237–3242. [Google Scholar] [CrossRef] [PubMed]
- Lim, M.J.; Lee, H.K.; Nam, I.W.; Kim, H.K. Carbon nanotube/cement composites for crack monitoring of concrete structures. Compos. Struct. 2017, 180, 741–750. [Google Scholar] [CrossRef]
- Filho, E.D.S.S.; Barbosa, M.T.G. Dynamic Size Effect in Normal- and High-Strength Concrete Cylinders. ACI Mater. J. 2006, 102, 77–85. [Google Scholar]
- Su, J.; Yang, Z.; Fang, Z. Size Effect of Concrete Compressive Strength with Different Aggregate Composition. Key Eng. Mater. 2009, 400, 831–835. [Google Scholar] [CrossRef]
- Han, B.; Guan, X.; Ou, J. Electrode design, measuring method and data acquisition system of carbon fiber cement paste piezoresistive sensors. Sens. Actuators A Phys. 2007, 135, 360–369. [Google Scholar] [CrossRef]
- Ivorra, S.; Garcés, P.; Catalá, G.; Andión, L.G.; Zornoza, E. Effect of silica fume particle size on mechanical properties of short carbon fiber reinforced concrete. Mater. Des. 2010, 31, 1553–1558. [Google Scholar] [CrossRef]
- Tosti, L.; Zomeren, A.V.; Pels, J.R.; Comans, R.N.J. Technical and environmental performance of lower carbon footprint cement mortars containing biomass fly ash as a secondary cementitious material. Resour. Conserv. Recycl. 2018, 134, 25–33. [Google Scholar] [CrossRef]
- Giner, V.T.; Baeza, F.J.; Ivorra, S.; Zornoza, E.; Galao, Ó. Effect of steel and carbon fiber additions on the dynamic properties of concrete containing silica fume. Mater. Des. 2012, 34, 332–339. [Google Scholar] [CrossRef]
Figure 1.
Preparation and Pressure-Sensitivity Test of CNFUC specimen. (a) Static resistivity test block of CNFPUC; (b) Two-electrode reference resistance method for static resistivity of CNFPUC specimen; (c) Preparation of CNFPUC hexahedron specimen; (d) Resistance test of CNFPUC hexahedron specimen; (e) The four-electrode position diagram for measuring the sensitivity of CNFPUC hexahedron; (f) Measurement of sensitivity of CNFPUC mixture by four-electrode method.

Figure 2.
CNFPUC seepage curve for different CNF contents.

Figure 3.
CNFPUC composite equivalent circuit for different CNF contents.

Figure 4.
Schematic diagram of the resistance calculation. (a) Calculation diagram of counter resistance; (b) Calculation diagram of impending resistance; (c) Calculation diagram of oblique resistance.
Figure 4.
Schematic diagram of the resistance calculation. (a) Calculation diagram of counter resistance; (b) Calculation diagram of impending resistance; (c) Calculation diagram of oblique resistance.

Figure 5.
Sensitivity fitting curve for CNFPUC hexahedron specimen with different ratio of polymer and silica fume. (a) Sensitivity fitting curve of CP1.7, CP1.6, CP1.5 and CP1.5-5; (b) Sensitivity fitting curve of CP1.4, CP1.4-5, CP1.4-8 and CP1.4-12; (c) Sensitivity fitting curve of CP1.3, CP1.3-5, CP1.3-8 and CP1.3-12; (d) Sensitivity fitting curve of CP1.2, CP1.2-5, CP1.2-8 and CP1.2-12.

Figure 6.
Relationship curve for resistance coefficient of variation and poly-ash ratio in CNFPUC hexahedron.
Figure 6.
Relationship curve for resistance coefficient of variation and poly-ash ratio in CNFPUC hexahedron.

Figure 7.
Relationship curve for sensitivity coefficient of variation and poly-ash ratio in CNFPUC hexahedron.
Figure 7.
Relationship curve for sensitivity coefficient of variation and poly-ash ratio in CNFPUC hexahedron.

Figure 8.
SEM images of different parts of CP1.6 CNFPUC hexahedron.

Figure 9.
SEM images of different parts of CP1.4-5 CNFPUC hexahedron.

Figure 10.
Relationship curve for CNF content and resistance coefficient of variation in CNFPUC hexahedron.
Figure 10.
Relationship curve for CNF content and resistance coefficient of variation in CNFPUC hexahedron.


Table 1.
Chemical composition of cement.
| Chemical Composition | CaO | SiO2 | Al2O3 | Fe2O3 | MgO | SO3 | Na2O | K2O | Cl | f-CaO | Loss |
|---|---|---|---|---|---|---|---|---|---|---|---|
| Percentage of mass (%) | 60.19 | 20.58 | 5.58 | 2.84 | 2.47 | 2.18 | 0.18 | 0.48 | 0.03 | 1.94 | 4.04 |
Table 2.
Physical parameters of carbon nanofiber.
| Purity | Diameter | Length | Draw Ratio | Resistivity | Thermal Expansivity | Thermal Conductivity | Specific Area | Stacking Density | Density |
|---|---|---|---|---|---|---|---|---|---|
| 99.9% | 150–200 nm | 10–20 μm | 70 | 6 × 10⁻⁶ Ω·m | 1.0 ppm/°C | 2000 W/m | 300 m2/g | 0.18 g/cm3 | 2 g/cm3 |
Table 3.
Chemical composition of silica fume.
| Chemical Composition | SiO2 | Al2O3 | Fe2O3 | MgO | CaO | Na2O | pH Average |
|---|---|---|---|---|---|---|---|
| Percentage of mass (%) | 85–96 | 1.0 | 0.9 | 0.7 | 0.3 | 1.3 | neutral |
Table 4.
Test block number.
| Proportion of Silica Fume Used Instead of Cement (%) | Poly-Ash Ratio | |||||
|---|---|---|---|---|---|---|
| 1:1:1.7 | 1:1:1.6 | 1:1:1.5 | 1:1:1.4 | 1:1:1.3 | 1:1:1.2 | |
| 0 | CP1.7 | CP1.6 | CP1.5 | CP1.4 | CP1.3 | CP1.2 |
| 5 | — | — | CP1.5-5 | CP1.4-5 | CP1.3-5 | CP1.2-5 |
| 8 | — | — | — | CP1.4-8 | CP1.3-8 | CP1.2-8 |
| 12 | — | — | — | CP1.4-12 | CP1.3-12 | CP1.2-12 |
Note: CP is the abbreviation for CNFPUC.
Table 5.
Coefficient of variation of hexahedron resistance.
| Proportion of Silica Fume Used Instead of Cement (%) | Poly-Ash Ratio | |||||
|---|---|---|---|---|---|---|
| 1:1:1.7 | 1:1:1.6 | 1:1:1.5 | 1:1:1.4 | 1:1:1.3 | 1:1:1.2 | |
| 0 | 0.593 | 0.526 | 0.296 | 0.336 | 0.431 | 0.486 |
| 5 | — | — | 0.308 | 0.092 | 0.173 | 0.397 |
| 8 | — | — | — | 0.146 | 0.108 | 0.288 |
| 12 | — | — | — | 0.253 | 0.189 | 0.217 |
Table 6.
Sensitivity coefficient under different ratios of polymer to silica fume.
| Proportion of Silica Fume Used Instead of Cement (%) | Poly-Ash Ratio | |||||
|---|---|---|---|---|---|---|
| 1:1:1.7 | 1:1:1.6 | 1:1:1.5 | 1:1:1.4 | 1:1:1.3 | 1:1:1.2 | |
| 0 | 87.4 | 171.9 | 519.1 | 359.8 | 270.7 | 225.3 |
| 5 | — | — | 371.7 | 697.2 | 580.9 | 286.7 |
| 8 | — | — | — | 605.3 | 688.2 | 428 |
| 12 | — | — | — | 503.7 | 560.1 | 530 |
Table 7.
Sensitivity error between sampling hexahedron and corresponding mixture.
| Type | CP1.7 | CP1.6 | CP1.5 | CP1.5-5 | CP1.4 | CP1.4-5 | CP1.4-8 | CP1.4-12 |
| Hexahedron (Sh) | 87.4 | 171.9 | 519.1 | 371.7 | 359.8 | 697.2 | 605.3 | 503.7 |
| CNFPUC Mixture (SP) | 77.2 | 153.3 | 490.4 | 346.7 | 334.8 | 680.8 | 584.4 | 474.9 |
| (Sh–SP)/Sh (%) | 11.72 | 10.84 | 5.52 | 6.73 | 6.95 | 2.35 | 3.46 | 5.72 |
| Type | CP1.3 | CP1.3-5 | CP1.3-8 | CP1.3-12 | CP1.2 | CP1.2-5 | CP1.2-8 | CP1.2-12 |
| Hexahedron (Sh) | 270.7 | 580.9 | 688.2 | 560.1 | 225.3 | 286.7 | 428 | 530 |
| CNFPUC Mixture (SP) | 246.2 | 558 | 668 | 536.2 | 203.3 | 262.3 | 402.1 | 503.7 |
| (Sh–SP)/Sh (%) | 9.04 | 3.95 | 2.93 | 4.27 | 9.77 | 8.52 | 6.04 | 4.96 |
Table 8.
Optimal blending ratio of CNF.
| Proportion of Silica Fume Used Instead of Cement (%) | Poly-Ash Ratio | ||||
|---|---|---|---|---|---|
| 1:1:1.6 | 1:1:1.5 | 1:1:1.4 | 1:1:1.3 | 1:1:1.2 | |
| 0 | 3–3.5% | 3.5–4% | 4–4.5% | 4.5–5% | 5–5.5% |
| 5 | — | 3–3.5% | 3.5–4% | 4–4.5% | 4.5–5% |
| 8 | — | — | 3–3.5% | 3.5–4% | 4–4.5% |
© 2018 by the authors. Licensee MDPI, Basel, Switzerland. This article is an open access article distributed under the terms and conditions of the Creative Commons Attribution (CC BY) license (http://creativecommons.org/licenses/by/4.0/).
Share and Cite
MDPI and ACS Style
Yang, N.; Zhang, K.; Sun, Q. Dispersion and Pressure Sensitivity of Carbon Nanofiber-Reinforced Polyurethane Cement. Appl. Sci. 2018, 8, 2375. https://doi.org/10.3390/app8122375
AMA Style
Yang N, Zhang K, Sun Q. Dispersion and Pressure Sensitivity of Carbon Nanofiber-Reinforced Polyurethane Cement. Applied Sciences. 2018; 8(12):2375. https://doi.org/10.3390/app8122375
Chicago/Turabian StyleYang, Nan, Kexin Zhang, and Quansheng Sun. 2018. "Dispersion and Pressure Sensitivity of Carbon Nanofiber-Reinforced Polyurethane Cement" Applied Sciences 8, no. 12: 2375. https://doi.org/10.3390/app8122375
Note that from the first issue of 2016, this journal uses article numbers instead of page numbers. See further details here.