Application of RFID to Soil-Erosion Research


1
Department of Geography, University of Sheffield, Sheffield S10 2TN, UK
2
Department of Geography and Planning, School of Environmental Sciences, University of Liverpool, Liverpool L69 3BX, UK
3
Center for Research in Isotopes and Environmental Dynamics, University of Tsukuba, Tsukuba 305-8577, Japan
4
Center for Advanced Research Facility, National Institute for Earth Science and Disaster Prevention, Tsukuba 305-0006, Japan
*
Author to whom correspondence should be addressed.
Appl. Sci. 2018, 8(12), 2511; https://doi.org/10.3390/app8122511
Submission received: 9 October 2018
/
Revised: 26 November 2018
/
Accepted: 28 November 2018
/
Published: 6 December 2018
(This article belongs to the Special Issue Innovative RFID Applications)
Abstract
:Soil erosion is a problem of global significance; yet obtaining data on rates of soil erosion is not straightforward. Radio-Frequency Identification (RFID) offers the prospect of improvements in estimates of these rates through better understanding of the movement of individual soil particles. We report on two laboratory experiments to measure the travel distances of surrogate soil particles during erosion events. In the first experiment, we used RFID tags that need to be placed within a reader for identification. In the second, we used tags with a booster antenna that allowed remote detection. The recovery rate of particles in the first experiment was 81.7%. Most likely, lost particles were buried by other moving sediment. The distribution of travel distances is well fitted by a Burr 4-parameter distribution which lends support to its use for modelling travel distances of eroded particles. In the second experiment, the average distance from which particles could be detected was 62 mm and the average error in locating particles was 17.9 mm. We attribute much of this error to the assumptions that the detection field is a circle on the ground with the reader at its centre, and that the same detection range exists for all positions of the reader. RFID is shown to provide insights into the movement of individual soil particles, but improvements are needed in both particle detection range and modelling of soil particle movement before the full potential of RFID for measuring soil erosion can be realized.
1. Introduction
Soil erosion is a problem of global significance. Of the variety of agencies that may be responsible for soil erosion, water is a principal one. An estimate by Reference [1] put the annual global cost of soil erosion by water in excess of US$ 7 billion. Despite its importance, obtaining data on rates of soil erosion on which to base land-management practices is not straightforward. Although several methods have been used, the rates obtained have been called into question (e.g., References [2,3]). More than 20 years ago, Reference [4] (p. 23) commented that to obtain estimates of rates of erosion “Emphasis should be given to measuring the distance particles are transported by splash, wash and rills in an erosion event.” However, because of their size and number, tracking the movement of individual soil particles has proved difficult in the past. For the most part tagging of bulk tracers has been used. (For a review and discussion of such tracers, see Reference [5]). More recently, tracking of individual particles has been achieved. Reference [6] reported on real-time tracking of individual fluorescent particles in a laboratory study, and Reference [7] used Radio-Frequency Identification (RFID) transponders to monitor the movement of tagged artificial ‘soil’ particles in both laboratory and field experiments. In this paper we report on two further experiments to assess the role of RFID to measure the distance travelled by soil particles during erosion events. In the first experiment we focus on RFID tagged particles that are the same size as their surrounding particles. The aim here is, in the longer term, to develop this study in conjunction with Reference [8] to demonstrate how the movement of tagged particles can be used to derive a rate of soil erosion. However, the particles used in this experiment need to be located within a reader in order to be identified, constraining the practical application of the study. In the second experiment, we used tags with a booster antenna that allowed remote detection to assess the range and accuracy of remote detection. Since both experiments can be described as feasibility studies, controlled laboratory conditions are used.
2. Materials and Methods
The experiments were conducted on an experimental plot (Figure 1) using the large-scale rainfall simulator at the National Research Institute for Earth Science and Disaster Resilience (NIED), Tsukuba Japan. The simulator is able to provide rainfall intensities between 15 and 300 mm/h from nozzles located 16 m above the ground, enabling the rainfall to attain near terminal velocity. The plot (originally constructed for experiments in 2009, see Reference [8]) was modified for the first experiment by adding a 60-mm-deep surface layer of quartz gravel with a median diameter of 2.86 mm (see Figure 2).
For this experiment, we manufactured artificial gravel particles each embedded with an RFID tag. The tags were made by TOPPAN FORMS Co., Ltd., Tokyo, Japan, and had a size of 2 mm × 1.8 mm × 0.4 mm. The tags were read by using R/W (TOPPAN FORMS Co., Ltd., Figure 3). To make the artificial gravel particles as similar as possible to the surface layer on the plot, they were coated in household-use cement, which is in use for making fishing lure, in order to make them roughly spherical in shape They were then coated in bronze powder to give them an overall density similar to that of quartz. Thus, the particles were comparable in size, shape and density to the surface layer on the plot. For ease of identification, they were further coated in fluorescent powder. The final particles were between 2.5 mm and 4.0 mm in diameter and had specific weights of 2.5 to 3.0. As each particle was made by hand the size and specific weights vary, but their overall characteristics make them comparable in size, shape and density to the surrounding gravel particles. Within the plot, 300 tagged particles were placed on the surface approximately 50 mm apart in three lines 5.5, 7.0 and 8.5 m from the upper boundary of the plot. The precise location of each particle was obtained using a Tajima laser total station (Type: TT-027, accuracy of distance: 1.5 mm + 2 ppm). The experiment consisted of applying rainfall to the plot for 45 min at an intensity of 137 mm/h. This duration and intensity were selected in order that infiltration would be exceeded, and the runoff would have time to reach equilibrium. During the experiment, runoff (and any included sediment) was sampled volumetrically at the outlet of the plot every two minutes in order to generate hydrographs and sedigraphs to be used in subsequent modelling. In each interval between these samples, sediment leaving the plot was collected in a sieve. After the experiment, the location of each of the tagged particles was determined using the same method as before, after which the particle was removed from the plot to read its RFID tag. Although most of the particles moved only a short distance during the experiment (see Section 3), a few were transported off the plot and were collected with the water and sediment samples. These particles were identified and the time they left the plot was recorded.
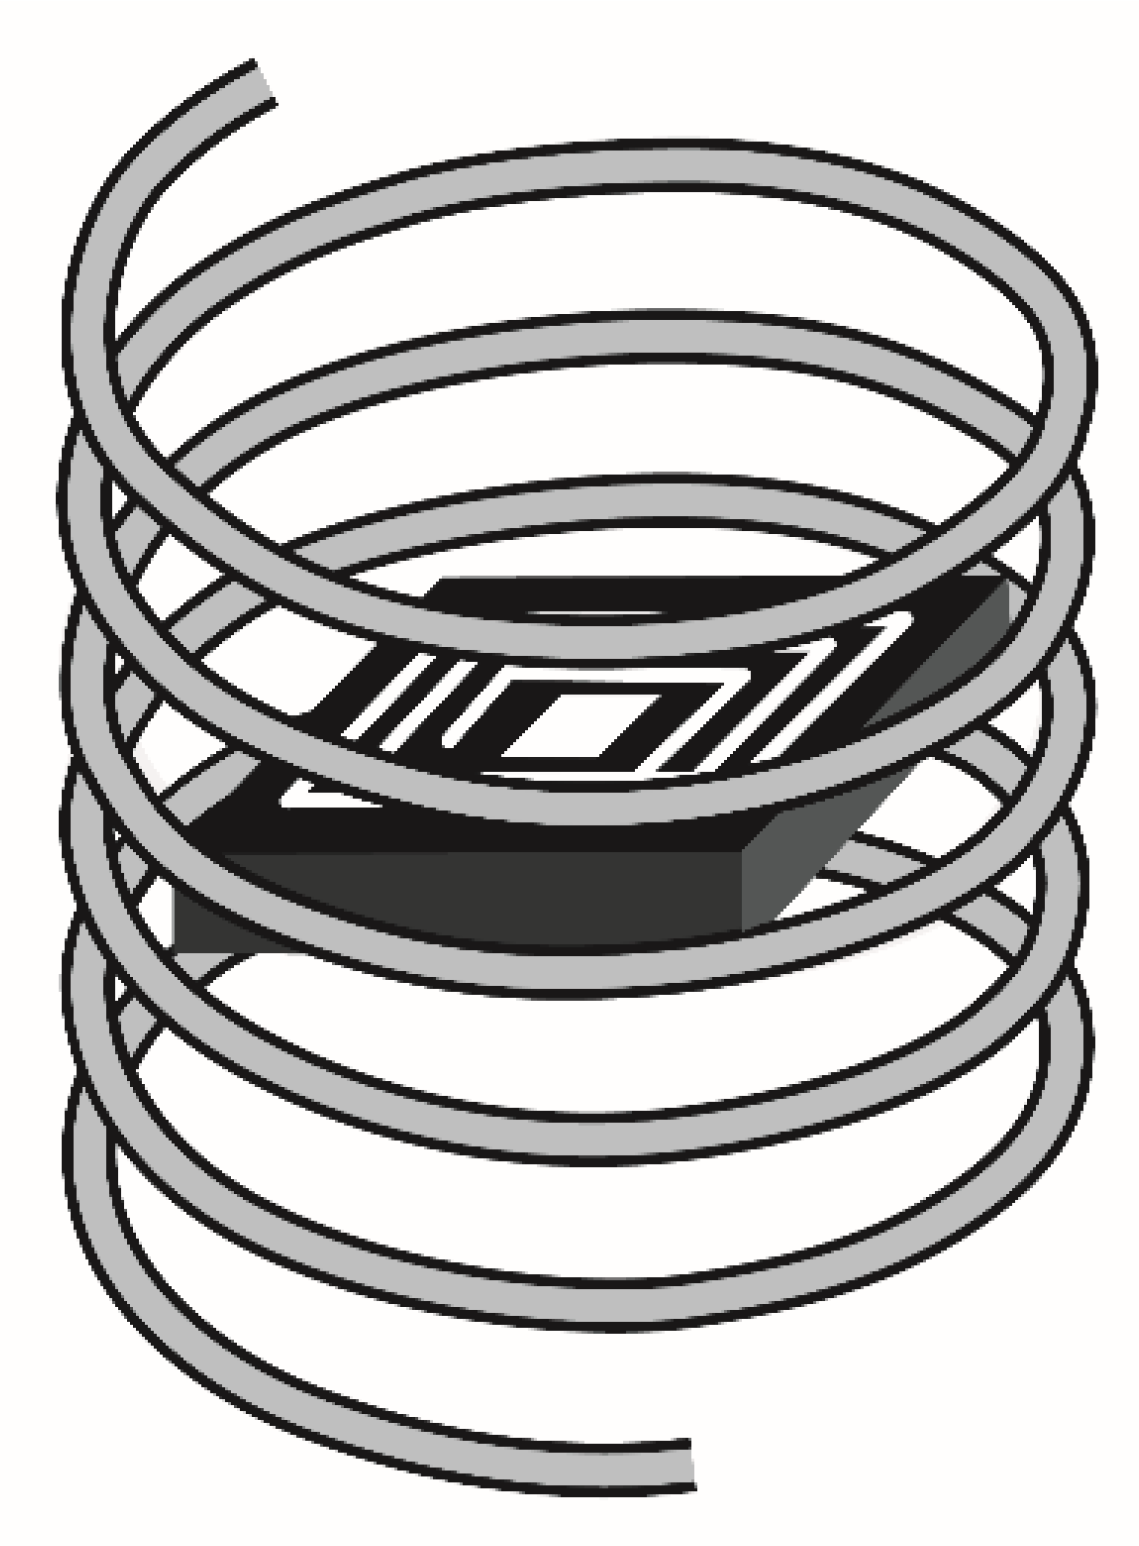
For the second experiment, we used an UHF tag manufactured by Hitachi Chemical Co., Tokyo, Japan, measuring 2.5 by 2.5 by 0.4 mm. By placing the tag within a booster antenna (Figure 4), remote detection becomes possible. Similar to the first experiment, we manufactured 100 artificial soil particles by encasing the tag and its antenna in a clear silicone resin (NisshinAssociates Co., Ltd., Tokyo, Japan), in order to make them roughly spherical in shape, and then coated the resin in bronze powder to give the particles an overall density similar to that of quartz particles. For ease of identification, they were further coated in fluorescent powder. The final surrogate soil particles had a median diameter of 6 mm and had specific weights of 2.5 to 3.0. Again, as each particle was made by hand, the size and specific weights vary. Although the goal of this experiment was to test the range and accuracy of remote detection of the tagged particles, so that their size, shape and density in relation to the surrounding gravel is not important, we made them similar to comparably sized quartz particles for possible use in further experiments. The reader employed was a UHF band IC tag handy reader writer XIT-261-G manufactured by Welcat Inc. Tokyo, Japan. Trials with the RFID reader showed that the tags could be read from a distance of about 100 mm. Within the plot used for the first experiment, we constructed a 1-m-wide plot along the centre line (Figure 2). The cross section of the plot had been previously shaped into a shallow depression (maximum depth 100 mm) running the full length of the plot (less the top 50 cm) to achieve a range of runoff depths. The particles were placed at 50 mm spacings in a 5-across by 20-down array starting 6.4 m from the top of the plot. The array of particles was located such that the deepest part of the depression corresponded with the fourth line of the array. We established a grid over the area of the tagged particles and sited the RFID reader at 25-mm spacings in a rectangular grid, recording all the RFIDs that could be detected from each location (Figure 5). The plot was then subject to 22 min of rainfall at 200 mm/h. We used a higher rainfall intensity in this experiment in order to achieve greater runoff, and longer travel distances of the particles than occurred in the first experiment. Runoff was collected volumetrically in 10-s samples taken at 1-min intervals. Tagged particles leaving the plot were collected with, and between, the runoff samples, and those remaining on the plot were identified after the experiment using the same grid to locate the reader.
3. Results
3.1. Experiment 1
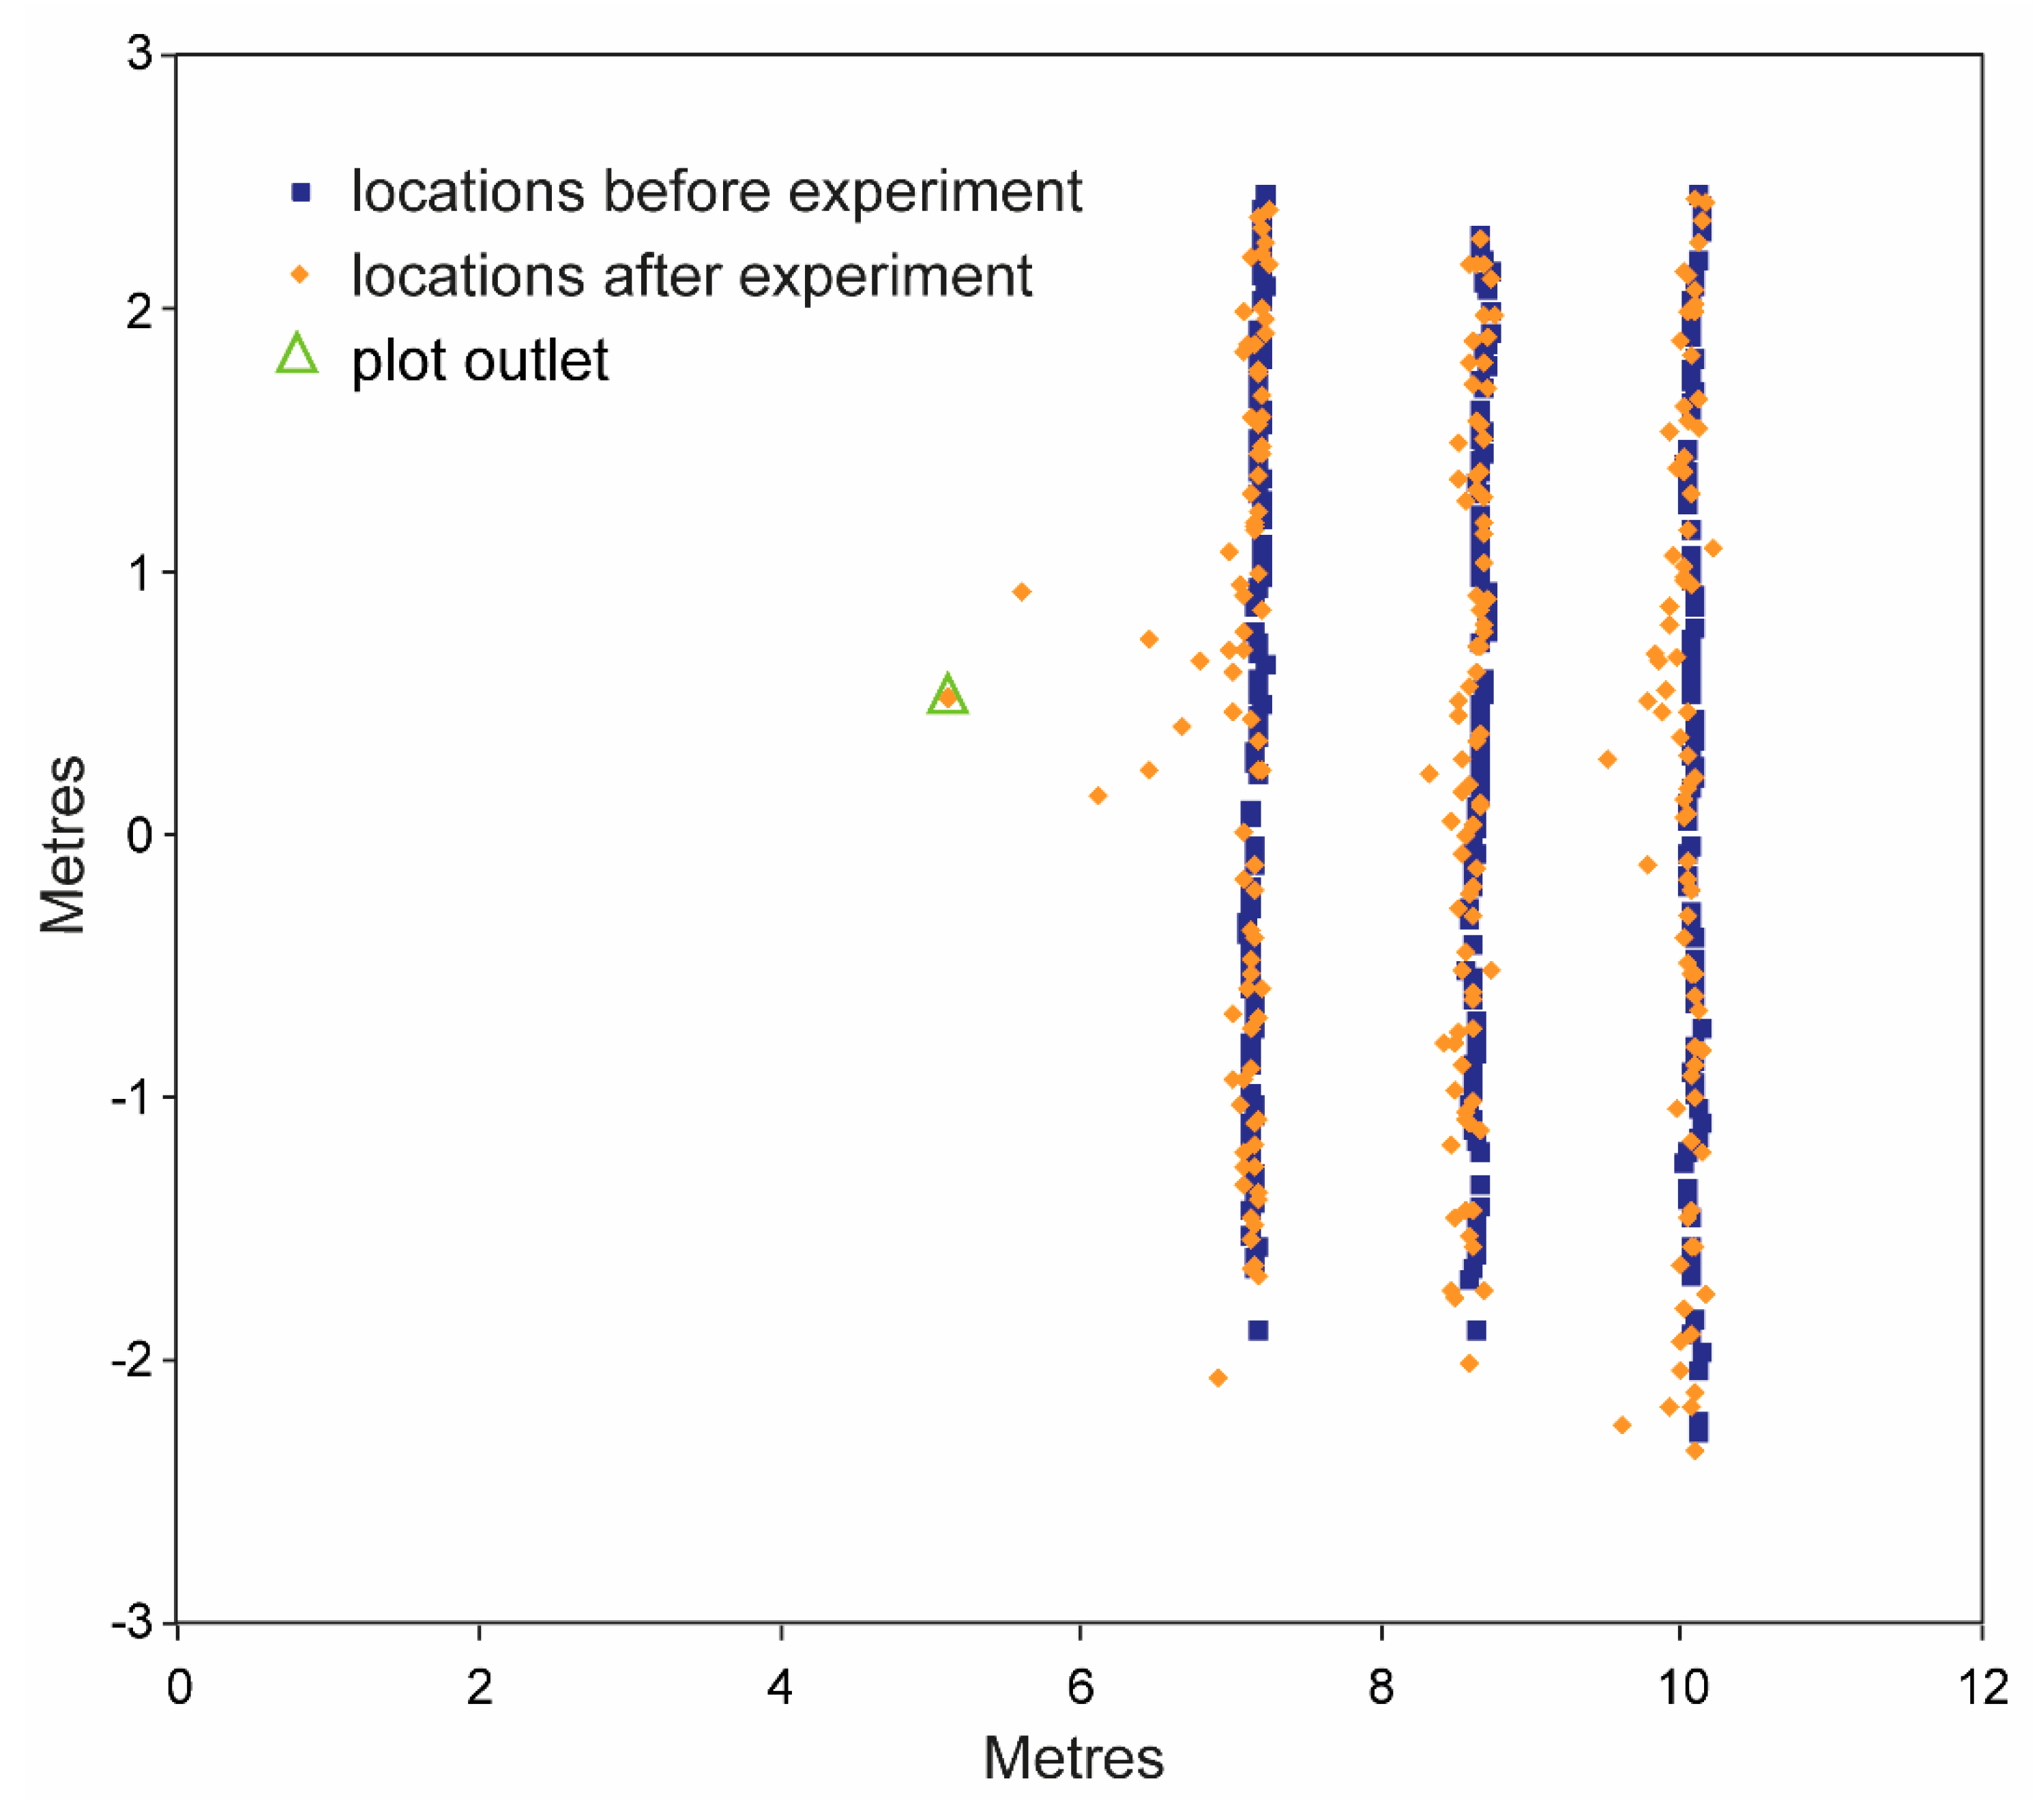
Of the 300 tagged particles set out before the experiment, 240 were recovered on the plot and 5 left the plot during minutes 14 to 19 of the experiment. The remaining 55 particles were not recovered. Most likely, they were buried by other moving sediment and not found during the re-survey (despite some excavation of the surface). The mean distance of travel of the particles remaining on the plot was 125.7 mm and the median distance was 73.1 mm. The positions of the particles before and after the experiment are shown on Figure 6.
3.2. Experiment 2
3.2.1. Survey of In-Situ Particles
Using the grid to locate the reader from which to detect the particles, a wide range in the number of observations of the tagged particles was found. The minimum number of locations from which a particular particle was recorded was one, and the maximum was 33. The modal value was 15. The average distance from which particles could be detected was 62 mm.
A method for locating RFID-tagged particles from multiple observations was presented by Reference [9] in which the X and Y coordinates of a particle are given by
and
respectively, in which x1…xn and y1…yn are the coordinates of the reader from which the particular particle is recorded. Using this method, and assuming that there is no error in the actual locations of the particles with respect to the nominal array (but see Figure 5), the results are as shown in Figure 7. The minimum difference between the actual and computed locations of the particles is 6.3 mm, the average is 17.9 mm, and the maximum is 45.7 mm.
3.2.2. Recording of Particles after the Rainfall Event
Twenty-two particles remained on the plot after the rainfall event, 29 were collected with the runoff samples, and 49 left the plot during the intervals between collecting runoff samples. Of these, 26 left the plot before minute 9 of the experiment and the times for the remaining 23 were not recorded. Of the 22 particles remaining on the plot, 10 were from line one corresponding with the greatest distance from the centre of the depression. The fewest were from lines 2 and 5 (one and two particles, respectively), and intermediate numbers (four and five particles) from lines 3 and 4, respectively. Correspondingly, the fewest particles leaving the plot were from line 1 (10), the greatest number from lines 2 and 5 (19 and 18, respectively), and intermediate numbers from lines 3 and 4 (17 and 15, respectively). Particles leaving the plot before minute 9 showed only a slight bias towards the lower part of the array compared to those leaving after minute 9. Mean travel distances were 4.62 m and 4.76 m, respectively, but the difference is statistically significant (p = 0.047).
4. Analysis and Discussion
4.1. Experiment 1
The recovery rate of particles (81.7%) is lower than that for a previous laboratory experiment (97%), but comparable to that for field experiment (84.5%) reported by Reference [7]. In all probability the loss is a function of total rainfall. For the present experiment, total rainfall was 103 mm, whereas for the previous laboratory and field experiments it was 15 mm and 106 mm, respectively. The need to physically locate the tagged particles in order to identify them and record their travel distance is a weakness of this use of RFID for measuring soil erosion, and limits its practical application to (i) the understanding of processes, (ii) studies of factors controlling rates of erosion conducted in the laboratory or controlled field experiments, and (iii) providing parametrisation for models of soil erosion. Nonetheless, these are important elements towards better practical predictions of soil erosion. The distribution of travel distances of individual particles is well fitted by a Burr 4-parameter distribution which Reference [10] fitted to the distribution of particles splashed by an individual raindrop. Inasmuch as the travel distances of these particles are short and most likely represent a combination of detachment by raindrops and transport by flow (see Reference [11]), this result lends support to the use of the Burr 4-parameter distribution for modelling travel distances of particles eroded by water.
4.2. Experiment 2
4.2.1. Survey of In-Situ Particles
There are several sources of error in the estimation of the locations of the tagged particles, beyond the simple assumption that the true locations are the nominal ones. The method assumes that the best estimate of the location of a particular particle is midway between the first and last x and y coordinates at which it is detected by the reader. This assumption means that the detection field is taken to be a circle on the ground with the reader at the centre of the circle, and also assigns the same detection range for all positions of the reader. The detection field of the reader will be a circle on the ground only if the reader and the ground surface are in the same plane. Any ground-surface irregularity or non-alignment of the two surfaces will distort the field of view on the ground surface, and thereby affect the distance over which an RFID can be detected in a particular direction. Such distortion is evident in Figure 5. For the fourth line of particles, the y coordinate is close to the same plane as the reader, but those to either side are not because of the shallow depression in which the particles were placed. The disparities between the actual and the detected locations of the particles show both greater asymmetry away from the central area, such that all but one of the detected locations of the particles in the two outer lines are to one side of the actual locations, and greater in absolute value. The mean error in location for line 1 is 22.4 mm, whereas that for line 4 is 15.1 mm. The misalignment of the plane of the reader and that of the ground surface leads to an increase in the number of points from which an individual particle can be detected (Figure 8).
As pointed out by Reference [12] the shape of the detection zone for an RFID is not a sphere but is a function of its orientation with respect to the reader. Since the orientation of the RFID within the particle is an unknown variable, the isotropic assumption of the detection method is compromised. Using data from the fourth line of particles, we examined the detection range along the x axis either side of the nominal locations of the particles. The average difference between detection on the left and right side of the nominal locations is close to zero (2.1 mm), as might be expected if the orientation of the RFID within the particle is random. However, the range is from 0 to 56.5 mm, indicating that the orientation of the RFID within an individual particle can have a significant effect on the detection distance.
Assuming the RFID tags are, themselves, identical so that the detection range of any individual tag varies only with the quality of the manufactured particles, it might be expected that the greater the number of positions from which any tag can be read the greater is the accuracy with which its true location can be determined. Such an expectation is not borne out by the data which shows a weak (R2 = 0.097), but statistically significant (p = 0.001), positive correlation between the number of observations and the error in its location (Figure 9). The possibility that this surprising result arises from the association of increased number of observations (Figure 8) with increased disparity between the planes of the detector and the ground surface was tested by analysing separately the data from the fourth and first line of particles. Neither regression is significant at p = 0.05, but the R2 for the fourth line is higher than that for the first line. Consequently, the positive relationship between the error and the number of observations cannot be attributed to this cause. This conclusion is consistent with the fact that the weakest relationship between the error and the number of observations is found for the error in the y coordinate (Figure 9). A second possible explanation is that it is affected by the orientation of the tag within the particle. A regression of the difference between the left and right detection range of particles along the fourth line of data on the number of observations is just significant (R2 = 0.19, p = 0.05), so this may be an explanation.
The sampling frequency affects the accuracy with which the RFID locations are detected. By removing alternate rows and columns in the grid used to site the reader (giving a sampling interval of 50 mm) the average error in locating the tagged particles is increased to 21.3 mm. However, the same weak (but statistically significant) positive relationship between the number of observations and the error in determining RFID locations is maintained.
The analysis demonstrates that with even a small detection range there is a significant error in the location of the tagged particles. In a 16-year study of travel distance of particles in southern Arizona, Reference [13] estimated that soil particles had travelled, on average, of the order of 0.18 m. The error associated with the present remote detection system is of the order of 10% of this value. As such, it is indicative of the likely temporal application of the approach. In other environments, where rates of soil erosion may be higher, the approach may be useful over shorter timescales.
4.2.2. Recording of Particles after the Rainfall Event
The locations and timings of particles leaving the plot are consistent with previous studies on interrill erosion. Reference [14] used a simulation model to predict an observed downslope pattern of soil loss. From this model, they were able to argue that soil erosion is greatest (i) where areas of flow are adjacent areas where flow is absent or shallow so that detachment by rainsplash is most effective and can splash particles into the flow, (ii) where flow is shallow enough to permit splash detachment, and (iii) where flow velocities are high enough to transport particles dislodged within or splashed into it. Reference [11] showed that the transport competence of rain-impacted overland flow is a function of the product of rainfall and flow energies. The RFID particles used in this experiment were too large to be splashed by rainfall impact, but observations during the experiment showed they could be dislodged, and thus become more readily available for transport by the flow. Due to their size, the competence of the flow to transport the particles would be a factor in determining their removal from the plot. The flow competence would be at a maximum at line 4 of the array where the flow was deepest, but this line would have the lowest value for rainfall energy. The product of rainfall energy and flow energy would reach a maximum away from this line, corresponding to the locations of most particles removed from the plot. Likewise, as discharge increased both down the plot and through time (plot discharge increased up to minute 12 of the experiment) dislodgement of particles by raindrops decreased, most likely accounting for the very small difference between locations of particles recorded before and after minute 9.
5. Conclusions
RFID has been shown to provide insights into the movement of individual particles that go some way to address the call made by Reference [4]. However, weaknesses remain. First the particles are large by the standards of soil particles. The most common size of particle transported by interrill flow is about 100 μm, Reference [15], whereas those used in this study have a diameter of several millimetres. This issue may not be significant if the relationships among transport distances of particles of different sizes is well understood. However, the evaluation of a transport-distance approach to modelling soil erosion, Reference [16], demonstrated that this is not the case, Reference [17]. Advances in this area are needed if the benefits of RFID are to be exploited. Secondly, unless the particles can be detected remotely, recovery rates may be insufficient. However, remote detection requires an external antenna, resulting in larger particles. Thirdly, the detection range for the latter type of RFID remains quite small. Fourthly, errors in the location of the detected particles will affect the error associated with any estimate of rates of soil erosion that are based upon them. Improvements are needed to achieve larger a detection range before the full potential of RFID for measuring soil erosion can be realized.
Author Contributions
Conceptualisation, A.P. and J.C.; methodology, A.P. and J.C.; formal analysis, A.P. and J.C.; investigation, A.P., J.C., Y.O., N.S.; resources, Y.O. and N.S.; data curation, A.P. and J.C.; writing—original draft preparation, A.P.; writing—review and editing, Y.O. and J.C.; visualisation, A.P. and J.C.; project administration, A.P. and Y.O.; funding acquisition, A.P. and Y.O.
Funding
This research was funded by The Leverhulme Trust, grant number EM-2013-015. Further support was provided by a collaborative research grant from the Interdisciplinary Project on Environmental Transfer of Radionuclides, University of Tsukuba.
Acknowledgments
We thank the numerous students and technicians from Tsukuba University and the National Research Institute for Earth Science and Disaster Prevention who assisted in the experiments reported in this paper.
Conflicts of Interest
The authors declare no conflict of interest.
References
- Pimentel, D.; Harvey, C.; Resosudarmo, P.; Sinclair, K.; Kurz, D.; McNair, M.; Crist, S.; Shpritz, L.; Fitton, L.; Saffouri, R.; et al. Environmental and economic costs of soil erosion and conservation benefits. Science 1995, 267, 1117–1123. [Google Scholar] [CrossRef] [PubMed]
- Trimble, S.W.; Cosson, P.U.S. Soil Erosion Rates—Myth and Reality. Science 2000, 289, 248–250. [Google Scholar] [CrossRef] [PubMed]
- Parsons, A.J.; Foster, I.D.L. What can we learn about soil erosion from the use of 137Cs? Earth Sci. Rev. 2011, 108, 101–113. [Google Scholar] [CrossRef]
- Evans, R.; Boardman, J. Assessment of water erosion in farmers’ fields in the UK. In Conserving Soil Resources: European Perspectives; Rickson, J., Ed.; CAB International: Wallingford, UK, 1994; pp. 13–24. [Google Scholar]
- Guzman Guzman, G.; Quinton, J.N.; Nearing, M.A.; Mabit, L.; Gómez, J.A. Sediment tracers in water erosion studies: Current approaches and challenges. J. Soils Sediments 2013, 13, 816–833. [Google Scholar] [CrossRef]
- Hardy Hardy, R.A.; James, M.R.; Pates, J.M.; Quinton, J.N. Using real time particle tracking to understand soil particle movements during rainfall events. Catena 2017, 150, 32–38. [Google Scholar] [CrossRef]
- Parsons, A.J.; Onda, Y.; Noguchi, T.; Patin, J.; Cooper, J.; Wainwright, J.; Sakai, N. The use of RFID in soil-erosion research. Earth Surf. Proc. Landf. 2014, 39, 1693–1696. [Google Scholar] [CrossRef]
- Cooper, J.R.; Wainwright, J.; Parsons, A.J.; Onda, Y.; Fukuwara, T.; Obana, E.; Kitchener, B.; Long, E.J.; Hargrave, G.H. A new approach for simulating the distribution of soil particles by water erosion: A marker-in-cell model. Water Res. Res. 2012, 117, F04027. [Google Scholar] [CrossRef]
- Barai, S.; Sau, B.; Mukhopadhyaya, K. Localization and mapping of passive RFID tags using recognition area of an RFID reader. In Proceedings of the 9th International Conference of Microwaves, Antenna, Propagation and Remote Sensing ICMARS-2013, Jodhpur, India, 11–14 December 2013; pp. 194–199. [Google Scholar]
- Long, E.J.; Hargrave, G.K.; Cooper, J.R.; Kitchener, B.G.B.; Parsons, A.J.; Hewett, C.; Wainwright, J. Experimental investigation into the impact of a liquid droplet onto a granular bed using 3D, time-resolved, particle tracking. Phys. Rev. E 2014, 89, 032201. [Google Scholar] [CrossRef] [PubMed]
- Parsons, A.J.; Stromberg, S.G.L.; Greener, M. Sediment-transport competence of rain-impacted interrill overland flow. Earth Surf. Proc. Landf. 1998, 23, 365–375. [Google Scholar] [CrossRef]
- Chapuis, M.; Bright, C.J.; Hufnagel, J.; MacVicar, B. Detection ranges and uncertainty of passive Radio Frequency Identification (RFID) transponders for sediment tracking in gravel rivers and coastal environments. Earth Surf. Proc. Landf. 2014, 39, 2109–2120. [Google Scholar] [CrossRef]
- Parsons, A.J.; Wainwright, J.; Fukuwara, T.; Onda, Y. Using sediment travel distance to estimate medium-term erosion rates: A 16-year record. Earth Surf. Proc. Landf. 2010, 35, 1694–1700. [Google Scholar] [CrossRef]
- Abrahams, A.D.; Parsons, A.J.; Luk, S.-H. The effect of spatial variability in overland flow on the downslope pattern of soil loss on a semi-arid hillslope, southern Arizona. Catena 1991, 18, 255–270. [Google Scholar] [CrossRef]
- Parsons, A.J.; Wainwright, J.; Abrahams, A.D. Tracing sediment movement in interrill overland flow on a semi-arid grassland hillslope using magnetic susceptibility. Earth Surf. Proc. Landf. 1993, 18, 721–732. [Google Scholar] [CrossRef]
- Wainwright, J.; Parsons, A.J.; Müller, E.N.; Brazier, R.E.; Powell, D.M.; Fenti, B. A transport-distance approach to scaling erosion rates: 1. Background and model development. Earth Surf. Proc. Landf. 2008, 33, 813–826. [Google Scholar] [CrossRef]
- Wainwright, J.; Parsons, A.J.; Müller, E.N.; Brazier, R.E.; Powell, D.M.; Fenti, B. A transport-distance approach to scaling erosion rates: 3. Evaluating scaling characteristics of MAHLERAN. Earth Surf. Proc. Landf. 2008, 33, 1113–1138. [Google Scholar] [CrossRef]
Figure 1.
The experimental plot shown under construction in 2009.

Figure 2.
The 1-m-wide plot used for the second experiment, showing also the surface layer of gravel used for both experiments.
Figure 2.
The 1-m-wide plot used for the second experiment, showing also the surface layer of gravel used for both experiments.

Figure 3.
An artificial gravel particle used in the first experiment shown within the Radio-Frequency Identification reader.
Figure 3.
An artificial gravel particle used in the first experiment shown within the Radio-Frequency Identification reader.

Figure 4.
Schematic of the RFID used in the second experiment embedded in a spiral antenna.

Figure 5.
The locations of the array of 100 particles being read by the RFID reader before the second experiment.
Figure 5.
The locations of the array of 100 particles being read by the RFID reader before the second experiment.

Figure 6.
Locations of tagged particles before and after experiment 1. Particles leaving the plot are shown located at the plot outlet. Distances on the axes are x and y coordinates from the location of the total station used to record the locations.
Figure 6.
Locations of tagged particles before and after experiment 1. Particles leaving the plot are shown located at the plot outlet. Distances on the axes are x and y coordinates from the location of the total station used to record the locations.

Figure 7.
Difference between RFID nominal locations and those obtained from the multiple observations by the remote reader.
Figure 7.
Difference between RFID nominal locations and those obtained from the multiple observations by the remote reader.

Figure 8.
Plot of number of detections of individual particles against their location across the shallow depression in which they were sited.
Figure 8.
Plot of number of detections of individual particles against their location across the shallow depression in which they were sited.

Figure 9.
Regression of error in locating particles on the number of times it was detected showing error in (i) the x coordinate, (ii) the y coordinate, and (iii) total error.
Figure 9.
Regression of error in locating particles on the number of times it was detected showing error in (i) the x coordinate, (ii) the y coordinate, and (iii) total error.

© 2018 by the authors. Licensee MDPI, Basel, Switzerland. This article is an open access article distributed under the terms and conditions of the Creative Commons Attribution (CC BY) license (http://creativecommons.org/licenses/by/4.0/).
Share and Cite
MDPI and ACS Style
Parsons, A.; Cooper, J.; Onda, Y.; Sakai, N. Application of RFID to Soil-Erosion Research. Appl. Sci. 2018, 8, 2511. https://doi.org/10.3390/app8122511
AMA Style
Parsons A, Cooper J, Onda Y, Sakai N. Application of RFID to Soil-Erosion Research. Applied Sciences. 2018; 8(12):2511. https://doi.org/10.3390/app8122511
Chicago/Turabian StyleParsons, Anthony, James Cooper, Yuichi Onda, and Naoki Sakai. 2018. "Application of RFID to Soil-Erosion Research" Applied Sciences 8, no. 12: 2511. https://doi.org/10.3390/app8122511
Note that from the first issue of 2016, this journal uses article numbers instead of page numbers. See further details here.