Real-Time Tunnel Deformation Monitoring Technology Based on Laser and Machine Vision


State Key Laboratory of Precision Measuring Technology and Instruments, School of Precision Instruments and Opto-electronics Engineering, Tianjin University, Tianjin 300072, China
*
Author to whom correspondence should be addressed.
Appl. Sci. 2018, 8(12), 2579; https://doi.org/10.3390/app8122579
Submission received: 23 October 2018
/
Revised: 7 December 2018
/
Accepted: 7 December 2018
/
Published: 11 December 2018
(This article belongs to the Special Issue Precision Dimensional Measurements)
Abstract
:Featured Application
The proposed tunnel deformation monitoring system was designed for tunnel during construction in dusty and dark environment with low visibility, and it also can be applied for the tunnel that has already been built.
Abstract
Structural health monitoring is a topic of great concern in the world, and tunnel deformation monitoring is one of the important tasks. With the rapid developments in tunnel traffic infrastructure construction, engineers need a portable and real-time system to obtain the tunnel deformation during construction. This paper reports a novel method based on laser and machine vision to automatically measure tunnel deformation of multiple interest points in real time and effectively compensate for the environment vibration, and moreover it can overcome the influence of a dusty and dark tunnel environment in low visibility. An automatic and wireless real-time tunnel deformation monitoring system, which is based on laser and machine vision and can give early warnings for tunnel collapse accidents, is proposed. The proposed system uses a fixed laser beam as a monitoring reference. The image acquisition modules mounted on the measured points receive the laser spots and measure the tunnel accumulative deformation and instantaneous deformation velocity. Compensation methods are proposed to reduce measurement errors caused by laser beam feasibility, temperature, air refraction index, and wireless antenna attitude. The feasibility of the system is verified through tunnel tests. The accuracy of the detection system is better than 0.12 mm, the repeatability is less than 0.11 mm, and the minimum resolution is 10 μm; therefore, the proposed system is very suitable for real-time and automatic detection of tunnel deformation in low visibility during construction.
1. Introduction
Structural health monitoring plays an indispensable role in diagnosing structure safety around the world [1], and tunnel deformation monitoring is one of the important tasks [2]. With the continuous expansion of the scale of tunnel traffic infrastructure construction, tunnel collapse accidents have occurred frequently in recent years [3]; this indicates that the traditional methods for monitoring tunnel deformation are unable to meet the new safety monitoring requirements for large tunnel traffic infrastructure [4], when real time becomes an important issue. In tunnel construction, the tunnel excavation surface is composed of tunnel face, side face, and roof face. Numerous workers are present on the excavation surface with dusty and dark environment in low visibility [5], and the tunnel deformation is at a maximum; thus, monitoring the deformation of this fracture surface in real time is important. The current tunnel deformation monitoring technology, including non-machine vision measurement methods and machine vision measurement methods [6], however, is not effective enough. Most of the existing equipment is manually operated and susceptible to a dusty and dark environment in low visibility, and cannot meet real-time automatic monitoring and early warning requirements or provide timely warnings about dangerous deformation [7].
Non-machine vision measurement methods are widely used in tunnel deformation monitoring; however, they are susceptible to environmental and human factors, and take a long time. Tape extensometers and convergence gauge are unstable and operated manually; in addition, they are strongly influenced by environmental and human factors [8]. The leveling method mainly addresses the tunnel settlement value [9] and requires many monitoring points to be set; thus, the error accumulates with the increase in the tunnel length. The indoor global positioning system measurement method requires many reference signal transmitters; however, it is difficult to ensure the stability of the reference signal transmitters position. The traditional total station measurement method has a low degree of automation, exhibits strong subjectivity, and requires a fixed station; these features affect the tunnel construction period [10]. The new-generation total station measurement method allows stations to be freely monitored, compared with the traditional method [11,12], but it cannot be used to monitor all kinds of tunnels because of its high cost [13]. The fiber Bragg grating measurement method [14] can be used to monitor tunnel deformation constantly over a long period of time, but it is expensive, and the relevant equipment is easily damaged. Moreover, the equipment needs to be embedded into the structure or adhered onto the structure surface during monitoring, which results in a higher demand on the environment. A deformation monitoring system based on ultrasonic sensors [15] is automatic and in real time; however, it is only suitable for small- to middle-size tunnels, and it cannot be used to realize early warnings of dangerous deformation during the construction. Terrestrial laser scanning [16] achieves tunnel deformation monitoring; however, it takes a long time to obtain and process point cloud data, and cannot realize real-time monitoring.
A machine vision measurement method for tunnel deformation develops a lot in the last few years [17]; however, existing machine vision measurement methods are not suitable for real-time tunnel deformation monitoring during construction with dusty and dark environments. A three-dimensional reconstruction method based on machine vision [18] needs to take lots of photos and the data processing algorithms are complex; this takes a long time and cannot meet real-time automatic monitoring and early warning requirements. A digital close-range photogrammetric method [19] is susceptible to tunnel dust and light intensity, heavy dust and a dark environment during construction reduces photo quality and detection accuracy. A photogrammetric method for tunnel detection based on a CCD camera [20] has a higher requirement for brightness and lighting equipment; this requires external power supply; when using batteries, the equipment is heavy and not easy to install; when using an electric generator, extra great vibration is produced and this affects the result. The infrared photogrammetric method [21] reduces dust impact at the price of decreasing photo brightness; as a result, the detection accuracy is low and cannot be used for real-time monitoring. Photogrammetric techniques for monitoring tunnel deformation [22] are only suitable for tunnels without dust after excavation, and it is also susceptible to dusty and dark environments. A tunnel detection method combining photogrammetry and laser scanning [23] is susceptible to the set position of the equipment; when the equipment is set deviating from the tunnel axis, the detection error increases obviously [24]; this indicates that the method is not suitable for a tunnel during construction, since the set position has a conflict with tunnel construction.
This paper presents a real-time and automatic tunnel deformation monitoring system to realize real-time monitoring and early warning for dangerous tunnel deformation. Considering the dusty and dark tunneling environment, a fixed laser beam is used to transmit the monitoring reference from a stable point to a measured point through the dust and darkness in low visibility, and a shielded image acquisition module mounted on the measured points is used to acquire the laser spot image regardless of the dust and darkness. However, because of the adverse tunnel environment, the measurement result is affected by laser beam feasibility, temperature, air refraction index, and wireless antenna attitude. These factors are carefully examined in this study, and compensation methods are proposed to reduce the measurement errors caused by them. The results show that the proposed system not only achieves good detection accuracy, repeatability and resolution, but also compensates for the shortcomings of the above methods, such as the low degree of automation, the lack of real-time measurement function and overcoming the influence of dusty and dark environments in low visibility.
2. Methodology
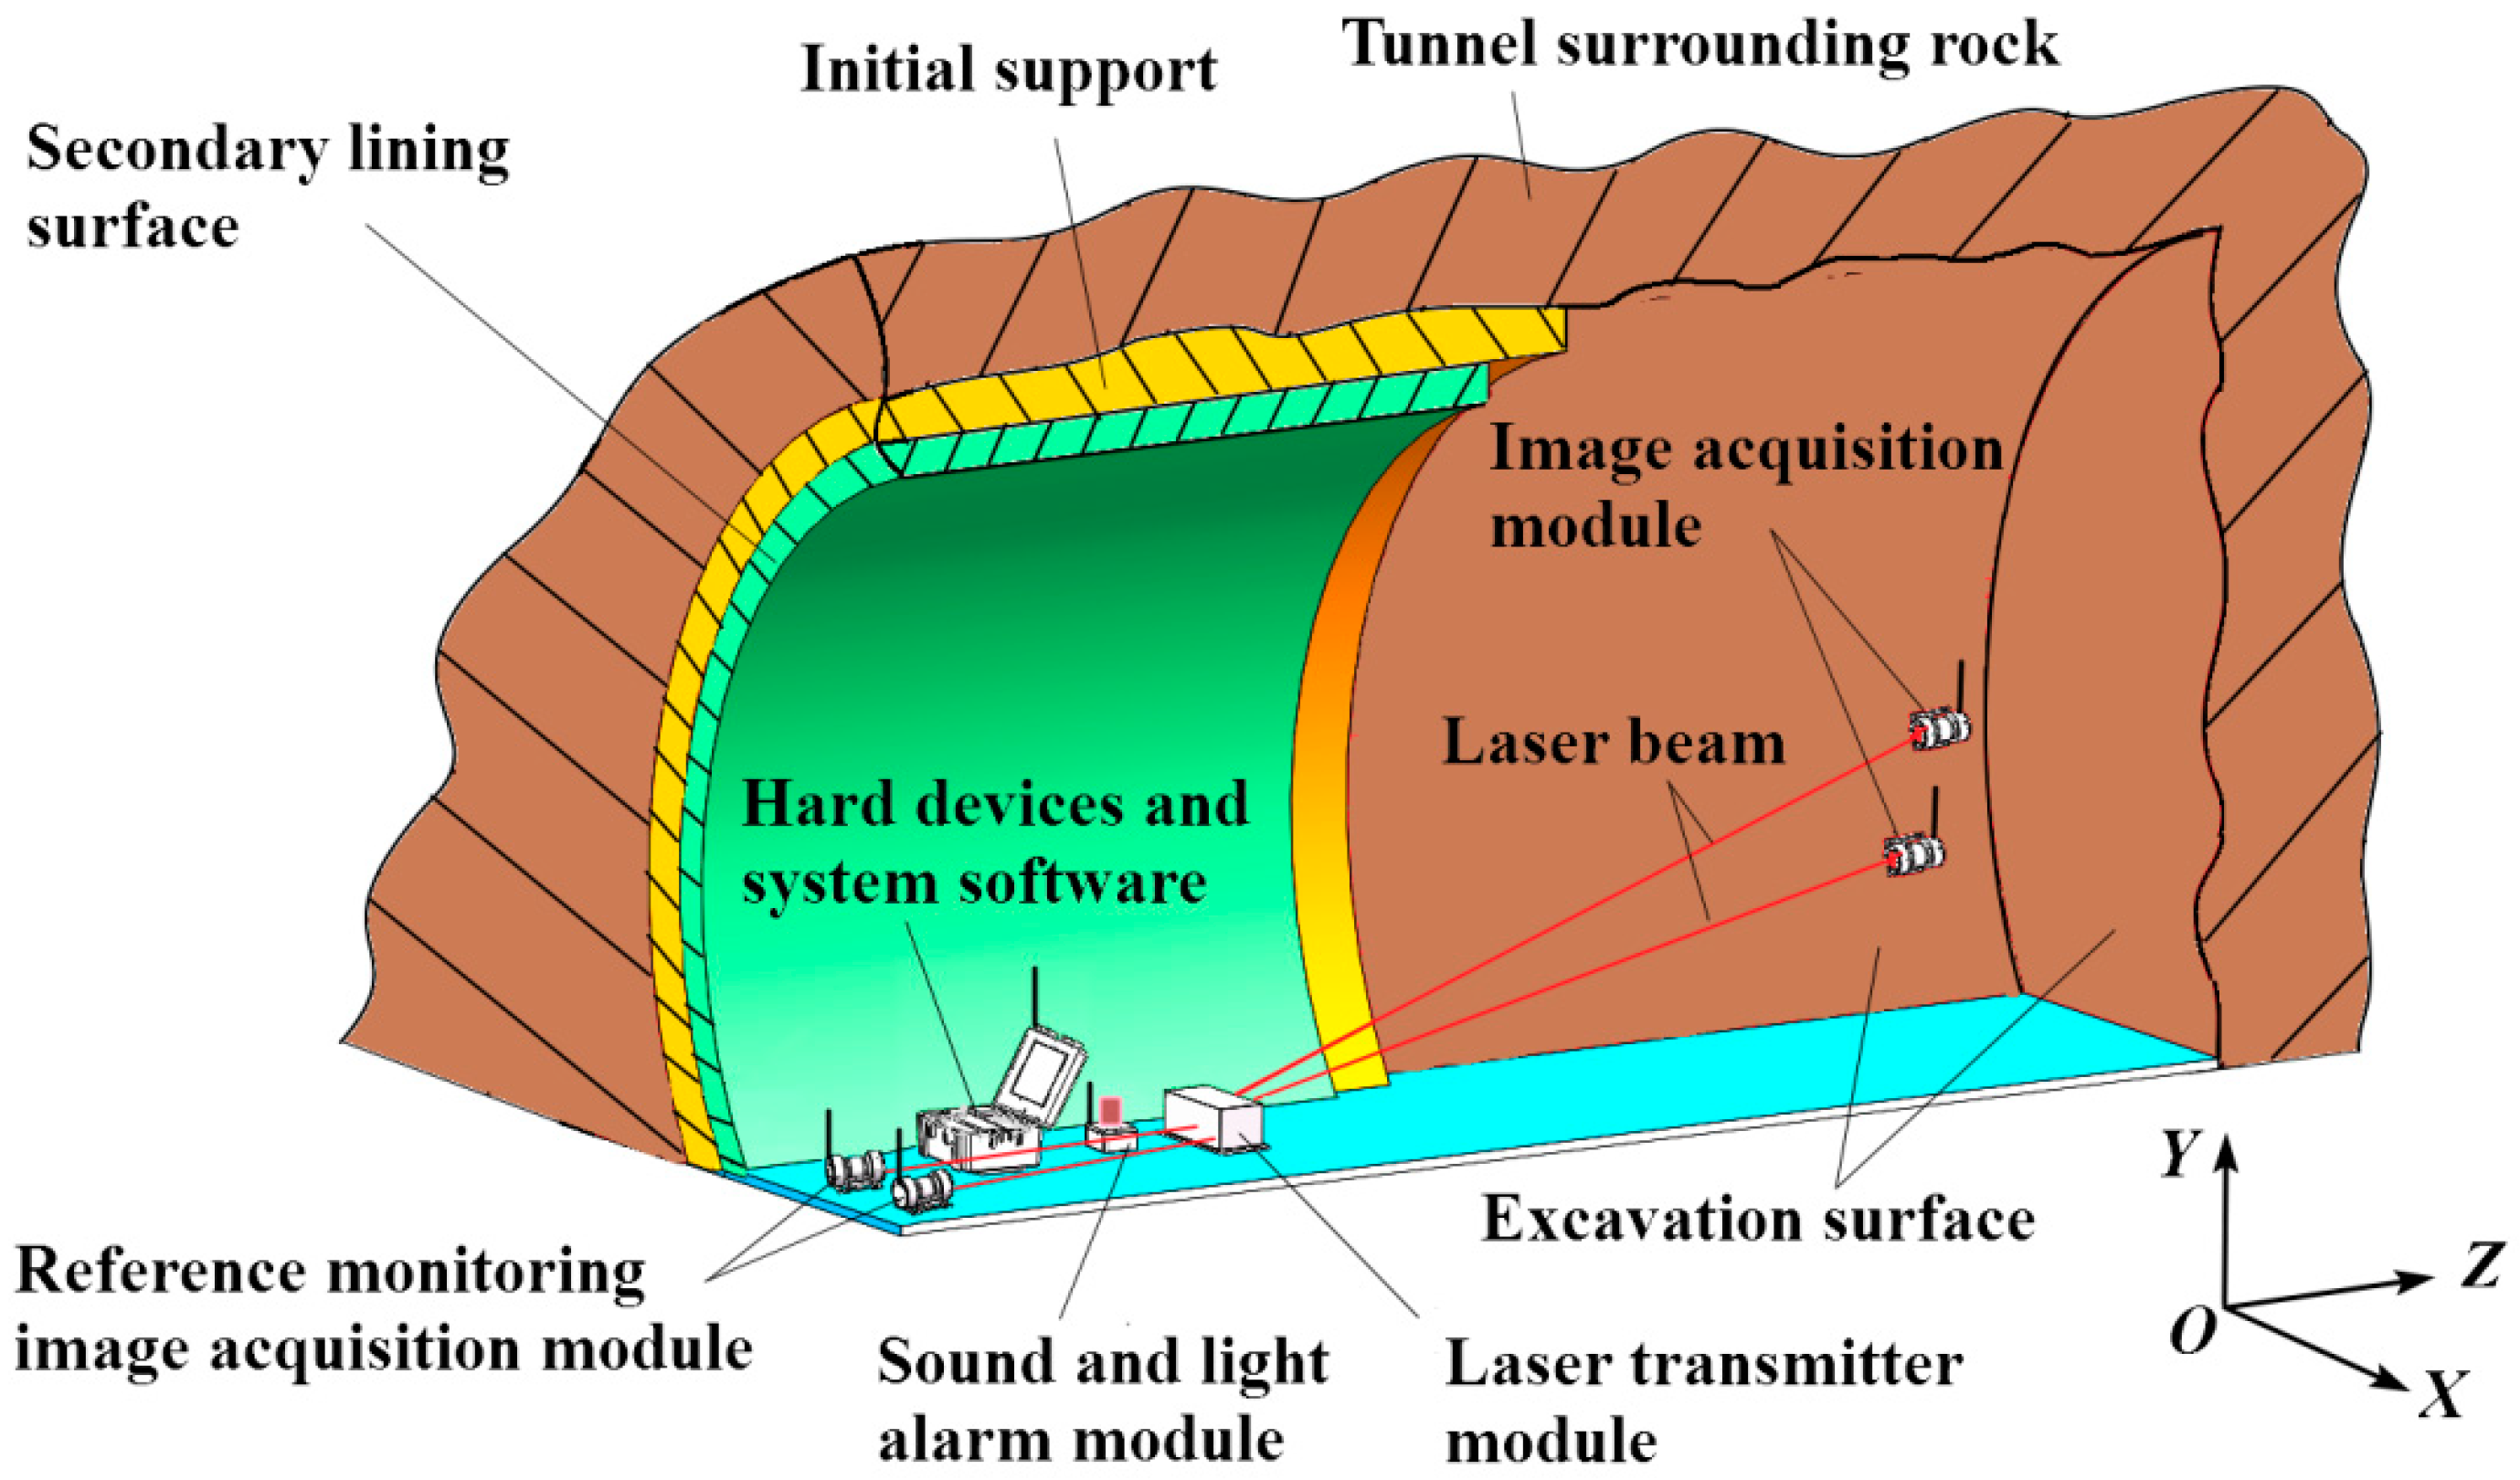
The tunnel collapse process is the deformation of the construction fracture surface in the tunnel, which takes a fixed point of the earth as a reference. At present, the new Austrian tunneling method [25], which includes designing an initial support and secondary lining to the construction fracture surface [26], is mostly adopted in tunnel construction. The secondary lining is constructed on the basis of the initial support when the deformation of the initial support becomes stable [27]. Therefore, the deformation of the secondary lining surface can be ignored; however, the deformation of the excavation surface and the edge part of the initial support is significant. The proposed system takes a fixed point of the earth as monitoring reference and measures the deformation of excavation surface. Given the good directivity and energy concentration of a laser, as well as the dusty and dark tunneling environment in low visibility, a laser beam is used to transmit the monitoring reference from the fixed point to the measured point through the dust and darkness, thereby forming an optical projection of the fixed point on the intersecting surface near the measured point, which is the optical equivalent reference, to monitor the tunnel deformation in the system. A sketch map of the system is shown in Figure 1.
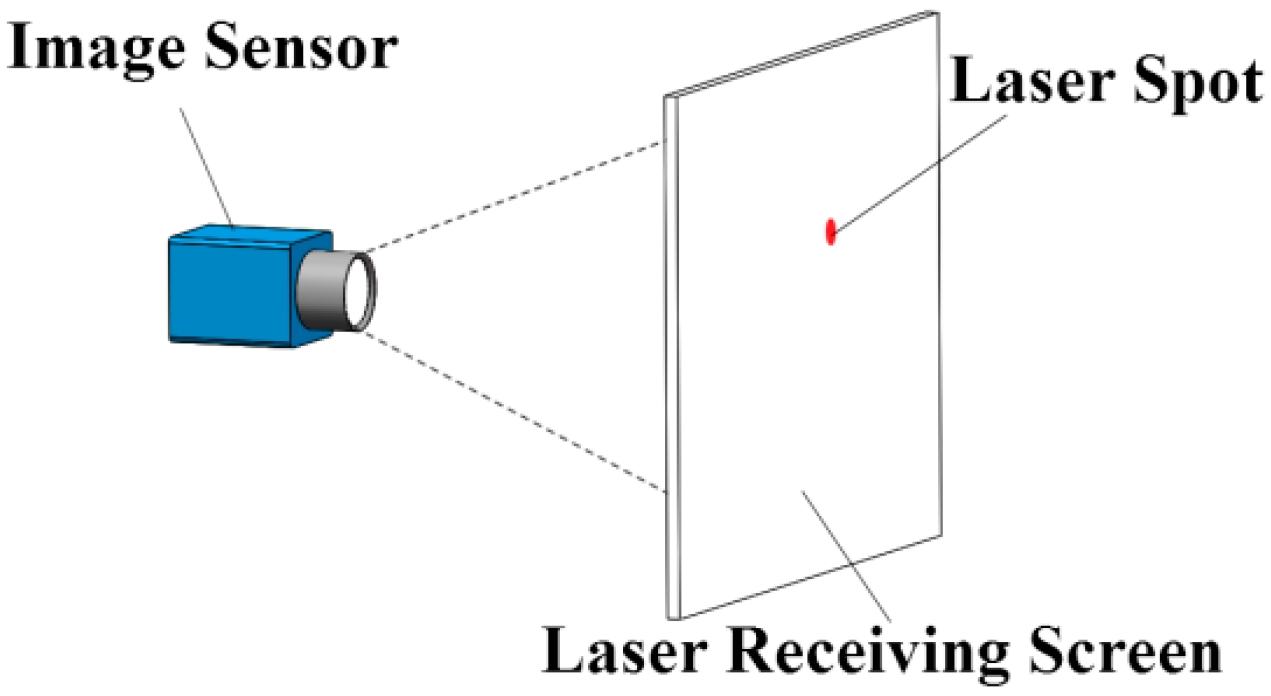
A laser transmitter module, whose laser beam points to the intersecting surface near the measured points and forms an optical projection of the fixed point as a laser spot, is firmly fixed on the earth. To obtain the position relationship between the measured point and the fixed point, an image acquisition module mounted on the measured point and located perpendicularly to the laser beam is used to acquire the laser spot image of the laser beam. This module monitors the laser spot position in the image coordinate system with machine vision technology. The image acquisition mode is shown in Figure 2. The image sensor acquires the laser spot image through a laser receiving screen placed in front of the sensor.
The image acquisition module is fixed on the measured points. When the excavation surface sinks during the deformation, the image acquisition module will sink along with it, thereby changing the laser spot position in the image coordinate system. The change of the laser spot position in the image coordinate system reflects the deformation of the excavation surface, including accumulative deformation and instantaneous deformation velocity [28].
The mathematical model of this principle is shown in Figure 3. The geometric center of the laser is the coordinate origin, the tunnel driving direction is the z-axis, the horizontal direction is the x-axis, and the vertical axis is the y-axis. Therefore, a three-dimensional world coordinate system o-xyz is established. The laser beam points to the laser receiving screen and forms a laser spot P on the screen.
Considering the horizontal and vertical position information, the coordinates of the spot P in the world coordinate system o-xyz are . To examine the position information of laser spot P in the image coordinate system, an image coordinate system on the laser receiving screen is established, as shown in Figure 3. The axis is parallel to the axis, and the axis is parallel to the axis; the coordinates of laser spot P in the image coordinate system are . The coordinate transformation of spot P in the two coordinate systems is shown in Equation (1). The constants and are coordinate conversion parameters, which are related to the relative position of the two coordinate systems:
In the three-dimensional world coordinate system o-xyz, the laser beam equation is shown as Equation (2), and the equation of the intersecting surface near the measured point is shown as Equation (3), where A, B, C, and d are constant parameters and are related to the laser position:
According to Equations (1)–(3), the coordinates of the laser spot in the image coordinate system o′-x′y′ can be obtained as shown in Equation (4):
According to Equation (4), when the positions of laser and image acquisition module are invariant, that is, when the parameters A, B, C, and d are invariant, the coordinates of the laser spot in the image coordinate system remain fixed. Therefore, the monitoring reference can be transmitted from the fixed point of the earth to the measured points. When the image acquisition module sinks during tunnel deformation, the image coordinate system moves relative to the world coordinate system o-xyz. Supposing that the vertical and horizontal deformation amounts of the image acquisition module are Δx and Δy, respectively, the laser spot position in the image coordinate system also shifts Δx and Δy in the vertical and horizontal directions, respectively. Therefore, when the image acquisition module shifts in the vertical and horizontal directions along with the measured point, the change of the laser spot position in the image coordinate system reflects the deformation.
In an actual situation, the laser beam is not absolutely perpendicular to the laser receiving screen. As a result, when the image acquisition module moves along the z-axis with the measured point, the laser spot will produce the displacement component in the vertical and horizontal directions. As shown in Figure 3, α is the angle between the laser beam and the ox axis, β is the angle between the laser beam and the oy axis, and θ is the angle between the laser beam and the oz axis. Assuming that the displacement change of image acquisition module along the oz axis is Δz, the errors of the horizontal and vertical deformation measurements are as shown in Equation (5):
Assuming that the laser beam points obliquely to the receiving screen, the angles α = 73.3°, β = 81.5°, and θ = 18.9° (in fact, the tilt of the laser beam is not that particularly obvious). When the image acquisition module shifts 1 mm along the oz axis, Δx = 0.3037 mm and Δy = 0.1562 mm. Therefore, when the shifting displacement of the image acquisition module along the z-axis is not large (and in fact it is not large) [29], this error can be ignored.
The laser transmitter module is mounted on the fixed point of the earth distant from the construction site, and it should remain stable. However, in cases of emergency during construction, such as sudden vibrating, when the laser beam reference is shifted and rotated, the position of the laser spot in the image coordinate will change. Taking the x-axis coordinate as an example, if the displacements along the x-axis and the horizontal rotation angle of the laser beam reference are and , respectively, the resulting laser spot position error is as shown in Equation (6):
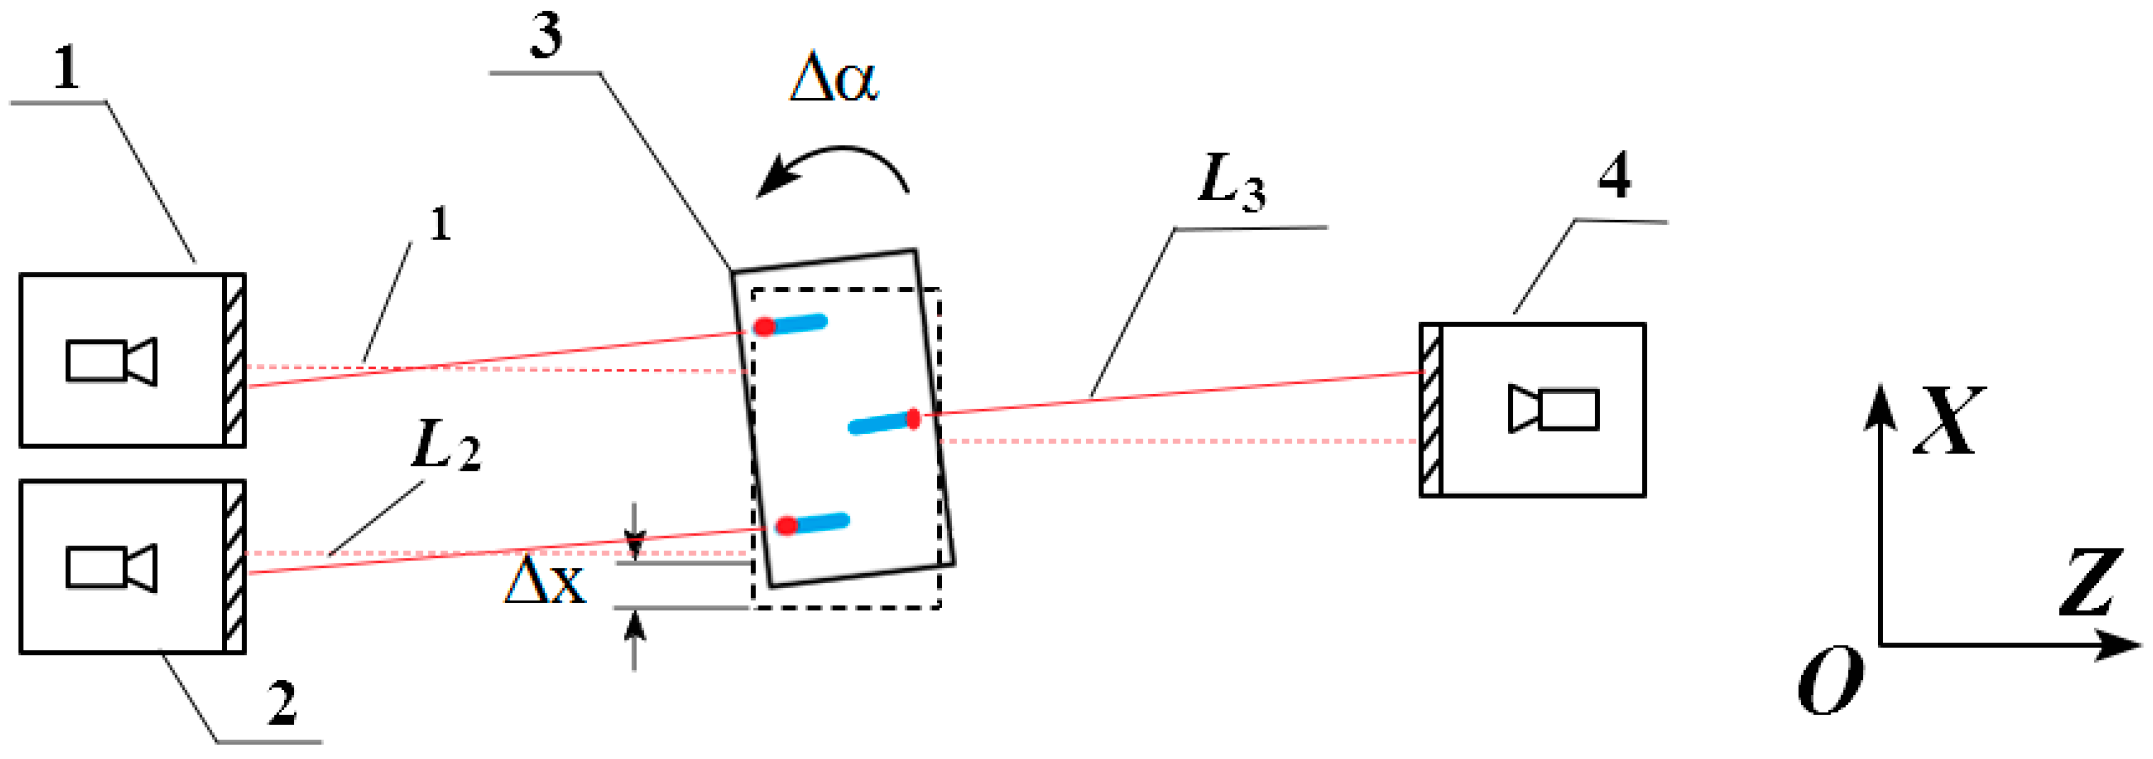
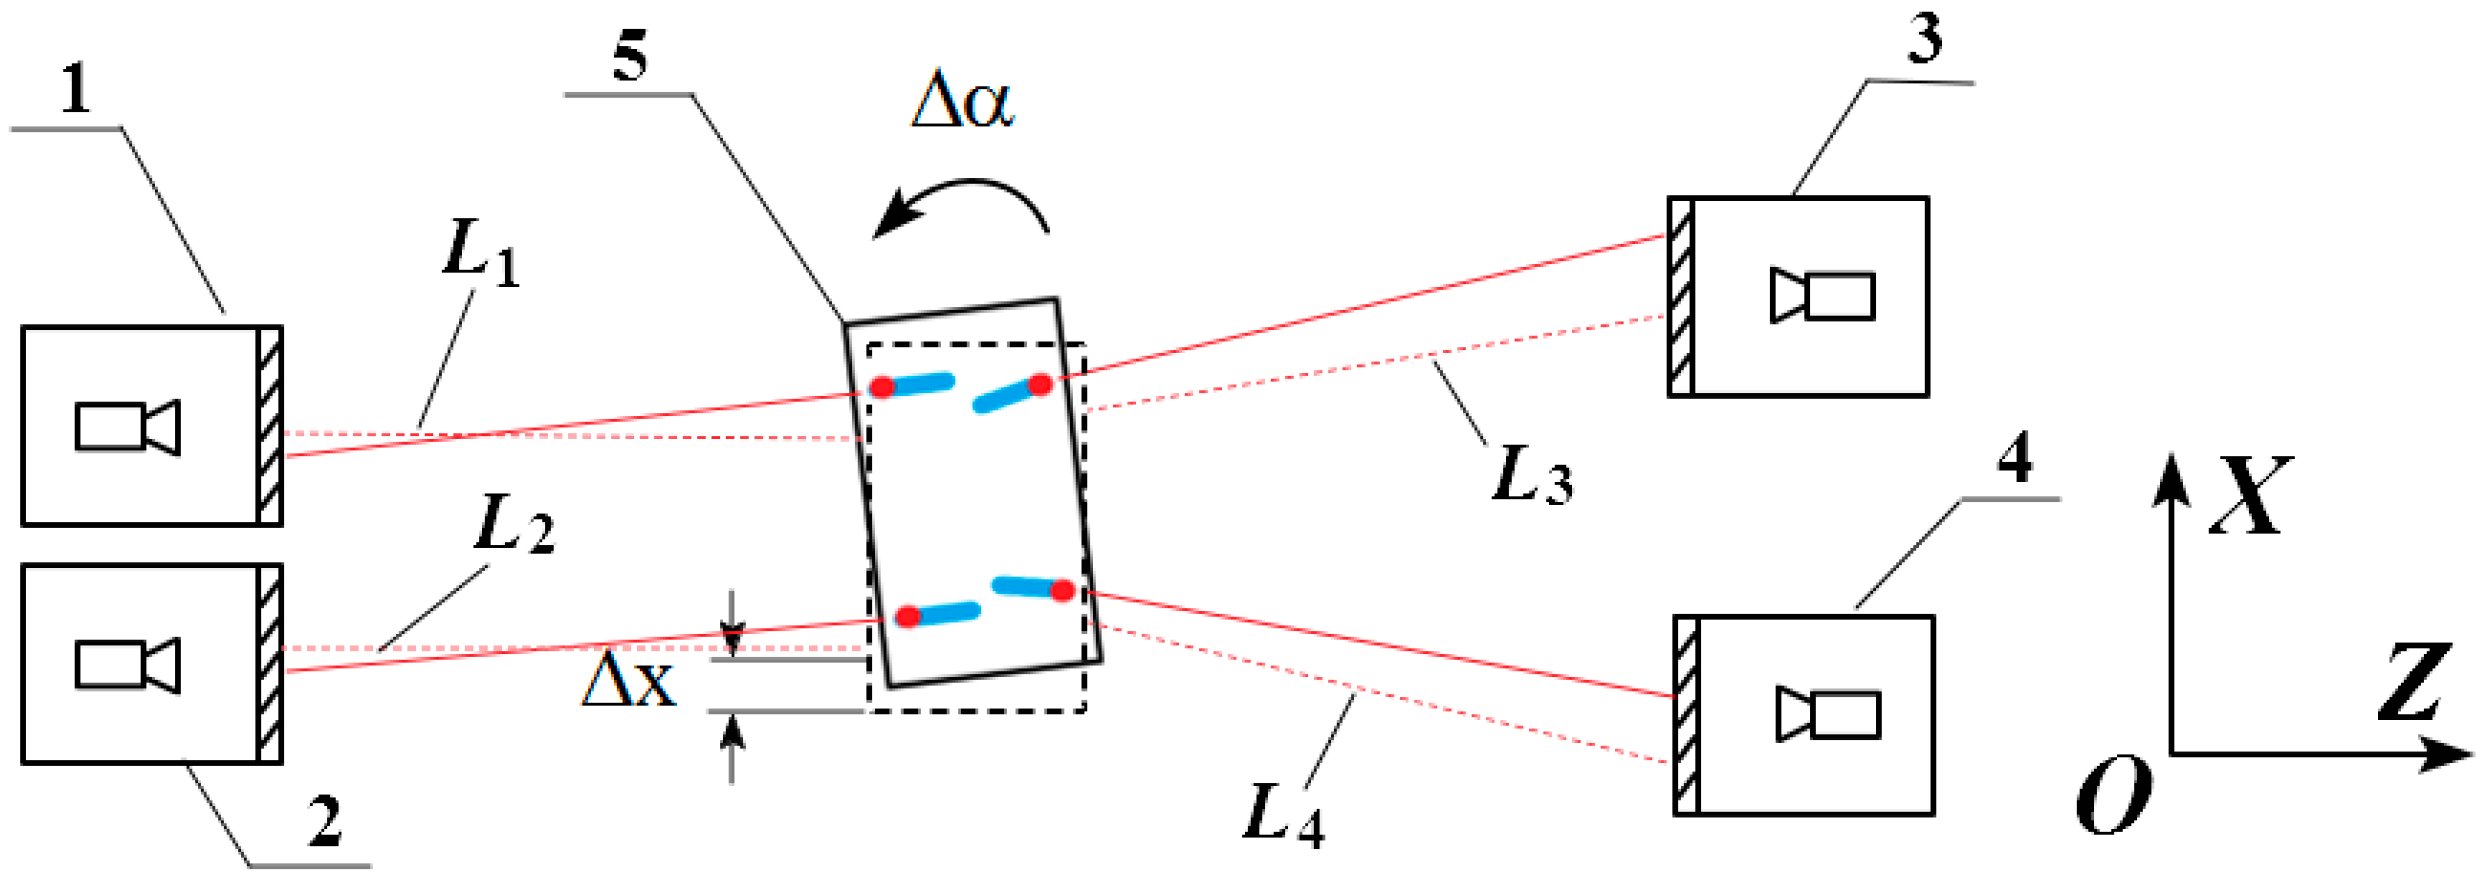
In order to reduce this error, a data compensation method is proposed here. The data compensation method uses two backward lasers in the laser transmitter module and two fixed distant reference monitoring image acquisition modules with higher stability to monitor the feasibility of the laser transmitter, as shown in Figure 4, where Ls represents the distance between the laser transmitter module and the image acquisition modules, represents the horizontal rotation angle of the laser transmitter module, and represents the displacement along the x-axis of the laser transmitter module.
Given that Ls were dozens of meters, small displacement and rotation angle will have no effect on these Ls; that is, the lengths of Ls were invariable before and after the position change of the laser transmitter module. With the two reference monitoring image acquisition modules, two laser spot position errors and can be obtained. The image acquisition module detecting displacement with error is . The equations of two variables and were obtained, as shown in Equation (7):
According to Equation (10), and can be determined as shown in Equation (8):
Then, the detected displacement can be compensated in Equation (9):
Therefore, the detected displacement error caused by sudden vibration is compensated successfully.
3. System Composition
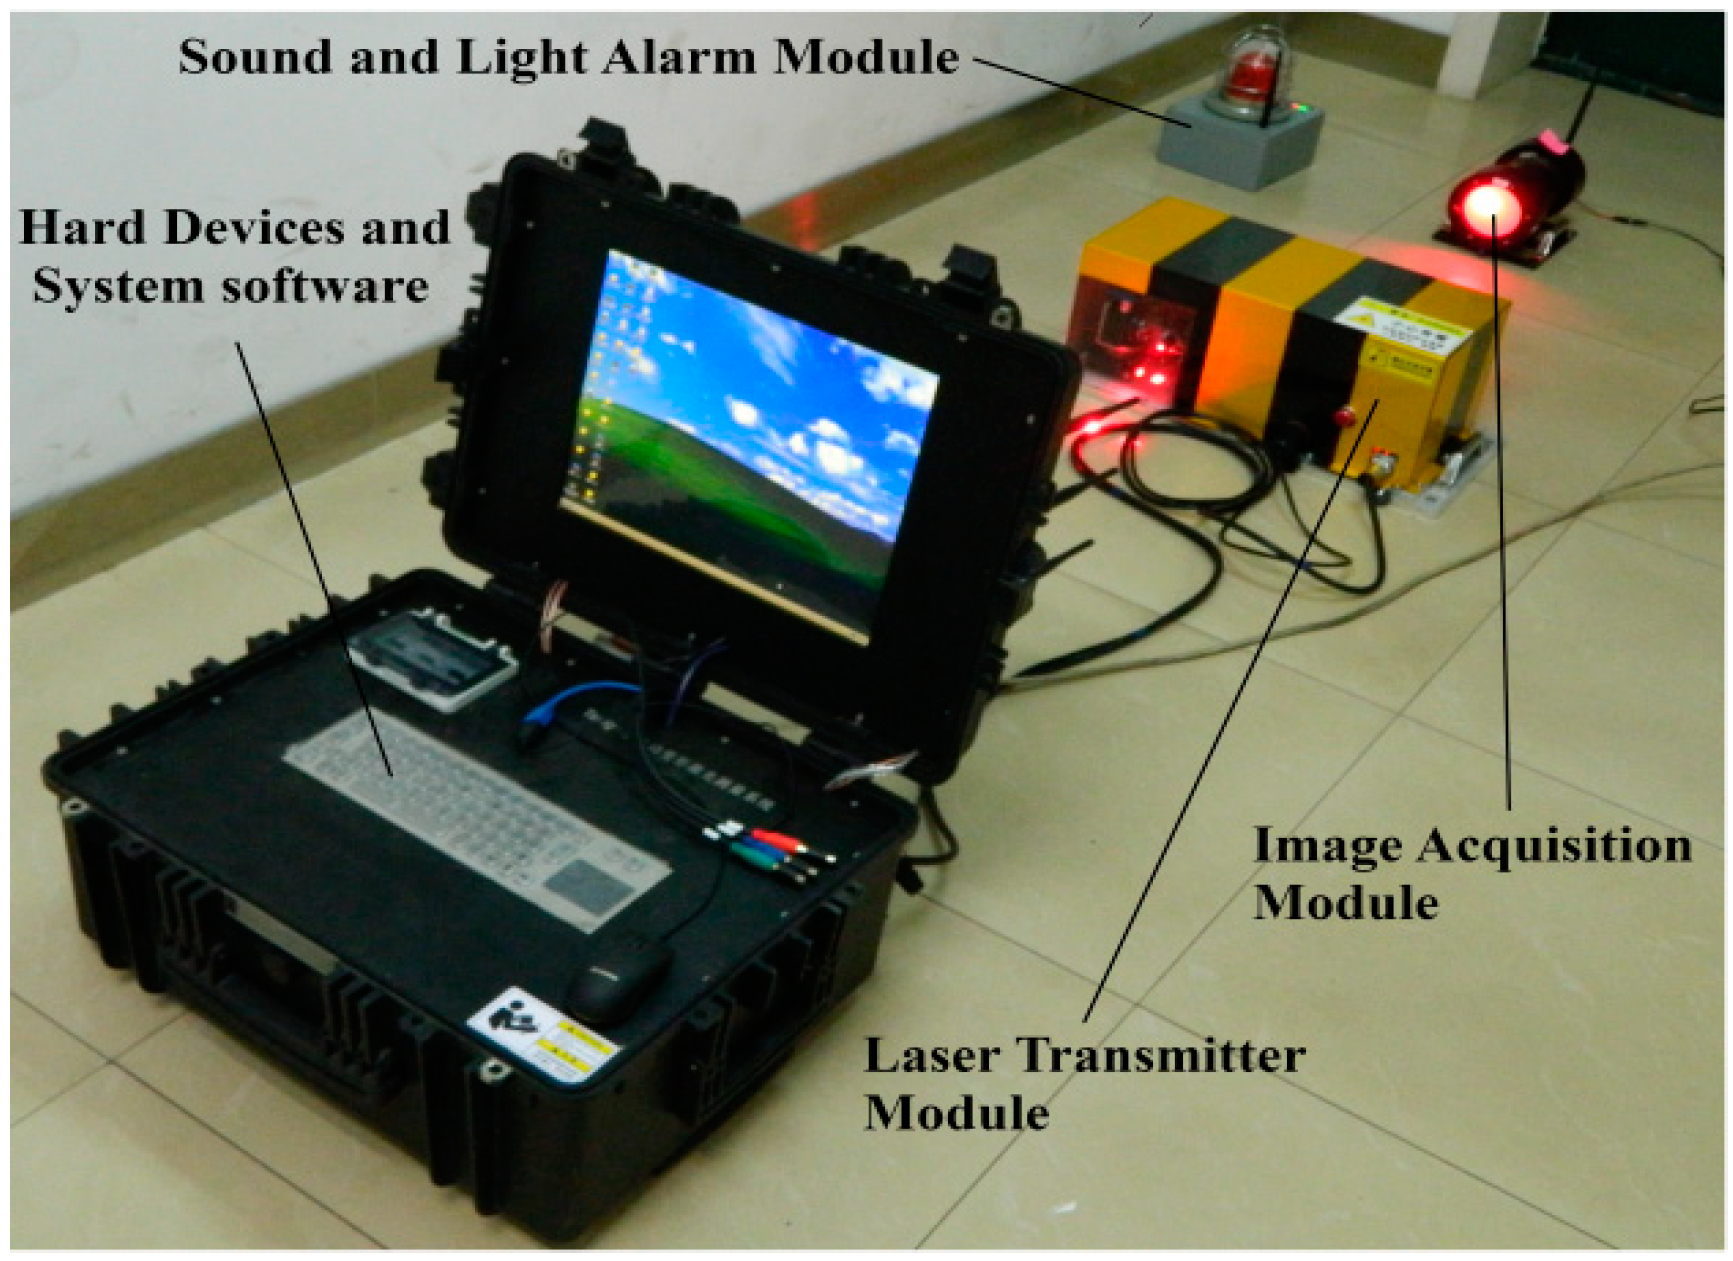
Figure 5 shows the main composition of the real-time tunnel deformation monitoring system, and Figure 6 shows the details. The working principle is briefly described as follows.
Install the system in the tunnel and turn it on. After calibration, adjust the direction of laser to the image acquisition module. The command to measure tunnel deformation is first generated at the industrial computer and sent to the wireless adaptor by a USB port. The communication between the adapter and the image acquisition module is wireless. The wireless adaptor is shown in Figure 7. The image acquisition module receives the command and begins to capture laser spot images and sends them to the industrial computer through the corresponding wireless adaptor in real time. The software installed in the industrial computer receives the images and processes them, obtaining the tunnel accumulative deformation and instantaneous deformation velocity. If the deformation values exceed the safe threshold, another command is generated and sent to the sound and light alarm module and the command center through a wireless adaptor, giving an early warning to workers and managers.
3.1. Laser Transmitter Module
All parts of this module, except the reference monitoring image acquisition module, are rigidly connected, thereby preventing the deformation of the module. The organic glass window and the dirt shroud form a sealed space, which can effectively prevent the interference of tunnel dust to the module and guarantee the permeability of the laser beam. The electronically controlled two-dimensional swivel table can adjust the horizontal and vertical angles of the laser beam, making the laser beam to point to the intersecting surface near the measured points. The reference monitoring image acquisition module is behind and distant from the other parts of the laser transmitter module, and it is mounted on a more stable fixed point away from the construction site, monitoring the feasibility of the forward laser beam.
3.2. Image Acquisition Module
A band-pass filter film [30] matching with the laser frequency is coated on the exterior surface of the filter imaging screen [31]; this allows the laser beam to go through the screen. A thin layer of diffuse reflection coating is present on the interior surface of the filter imaging screen [32]. On this layer, the laser beam forms a laser spot with Lambertian reflection. The HD industrial camera constantly takes photos of the laser spot, extracting the position information of the laser spot in the image coordinate system with machine vision. The band-pass filter film and darkroom [33] helps to reduce the stray light interference.
3.3. Sound and Light Alarm Module
When the tunnel accumulative deformation and instantaneous deformation velocity exceeds the set threshold, the module is turned on and provides an early warning to the command center through a sound and light alarm; this gives a timely and effective early warning against tunnel collapse accidents, thereby reducing casualties and property losses.
3.4. Hard Devices and System Software
The hard devices are used to realize the communication between each module and install the system software. The main functions of the software for real-time tunnel deformation monitoring system include measurement, control, communication, and data storage. Considering the multi-system operation, cross platform, and compatibility of the system software requirements, LabVIEW [34] 2010 by NI (Austin, TX, USA) is adopted as the software development platform. The communication between the laser transmitter module, image acquisition module, sound and light alarm module, and hard devices and system software is wireless. The flow chart of the system software is shown as Figure 8.
4. Test Results and Analysis
4.1. Principle Verification Test
To verify the principle of the proposed tunnel deformation monitoring technology, a tunnel deformation process was designed and simulated as shown in Figure 9.
The image acquisition module was placed on a high-precision micro motion platform, which is a one-dimensional motion platform with a 1 µm accuracy to enable the image acquisition module to move with the moving platform and simulate the deformation process of the tunnel. The laser transmitter module was arranged on the other side, with the laser pointing to the filter imaging screen. If the change in the coordinates of the laser spot center [35] in the image coordinate system is proportional to the tunnel deformation, then the correctness of the tunnel deformation monitoring principle is proved.
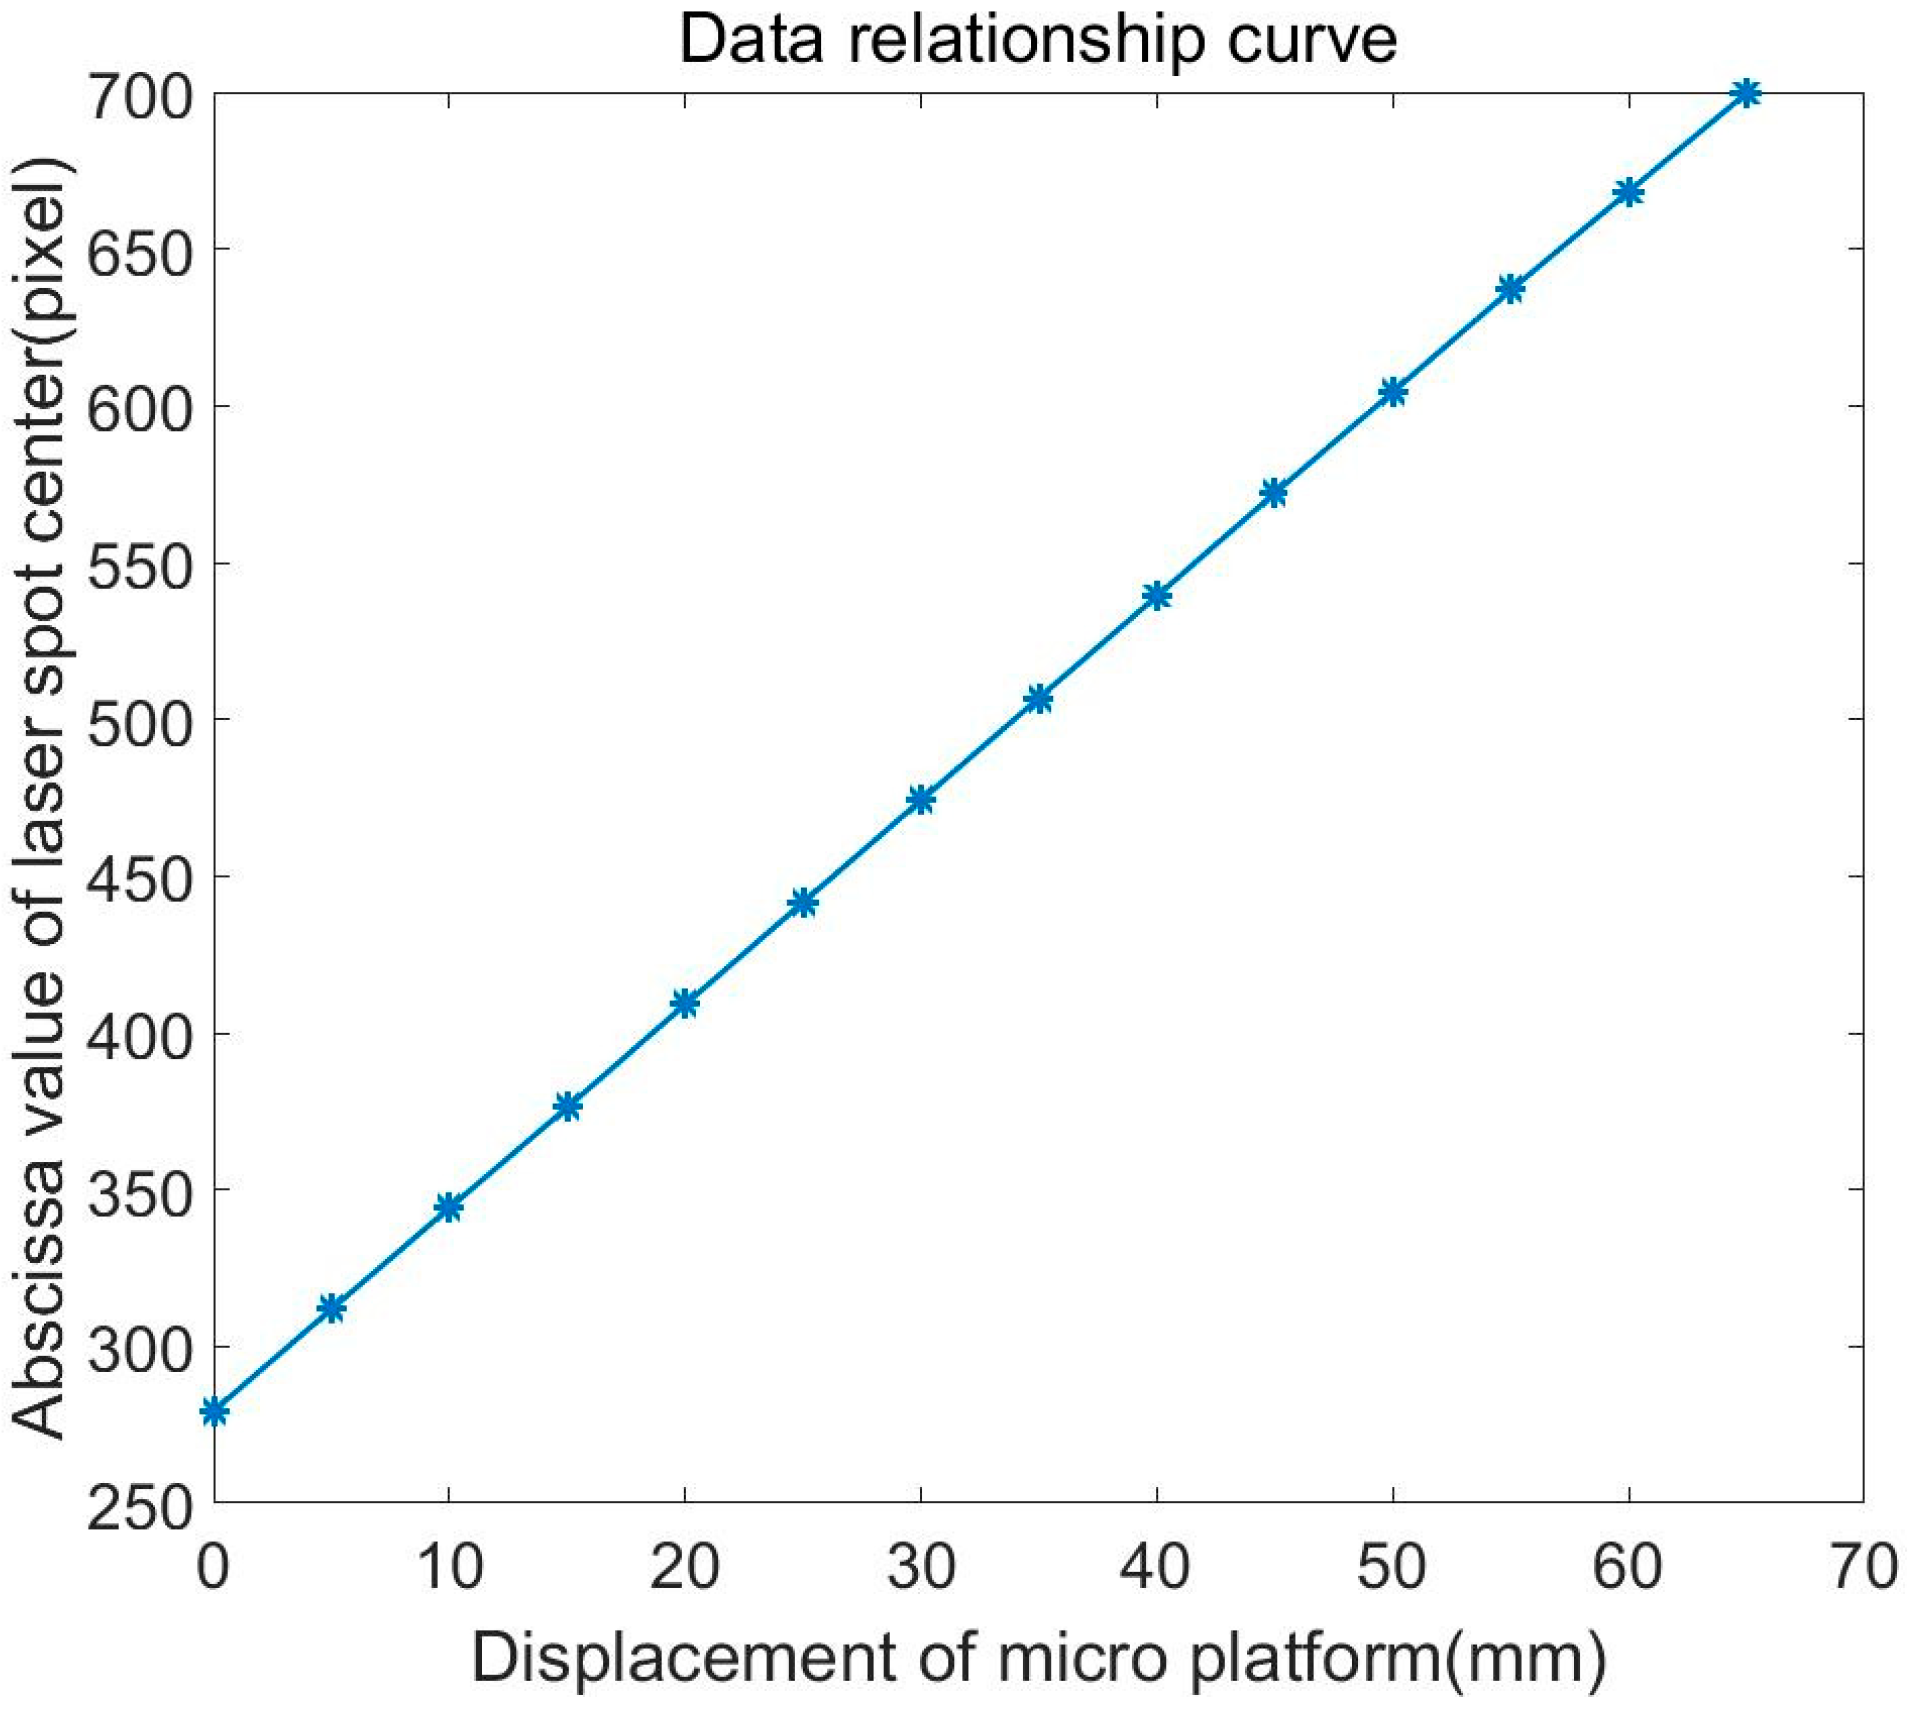
In the experiment, the micro motion platform was moved at an interval of 5 mm, and the displacement of the micro motion platform and the corresponding abscissa values of the laser spot center in the image coordinate system in pixel units were recorded.
The data relation curve is shown in Figure 10. In this curve, the x-axis is the displacement of the micro motion platform, and the y-axis is the measured displacement, namely the abscissa value of the laser spot center.
According to the data relation curve, the displacement of the micro motion platform was linearly correlated to the measured displacement, and the linear correlation coefficient was close to 1, which demonstrates the correctness of the principle.
4.2. Image Acquisition Module Calibration Experiment
The position information obtained by the image acquisition module is the plane two-dimensional data in the image coordinate system in pixels. Thus, the image coordinate system needs to be calibrated to restore the true deformation value of the measured point [36].
4.2.1. Horizontal Calibration Experiment
Given the different positions of the measured points in the tunnel, the image acquisition module will often roll along the z-axis after it is installed. As a result, an angle will form between the x′-axis of the image coordinate system and the x-axis of the world coordinate system. Given this angle, the change in the position information of the laser spot center obtained by the image acquisition module cannot directly represent the settlement and the diameter convergence of the measured point. Therefore, the horizontality of the image coordinate system needs to be calibrated.
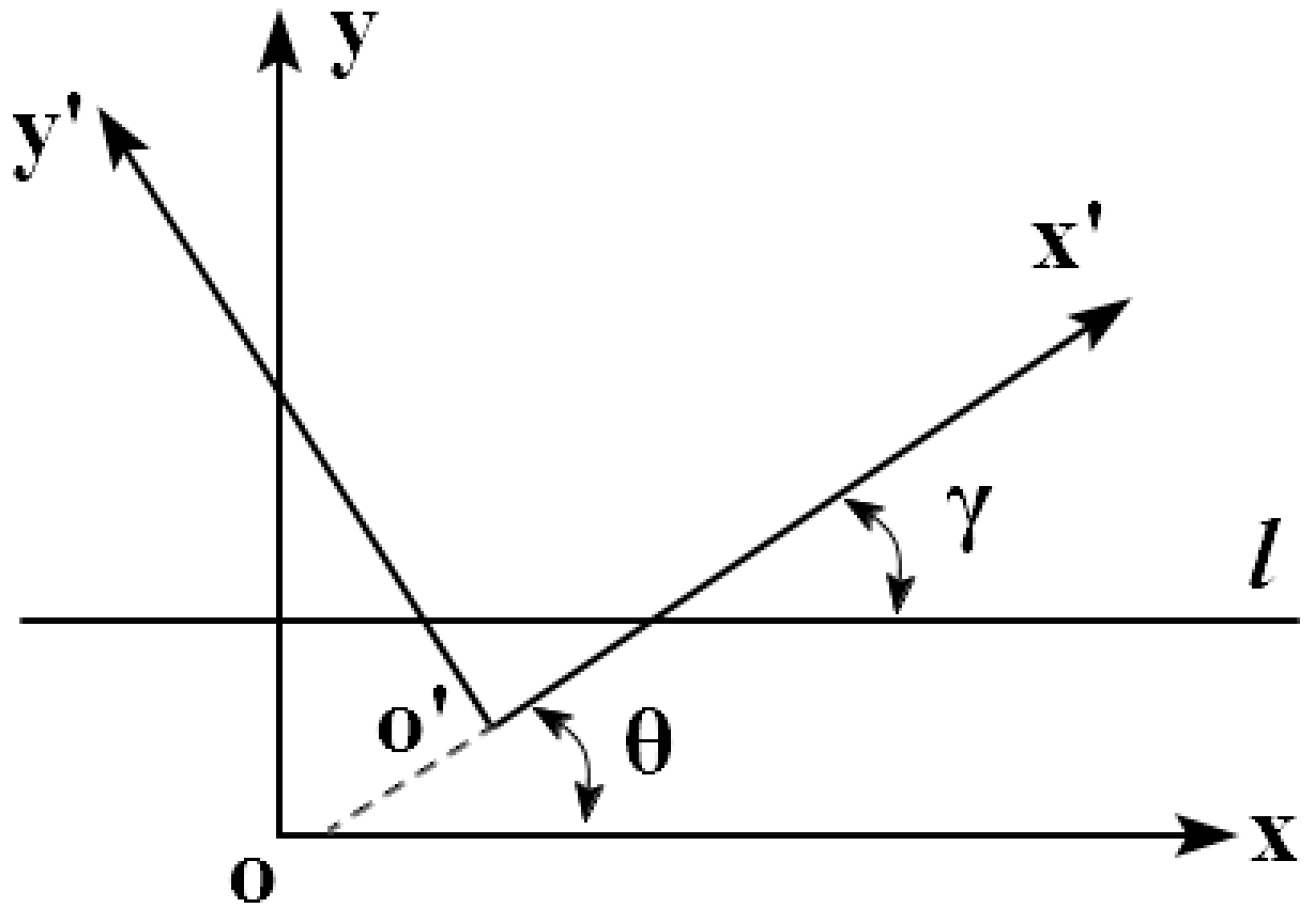
A simplified model for the relationship between the world coordinate system and the image coordinate system is shown in Figure 11 [37]. Here, o-xy represents the world coordinate system, o′-x′y′ represents the image coordinate system, and θ represents the rotation angle. The line l is a horizontal line, which is parallel to the ox axis and comes from a laser cast instrument. The laser cast instrument produced a horizontal laser line with a ±10″ accuracy. Supposing that the slope of the line l in the image coordinate system is k, the relationship between θ and k is as shown in Equation (10):
After the rotation angle θ was obtained, the horizontal calibration of the image coordinate system could be completed by rotating the image coordinate system by an angle θ around point o′, as the rotation center in the reverse direction. The horizontal calibration process is shown in Figure 12.
Before the horizontal calibration, when the image acquisition module horizontally moved along the micro motion platform, as shown in Figure 9, both the x-axis and y-axis values of the laser spot center in the image coordinate system changed with the movement. After the horizontal calibration was completed, only the x-axis value changed, thereby indicating that the horizontal calibration of the image coordinate system was successful. The micro motion platform moved at an interval of 5 mm. The experimental data curves are shown in Figure 13.
According to Figure 13, the displacement of the micro motion platform was from 0 mm to 70 mm, and the change in the y-axis value after calibration was as follows:
ΔY = 318.52 − 317.01 = 1.51 (pixel).
Therefore, within the permitted error, the y-axis values were basically unchanged, and the horizontal calibration of the image coordinate system was successful.
4.2.2. Conversion Coefficient Calibration Experiment
The unit of spot center coordinates in the image coordinate system is pixel, which cannot represent the true displacement directly [38]. A sketch map of the conversion coefficient calibration experiment is shown in Figure 16. The laser was placed on the micro motion platform and pointed to the fixed image acquisition module, thereby allowing it to move with the micro motion platform.
To restore the true displacement of the micro motion platform, the horizontal coordinate conversion coefficient α and the vertical coordinate conversion coefficient β needed to be determined [39]. The calculation formulas are shown in Equation (11):
In Equation (11), (ΔX, ΔY) represents the displacement of the laser spot in the image coordinate system in pixels, and (Δx, Δy) represents the real displacement in the world coordinate system. The x-axis conversion coefficient calibration experimental data are shown in Table 1.
The x-axis conversion coefficient can be obtained with Equation (11), and the arithmetic mean value formula is shown as Equation (12):
The calibration process of the y-axis conversion coefficient β was the same as α; that is, β = 0.1454. The relationship between the positions of the filter imaging screen and the HD industrial camera is invariant. Once the conversion coefficients α and β are determined, they are invariant and only need to be calibrated once.
4.3. Data Processing Algorithm Comparison Test
Because of changes in the refractive index of air and other factors in a long distance of 30 m, the laser beam will slightly deflect during the propagation, and the position of the laser spot on the filter imaging screen will vibrate. Given the isotropy of laser spot vibration, this experiment only addressed the x-axis coordinates of the spot, and the unit is pixels.
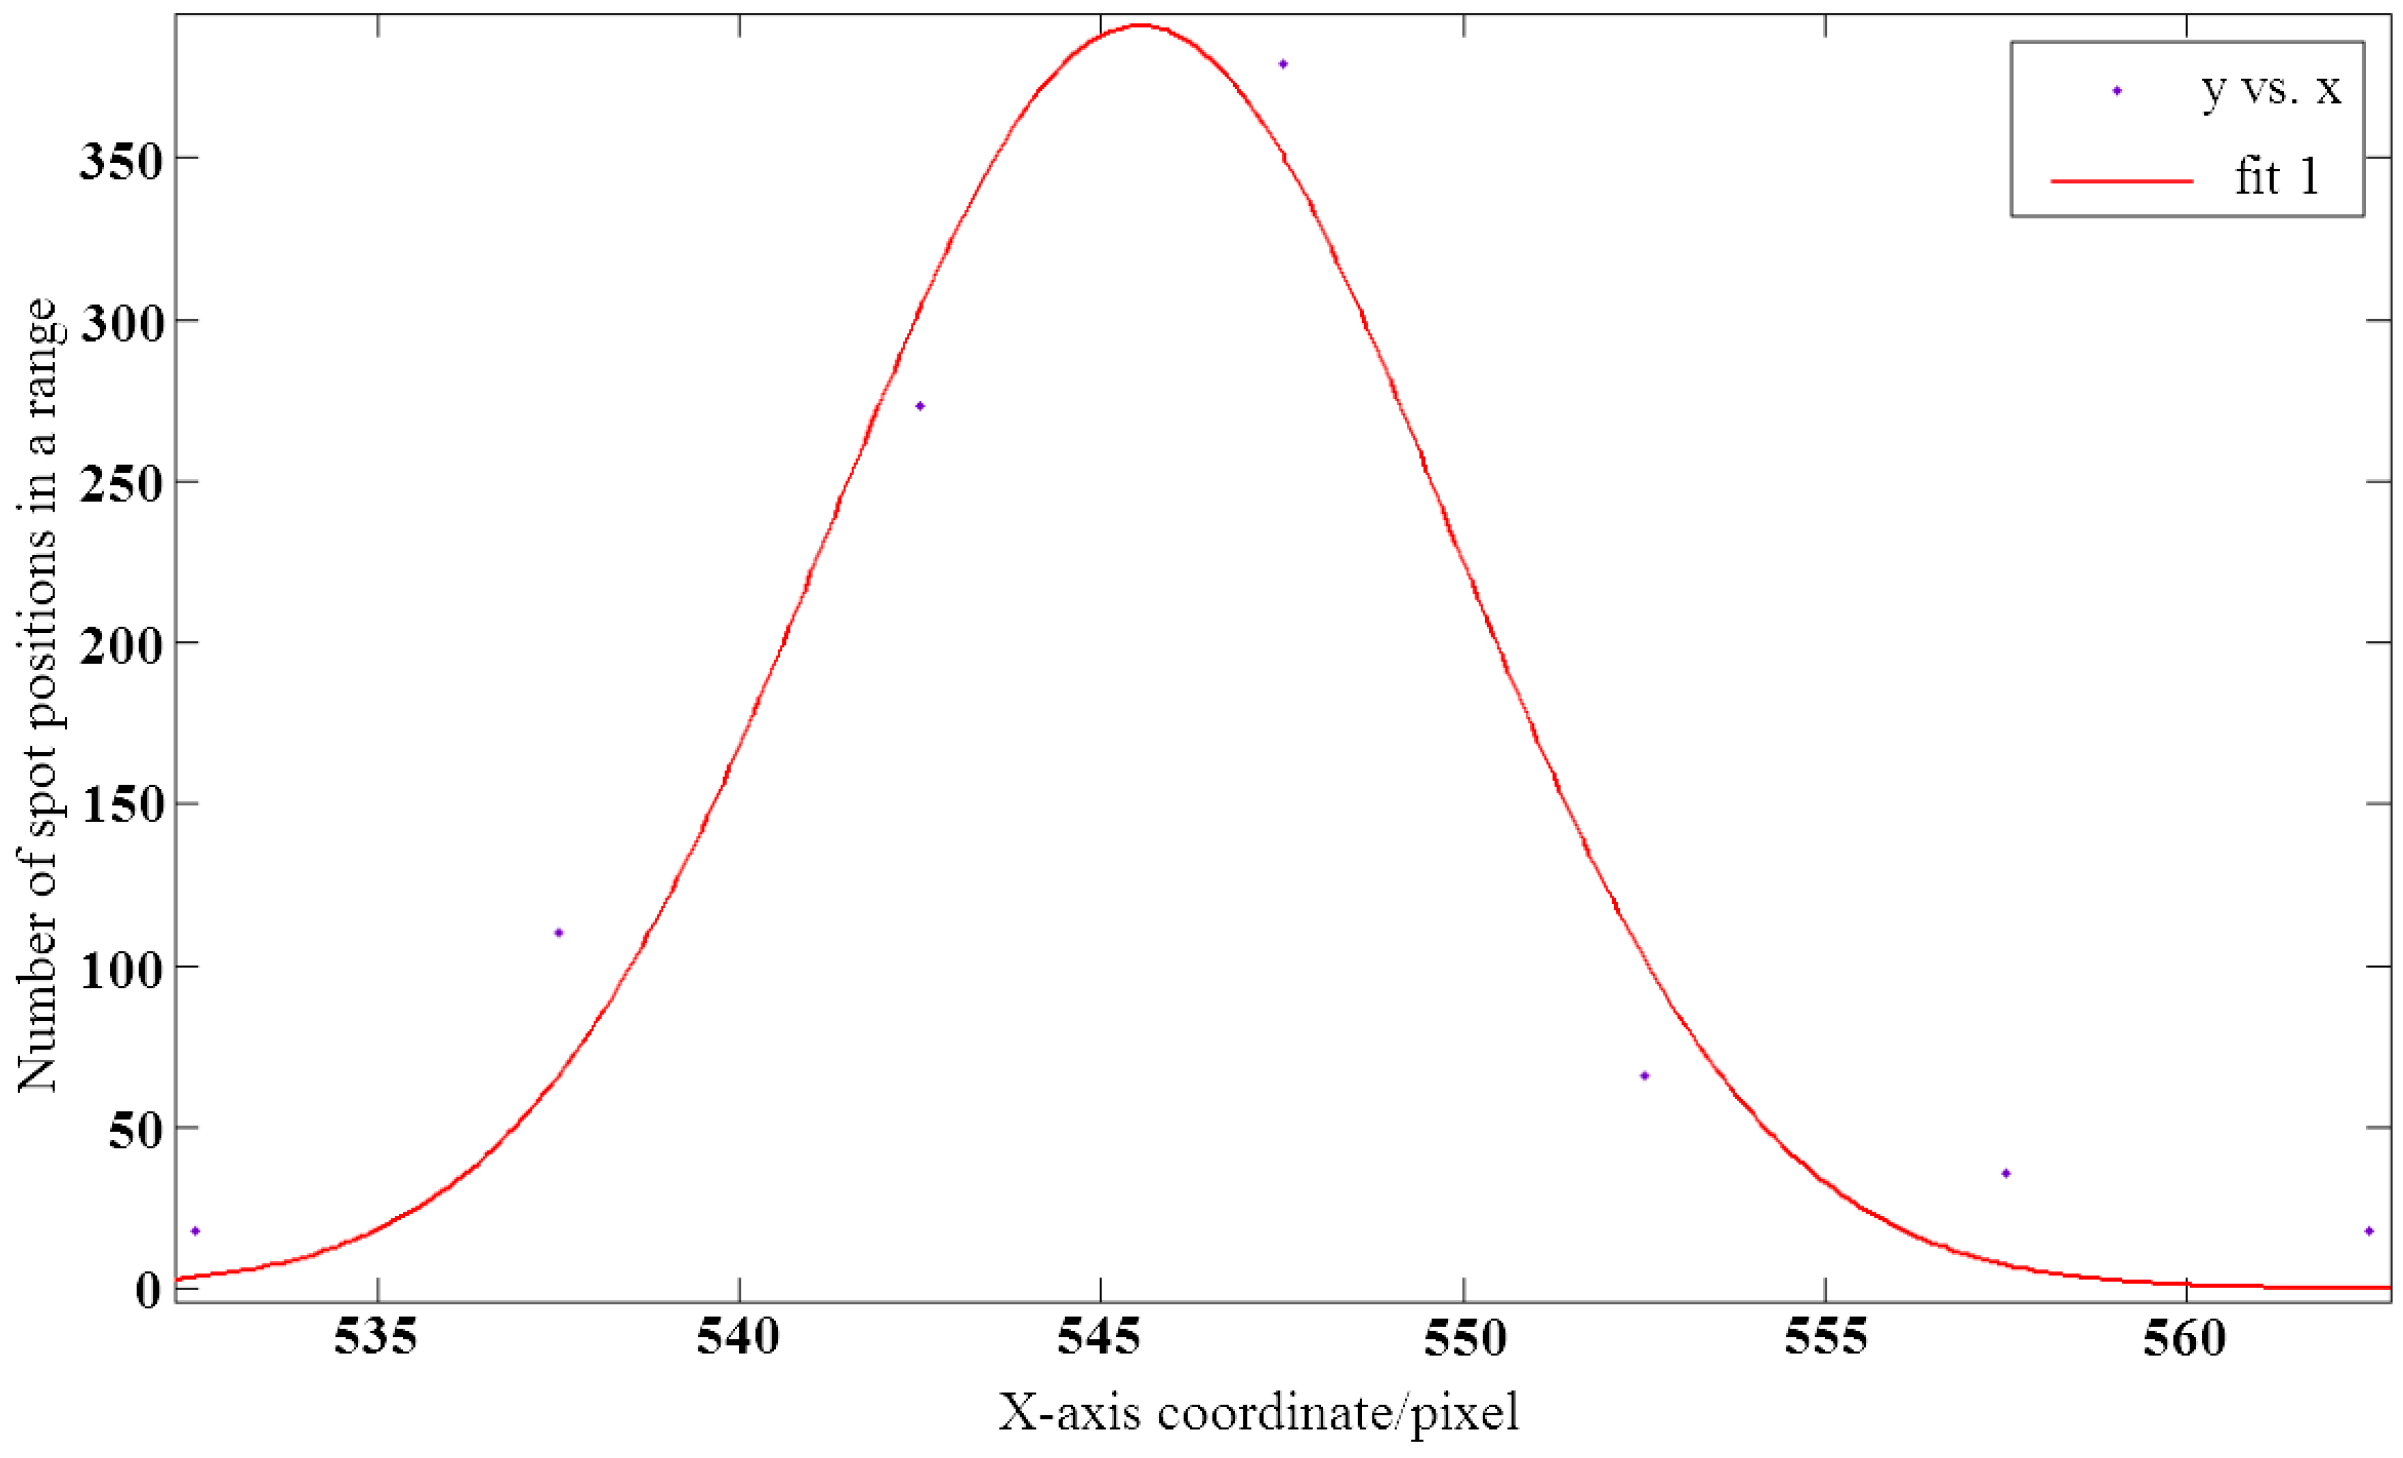
As shown in Figure 17, the laser spot position information of 1000 spot images was processed, wherein the abscissa axis was the acquisition time. As can be seen from the diagram, the vibration range of laser spot was big; therefore, when the laser propagation distance is long, the laser spot center data at a single time point could not be used to represent the monitoring reference. The position probability distribution of the 1000 spot images is shown in Figure 18. Although the laser spot was in vibration, the position probability distribution was approximately in accordance with Gaussian distribution; therefore, stable data was found to represent the monitoring reference by processing a set of data over a period of time.
Given the characteristics of the dataset, the following methods were used to process the data: (1) calculation of the extremum after Gauss fitting, (2) calculation of the expectation from original data, (3) calculation of the expectation after low-pass filtering, and (4) acquisition of the maximum probability data from data probability distribution map. The results are shown in Table 2. As can be seen, the fourth method has the highest accuracy; therefore, this method was used to process the laser spot position information.
4.4. Wireless Antenna Attitude Test
According to the principle of electromagnetic wave emission, the antenna has a certain angle when transmitting and receiving electromagnetic waves, as shown in Figure 19, where the signal is strongest in the main lobe range. When the antenna is arranged, if the antenna attitude can be adjusted to the right position, the intensity of the received signal will be enhanced.
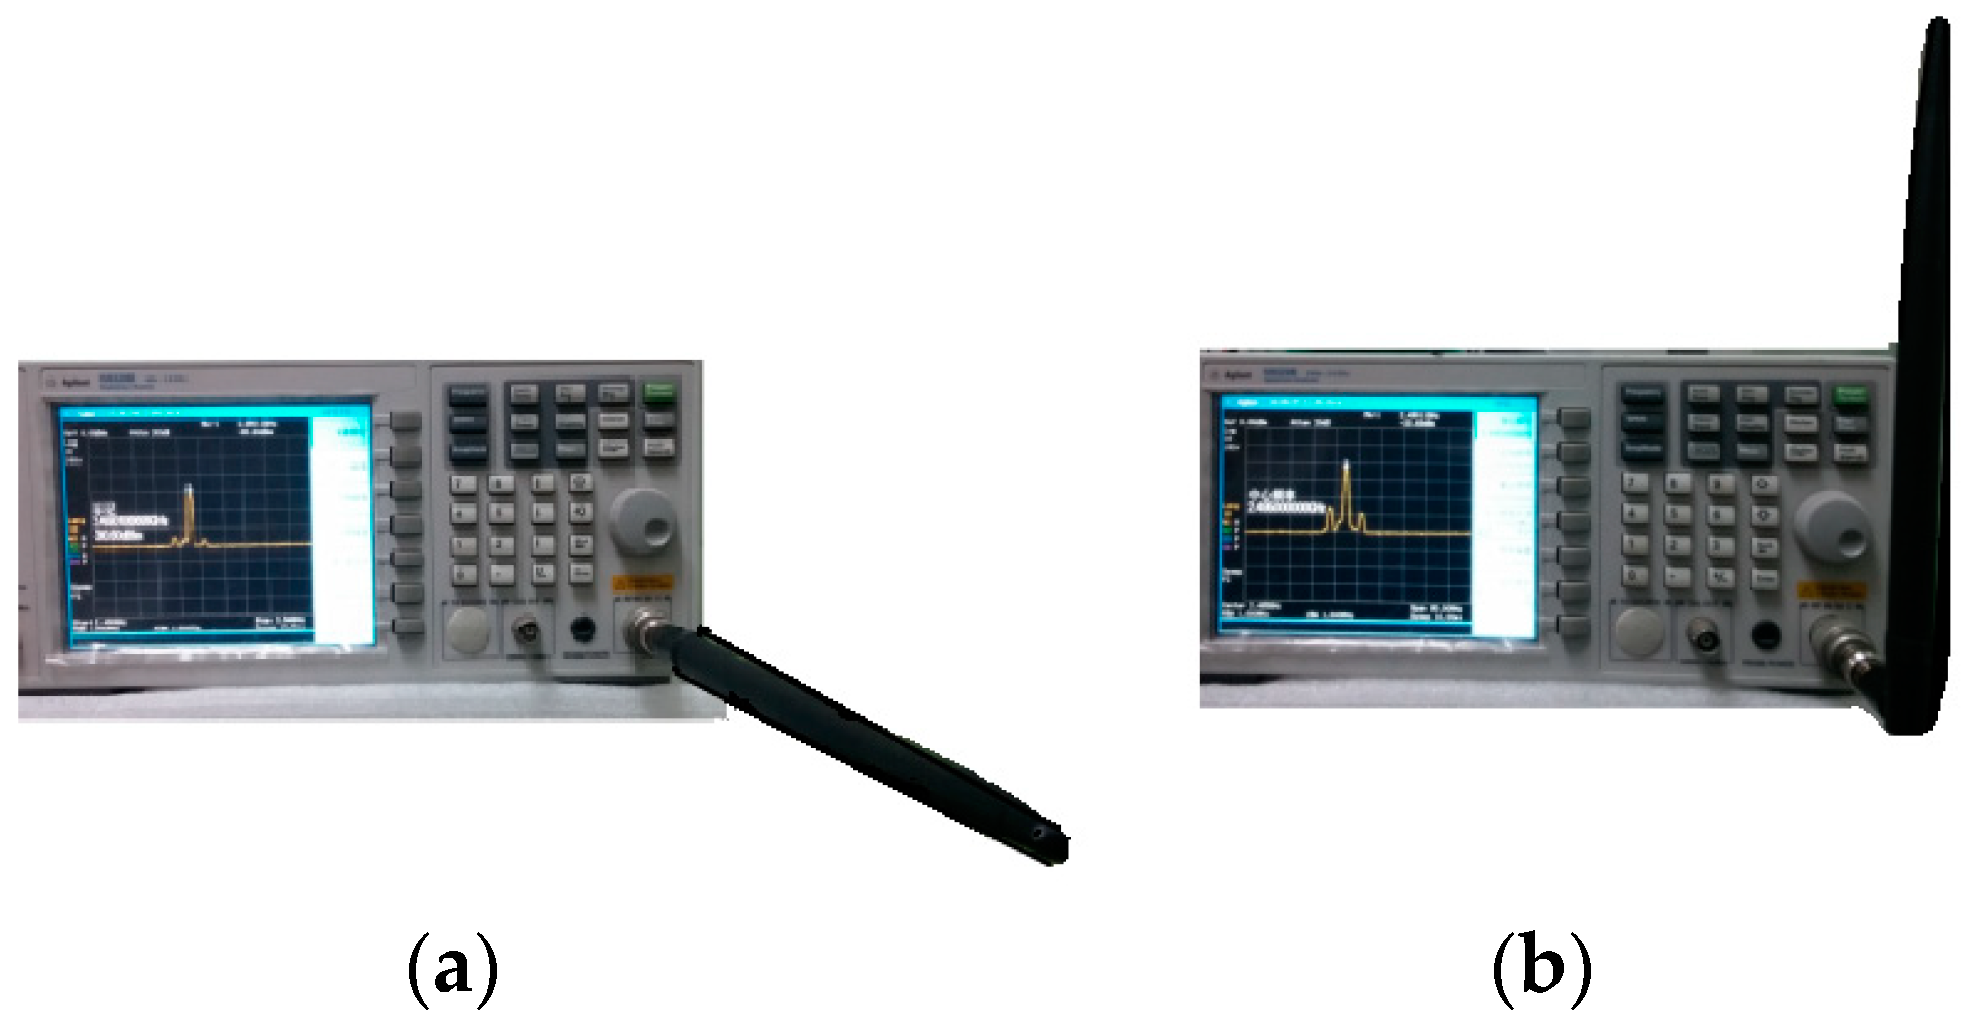
A spectrum analyzer was used as a wireless signal detection tool to analyze the size of the power received under different poses. Because the attitudes of the transmitting antenna and the receiving antenna were relative, the transmitting antenna was fixed horizontally during the experiment, and the attitude of the receiving antenna was changed.
As shown in Figure 20a, when the receiving antenna was parallel to the transmitting antenna, the maximum signal intensity was −23.63 db. As shown in Figure 20b, when the receiving antenna was vertical to the transmitting antenna, the signal strength was minimum, −35.68 db. Therefore, when using the instrument, the two antennas should be as parallel as possible to enhance the intensity of the received signal.
4.5. Temperature Change Test
The system needs to meet the requirement of real-time measurement without interruption for a long time; therefore, it is bound to be affected by the change of ambient temperature. However, the long distance laser reference propagation has a magnifying effect on the laser’s own angle change. Since the maximum temperature difference in the tunnel during day and night is only 4 °C, the linear thermal deformation of the laser system can be ignored, but the angle change will have a large error. As shown in Figure 21, for a temperature difference 10 °C during 14 h, the x-axis coordinate difference of the spot position caused by thermal deformation can reach 38 pixels on a 50 m propagation distance. For the 4 °C temperature difference in the tunnel, the thermal deformation will cause less x-axis coordinate difference.
To reduce the effect of thermal deformation on the precision of the system, the mechanical structure was designed to be symmetrical to minimize the angle torsion caused by thermal deformation.
4.6. System Accuracy Test Experiment
4.6.1. Detection Accuracy Test Experiment
After the above tests were performed, the real-time tunnel deformation monitoring system was ready to operate. A high-precision micro motion platform was used to simulate the tunnel deformation process, and it moved at an interval of 5 mm. The obtained detection displacement is shown in Table 3.
According to Table 3, the monitoring system had a high detection accuracy better than 0.12 mm.
4.6.2. Repeatability Accuracy Test Experiment
The micro motion platform performed a linear reciprocating motion at an interval of 10 mm. Experimental data are shown in Table 4.
According to Table 4, the monitoring system had good stability and repeatability, and the repeatability accuracy was better than 0.11 mm.
4.6.3. System Resolution
The micro motion platform moved slowly with the minimum displacement, that is, at an interval of 1 μm. In the system accuracy test experiment, when the micro motion platform moved 10 μm, the coordinates of the laser spot from the system software started to change, indicating that the system resolution was 10 μm.
4.7. Laser Transmitter Module Feasibility Test
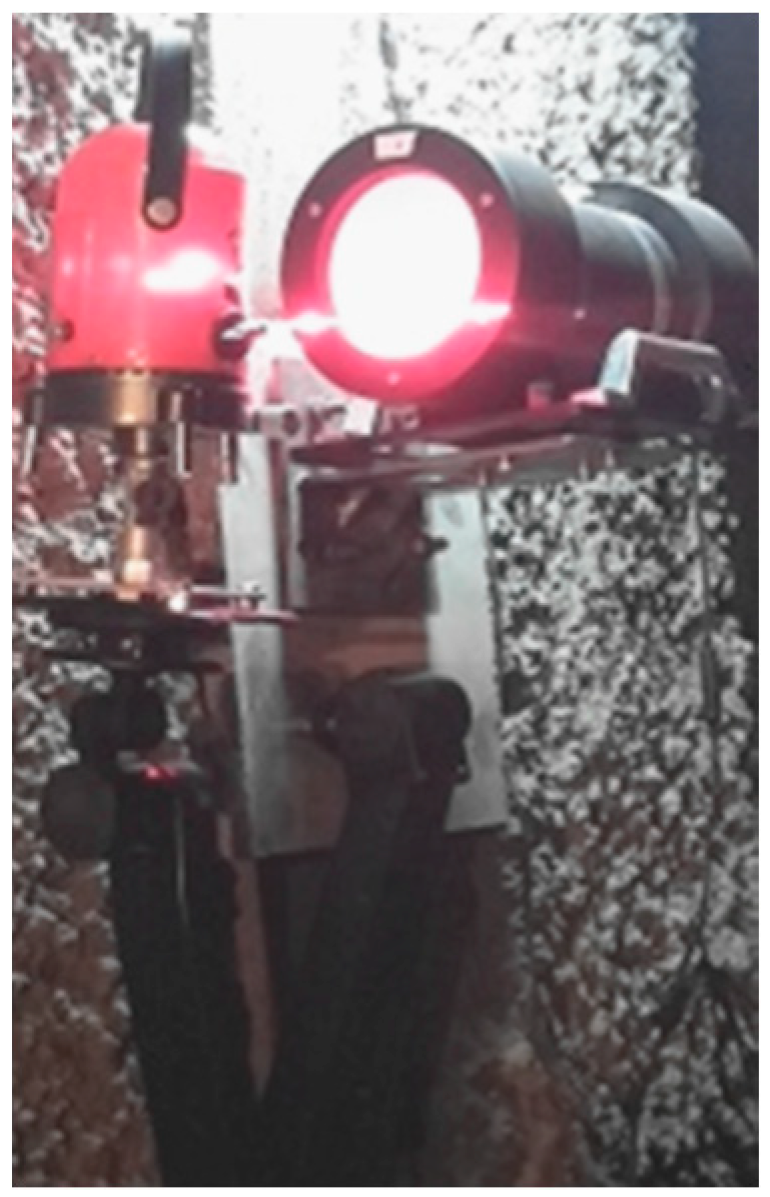
In order to simulate the dusty and dark tunneling environment, this test was conducted on a foggy night as shown in Figure 22.
The test sketch map is shown in Figure 23.
As shown in Figure 23, the laser transmitter module was located on a precision swivel table that was fixed on the micro motion platform. Two image acquisition modules and two reference monitoring image acquisition modules were placed on both sides of the laser transmitter module respectively, and Ls represents the distance between the laser transmitter module and the image acquisition modules, represents the horizontal rotation angle of the laser transmitter module, and represents the displacement along the x-axis of the laser transmitter module.
In this test, the two reference monitoring modules and the two image acquisition modules were fixed, and the laser beam reference was shifted 12 mm and rotated 36″. According to Equation 9, the detected displacement can be compensated. The test data are shown in Table 5.
According to Table 5, this compensation method can effectively reduce the error caused by small sudden vibrations of the laser transmitter module.
4.8. Field Test
To verify the stability and accuracy of the monitoring system, the system was taken to the Xingyuan Town Tunnel in Heilongjiang province for a field test.
As shown in Figure 24, the tunneling environment was adverse and filled with dust, darkness and sudden vibration during construction. Tunnel trolley, as shown in Figure 24a, ran between initial support and secondary lining; this may block the laser transmitting path, so that the laser transmitter module was fixed on the earth close to the side face; therefore, the proposed monitoring system had no conflict with construction as shown in Figure 24c.
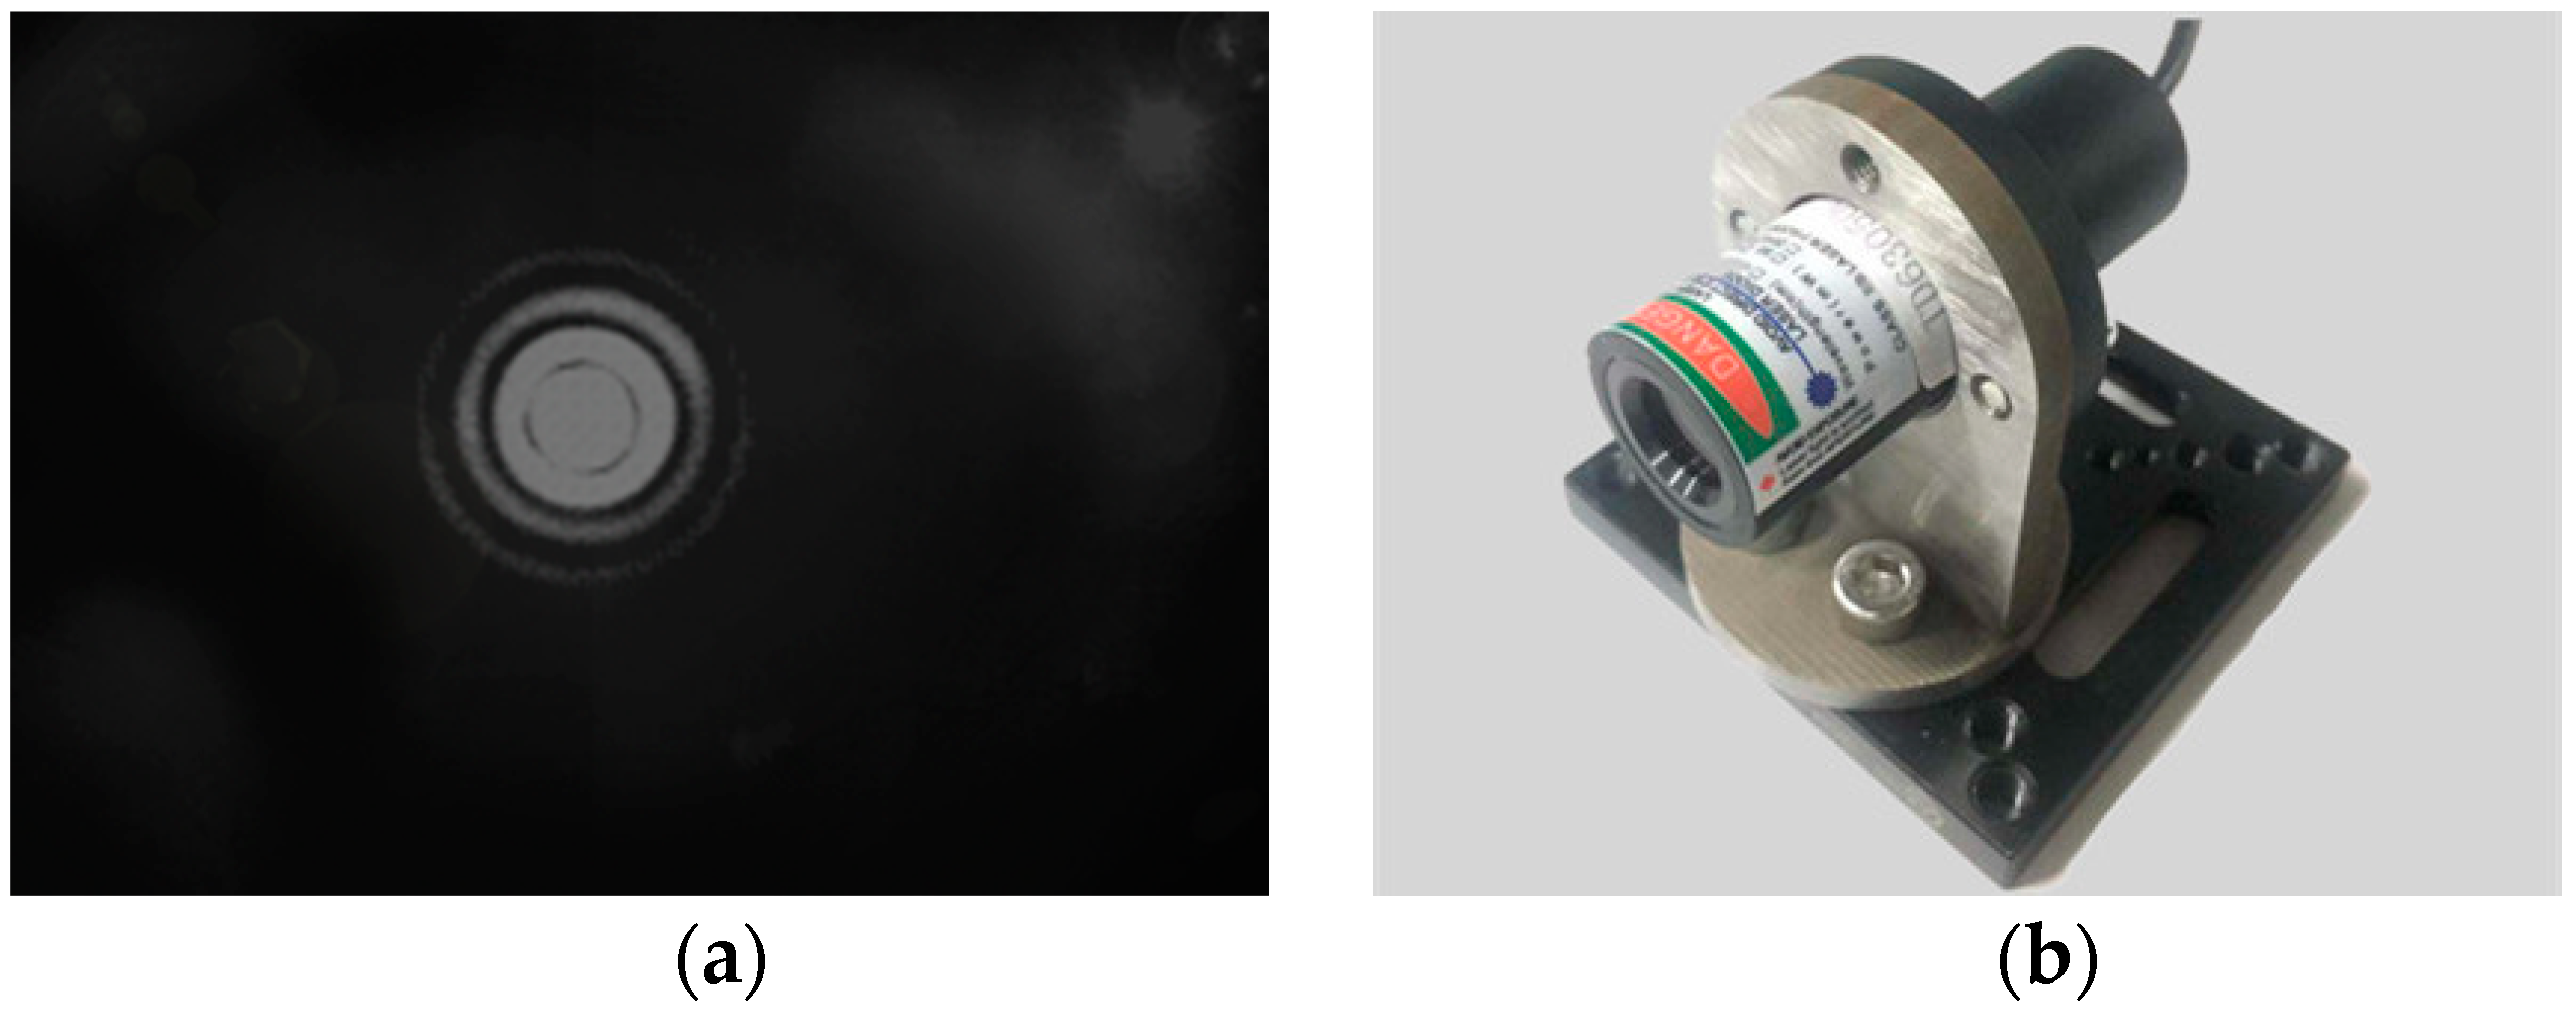
As shown in Figure 24b,d, the dust is heavy, this may decrease the laser spot energy received by the image acquisition module, so that the laser transmitter module used 500 mw high power lasers with an optical lens to achieve better long-distance transmission effect. In addition, the distance from the laser transmitter module to the measured points was varying from 30 m to 80 m, and the laser spot energy decreased with increasing distance, so that a laser energy transmission test with difference receiving distances was conducted in the dusty tunnel to detect the image quality acquired by image acquisition module. The test data are shown as Table 6.
According to Table 6, laser spot energy decreased with increasing receiving distance, but the laser spot could still be obtained by image acquisition module, and the gray value of the laser spot met measurement requirements; this indicates that the proposed system is not susceptible to dusty and dark environment. The laser spot image obtained in 70 m receiving distance is shown in Figure 25a, and the high power laser with optical lens is shown in Figure 25b.
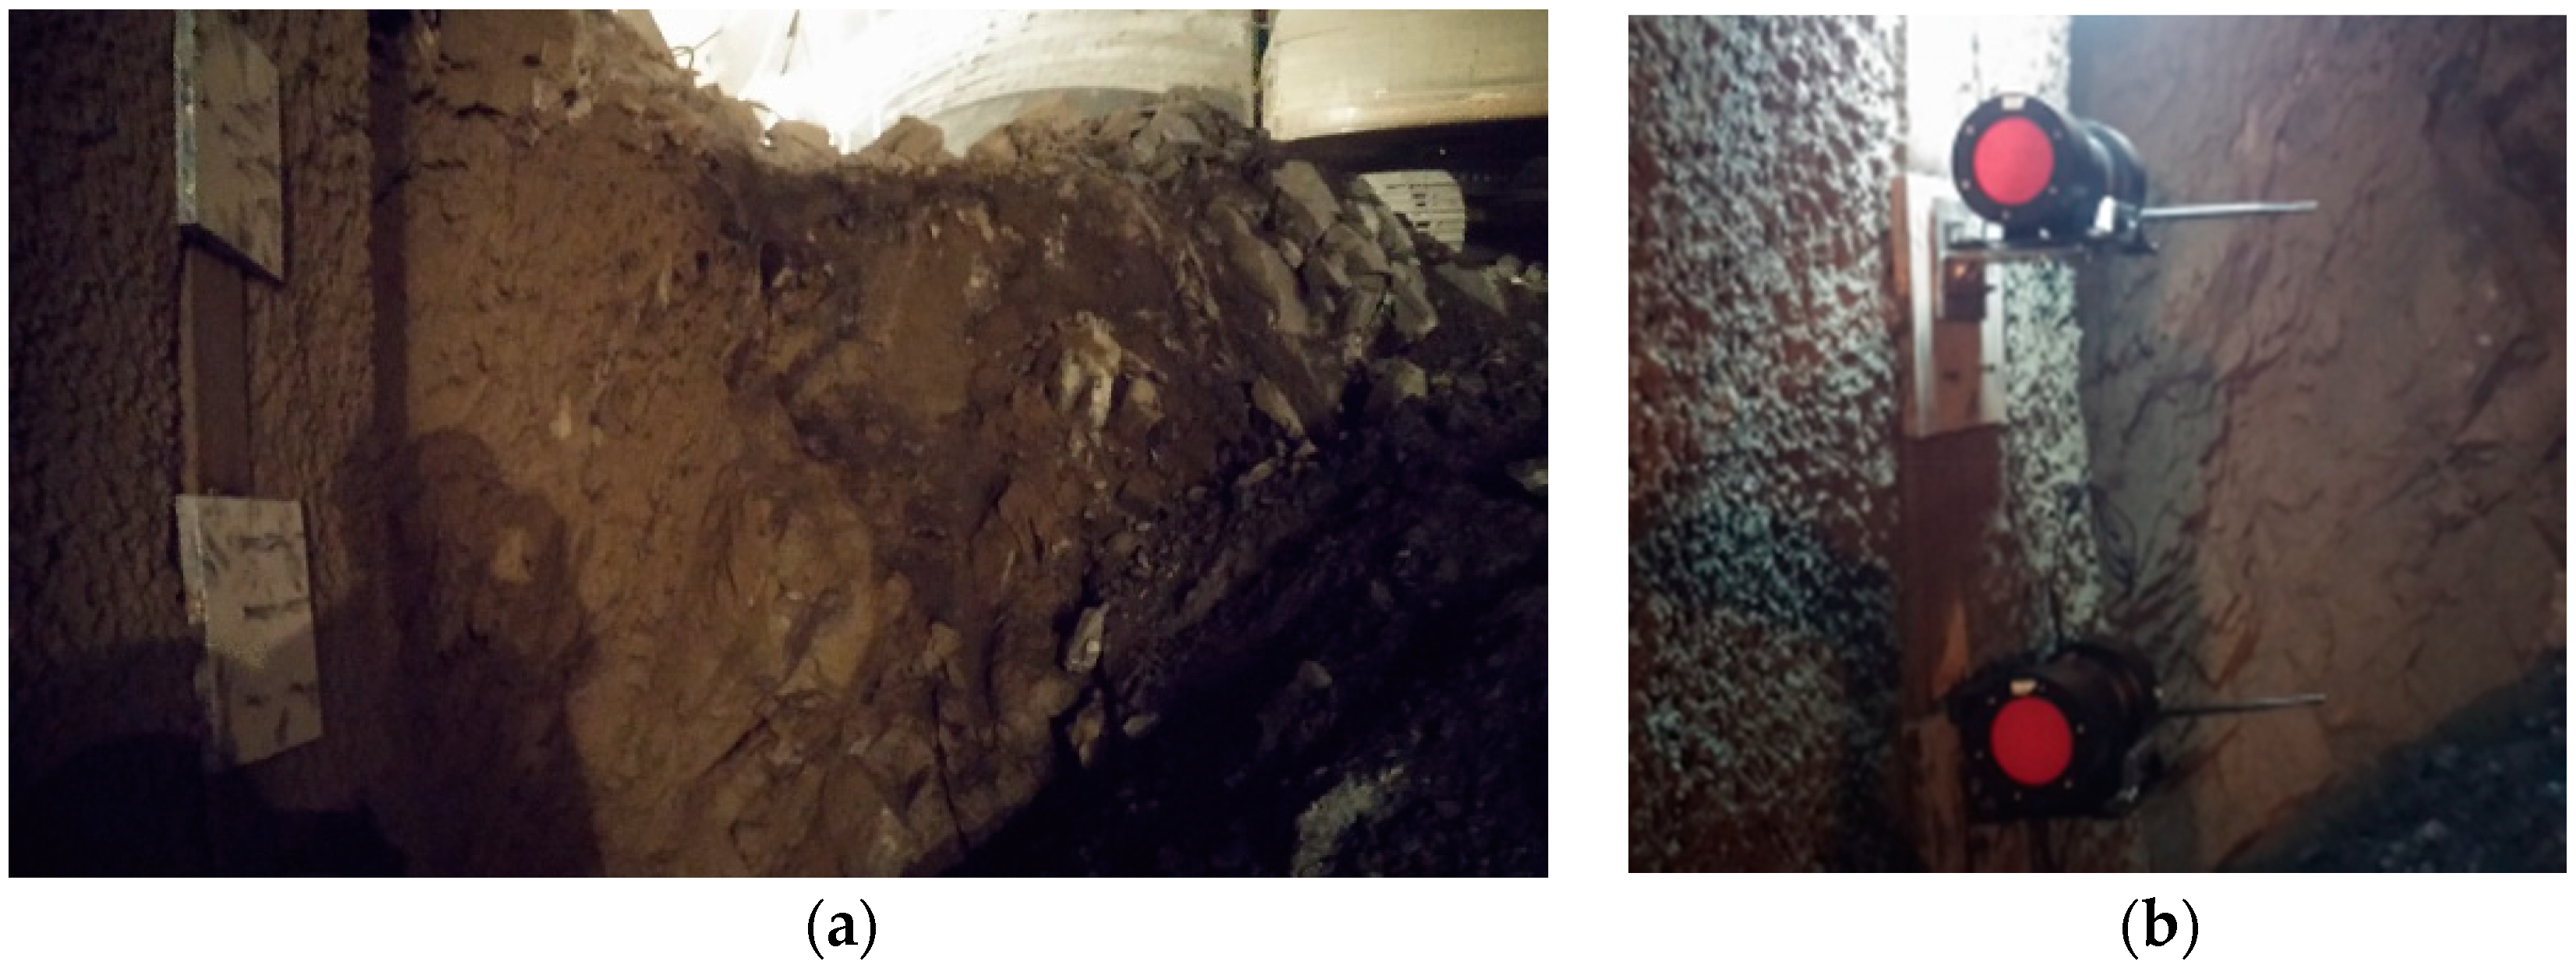
In order to verify the stability and accuracy of the monitoring system, a field test was conducted in the tunneling environment. The image acquisition module was fixed on the edge of initial support of the tunnel, as shown in Figure 26a.
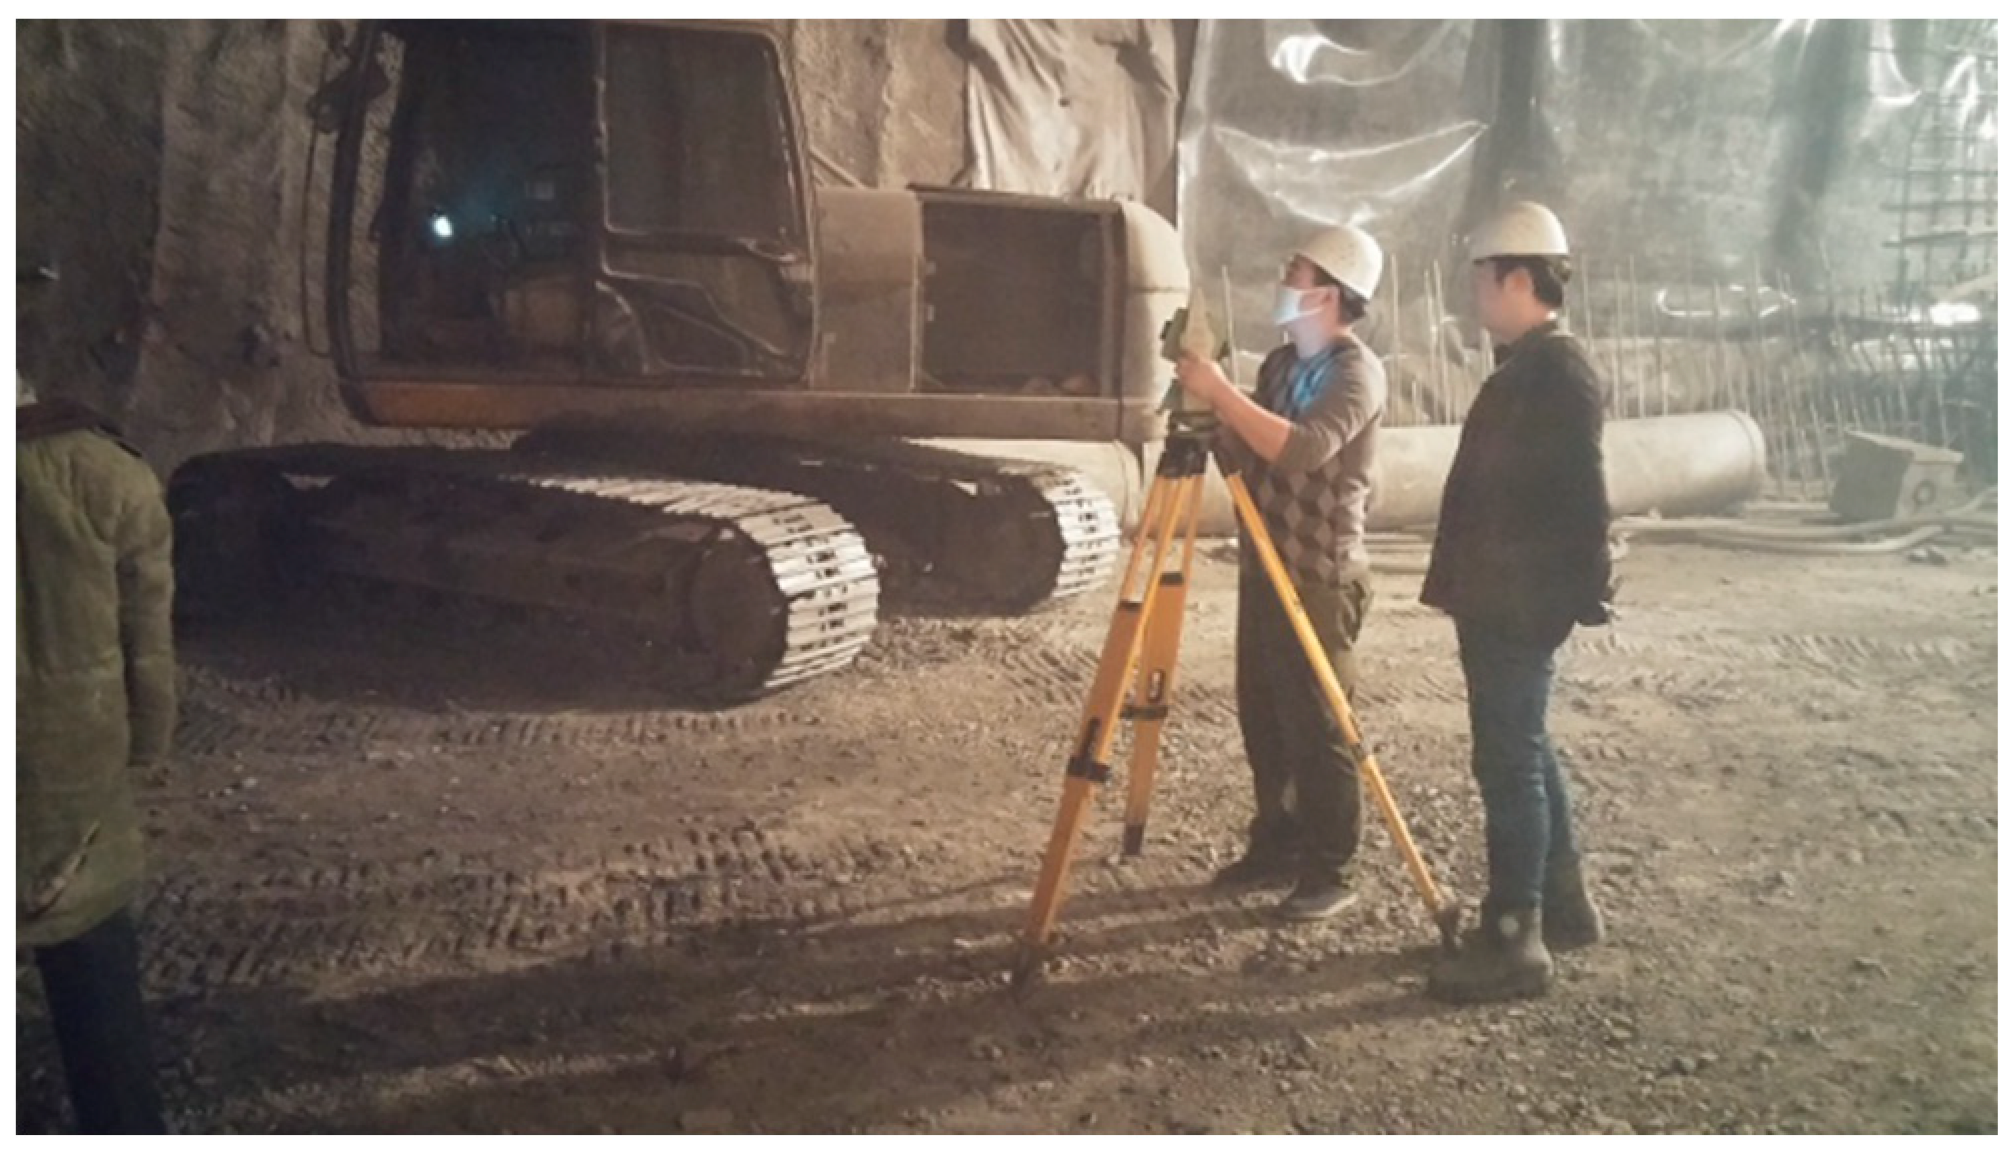
As shown in Figure 27, a total station was used to synchronously measure the deformation of the same measured point in the tunnel every 1 h, while the system conducted real-time monitoring during construction as shown in Figure 28.
In the field test, a large number of data were obtained, and part of the system measurement results corresponding with the station measurement results are presented in Table 7.
According to Table 6, the monitoring system and total station measurement results are close, which indicates that the monitoring system has good accuracy, stability, and repeatability in a field application.
5. Discussion
5.1. About Data Compensation Method for Environment Vibration
The data compensation method for environment vibration is effective for small and sudden vibration. When the vibration of the laser transmitter module is large and continues for a while, the spot position in the reference monitoring image acquisition modules will change and reflect the vibration; then, the system will stop the measurement for the measured points until the vibration of the laser transmitter module stops, filtering out the influence of the vibration on the accuracy of the system.
5.2. Drawbacks and Improvements of Simulation Environment
Because of the complex tunnel environment, the verification test environment needs to be discussed for such a complicated engineering mechanics problem.
- (1)
- For the principle verification test, image acquisition module calibration experiment and wireless antenna attitude test, a relative stable environment was needed; thus, these tests were conducted in the laboratory reasonably;
- (2)
- For the data processing test and temperature change test, a real tunnel environment was needed. However, because of the busy, dusty and vibrational construction sites, it was not only hard to study effects of single factor, but also inconvenient to conduct the tests in such a complex tunnel environment. Therefore, the tests were conducted in laboratory and studied without dust, and it would be better to simulate a dusty environment during the lab test;
- (3)
- For the system accuracy test, the deformation was simulated by a micro motion platform with a 1 µm accuracy. The micro motion platform was placed on a table and moved horizontally. However, for tunnel settlement deformation, it settled vertically. Given the isotropy of the image sensor for vertical and horizontal direction, the test was reliable, and the field test verified this adequately. In addition, it would be better to use a vertical micro motion platform for the deformation simulation in a vertical direction;
- (4)
- For the laser transmitter feasibility test, this test was conducted in a foggy night; thus, the simulation environment was similar to a tunnel, a dusty and dark environment in low visibility.
- (5)
- For the field test, the environment is dusty and even wet. In order to prevent the interference of tunnel dust and water mist, dirt shrouds and waterproof devices were used in laser transmitter module, image acquisition module and some electric parts. To improve the permeability of the laser beam, an automatic device needs to be added to clear the mud consisting of dust and water mist on the laser receiving screen and laser transmitter module glass window.
5.3. About Diffraction Rings of Laser Spots
5.4. About Application of the Proposed System
The proposed system was designed for tunnel deformation monitoring in construction, but it is also suitable for the tunnel that has already been built. However, because of the heavy traffic or trains’ passage, an unavoidable noise is produced in operating tunnels, and the noise intensity is different and relates to traffic volume, vehicle speed and vehicle type.
In order to solve this problem in the application of operating tunnels, a noise prediction model based on traffic volume, vehicle speed and vehicle type needs to be studied [41]. With this prediction model, a data compensation method should be proposed to compensate for the measurement error caused by unavoidable noise.
6. Conclusions
This paper presents a novel method based on laser and machine vision to automatically measure tunnel deformation of multiple interest points in real time and effectively compensate for the environment vibration, and, moreover, it can overcome influence of dusty and dark environments in low visibility. An automatic and wireless real-time tunnel deformation monitoring system that is based on laser and machine vision, and can give early warnings for tunnel collapse accidents, is proposed. Compensation methods are proposed to reduce the measurement errors caused by laser beam feasibility, temperature, air refraction index, and wireless antenna attitude. Experimental results show that the proposed monitoring system has a high detection accuracy, which can compensate for the shortcomings of the traditional tunnel deformation monitoring method in highly automatic real-time monitoring. The proposed system can also avoid the conflict with tunnel construction, that is, it realizes real-time monitoring during construction. Moreover, the monitoring system has good stability and repeatability. The detection accuracy is better than 0.12 mm, the repeatability accuracy is less than 0.11 mm, and the minimum resolution is 10 μm.
Author Contributions
Z.Q. conceived the method and revised the paper; H.L. designed the experiments and wrote the paper; W.H. and C.W. designed mechanical and electrical structure; W.H. and J.L. designed and conducted the field test; W.H., J.L., and Q.S. developed system software and improved the experimental results.
Funding
This research was financially supported by the National Natural Science Foundation of China (NSFC) (No: 51775378) and the National Key R&D Program of China (No.2017YFF0108102).
Conflicts of Interest
The authors declare no conflict of interest.
References
- Glišić, B.; Inaudi, D. Introduction to Structural Health Monitoring. In Fibre Optic Methods for Structural Health Monitoring; John Wiley & Sons, Ltd.: Hoboken, NJ, USA, 2007. [Google Scholar]
- Brownjohn, J.M.W. Structural health monitoring of civil infrastructure. Philos. Trans. Math. Phys. Eng. Sci. 2007, 365, 589–622. [Google Scholar] [CrossRef] [PubMed] [Green Version]
- Ding, L.Y.; Zhou, C.; Deng, Q.X.; Luo, H.B.; Ye, X.W.; Ni, Y.Q.; Guo, P. Real-time safety early warning system for cross passage construction in Yangtze Riverbed Metro Tunnel based on the internet of things. Autom. Constr. 2013, 36, 25–37. [Google Scholar] [CrossRef]
- Jicheng, T. The present situation and developing trend of surveying instrument. Mod. Surv. Mapp. 2003, 26, 46–48. [Google Scholar] [CrossRef]
- Kanaoka, C.; Furuuchi, M.; Inaba, J.; Myojo, T. Flow and dust concentration near working face of a tunnel under construction. J. Aerosol Sci. 2000, 31, 31–32. [Google Scholar] [CrossRef]
- Yuan, W.; Xue, D. Review of Tunnel Lining Crack Detection Algorithms based on Machine Vision. Chin. J. Sci. Instr. 2017, 38, 3100–3111. [Google Scholar]
- Han, D.; Xie, J. State-of-Arts of health monitoring techniques for long span bridges. Bridge Constr. 2002, 6, 69–73. [Google Scholar] [CrossRef]
- Wang, J. Tunnel Project Monitoring and Information Design Principles; China Railway Publishing House: Beijing, China, 1990; pp. 19–40. ISBN 7-113-00917-4. [Google Scholar]
- Zhang, S. Algorithm Research in Image Processing and Recognition for Coded Level Ruler of Digital Levels; Xi’an Technological College: Xi’an, China, 2004; Volume 24, pp. 353–355. [Google Scholar]
- Zhang, P. Study and Research of Digital Photogrammetry to Rock Mass Joint Distortion in the Underground Structures; Wuhan University of Technology: Wuhan, China, 2007. [Google Scholar]
- Yang, S.; Liu, W.; Wang, M. Study on the auto-total station system for monitoring analyzing and forecasting tunnel country rock deformation. J. China Railw. Soc. 2004, 26, 93–97. [Google Scholar] [CrossRef]
- Yang, S.; Liu, W.; Shi, H.; Huang, F. A study on the theory and method of non-contact monitoring for tunnel rock deformation based on free stationing of a total station. China Civ. Eng. J. 2006, 39, 100–104. [Google Scholar] [CrossRef]
- Chen, Y. Study on Tunnel Deformation Monitoring Using Digital Image Processing Techniques; Guangdong University of Technology: Guangzhou, China, 2014. [Google Scholar]
- Zhao, X.; Qiu, H. Application of fiber bragg grating sensing technology to tunnel monitoring. Chin. J. Rock Mech. Eng. 2007, 26, 587–593. [Google Scholar] [CrossRef]
- Xu, D.S.; Zhao, Y.M.; Liu, H.B.; Zhu, H.H. Deformation Monitoring of Metro Tunnel with a New Ultrasonic-Based System. Sensors 2017, 17, 1758. [Google Scholar] [CrossRef]
- Yufeng, S.; Jun, Z.; Yingya, Z. Tunnel safety monitoring based on terrestrial laser scanning technology. J. Southeast Univ. 2013, 43, 246–249. [Google Scholar] [CrossRef]
- Xu, Y.; Brownjohn, J.M.W. Review of machine-vision based methodologies for displacement measurement in civil structures. J. Civ. Struct. Health Monit. 2017, 8, 91–110. [Google Scholar] [CrossRef] [Green Version]
- Wang, J.; Chen, D.; Zhao, T. Research of Three-Dimensional Reconstruction Based on Computer Vision. In Proceedings of the International Conference on Wireless Communications Networking & Mobile Computing, Leipzig, Germany, 21–25 September 2010. [Google Scholar]
- Wang, L. Tunnel Deformation Monitoring Based on Digital Close-Range Photogrammetry; Chongqing Jiaotong University: Chongqing, China, 2012. [Google Scholar]
- Huang, H.; Sun, L.; Xue, Y. Research progress of tunnel lining surface disease detection technology based on machine vision. Mod. Tunn. Technol. 2014, 51, 19–31. [Google Scholar] [CrossRef]
- Sang, Z. Research on Close-Range Photogrammetry Technology in Tunnel Deformation Monitoring; Tongji University: Shanghai, China, 2008. [Google Scholar]
- Scaioni, M.; Barazzetti, L.; Giussani, A.; Previtali, M.; Roncoroni, F.; Alba, M.I. Photogrammetric techniques for monitoring tunnel deformation. Earth Sci. Inform. 2014, 7, 83–95. [Google Scholar] [CrossRef]
- Qi, C.; Kegang, H.; Shaohui, L.; Wu, T.; Guo, W.; Tang, Y. Development of a Modeling Method for Monitoring Tunnel Deformation Based on Active Panoramic Vision Technology. In Proceedings of the Sixth International Conference on Intelligent Systems Design & Engineering Applications, Guiyang, China, 18–19 August 2016. [Google Scholar]
- Qi, C. Research of the Modeling Method for Monitoring Tunnel Deformation Based on Active Stereo Omni-Directional Vision Sensor; Zhejiang University of Technology: Zhejiang, China, 2017. [Google Scholar]
- Wei, T.G. NATM Tunneling Construction Technology. Value Eng. 2013, 32, 120–121. [Google Scholar] [CrossRef]
- Sui, X.Z.; Teng, W.Y. Analysis of the Interaction between Primary Support and the Secend Linning of Large Span and Double Arch Tunnel. Nat. Sci. 2003, 16, 8–11. [Google Scholar] [CrossRef]
- Sun, M.L.; Zhu, Y.Q. Research on construction time of secondary lining soft rock of large-deformation tunnel. Chin. J. Rock Mech. Eng. 2008, 27, 580–588. [Google Scholar] [CrossRef]
- Chen, D. Research on Deformation Features and Stability Analysis of Tunnels in Carbonaceous Shale. Nat. Sci. 2011, 30, 58–64. [Google Scholar] [CrossRef]
- Lai, J.; Fan, H.; Lai, H. In-situ monitoring and analysis of tunnel deformation law in weak loess. Rock Soil Mech. 2015, 36, 2003–2012. [Google Scholar] [CrossRef]
- Zhao, H. Evaporation and Research on Anti-Radiation of Bandpass Filter; Harbin Institute of Technology: Harbin, China, 2014. [Google Scholar]
- Bai, S.; Gu, P.; Liu, X.; Tang, J. Optical stability of thin film filters. Acta Photonica Sin. 2001, 30, 576–580. [Google Scholar]
- Zhang, J.; Wang, S.; Wang, Z. Research on diffuse reflectivity of the reflective screen for a laser-guided weapon simulation system. Electron. Opt. Control 2005, 12, 27–30. [Google Scholar] [CrossRef]
- Zhou, Z. Automatic Measurement Technology for Shaft Parts Based on the Analysis of Sub-Pixel; Jilin University: Jilin, China, 2016. [Google Scholar]
- Kalkman, C.J. LabVIEW: A software system for data acquisition, data analysis, and instrument control. J. Clin. Monit. 1995, 11, 51–58. [Google Scholar] [CrossRef]
- Wei, Z.; Yang, K. Laser spot analytic system based on CCD and LabView. Laser J. 2011, 32, 17–18. [Google Scholar] [CrossRef]
- Singh, K.R.; Garg, A.; Upadhyay, A. A Novel Camera Calibration method for measurement of horizontal and vertical displacement of target object using LABVIEW. Int. J. Adv. Eng. Res. Sci. 2015, 2, 21–24. [Google Scholar]
- Wu, B.F.; Chen, W.H.; Chang, C.W.; Liu, C.C.; Chen, C.J. Dynamic CCD camera calibration for traffic monitoring and vehicle applications. In Proceedings of the IEEE International Conference on Systems, Man and Cybernetics, Montreal, QC, Canada, 7–10 October 2007; pp. 1717–1722. [Google Scholar]
- Hsu, C.C.; Lu, M.C.; Chin, K.W. Distance measurement based on pixel variation of CCD images. ISA Trans. 2009, 48, 389–395. [Google Scholar] [CrossRef] [PubMed]
- Yi, Y.; Huang, J.; Long, M. Camera calibration method based on binocular vision research. Int. J. Sci. 2016, 3, 129–134. [Google Scholar]
- Xu, Y.; Qiu, J.H. Focusing and Diffraction Effects of a Laser Beam through a Lens System. Appl. Laser 1991, 11, 51–54. [Google Scholar]
- Qin, L.; Dong, L.-L.; Xu, W.-H.; Zhang, L.-D.; Leon, A.S. An intelligent luminance control method for tunnel lighting based on traffic volume. Sustainability 2017, 9, 2208. [Google Scholar] [CrossRef]
Figure 1.
System principle.

Figure 2.
Image acquisition module.

Figure 3.
Mathematical model.

Figure 4.
Sketch map. 1. reference monitoring image acquisition module A; 2. reference monitoring image acquisition module B; 3. laser transmitter module; 4. image acquisition module.
Figure 4.
Sketch map. 1. reference monitoring image acquisition module A; 2. reference monitoring image acquisition module B; 3. laser transmitter module; 4. image acquisition module.

Figure 5.
Main composition of the real-time tunnel deformation monitoring system.

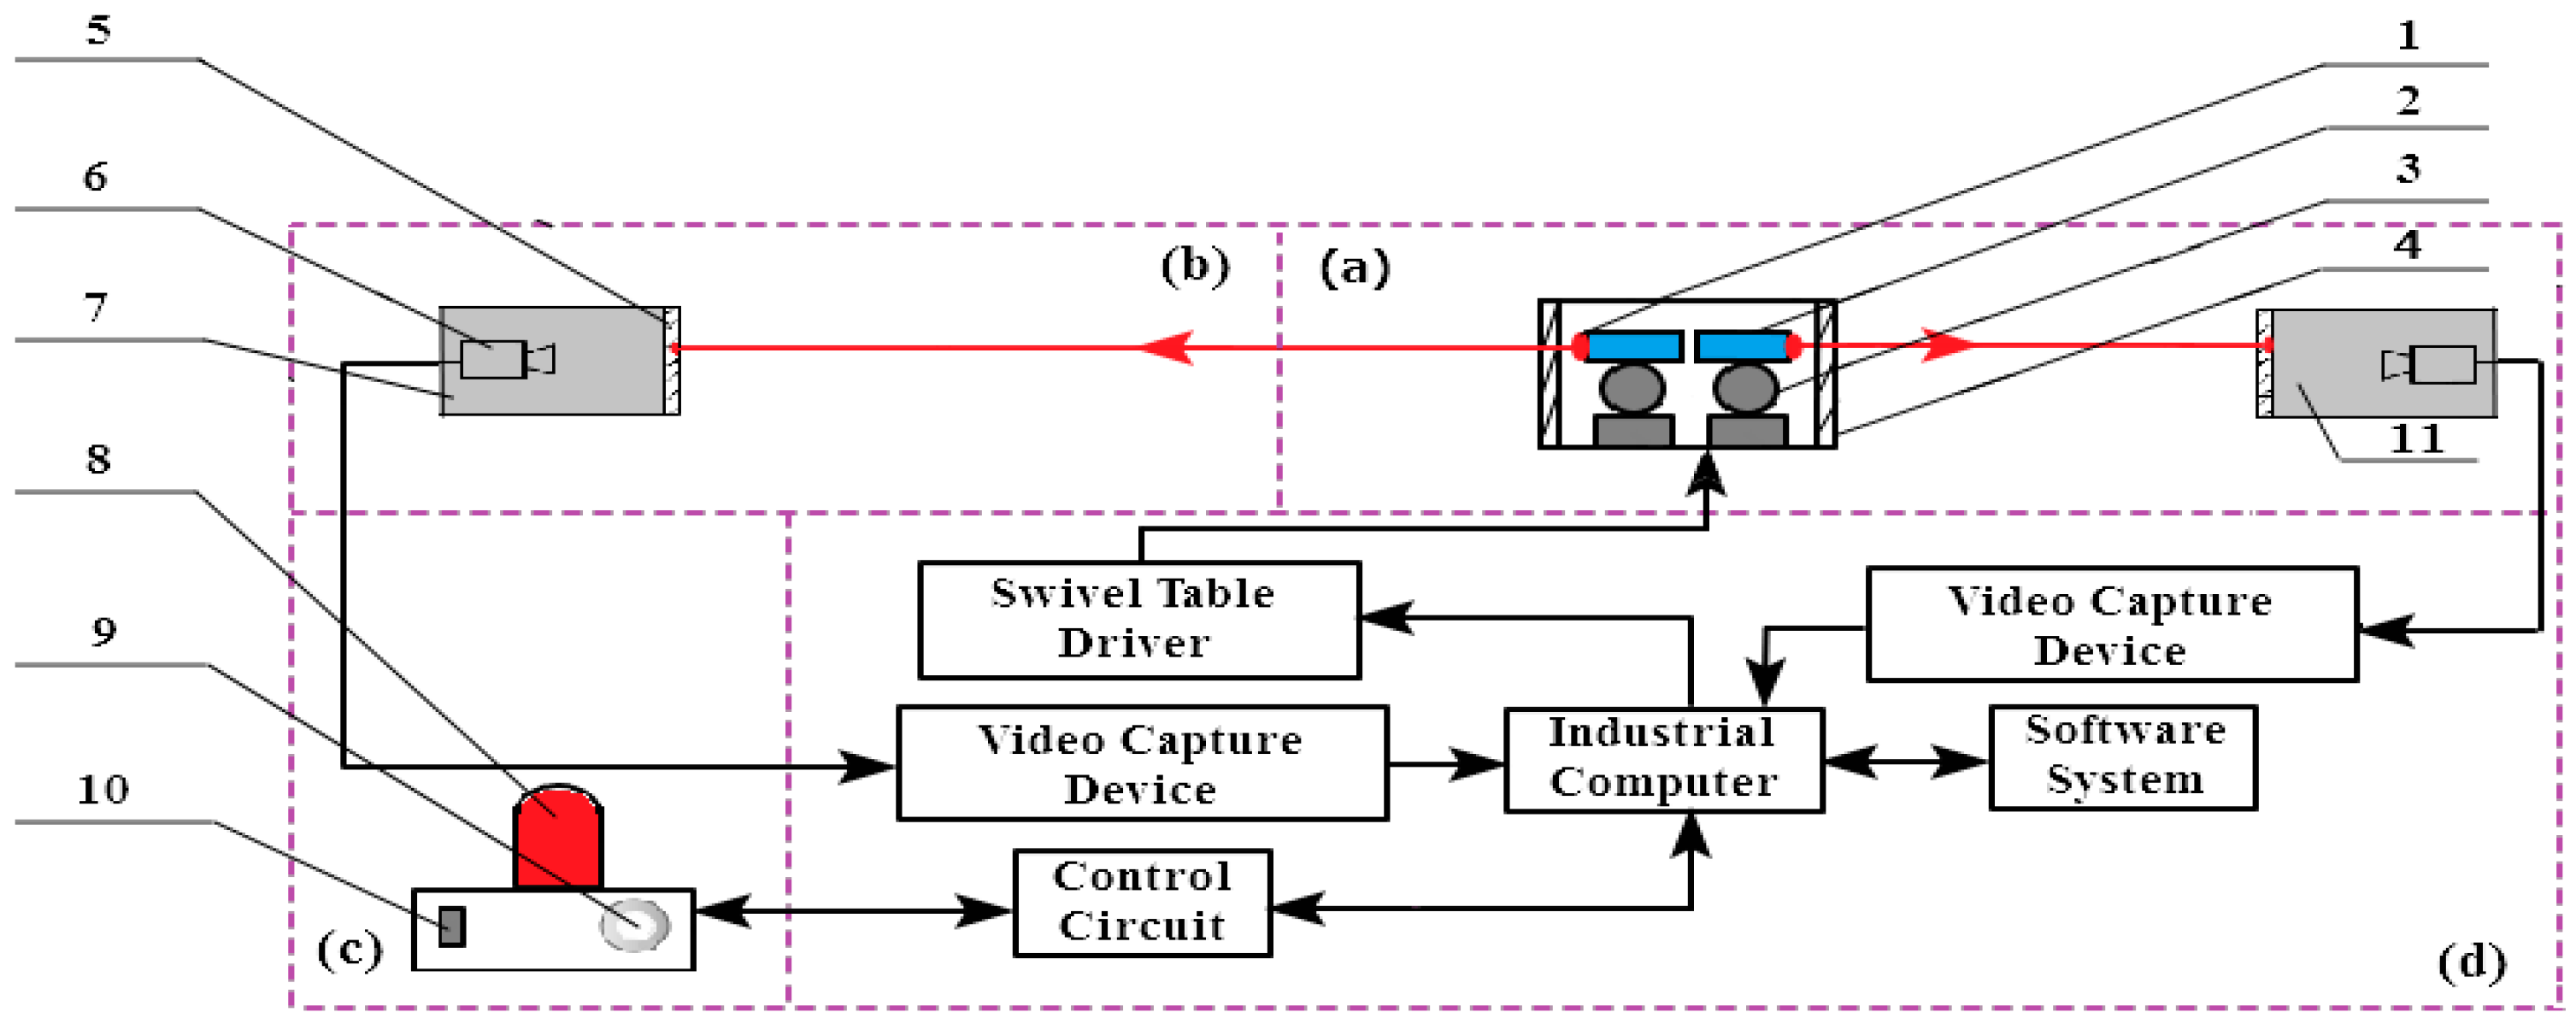
Figure 6.
System composition: (a) laser transmitter module; (b) image acquisition module; (c) sound and light alarm module; (d) hard devices and system software. 1. forward laser; 2. backward laser; 3. electronically controlled two-dimensional swivel table; 4. organic glass window; 5. filter imaging screen; 6. high-definition industrial camera; 7. darkroom; 8. alarm light; 9. alarm horn; 10. power switch; 11. reference monitoring image acquisition module.

Figure 7.
Wireless adaptor.

Figure 8.
Flowchart of the system software.

Figure 9.
Sketch map of the principle verification experiment. 1. moving direction; 2. micro motion platform; 3. image acquisition module; 4. laser transmitter module.
Figure 9.
Sketch map of the principle verification experiment. 1. moving direction; 2. micro motion platform; 3. image acquisition module; 4. laser transmitter module.

Figure 10.
Data relation curve.

Figure 11.
Simplified coordinate model.

Figure 12.
Horizontal calibration experiment.

Figure 13.
Coordinate change before and after horizontal calibration.

Figure 14.
Universal arm.

Figure 15.
Tunnel environment.

Figure 16.
Conversion coefficient calibration experiment. 1. image acquisition module; 2. movement direction; 3. micro motion platform; 4. laser.
Figure 16.
Conversion coefficient calibration experiment. 1. image acquisition module; 2. movement direction; 3. micro motion platform; 4. laser.

Figure 17.
Laser spot position information of 1000 spot images.

Figure 18.
Position probability distribution.

Figure 19.
Schematic diagram of electromagnetic wave emission principle.

Figure 20.
Receiving antenna power map. (a) Parallel attitude; (b) vertical attitude.

Figure 21.
Result of data change caused by thermal deformation.

Figure 22.
Test environment in foggy and dark night.

Figure 23.
Test sketch map. 1. reference monitoring image acquisition module A; 2. reference monitoring image acquisition module B; 3. image acquisition module I; 4. image acquisition module II. ( m, m, m, m).
Figure 23.
Test sketch map. 1. reference monitoring image acquisition module A; 2. reference monitoring image acquisition module B; 3. image acquisition module I; 4. image acquisition module II. ( m, m, m, m).

Figure 24.
Tunnel environment during construction. (a) Tunnel construction trolley; (b) dusty and dark tunneling environment; (c) deformation monitoring during construction; (d) tunnel face environment.
Figure 24.
Tunnel environment during construction. (a) Tunnel construction trolley; (b) dusty and dark tunneling environment; (c) deformation monitoring during construction; (d) tunnel face environment.

Figure 25.
(a) Laser spot image in 70 m receiving distance; (b) high power laser with optical lens.

Figure 26.
(a) Measured points; (b) image acquisition module mounted on measured points.

Figure 27.
Total station measurement.

Figure 28.
System measurement.


Table 1.
x-axis conversion coefficient calibration experimental data.
| Displacement of Micro Motion Platform (mm) | Abscissa Value of Laser Spot Center (pixel) | Δx (mm) | ΔX (pixel) |
|---|---|---|---|
| 0 | 636.39 | — | — |
| 10 | 567.28 | 10 | 69.11 |
| 20 | 498.04 | 10 | 69.24 |
| 30 | 428.44 | 10 | 69.60 |
| 40 | 360.53 | 10 | 67.91 |
| 50 | 291.98 | 10 | 68.55 |
| 60 | 223.58 | 10 | 68.40 |
| 70 | 154.93 | 10 | 68.65 |
Table 2.
Results comparison.
| Method | Accuracy (mm) |
|---|---|
| 1. Calculation of the extremum after Gauss fitting | 0.28 |
| 2. Calculation of the expectation from original data | 0.42 |
| 3. Calculation of the expectation after low-pass filtering | 0.21 |
| 4. Acquisition of the maximum probability data | 0.12 |
Table 3.
Detection accuracy test experimental data.
| Position of Micro Motion Platform (mm) | Laser Spot Center before Calibration (pixel) | Laser Spot Center after Calibration (mm) | x (mm) | (mm) |
|---|---|---|---|---|
| (70, 0) | (598.27, 317.10) | (86.99, 46.11) | — | — |
| (60, 0) | (529.16, 317.29) | (76.94, 46.13) | 10.05 | 0.05 |
| (50, 0) | (459.92, 317.45) | (66.87, 46.15) | 10.07 | 0.07 |
| (40, 0) | (390.32, 317.60) | (56.75, 46.18) | 10.12 | 0.12 |
| (30, 0) | (322.41, 317.84) | (46.87, 46.21) | 9.88 | 0.12 |
| (20, 0) | (253.86, 318.14) | (36.91, 46.25) | 9.96 | 0.04 |
| (10, 0) | (185.46, 318.42) | (26.97, 46.29) | 9.94 | 0.06 |
| (0, 0) | (116.81, 318.61) | (16.88, 46.32) | 10.09 | 0.09 |
Table 4.
Repeatability accuracy test experimental data.
| Position of Micro Motion Platform (mm) | System Detection Results | Position of Micro Motion Platform (mm) | System Detection Results | ||
|---|---|---|---|---|---|
| (x, y) (mm) | (mm) | (x, y) (mm) | (mm) | ||
| (70, 0) | (86.95, 46.09) | — | (60, 0) | (76.95, 46.13) | 0.06 |
| (60, 0) | (77.02, 46.12) | 0.07 | (70, 0) | (86.96, 46.11) | 0.01 |
| (50, 0) | (66.90, 46.15) | 0.12 | (60, 0) | (76.89, 46.12) | 0.07 |
| (40, 0) | (56.80, 46.19) | 0.10 | (50, 0) | (66.88, 46.16) | 0.01 |
| (30, 0) | (46.87, 46.21) | 0.07 | (40, 0) | (56.80, 46.18) | 0.08 |
| (20, 0) | (36.89, 46.23) | 0.02 | (30, 0) | (46.83, 46.22) | 0.03 |
| (10, 0) | (26.85, 46.27) | 0.04 | (20, 0) | (36.91, 46.25) | 0.08 |
| (0, 0) | (16.90, 46.32) | 0.05 | (10, 0) | (26.88, 46.28) | 0.03 |
| (10, 0) | (26.88, 46.28) | 0.02 | (0, 0) | (16.89, 46.33) | 0.01 |
| (20, 0) | (36.91, 46.25) | 0.03 | (10, 0) | (26.96, 46.29) | 0.07 |
| (30, 0) | (46.88, 46.22) | 0.03 | (20, 0) | (36.89, 46.26) | 0.07 |
| (40, 0) | (56.80, 46.20) | 0.08 | (30, 0) | (46.85, 46.23) | 0.04 |
| (50, 0) | (66.89, 46.14) | 0.09 | (40, 0) | (56.78, 46.18) | 0.07 |
Table 5.
Laser transmitter module feasibility test data (unit: mm).
| Devices | Reference Monitoring Image Acquisition Modules | Image Acquisition Modules | ||
|---|---|---|---|---|
| Number | 1 | 2 | 3 | 4 |
| Initial laser spot coordinates | (92.02, 48.13) | (69.27, 66.21) | (80.42, 60.30) | (73.89, 58.62) |
| Final laser spot coordinates | (97.18, 48.15) | (73.36, 66.18) | (62.22, 60.37) | (55.12, 58.70) |
| Horizontal displacement before compensation | 5.16 | 4.09 | 18.20 | 18.71 |
| Horizontal displacement after compensation | — | — | 0.09 | 0.14 |
Table 6.
Laser energy transmission test data.
| Receiving Distance (m) | Gray Value of Laser Spot | Receiving Distance (m) | Gray Value of Laser Spot | Receiving Distance (m) | Gray Value of Laser Spot |
|---|---|---|---|---|---|
| 20 | 255 | 45 | 246 | 70 | 185 |
| 25 | 255 | 50 | 233 | 75 | 171 |
| 30 | 255 | 55 | 221 | 80 | 169 |
| 35 | 255 | 60 | 210 | 85 | 155 |
| 40 | 255 | 65 | 196 | 90 | 139 |
Table 7.
Partial field test data.
| No. | Time | Deformation from Total Station (mm) | Deformation from Monitoring System (mm) |
|---|---|---|---|
| 1 | 16:00 | 0 | 0 |
| 2 | 17:00 | 2.51 | 2.46 |
| 3 | 18:00 | 4.90 | 4.95 |
| 4 | 19:00 | 6.21 | 6.22 |
| 5 | 20:00 | 7.10 | 7.15 |
| 6 | 21:00 | 8.01 | 7.99 |
© 2018 by the authors. Licensee MDPI, Basel, Switzerland. This article is an open access article distributed under the terms and conditions of the Creative Commons Attribution (CC BY) license (http://creativecommons.org/licenses/by/4.0/).
Share and Cite
MDPI and ACS Style
Qiu, Z.; Li, H.; Hu, W.; Wang, C.; Liu, J.; Sun, Q. Real-Time Tunnel Deformation Monitoring Technology Based on Laser and Machine Vision. Appl. Sci. 2018, 8, 2579. https://doi.org/10.3390/app8122579
AMA Style
Qiu Z, Li H, Hu W, Wang C, Liu J, Sun Q. Real-Time Tunnel Deformation Monitoring Technology Based on Laser and Machine Vision. Applied Sciences. 2018; 8(12):2579. https://doi.org/10.3390/app8122579
Chicago/Turabian StyleQiu, Zurong, Haopeng Li, Wenchuan Hu, Chenglin Wang, Jiachen Liu, and Qianhui Sun. 2018. "Real-Time Tunnel Deformation Monitoring Technology Based on Laser and Machine Vision" Applied Sciences 8, no. 12: 2579. https://doi.org/10.3390/app8122579
Note that from the first issue of 2016, this journal uses article numbers instead of page numbers. See further details here.