A Review of the Applications of OCT for Analysing Pharmaceutical Film Coatings


1
Department of Engineering, Lancaster University, Lancaster LA1 4YW, UK
2
Department of Electrical Engineering and Electronics, University of Liverpool, Liverpool L69 3GJ, UK
3
Strathclyde Institute of Pharmacy and Biomedical Sciences, University of Strathclyde, 161 Cathedral Street, Glasgow G4 0RE, UK
4
EPSRC Centre for Innovative Manufacturing in Continuous Manufacturing and Crystallisation, University of Strathclyde, 99 George Street, Glasgow G1 1RD, UK
5
Department of Chemical Engineering and Biotechnology, Philippa Fawcett Drive, University of Cambridge, Cambridge CB3 0AS, UK
*
Authors to whom correspondence should be addressed.
Appl. Sci. 2018, 8(12), 2700; https://doi.org/10.3390/app8122700
Submission received: 30 October 2018
/
Revised: 10 December 2018
/
Accepted: 11 December 2018
/
Published: 19 December 2018
(This article belongs to the Special Issue Optical Coherence Tomography and its Applications)
Abstract
:Optical coherence tomography (OCT) has recently attracted a lot of interest in the pharmaceutical manufacturing industry as a fast, contactless and non-destructive modality for quantifying thin film coatings on pharmaceutical dosage forms, which cannot be resolved easily with other techniques. In this topical review, we present an overview of the research that has been performed to date, highlighting key differences between systems and outlining major challenges ahead.
1. Introduction
In pharmaceutical manufacturing, film coating on solid oral dosage forms is performed as part of the secondary manufacturing. The film coating process is a widely used unit operation in the pharmaceutical industry for ensuring color uniformity, light protection and taste masking of the final products. Pharmaceutical film coating is a thin polymer-based coat applied to a solid dosage form such as a tablet or pellet. In the majority of cases, a coating formulation contains additives such as a plasticizer, anti-adherents, surfactants and colorants [1]. For advanced drug delivery systems, functional coatings such as modified release (sustained, extended, delayed and osmotic-controlled), active and enteric coatings, are used. Modified release coatings allow formulators to control the rate of drug release as a function of time, whereas enteric coatings will lead to drug release as a response to the environment (e.g., depending on the pH) [1].
The coating process can be performed either as a batch or continuous operation. Even though the latter is receiving increasing attention in development as part of continuous manufacturing, batch operations are more commonly used commercially. Depending on the size of the solid oral dosage form, coating is routinely performed inside a pan-coater or a fluid-bed apparatus. For example, small drug delivery devices such as granules, pellets and mini-tablets with a diameter <5 mm are typically coated inside a fluid-bed apparatus.
Even though coating processes have been used for many decades, there are still remaining challenges attributed to the inherent complexity of the process itself. The process ultimately represents a complex interplay between three main physical phenomena: (1) system thermodynamics, influenced by both the drying air and spray conditions that can be considered an adiabatic evaporative cooling process; (2) spray atomization; and (3) tablet mixing, which describes the tumbling of tablets and transfer of coating through contact with neighbouring tablets. These phenomena in turn are influenced by the equipment design and operating parameters, as well as tablet core and coating material properties [2]. A lack of scientific understanding of these complex interactions and how they impact product quality makes it difficult to produce coatings with the desired thicknesses and densities, and with low inter-dosage form and inter-batch variability. As the coating process is stochastic in nature, coating thickness of the final product inevitably will follow a distribution. The realistic aim of a successful coating operation is therefore to make this distribution as narrow as possible, or in other words, to minimise coating variations. Process understanding can be achieved by process modelling, where advances have been made using discrete element modelling, ray tracing [3] and computational fluid dynamics [4]. At the same time, developments in process analytical technology (PAT) have allowed measurements of the dosage forms throughout the process to be acquired, not only useful for quality control, but also for understanding the physicochemical changes of the film during manufacturing. Many analytical techniques have been demonstrated to date for the assessment of the coatings on the dosage forms and extensive reviews on the subject matter have been presented [5,6,7]. Optical coherence tomography (OCT) is fast gaining popularity as a non-destructive method for quantitative evaluation of pharmaceutical coatings because it offers both high data acquisition rate and high axial and spatial resolutions. In this review, we will therefore only focus on the use of OCT for analysing pharmaceutical film coatings, highlighting the major achievements, as well as the challenges ahead.
2. Overview of OCT Techniques
OCT is based on low-coherence interferometry, which operates in accordance with the principle interference between two optical beams when the optical path difference (OPD) is within the coherence length of the light source. The coherence length therefore determines the temporal width of the interferometric signal generated by the interferometer and thus defines the axial resolution of an OCT imaging system. There are three types of OCT modalities that have been applied in pharmaceutical film coating imaging: time-domain full-field OCT (FF-OCT), spectral-domain (SD-OCT) and swept-source OCT (SS-OCT). They are implemented with time-domain OCT (TD-OCT) and Fourier-domain OCT (FD-OCT) principles. It should be noted that Fourier transform is used as part of depth profile reconstruction for SD-OCT and SS-OCT [8,9,10,11]. In this paper, OCT performed in SD-OCT and SS-OCT are therefore categorised as FD-OCT. Here we present a brief summary of TD-OCT and FD-OCT technologies.
2.1. Time-Domain OCT
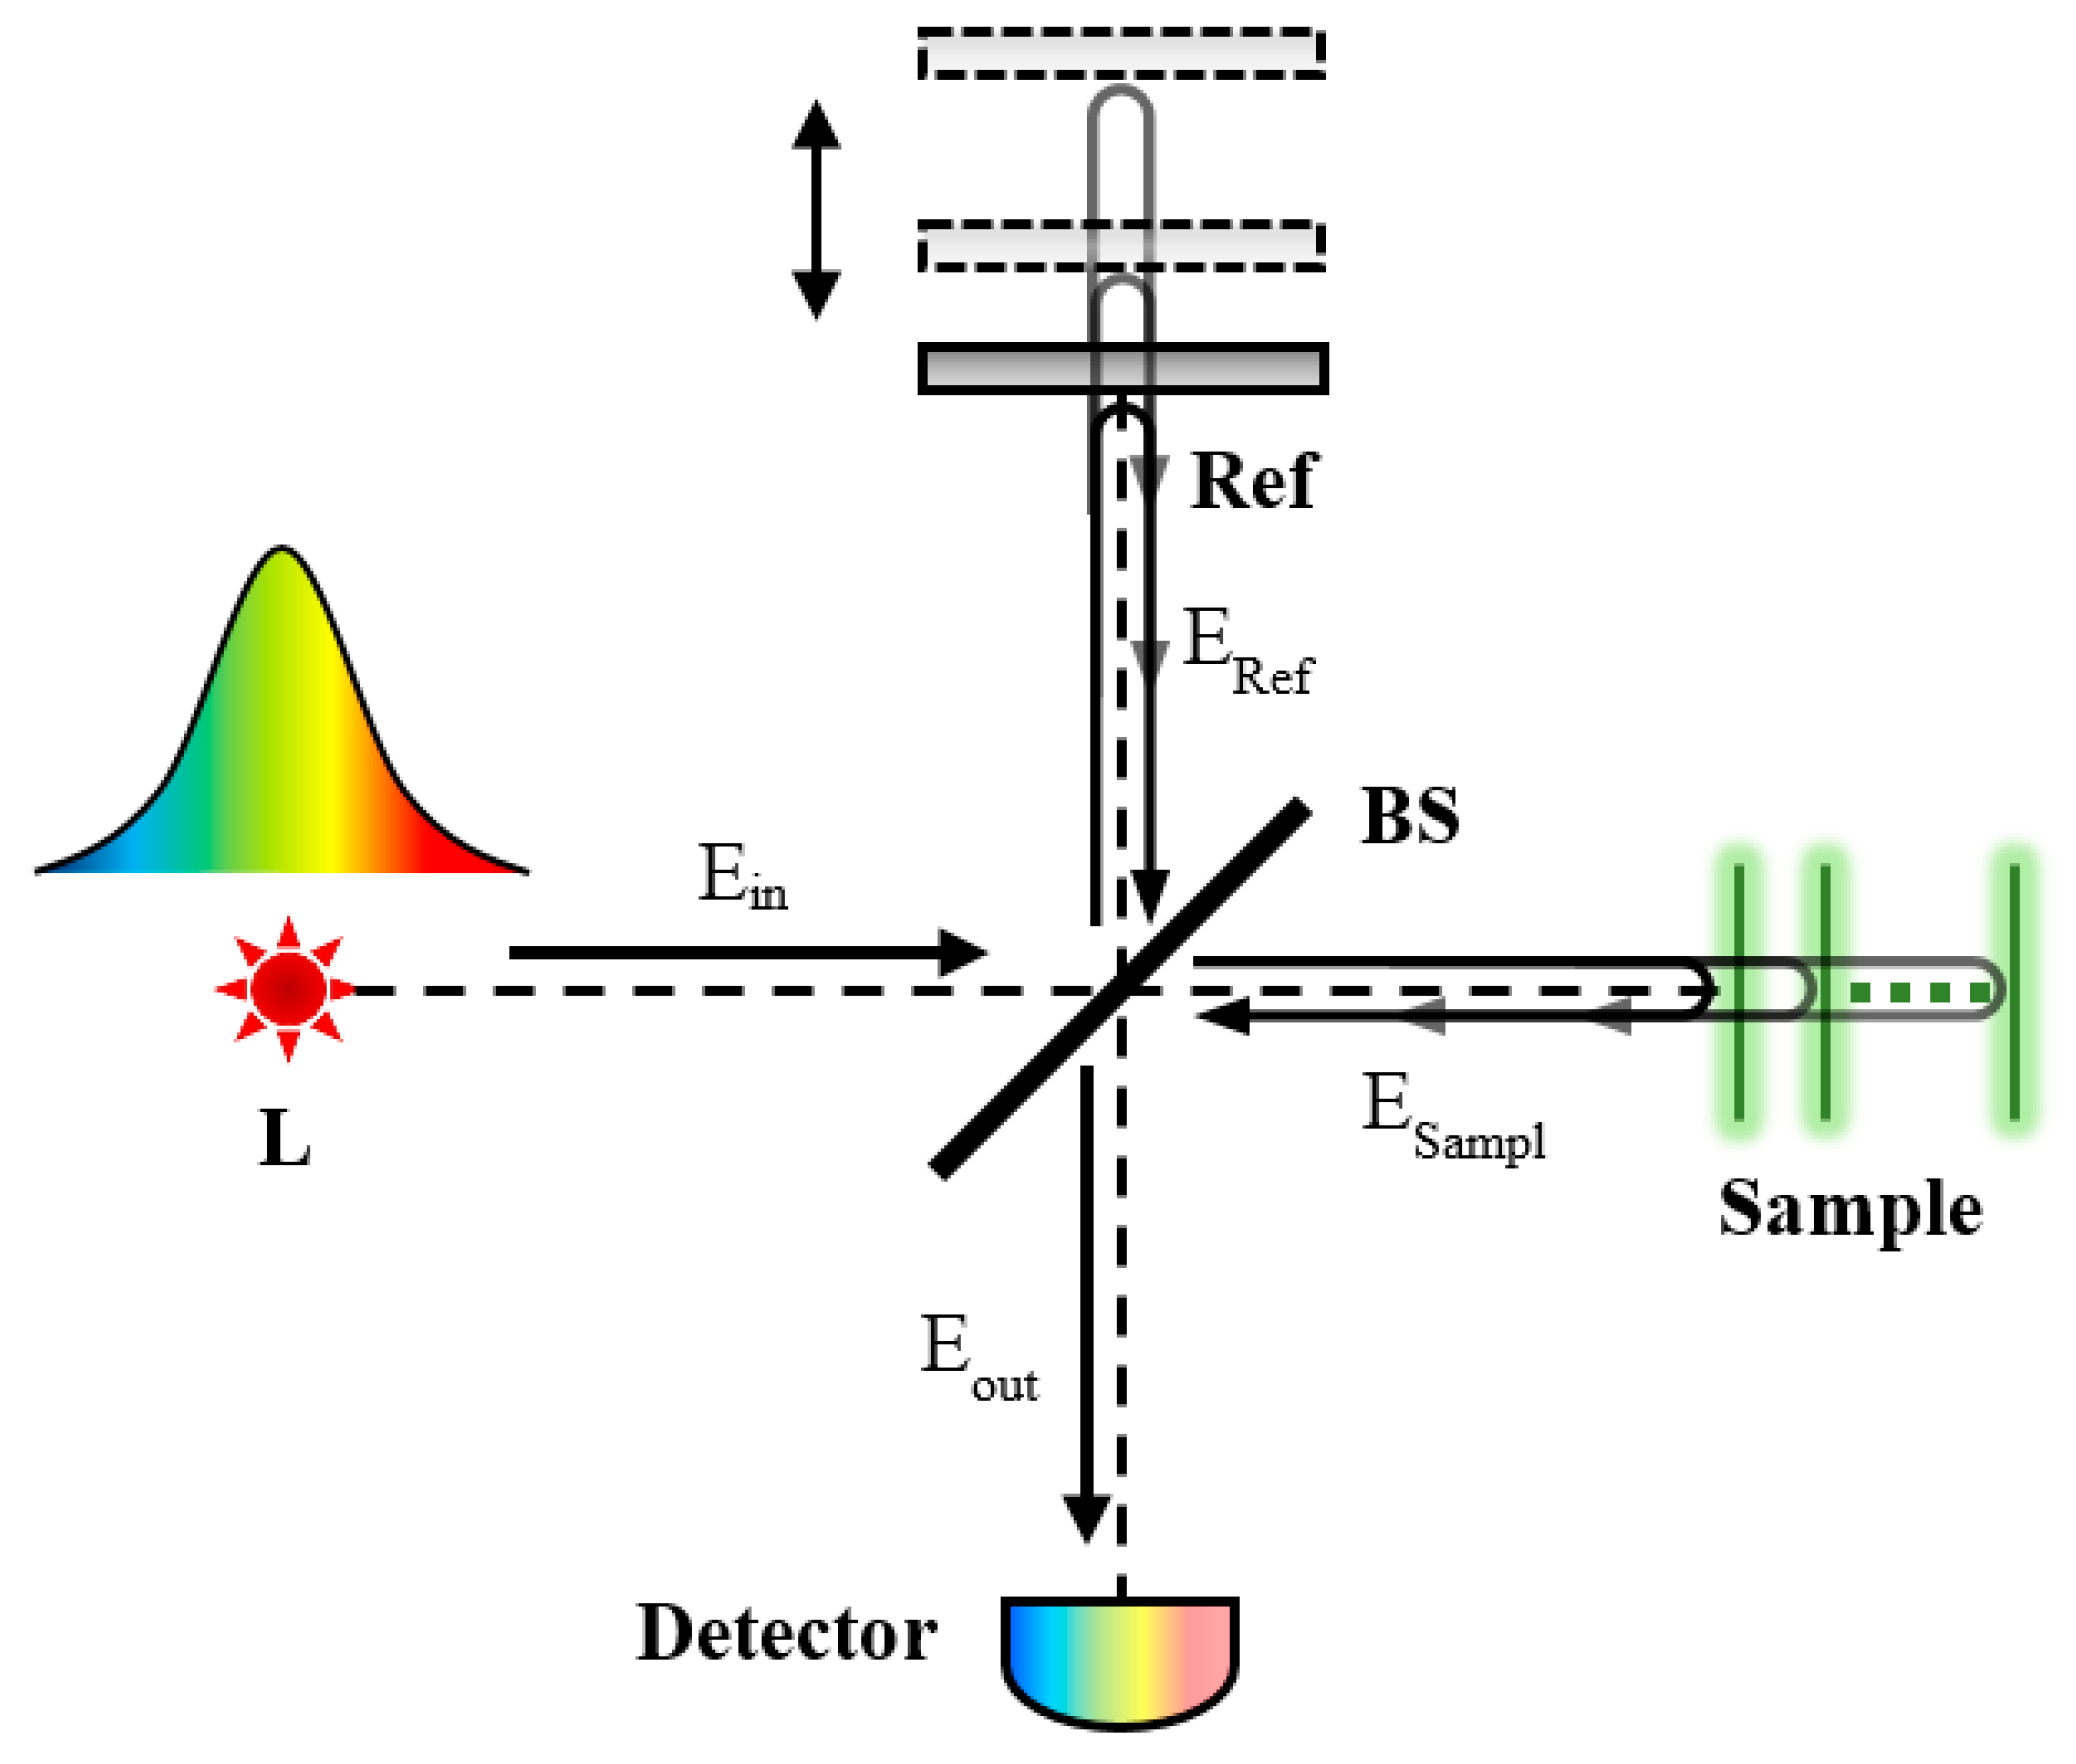
Figure 1 shows a schematic diagram of a typical TD-OCT system. Here the optical beam from a broadband light source is split into a reference and sample arm, respectively, using a beam-splitter, which also recombines the respective back-reflected beams into a photodetector, such as a photodiode, for heterodyne detection [12,13,14]. By systematically displacing a reference mirror by means of a motorized stage, scanning along the depth/axial direction of the sample can be achieved. A single depth scan is performed by measuring the interference signals as a function of time while the reference arm is moved. Thus, such a measurement requires time and the mechanical movement of a mirror to acquire axial information of the sample.
2.2. Fourier-Domain OCT
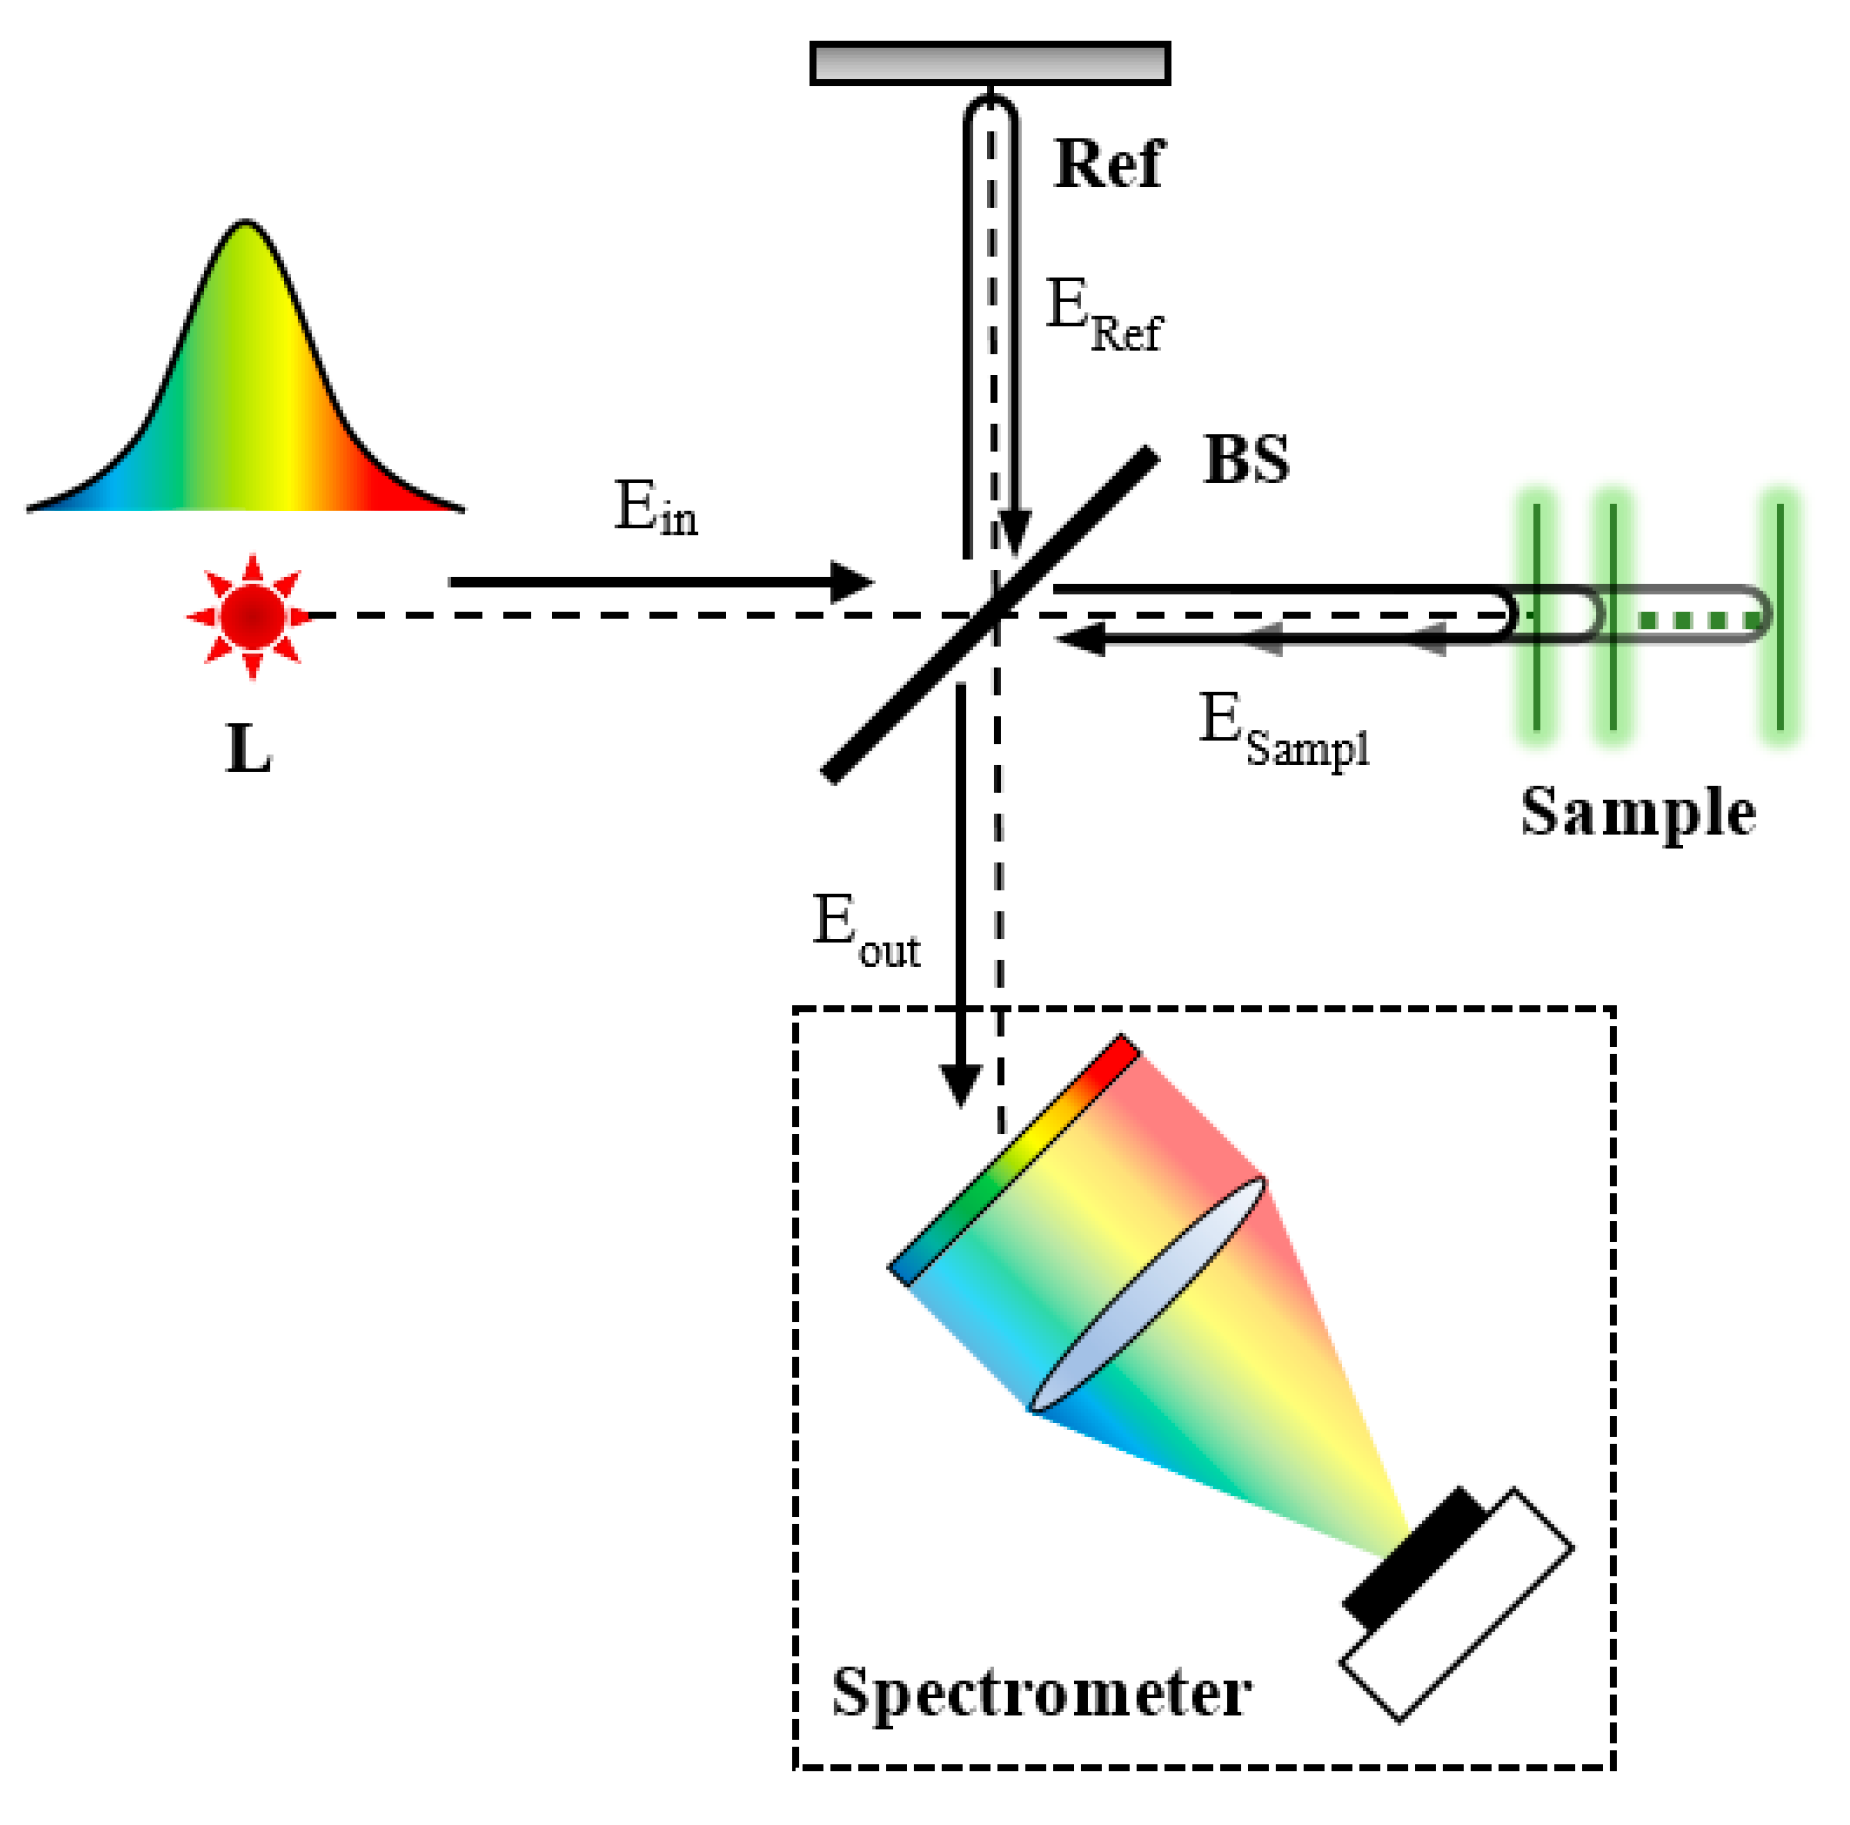
Figure 2 shows a schematic of a typical SD-OCT system [15,16,17], which bares close resemblance to the TD-OCT, except there is no longer the need to mechanically scan along the reference arm. Instead, the sample depth profile is encoded into the spectral components of the interference signal that are simultaneously detected by a linear detector array, such as a line camera. As there are no moving parts for depth/axial scanning, measurement time and sensitivity are significantly improved over TD-OCT at the expense of a line camera investment. The alternative option is that instead of inspecting all wavelengths at the same time by means of a line-camera, SS-OCT can sweep over the spectral width of a swept-source, where a narrow band laser is used to sweep over a broad spectral bandwidth [18,19,20]. In both the FD-OCT implementations, the captured interference signals are spectrally resolved and can be reconstructed to the OCT images with same method.
3. Pharmaceutical Film Coatings
3.1. Measurement Principle
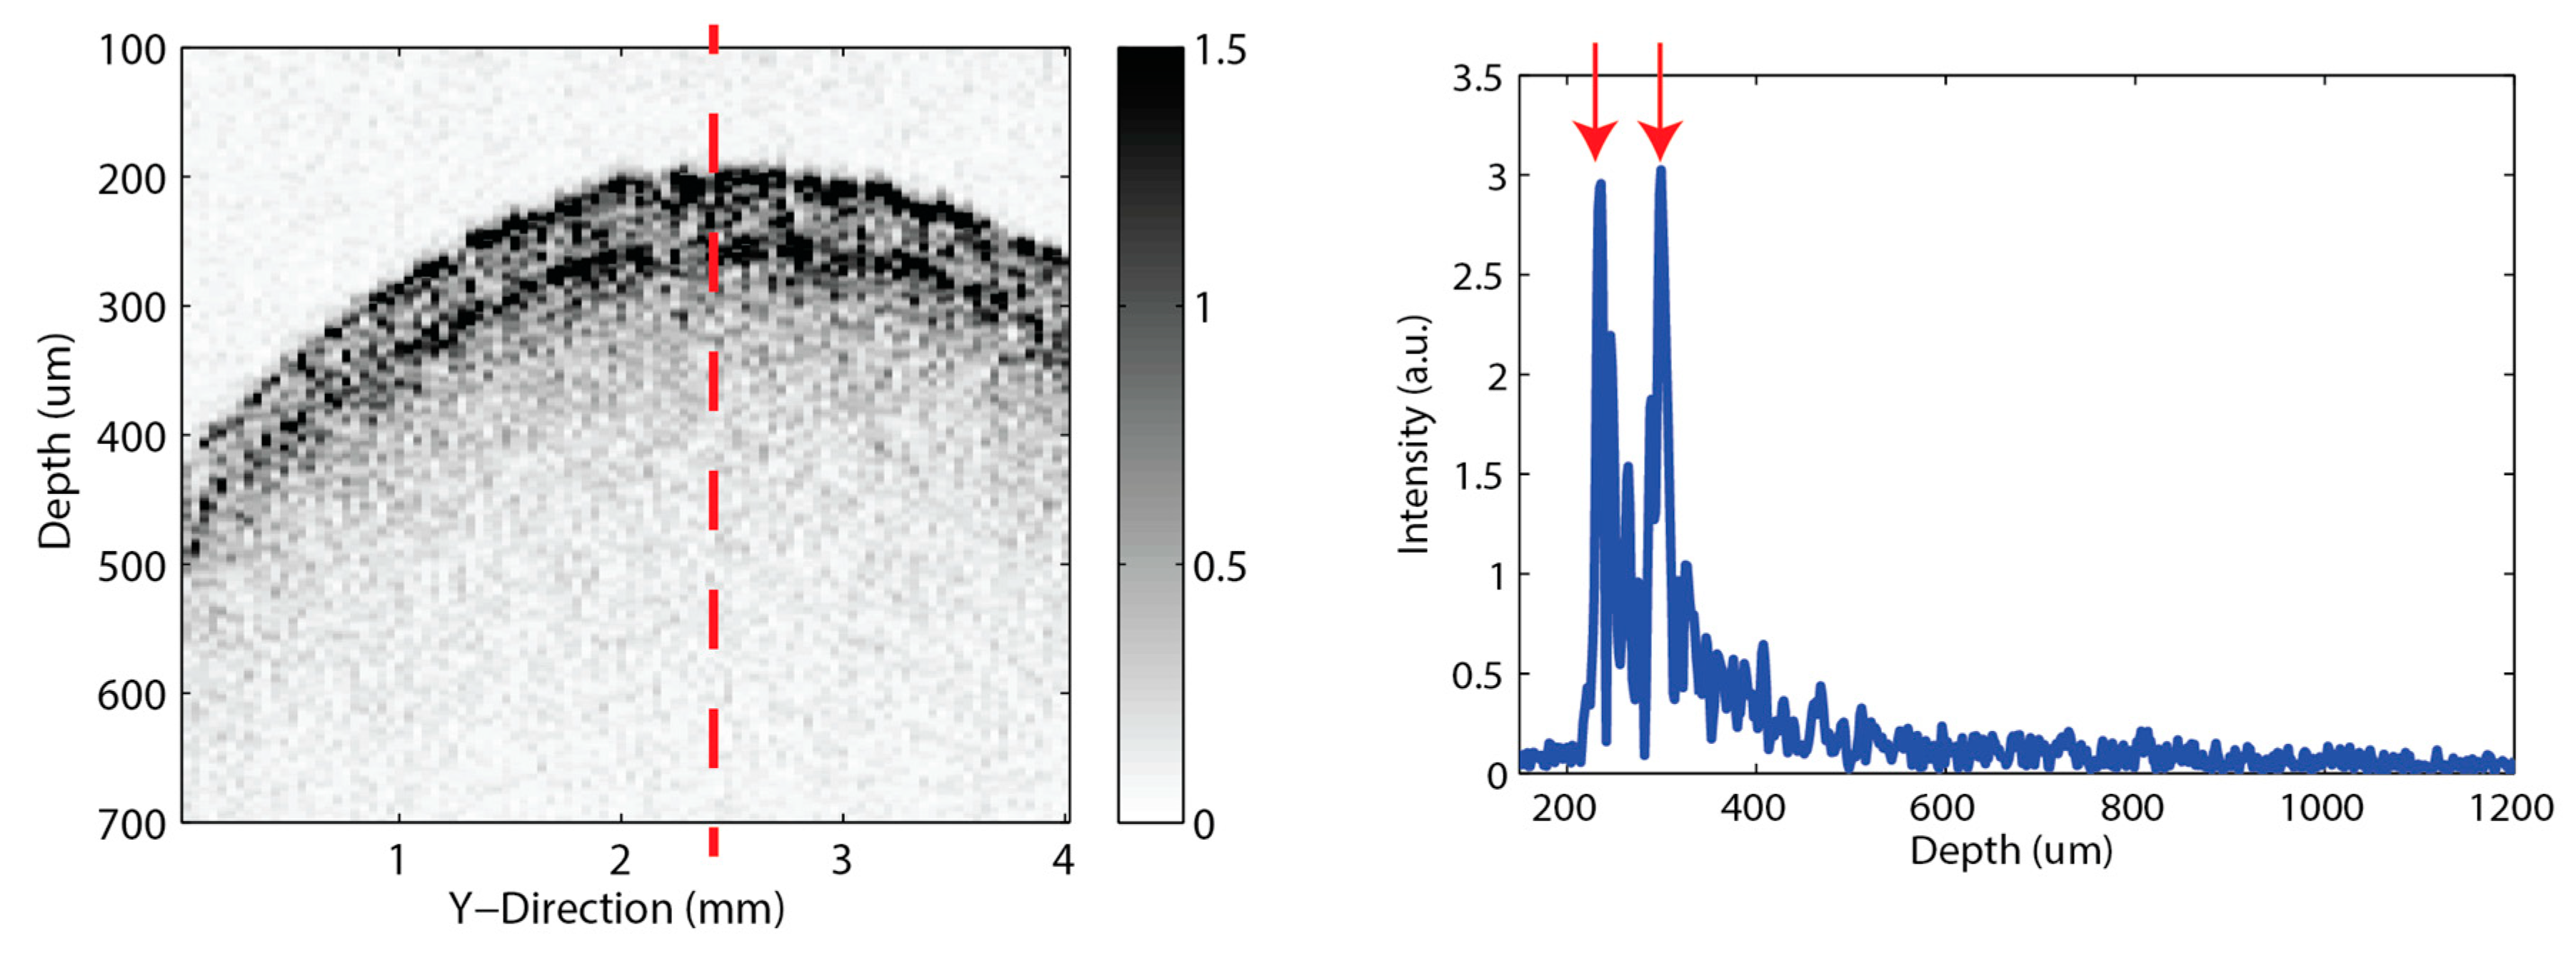
OCT is a high-resolution imaging modality providing depth profiles of semi-transparent and turbid materials non-destructively and without physical contact. Extensive reviews of applications have been presented [21,22]. In a standard measurement in pharmaceutics, an optical beam is incident onto a pharmaceutical dosage form, where a fraction of light reflects off due to a change in the material refractive index while the majority of the remaining portion penetrates into the coating structure, which undergoes reflection and/or scattering when it encounters subsequent change in material interfaces. Film coating thickness at a given point on a pharmaceutical tablet surface, provided that it is oriented perpendicular to the incident beam, is therefore directly proportional to the separation between adjacent reflection peaks in the time-domain OCT signal or A-scan and is determined by , where is the speed of light, is the coating thickness, is the peak separation, and is the coating refractive index at the optical regime. The coating refractive index can be estimated either from an independent measurement of the absolute film coating thickness using techniques such as terahertz pulse imaging (TPI) [23] or X-ray microtomography (XµCT) [24], or more precisely by spectroscopic methods such as spectroscopic ellipsometry. By varying the relative distance between the OCT sensor and the dosage form laterally, a cross-sectional image or B-scan can be constructed as shown in Figure 3.
3.2. Off-Line Measurement
The first demonstration of OCT’s potential for coating analysis of pharmaceutical tablets was presented in 2009 [25]. In the study, tablets of different shapes and coating formulations were tested using a commercial SD-OCT and SS-OCT operating at 930 nm and 1325 nm, respectively. It was found that differences between the refractive indices of the respective coating layers was the reason behind the contrast between interfaces, which was necessary for resolving the different coating layers. A penetration depth of approximately 0.5 mm was demonstrated, though this value would likely change depending on the materials’ scattering and absorption properties at the wavelengths of the illumination source. Although the penetration depth may be increased with a longer wavelength source at 1325 nm, improvement over the shorter wavelength source at 930 nm was found to be negligible. The advantage of a shorter wavelength source, however, is the increase in the achievable spatial and axial resolution, at 9 and 6.5 µm, respectively. The authors also highlighted the high data acquisition rates used, i.e., A-scan rate of 5 kHz (B-scan rate of 4 fps) and 16 kHz (B-scan rate of 25 fps) for SD-OCT and SS-OCT, respectively, thus making it attractive for in-line quality control during manufacturing.
In order to better assess OCT against the relatively well-established TPI used in pharmaceutical tablet coating analysis, coatings in the thickness range between 10–140 µm were measured by an in-house SD-OCT and a commercial TPI 2000 [26,27]. The in-house SD-OCT featured a white light source in the form of a halogen lamp and a broadband Charge-coupled device (CCD)-based spectrometer in order to ensure good axial resolution and signal-to-noise ratio (SNR). By actuating the reference beam repetitively, phase-shifting method was implemented to increase measurement sensitivity. To ensure a comparable spot size to TPI, a multi-mode fibre with a diameter of 200 µm was used to collect the back-reflected reference and sample beam. By comparing OCT and TPI measurements, the study found that the two techniques are complementary from a coating thickness measurement perspective, where OCT is suitable for thin coatings 10–60 µm, while TPI is suitable for 40 µm and above. The upper limit for OCT strongly depends on the optical properties of the coating formulation as well as on the occurrence of window fouling, i.e., coating material adheres to the sensor window and reduces the measured signal intensity. Material on the window typically builds up during the operation of the coater and can potentially be overcome by window heating or blow off systems.
A commercial SD-OCT system operating at 820 nm was used to characterise pharmaceutical tablet coatings sampled at 15 different stages of a tablet coating process (i.e., during heating, coating, drying and cooling) and with a coating thickness from uncoated to a target thickness of approximately 70 µm [27]. Coating variations between tablets were investigated for the first time and 3-D visualisation of tablet coating was additionally presented to further demonstrate the potential use of SD-OCT as a diagnostic tool during and after tablet production.
As a step towards realising SD-OCT for in-line quality control, the problem of automatic interface detection and thickness measurement in real-time under realistic scenarios was investigated in [28] and later applied to [24,29,30]. In particular, Ref. [28] highlighted the need to take into account coating variations on individual tablets and between tablets, oblique orientation of tablets, and the distortion to the measurement caused by tablets movement (i.e., tablet cap no longer orientated orthogonally to the probe beam). To address the identified challenges with low computation complexity, inspired by works at identifying intra-retinal layers, the authors proposed a graph-based segmentation method to discriminate the interfaces on B-scans automatically by finding the shortest path using dynamic programming combined with hard constraints defined by surface set feasibilities. Given tablet properties such as diameter, height and curvature radius, optical distortions were corrected by determining the angle of incidence and hence Snell’s angle of refraction. This is then followed by determining the coating thickness where the distance between a point on the coating-core interface is subtracted from a point on the air-coating interface at the same polar angle. The algorithm was assessed using two different data sets: coatings with different thicknesses [27] and simulating the oblique tablet orientation where 30° represents the maximum angle of tablet rotation for successful thickness measurement.
The problem of automatic interface detection and thickness measurement was also addressed in the study from [23] using similar tablets as [26,27] with a comparatively simpler in-house built SD-OCT system illuminated by superluminescence laser diode (SLD) source centred at 840 nm. Compared to the algorithm in [29], the approach taken was entirely based on A-scans, where stationary wavelet denoising, air-coating and coating–core interface fitting for bi-convex shaped tablets and recursive peak finding within the constraints of the identified interfaces were applied to the measurements. Instead of being intended for a real-time operation, the algorithm served the purpose of determining a quantifiable thickness limit of 100 µm, for the particular coating material, based on the similarity between measured intra-tablet coating uniformity against the values measured by TPI. The findings are consistent with earlier work [27] that TPI and OCT are complementary in that OCT is suitable for thin coatings while TPI is suitable for thicker coatings. The study also showed how the coating refractive index at optical frequencies could be determined when the absolute thickness is known from another measurement modality, such as TPI.
Addressing the matter on how best to represent intra-tablet coating uniformity is the work presented by [31], where the authors argued a need to better manage the voluminous size of the OCT dataset with compressive sensing for a more accurate estimation of the intra-tablet coating uniformity. The work is relevant to OCT measurements where small spot sizes are raster scanned over a large tablet surface area, such as scanning across a tablet with a diameter of 8 mm and an optical spot size of 10 µm. The size of the dataset produced in turn could easily exceed 1 GB. The study therefore demonstrated that by using an algebraic reconstruction technique for a dataset collected for a set of coated pharmaceutical tablets with coating thickness in the range of 60–100 µm, only 30% of the acquired OCT data were required for satisfactory reconstruction when compared against the intra-tablet coating uniformity of the same tablets measured with TPI.
The use of OCT beyond coating thickness measurement was shown in 2009 to profile the surface topographies and roughness properties of flat-faced pharmaceutical tablets from the acquired B-scans [32]. Deviations of the air-core interface from the mean lines in turn represents surface roughness. Measuring parameters associated with surface roughness is important to pharmaceutical coating manufacturers because this information can help to provide a more comprehensive picture of coating surface quality. This in turn could be used to gauge tablet porosity, which is a performance-related metric. The in-house OCT system was pumped by a Ti:sapphire femtosecond laser and achieved a lateral resolution of approximately 5 µm. The sub-surface imaging capability of OCT was exploited recently in [33], where the surface roughness parameters (root mean square deviation, the skewness and the kurtosis) for both the tablet cores and coatings were extracted automatically for coated tablets that were removed periodically from a pan-coating process. The measurements were able to show accurate coating variations across tablets’ surfaces away from the edges. Interestingly, the findings revealed that for the particular coating formulation used, small valleys on the core were filled with coatings, while coarser features remained visible on the final coated tablet. This therefore contributes to the overall coating uniformity and underpins further investigations. Though not demonstrated, the measurement in principle could be extrapolated for in-line measurement for the extraction of the aforementioned surface roughness parameters, not only for quality control and assurances, such as defects and irregularities detection, but more importantly as the essential feedback for process understanding. However, as pointed out by the authors, ultimately the applicability of OCT to measure functional or active coatings would primarily depend on the coating formulation, which may cause strong scattering losses leading to a reduced penetration depth thus limiting the maximum detectable coating thickness.
Owing to the fact that OCT measurement contrast results from a combination of absorption and scattering, one of the main drawbacks of OCT technology is that light can be highly scattered by some coating formulations/structures, thus fundamentally limiting the resolvable coating thickness. Scattering is due to the particles that make up the tablet powder compact or air inclusions as well as particles in the coating (≤100 μm). The issue of identifying an applicable coating formulation was shown in [34], where SD-OCT measurements at 840 nm for a range of pigments and formulations were presented. It was shown that coating transparency for OCT measurement is very much dependent on the pigment type, coating formulation and tablet core properties, as well as the coating process. The use of titanium dioxide, either alone or together with other pigments, would lead to adverse scattering and therefore blurring out the coating-core interface on the acquired B-scans rendering coating thickness quantification almost impossible. For coatings without titanium dioxide, coating transparency also cannot always be guaranteed. It is therefore anticipated that a quick test for optical transparency on coated dosage forms would be routinely performed before in-line quality control.
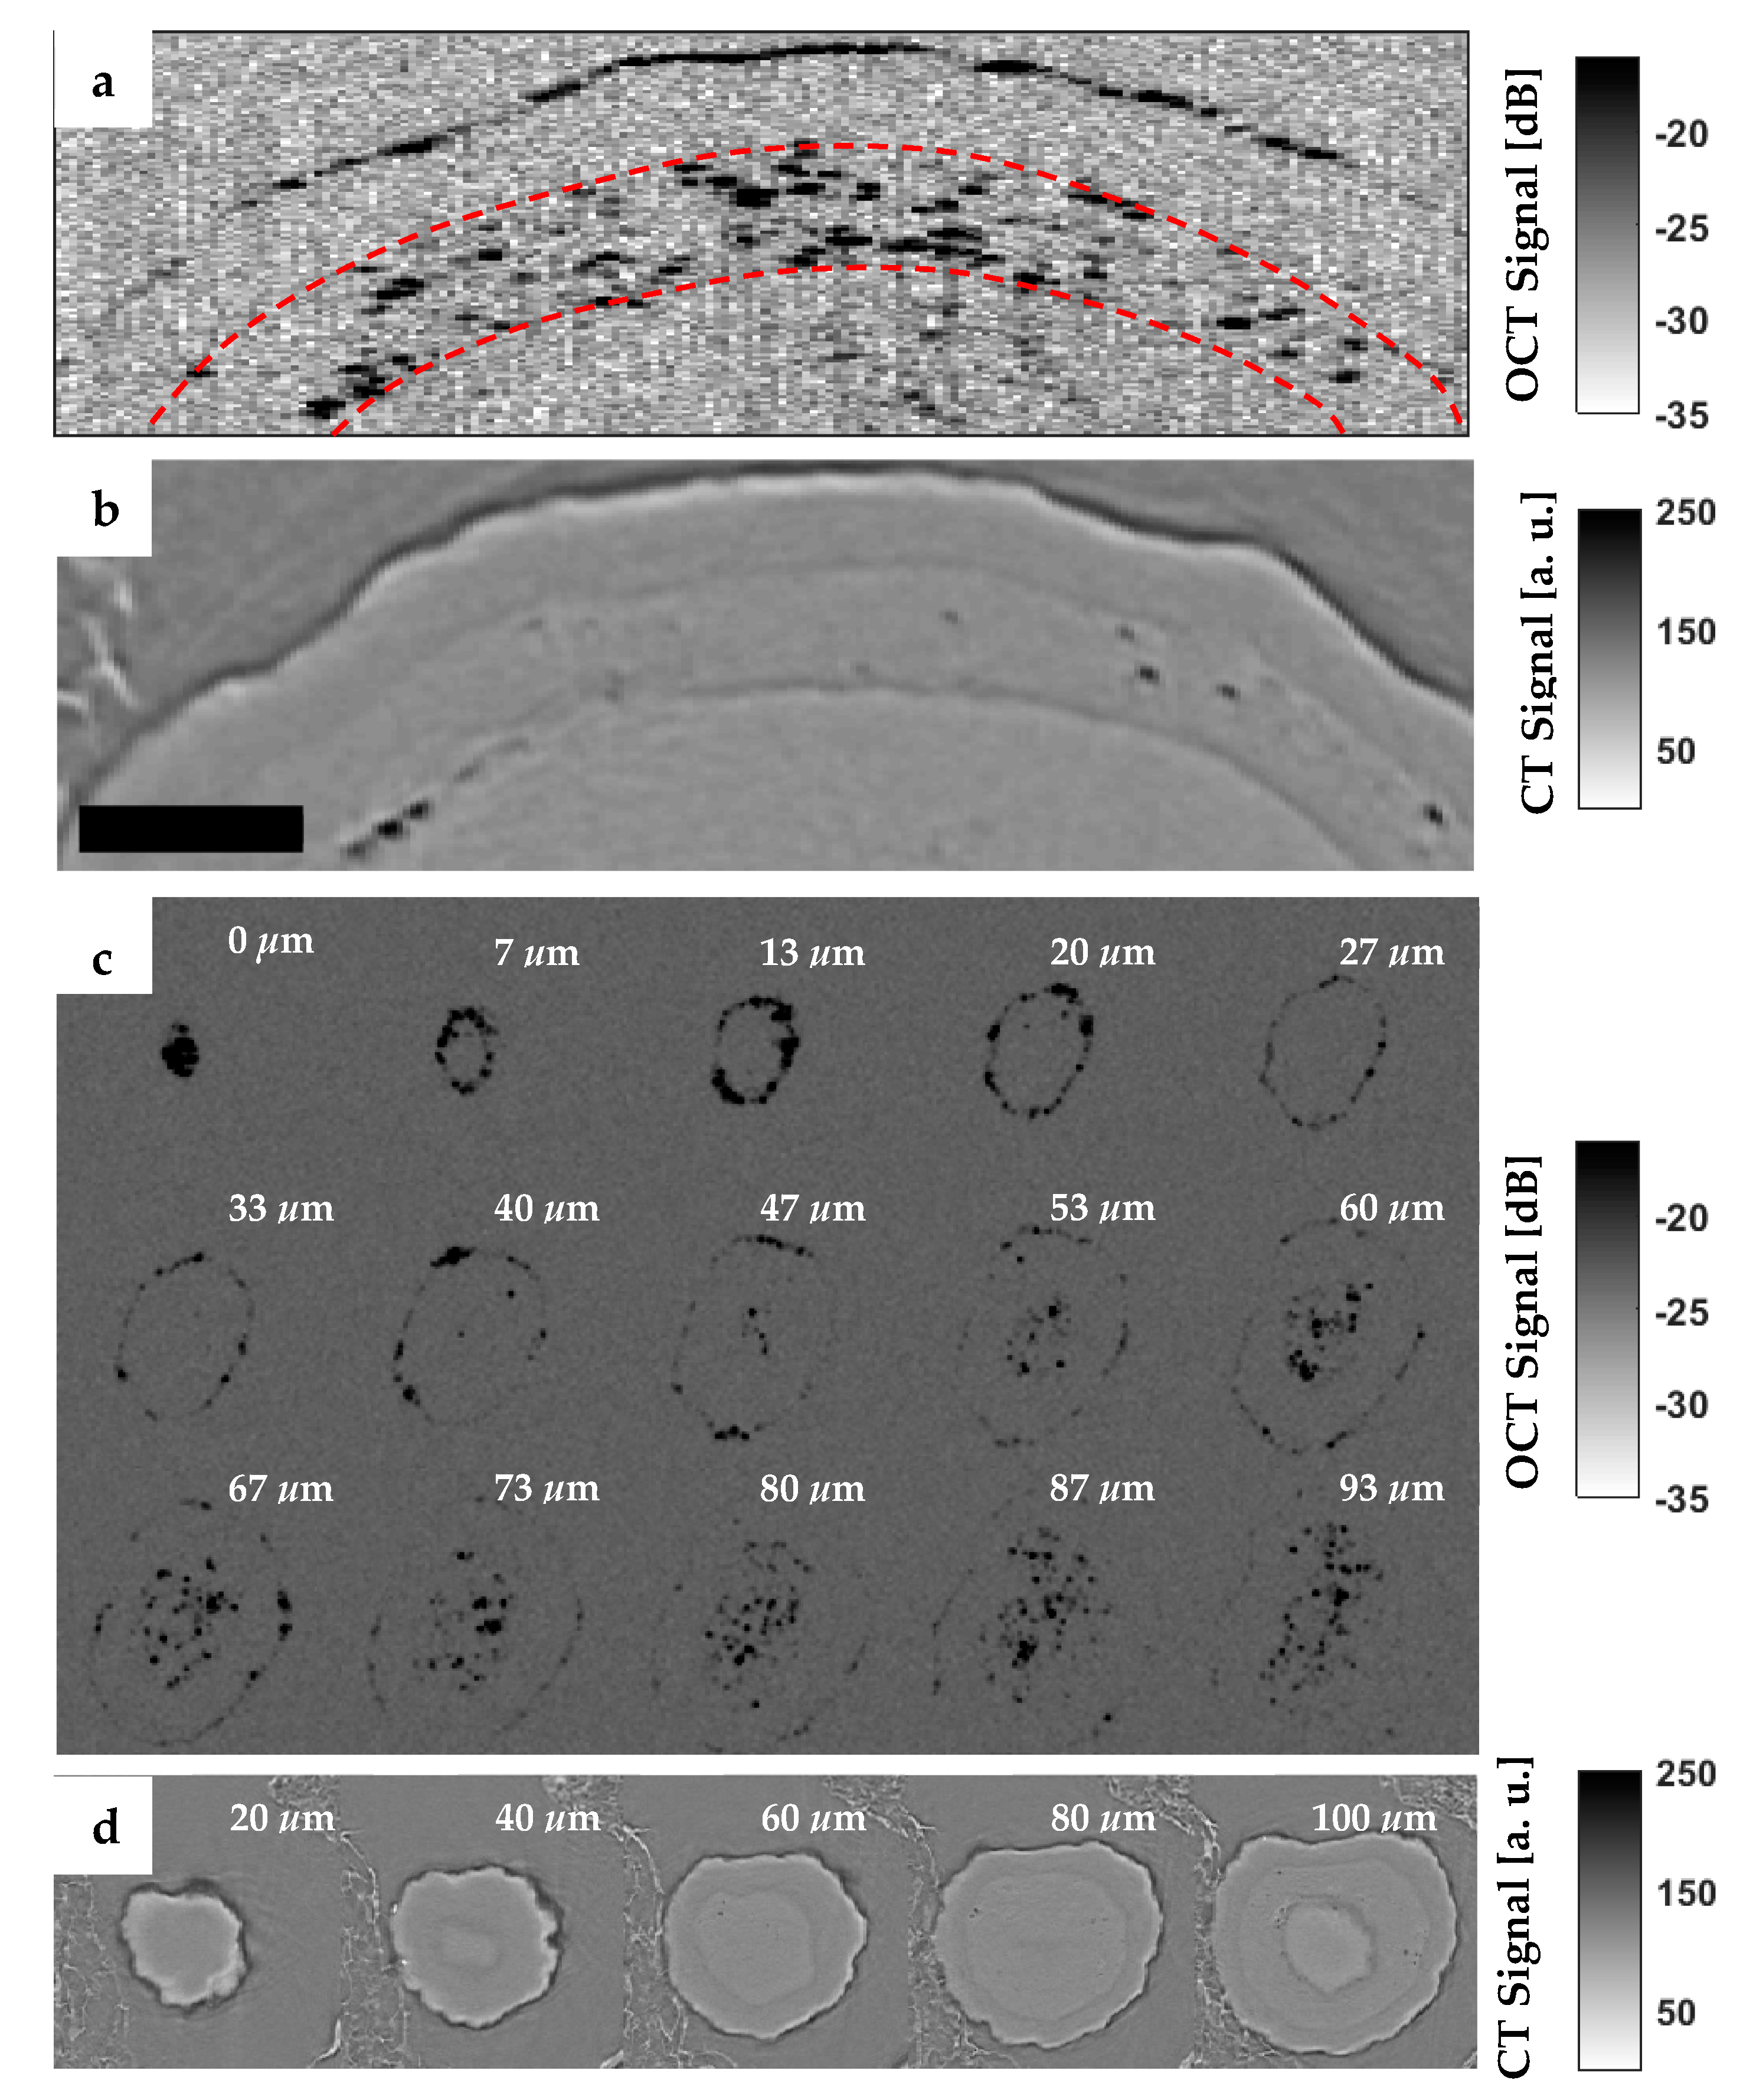
A TD-OCT system in the form of a full-field OCT (FF-OCT) was demonstrated for the first time in [35] for coating thickness measurement of bi-layered spherical pellets. Contrary to aforementioned setups, the FF-OCT system uses a CMOS camera (Point Grey Research Inc., Richmond, Canada) as a detector thus enabling the acquisition of sample en face images across the sample depth/axial direction [36,37]. A-scans were then reconstructed at a fixed spatial coordinate on the en face images so that coating thickness can be quantified. Compared to point-based measurement, such as XµCT and SD-OCT for sample 3-D reconstruction [28], FF-OCT is an efficient alternative to visualize the internal coating structures volumetrically as shown in Figure 4.
3.3. In-Line Measurement
The feasibility of OCT as an in-line quality control tool for the tablet coating process was investigated in [38], where a SD-OCT system operating at a centre wavelength of 830 nm was used. As part of the pilot study, the OCT sensor head was mounted onto an x–y stage in order to traverse across a static tablet bed at speeds up to 0.7 m s−1 mimicking an ideal in-process measurement condition. The sensor heads used in most in-line OCT studies did not run an internal scanning procedure, such as galvanometer mirrors, which are commonly used to acquire 2D or 3D images of static objects. In-line OCT configurations utilised the movement of the samples (or of the sensor head) and continuously acquired A-scans. Successive A-scans (e.g., 1000 A-scans) then yielded cross-section images (B-scans) of the moving sample. Even though there was a loss in spatial resolution due to the broadening in the optical beam spot at high traversal speeds, the pilot study with a read-out rate of approximately 28 kHz demonstrated the potential of extracting both the inter-tablet and intra-tablet coating uniformity. The technique was applied to an actual lab-scale pharmaceutical pan coating process [30], where the thickness evaluation algorithm proposed in [29] was adapted to automatically identify coated tablets and extract the coating thicknesses. The study configured the OCT sensor at the exhaust of the coating unit similar to the TPI sensor [39] and represented a big step towards a real-time OCT measurement implementation for the tablet coating process.
In a similar manner, SD-OCT system was demonstrated to measure pellet coating thickness and coating uniformity inside a lab-scale fluid-bed coating process [40]. Measurement in this case was acquired through the viewing window, where dispersion had to be compensated for at the reference arm of the system. Even though coating thickness of individual pellets had to be calculated manually from the in-line acquired OCT B-scans, coating thickness growth and both intra-, and inter-pellet coating uniformity could be resolved and validated against off-line OCT and particle size measurements. It is interesting to note that an integrated SD-OCT solution for in-line coating thickness measurement, uniformity and surface roughness is now commercially available from Phyllon GmbH (Graz, Austria).
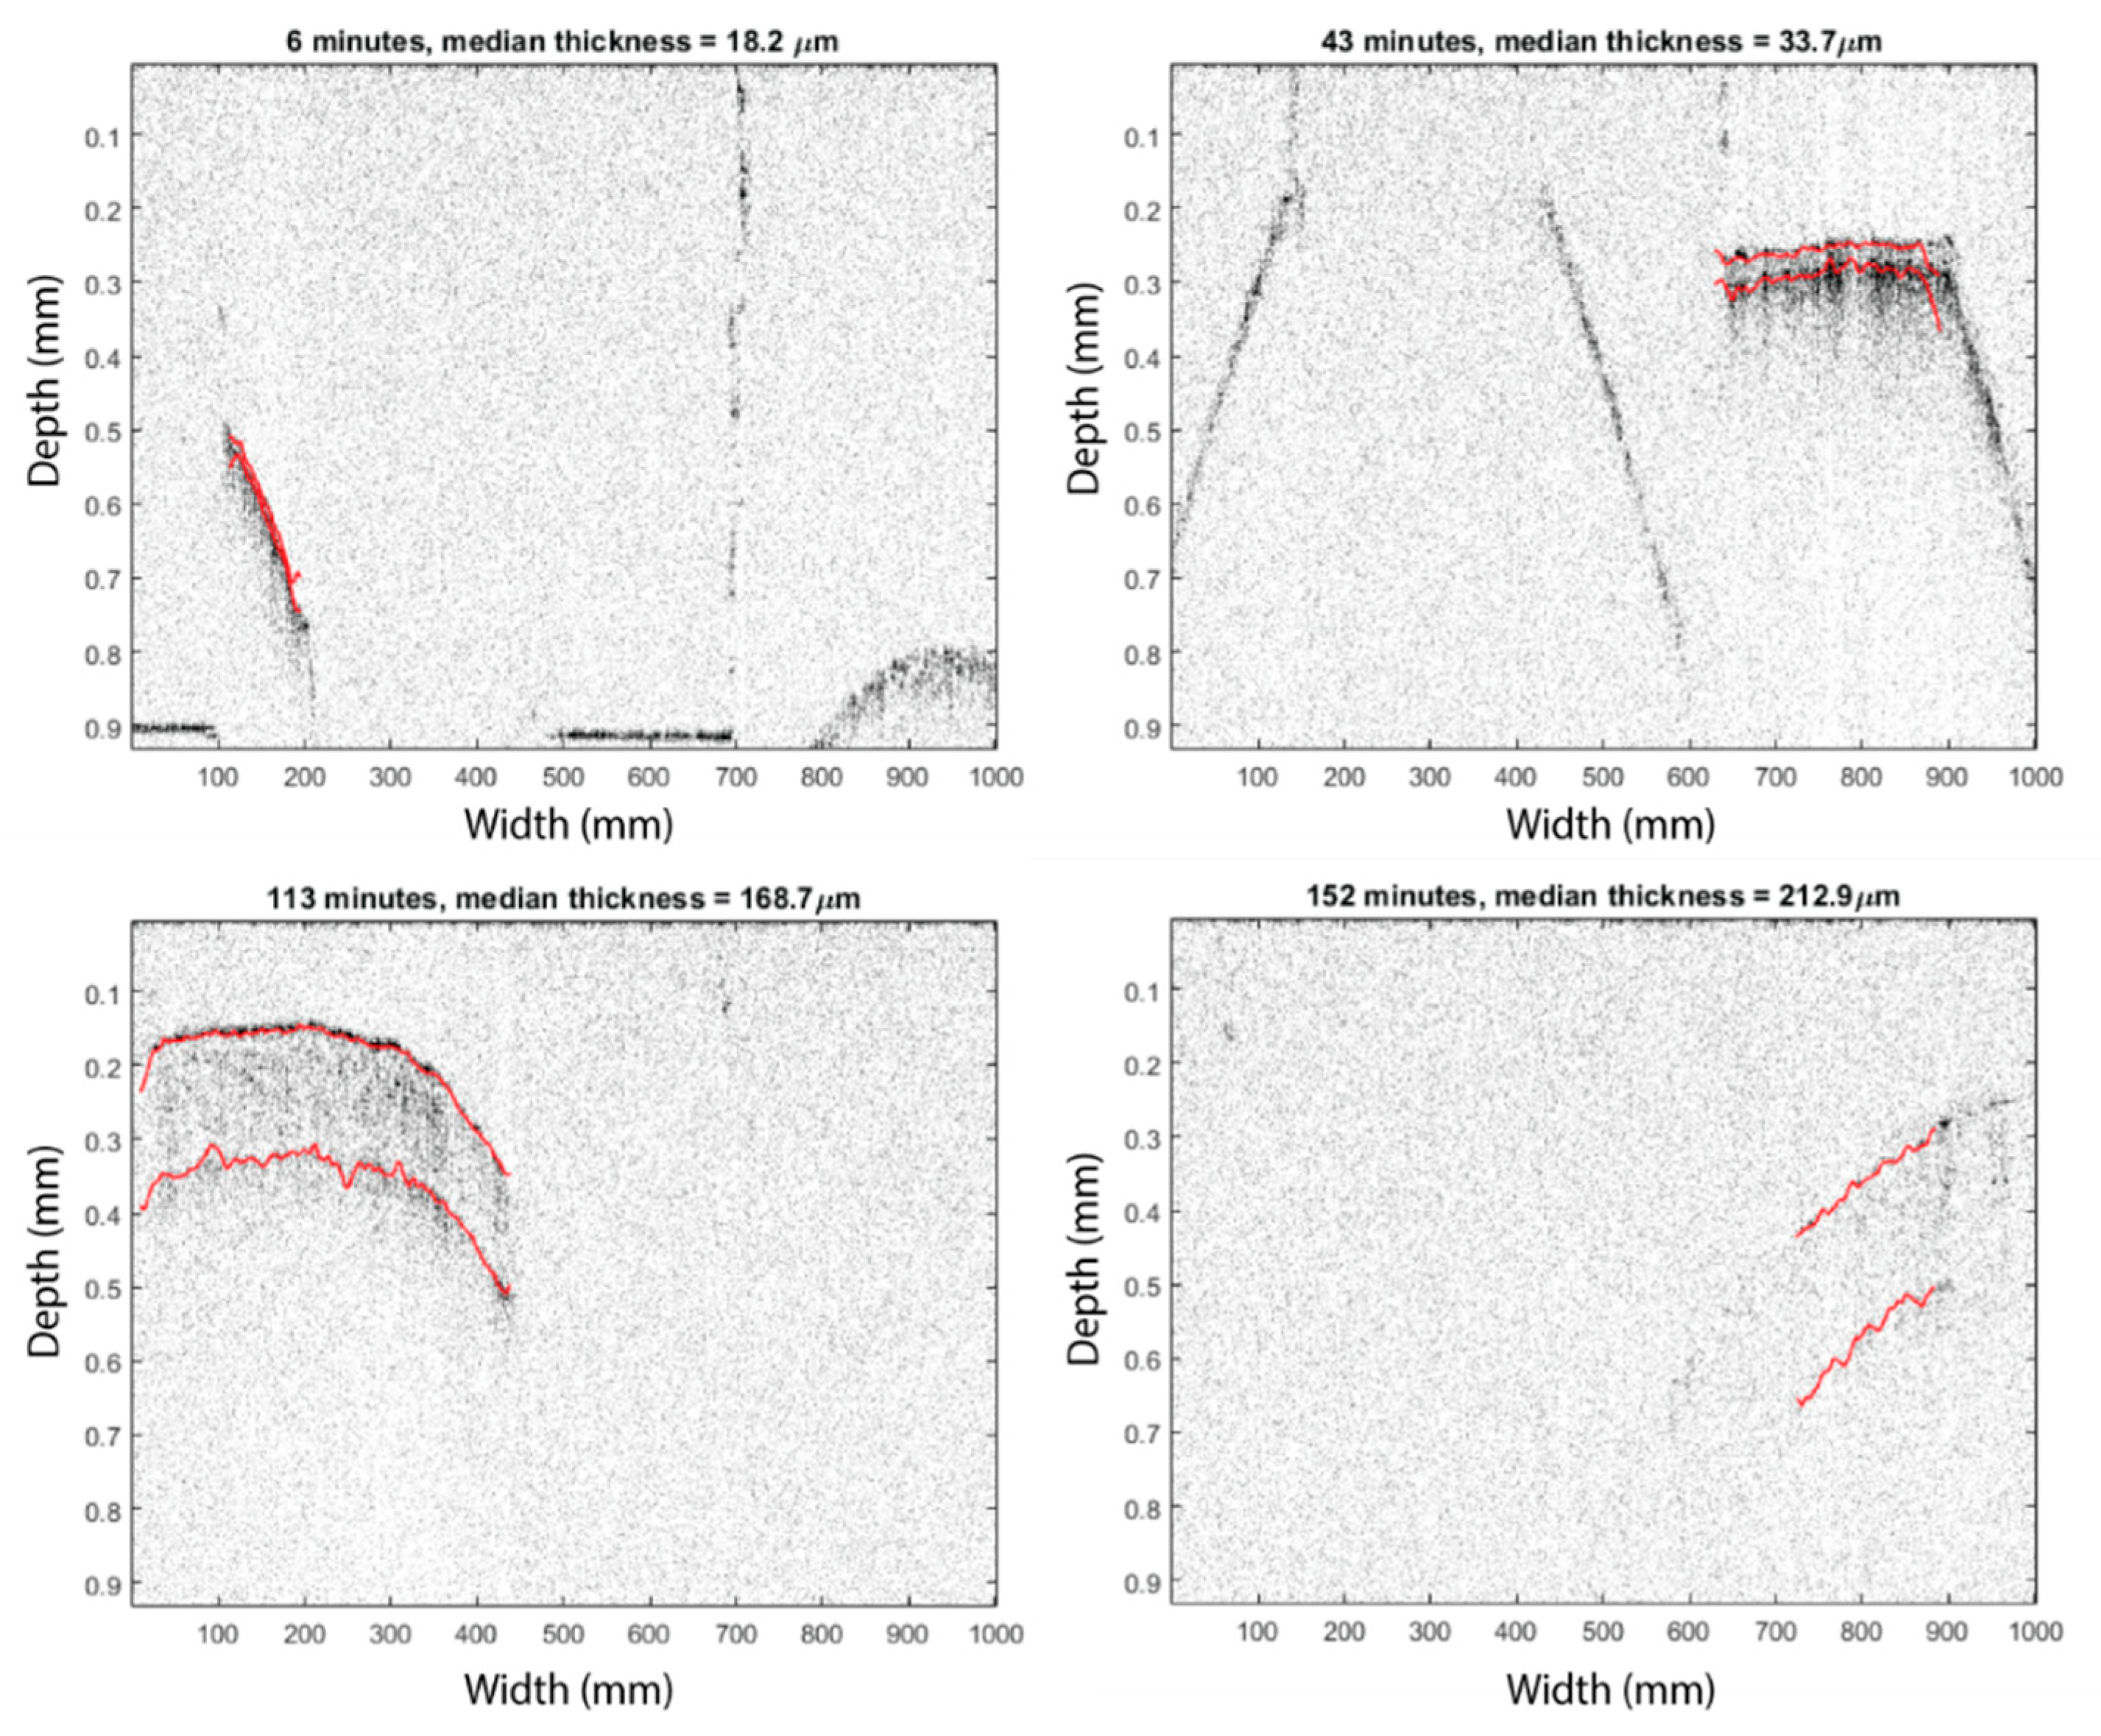
Owing to a comparatively shorter wavelength and low coherence length, OCT can achieve a high axial and lateral resolution (0.9 μm and 20 μm, respectively) and is capable of quantifying film coatings as thin as 10 μm [24,27]. However, owing to the strong scattering encountered by the short wavelength optical radiation as it penetrates through the coating matrix, the radiation suffers from limited penetration depth and hence can realistically resolve only thin coatings. The exact upper limit ultimately depends on the coating formulations used and the extent of use of post-processing, such as denoising [23,27,29]. On the other hand, terahertz radiation has a longer wavelength and hence is less prone to scattering. Thus, it is capable of quantifying thicker coatings up to a few hundred µm [24,27,39] at the expense of an axial and lateral resolution greater than 30–40 μm and 150–250 μm, respectively. Therefore, complementary use of OCT and TPI could present a powerful multimodal sensor combination for monitoring coating processes over a wide thickness range, which was demonstrated in a recent study in [24] at a data acquisition rate of 14 kHz (OCT) and 30 Hz (TPI). Examples of acquired B-scans are shown in Figure 5. However, such a combined measurement would require an exorbitant initial capital investment and therefore a laboratory coating unit was custom-built around an existing TPI and a home-built SD-OCT system was used. By combining these two independent yet complementary modalities, it allowed the measurement of a coating thickness in the range from 20 μm to greater than 280 μm. However, OCT was only able to measure up to 200 μm at an in-line setting due to coating material build-up on the OCT sensor head. The fact that the coating unit was constructed around the TPI also presented a rather unrealistic scenario for pharmaceutical manufacturing but shows an interesting platform for process investigation when consolidated with discerete element method (DEM) [41]. The coupling of numerical simulation techniques further allows one to better interpret the in-line measurements [42]. A summary of systems and their respective performances is presented in Table 1.
4. Conclusions and Outlook
Studies to date have clearly demonstrated the potential of OCT for the off-line and in-line analysis of pharmaceutical coatings. However, the field is currently facing some challenges and limitations: (1) A number of typical coating formulations (in particular cosmetic coatings) cause strong scattering thus limiting the penetration depth of OCT to tens of µm. (2) Window fouling during in-process control may either affect the data quality or, in the worst case, render the data useless as the signal strength of the back-reflections from the sample is not sufficiently high to detect the interfaces between the coating layer and the core material. (3) The integration of the sensor in the process is a critical aspect, which may have a significant effect on the quality of the measurements. This is particularly important for the integration of an OCT probe in a fluid-bed coater, where the particles typically do not have defined and uniform movement. In this case, the sensor needs to be positioned where the pellets/mini-tablets pass the sensor with a low but constant speed. However, (2) and (3) are challenges that are applicable to almost every measurement technology that is used to monitor a product quality attribute. OCT has the advantage compared to most other techniques, in particular Near-infrared (NIR) and Raman spectroscopy, that challenges (2) and (3) can be relatively easily detected. Window fouling will result in a built up of material on the OCT probe causing the disappearance of the tablets in the OCT image. Misalignments of the probe with respect to the samples of interest can be detected by comparing the contrast from the coating interface from in-line data to that from off-line measurements. The majority of OCT systems used for assessing the quality of film-coatings operated at a central wavelength of 700–900 nm in order to improve axial resolution rather than penetration power. The A-scan rate is particularly important for the in-line monitoring of the coating quality. There is great potential to adopt technologies from fields beyond pharmaceutical sciences, which have demonstrated A-scan acquisition rates > 1 MHz [43]. Finally, like any other PAT, data quickly builds up, especially operating at acquisition rates up to 1 MHz, leading to the need to address the issue of data management or optimal sampling strategy.
Author Contributions
H.L., Z.Z. and D.M. wrote the manuscript. All authors proof read the manuscript.
Acknowledgments
The authors acknowledge the financial support from UK Engineering and Physical Sciences Research Council Research Grant EP/L019787/1, EP/L019922/1 and EP/R019460/1.
Conflicts of Interest
The authors declare no conflict of interest. The funding sponsors had no role in the design of the study; in the collection, analyses, or interpretation of data; in the writing of the manuscript, and in the decision to publish the results.
References
- Felton, L.A.; Porter, S.C. An update on pharmaceutical film coating for drug delivery. Expert Opin. Drug Deliv. 2013, 10, 421–435. [Google Scholar] [CrossRef] [PubMed]
- McGinity, J.W.; Felton, L.A. Aqueous Polymeric Coatings for Pharmaceutical Dosage Forms, 3rd ed.; Informa Healthcare: London, UK, 2008. [Google Scholar]
- Pandey, P.; Bharadwaj, R. Predictive Modeling of Pharmaceutical Unit Operations; Woodhead Publishing: Duxford, UK, 2017. [Google Scholar]
- Toschkoff, G.; Just, S.; Funke, A.; Djuric, D.; Knop, K.; Kleinebudde, P.; Scharrer, G.; Khinast, J.G. Spray models for discrete element simulations of particle coating processes. Chem. Eng. Sci. 2013, 101, 603–614. [Google Scholar] [CrossRef]
- Li, L.; Remmelgas, J.; Wachem, BG.; Corswant, C.; Johansson, M.; Folestad, S.; Rasmuson, A. Residence time distributions of different size particles in the spray zone of a Wurster fluid bed studied using DEM-CFD. Powder Technol. 2015, 280, 124–134. [Google Scholar] [CrossRef]
- Knop, K.; Kleinebudde, P. PAT-tools for process control in pharmaceutical film coating applications. Int. J. Pharm. 2013, 457, 527–536. [Google Scholar] [CrossRef] [PubMed]
- Korasa, K.; Vrečer, F. Overview of PAT process analysers applicable in monitoring of film coating unit operations for manufacturing of solid oral dosage forms. Eur. J. Pharm. Sci. 2018, 111, 278–292. [Google Scholar] [CrossRef] [PubMed]
- Leitgeb, R.; Hitzenberger, C.; Fercher, A.F. Performance of fourier domain vs. Time domain optical coherence tomography. Opt. Express 2003, 11, 889–894. [Google Scholar] [CrossRef] [PubMed]
- Fercher, A.F.; Drexler, W.; Hitzenberger, C.K.; Lasser, T. Optical coherence tomography-principles and applications. Rep. Prog. Phys. 2003, 66, 239. [Google Scholar] [CrossRef]
- Walther, J.; Gaertner, M.; Cimalla, P.; Burkhardt, A.; Kirsten, L.; Meissner, S.; Koch, E. Optical coherence tomography in biomedical research. Anal. Bioanal. Chem. 2011, 400, 2721–2743. [Google Scholar] [CrossRef]
- Tomlins, P.H.; Wang, R. Theory, developments and applications of optical coherence tomography. J. Phys. D Appl. Phys. 2005, 38, 2519. [Google Scholar] [CrossRef]
- Park, H.; Chodorow, M.; Kompfner, R. High resolution optical ranging system. Appl. Opt. 1981, 20, 2389–2394. [Google Scholar] [CrossRef]
- Fujimoto, J.G.; De Silvestri, S.; Ippen, E.P.; Puliafito, E.P.; Margolis, R.; Oseroff, A. Femtosecond optical ranging in biological systems. Opt. Lett. 1986, 11, 150–152. [Google Scholar] [CrossRef]
- Huang, D.; Wang, J.; Lin, C.P.; Puliafito, C.A.; Fujimoto, J.G. Micron-resolution ranging of cornea anterior chamber by optical reflectometry. Lasers Surg. Med. 1991, 11, 419–425. [Google Scholar] [CrossRef]
- Fercher, A.F.; Hitzenberger, C.K.; Kamp, G.; Elzaiat, S.Y. Measurement of intraocular distances by backscattering spectral interferometry. Opt. Commun. 1995, 117, 43–48. [Google Scholar] [CrossRef]
- Hausler, G.; Lindner, M.W. “Coherence radar” and “spectral radar”-new tools for dermatological diagnosis. J. Biomed. Opt. 1998, 3, 21–31. [Google Scholar] [CrossRef] [PubMed]
- Mitsui, T. Dynamic range of optical reflectometry with spectral interferometry. Jpn. J. Appl. Phys. 1999, 38, 6133. [Google Scholar] [CrossRef]
- Chinn, S.R.; Swanson, E.A.; Fujimoto, J.G. Optical coherence tomography using a frequency-tunable optical source. Opt. Lett. 1997, 22, 340–342. [Google Scholar] [CrossRef]
- Yun, S.H.; Tearney, G.J.; Bouma, B.E.; Park, B.H.; de Boer, J.F. High-speed spectral-domain optical coherence tomography at 1.3 µm wavelength. Opt. Express 2003, 11, 3598–3604. [Google Scholar] [CrossRef] [PubMed]
- Choma, M.A.; Sarunic, M.V.; Yang, C.H.; Izatt, J.A. Sensitivity advantage of swept source and Fourier domain optical coherence tomography. Opt. Express 2003, 11, 2183. [Google Scholar] [CrossRef]
- Schmitt, J.M. Optical coherence tomography (OCT): A review. IEEE J. Sel. Top. Quantum Electron. 1999, 5, 1205–1215. [Google Scholar] [CrossRef]
- Stifter, D. Beyond biomedicine: A review of alternative applications and developments for optical coherence tomography. Appl. Phys. B Lasers Opt. 2007, 88, 337–357. [Google Scholar] [CrossRef]
- Lin, H.; Dong, Y.; Shen, Y.C.; Zeitler, J.A. Quantifying pharmaceutical film coating with optical coherence tomography and terahertz pulsed imaging: An evaluation. J. Pharm. Sci. 2015, 104, 3377–3385. [Google Scholar] [CrossRef] [PubMed]
- Lin, H.; Dong, Y.; Markl, D.; Williams, B.M.; Zheng, Y.; Shen, Y.C.; Zeitler, J.A. Measurement of the inter-tablet coating uniformity of a pharmaceutical pan coating process with combined terahertz and optical coherence tomography in-line sensing. J. Pharm. Sci. 2017, 106, 1075–1084. [Google Scholar] [CrossRef] [PubMed]
- Mauritz, J.M.; Morrisby, R.S.; Hutton, R.S.; Legge, C.H.; Kaminski, C.F. Imaging pharmaceutical tablets with optical coherence tomography. J. Pharm. Sci. 2010, 99, 385–391. [Google Scholar] [CrossRef] [PubMed]
- Zhong, S.; Shen, H.; Shen, Y.-C.; Zeitler, J.A.; Ho, L.; Evans, M.; Taday, P.F.; Pepper, M.; Rades, T.; Gordon, K.C.; et al. Noninvasive 3D Characterization using Terahertz Pulsed Imaging and Infrared Optical Coherence Tomography. In Proceedings of the 34th International Conference on Infrared, Millimeter, and Terahertz Waves (IRMMW-THz 2009), Busan, Korea, 21–25 September 2009. [Google Scholar]
- Zhong, S.; Shen, Y.-C.; Ho, L.; May, R.K.; Zeitler, J.A.; Evans, M.; Taday, P.F.; Pepper, M.; Rades, T.; Gordon, K.C.; et al. Non-destructive quantification of pharmaceutical tablet coatings using terahertz pulsed imaging and optical coherence tomography. Opt. Lasers Eng. 2011, 49, 361–365. [Google Scholar] [CrossRef] [Green Version]
- Koller, D.M.; Hannesschlager, G.; Leitner, M.; Khinast, J.G. Nondestructive analysis of tablet coatings with optical coherence tomography. Eur. J. Pharm. Sci. 2011, 44, 142–148. [Google Scholar] [CrossRef] [PubMed]
- Markl, D.; Sacher, S.; Leitner, M.; Khinast, J.G.; Buchsbaum, A. Automated pharmaceutical tablet coating layer evaluation of optical coherence tomography images. Meas. Sci. Technol. 2015, 26, 035701. [Google Scholar] [CrossRef]
- Markl, D.; Hannesschläger, G.; Sacher, S.; Leitner, M.; Buchsbaum, A.; Pescod, R.; Baele, T.; Khinast, J.G. In-line monitoring of a pharmaceutical pan coating process by optical coherence tomography. J. Pharm. Sci. 2015, 104, 2531–2540. [Google Scholar] [CrossRef]
- Dong, Y.; Lin, H.; Abolghasemi, V.; Gan, L.; Zeitler, J.A.; Shen, Y.-C. Investigating Intra-Tablet Coating Uniformity With Spectral-Domain Optical Coherence Tomography. J. Pharm. Sci. 2017, 106, 546–553. [Google Scholar] [CrossRef]
- Juuti, M.; Tuononen, H.; Prykäri, T.; Kontturi, V.; Kuosmanen, M.; Alarousu, E.; Ketolainen, J.; Myllylä, R.; Peiponen, K.-E. Optical and terahertz measurement techniques for flat-faced pharmaceutical tablets: A case study of gloss, surface roughness and bulk properties of starch acetate tablets. Meas. Sci. Technol. 2009, 20, 015301. [Google Scholar] [CrossRef]
- Markl, D.; Wahl, P.; Pichler, H.; Sacher, S.; Khinast, J.G. Characterization of the coating and tablet core roughness by means of 3D optical coherence tomography. Int. J. Pharm. 2018, 536, 459–466. [Google Scholar] [CrossRef]
- Lin, H.; Dong, Y.; Markl, D.; Zhang, Z.; Shen, Y.C.; Zeitler, J.A. Pharmaceutical Film Coating Catalog for Spectral Domain Optical Coherence Tomography. J. Pharm. Sci. 2017, 106, 3171–3176. [Google Scholar] [CrossRef] [PubMed]
- Li, C.; Zeitler, J.A.; Dong, Y.; Shen, Y.C. Non-destructive evaluation of polymer coating structures on pharmaceutical pellets using full-field optical coherence tomography. J. Pharm. Sci. 2014, 103, 161–166. [Google Scholar] [CrossRef] [PubMed]
- Dubois, A.; Vabre, L.; Boccara, A.C.; Beaurepaire, E. High-resolution full-field optical coherence tomography with a linnik microscope. Appl. Opt. 2002, 41, 805–812. [Google Scholar] [CrossRef] [PubMed]
- Dubois, A.; Grieve, K.; Moneron, G.; Lecaque, R.; Vabre, L.; Boccara, C. Ultrahigh-resolution full-field optical coherence tomography. Appl. Opt. 2004, 43, 2874–2883. [Google Scholar] [CrossRef] [PubMed]
- Markl, D.; Hannesschlager, G.; Sacher, S.; Leitner, M.; Khinast, J.G. Optical coherence tomography as a novel tool for in-line monitoring of a pharmaceutical film-coating process. Eur. J. Pharm. Sci. 2014, 55, 58–67. [Google Scholar] [CrossRef] [PubMed]
- May, R.K.; Evans, M.J.; Zhong, S.; Warr, I.; Gladden, L.F.; Shen, Y.C.; Zeitler, J.A. Terahertz in- line sensor for direct coating thickness measurement of individual tablets during film coating in real-time. J. Pharm. Sci. 2011, 100, 1535–1544. [Google Scholar] [CrossRef] [PubMed]
- Markl, D.; Zettl, M.; Hannesschlager, G.; Sacher, S.; Leitner, M.; Buchsbaum, A.; Khinast, J.G. Calibration-free in-line monitoring of pellet coating processes via optical coherence tomography. Chem. Eng. Sci. 2015, 125, 200–208. [Google Scholar] [CrossRef]
- Pei, C.; Lin, H.; Markl, D.; Shen, Y.C.; Zeitler, J.A.; Elliott, J.A. A quantitative comparison of in-line coating thickness distributions obtained from a pharmaceutical tablet mixing process using discrete element method and terahertz pulsed imaging. Chem. Eng. Sci. 2018, 192, 34–45. [Google Scholar] [CrossRef]
- Lin, H.; Pei, C.; Markl, D.; Shen, Y.C.; Elliott, J.A.; Zeitler, J.A. Steps towards numerical verification of the terahertz in-line measurement of tablet mixing by means of discrete element modelling. IET Mcrow. Antenna Propag. 2018, 12, 1775–1779. [Google Scholar] [CrossRef]
- Wang, S.; Singh, M.; Lopez, A.L.; Wu, C.; Raghunathan, R.; Schill, A.; Li, J.; Larin, K.V.; Larina, I.V. Direct four-dimensional structural and functional imaging of cardiovascular dynamics in mouse embryos with 15 MHz optical coherence tomography. Opt. Lett. 2015, 40, 4791–4794. [Google Scholar] [CrossRef]
Figure 1.
Schematic diagram of a time-domain optical coherence tomography (TD-OCT) system. L—low-coherence light source; Ref—reference mirror; BS—beam-splitter.
Figure 1.
Schematic diagram of a time-domain optical coherence tomography (TD-OCT) system. L—low-coherence light source; Ref—reference mirror; BS—beam-splitter.
Figure 2.
Schematic diagram of a spectral-domain optical coherence tomography SD-OCT system. L—low-coherence light source; Ref—reference mirror; BS—beam-splitter.
Figure 2.
Schematic diagram of a spectral-domain optical coherence tomography SD-OCT system. L—low-coherence light source; Ref—reference mirror; BS—beam-splitter.
Figure 3.
A 100 × 100 B-scan of a biconvex-shaped pharmaceutical tablet with the tablet central region annotated by the dashed line (left) and the respective A-scan with the air-coating and coating–core interfaces annotated by the respective arrows (right). Adapted from [23].
Figure 3.
A 100 × 100 B-scan of a biconvex-shaped pharmaceutical tablet with the tablet central region annotated by the dashed line (left) and the respective A-scan with the air-coating and coating–core interfaces annotated by the respective arrows (right). Adapted from [23].
Figure 4.
B-scan and en face images captured with full-field optical coherence tomography (FF-OCT) for characterising the micro-structure of a double-layer coated pellet. The FF-OCT B-scan in (a) and the en face results in (b) are validated by XμCT in (b,d) on the same pellet sample. Two dashed red lines in (a) indicate the upper and lower interfaces of the inner coating layer. Adapted from [35].
Figure 5.
B-scans captured with SD-OCT at an in-line setting for a lab-scale tablet coating process showing the measured tablets with highlighted coating interfaces using segmentation algorithm as part of automated thickness quantification. The title of each OCT image indicates the mean calculated from the detected coating layer interfaces. The -axis represents the width of the tablet measured and depends on the tablet movement speed. Adapted from [24].


Table 1.
Summary of OCT application for characterising pharmaceutical materials.
| Reference | Measurement Type | Light Source | Central Wavelength/FWHM Bandwidth (nm) | Axial Resolution (um) | Lateral Resolution (um) | Acquisition Rate |
|---|---|---|---|---|---|---|
| Juuti et al. (2009) [32] | Off-line | / | / | / | 5 | / |
| Mauritz et al. (2009) [25] | Off-line | Spectral radar OCT OCP930SR (Thorlabs) | 930/100 | 6.5 | 9 | 15 KHz |
| Swept source OCT Microscope OCM1300SS (Thorlabs) | 1325/130 | 12 | 15 | 16 KHz | ||
| Zhong et al. (2009, 2010) [26,27] | Off-line | Tungsten Halogen Lamp | 700/236 | 0.9 | / | / |
| Koller et al. (2011) [28] | Off-line | Supercontinuum Lasers (NKT Photonics) | 820/150 | <4 | 4.3 | 20 KHz |
| Li et al. (2013) [35] | Off-line (FF-OCT) | LED | 850/90 | 3.6 | 11 | 120 FPS |
| Markl et al. (2014) [38] | Off-line | TELESTOTM OCT (Thorlabs) | 1325/150 | 7.5 | / | / |
| SLD (Superlum Diode) | 830/62 | 4.9 | 9.51 | 27.8 KHz | ||
| Markl et al. (2015) [29] | Off-line | Supercontinuum Lasers (NKT Photonics) | 820/150 | 1.98 | 13.05 | 20 KHz |
| Lin et al. (2015) [23] | Off-line | SLD (EXALOS) | 840/55 | Theo: 5.7 | 16 | / |
| Dong et al. (2017) [31] | Off-line | SLD (EXALOS) | 844/131 | Theo: 2.4 | / | 45 KHz |
| Lin et al. (2017a) [34] | Off-line | SLD (EXALOS) | 840/55 | Theo: 5.7 | 20 | / |
| Markl et al. (2018) [33] | Off-line | SLD (Superlum Diode) | 832/75 | Theo: 4.1 | 10 | 59.2 KHz |
| Markl et al. (2015) [30] | In-line | SLD (Superlum Diode) | 832/75 | Theo: 4.1 | 14 | 59.2 KHz |
| Markl et al. (2015) [40] | In-line | SLD broadlighter (Superlum Diode Ltd.) | 830/62 | 4.9 | 9.51 | 27.8 KHz |
| Lin et al. (2017) [24] | In-line | SLD (EXALOS) | 840/55 | 7.5 | 20 | 14.3 KHz |
© 2018 by the authors. Licensee MDPI, Basel, Switzerland. This article is an open access article distributed under the terms and conditions of the Creative Commons Attribution (CC BY) license (http://creativecommons.org/licenses/by/4.0/).
Share and Cite
MDPI and ACS Style
Lin, H.; Zhang, Z.; Markl, D.; Zeitler, J.A.; Shen, Y. A Review of the Applications of OCT for Analysing Pharmaceutical Film Coatings. Appl. Sci. 2018, 8, 2700. https://doi.org/10.3390/app8122700
AMA Style
Lin H, Zhang Z, Markl D, Zeitler JA, Shen Y. A Review of the Applications of OCT for Analysing Pharmaceutical Film Coatings. Applied Sciences. 2018; 8(12):2700. https://doi.org/10.3390/app8122700
Chicago/Turabian StyleLin, Hungyen, Zijian Zhang, Daniel Markl, J. Axel Zeitler, and Yaochun Shen. 2018. "A Review of the Applications of OCT for Analysing Pharmaceutical Film Coatings" Applied Sciences 8, no. 12: 2700. https://doi.org/10.3390/app8122700
Note that from the first issue of 2016, this journal uses article numbers instead of page numbers. See further details here.